Article

Coastal Wetlands Play an Important Role in the Ecological Security Pattern of the Coastal Zone

1
Ningbo Institute of Oceanography, Ningbo 315832, China
2
Ningbo Hongmeng Testing Co., Ltd., Ningbo 315832, China
3
Faculty of Arts, Humanities, Languages, and Social Sciences, Aix-Marseille University, 13100 Aix-en-Provence, France
4
Department of Geography and Spatial Information Techniques, Ningbo University, Ningbo 315211, China
*
Author to whom correspondence should be addressed.
These authors contributed equally to this work.
Land 2022, 11(12), 2317; https://doi.org/10.3390/land11122317
Submission received: 24 September 2022 / Revised: 12 December 2022 / Accepted: 12 December 2022 / Published: 16 December 2022
(This article belongs to the Special Issue Regional Sustainable Development of Yangtze River Delta, China)

Abstract

:
The construction of an ecological security pattern can effectively overcome the contradiction between regional human exploitation and ecological protection in the coastal zone. Taking the Xiangshan Bay (XSB) basin as an example, this study identified ecological source areas from three aspects, namely ecosystem services’ importance, ecological sensitivity, and landscape connectivity, and then constructed ecological resistance surfaces, identified ecological corridors, and constructed an ecological security pattern. The results show that the natural reserves in the XSB basin were all located in the identified primary ecological source areas, thus indicating the feasibility and reliability of the “importance–connectivity–sensitivity” ecological source identification mechanism in this study. The ecological corridor in the coastal wetland area accounts for about 40% of the total corridor length, which is the link connecting other ecological sources, revealing the important role of coastal wetlands in the coastal ecosystem. Through the ecological security pattern of the XSB basin and field investigation, we put forward suggestions such as clearing Spartina alterniflora, restoring salt marsh wetland vegetation, and strengthening follow-up monitoring for the restoration of coastal wetlands. This study is expected to provide reference and guidance for the improvement of coastal zone ecological protection and restoration.

1. Introduction

In recent years, with the acceleration of global urbanization, the high intensity of land development, and the rapidly changing land use have made the contradiction between ecological protection and development of human society increasingly noticeable; especially in coastal areas of biodiversity loss and soil erosion, the scarcity of water resources has become more severe, and in this context, the construction of ecological security patterns have become increasingly important in balancing economic development and environmental protection [1,2,3,4].
The ecological security pattern is a spatial allocation scheme that optimizes the regional ecological spatial pattern, which is one of the effective ways to maintain the integrity of landscape pattern and regional ecological security [5,6]. In 1898, Ward and Win proposed the urban planning concept of a “pastoral city,” pointing out that a ring of suburbs should surround the city to reduce the area of urban expansion and alleviate the phenomenon of ecological deterioration, which has been used in environmental planning around the world until now [7]. In the late 1960s, McHarg proposed the “suitability” analysis method based on the vertical ecological process. This method emphasizes the vertical process and connection of various elements in the landscape unit, which is the superposition of each environmental element and human element. This method was still used to determine the “ecological source” in the ecological security pattern in the following decades [8,9]. In 1995, Forman proposed the landscape ecology research “patch–corridor–base” model, paying attention to the horizontal ecological processes that were difficult to reflect in McHard’s research. Forman’s research greatly promoted the study of landscape patterns, and since then, the development of landscape ecology has deepened people’s understanding of landscape processes [10]. Yu proposed the concept of ecological security pattern based on Forman’s study of landscape patterns [11], and his research on Beijing’s ecological security pattern in 2009 laid the foundation for the development of ecological security patterns in the past decade [12]. The technical route of the “source–space connection–optimization strategy” proposed by Yu has been constantly enriched and optimized. Related research has also been carried out rapidly, and fruitful research results have been obtained from the construction of the initial theoretical framework, the improvement of the index system, and the realization of technical methods [6,13].
At present, relevant research mainly focuses on the identification and construction of ecological security pattern and uses the rating of the ecosystem as an evaluation indicator. The ecological security pattern construction method of Yu’s team has been widely recognized and adopted, and its methodology framework is as follows. First, determine the existing habitat (source) of species diffusion; second, establish the resistance surface according to the difficulty of species diffusion and identify the ecological corridor according to the resistance surface; finally, identify the ecological security pattern according to the ecological corridor. Existing methods for determining ecological source areas mainly use landscape connectivity [14], ecosystem services [15,16], ecological sensitivity [17], and other indicators, among which the identification of ecological source areas is the most important link in the construction of ecological security pattern. The resistance surface is mainly based on the terrain and topography. Ecological corridors, or biological corridors, refer to the spatial types of ecosystems with linear or ribbon-like layouts in the environment, which can communicate and connect with the relatively isolated and dispersed ecological units in the spatial distribution. They can meet the requirements of species diffusion, migration, and exchange, and are an important part of the construction of the regional ecological security pattern. Ecological corridors can be identified by the minimal cumulative resistance (MCR) model [18], patch gravity model [19], and comprehensive evaluation index system. Among them, the MCR model can best simulate the hindrance effect of the landscape on the biological spatial movement process and better express the interaction relationship between the landscape pattern and ecological process. It is widely used in the construction of the ecological network and ecological security pattern [20,21]. In the past decade, the directions of specific exploration and research on the ecological security pattern have varied. In terms of the research scale, multiscale ecological security pattern construction methods of different sizes have been formed. In addition, in terms of research methods, a variety of ecological security pattern construction methods have gradually emerged, such as supply and demand of ecosystem services [22], ecological protection red line [23], ecological importance and sensitivity [24], and source–sink theory [25]. Generally, the research on ecological security pattern is still in its initial stage, with a wide range of research categories and various types, but the research on the mechanism is relatively weak. It is necessary to form a widely recognized unified evaluation system integrated with ecology and social economics [26]. The construction of the regional ecological security pattern mode has continued to improve the index and method, and the validity of the index system is one of the core issues of regional ecological security source recognition. Because there is a lack of understanding of the connotation of ecological security and regional ecological security problems of the specific differences, there are differences in different research scheme selection indicators. Moreover, various indicators have advantages and disadvantages; among them, habitat importance indicators are widely used, mainly focusing on specific ecosystem services such as habitat quality, biodiversity conservation, water conservation, and carbon sequestration and oxygen release. However, when identifying the source areas, the traditional methods only focus on the importance of ecological functions or the risk of functional degradation and only consider the services of the ecosystem to human beings in connotation, but they ignore the response of the ecosystem functions and processes to human activities and changes in the natural environment and the spatial organization structure of the ecosystem itself, resulting in a slightly weak basis for the selection of the source areas [17].
Coastal zones make up just 4% of the earth’s total land area and 11% of the world’s oceans, yet they contain more than a third of the world’s population and account for 90% of the catch from marine fisheries. However, human activities are now threatening many of the world’s remaining marine ecosystems and the benefits they provide. Due to coastal development, population growth, pollution, and other human activities, 50% of salt marshes, 35% of mangroves, 30% of coral reefs, and 29% of seagrasses have already been lost or degraded worldwide over several decades [27]. As a typical coastal zone area, the XSB basin has a concentrated population and developed economy. The increase of population and economic development have caused problems such as the decline of regional ecosystem services, the occupation of ecological space, and the continuous threat to biodiversity. It is urgent to solve the problem of coordinated development between people and the environment by building an ecological security pattern. In combination with the rich ecological resources in the XSB basin, this study extracted ecological sources through the importance of ecosystem services and the ecological sensitivity and the landscape connectivity, identified ecological corridors through the minimum resistance model, and comprehensively constructed ecological security pattern, so as to improve the construction method of traditional ecological security pattern, with a view to providing a case reference for the research on the construction of regional ecological security pattern. It also provides reference and guidance for coastal zone ecological protection and improvement of ecosystem services.

2. Research Area and Research Methods

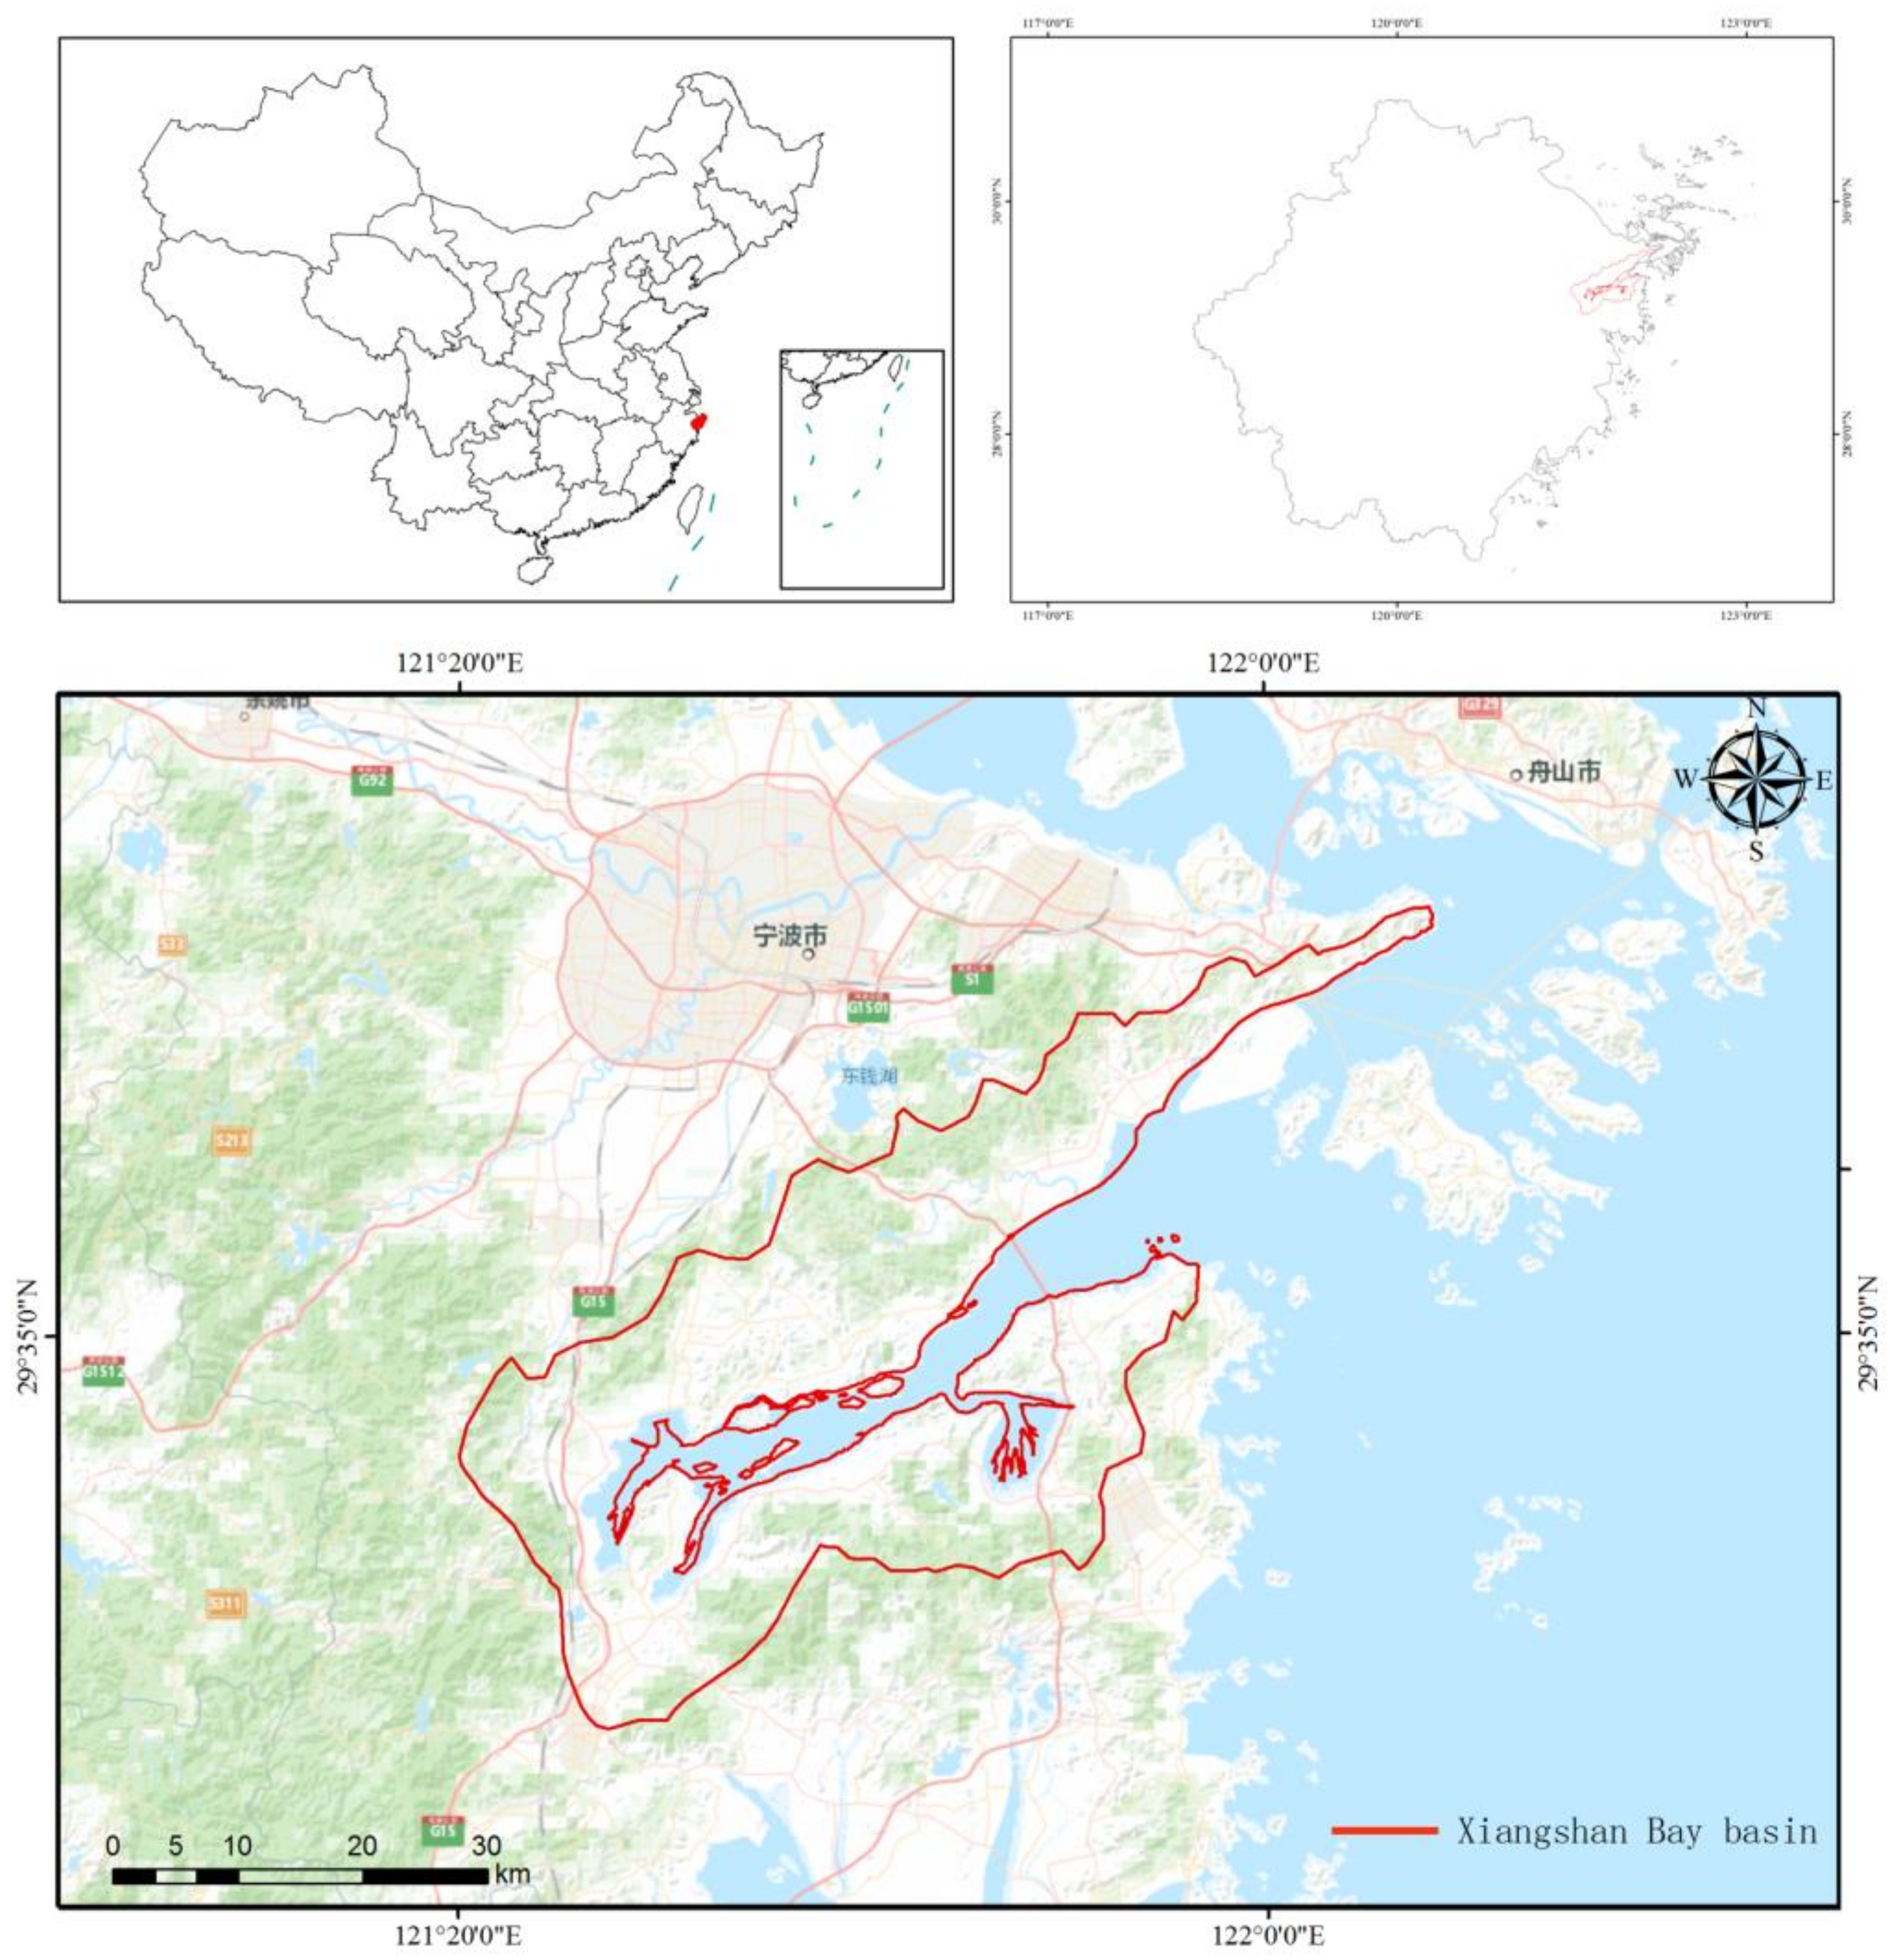
2.1. Overview of the Study Area

This study selected Xiangshan Bay (XSB) as the research area. The XSB is located on the southeast coast of China, between 121°25′ E–122°00′ E and 29°23′ N–29°49′ N; elevation ranges from 0 to 831 m. (Figure 1). The XSB basin is located in the northern extension of the Tiantai Mountain range, and also in the Cathaysian fold belt of the South China fold system. The area from the west of Shiyan Port to Xidian is nearly east–west, and the area from the northeast of Shiyan Port to Fodu Waterway belongs to the northeast syncline. The attitude of the syncline lithology is roughly symmetrical, and the late Jurassic volcanic rocks on the north and south sides are distributed symmetrically, which reflects that the volcanic activity is controlled by the NE trending fault structure of the basement. Since the Cenozoic era, the differential lifting activities between the fault blocks in the XSB basin have been significant. The geomorphic types are mainly broken hills and low-lying plains in front of mountains. Quaternary sediments are exposed in the intermountain plains and coastal areas.
It is a semi-enclosed bay composed of three major parts: the Xiangshan narrow bay, Niubi mountain waterway, and Fodu Waterway. The coastline of the XSB has a total length of about 400 km and a unique geographical location. It is an important station on the migration line of waterfowl from East Asia to Australia, an important forest ecological source and water conservation area, and a national aquatic germplasm resource protection zone for economic fish. As a typical coastal zone, the XSB basin has a coastal wetland covering 133.21 km2, which accounts for 8.5% of the area of the XSB basin and provides material production, environmental regulation, and rich biodiversity for the surrounding residents. Thus, the coastal zone is an extremely important ecosystem in the XSB basin.

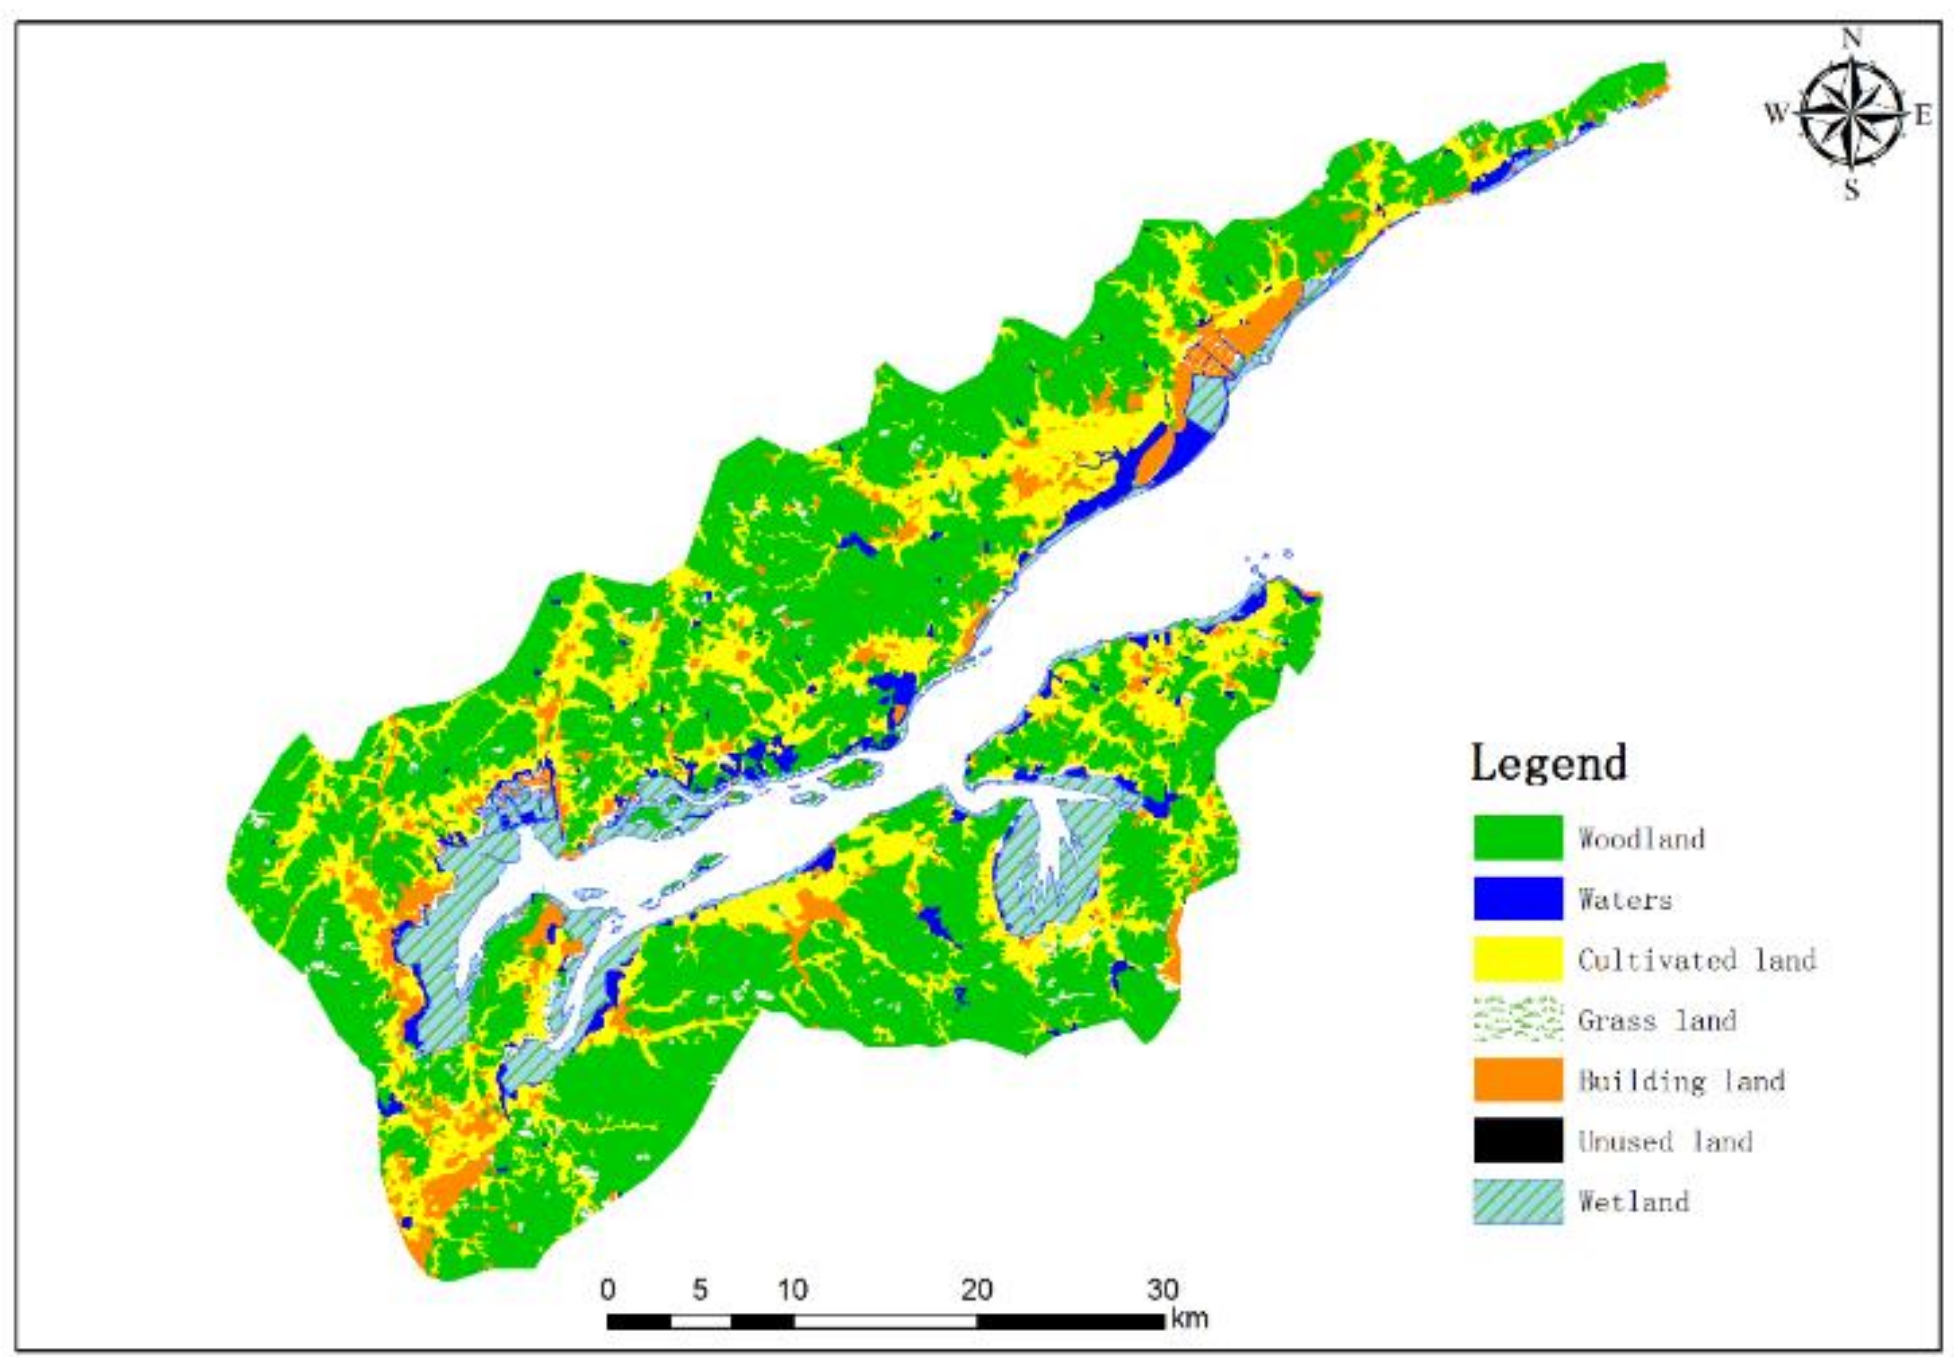
2.2. Data Sources and Software Usage

The data used in this study mainly include land-use data, meteorological data, the digital elevation model (DEM), soil data, and the distribution of forest scenic spots. The land-use data used in this paper were obtained from the Data Center for Resources and Environmental Sciences, and Chinese Academy of Sciences, and they were divided into seven categories (Figure 2). The meteorological data were obtained from the China greenhouse data system, and the basic meteorological data of the XSB basin were obtained by using the ArcGIS 10.2 software spatial interpolation tool for meteorological data. The forest scenic vector data were derived from Google Earth software. The basic spatial unit of this study is a 30 m resolution grid. The software and modules used in each single-factor evaluation are shown in Table A1 of Appendix A.

2.3. Research Methods

2.3.1. Identification of the Ecological Source

The ecological source refers to the source point of interregional species diffusion, as well as ecological function flow and transmission, which is an area that must be protected to maintain regional ecological security and sustainable development [28]. In this study, the ecological conservation importance classification of the XSB basin was obtained by stacking the grid layer of ecological service importance, ecological sensitivity, and landscape connectivity and then identifying the ecological source.
(1) Importance of ecological services:
According to the environmental characteristics of the XSB basin, the comprehensive evaluation of ecosystem services was carried out from the three aspects of water conservation, carbon fixation and oxygen release (NPP), and habitat quality, and the evaluation results were modified by forest scenic area.
Among them, water conservation and habitat quality were measured by the water yield and habitat quality modules of the integrated valuation of ecosystem services and trade-offs (InVEST) model [29]. The carbon fixation and oxygen release were measured by the NPP estimation plug-in of ENVI 5.3 software. The importance of the abovementioned ecosystem service functions was classified into 5 levels and assigned values from 1 to 5. The higher the value, the higher the ecosystem service level. For the forest scenic area correction, we downloaded the vector data of the XSB basin forest scenic area, assigned 5 to the forest scenic area, and assigned 1 to other areas. The evaluation results of the importance of ecological services were obtained by superposing the equal weights of the classified ecosystem services. The importance classification was carried out by using the natural breakpoint method, and the results are generally important, relatively important, moderately important, highly important, and extremely important, marked as 1, 2, 3, 4, and 5, respectively [30].
(a) Evaluation of water conservation function:
The meteorological data of 87 meteorological stations in five provinces on the east coast of China in 2017 were collected by the China Greenhouse Data System, including precipitation, real-time atmospheric pressure, air humidity, wind speed, and temperature. The basic meteorological data of the XSB basin were obtained by using the Arcgis10.2 software spatial interpolation tool. Evapotranspiration data of the XSB basin were retrieved by the surface energy balance principle (SEBS) model of ILWIS open 3.8.1.0 software. The data on soil depth, soil texture, and soil organic matter content were obtained from the national soil database, and the available water content of plants (PAWC) was calculated. By referring to the reference value of the crop coefficient of FAO and the research results of other scholars [31], we obtained the biophysical number table of each land-use type (Table 1). Finally, the Water Yield module of the InVEST model was used to import all data to calculate the water conservation data of the XSB basin [32].
(b) Evaluation of carbon fixation and oxygen release (NPP):
Based on the meteorological interpolation data obtained in the process of water conservation calculation, the radiation data and vegetation type data in 2017 were collected, and the NPP grid data of the XSB basin were calculated through the NPP inputs of ENVI 5.3 software (CASA model). The static parameters of the data required for the model are automatically configured by the software. The vegetation-type map, NDVI data, and meteorological data were collected from the Internet.
(c) Habitat quality assessment:
The habitat quality was obtained by using the habitat quality module of the InVEST model, in which cultivated land, rural residential areas, urban residential areas, roads, and industrial land were regarded as threat sources. By setting the relative influence of each threat source (the weight of a stress factor indicates the relative destructive power of a stress factor to all habitats, from 0 to 1), we obtained the distance between the habitat grid and the threat source, and the sensitivity level of the habitat to the threat source (Table 2). For the weight of the stress factor and the distance between the context grid and the threat source, we referred to other relevant studies [33,34,35]. The sensitivity of the threat source (Table 3) was set according to the basic principles of biodiversity protection and the basic theories of ecology and landscape science. For example, the sensitivity of natural lands, such as forests and grasslands, is high, and the sensitivity of roads and industrial land is low. The value is between 0 and 1. The closer the value is to 0, the smaller the sensitivity, and vice versa. Habitat suitability is a habitat score given to each land type, with a range of 0–1. The higher the score, the better the habitat suitability of the land type. The habitat suitability of various habitats and the related parameters of their sensitivity to threat factors were mainly based on the research results of other scholars [36]. The habitat quality map was generated by the distance attenuation method and exponential attenuation method.
(d) Forest scenic area correction:
Vector data of forest scenic spots can be downloaded through Google Earth. The data of forest scenic area were used as correction factors after the superposition of water conservation, NPP, and habitat quality.
(2) Ecological sensitivity:
Ecological sensitivity assessment is a comprehensive assessment of the possibility and degree of ecological imbalance and environmental problems when human activities interfere in a certain area. It reflects the possible ecological consequences of human activities [37]. The higher the regional ecological sensitivity, the worse the stability of the ecosystem, and the more easily ecological and environmental problems occur. After comprehensively considering the availability of data, resolution accuracy, data reliability, and academic recognition, we finally selected the normalized difference vegetation index (NDVI), elevation, slope, and land-use type to build an index system. The corresponding range of high, medium, and low sensitivity was divided for each impact factor. According to the index weight determined by Wang’s research [38] combined with the actual situation of the research area, the sensitivity evaluation results of the abovementioned five categories of factors were weighted (Table 4), and the ecological sensitivity evaluation map was formed.
(3) Landscape connectivity:
Landscape connectivity is a measure of the continuity between landscape spatial structural units. High landscape connectivity is conducive to the maintenance of ecological processes and biodiversity. This study analyzed the landscape connectivity through the morphological spatial pattern analysis method (MSPA); classified the landscape by using guidos Toolbox 2.8; took ecological land such as forest land, wetland, grassland, and water as the foreground; and took other non-ecological land as the background. After obtaining the grid map, ArcGIS 10.2 software, the plug-in modules Conefor inputs, and Conefor Sensinode 2.6 were used to calculate the landscape connectivity. The overall index of connectivity (IIC) and the probability of connectivity (PC) were used to evaluate the connectivity of the landscape in the study area [39]. On the basis of the connectivity index calculation, the importance dIIC of each patch, that is, the importance of each landscape patch to the overall connectivity, was calculated to characterize the patch connectivity importance. In the calculation of the patch connectivity index, the threshold of patch distance was set to 500 m, and the connectivity probability was set to 0.5. The calculation formula is as follows:
dIIC = (IIC − IICremove)/IIC × 100%
In the formula, dIIC represents the change of PC after a patch is removed, which is used to measure the importance of the patch to maintain landscape connectivity. IICremove is the overall index value of the remaining patches after removing a single patch, and IIC is the overall connectivity index of the patches. As the radiation effect of fine patches is limited, the 10 patches with the largest area (more than 20 km2) were selected as the ecological source.

2.3.2. Resistance Surface Analysis

The resistance that species and ecological functions need to overcome in the process of controlling and covering space is called ecological resistance. The larger the ecological resistance value, the more difficult the spatial movement of species, and the more ecological services and ecological functions that are lost in the flow process [40]. When a species makes necessary spatial movement owing to its own habits or environmental changes, it preferentially chooses the same or similar land-use type as its original habitat. Animals and plants are sensitive, and in the process of covering large-scale space, they choose to move in space within the patch. According to the main land-use types in the XSB basin, the relative resistance coefficient values were assigned to seven patch types in different regions, and the ecological resistance surface based on land-use types was obtained.
The setting of the resistance value based on land-use type only covers up the difference in ecological resistance within the same land type. Therefore, elevation and slope were selected as the other two factors, which were superimposed with the resistance surface formed based on the land type to form a comprehensive resistance surface in the study area and more accurately represent the difference in regional ecological resistance. The index system of resistance surface construction is based on the index weight determined by combining the research of Wang (2020) and Wang (2021) with the actual situation of the research area [38,41] (Table 5).

2.4. Construction of Ecological Security Pattern

An ecological corridor refers to the linear or ribbon ecological landscape connecting the ecological source. It connects the ecological source; is the carrier of species spatial movement and ecological function flow; is the key ecological land to ensuring the ecological flow, material flow, and energy flow between regions; and reflects the connectivity and accessibility of the source [42]. The MCR model was selected, and the low resistance channel between the ecological source sites was extracted as the ecological corridor by using the created ecological source sites and ecological resistance surfaces based on the spatial analysis tool of ArcGIS 10.2. Through the identification of ecological sources and the extraction of ecological corridors, the most basic ecological security network in the study area was formed.

3. Results

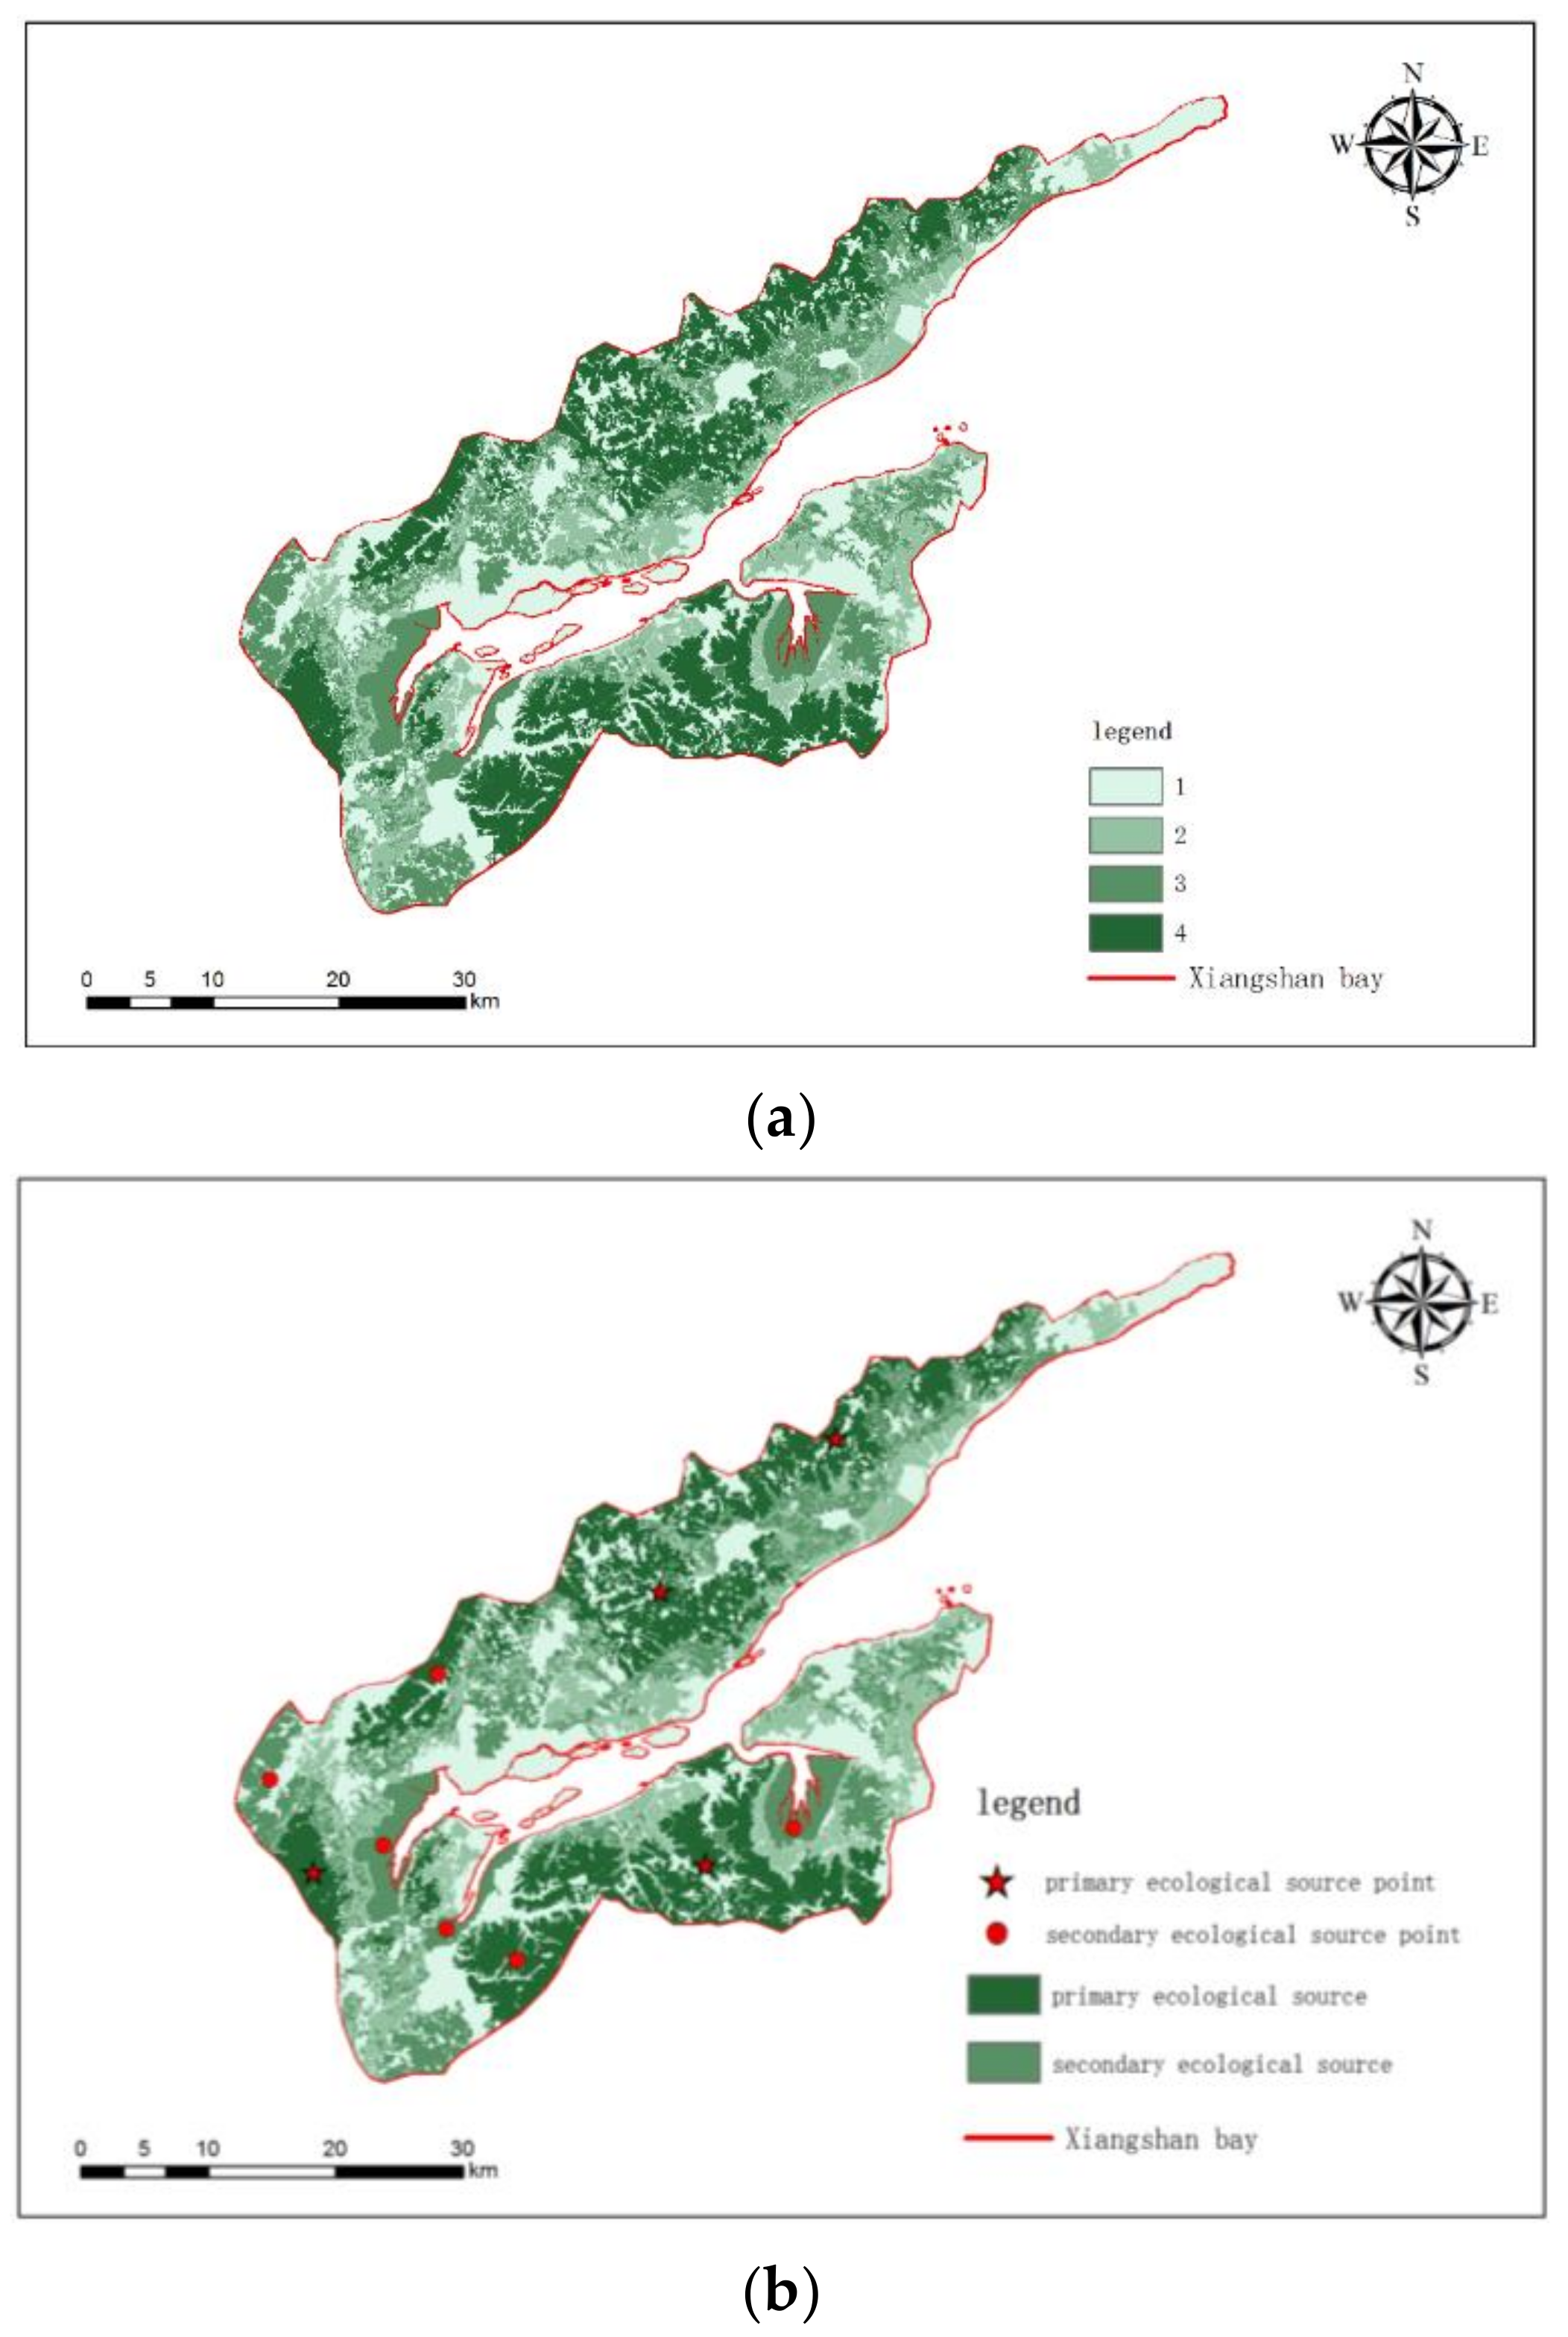
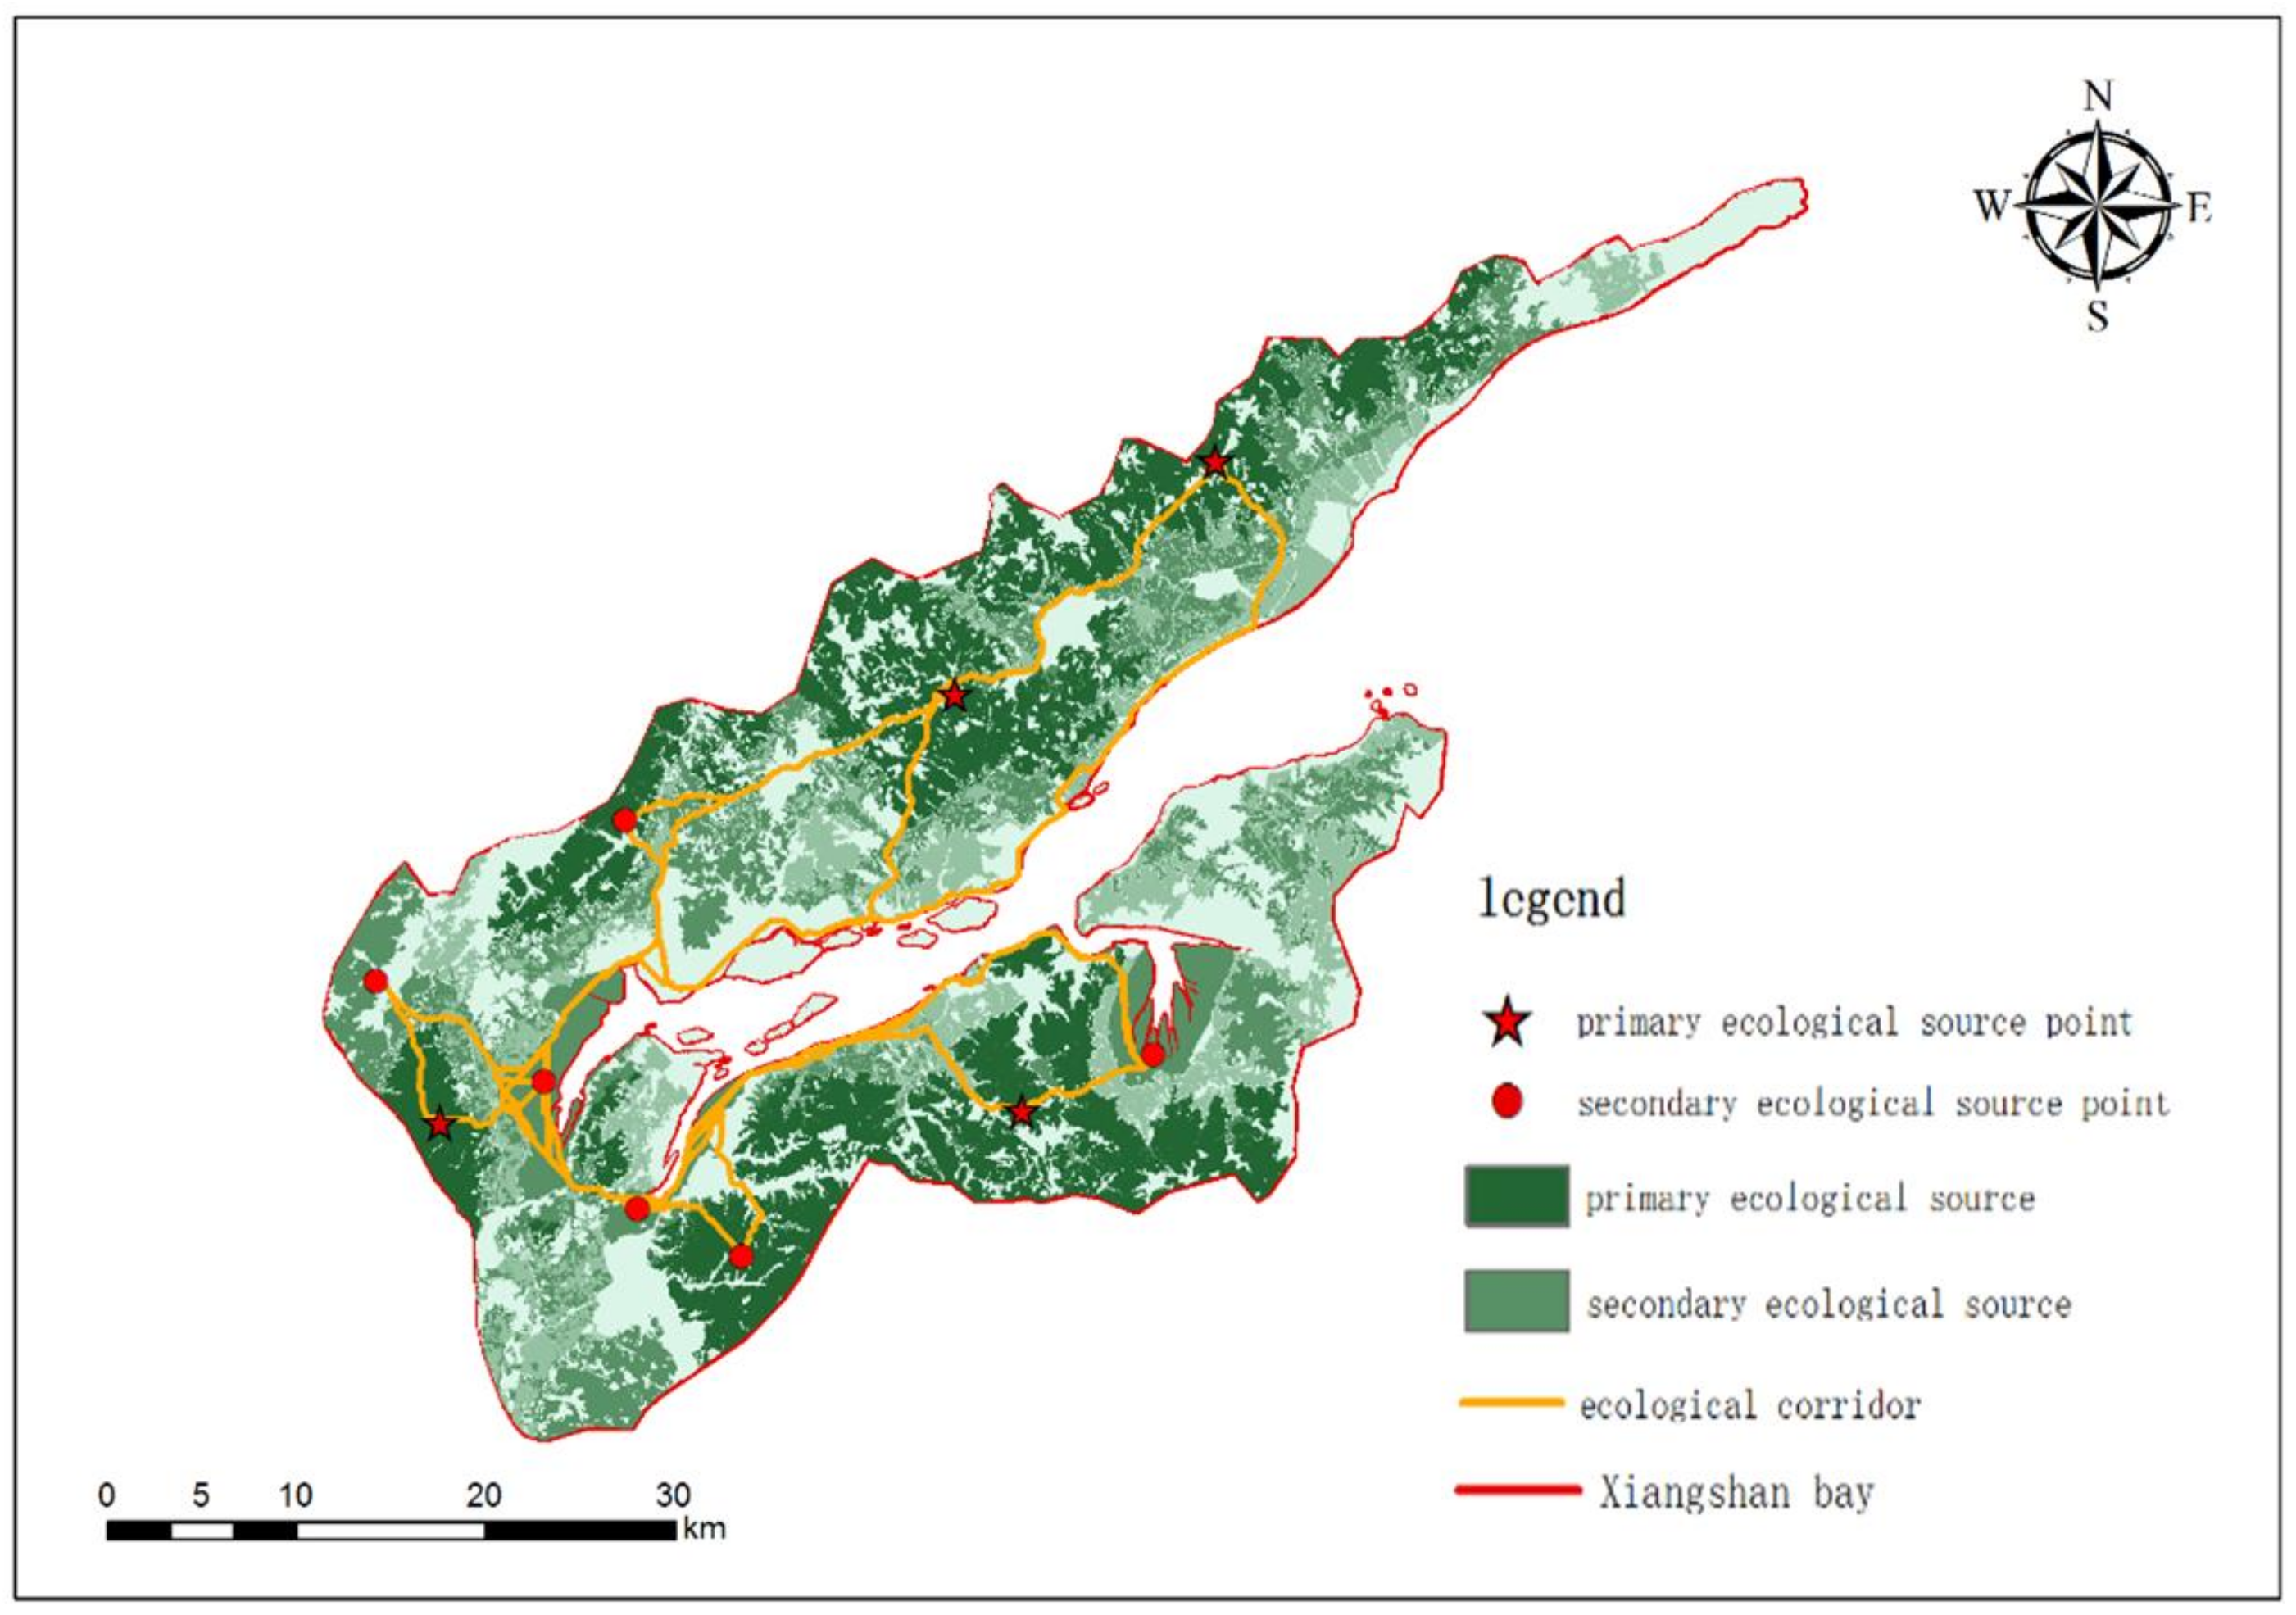
3.1. Ecological Source

The distribution map of the ecosystem service generation area in the study area is shown in Figure 3. The water yield decreases from the mountain forest land on both sides to the coastal wetland ecosystem near the sea area in the bay, urban living areas, and other areas with low vegetation coverage, which is closely related to the land-use type. The capacity of carbon fixation and oxygen release is reflected by the net primary productivity (NPP) of vegetation and decreases from the mountain forest land outside the bay to the urban residential area and the coastal wetland in the bay. The habitat quality of the XSB basin is relatively high on the whole. The forest ecosystems on both sides are the core of the whole basin. From the forest ecosystem to the surrounding agricultural area and then to the coastal wetland ecosystem, the habitat quality gradually decreases. The area with the lowest habitat quality is the residential area, which has been completely transformed into urban and rural residential areas by humans. The natural scenic spots, such as forest and water ecosystems, are all areas with excellent ecological conditions. The grid layers of the four ecological-service-importance evaluation results were superimposed to obtain the spatial pattern of the ecological service importance of the XSB basin (Figure 4). The extremely important area covers an area of 555.54 km2, accounting for 35.25% of the total area of the whole region. The highly important areas are mainly distributed in the area of 485.40 km2, accounting for 30.80% of the total area of the whole region. They are all distributed in the mountains, hills, rivers, lakes, reservoirs, and other areas with high ecological service value.
According to the ecological environment sensitivity evaluation method and index system constructed in this study, the ecological sensitivity of the XSB basin was evaluated by single-factor and comprehensive evaluation. The spatial pattern of the ecological sensitivity of each index is shown in Figure 5. The sensitivity of the land-use type gradually decreases from coastal wetlands on both sides of the bay to mountain forest land and then to urban residential areas, which are closely related to the diverse land-use types in the study area. NDVI sensitivity decreases from mountain forest land to coastal wetland in the bay, which is related to vegetation coverage in different areas. The sensitive areas with high elevation and slope are mainly distributed in mountainous and hilly areas. The grid layers of the four ecological sensitivity evaluation results were superimposed to obtain the spatial pattern map of the ecological sensitivity of the XSB basin (Figure 6). The extremely sensitive area is 395.17 km2, accounting for 25.01% of the area of the study area, and the highly sensitive area is 388.03 km2, accounting for 24.56% of the area of the study area. The two areas are distributed in mountains, hills, rivers, lakes, and reservoirs. The land-use types are mostly forest land and water, the vegetation coverage is high, and the water resources are rich and fragile, making the areas vulnerable to damage caused by natural disasters or manmade development. The slightly sensitive area is 318.62 km2, accounting for 20.17% of the study area. It is mainly distributed in the coastal wetland area, which is more stable than the forest ecosystem.
The assessment results of landscape connectivity are shown in Figure 7. The high-value areas of connectivity are mainly distributed in the forest ecosystems on both sides of the XSB basin. The forest ecosystems on both sides of the XSB basin run through and connect most of the study areas, so the connectivity is high. The low-value areas of connectivity are mainly affected by human activities and their surrounding areas. The transformation of the ecosystem landscape by human activities greatly reduces the connectivity of each landscape patch. According to the arrangement of 30 ecological source patches in the XSB basin in the order of area and landscape connectivity (Figure 8), it can be concluded that the landscape connectivity of each patch in the study area is in direct proportion to the area. With the reduction of the patch area, the landscape connectivity gradually decreases to zero, indicating that although the number of patches removed is large, the area is small and the distribution is discrete, so they have little impact on the overall pattern of landscape connectivity.
The landscape connectivity, ecological service importance evaluation map, and ecological sensitivity evaluation grid map were superposed with equal weight to form a spatial pattern of ecological protection importance (Figure 9a) to identify the ecological source. According to the specific situation of the study area, the importance of ecological protection in the study area is divided into four levels. The higher the level, the more important the ecological protection. The two-level ecological source areas are distinguished to ensure the integrity of the ecological process. The ecological source areas are selected in the Level 4 and Level 3 areas of ecological protection importance. Among them, the Level 4 area of ecological protection importance is the first level’s source area, with an area of 444.91 km2, accounting for 28.16% of the total area. The Level 3 area is the second level’s source area, with an area of 367.13 km2, accounting for 23.24% of the total area. According to the two-level ecological source areas, 10 ecological source points are determined, of which 4 primary ecological source points are in the area of ecological protection importance Level 4, and 6 secondary ecological source points are in the area of ecological protection importance Levels 4 and 3 (Figure 9b). As far as the distribution characteristics of the XSB basin are concerned, the ecological source areas are mainly distributed in the mountainous forest land, the surrounding areas of the water source areas, and the coastal wetland areas. It is worth mentioning that coastal wetlands are mainly distributed in secondary ecological sources, which may be related to the degradation of coastal wetlands.

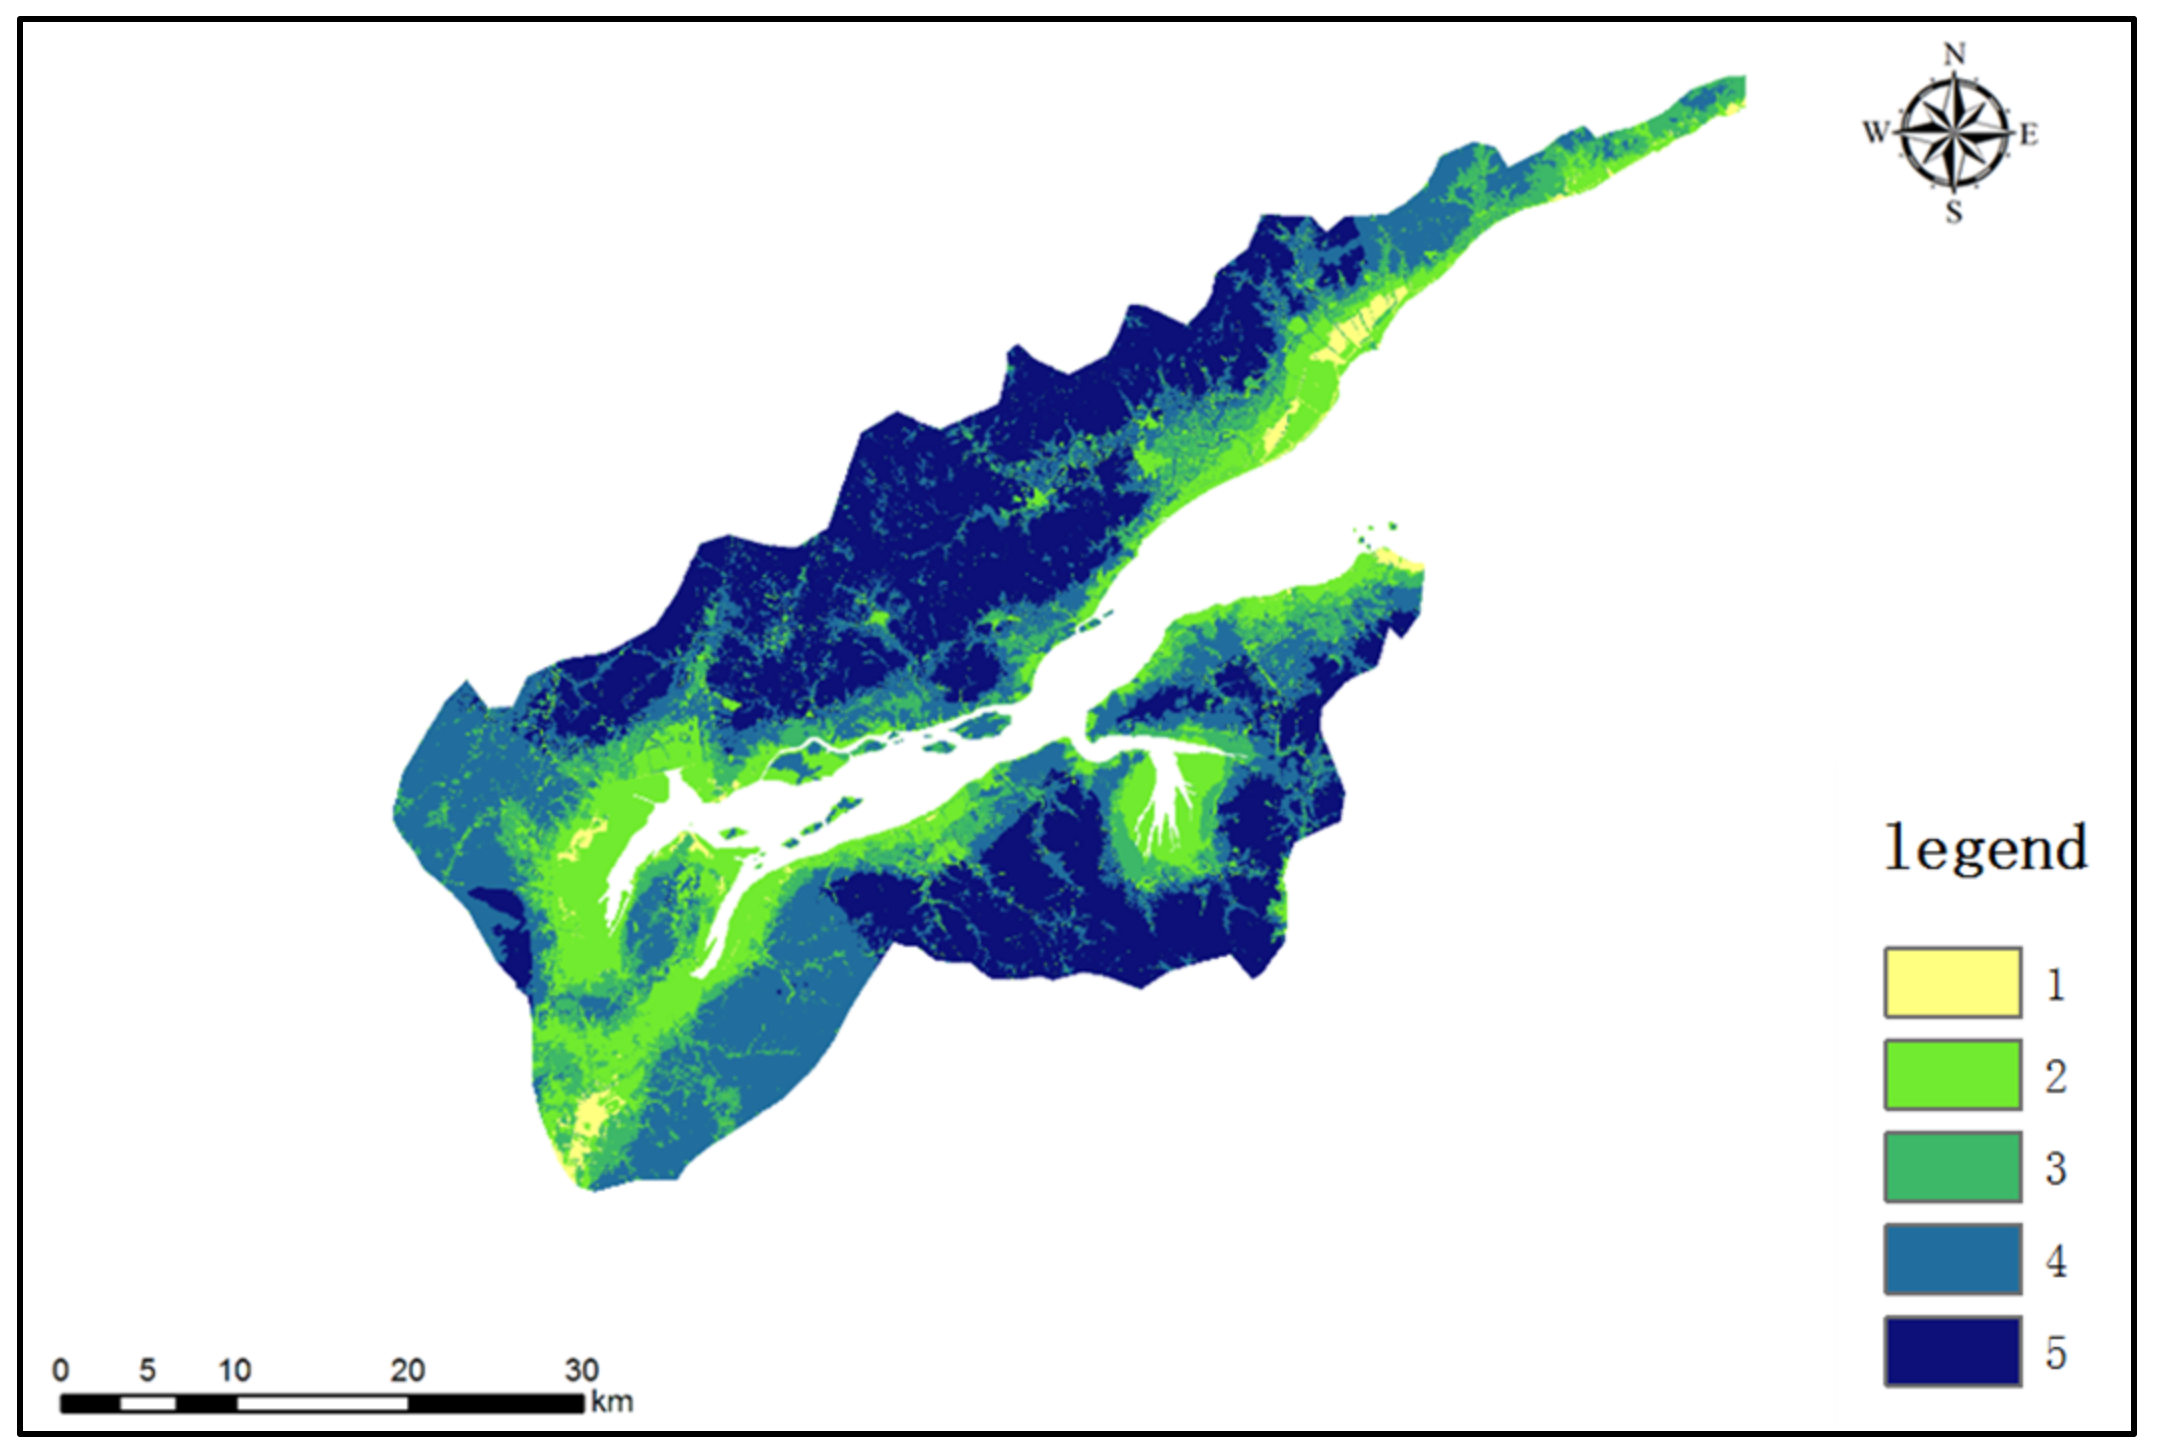
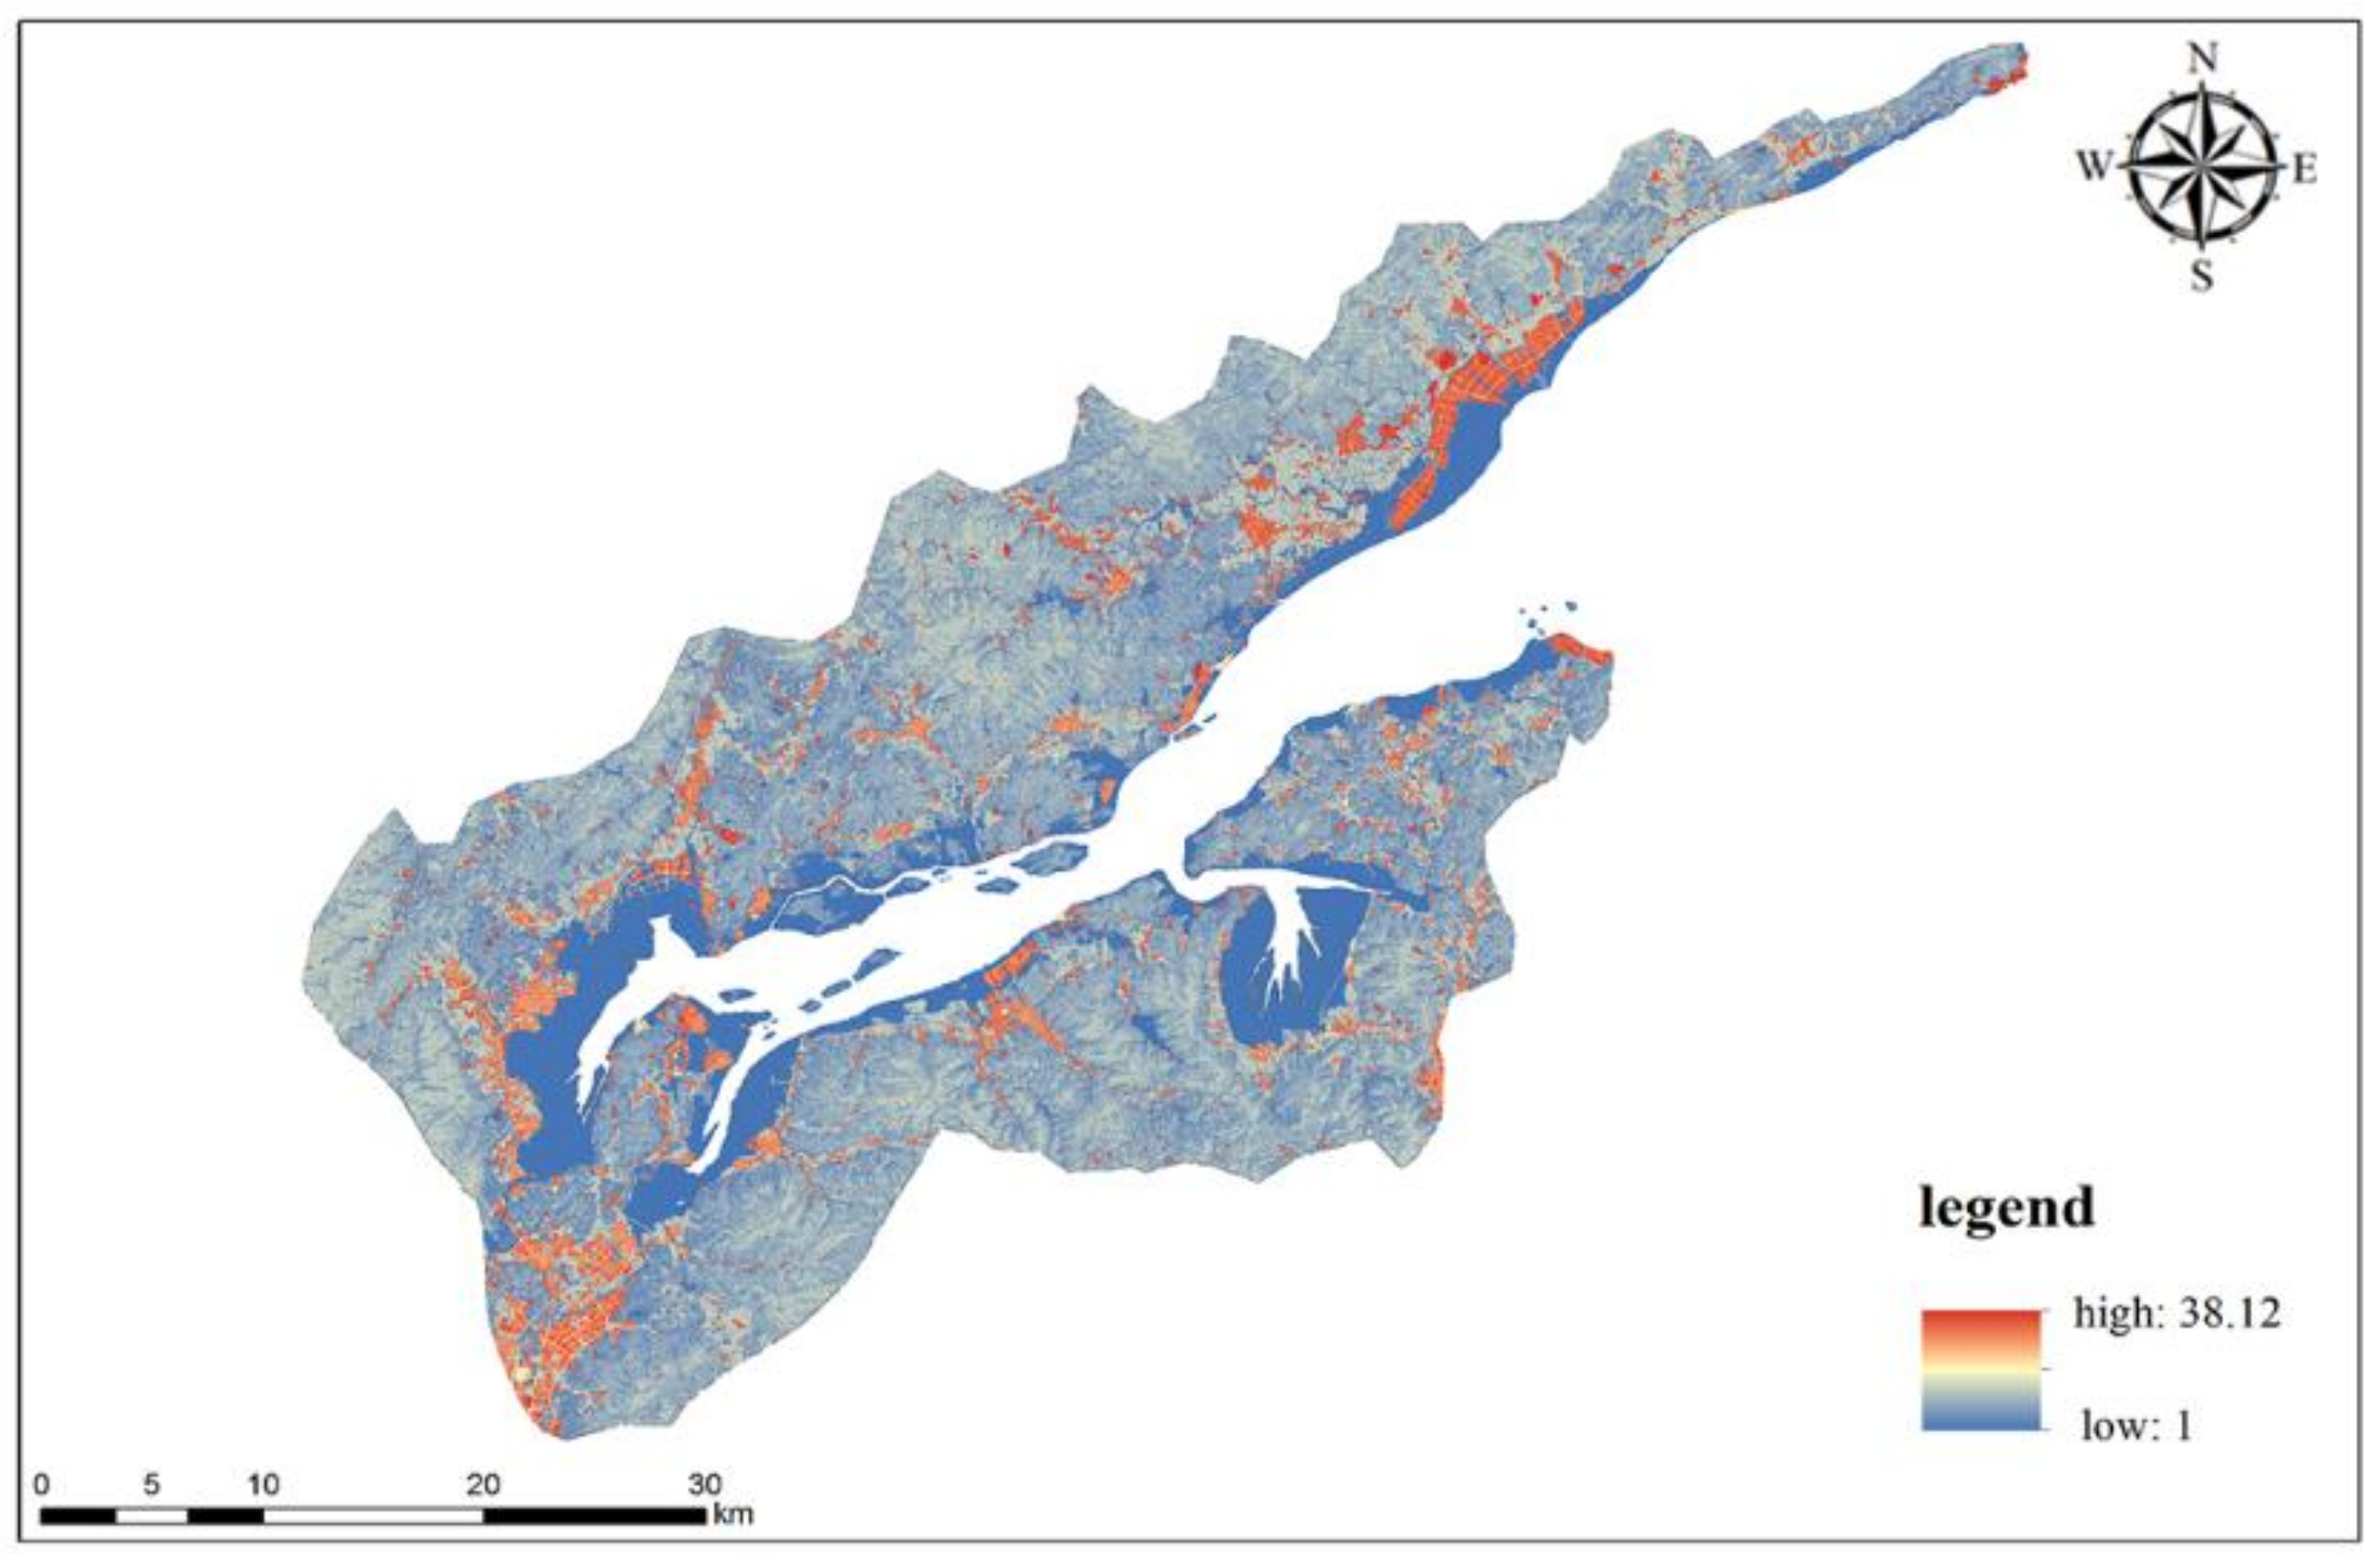
3.2. Minimum Accumulated Resistance Surface

Based on the spatial difference of ecological resistance formed by XSB, as shown in Figure 10, the ecological resistance values of most forest lands and other ecological areas in the study area are small. Owing to the correction of elevation and slope, the resistance values of mountain forest lands in different areas are different, which is more in line with the actual situation. The area with the smallest resistance value is the forest land in the low-lying area and the coastal wetland area, so the area is transformed into the area of human activities. The resistance value gradually increases and reaches the maximum value in the residential area.

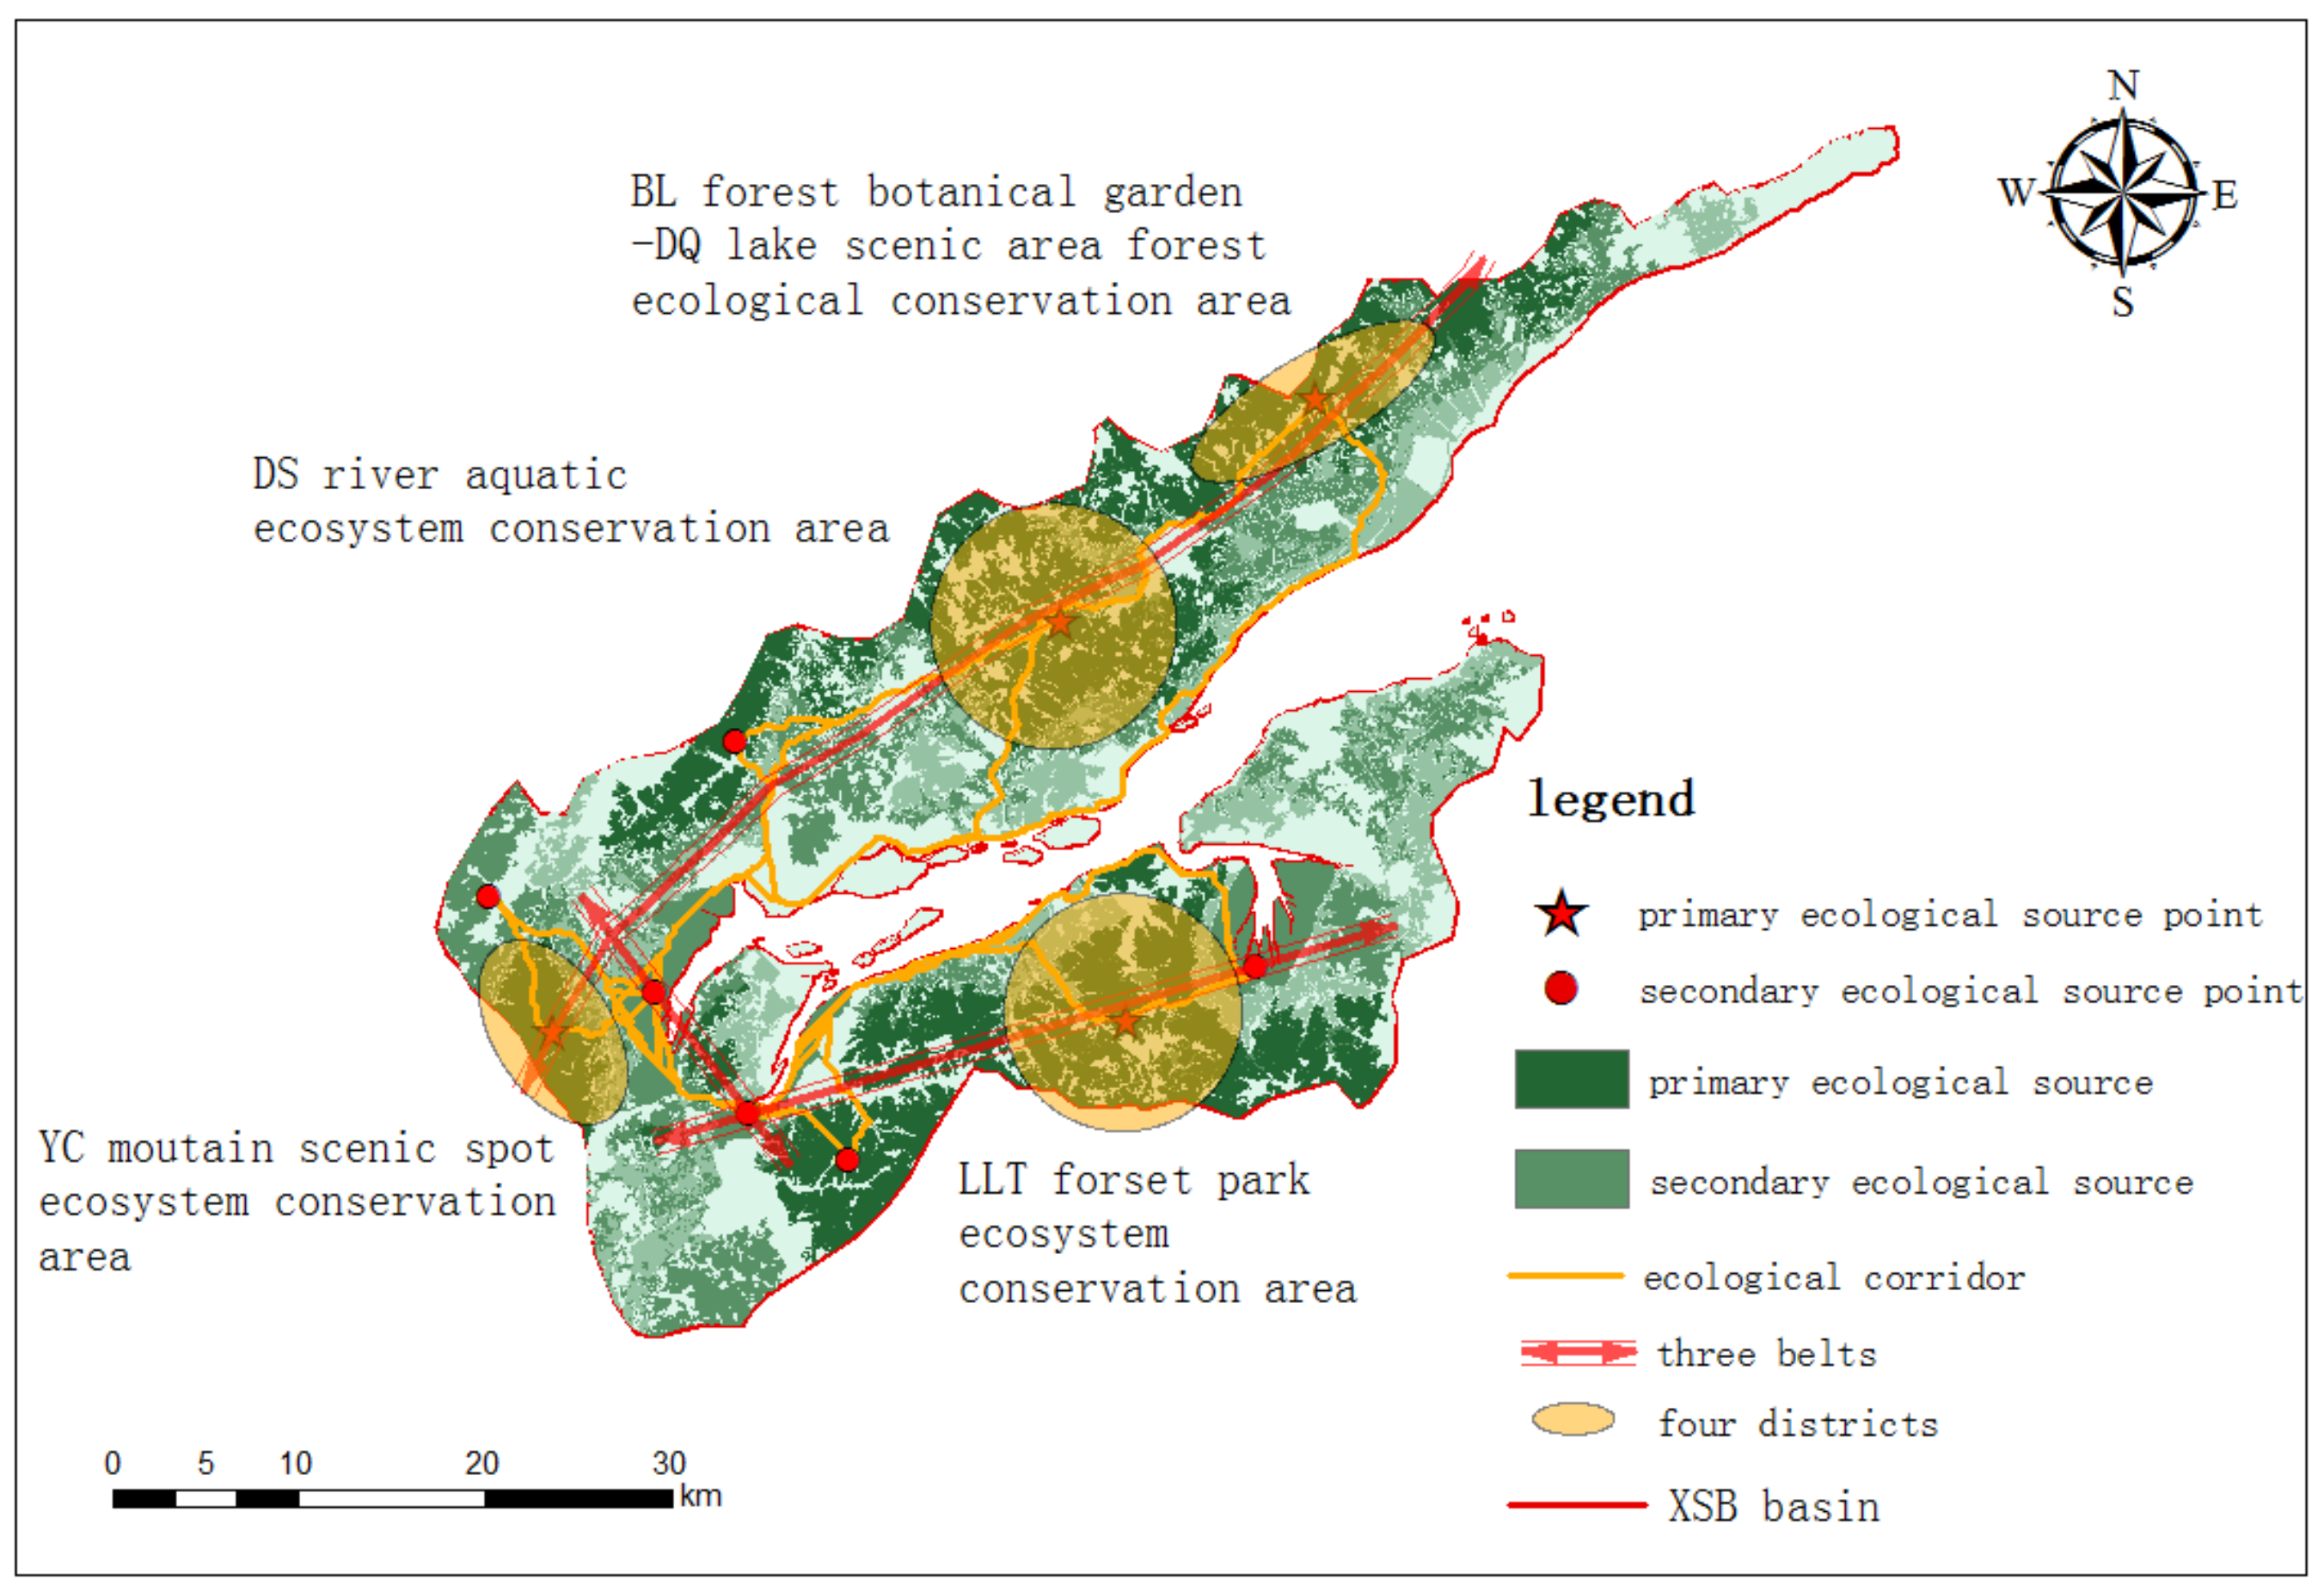
3.3. Key Ecological Corridors and Ecological Security Pattern

This study took the XSB basin as the research area, extracted the ecological source through two methods, comprehensively selected the best ecological source through field investigation and data reference, identified the ecological corridor through the minimum resistance model, and finally constructed the ecological security pattern of the XSB (Figure 11). The results show that the primary ecological source area of the XSB basin is 444.91 km2, and the secondary ecological source area is 367.13 km2, accounting for 28.16% and 23.24% of the total study area, respectively. The primary ecological source area is mainly distributed in the mountain forest land and water source area of the XSB basin, and the secondary ecological source area is mainly distributed in the mountain forest land and water source area and coastal wetland area. The total length of the ecological corridor is 550.91 km, and there are multiple ecological corridors between the two source areas, which reflects the randomness of species in the spatial movement. On the whole, the ecological corridors between the ecological sources of the XSB basin are connected in two ways. The first way is to connect the sources along the mountain plain and avoid the urban area. The second way connects the sources through the coastal wetland. The ecological corridor in the north of the XSB basin extends from the southwest to the northeast, connecting the YC mountain scenic area, DS river water system, BL Forest Park, and DQ Lake Scenic Area in turn, as well as four secondary sources of forest water. The ecological corridor in the south of the XSB basin is centered on the primary source of the LLT Forest Park, connecting a secondary source of forest water to the southwest and a secondary source of coastal wetland to the northeast. The two ecological corridors in the north and south are connected by an ecological corridor from the northwest to the southeast which runs through the two secondary sources of coastal wetlands. Through the spatial layout optimization of ecological elements, the ecological spatial optimization layout plan of the XSB basin is constructed and is mainly composed of two-level ecological source points, three ecological belts, and four ecological conservation areas (Figure 12).

4. Discussion

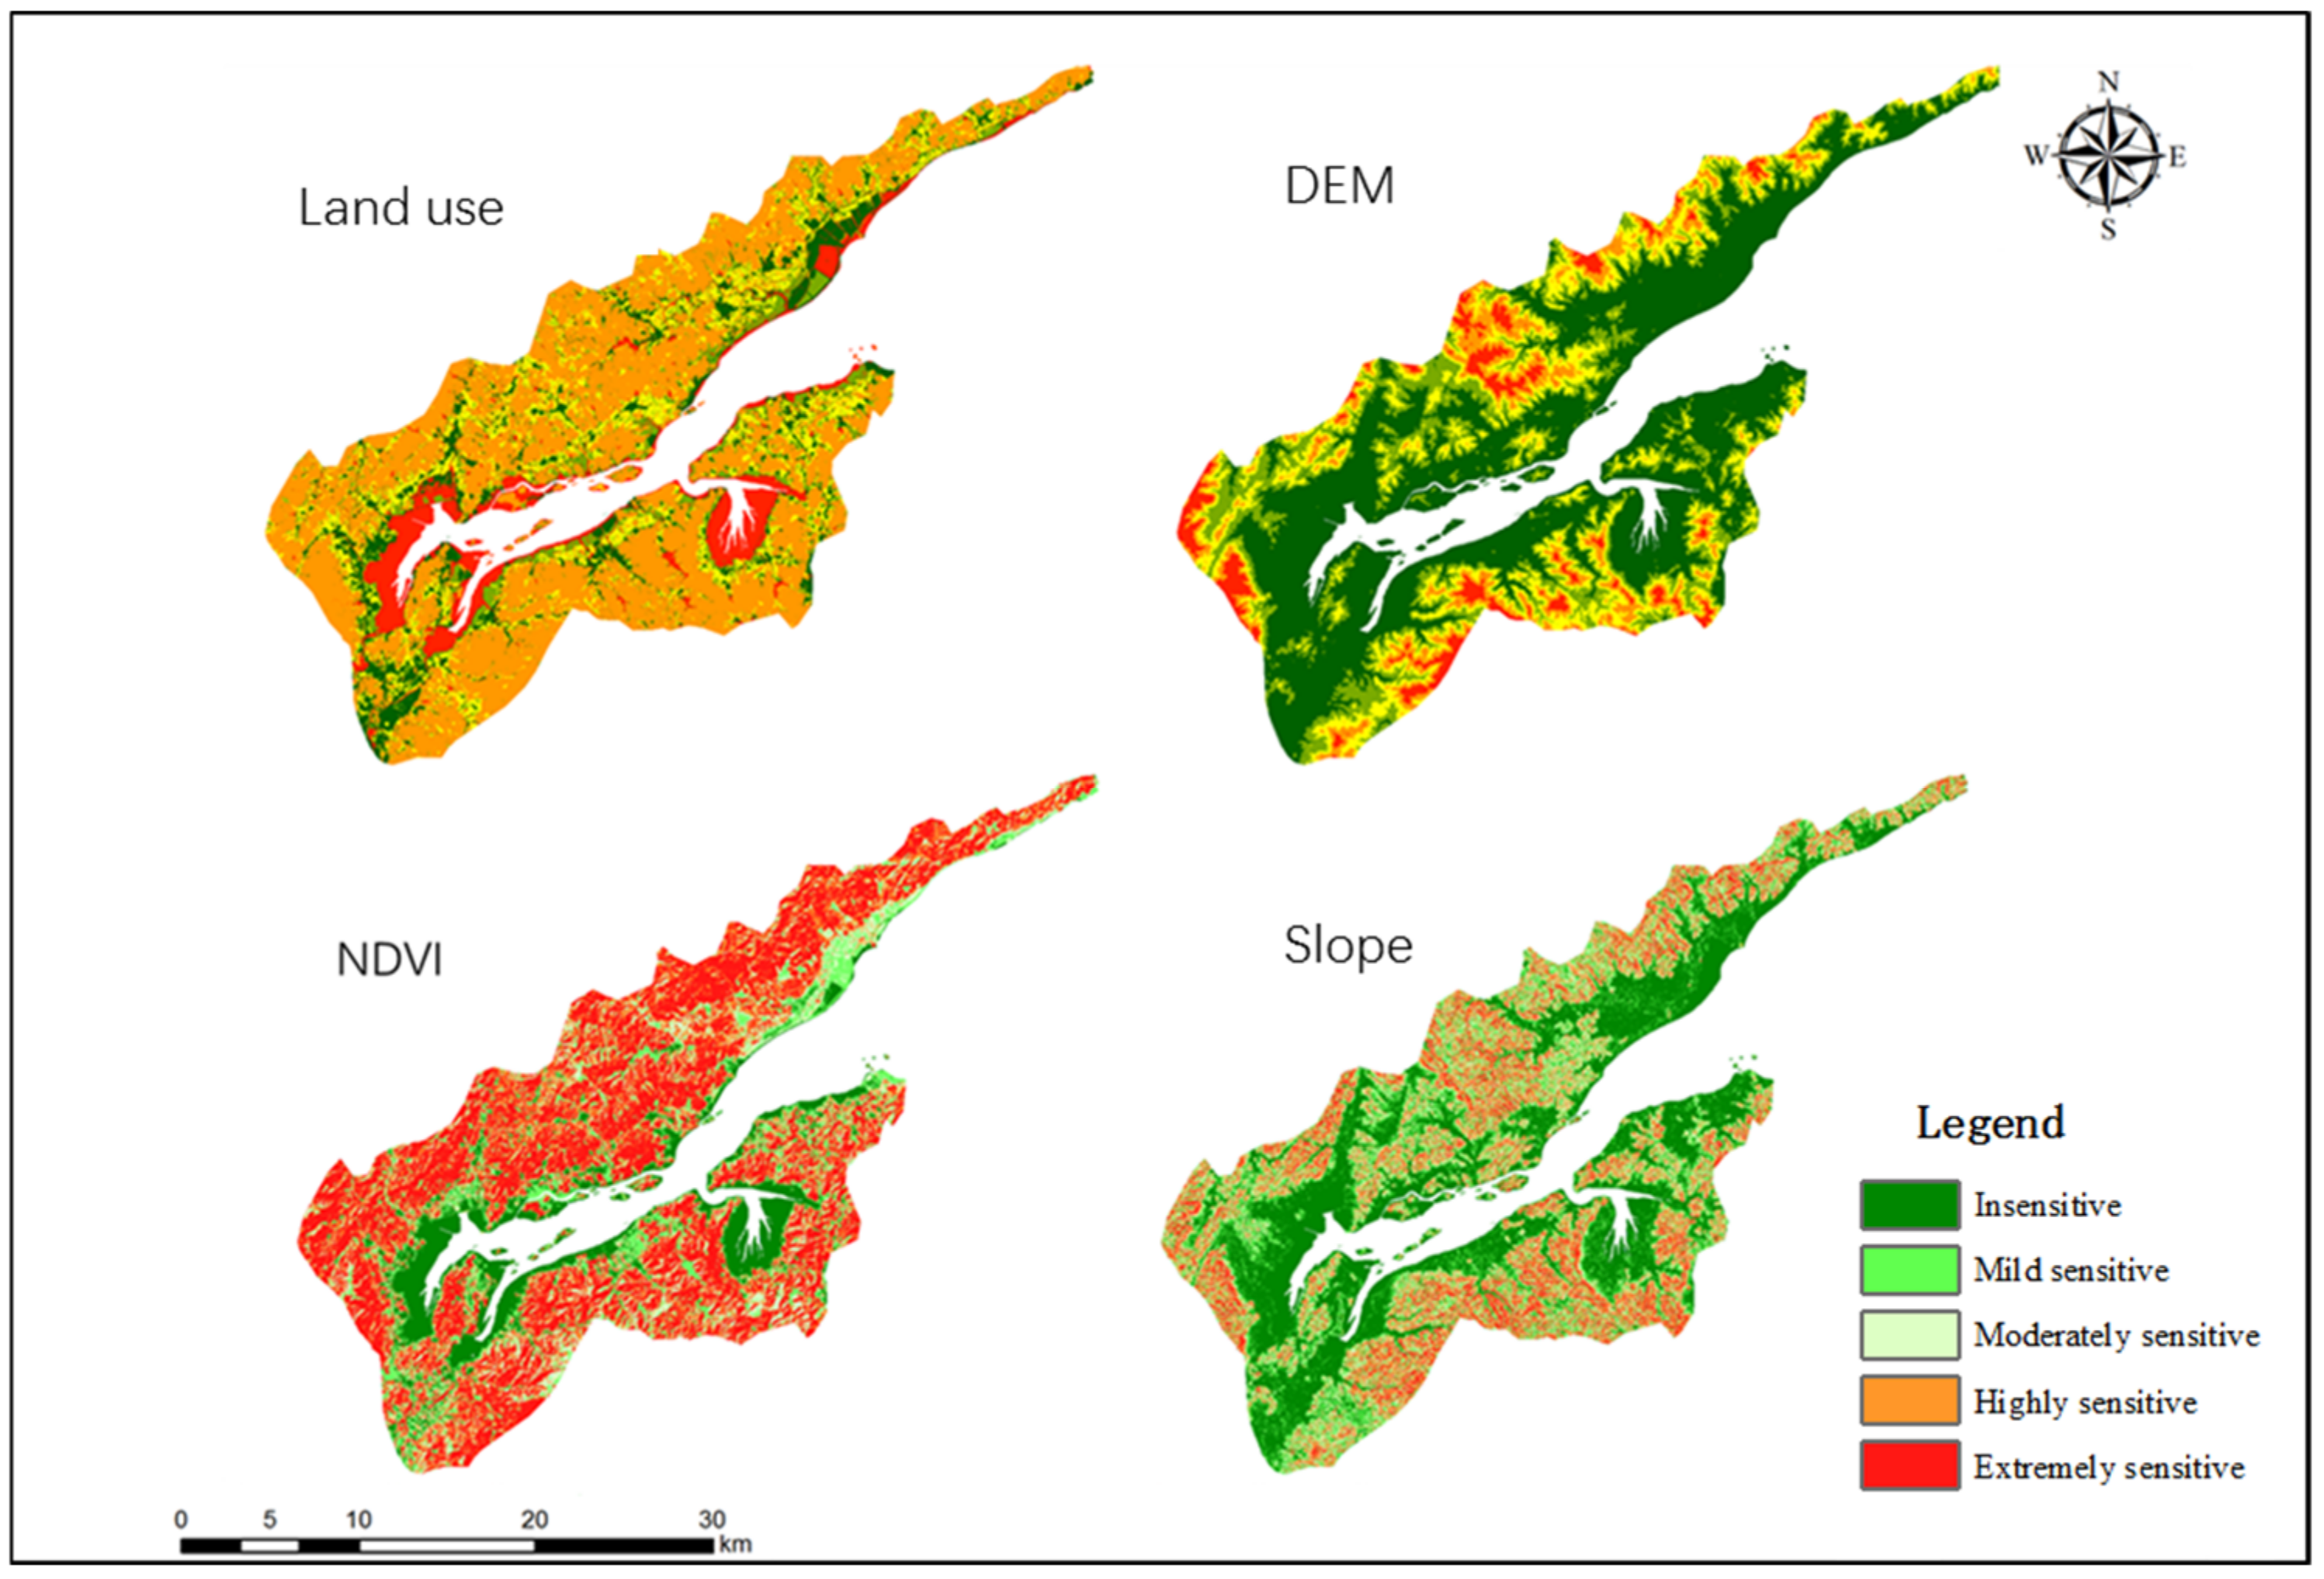
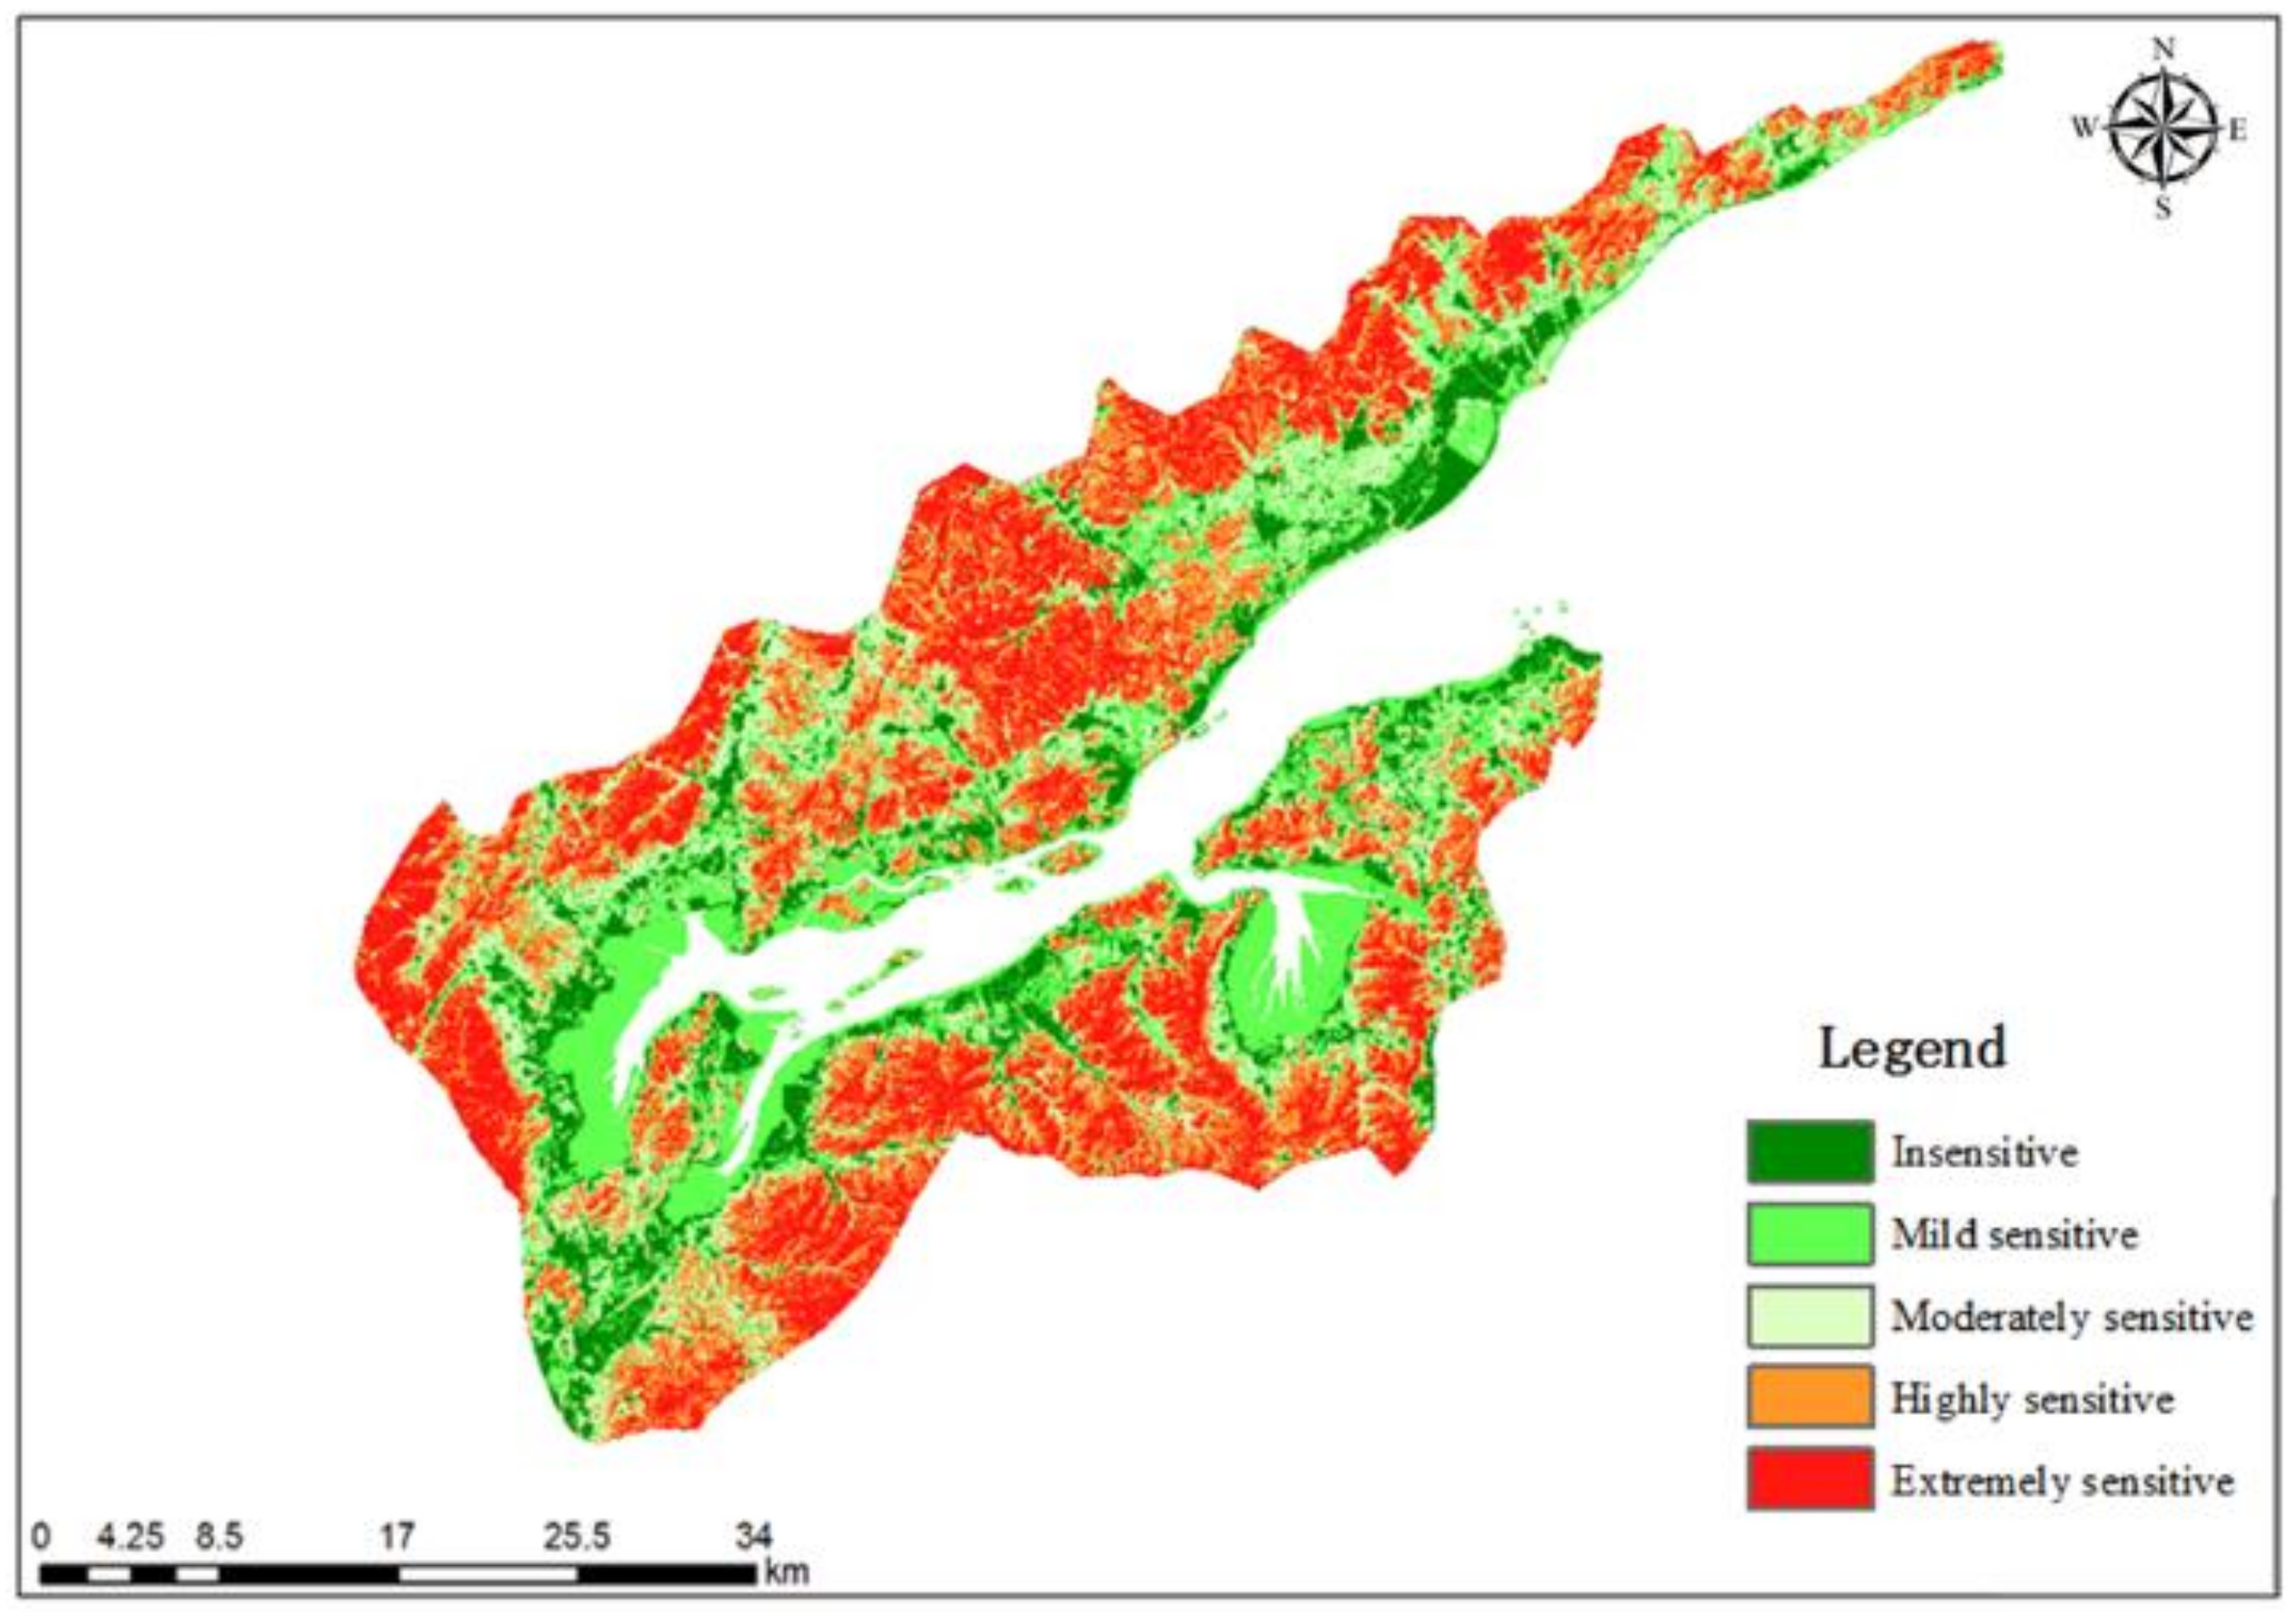
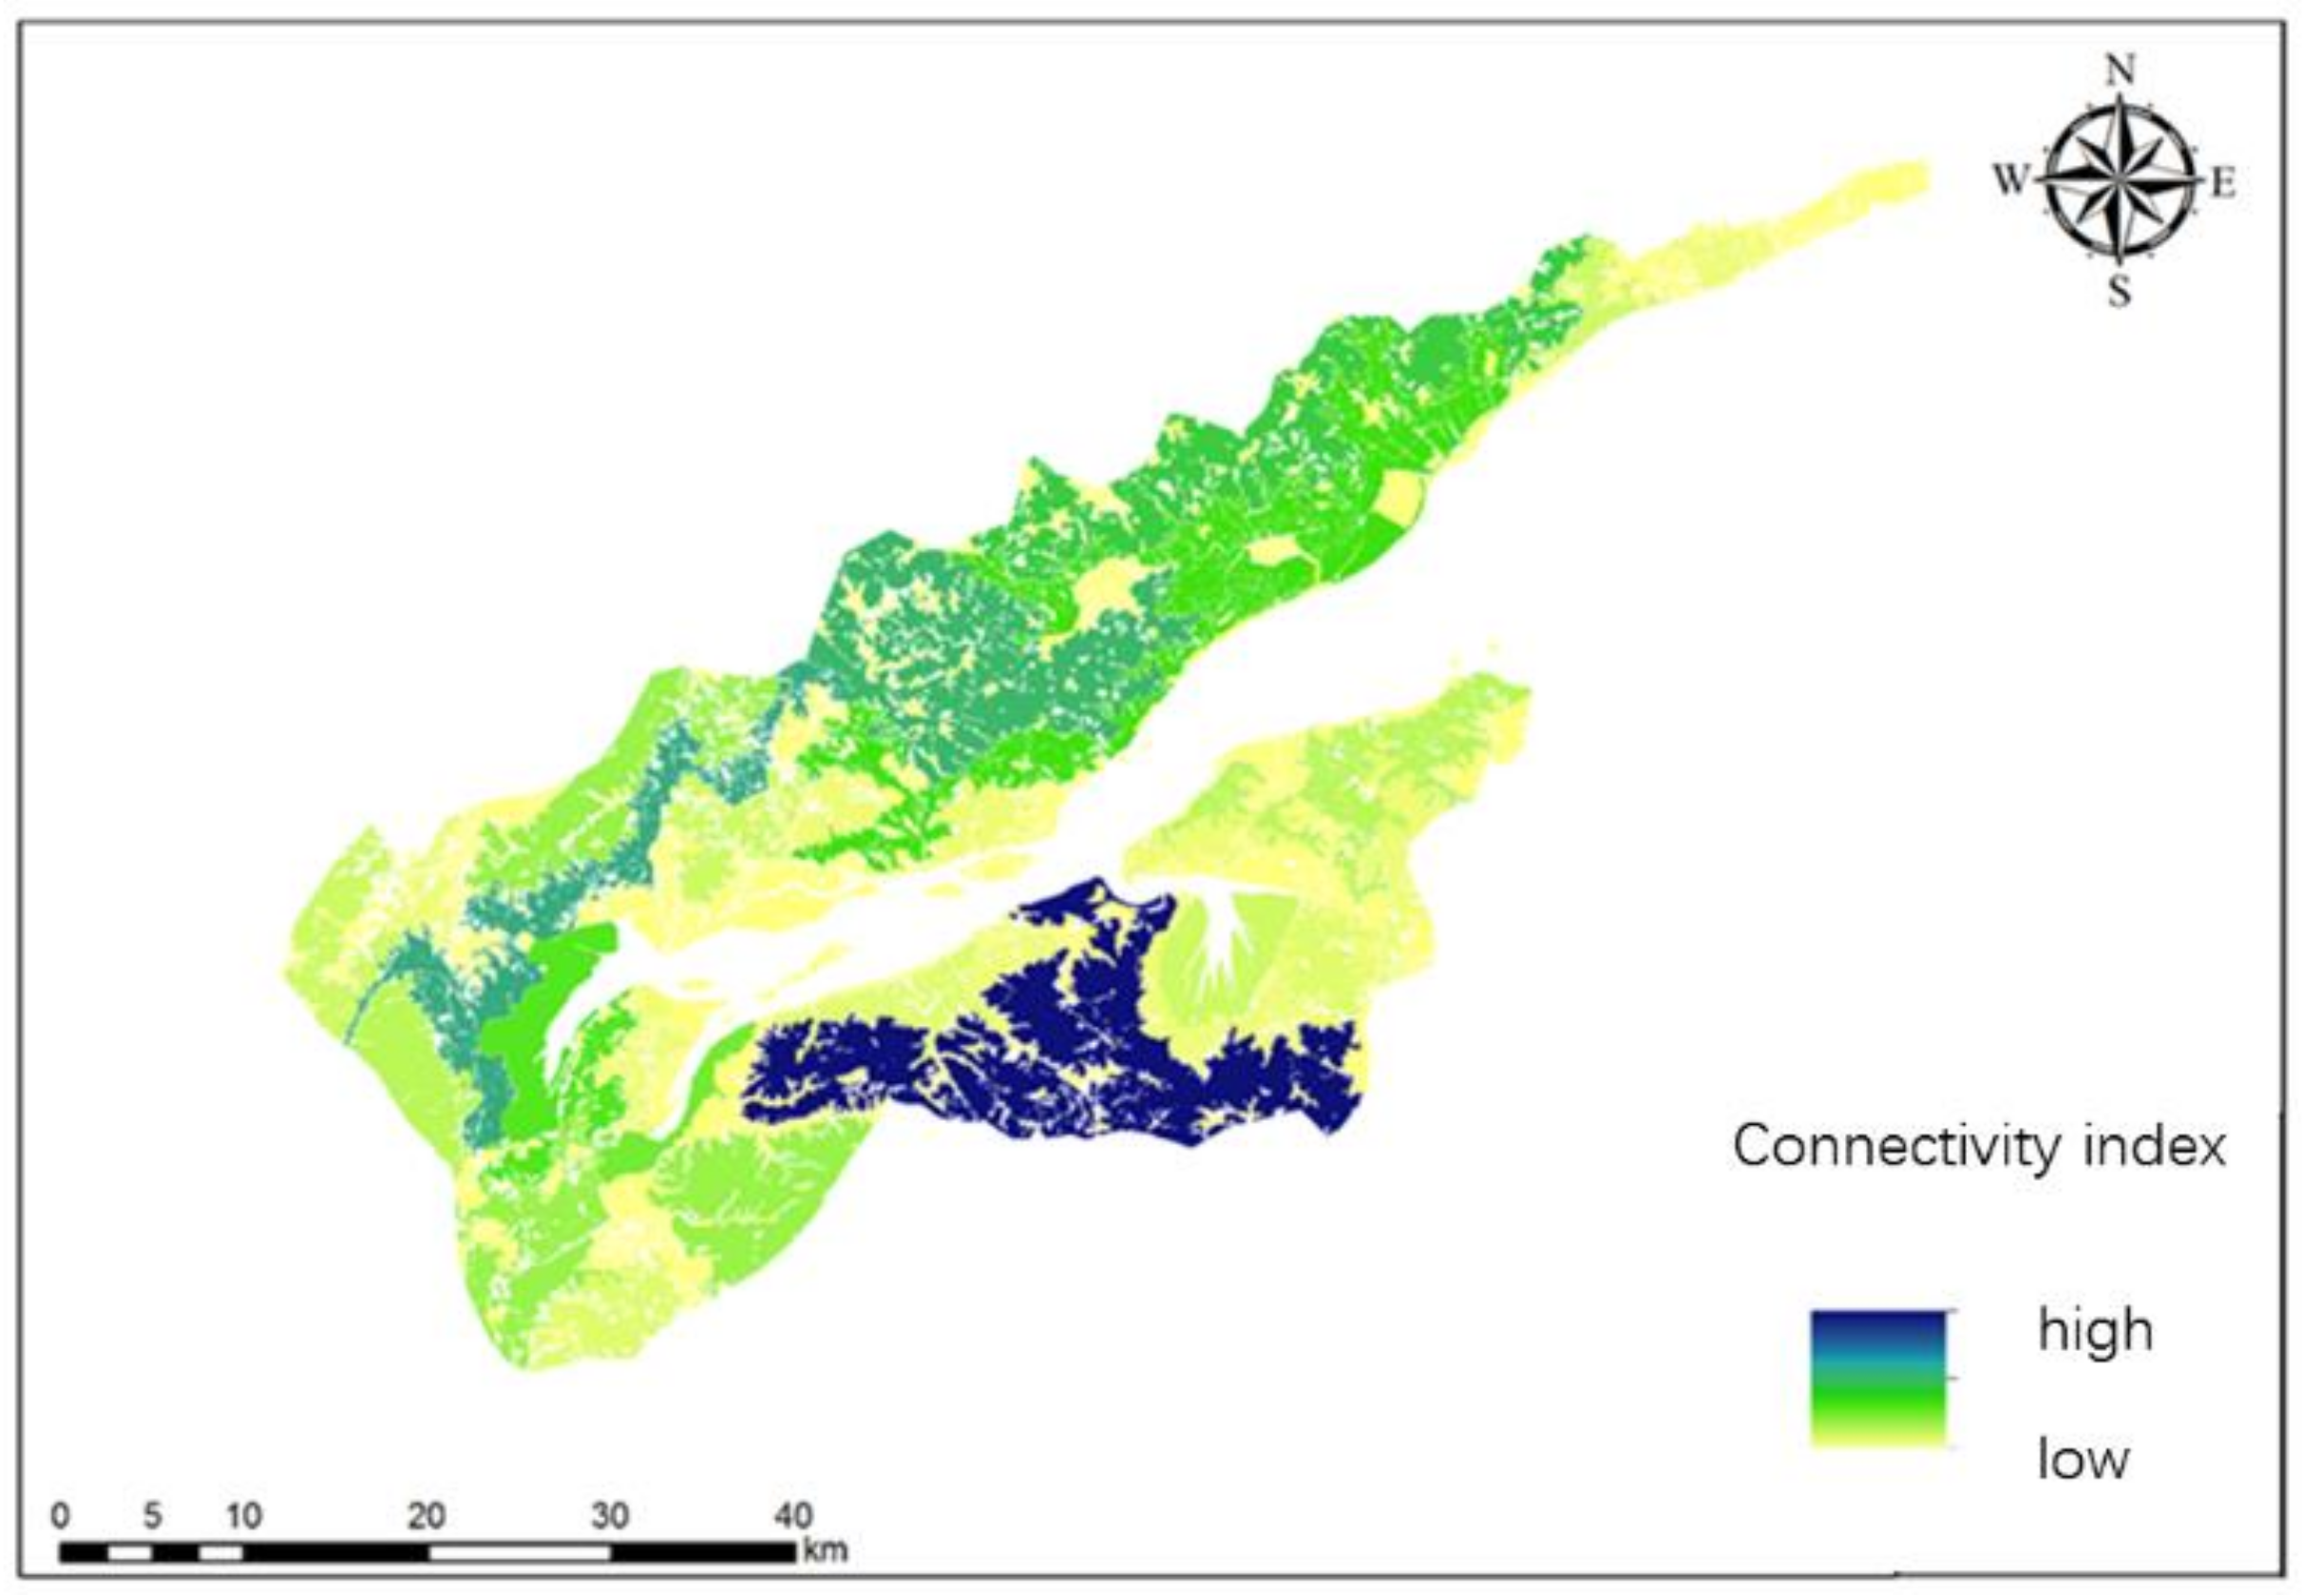
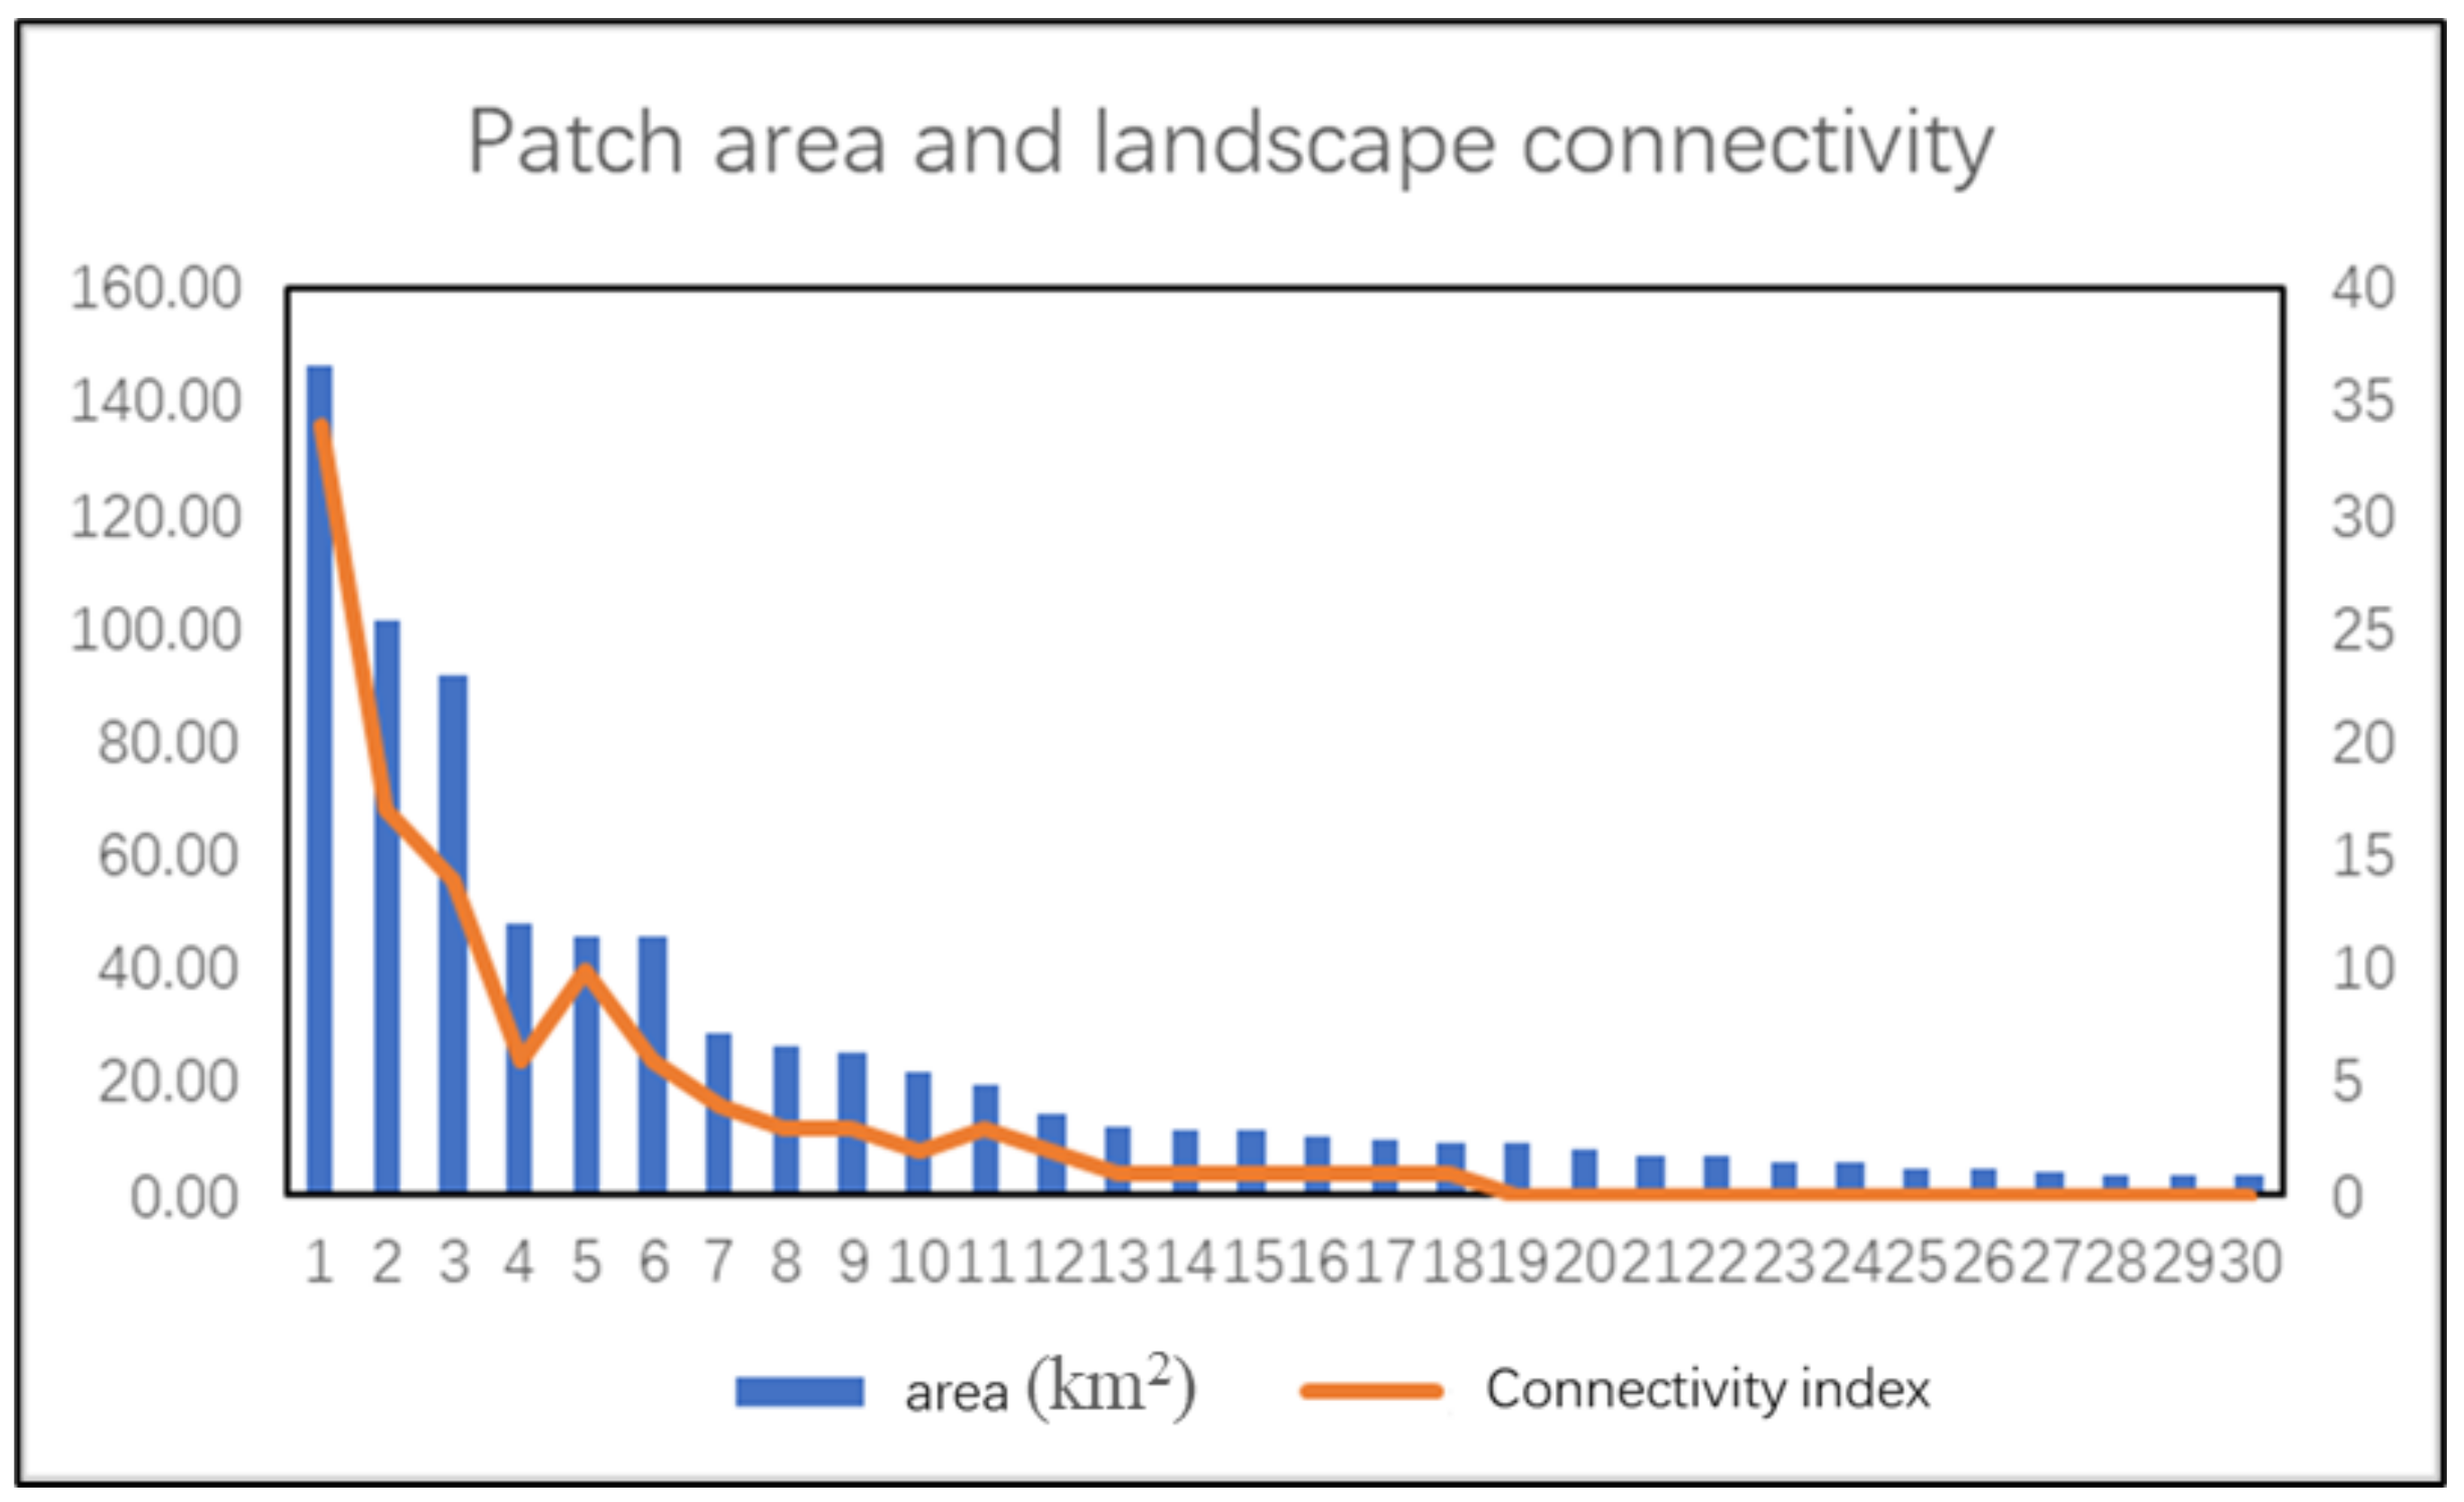
4.1. Analysis of Identification Mechanism of Ecological Source

At present, there are two methods for identifying the ecological source: the direct identification method and the building comprehensive evaluation index system method. The direct identification method usually selects natural scenic spots as the ecological source, but there are strong subjective factors. The method for building a comprehensive evaluation index system is usually based on factors including ecological suitability, ecological risk, ecological importance, and ecological connectivity, of which the ecological importance assessment based on ecosystem services is the most important and commonly used [43,44]. However, these methods focus on the functional attributes of the ecosystem [45], ignoring the impact of landscape connectivity on ecological processes and ecological functions at different scales [46,47]. Therefore, this study added landscape connectivity to identify the ecological source. With landscape connectivity, the classification of the landscape in the study area was mainly based on the land type and the area of the connected patches. This method could effectively identify the ecological source in the study area. According to the research results of this paper, the removed fine patches had little impact on the connectivity of the whole habitat, and, thus, they had little impact on the distribution of the ecological source. This agrees with the research results of Wu and others. Through the combination of landscape connectivity and other indicators to identify the ecological source in Shenzhen, the research results show that, although the number of patches removed was large, the area was small and the distribution was relatively discrete, so the impact on the overall pattern of the ecological source was small [48]. In specific research, a certain perspective or a combination of multiple perspectives is usually selected to determine the ecological source. In this study, the importance of ecological services, ecological sensitivity, and landscape connectivity were combined to identify the ecological source. In recent years, this approach has been favored by many researchers in the identification of ecological sources [17,49]. According to the identification results of the ecological source of the XSB basin in this study, the ecological source is mainly distributed in the mountain forest land and water source, which agrees with the results of many scholars. Wu et al. identified the ecological source of Shenzhen through the combination of landscape connectivity, biodiversity, and habitat quality and constructed an ecological security pattern. The results show that the important patches in the ecosystem were basically distributed in the mountains, and the ecological source was mainly composed of forest land [50]. Peng et al. identified the ecological source of Yunnan province based on the importance of ecological services, combined with biodiversity and habitat quality, and constructed the ecological security pattern through the minimum resistance model. The results show that the ecological security pattern of Yunnan province was composed of ecological sources dominated by forest land, and radial ecological corridors were distributed along mountains and forest belts [51]. Moreover, the nature reserves in the XSB basin were located in the primary ecological source identified in this study, and the coastal wetlands, one of the important ecosystems in XSB basin, were located in the secondary source, which, to a large extent, indicates the feasibility and reliability of this identification method.

4.2. The Important Role of Coastal Wetlands in the Ecological Security Pattern of the Coastal Areas

The ecological corridor can achieve the following ecological services: movement and diffusion, lasting maintenance of species diversity, habitat connectivity, and gene exchange. The aim is to maintain a healthy ecosystem. Therefore, the ecological corridor plays a decisive role in the whole ecosystem [52]. The XSB basin has 133.21 km2 of tidal flats, accounting for 8.5% of the area. It provides people with material production, environmental regulation, and rich biodiversity and is an important ecosystem in the XSB basin. From the identification results of ecological corridors in the XSB basin, the ecological corridors connecting various ecological sources eventually converge in the coastal wetland area, accounting for about 40% of the total corridor length. The coastland wetland area occupies the most important position in biological migration and species exchange among ecological sources and is the link connecting other ecological sources.
The coastal wetlands in the XSB basin play a key role in the ecological security pattern. From the perspective of building the minimum resistance model, the ecological resistance value of the coastal wetland area is the lowest, and the two ecological belts in the north and south are connected by two ecological sources of the coastal wetland, so they occupy a pivotal position in the distribution of ecological corridors. Zhan built an ecological security pattern composed of coastal ecological corridors and landscape ecological corridors in Weihai, Shandong province, China, by combining the importance of ecosystem services and ecological sensitivity with the ecological red line. The coastal ecological corridors cover the whole coastline of Weihai, providing an important guarantee for the biodiversity and biological migration and diffusion of Weihai [53]. Similarly, Wu constructed the wetland ecological network of the Yellow River Delta based on the minimum resistance model. By comparing the ecological resistance values between different land-use types, she found that the natural wetland and water area were the best distribution areas of the ecological corridor, while the human activity transformation area was rarely distributed [54]. All of these results prove that the coastal wetland regional ecological corridor is the most economical path for the spatial movement of biological species.
The coastal wetland in the XSB basin plays an important role in the ecological security pattern, and from the perspective of coastal ecological service functions, the coastal wetland is the ecosystem with the largest biomass and rich biodiversity, which is conducive to biological migration and diffusion in the whole habitat. According to the survey data from 2006 to 2009, 158 species of intertidal organisms have been identified in the XSB, mostly mollusks and crustaceans. The abundant intertidal organisms are secondary consumers in the ecosystem, which shows not only the abundance of phytoplankton as primary producers and floating animals as primary consumers in coastal wetlands but also the existence of other consumers at the top of the food chain [55]. The organisms in the coastal wetland area not only can diffuse to the surrounding area through the coastal wetland but also provide a habitat and food source for other migratory organisms. Comparing 1981 with 1990, the biomass in the intertidal zone of the XSB has decreased significantly, which is because of the rapid increase in the population of coastal cities and towns. The rapid development of the port industry and the vigorous development of marine aquaculture, human factors, and natural factors such as Spartina invasion have caused damage to the coastal wetland ecology to a certain extent. However, there is evidence that the construction of artificial wetlands and the restored coastal wetlands have greatly improved the biodiversity of habitats. According to the statistics of many studies, the biodiversity of wetlands after restoration has increased by 40% [56]. According to the survey, nine wetland restoration projects have been carried out in the wetlands on both sides of an inner bay in the XSB basin. Before and after the restoration, the number of birds increased from 886 of 37 species to 10,206 of 43 species. Zhang investigated the ecological environment of the newly built artificial wetland in a coal mining subsidence area; carried out in situ sampling and positioning research on the plant diversity, benthic invertebrate diversity, and bird diversity of the newborn wetland; and concluded that there were 271 species of newborn wild vascular plants, 138 species of birds, and 68 species of benthic invertebrates, demonstrating a qualitative improvement in biodiversity [57]. A good coastal wetland ecosystem plays a vital role in maintaining the biodiversity and ecological connectivity of the whole ecosystem, and the migration and diffusion of organisms in the coastal wetland area can only rely on the ecological corridor in this area to a large extent. Therefore, strengthening the construction of an ecological corridor in the coastal wet area is of great significance to the improvement of the biodiversity and ecological connectivity of the whole XSB basin. In addition to providing rich aquatic products, coastal wetland vegetation, especially mangroves, plays an important role in preventing coastal erosion. Zahra Karimi studied the root soil of mangroves along the northern coastline of Qeshm Island, Iran. The results show that mangrove roots can improve soil stability and play an important role in preventing coastal erosion [58]. Coastal wetlands also play an important role in purifying water quality, especially in the absorption, transformation, and retention of nutrients such as nitrogen and phosphorus and heavy metals, which can effectively reduce their concentration in water [59]. The two inner ports in XSB basin have more reclamation and aquaculture, and the original vegetation communities have been destroyed, leading to serious coastal zone erosion, while the areas with better vegetation communities have almost no coastal erosion. Land-sourced domestic sewage, agricultural fertilizer, industrial emissions, and other land-sourced pollutants in the XSB basin are usually combined with sediments. They are degraded, stored, and transformed through the absorption of wetland vegetation and the transformation of chemical and biological processes. The slow water flow speed in the wetland is conducive to the sinking of sediments, and also to the storage and transformation of pollutants combined with sediments. Many aquatic plants in coastal wetlands can enrich heavy metals, thus participating in the process of metal detoxification, which can effectively alleviate the outstanding contradiction between economic and social development and environmental protection. The coastal wetland ecosystem has a strong ecological service function, which plays an important role in maintaining the stability of the ecosystem in the XSB basin.
The wetland habitat has important ecological significance for other migratory organisms; various wetlands distributed along the migration route are particularly important energy supply sources for waterfowl migration, providing food and habitat for different populations [60]. There are more than 870 species of waterfowl worldwide that rely on wetlands for survival, most being seasonal migratory birds [61]. A series of available stop point wetlands distributed along the migration route are the basis for ensuring the success of waterfowl migration. They play the role of relay stations and food supply places in the whole migration network, but they are often the bottleneck in the migration process of many waterfowl populations [62]. The change in the wetland habitat, especially the habitat change of important stopover wetlands of international significance, has a strong impact on the number of waterfowl populations during migration [63]. The coastal wetland in the XSB basin is an important station on the East Asia Australia waterfowl migration line. According to a survey, in the autumn of 2020, there were 85 species in 59 genera, 36 families, and 12 orders of birds in a certain inner port of the XSB. In recent decades, with the intensification of climate change and human activities, natural wetlands have been lost on a large scale, and the coastal wetlands located on the migration route from East Asia to Australia have, in particular, undergone tremendous changes [64]. By the end of the 20th century, more than 50% of the wetlands in the world had disappeared, while China had lost about 33% of the wetlands from 1978 to 2008, and the rest had also been degraded to varying degrees under the interference of human activities [65]. The habitat loss or habitat quality decline of many waterfowl located on the migration route has posed a serious threat to the migratory population [66]. If the existing wetland ecosystem is further damaged, the waterfowl population will lose the suitable wetland as a resting place or wintering place during the migration process. As a result, the population will be unable to complete the migration cycle and will eventually be extinct [67]. A good coastal wetland habitat is a relay station for bird migration. For the XSB basin, the coastal wetland provides an ideal place for birds foraging, migration, and species exchange between ecological patches and plays a crucial role in the maintenance of bird biodiversity.

4.3. Coastal Wetland Degradation and Restoration Strategy

Coastal wetland degradation is a common problem faced by all countries in the world and mainly stems from natural disasters and human factors; natural disasters include typhoons, tsunamis, and biological invasions, and human factors include land reclamation, aquaculture, land-based pollution, aquaculture pollution, coastal vegetation felling, or destruction [68,69], which not only lead to the loss of coastal wetland ecosystem diversity but also seriously weaken the coastal wetland ecosystem function. The restoration of degraded coastal wetland ecosystems has therefore become a hot topic in international ecological research. The restoration objects of coastal wetlands have gradually diversified, covering all types of coastal wetland habitats, such as salt marshes, mangroves, coral reefs, and seagrass beds. The restoration system has changed from a small scale, such as a single habitat, community, or species, to a large scale, such as a region or country. A large number of regional or large-scale coastal restoration projects dominated by developed countries such as Europe have emerged [70,71]. Ecological restoration of coastal wetlands in China has mainly focused on individual projects or local areas, and artificial restoration technology of wetland vegetation and coral.
The global coastal wetland area is about 1.42 million square kilometers, and China’s coastal wetland area is about 52,450 km2 [72,73]. The coastal wetland is a transitional zone between the terrestrial ecosystem and the marine ecosystem. It is composed of a continuous coastal area, intertidal zone, and water ecosystem, including the river network, estuary, salt marsh, and beach. As it is affected by the interaction of sea and land, it is a relatively fragile ecologically sensitive area. It is considered one of the most productive and biodiversity-rich ecosystems. It provides protection against storms and coastal erosion and provides important ecosystem functional services such as aquatic products, water purification, and biodiversity maintenance [74]. The XSB basin has 133.21 km2 of tidal flats, accounting for 8.5% of the basin area. The coastal wetland provides people with material production, environmental regulation, and rich biodiversity and is an extremely important ecosystem in the XSB basin. According to the importance of ecological services and ecological sensitivity, ecological services of coastal wetlands in the study area are relatively important and moderately important, and the ecological sensitivity is slightly sensitive, which is related to the degradation of coastal wetlands. Some scholars regard coastal wetlands as potential ecologically sensitive areas, which shows that coastal wetland ecosystems are vulnerable to damage and degradation. However, as a potential ecologically sensitive area, it needs to be repaired to better serve its ecosystem service function [75]. According to remote-sensing interpretation and field investigation, the main problem of coastal wetlands in the XSB basin is the invasion of Spartina alterniflora. In the 10-year period from 2009 to 2019, Spartina alterniflora invaded in large quantities, increasing from 1058 hectares in 2009 to 2587 hectares in 2019, resulting in the decline of beach biodiversity and the reduction of bird habitat. In addition, many coastal wetlands in the study area have been reclaimed from the sea for aquaculture, which has led to the degradation of the coastal wetland ecosystem, the change of hydrodynamic conditions in the bay, the discharge of land-based pollution into the sea, and aquaculture pollution. According to the survey results, the coastal wetland restoration in the study area is a salt marsh wetland restoration type. There are many large-scale regional salt marsh ecological restoration projects in the world, such as in Delaware Bay [76], San Francisco Bay [77], and Chesapeake Bay [78] in the United States. Compared with international research, the research on salt marsh wetland ecological restoration in China is still in its infancy, and it mainly focuses on the restoration and reconstruction of the salt marsh wetland ecosystem, wetland pollution bioremediation technology, wetland invasive species (especially Spartina alterniflora) removal, and prevention and control technology. In view of the problems existing in the coastal wetlands in the study area, cutting and flooding can be used to treat a large area of Spartina alterniflora, and local dominant species such as Hibiscus hamabo and Bolboschoenoplectus mariqueter can be cultivated. In addition, salt marsh wetland organisms need to be introduced to complete the restoration and reconstruction of the salt marsh wetland ecosystem. According to the survey, after this method of treatment in Chongming Island, Shanghai, the removal rate of Spartina alterniflora can reach more than 95%, and the biodiversity can be greatly improved [79]. For aquaculture, the management department should restore the original ecosystem in an orderly manner according to relevant plans. In addition, an ecological restoration monitoring and effect evaluation system was established to evaluate the governance effect and follow-up monitoring of the coastal wetland environment.
According to the results of the ecological security pattern of the XSB basin, the coastal wetland ecosystem occupies a prominent position in the whole habitat and plays a link role in biological migration and species exchange. However, the coastal wetland ecosystem poses a great threat to the ecological security of the whole basin, owing to habitat degradation. Our suggestions are to carry out salt marsh wetland restoration for the coastal wetland ecosystem, strengthen the construction of green infrastructure in the ecological corridor area, establish an ecological buffer for the coastal wetland area in the XSB basin, and connect the ecological land and non-ecological land in the area to improve the ecological connectivity of the coastal wetland ecosystem in the whole basin and improve the environmental quality of nonecological land. This way, the coastal wetland ecosystem can be built into a unique inner harbor ecological connectivity belt in the XSB basin.

4.4. Deficiencies and Prospects

As the case in this study is an attempt of a new method, there are still some shortcomings: For example, in terms of specific operation methods, when assessing the habitat quality, only the range of the XSB basin is considered, and there will be deviation in the assessment of the threat to the patches at the edge of the study area. In subsequent studies, the habitats at a certain distance from the periphery of the study area can be taken into account. The time series of this study is short, but because there are many evaluation indicators, it will be a huge project to evaluate all indicators according to the time series. In addition, the universal applicability and rationality of this method need to be further verified by more field work and case studies in the future.

5. Conclusions

In this study, the ecological source area of the XSB basin was identified by the method of “importance–connectivity–sensitivity”, and the ecological corridor was identified by the minimum resistance model to finally build an ecological security pattern.
The results show that the primary ecological source area of the XSB basin is 444.91 km2, and the secondary ecological source area is 367.13 km2, accounting for 28.16% and 23.24% of the total study area, respectively. The natural reserves in XSB basin were all located in the identified primary ecological source areas, which indicates the feasibility and reliability of the “importance–connectivity–sensitivity” ecological source identification mechanism in this study. From the identification results of ecological corridors in the XSB basin, the ecological corridors connecting various ecological sources eventually converge in the coastal wetland area, accounting for about 40% of the total corridor length. The coastland wetland area occupies the most important position in biological migration and species exchange among ecological sources and is the link connecting other ecological sources.
However, according to the results of the construction of the ecological security pattern and the field survey, the ecological services and ecological sensitivity of the coastal wetlands in the XSB basin are reduced, and the habitat is degraded. This study proposes some restoration strategies: cutting and flooding can be used to treat a large area of Spartina alterniflora, and local dominant species such as Hibiscus hamabo and Bolboschoenoplectus mariqueter can be cultivated. In addition, salt marsh wetland organisms need to be introduced to complete the restoration and reconstruction of the salt marsh wetland ecosystem.

Author Contributions

Conceptualization, Q.Y.; methodology, Q.Y. and C.H.; software, Q.Y., S.Z., H.G. and Y.Y.; formal analysis, Q.Y., Y.X. and C.H.; data curation, Q.Y., H.G., S.Z., Y.X., Y.Y. and F.L.; writing—original draft preparation, Q.Y.; writing—review and editing, Q.Y. and C.H.; visualization, Q.Y. and H.G.; supervision, C.H. and K.L. All authors have read and agreed to the published version of the manuscript.

Funding

This research was funded by the Ningbo Key R&D Project (2022Z059), Natural Science Foundation of Ningbo (20221JCGY010488), and Public Welfare Science and Technology Project of Ningbo (2022S116).

Conflicts of Interest

The authors declare no conflict of interest.

Appendix A

Table A1. Software and modules used in each evaluation.
Comprehensive EvaluationSingle-Factor EvaluationSoftwareModule
Importance of ecological servicesWater conservationInVESTWater Yield
ILWIS open 3.8.1.0SEBS model
Habitat qualityInVESTHabitat Quality
Carbon fixation and oxygen releaseENVI 5.3NPP Inputs
Forest Scenic AreaGoogle Earth\
Ecological sensitivityNDVIENVI 5.3\
Landscape connectivity\Guidos Toolbox 2.8
ArcGIS 10.2
Conefor Sensinode 2.6
\
Conefor Inputs
\

References

  1. Zhang, L.; Luo, Z.H.; Mallon, D.; Li, C.W.; Jiang, Z.G. Biodiversity conservation status in China’s growing protected areas. Biol. Conserv. 2017, 210, 89–100. [Google Scholar] [CrossRef]
  2. He, C.Y.; Liu, Z.F.; Tian, J.; Ma, Q. Urban expansion dynamics and natural habitat loss in China: A multiscale landscape perspective. Glob. Chang. Biol. 2014, 20, 2886–2902. [Google Scholar] [CrossRef]
  3. Qiu, T.; Song, C.H.; Li, J.X. Impacts of urbanization on vegetation phenology over the past three decades in Shanghai, China. Remote Sens. 2017, 9, 970. [Google Scholar] [CrossRef] [Green Version]
  4. Li, C.; Li, J.X. Assessing urban sustainability using a multi-scale, theme-based indicator framework: A case study of the Yangtze River Delta Region, China. Sustainability 2017, 9, 2072. [Google Scholar] [CrossRef] [Green Version]
  5. Chen, Y.; Ha, K.; He, W.L.; W, Z.T.; Feng, F.; Men, M.X.; Ding, Q.L. Study on the change and optimization of landscape pattern in the basin of Northwest Hebei Mountains: A case study of Huailai county, Hebei province. J. Nat. Resour. 2016, 31, 556–569. [Google Scholar]
  6. Peng, J.; Zhao, H.J.; Liu, Y.X.; Wu, J.S. Research progress and prospect on regional ecological security pattern construction. Geogr. Res. 2017, 36, 407–419. [Google Scholar]
  7. Butlin, F.M.; Howard, E. Tomorrow: A Peaceful Path to Real Reform; The Economic Journal: London, UK, 1898. [Google Scholar]
  8. Yu, K.; Li, D.; Liu, H. The Way of “Anti Planning”; China Construction Industry Press: Beijing, China, 2005. [Google Scholar]
  9. Pei, D. Review green infrastructure planning methods. Urban Plan. 2012, 46, 84–90. [Google Scholar]
  10. Forman, R.T.T. Some general principles of landscape and regional ecology. Landsc. Ecol. 1995, 10, 133–142. [Google Scholar] [CrossRef]
  11. Yu, K.J. Landscape ecological security pattern of biological conservation. Acta Ecol. Sin. 1999, 19, 8–15. [Google Scholar]
  12. Yu, K.J.; Wang, S.S.; Li, D.H.; Li, C.B. The function of ecological security patterns as an urban growth framework in Beijing. Acta Ecol. Sin. 2009, 29, 1189–1204. [Google Scholar]
  13. Liu, H.; Wang, H.; Liu, K. A Review of ecological security assessment and relevant methods in China. Environ. Prot. 2005, 8, 34–37. [Google Scholar]
  14. Wu, J.S.; Li, P.; Zhang, Y.Q. Sustainable development capacity evaluation based on urban ecological footprint: A case study of Shenzhen. Resour. Sci. 2008, 30, 850–856. [Google Scholar]
  15. Wu, J.S.; Yue, X.X.; Qin, W. The establishment of ecological security patterns based on the redistribution of ecosystem service value: A case study in the Liangjiang New Area, Chongqing. Geogr. Res. 2017, 36, 429–440. [Google Scholar]
  16. Peng, B.F.; Zheng, Y.; Liu, Y. Coupling Ecosystem Services and Regional Ecological Security Pattern. Sci. Geogr. Sin. 2018, 38, 361–367. [Google Scholar]
  17. Chen, X.; Peng, J.; Liu, Y.X.; Yang, Y.; Li, G.C. Constructing ecological security patterns in Yunfu city based on the framework of importance-sensitivity-connectivity. Geogr. Res. 2017, 36, 471–484. [Google Scholar]
  18. Knaapen, J.P.; Scheffer, M.; Harms, B. Estimating habitat isolation in landscape planning. Landsc. Urban Plan. 1992, 23, 1–16. [Google Scholar] [CrossRef]
  19. Kong, F.H.; Yin, H.W.; Nakagoshi, N.; Zong, Y.G. Urban green space network development for biodiversity conservation: Identification based on graph theory and gravity modeling. Landsc. Urban Plan. 2010, 95, 16–27. [Google Scholar] [CrossRef]
  20. Wang, Y.H.; Yang, K.C.; Bridgman, C.L.; Lin, L.K. Habitat suitability modeling to correlate gene flow with landscape connectivity. Landsc. Ecol. 2008, 23, 989–1000. [Google Scholar]
  21. Huck, M.; Jędrzejewski, W.; Borowik, T.; Jędrzejewska, B.; Nowak, S.; Mysłajek, R.W. Analyses of least cost paths for determining effects of habitat types on landscape permeability: Wolves in Poland. Acta Theriol. 2011, 56, 91–101. [Google Scholar] [CrossRef] [Green Version]
  22. Jing, Y.C.; Chen, L.D.; Sun, R.H. A theoretical research framework for ecological security pattern construction based on ecosystem services supply and demand. Acta Ecol. Sin. 2018, 38, 4121–4131. [Google Scholar]
  23. Tang, F.; Wang, L.; Zhang, P.T.; Fu, M.C. Construction of county-level ecological security pattern based on ecological protection red line and network in China. Trans. Chin. Soc. Agric. Eng. (Trans. CSAE) 2020, 36, 263–272. [Google Scholar]
  24. Gao, M.W.; Hu, Y.C.; Li, X.; Song, R. Construction of ecological security pattern based on the importance of ecosystem services and environmental sensitivity in karst mountainous areas: A case study in Hechi, Guangxi. Acta Ecol. Sin. 2021, 41, 2596–2608. [Google Scholar]
  25. Wang, Q.; Fu, M.D.; Wei, L.; Han, Y.; Shi, N.N.; Li, J.S.; Quan, Z.J. Urban ecological security pattern based on source-sink landscape theory and MCR model: A case study of Ningguo City, Anhui Province. Acta Sci. Circumstantial 2016, 36, 4546–4554. [Google Scholar]
  26. Ye, X.; Zou, C.X.; Liu, G.H.; Lin, N.F.; Xu, M.J. Main research contents and advances in the ecological security pattern. Acta Ecol. Sin. 2018, 38, 3382–3392. [Google Scholar]
  27. Barbier, E.B. Marine ecosystem services. Curr. Biol. 2017, 27, 507–510. [Google Scholar] [CrossRef] [Green Version]
  28. Ou, D.H.; Xia, J.G.; Zhang, L.; Zhao, Z. Research Progress on Regional Ecological Security Pattern Planning and Discussion of Planning Techniqueflow. Ecol. Environ. Sci. 2015, 24, 163–173. [Google Scholar]
  29. Sharp, R.; Tallis, H.T.; Ricketts, T.; Guerry, A.D.; Wood, S.A.; Chapin-Kramer, R.; Nelson, E.; Ennaanay, D.; Wolny, S.; Olwero, N.; et al. InVEST 3.2.0 User’s Guide; The natural capital project; Stanford University: Standford, CA, USA, 2015. [Google Scholar]
  30. Liang, F.C.; Liu, H.R.; Liu, S.R.; Qi, X.X.; Liu, M. Spatial Restructuring Countermeasures of Landscape Ecological Security Network in Southern Fujian: A Case Study of Jimei District in Xiamen. Econ. Geogr. 2018, 38, 231–239. [Google Scholar]
  31. Ye, L.P. Study on Spatial Heterogeneity of Water Supply Service Function in Qi River Basin. Master Dissertation, Henan University, Zhengzhou, China, June 2018. [Google Scholar]
  32. Yang, Y.; Wang, L.X.; Ren, W.H.; Zheng, D.M.; Zhi, C.G. Headwater Conservation Evaluation of Forest Resources in Xichuan County Based on InVEST Model. For. Resour. Manag. 2017, 0, 51–55. [Google Scholar]
  33. Deng, Y.; Jiang, W.G.; Wang, W.J.; Lv, J.X.; Chen, K. Urban expansion led to the degradation of habitat quality in the Beijing-Tianjin-Hebei Area. Acta Ecol. Sin. 2018, 38, 4516–4525. [Google Scholar]
  34. Huang, M.; Yue, W.Z.; Feng, S.R.; Zhang, J.H. Spatial-temporal evolution of habitat quality and analysis of landscape patterns in Dabie Mountain area of west Anhui province based on InVEST model. Acta Ecol. Sin. 2020, 40, 2895–2906. [Google Scholar]
  35. Sun, R. Evaluation of Conservation Benefits in Nature Reserves Based on the InVEST and Max Ent Models. Master Dissertation, Jiangxi Normal University, Nanchang, China, 2020. [Google Scholar]
  36. Wang, L.Z. Research on Soil Conservation and Habitat Quality Change in Poyang Lake Basin Based on InVEST Model. Master Dissertation, Nanchang University, Nanchang, China, 2021. [Google Scholar]
  37. Lin, J.J.; Pan, W.B. Study on watershed eco-sensitivity assessing and regional panning based on GIS. Saf. Environ. Eng. 2005, 2, 23–26, 34. [Google Scholar]
  38. Wang, X.Y.; Chen, T.Q.; Feng, Z.; Wu, K.N.; Lin, Q. Construction of ecological security pattern based on boundary analysis: A case study on Jiangsu Province. Acta Ecol. Sin. 2020, 40, 3375–3384. [Google Scholar]
  39. Saura, S.; Josep, T. Conefor Sensinode 2.2: A software package for quantifying the importance of habitat patches for landscape connectivity. Environ. Model. Softw. 2009, 24, 135–139. [Google Scholar] [CrossRef]
  40. Yang, T.R.; Kuang, W.H.; Liu, W.D.; Liu, A.L.; Pan, T. Optimizing the layout of eco-spatial structure in Guanzhong urban agglomeration based on the ecological security pattern. Geogr. Res. 2017, 36, 441–452. [Google Scholar]
  41. Wang, H.; Ma, X.; Du, Y. Constructing ecological security patterns based on ecological service importance and ecological sensitivity in Guangdong Province. Acta Ecol. Sin. 2021, 41, 1705–1715. [Google Scholar]
  42. Nidumolu, U.B.; Keulen, H.V.; Lubbers, M.; Mapfumo, A. Combining interactive multiple goal linear programming with an inter-stakeholder communication matrix to generate land use options. Environ. Model. Softw. 2007, 22, 73–83. [Google Scholar] [CrossRef] [Green Version]
  43. Su, Y.X.; Chen, X.Z.; Liao, J.S.; Zhang, H.O.; Wang, C.J.; Ye, Y.Y.; Wang, Y. Modeling the optimal ecological security pattern for guiding the urban construction land expansions. Urban For. Urban Green. 2016, 19, 35–46. [Google Scholar] [CrossRef]
  44. Teng, M.J.; Wu, C.G.; Zhou, Z.X.; Lord, E.; Zheng, Z.M. Multipurpose greenway planning for changing cities: A framework integrating priorities and a least-cost path model. Landsc. Urban Plan. 2011, 103, 1–14. [Google Scholar] [CrossRef]
  45. Sun, X.B.; Liu, H.Y. Optimization of wetland landscape patterns based on ecological function evaluation: A case study on the coastal wetlands of Yangcheng, Jiangsu province. Acta Ecol. Sin. 2010, 5, 1157–1166. [Google Scholar]
  46. Peng, J.; Pan, Y.J.; Liu, Y.X.; Zhao, H.J.; Wang, Y.L. Linking ecological degradation risk to identify ecological security patterns in a rapidly urbanizing landscape. Habitat Int. 2018, 71, 110–124. [Google Scholar] [CrossRef]
  47. Yang, S.S.; Zou, C.X.; Shen, W.S.; Shen, R.P.; Xu, D.L. Construction of ecological security patterns based on ecological red line: A case study of Jiangxi Province. Chin. J. Ecol. 2016, 35, 250–258. [Google Scholar]
  48. Wu, M.Q.; Hu, M.M.; Wang, T.; Fan, C.; Xia, B.C. Recognition of urban ecological source area based on ecological security pattern and multi-scale landscape connectivity. Acta Ecol. Sin. 2019, 39, 4720–4731. [Google Scholar]
  49. Pan, Y.; Gong, J.; Yang, J.X.; Yang, T.; Wang, Y. Construction of Ecological Security Pattern Based on Ecological Importance and Connectivity of MSPA-core Area: A Case Study of Guijiang River Basin. China Land Sci. 2022, 36, 86–95. [Google Scholar]
  50. Wu, J.; Zhang, L.; Peng, J.; Feng, Z.; Liu, H.; He, S. The integrated recognition of the source area of the urban ecological security pattern in Shenzhen. Acta Ecol. Sin. 2013, 33, 4125–4133. [Google Scholar]
  51. Peng, J.; Yang, Y.; Liu, Y.X.; Hu, Y.N.; Du, Y.Y.; Meersmans, J.; Qiu, S.J. Linking ecosystem services and circuit theory to identify ecological security patterns. Sci. Total Environ. 2018, 644, 781–790. [Google Scholar] [CrossRef] [Green Version]
  52. Curcic, N.B.; Djurdjic, S. The actual relevance of ecological corridors in nature conservation. J. Geogr. Inst. Jovan Cvijic SASA 2013, 63, 21–34. [Google Scholar] [CrossRef] [Green Version]
  53. Zhan, L.S.; Chen, K.X.; Li, Q.Q.; Zhang, Y.N. Study on ecological protection and restoration in territorial spatial planning—A case study of Weihai City, Shandong Province. Intell. City 2021, 11, 107–112. [Google Scholar]
  54. Wu, J.J. Construction of Ecological Network for Natural Wetlands in the Yellow River Delta. Master Dissertation, University of Chinese Academy of Sciences (Yantai Institute of Coastal Zone Research), Yantai, China, 2018. [Google Scholar]
  55. You, Z.; Jiao, H. Study on Ecological Environment Protection and Restoration Technology of Xiangshan Bay; China Ocean Press: Beijing, China, 2011. [Google Scholar]
  56. Benayas, J.M.; Newton, A.C.; Diaz, A.; Bullock, J.M. Enhancement of biodiversity and ecosystem services by ecological restoration: A meta-analysis. Science 2009, 325, 1121–1124. [Google Scholar] [CrossRef]
  57. Zhang, G.X. Biodiversity and Temporospatial Distribution Characteristics of Newly Formed Wetlands in Coal Mining Subsidence Area. Master Dissertation, Chongqing University, Chongqing, China, 2020. [Google Scholar]
  58. Karimi, Z.; Abdi, E.; Deljouei, A.; Cislaghi, A.; Shirvany, A.; Schwarz, M.; Hales, T.C. Vegetation-induced soil stabilization in coastal area: An example from a natural mangrove forest. Catena 2022, 216, 106410. [Google Scholar] [CrossRef]
  59. Ding, D.J.; Li, M.; Liao, B.W.; Dan, X.Q. Evaluation of Economic Value of Coastal Natural Wetland EcosystemServices of Hainan Province. Ecol. Environ. Sci. 2015, 24, 1472–1477. [Google Scholar]
  60. Junk, W.J. The comparative biodiversity of seven globally important wetlands. Aquat. Sci. 2006, 68, 239. [Google Scholar] [CrossRef]
  61. Nisbet, I.C.T. Waterbird Population Estimates—Fourth Edition. Waterbirds 2008, 31, 152–153. [Google Scholar] [CrossRef]
  62. Bamford, M.; Watkins, D.; Bancroft, W.; Tischler, G.; Wahl, J. Migratory Shorebirds of the East Asian-Australasian Flyway: Population Estimates and Internationally Important Sites; Wetlands International, Oceania: Canberra, Australia, 2008. [Google Scholar]
  63. Hansen, B.D.; Menkhorst, P.; Moloney, P.; Loyn, R.H. Long-term declines in multiple waterbird species in a tidal embayment, south-east Australia. Austral Ecol. 2015, 40, 515–527. [Google Scholar] [CrossRef]
  64. Mackinnon, J.; Verkuil, Y.I.; Murray, N.J. IUCN Situation Analysis on East and Southeast Asian Intertidal Habitats, with Particular Reference to the Yellow Sea (Including the Bohai Sea); IUCN: Gland, Switzerland, 2012. [Google Scholar]
  65. Niu, Z.G.; Zhang, H.Y.; Wang, X.W.; Yao, W.B.; Zhou, D.M.; Zhao, K.Y.; Zhao, H.; Li, N.N.; Huang, H.B.; Li, C.C. Mapping wetland changes in China between 1978 and 2008. Chin. Sci. Bull. 2012, 57, 2813–2823. [Google Scholar] [CrossRef] [Green Version]
  66. Somveille, M.; Manica, A.; Butchart, S.H.; Rodrigues, A.S. Mapping Global Diversity Patterns for Migratory Birds. PLoS ONE 2013, 8, e70907. [Google Scholar] [CrossRef]
  67. Amezaga, J.M.; Santamaría, L.; Green, A.J. Biotic wetland connectivity—Supporting a new approach for wetland policy. Acta Oecologica 2002, 23, 213–222. [Google Scholar] [CrossRef] [Green Version]
  68. Warren, R.S.; Fell, P.E.; Rozsa, R.; Brawley, A.H.; Orsted, A.C.; Olson, E.T.; Swamy, V.; Niering, W.A. Salt Marsh Restoration in Connecticut: 20 Years of Science and Management. Restor. Ecol. 2010, 10, 497–513. [Google Scholar] [CrossRef] [Green Version]
  69. Jiang, T.T.; Pan, J.F.; Pu, X.M.; Wang, B.; Pan, J.J. Current status of coastal wetlands in China: Degradation, restoration, and future management. Estuar. Coast. Shelf Sci. 2015, 164, 265–275. [Google Scholar] [CrossRef]
  70. Simenstad, C.; Reed, D.; Ford, M. When is restoration not? Incorporating landscape-scale processes to restore self-sustaining ecosystems in coastal wetland restoration. Ecol. Eng. 2006, 26, 27–39. [Google Scholar] [CrossRef]
  71. Weishar, L.L.; Teal, J.M.; Hinkle, R. Designing large-scale wetland restoration for Delaware Bay. Ecol. Eng. 2005, 25, 231–239. [Google Scholar] [CrossRef]
  72. Davidson, N.C.; Finlayson, C.M. Updating global coastal wetland areas presented in Davidson and Finlayson (2018). Mar. Freshw. Res. 2019, 70, 1195–1200. [Google Scholar] [CrossRef]
  73. Zhang, J.; Li, J.R.; Yang, L.; Li, X. Current situation, problems and management countermeasures of coastal wetlands in China. Environ. Sustain. Dev. 2019, 44, 127–129. [Google Scholar]
  74. Kullenberg, G.; Cicin-Sain, B.; Knecht, R. Integrated Coastal and Ocean Management: Concepts and Practices; Island Press: Washington, DC, USA, 1999. [Google Scholar]
  75. Ren, J.J. Coastal Potential Eco-Sensitive Areas of Ecological Conservation and Urban Design. Master Dissertation, Tianjin University, Tianjin, China, 2012. [Google Scholar]
  76. Hinkle, R.L.; Mitsch, W.J. Salt marsh vegetation recovery at salt hay farm wetland restoration sites on Delaware Bay. Ecol. Eng. 2005, 25, 240–251. [Google Scholar] [CrossRef]
  77. Williams, P.B.; Faber, P.M. Salt Marsh Restoration Experience in San Francisco Bay. J. Coast. Res. 2001, 27, 203–311. [Google Scholar]
  78. Willard, D.A.; Cronin, T.M. Paleoecology and ecosystem restoration: Case studies from Chesapeake Bay and the Florida Everglades. Front. Ecol. Environ. 2007, 5, 491–498. [Google Scholar] [CrossRef]
  79. Ma, Q.; Wu, W.; Tang, C.D.; Niu, D.L.; Wu, J.H.; Ma, Z.J. Effects of habitats restoration on the diversity of bird macrobenthos in the Chongming Dongtan wetland. J. Nanjing For. Univ. (Nat. Sci. Ed.) 2017, 41, 9–14. [Google Scholar]
Figure 1. Study area.
Land 11 02317 g001
Figure 2. Land-use types in the study area.
Land 11 02317 g002
Figure 3. Spatial distribution of ecological service-generating areas.
Land 11 02317 g003
Figure 4. Spatial pattern of the importance of ecological services.
Land 11 02317 g004
Figure 5. Evaluation results of ecological sensitivity indicators.
Land 11 02317 g005
Figure 6. Spatial pattern of ecological sensitivity.
Land 11 02317 g006
Figure 7. Landscape connectivity of the XSB basin.
Land 11 02317 g007
Figure 8. Patch area and landscape connectivity.
Land 11 02317 g008
Figure 9. Spatial pattern of ecological protection importance (a) and Spatial distribution of ecological sources (b).
Land 11 02317 g009
Figure 10. Spatial difference in ecological resistance.
Land 11 02317 g010
Figure 11. Ecological security pattern of the XSB basin.
Land 11 02317 g011
Figure 12. Ecological space optimization layout scheme of the XSB basin.
Land 11 02317 g012
Table 1. Biophysical parameters of each land-use type input into InVEST water production module.
Land UseLucodeKcRoot Depth (mm)LULC Veg
Cultivated land10.6521001
Woodland2170001
Grassland30.6526001
Water41100
Building land50.001100
Unused land60.001100
Table 2. Main threat sources affecting habitat quality.
Threat SourceMaximum Impact Distance (km)WeightRecession Way
Cultivated land0.50.5Linear
Rural residential land50.6Exponential
Urban residential land101Exponential
Transport land50.6Exponential
Industrial land80.7Exponential
Table 3. Threat source sensitivity assignment.
Land UseSuitability of HabitatCultivated LandRural Residential LandUrban Residential LandTransport LandIndustrial Land
Cultivated land0.50.30.70.50.30.6
Woodland10.30.60.70.50.7
Grassland0.70.550.650.70.60.6
Water0.80.50.60.80.80.8
Construction land000000
Other land0.10.10.20.20.20.2
Table 4. Ecological sensitivity index system.
Evaluation FactorSensitivity AssignmentWeight
13579
Land useBuilding landUnused landCultivated landWoodland, grasslandWetland, water0.32
NDVI0–0.250.25–0.50.5–0.650.65–0.8>0.80.28
DEM (m)≤6060–150150–250250–400>4000.2
Slope (°)≤55–1515–2525–35>350.2
Table 5. Index system of resistance surface construction.
Resistance FactorClassificationResistance ValueWeight
Land useWoodland10.5
Wetland, grassland
Water
10
30
Cultivated land50
Other land70
Building land100
Slope≤5100.25
5–1530
15–2550
25–3570
>35100
DEM≤48100.25
48–12120
121–20540
205–30260
302–42180
>421100
Publisher’s Note: MDPI stays neutral with regard to jurisdictional claims in published maps and institutional affiliations.

