4.1. Findings
This study established an index system for the measurement of tourism eco-efficiency. The values of tourism eco-efficiency of 26 cities in the Yangtze River Delta from 2009 to 2019 were measured using the undesirable output super-SBM model. In addition, the spatial correlation matrix of tourism eco-efficiency was constructed using the modified gravity model. The spatial correlation of tourism eco-efficiency and its influencing factors were analyzed using the social network analysis.
Firstly, our study differs from previous studies that simply measured the tourism eco-efficiency of a tourism destination and analyzed their spatiotemporal differences [
16]. This study argues that the tourism eco-efficiencies of different regions have spatial correlations and are not independent of each other. Based on the analysis of the spatial differences of the tourism eco-efficiencies of the cities in the Yangtze River Delta, this study combined the social network and the geographic information system analyses to construct a spatial correlation network of tourism eco-efficiency, which facilitates the extension of the original “point measurement” of tourism eco-efficiency to the level of “surface evaluation”, and also allows for a comprehensive and in-depth exploration of its internal correlations to be made, thus enabling more insightful conclusions to be drawn. Strategically, this combined social network analysis and geographic information system approach can facilitate research on the formation, evaluation, and evolution of the spatially linked networks of tourism eco-efficiency.
Secondly, the driving factors for the formation of the spatial association network of tourism eco-efficiency are analyzed to expand the scope of research. At present, scholars mainly focus on the influencing factors of the spatiotemporal evolution of tourism eco-efficiency [
8,
51], and much less research has been conducted on the driving factors of the formation of the spatial association network of tourism eco-efficiency. Therefore, the QAP analysis was applied to measure the influence of various driving factors on the nature, direction, and intensity of the spatial linkages of tourism eco-efficiency. The results show that the EDL, the DBC, and the IDL are key factors that have significant effects on the spatial correlation network of tourism eco-efficiency in 26 cities in the Yangtze River Delta. In addition, the nature, direction, and degree of influence of various driving factors vary.
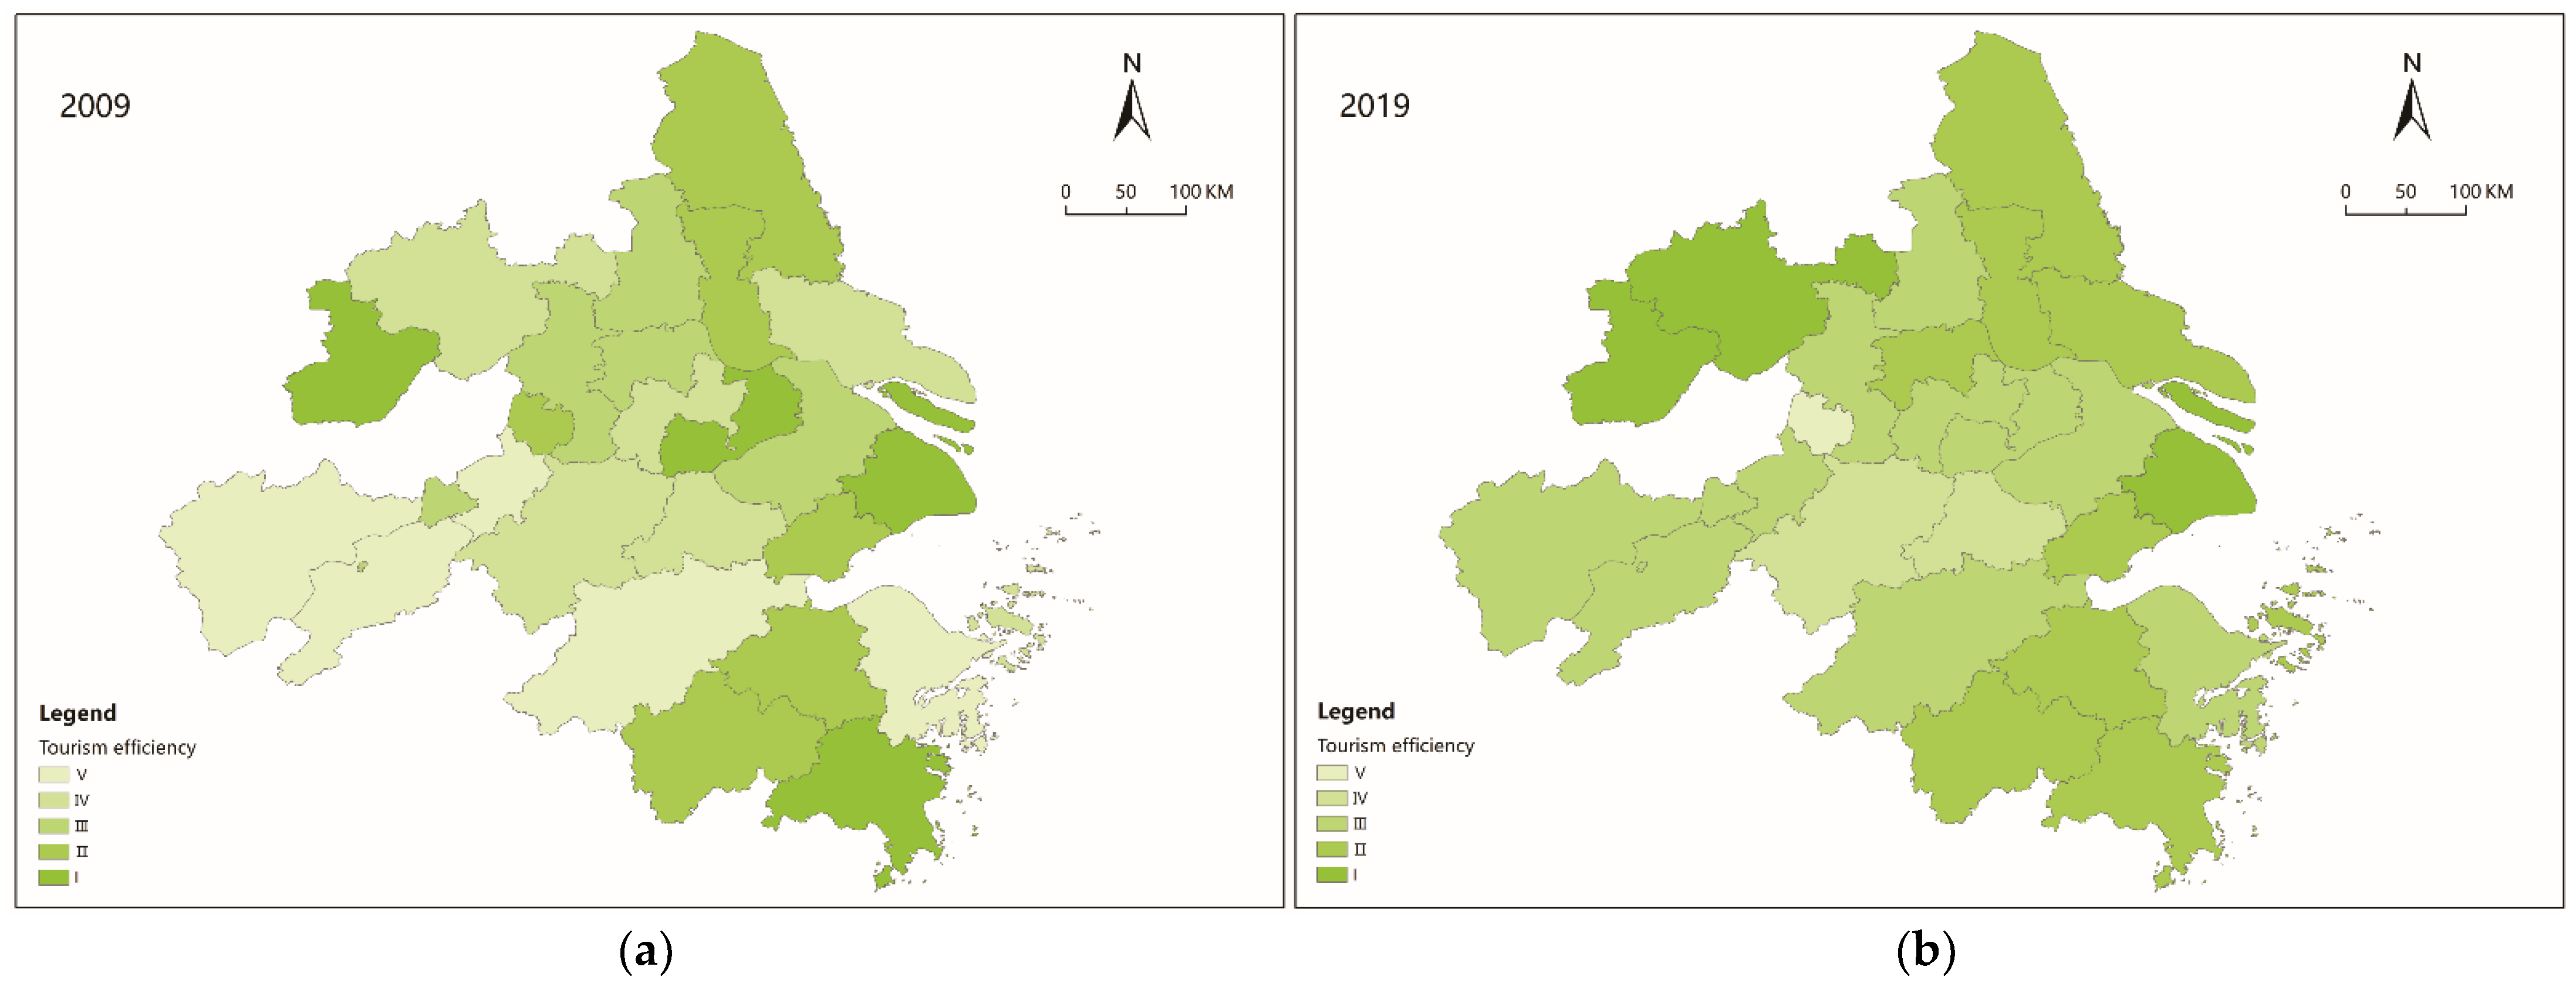
The empirical results verify that the tourism eco-efficiencies of 26 cities are spatially correlated with spatial differentiation patterns and dynamic development trends. On the one hand, tourism eco-efficiency shows an overall growth trend, indicating that with the formulation and implementation of tourism energy conservation and reduction projects in various cities, the construction of the ecological civilization has been continuously promoted. Therefore, the impact of the tourism economic activities on the ecological environment is reduced thereby promoting the maximization of social and economic benefits. On the other hand, the spatial distribution of tourism eco-efficiency in the Yangtze River Delta is not uniform. The tourism eco-efficiencies of most of the cities are at a medium-to-high level, and some cities show a fluctuating change trend. Ten cities show an increasing trend, and three cities show a decreasing trend.
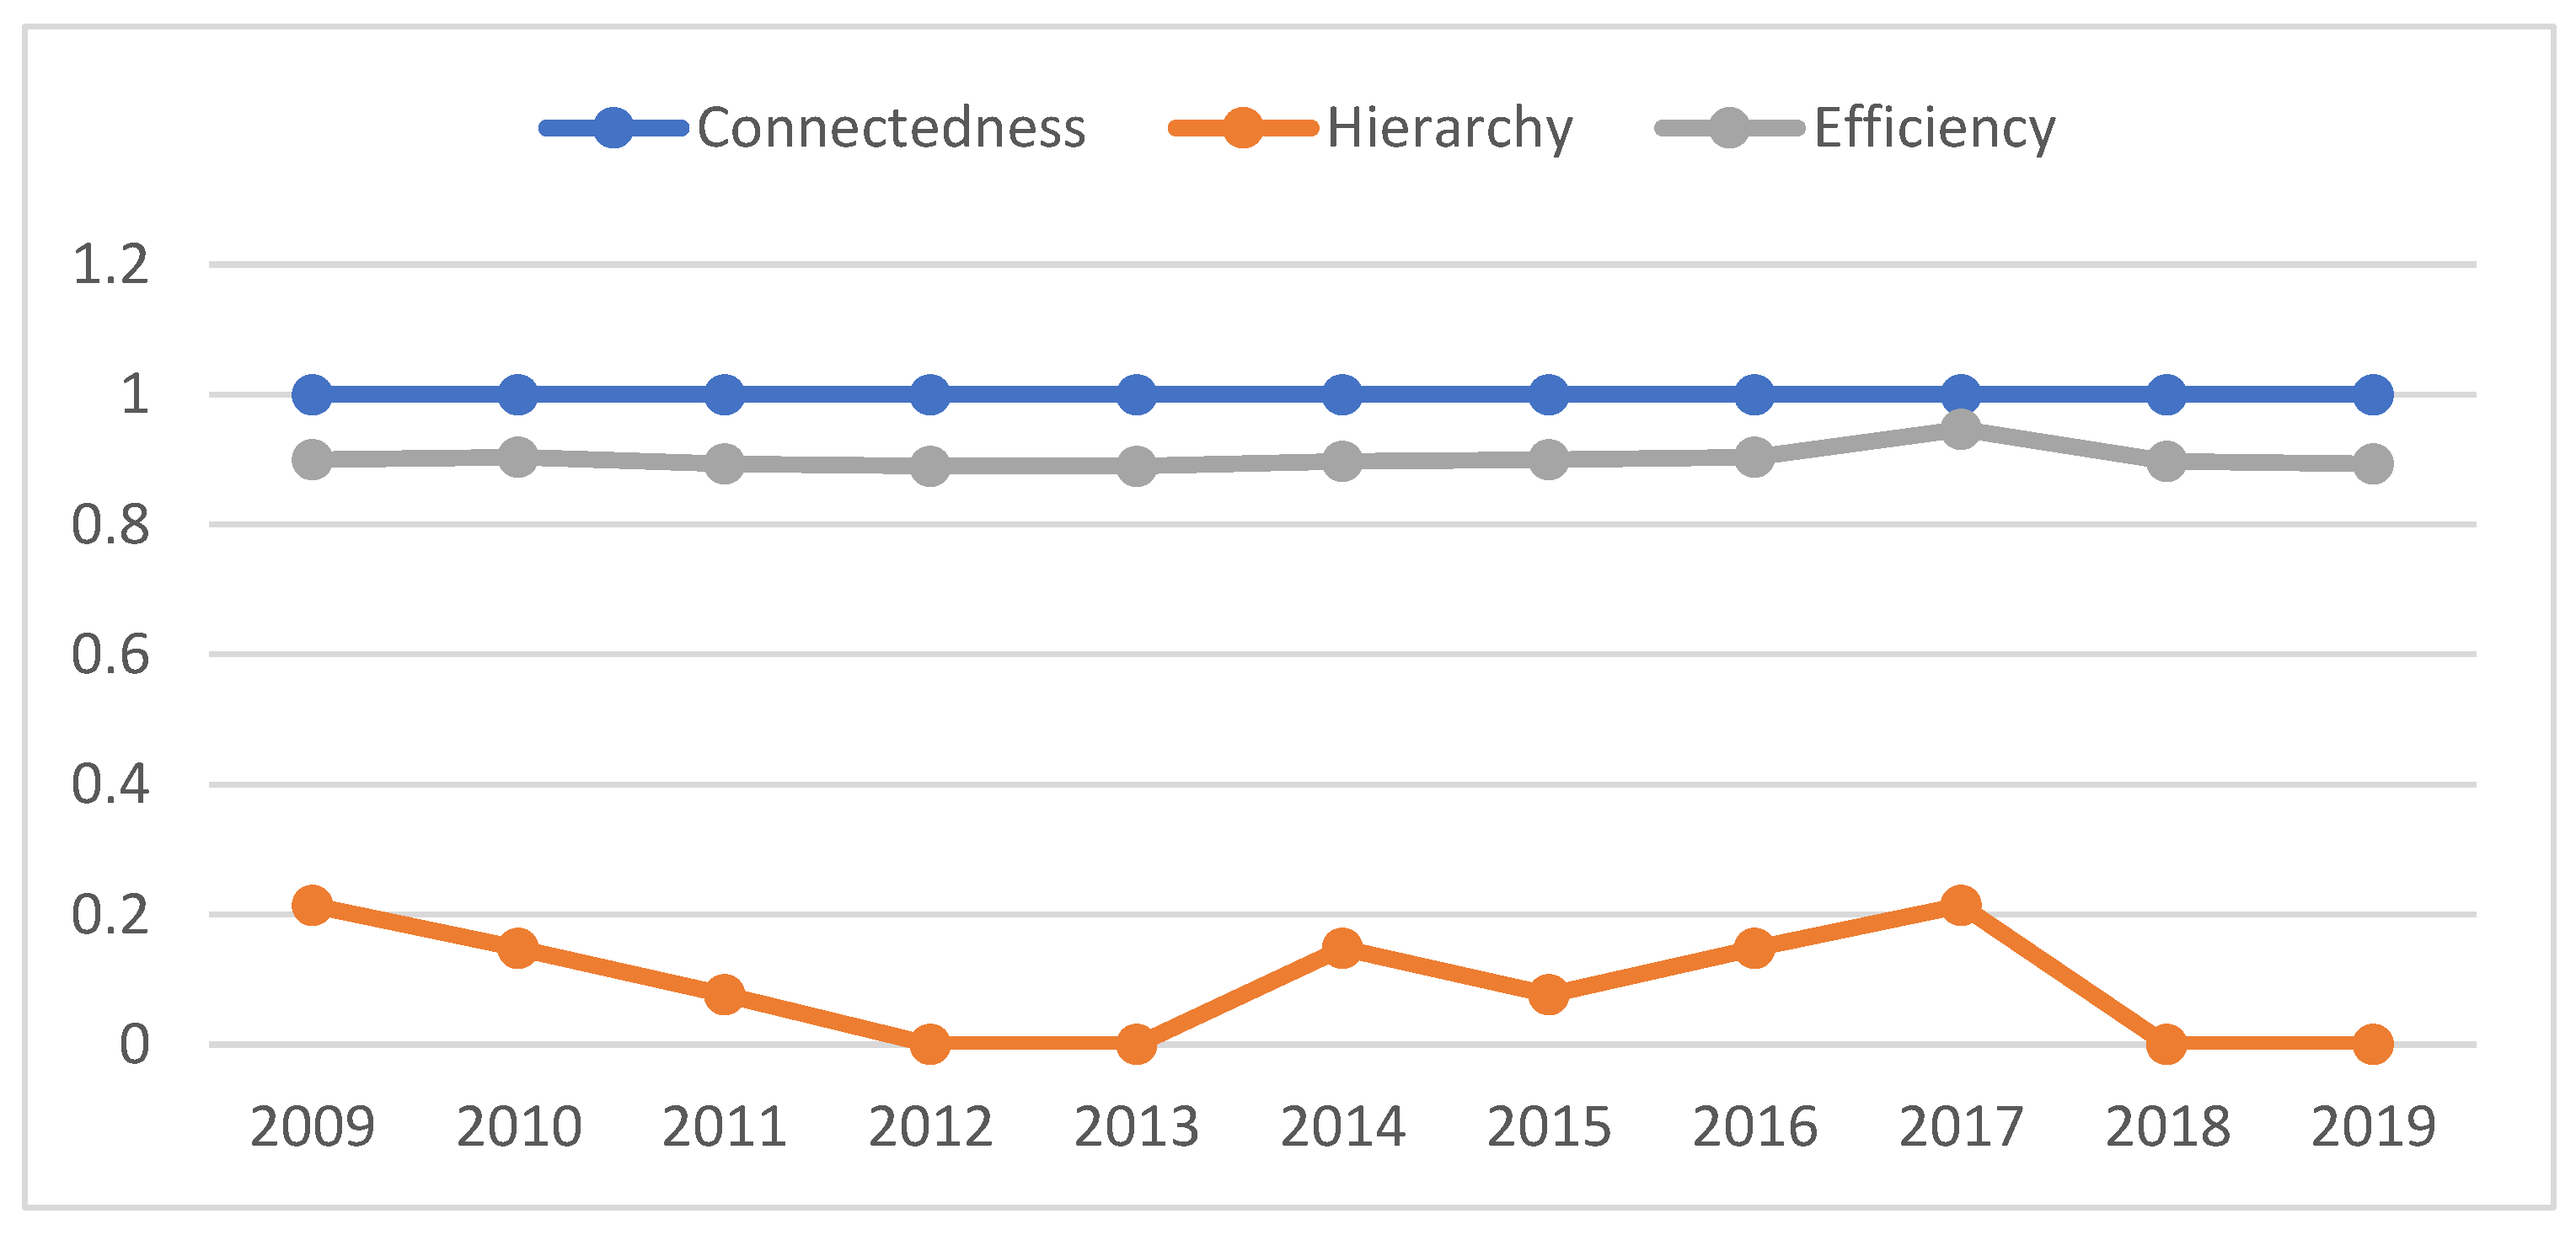
This study also analyzed the degrees of correlation, the network levels, and the network efficiency values of the spatial correlation networks of tourism eco-efficiency in 2009 and 2019 to effectively judge their scale and evolution in terms of achieving tourism eco-efficiency [
38,
39]. By comparing the correlation degrees of the spatial correlation network of tourism eco-efficiency in 2009 and 2019, this study finds that all of the cities are interrelated, and there is no “island” phenomenon. The structure of the spatial correlation network of tourism eco-efficiency shows good connectivity, accessibility, and robustness. The network rank is in the lower middle level, and it shows a decreasing trend, indicating that the differences between the cities are shrinking and more core nodes are emerging. Moreover, the network efficiency is at a high level, indicating that there are more correlations and only some redundant relationships in this network.
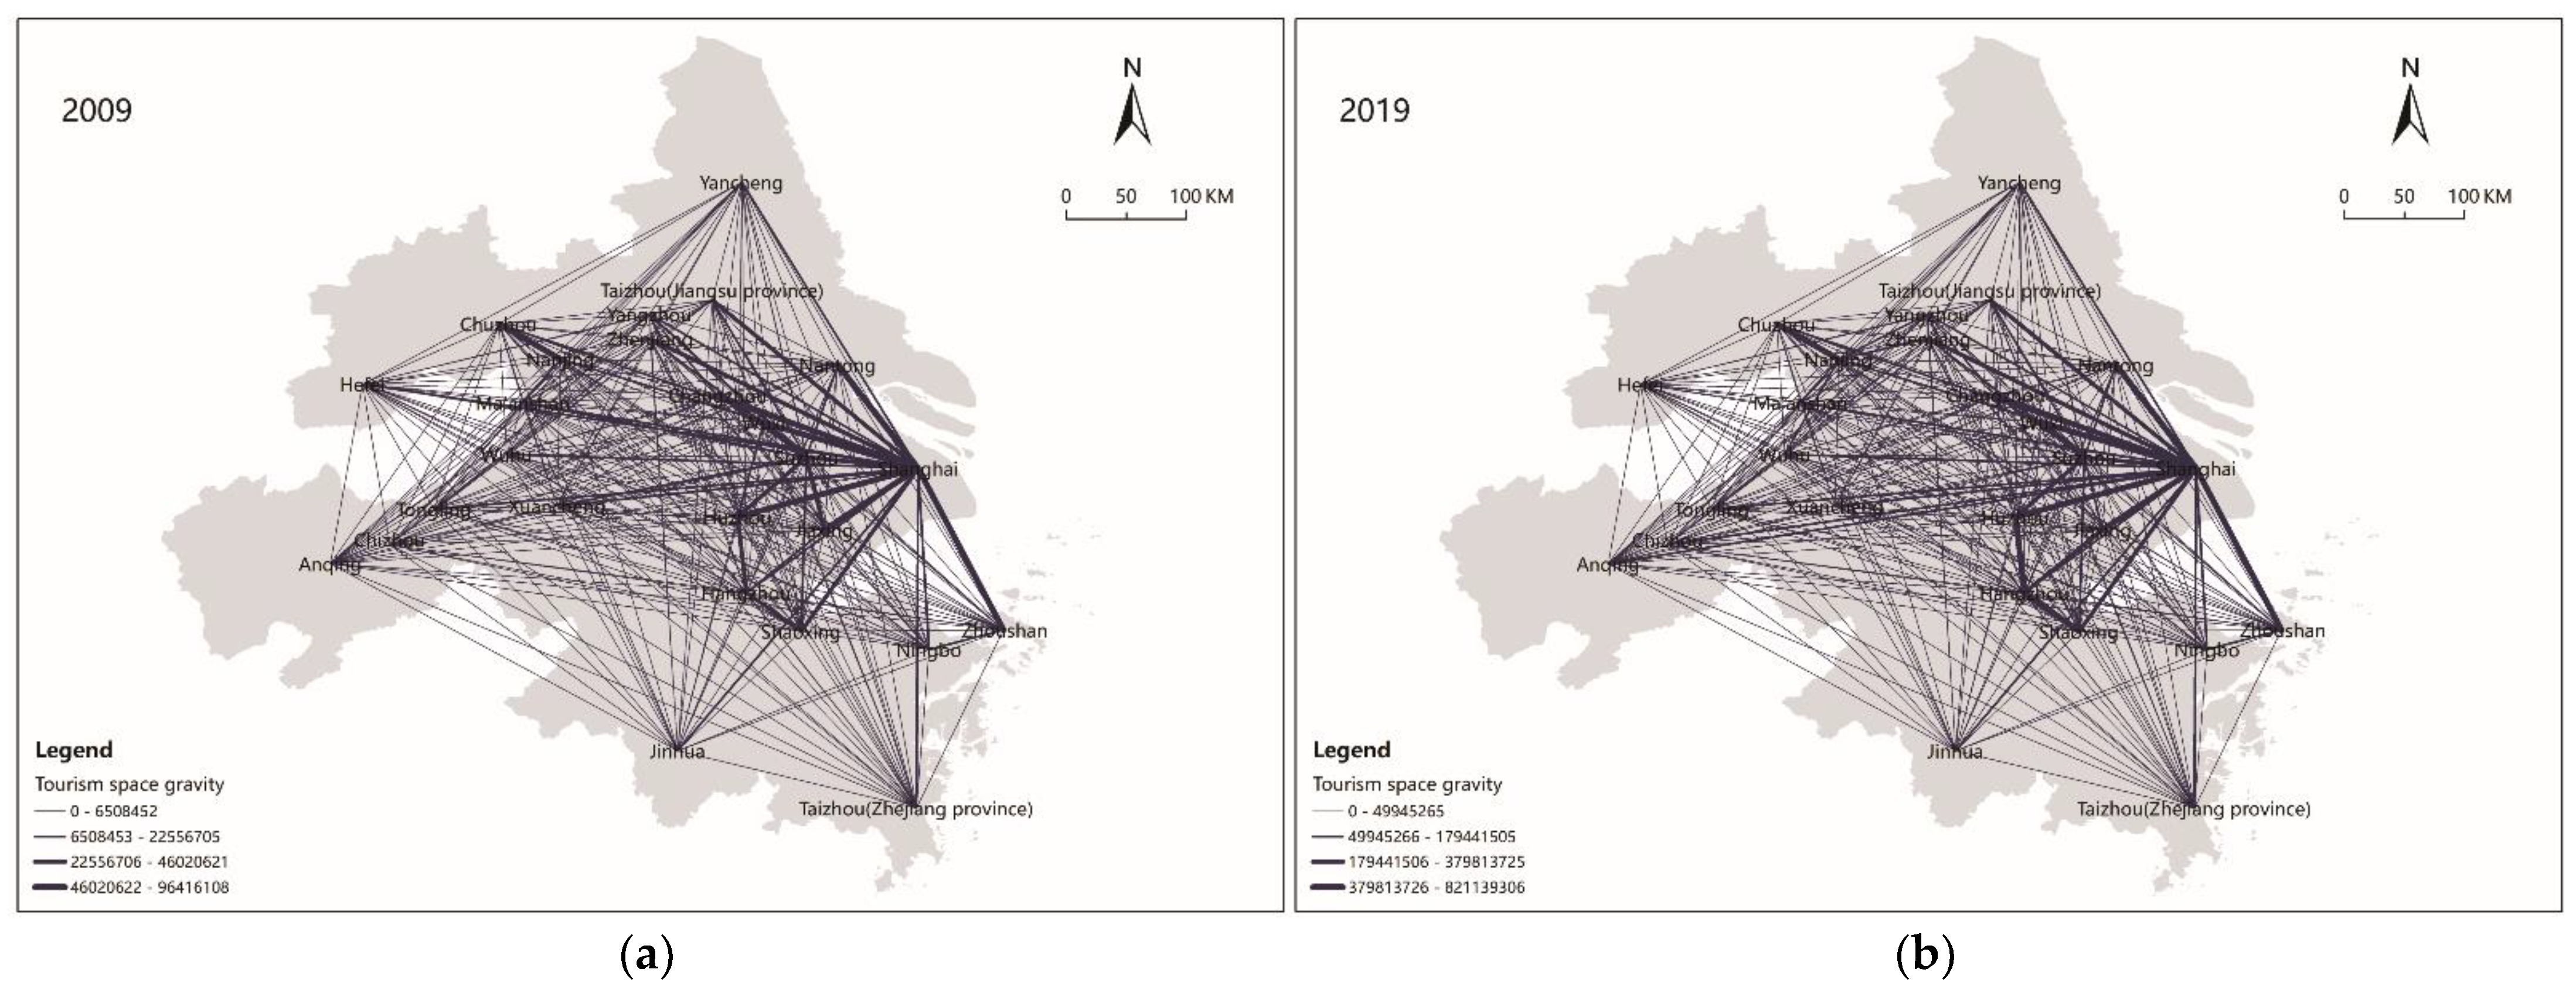
This study further analyzed the structure of the nodes in the spatial correlation network of tourism eco-efficiency in 2009 and 2019. The degrees of centrality index of the nodes in the tourism eco-efficiency association network were measured to effectively judge their roles, spatial differences, and evolution [
38,
39]. Shanghai, Suzhou, Nanjing, and Hangzhou had above average degrees of centrality, indicating that these cities have more connections, and they are a priority in the spatial correlation network of tourism eco-efficiency. The point-out degrees of 26 cities were >0, indicating that the tourism eco-efficiency of each city has some spatial radiation. Shanghai, Suzhou, Nanjing, and Hangzhou had higher than average point-out degrees. Yancheng, Taizhou (Zhejiang), Ma’anshan, Anqing, and Chizhou had lower point-out degrees. In terms of the point-in degree, Shanghai had the highest number of receiving relations, up to twenty-four, while Yancheng, Taizhou (Jiangsu) and Anqing had the lowest number of receiving relations of only one. In addition, the tourism eco-efficiency of each city in the spatial association network can produce connections with other cities relatively quickly. Shanghai, Nanjing, Suzhou, and Hangzhou had higher than average centrality values, indicating that they play the role of “core actors” in the spatial correlation network of tourism eco-efficiency, leading to the development of the whole network. The tourism eco-efficiencies of 22 cities, such as Changzhou, Ningbo, and Wuhu, were lower than the average level, indicating that their eco-efficiency of tourism is relatively low, leading to the restrictions of other cities and passive positions in the network. Shanghai, Suzhou, and Nanjing play a significant role as “bridges” and “intermediaries”, indicating that they play a key role in the spatial association network of tourism eco-efficiency by connecting well with other cities in the transfer of tourism production factors, and they have a strong control in the network.
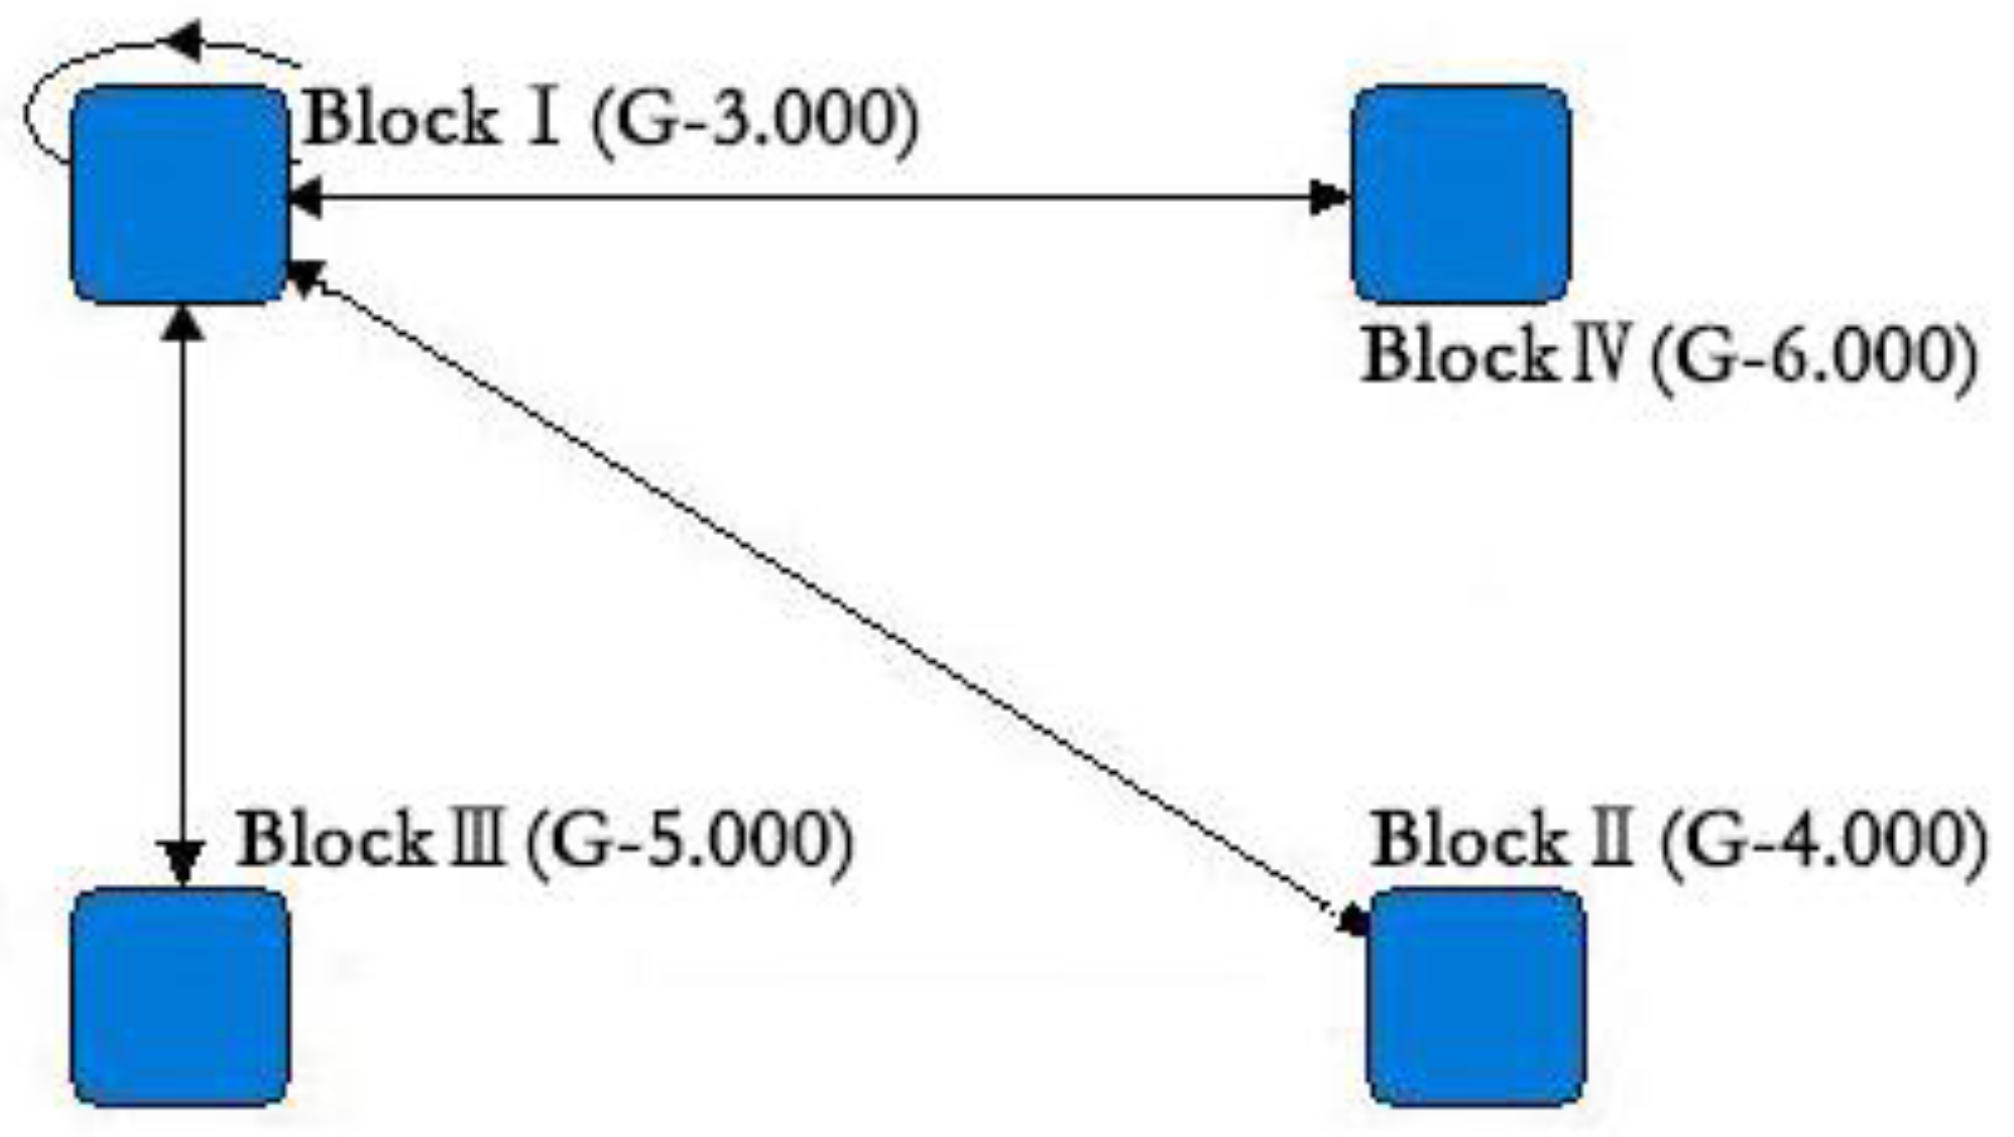
The spatial correlation of tourism eco-efficiency of 26 cities in 2019 was further analyzed using the block model. Block I is the “core actor” of the spatial correlation network of tourism eco-efficiency with the maximum spillover relationships, and it presents a “two-point” distribution in space. Block III has the second highest number of spillover relationships, and it is centered around the spatially central actor, and it mostly spills over to block I. Blocks II and IV have the same number of spillover relationships and are located in the outermost layer of the entire network. The mutual spillover relationships among blocks II, III, and IV are fewer, and therefore they are “marginal actors” in the spatial correlation network of tourism eco-efficiency.
The tourism eco-efficiency levels of Shanghai, Hangzhou, and Suzhou are relatively high because of their developed tourism economy and geographical advantages. It is easy for these cities to attract social, economic, and environmental resources from other cities. However, the cities in the other three blocks have a relatively backward economic foundation and a poor geographical location, and their tourism eco-efficiency development level is also relatively low with a high dependence on block I through the spillover effect.
All of the relationships in the spatial correlation network of tourism eco-efficiency originate from block I. In other words, Shanghai, Suzhou, and Hangzhou play driving roles in improving the tourism eco-efficiency of the other cities significantly, thereby narrowing the gap in the Yangtze River Delta region and fully alleviating the Matthew effect.
The formation and development of the spatial correlation network of tourism eco-efficiency are influenced by many factors. The results of the QAP correlation analysis show that the EDL and the IDL and the DBC and the TIL are positively and negatively correlated, respectively, with the development of the spatial correlation network of tourism eco-efficiency. The QAP regression analysis shows that the EDL, the DBC, and the IDL play significant roles in the spatial correlation network of tourism eco-efficiency. Therefore, the improvement of tourism eco-efficiency can be achieved by improving the EDL and the IDL. Meanwhile, the closer the cities are to the high eco-efficiency cities, the more beneficial it is to improve their tourism eco-efficiencies. The TIS, the TIL, and the TRE had no significant relationship with the spatial correlation network of tourism eco-efficiency.
The methods and findings of this research can be useful in enhancing the tourism eco-efficiency in the Yangtze River Delta region of China, and they can be applied to multiple destinations. Further empirical studies by other scholars are required to verify the outcomes of this research.
4.2. Implications
Based on the established tourism eco-efficiency measurement index system, this study used the undesirable output Super-SBM model to measure the tourism eco-efficiency values of 26 cities in the Yangtze River Delta in 2009 and 2019. Then, the gravity model was used to calculate the spatial correlation of tourism eco-efficiency of 26 cities in the Yangtze River Delta, and the relationship matrix was built. Finally, the social network analysis was used to analyze the spatial correlation of tourism eco-efficiency and its influencing factors. This study is a bold attempt, which not only enriches the research content of tourism eco-efficiency, but it also promotes the sustainable development of regional tourism.
4.2.1. Theoretical Implications
Firstly, this study is in line with China’s development goal of achieving an ecological civilization construction, as well as its requirements for high-quality economic development. It is of great significance to enrich the theory of sustainable development and expand the application scope of the sustainable development theory.
Secondly, this study is a bold application of the theory of tourism eco-efficiency. By exploring the tourism eco-efficiency of different cities in the Yangtze River Delta, this study further compares the spatial and temporal differences, the spatial correlation, and the influencing factors. This is the logical starting point for exploring the green and sustainable development of the Yangtze River Delta urban agglomeration. This study is different from previous studies that simply measure the tourism eco-efficiency of a certain tourist destination and analyze its internal spatio-temporal differences. It believes that the tourism eco-efficiency of different regions is not independent of each other, but they have a certain spatial correlation. The overall network structure characteristics of the spatial correlation of tourism eco-efficiency were analyzed from the perspective of their “relationship”.
Thirdly, on the basis of analyzing the spatial differences of tourism eco-efficiency in different cities in the Yangtze River Delta, this study combined the analysis of the SNA and GIS data to build the spatial correlation network of tourism eco-efficiency in the Yangtze River Delta urban agglomeration. This is not only conducive to further promoting the original “point measurement” of tourism eco-efficiency to a “surface evaluation”, but also to comprehensively and deeply explore its internal correlation, so as to draw more insightful conclusions. Strategically, the combination of SNA and GIS can promote the research on the formation, evaluation, and evolution of the spatial correlation network of tourism eco-efficiency.
4.2.2. Management Implications
This study found that the overall level of tourism eco-efficiency in the Yangtze River Delta region is constantly improving, and the tourism eco-efficiencies of most of the cities in the region are also improving. Through the method of the social network analysis, the network characteristics between the cities in the region were further analyzed. This can not only help the government to better coordinate the relationship between the regional economic development and the ecological environment and formulate policies according to the local conditions, but also provide new ideas for the urban development of ecological tourism.
Based on the block model analysis, one core block and three marginal blocks were distinguished in this study. It is helpful for the local government to take into account the characteristics of the different sectors and adopt corresponding management strategies to narrow the gap of eco-efficiency of urban tourism in the region to alleviate the Matthew effect.
In addition, this study also explores the influencing factors of the spatial correlation network of tourism eco-efficiency, which can provide a reference for the government and tourism enterprises to formulate the formation and optimization strategies of the spatial correlation network of tourism eco-efficiency.


