Article

Spatial Distribution Characteristics and Influencing Factors of the Success or Failure of China’s Overseas Arable Land Investment Projects—Based on the Countries along the “Belt and Road”

1
School of Economics and Management, Northwest A&F University, Yangling 712100, China
2
School of Economics, Qufu Normal University, Rizhao 276826, China
*
Author to whom correspondence should be addressed.
These authors contributed equally to this work.
Land 2022, 11(11), 2090; https://doi.org/10.3390/land11112090
Submission received: 1 November 2022 / Revised: 16 November 2022 / Accepted: 16 November 2022 / Published: 19 November 2022

Abstract

:
As globalization continues, overseas arable land investment is becoming a viable option for China to alleviate its agricultural growth constraints, and the “Belt and Road” initiative offers plenty of opportunities for China to invest in overseas arable land. This study used data from the Land Matrix, KOF, World Bank, CEPII, UNCTAD and other databases to analyze the spatial distribution characteristics and factors influencing the success or failure of China’s overseas farmland investment projects in countries along the “Belt and Road” project through spatial analysis and the Logit model. The results show that North America has the largest share of production versus contracted acreage in current acreage investment cases, and Asian projects have the highest success rate. Both successful and failed projects in China regarding arable land investment are highly correlated spatially and characterized by a strong concentration and low uniformity of distribution, with differences in the degree of concentration in Asia, Africa and other regions. The contracted area, host country participation and host country resource endowment, business environment and institutional quality have significant, inverted “U-shaped”, negative and positive effects on project success, respectively. In addition, the involvement of the host country has a significant negative impact on the success of investment projects in Africa, and the length of investment and the type of investment purpose have a significant positive and negative impact on the success of investment projects in Asian countries. Therefore, China’s overseas arable land investment should be based on a full examination of existing investment projects in each country, the selection of host countries with abundant resource endowments and a good business environment and institutional environment and the adoption of a model suitable for each location to carry out investments according to local conditions.

1. Introduction

Since the beginning of the new century, the global population growth rate has accelerated, and the conflict between the supply and demand of water and land resources has become increasingly prominent, which has further intensified the conflict between food supply and demand [1,2,3]. Moreover, some countries with agricultural land shortages urgently need to control and use the cultivated land of other countries for agricultural production, and then ship the food produced back home to supplement their supplies. In this context, the strategic importance of arable land resources has been highlighted, and the control and use of arable land in other countries for agricultural production has gradually become important—this is called overseas arable land investment [4]. Overseas investment in farmland has a long history, starting in the 1890s, when Japan began investing in land in South America due to a shortage of agricultural land [5,6], followed by Korea, Saudi Arabia and other countries with scarce farmland resources and high import dependence [7]. Overseas arable land investment has gradually developed into an important means to realize the redistribution of agricultural resources and solve the dilemma of the mismatch between the global population and the amount of arable land, which has been supported and recognized by many institutions. According to the World Bank, investment in overseas arable land can improve global farming productivity, promote sustainable agricultural development and mitigate the threat of human food shortages [8], and the Food and Agriculture Organization of the United Nations (FAO) believes that greater investment in arable land in developing regions is key to breaking the agricultural growth constraint [9]. Therefore, overseas arable land investment has become an important means to increase the global food supply [10].
As a country with a large population, China cultivates only 7% of the world’s arable land but feeds 18.7% of the world’s population, making an outstanding contribution to ensuring global food security [11]. However, due to the inefficient use of arable land, the increase in industrial land and the increase in per capita grain consumption, China’s grain supply and demand have been in a state of “tight balance” for a long time. In the case of insufficient arable land reserve resources, overseas arable land investment has become a feasible solution to ease the constraints of China’s agricultural growth [5]. Therefore, overseas arable land investment is highly valued by the Chinese central government. Since the strategy of “going out” in agriculture was first proposed in 2006, the first document of the Central Committee in 2007~2019 repeatedly proposed the overall use of “two markets and two resources” at home and abroad to improve the level of agricultural foreign cooperation. With policy support and encouragement, China’s overseas arable land investment has continued to expand.
At the same time, the “Belt and Road” initiative was proposed in 2013 as a new major policy, opening up a broad space for China’s enterprises to expand abroad to invest in overseas arable land [12]. In addition, the countries along the “Belt and Road” are the world’s most important grain-producing regions, which have abundant arable land resources and huge investment potential, and have become hotspots for China’s arable land investment [13]. According to the Land Matrix, as of June 2021, China has invested in 53 countries, covering 13,250,200 hm2 of arable land, of which 48 countries have signed the “Belt and Road” cooperation agreements with China. However, the overall effect of China’s investment in countries along the “Belt and Road” is not optimistic, with only 8% of the arable land entering production and the rest not entering production for various reasons, leading to project failure. As the first law of geography shows, geographical aspects or their attributes are spatially related to each other, so there may be spatial connections between China’s successful and failed arable land investment projects in countries along the “Belt and Road”. What does this connection look like? What factors influence the success of an investment project? Answering these questions is important to ensure the successful operation of China’s overseas arable land investment projects, to relieve the pressure on the domestic food supply and thus to achieve the optimal allocation of global agricultural resources. Therefore, based on the Land Matrix database, this paper explores the implementation status of China’s arable land investment projects in countries along the “Belt and Road” and analyzes their spatial distribution characteristics and influencing factors in order to provide a reference for China’s government and enterprises to scientifically guide and plan their investment projects and improve their success rate.
The main contributions of this study can be summarized as follows. First, this paper examines the current status and spatial distribution of successful or failed overseas arable land investment projects in countries along the “Belt and Road”. The existing studies mainly focus on analyzing the distribution characteristics of investment locations, but lack in-depth analysis of the implementation status of investment projects. Therefore, this study fills the gap in this area of research. Second, this study analyzes the factors influencing the performance of China’s overseas arable land investment projects by selecting indicators from multiple dimensions, such as project characteristics, host country resource endowment and the business environment, which is more in-depth and comprehensive than existing studies.
The remaining body of this paper is organized as follows. Section 2 describes related studies. Section 3 briefly introduces the research scope and data sources. Section 4 introduces the current situation and the spatial distribution characteristics of successful and failed projects in China’s overseas arable land investment. Section 5 analyzes the influencing factors of successful overseas arable land investment projects. Section 6 and Section 7 presents the discussion, conclusions and policy implications of the study.

2. Literature Review

The prevalence of overseas arable land investment activities has attracted academic attention, with current research focusing on value judgments, driving forces, influencing factors and the impact of investment [14,15,16]. In terms of judging the value of overseas arable land investment, there is a major academic controversy over the act due to differences in observation perspectives, with proponents arguing that the investment can solve the world food security problem and calling it large-scale land acquisition or overseas arable land investment [17,18], and opponents describing it as land grabbing or neo-colonial power [2,19,20,21]. In terms of driving forces, some scholars believe that the financial crisis, climate change and changes in energy prices are the main driving forces for the rapid expansion of overseas arable land investment [1,22,23]; others believe that securing domestic food and energy security and controlling foreign resources and industries are important factors motivating countries to invest in overseas arable land [6,24]. In terms of influencing factors, the host country’s arable land resource endowment, agricultural production conditions and social governance status are important factors that influence investors to carry out investment [4,25,26,27,28]. Some scholars also believe that overseas arable land investment is more influenced by the institutional environment and political situation of the host country and the bilateral political relationship between the two countries [10,24,29,30]. In terms of the impact of investment, current research suggests that investing in overseas arable land not only ensures food security in the investing country [31,32], but also improves the level of agricultural technology and productivity in the host country, drives local employment and improves the living conditions of residents [33,34,35], but it may also bring damage to the ecological environment of the host country [18,36].
In addition, with the rapid advancement of globalization, the development of overseas arable land investment has accelerated and the investment performance has attracted much attention. However, the actual situation is that the current success rate of overseas arable land investment is low and many projects cannot be successfully implemented [37]. There are few academic studies on the investment performance of overseas arable land; only McCarthy and Prudham [38] suggest that the success of farmland agreements, the needs of the host country’s political economy and the attitudes of local residents have a significant impact on the performance of overseas arable land investments. However, some scholars have suggested that there are some common influencing factors for OFDI and overseas arable land investment performance, including host country factors, investor factors and the relationship between the two countries. In terms of the host country, some scholars believe that the institutional environment of the host country can affect the performance of outbound investment positively and negatively, respectively [39,40]; in terms of the investor, the overseas acquisition experience, entry mode and location chosen by the firm determine the risk and performance of the investment [41,42]; in terms of the relationship between the two countries, the geographical distance, institutional distance, psychological distance, cultural distance and bilateral investment agreements all have an impact on the investment performance [39,43,44].
In summary, the existing literature provides an important theoretical and methodological reference for this study. Most scholars have been focusing on research on the nature and location of overseas arable land investment, but there are still some unresolved issues. First, as a country with a large population, the performance of overseas arable land investments by China’s companies has an important impact on food security in China and even globally, but there are few studies that analyze the performance of China’s overseas arable land investments. Second, China’s investment regions are expanding rapidly, but few scholars have focused on the differences and linkages between China’s investment performance in different regions. Therefore, this study analyzes the performance characteristics, distribution features and influencing factors of China’s overseas arable land investment in countries along the “Belt and Road”.

3. Research Design

3.1. Research Methods

3.1.1. Nearest Neighbor Index

The nearest neighbor index is a measure used to analyze the distribution type of point elements [45]. The principle is to find the Euclidean distance between any successful or failed project point and its nearest neighbor point and use the mean of these distances to represent the average nearest neighbor distance of the point element’s proximity. The nearest neighbor index is used to analyze the distribution characteristics of successful and failed overseas arable land investment projects. The calculation formula is as follows:
R = r i / r e = 1 n i = 1 n r i s i / ( 1 2 n / A )  
where R is the nearest neighbor index; r i   and r e   are the average distance and expected average distance when the successful or failed projects are randomly distributed, respectively; n is the total number of successful or failed projects; r i s i is the distance from China’s successful or failed overseas arable land investment projects in countries along the “Belt and Road” to its nearest neighbors; A is the area of the study region. If R = 1, it indicates that the successful or failed projects of China’s overseas arable land investment along the “Belt and Road” are randomly distributed in space. Meanwhile, R > 1, R < 1 and R = 0 indicate that the successful or failed projects are uniformly distributed, cohesively distributed and completely concentrated, respectively.

3.1.2. Gini Coefficient

The Gini coefficient is an important method used to describe the distribution of spatial elements in discrete regions in spatial structure analysis [46]. This coefficient is used to judge the spatial agglomeration status of successful and failed overseas arable land investment projects in China along the “Belt and Road”. The calculation formula is as follows:
G i n i = i = 1 n P i L n P i L n N ,   C = 1 G i n i  
where Gini is the Gini coefficient; P i is the proportion of the successful or failed number of China’s overseas arable land investment projects in the i-th country to the total number of China’s successful or failed investment projects in the region studied; N is the number of countries studied; C is the distribution uniformity. The range of the Gini coefficient is [0,1], and the larger the value, the higher the concentration.

3.1.3. Spatial Autocorrelation

Global spatial autocorrelation is a description of the spatial characteristics of attribute values in the entire region and is usually used to judge the similarity of observations at adjacent spatial locations [47]. This paper observes the characteristics and trends of the global distribution of China’s successful and failed overseas arable land investments in countries along the “Belt and Road” through Moran’s I value. The calculation formula is as follows:
M o r a n s   I = i = 1 n j = 1 n w i j X i X ¯ X j X ¯ S 2 i = 1 n j = 1 n w i j  
where n is the number of countries studied; X i   and X j are the number of successful or failed projects of China’s arable land investment in country i and country j, respectively; X ¯ = i = 1 n X i ; w i j is the spatial weight matrix. The value range of Moran’s I index is [–1,1].

3.1.4. Logit Regression Model

Whether the overseas arable land investment project is successful is set as the dependent variable in this study, which is a binary variable. Therefore, the Logit regression model is appropriate for analysis. A value of 1 for the dependent variable means that the investment project is successful—that is, some or all of the arable land has been placed into production after the project was initiated. A value of 0 indicates that the investment project fails—that is, the contracted arable land has not been placed into production. The independent variable affecting y is denoted as x i (i = 1,2,3,…). Let the conditional probability of project success be p y = 1 / x = p i ; then, 1 p i represents the probability of project failure. They are all nonlinear functions composed of independent variable vector X:
p i = 1 1 + e ( α + i = 1 m β i x i ) = e α + i = 1 m β i x i 1 + e α + i = 1 m β i x i  
Through logarithmic transformation, the linear expression of the Logit regression model is obtained:
L n ( p i 1 p i ) = α + i = 1 m β i x i  
where α is the constant term; m is the number of independent variables; β i is the coefficient of the independent variables.

3.2. Indicator Selection and Data Sources

3.2.1. Indicator Selection

  • Explained variables. A dummy variable is constructed to represent the success or failure of China’s overseas arable land investment projects in the host country. The value of successful investment is 1, and the value of investment failure is 0.
  • Explanatory variables. The project characteristics, host country’s economic base, resource endowment, business environment, degree of openness, institutional environment and bilateral relations between the two countries will all have an impact on the success or failure of an investment project.
    (a)
    As the core of overseas arable land investment, the contracted area and use of arable land are important factors affecting the success or failure of investment [37]. The development of overseas arable land investment can bring rental income, taxation, jobs and new technologies to the host country, and, to a certain extent, it can be supported by the local government and people. However, due to the political sensitivity of arable land investment, as the contracted area increases, the local residents may panic or even block the investment due to the influence of public opinions such as the “China threat theory” and “neocolonialism” [48], resulting in project failure. The contracted arable land is mostly used for agricultural production and non-food crop production. The more uses, the higher the requirements for the business entity and the greater the risk, which may reduce the success rate of the project. The longer the investment period, and the deeper the investor’s understanding of the local government, the public and the market of the host country, the more conducive it is to the successful operation of the project. Overseas arable land investment generally has two modes: sole proprietorship and joint venture. If the host country participates in the joint venture, it will help to reduce policy discrimination, public opinion risks, etc., and can speed up the operation of the enterprise.
    (b)
    The economic base reflects the persistence of a country’s investment environment, which is characterized by the level of development and economic growth. A better economic foundation is the fundamental guarantee for the level of return and security of China’s companies’ investment in overseas arable land [49]. The better the economic foundation of the host country, the greater the market demand and investment space, and the greater the probability of project success.
    (c)
    The resource endowment is represented by the per capita arable land area, the per capita renewable inland freshwater resources, the proportion of agricultural employment and the grain yield per unit. Resource endowment is the basis for overseas arable land investment. The higher the endowment, the more conducive to investment. However, countries with excellent resources and a good environment will also attract other competitors; there may be malicious slander and other incidents in the competition process, which will be detrimental to the image of enterprises and even China as a whole, and hinder the development of the project.
    (d)
    The business environment of the host country is characterized by the business convenience index, the degree of protection of small and medium investors, the difficulty of contract execution and the proportion of the total tax rate. The business environment is related to the capital, human resources, time and opportunity costs of an enterprise’s production and operation activities. An open, transparent, fair and good business environment can promote the marketization of investment activities [50]; by simplifying procedures, providing protection policies and reducing taxation, the company’s start-up time and operating costs are reduced, which will help China’s companies to adapt to the host country’s business environment, reduce the difficulty of survival and promote successful investment.
    (e)
    The degree of openness of the host country is represented by the number of investment protection policies towards China, the globalization index and the proportion of foreign investment. Countries with a high degree of openness are more tolerant of foreign investors and can provide preferential policies to attract investment. As a result, foreign investors have higher autonomy to operate independently [51], which can improve the success rate of investment.
    (f)
    We use public discourse power, political stability, government efficiency, supervision quality, the rule of law level and corruption control ability to characterize the host country’s institutional environment. The main function of institutions is to create an orderly market environment and reduce market uncertainty to facilitate the conductance of economic activities. An excellent institutional environment in a country means that the government is more effective, the protection of contracts and property rights is stronger, and the investment risk of enterprises is lower [52], which is conducive to the success of investment.
    (g)
    The bilateral relationship is represented by the language similarity between China and the host country, the signing length of the bilateral investment agreement, the partnership, the length of the establishment of diplomatic relations and the number of high-level mutual visits. Language similarity represents the cultural distance between China and the host country. Having a common language between the two countries means that they have similar cultural values, which can reduce information asymmetry and make it easier for both parties to communicate and reach business agreements [53]. The remaining variables all represent the political relationship between China and the host country. A friendly bilateral political relationship can provide China’s enterprises with higher property rights protection and residual claiming ability [54], which guarantees the success of project investment. The selection and description of the variables are shown in Table 1.

3.2.2. Data Sources

The data of the arable land investment area, project characteristics, production status and other related data are all from the Land Matrix database (https://landmatrix.org/, accessed on 30 June 2021). The host country’s resource endowment, institutional quality, degree of openness and other related data are from databases such as the KOF Globalisation Index (https://kof.ethz.ch/en/forecasts-and-indicators/indicators/kof-globalisation-index.html, accessed on 30 June 2021) and World Bank (https://data.worldbank.org.cn/indicator, accessed on 30 June 2021). The geographical distance between China and the host country, the length of investment agreement sining, partnerships and other related data are, respectively, from the Centre for International Vision and Information Research, France (cepii.fr/cepii/en/bdd_modele/bdd_modele.asp, accessed on 30 June 2021), the United Nations Conference on Trade and Development, UNCTAD (https://comtrade.un.org/data/, accessed on 30 June 2021) and the website of the Ministry of Foreign Affairs of the People’s Republic of China (www.gov.cn/guoqing/2005-06/02/content_2582743.html, accessed on 30 June 2021).

4. The Status and Spatial Distribution Characteristics of Successful and Failed Investment Projects

4.1. The Current Situation of China’s Overseas Arable Land Investment Projects

According to the Land Matrix database, as of June 2021, China has invested in arable land in 48 countries along the “Belt and Road”. However, due to the lack of Cuban investment data, it is excluded. Only the remaining 277 investment projects in 47 countries are studied. In terms of area, China’s contracted area for arable land investment in countries along the “Belt and Road” is 9,411,400 hm2, with a production area of 720,800 hm2 and a productivity level of 7.66%. In terms of the number of projects, there are 277 investment projects, of which 86 are in successful operation, and the success rate is 31.05%. The distribution profile of investment projects is shown in Table 2.
From a regional perspective, investment projects are mainly distributed in Africa, Asia, Europe and South America. Among them, the contracted area in Africa is 866,500 hm2, including 66 projects in 22 countries, and it is the region involving the most host countries. Its production area is 84,200 hm2, accounting for 9.7% of the contracted area, and 20 projects have been placed into production, with a success rate of 30.30%. The contracted area in Asia is 1.7024 million hm2, including 124 projects in 12 countries, more than half of which are concentrated in Laos and Indonesia, which is the region with the most projects. The production area is 246,200 hm2, accounting for 14.46% of the contracted area, and 54 projects have been placed into production, with a success rate of 43.55%. The contracted area in Europe is 5,181,100 hm2, including 69 projects in 5 countries. It is the area with the largest investment area; notably, 64 of these projects are located in Russia. The total production area is 81,900 hm2, accounting for 1.58% of the contracted area. The number of projects placed into production is 5, with a success rate of 7.25%. The contracted area in South America is 1,149,400 hm2, including 14 projects in 6 countries, with a production area of 290,500 hm2, accounting for 25.28% of the contracted area, and 6 projects have been placed into production, with a success rate of 42.86%. The contracted area in North America is 18,000 hm2, which is the area with the smallest investment area, involving only one project in one country, and all of them have entered into production. The contracted area in Oceania is 494,000 hm2, involving only 3 projects in one country, but the production area is 0 hm2. The distribution profile of the investment projects is shown in Table 2. It can be seen that the contracted arable land area may not always be placed into production, and the number of projects placed into production does not fully reflect the actual arable land area placed into production. Therefore, in determining which areas are suitable for investment, we should focus on the arable land area placed into production in the region, so that we can better determine the potential for successful investment in the region.
In general, China’s implementation of overseas arable land investment in countries along the “Belt and Road” is not optimistic, most of the contracted arable land has not been developed and utilized, and the established projects have not started operation. Moreover, investment projects are mostly distributed in Africa and Asia, and to a lesser extent in other regions. Considering the differences in resource characteristics and economic conditions in each region, the sample is divided into three regions, Asia, Africa and other regions, to analyze the heterogeneity of factors affecting the success or failure of projects in each region.

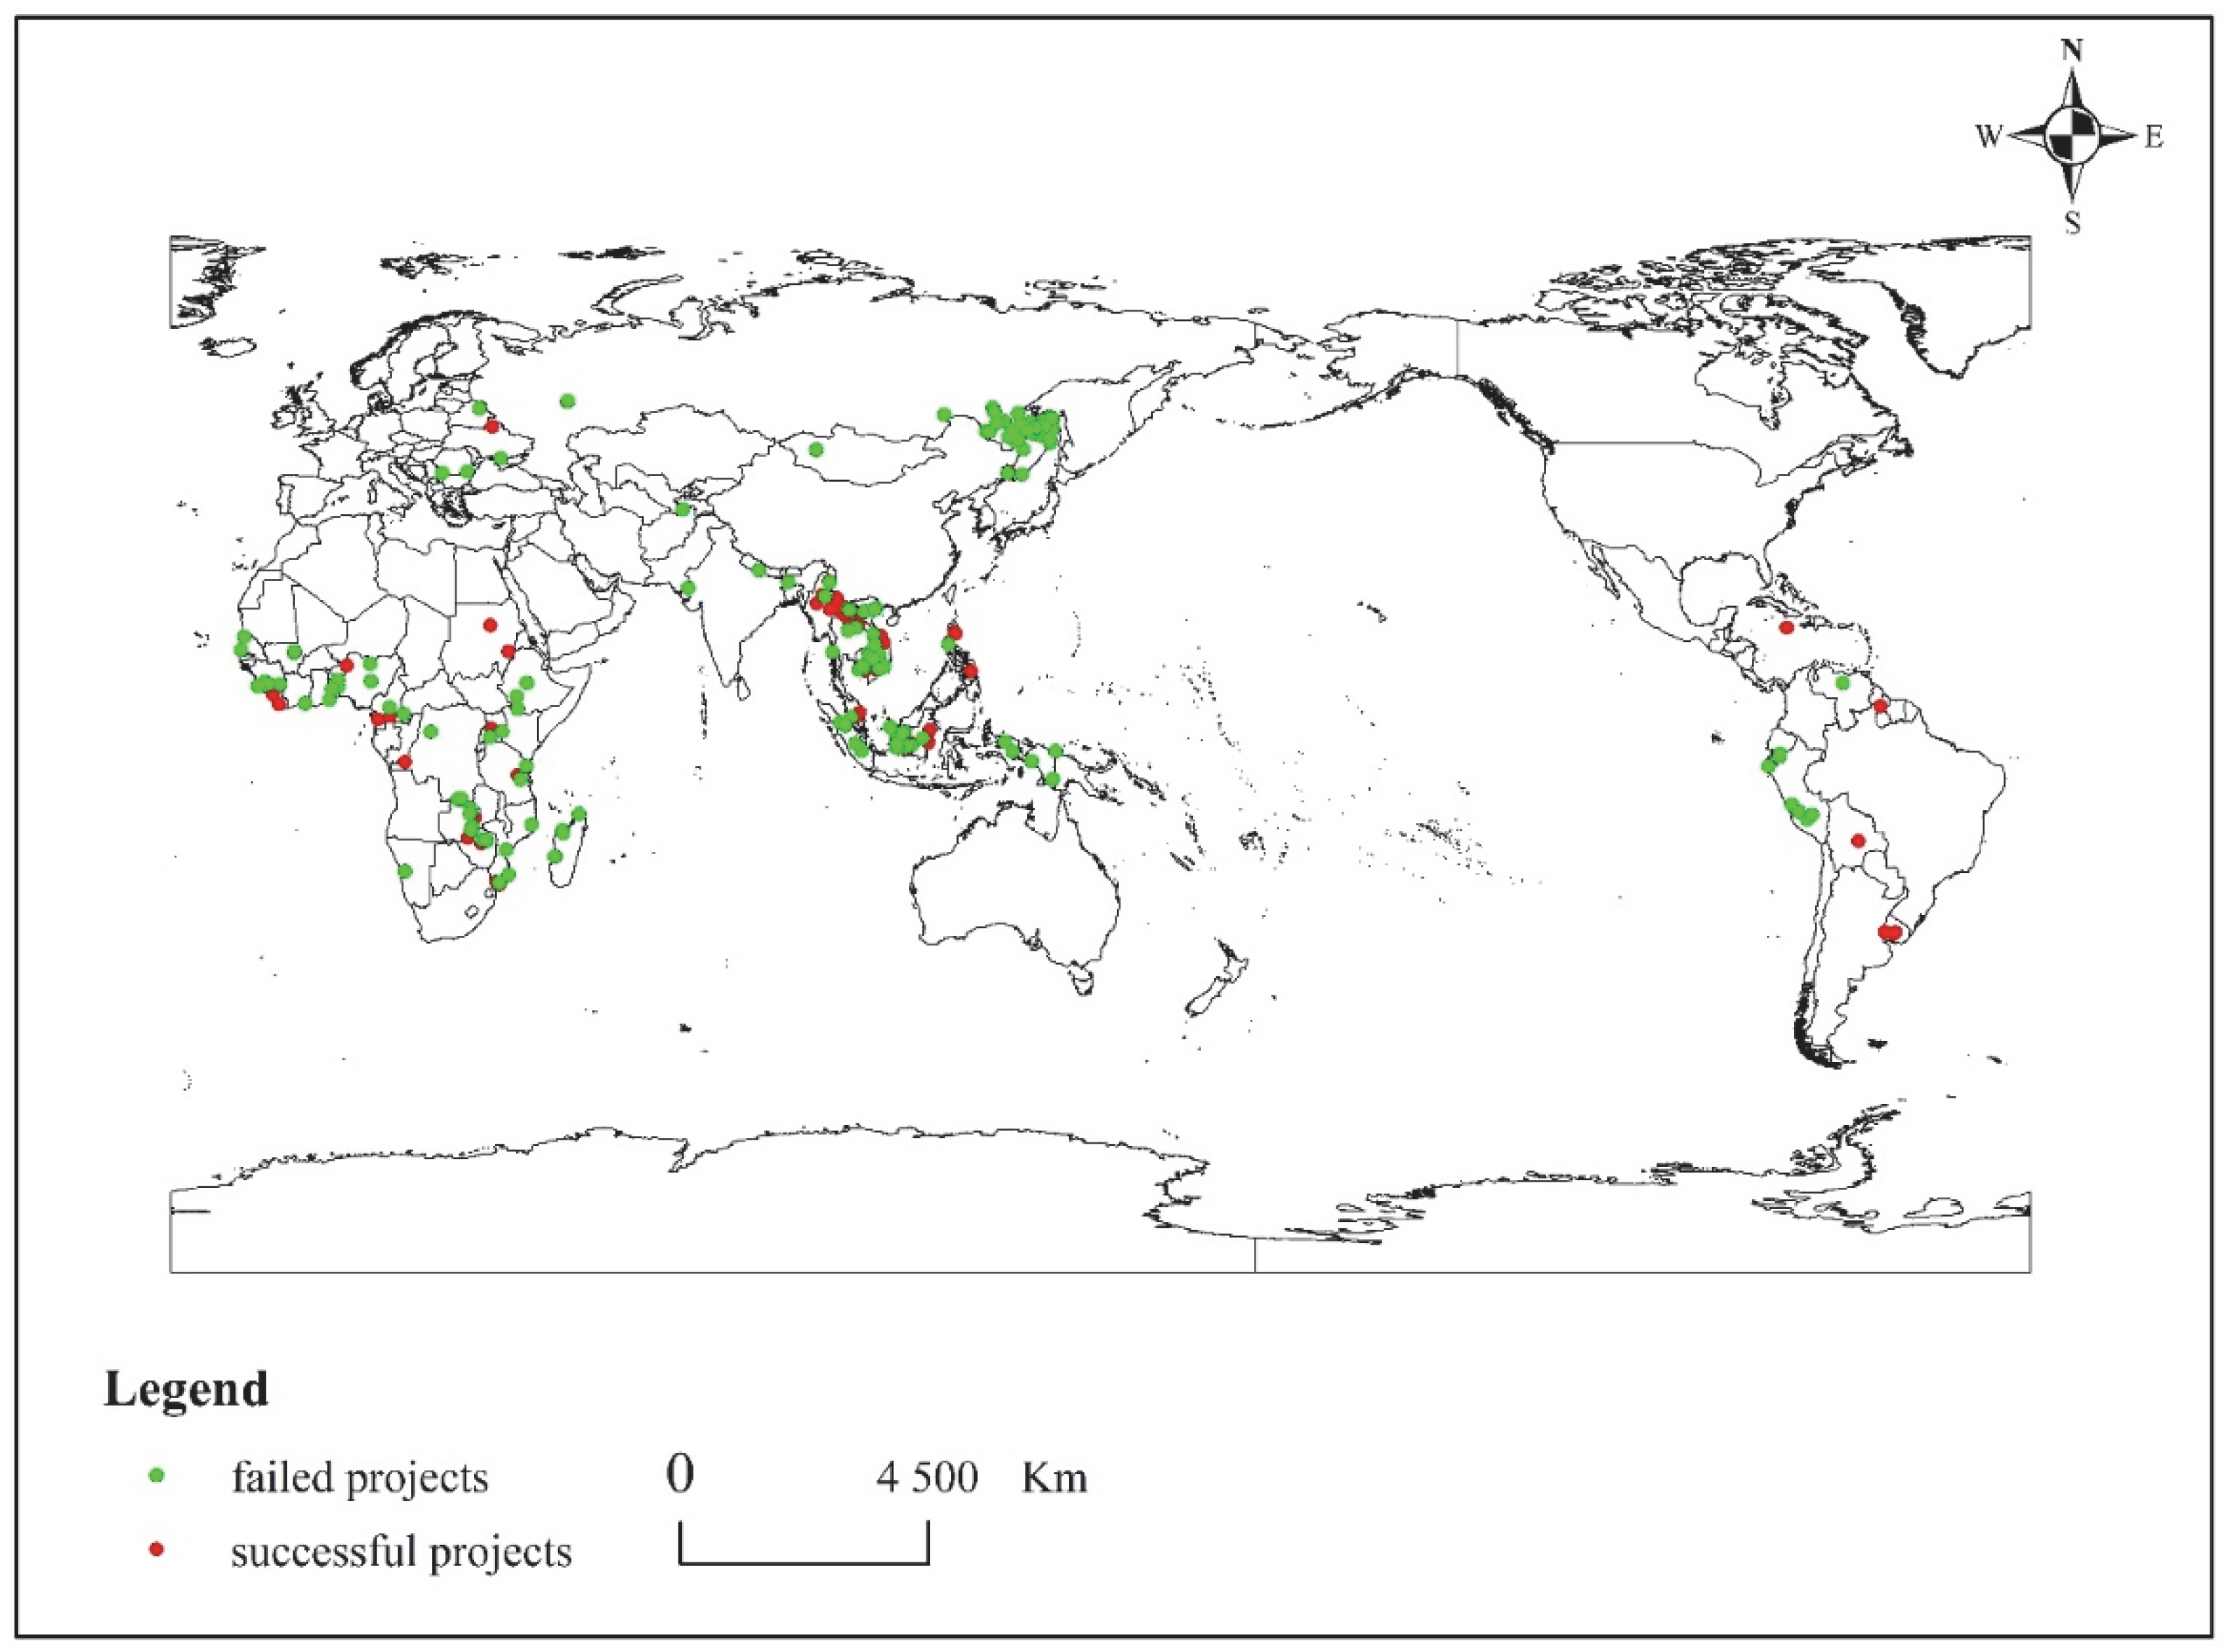
4.2. Spatial Pattern Characteristics of Success or Failure of Arable Land Investment Projects

4.2.1. Analysis of the Nearest Neighbor Index

ArcGIS 10.6 software was used to calculate the nearest neighbor indices for successful and failed projects in the total region and three sub-regions in Asia, Africa and other regions to determine the type of spatial distribution of China’s arable land investment projects in each region. The results show that the nearest neighbor index of successful projects of overseas arable land investment in countries along the “Belt and Road” is 0.385 and passes the 1% significance test, indicating that the successful projects have a cohesive distribution. In addition, the nearest neighbor index of failed projects is 0.321, which also passes the significance test—that is, the failed projects also a cohesive distribution. From the perspective of various regions, the nearest neighbor indices of China’s successful and failed arable land investment projects in Africa, Asia and other regions are all less than 1 and pass the significance test. This shows that both successful and failed projects in the three regions are characterized by a cohesive distribution, and the highest degree of cohesion was found in successful projects in Asia and in failed projects in other regions. The results of the nearest neighbor index are shown in Table 3.

4.2.2. Analysis of the Gini Coefficient

We calculate the Gini coefficient and distribution uniformity of the number of successful and failed overseas arable land investment projects in each region to judge their distribution characteristics.
The results show that the Gini coefficient of China’s successful arable land investment projects in countries along the “Belt and Road” is 0.711, and the distribution uniformity is 0.289, which is slightly higher than the distribution uniformity of failed projects. It indicates that both China’s successful and failed arable land investment projects in countries along the “Belt and Road” are characterized by a high concentration and low uniformity of distribution. A possible reason is that overseas arable land investment is risky and site selection is difficult. Generally, companies will refer to the site selection experience of existing projects before making investments, which often leads to the accumulation of projects in some areas. By region, the concentration of successful and failed projects is at the highest level in Africa, followed by Asia, and the lowest concentration is in other regions, due to the fact that Africa has more abundant agricultural resources, making investments more concentrated. The results of the Gini coefficient are shown in Table 4.

4.2.3. Analysis of the Spatial Autocorrelation

The global autocorrelation can visually express the spatial correlation between China’s successful and failed arable land investment projects in countries along the “Belt and Road”, and it can identify the characteristics and patterns of project distribution in geographic space. According to the number of successful and failed projects invested in by China in various countries, GeoDA software is used to construct a weight matrix based on the distance relationship to calculate the global Moran’s I values of successful and failed projects. The results shows that the Moran’s I values of the successful and failed projects are 0.180 and 0.118, respectively, and pass the 1% and 5% significance tests, indicating that there is a positive spatial correlation between the successful and failed projects, showing a spatial agglomeration effect. Moreover, the agglomeration degree of successful projects is higher than that of failed projects. The results of the Moran’s I are shown in Table 5.
Combining Table 3, Table 4 and Table 5 and Figure 1, it can be seen that the clustering effects of both successful and failed projects are most significant in Africa, where successful projects are concentrated in Liberia, Mali, Sudan, etc., and failed projects are concentrated in Congo, Madagascar, Zambia, etc.; the successful projects in Asia are mainly concentrated in Laos and Myanmar, and the failed projects are mainly concentrated in Cambodia and Indonesia; most of the failed projects in Europe are concentrated in Russia( Figure 1).

5. Influencing Factors of Success of Arable Land Investment Projects

5.1. Baseline Regression Results

Before carrying out the regression analysis, the entropy method was used to assign weights to each indicator of the five dimensions of economic base, resource endowment, business environment, openness and bilateral relations and weighted to calculate the corresponding values; the mean values of the six variables in institutional quality were taken to represent the overall institutional environment quality of the host country.
Logit regression analysis was carried out by using Stata software to study the factors influencing the success of China’s overseas arable land investment. First of all, the project characteristics were used as explanatory variables in the regression to obtain Model 1. Then, on the basis of Model 1, the host country’s economic base, resource endowment, business environment, degree of openness, bilateral relations and institutional quality were added to obtain Model 2 to Model 7. The seven models are all significant at the 1% level, and the Pseudo R2 increases sequentially from Model 1 to Model 7, indicating that the overall fit of the model has improved, and the selected variables provide a good explanation for the success of China’s overseas arable land investment. Therefore, the final analysis in the text refers to Model 7. The results show that the contracted area, the square of the area, whether the host country participates in the investment and the host country’s resource endowment, business environment and institutional quality have a significant impact on the success of arable land investment projects. The model regression results are shown in Table 6.
The contracted area and the square of the area have positive and negative effects on the success of investment projects at the significance level of 5% and 10%, respectively. This shows that the contracted area and the project success do not have a simple linear relationship, but an inverted “U”-shaped relationship. The reason is that, as the contracted area increases, the company can bring rental income, technology, etc., to the host country, and the project is highly regarded and supported by the local government; thus, the probability of success increases. However, when the area increases to a certain level, unfavorable public opinion can cause panic and lead to the rejection of foreign investment by the host population and government, reducing the success rate of the project. Contrary to expectations, the participation of the host country in the investment will reduce the probability of project success. The reason may be that although cooperation with the host country can reduce the risk of public opinion and information transaction costs to a certain extent, it can also cause Chinese companies to lose absolute control over the project and increase the risk of internal management, thus increasing the probability of project failure.
The resource endowment of the host country has a positive impact on the success of investment projects and passes the 5% significance test. This indicates that a host country with good resource endowment is not only more attractive to enterprises, but also can improve the success rate. The reason is that countries with higher endowments are relatively more tolerant of foreign investors, and their abundant resources make the host country more supportive and welcoming of foreign investment and technology, which is conducive to the success of investment projects.
The business environment of the host country has a positive impact on the success of investment projects and passes the 5% significance test. On the one hand, the reason may be that a host country with a good business environment can create a superior investment environment for China’s investors and provide corresponding protection policies. In addition, the host government’s support and recognition of China’s enterprises will also help to drive the acceptance and participation of local organizations and the public, reducing investment obstacles. On the other hand, the more inclusive that a host country is regarding foreign investors, the more it can help to promote local cooperation with China’s companies, accept China’s investment and implement fair and transparent policies, which can further improve the success rate of investment.
The institutional environment of the host country has a significant positive impact on the success of investment projects. In a good institutional environment, the market will be free from abnormal government intervention and operate according to economic laws. At the same time, market information will be more open and transparent [55]. In addition, a favorable institutional environment can reduce investment uncertainty, reduce transaction costs and operating costs, improve the stability of investment returns and better enable host countries to fulfill their commitments to foreign investors’ protection and contribute to the successful operation of overseas arable land investment projects.
The length of investment and type of investment purpose have positive and negative effects on project success, respectively, but neither is significant, probably because China’s overseas arable land investment started late and is in its infancy, with a short period of investment. Moreover, at present, China’s investment serves a single purpose, with most of the contracted arable land used for growing grain, so these two variables are not key factors affecting project success. In addition, the economic base of the host country, the degree of openness and the bilateral relationship with China do not have a significant impact on project success, because China’s overseas arable land investment is resource-oriented and focuses mainly on the resource endowment, business environment and institutional quality of the host country, while the remaining variables do not have a large impact on project success.

5.2. Heterogeneity Analysis

Regressions were performed separately for samples from Asia, Africa and other regions to analyze the heterogeneity of factors influencing the success of arable land investment projects in each region. The results show that whether the host country participates in the investment only has a significant negative impact on the success of African projects. The reason is that the political situation in most African countries is turbulent, and the host country’s participation in the investment of China’s enterprises is more likely to lead to conflicts between parties and governments; thus, the probability of failure is higher.
The influence of the contracted area on the success of overseas arable land investment projects in Asian countries is consistent with the overall sample, which displays an inverted “U” shape, and there are significant positive and negative effects of the investment duration and type of investment purpose on the success of investment projects in Asian countries. The reason is that, on the one hand, Asian countries have a similar cultural system to China and start to exchange and cooperate earlier, and the political situation is more stable compared with that of African countries, so the chance of sustainable investment is higher; the longer the investment time is, the more the investment experience and foundation can be increased for enterprises, which is conducive to the support and trust of the host country. Therefore, the length of investment has a positive impact on the success of projects in Asian countries. On the other hand, Asian countries have a strongly conservative culture, so, if China’s companies increase, the variety of investment purposes will not only increase the risk of corporate management, but also may cause the rejection of the host country, resulting in project failure. The results of the heterogeneity analysis are shown in Table 7.

5.3. Robustness Test

In this paper, we use a substitution model and variable approach to test the robustness of the previous results. The research idea is to replace the Logit model with the Probit model, and the results are shown in Model 11. Model 12 serves to convert the binary model into a linear model, and we use the logarithm of the arable land placed into production as the explained variable to measure the success or failure of investment projects. The results show that, in Models 11 and 12, the contracted area, the square of the area, whether the host country participates in the investment, resource endowment, the business environment and institutional quality all significantly affect the explained variable, and the direction is the same as in the previous results, indicating that the research results have strong robustness. The robustness test results are shown in Table 8.

6. Discussion

This study aimed to explore the implementation of China’s overseas arable land investment in countries along the “Belt and Road”. We not only analyze the distribution of successful and failed investment projects, but also explore the factors that influence project success.
With the advancement of globalization, investment in overseas arable land has become an important means to reallocate global agricultural resources and ensure global food security [8]. In particular, China, as a populous country, needs to alleviate the pressure of the mismatch of domestic human and land resources by investing in overseas arable land. China’s overseas arable land investment started late, but the development trend in the past few years has been good, and the “Belt and Road” initiative has laid the foundation for the opening up of investment channels. However, due to the lack of project site selection theory and overall planning guidance in the investment process of China’s enterprises, the investment risks are greater and there are fewer successful projects, which will not only cause the wastage of resources but also pose a threat to China’s food security [56].
There are many countries involved along the “Belt and Road”, and China’s investment situation in each country may vary. First of all, in terms of the number of successful projects, Asian countries have the highest success rate and Oceania has the lowest. This is consistent with the research results of Mills [57] and Han et al. [58]. Asia, especially Southeast Asia, is a region with sufficient light and heat conditions, good natural conditions for the development of agriculture and good geographical relations with China, becoming an important location for China to carry out overseas arable land investment, so its investment scale and success rate are higher than those of other regions.
Second, according to the results of the nearest neighbor index, the Gini coefficient and the Moran index, both China’s successful and failed investment projects are highly correlated in space. For example, China has a number of successful projects in Laos, Vietnam and Myanmar, and these three countries are adjacent to each other, indicating that successful investment projects are likely to accumulate in certain regions. At the same time, similar clustering characteristics may exist for failed projects; for example, China has a number of failed projects in Mozambique, Zimbabwe and Zambia. This result is consistent with the conclusion reached by Han et al. [59], who also believe that China’s overseas arable land investment projects have a good concentration in location and area, which requires China’s enterprises to focus on examining existing investment projects before investing in various countries, strengthen the analysis and research of successful and failed investment projects and select suitable investment areas based on the characteristics of enterprises. In particular, it is necessary to enhance the strength of enterprises, reduce the adverse impact of vicious competition in the international market and distorted reports in western media, such as those concerning “neo-colonialism” and “land grabbing”, and enhance the continuity of current successful investment projects [6].
Finally, since both successful and failed projects have significant clustering characteristics and are highly spatially correlated, it is necessary to explore which factors contribute to project success or failure. Through the analysis, we found that the resource endowment of the host country and the contracted arable land area have a greater impact on the success of the investment project. The higher the resource endowment of the host country, the higher the investment success rate, reflecting that China’s overseas arable land investment is a resource-oriented investment model, and abundant resources, as the main factor attracting investors in the host country, can not only expand the scale of investment but also improve the success rate of investment, which verifies the conclusions of scholars such as Deininger [4] and Hak et al. [25]. For example, Indonesia’s agricultural resources are among the top 20 in the world, with high resource endowment, and there are a number of successful Chinese investment projects in the country; on the contrary, Cambodia’s agricultural resources are at a moderate level, and the number of successful Chinese investment projects in the country is low, indicating that high resource endowment is the key element to guarantee the successful operation of investment projects. In addition, this study suggests that the contracted arable land area and the investment success rate show an inverted “U”-shaped relationship, which means that it is not the case that the greater the contracted area, the greater the probability of success. For example, China has assigned a great deal of arable land to Russia, but only a small part of the arable land has been placed into production, probably because, as the contracted area increases, this causes the Russian government to pay attention and panic, fearing that China will exploit their resources, and they will block China’s investment. However, interestingly, Zhou [37] believes that the investment’s cultivated land area and the success rate have a “U” curve relationship, which is contrary to the conclusion of this study. Borras and Franco [60] point out that the area invested is related to the number of farmers involved, and when the area is large, if the investor fails to meet the obligations, this can easily cause the farmer to revolt, which will lead to the failure of the project. However, when the area is further increased, the host government may reevaluate the transaction, and the company will also invest under the formal legal framework, which can help to improve the success rate.

7. Conclusions and Policy Suggestions

In this study, the distribution characteristics of China’s successful and failed arable land investment projects in countries along the “Belt and Road” are analyzed using spatial analysis methods such as the nearest neighbor index, Gini coefficient and Moran index, and the Logit model is constructed to analyze the influencing factors of investment project success.
On the whole, China’s performance in arable land investment in countries along the “Belt and Road” is not optimistic. At present, only 31.05% of the projects are in operation, and only 7.66% of the contracted arable land area has been placed into production. From the perspective of regional distribution, China has the largest share of arable land invested in production in North America, followed by South America, and the smallest share in Europe. Asia has the highest percentage of projects in production, while Oceania has the lowest percentage. In terms of the spatial pattern, the nearest neighbor indices of successful and failed investment projects were 0.385 and 0.321, respectively, and passed the significance test—that is, the successful and failed projects had the characteristics of a cohesive distribution, and the agglomeration degree of successful projects was higher than that of failed projects. The results of the Gini coefficient and spatial autocorrelation analysis also confirm this conclusion. Based on the results, the following policy suggestions are proposed. First, in the selection of regions for overseas arable land investment, Asian and American countries should be selected as much as possible. At present, the success rate and production area share of China’s overseas arable land investment projects in Asian and American countries along the “Belt and Road” are among the highest, which is a good reference for future new investment sites. Second, it is necessary to fully examine China’s existing investment projects in various countries before making an investment. Since the distribution of failed projects and successful projects in various countries has a significant agglomeration effect, the agglomeration area of successful projects should be considered when selecting a site, and one should avoid the agglomeration area of failed projects.
The results of the analysis of the factors influencing the success of the investment show that the characteristics of investment projects, the resource endowments of the host country, the business environment and the quality of institutions will all have an impact on the success of the projects. Among them, the impact of the contracted area on the success of the project has an inverted “U” shape, and a joint venture with the host country will reduce the success rate. Moreover, the host country’s resource endowment, business environment and institutional quality all have a significant positive impact on the success of the project. In addition, the main influencing factors vary across regions, and joint ventures with host countries only have a significant negative impact on the performance of projects in Africa. The effect of the contracted area on the success of overseas arable land investment in Asian countries is consistent with the total sample, with an inverted “U” shape. In addition, there are significant positive and negative effects of the investment duration and type of investment purpose on the success of investment projects in Asian countries, respectively. Based on the results, the following policy suggestions are proposed. First, it is necessary to choose a host country with abundant resource endowment, a good business environment and institutional quality, and to collect relevant information through various channels to conduct a risk assessment of the host country investment. At the same time, the arable land area invested should be reasonable, and the investment plan should be formulated on the basis of fully considering the arable land area of the host country, the land system and the attitudes of the government and the people. Second, it is crucial to adopt differentiated investment models for different regions according to local conditions. For African countries, we should avoid joint ventures with local governments to avoid contributing to social conflicts and political party disputes; for Asian countries, we should adopt long-term investment plans and establish stable partnerships with countries for overseas arable land investment, and we should avoid complex and diverse crop cultivation types to reduce the risk of corporate management and rejection by host governments and citizens.
This study analyzes the distribution characteristics and influencing factors of successful and failed projects regarding China’s arable land investment in countries along the “Belt and Road”, but only the project characteristics and host country characteristics were considered among the influencing factors. Moreover, due to the lack of relevant information, the relevant characteristics of the investing firms were not included in the analysis framework, which is a problem to be overcome in a follow-up study. In addition, this paper only analyzes the distribution characteristics of investment projects and the factors influencing project success in China, with a small sample, and the results cannot be compared with those of other countries. Future research will expand the scope to study the distribution characteristics of global overseas arable land investment projects and factors influencing project success, compare the differences between China and other countries, learn from the experience and advantages of other countries and contribute to the efficient development of China’s overseas arable land investment.

Author Contributions

Conceptualization, Z.P.; Data curation, Y.W.; Funding acquisition, F.W.; Methodology, F.W.; Software, Z.P.; Validation, Y.W.; Writing – original draft, L.M. All authors have read and agreed to the published version of the manuscript.

Funding

This research was funded by the National Natural Science Foundation of China (Grant No 71673222), the Humanities and Social Science Fund of Ministry of Education of China (Grant No 15XJA790005), General Project of Shanghai Cooperation Institute for Modern Agricultural Development “Food Issues in SCO Countries” (Grant No SCO21A002), and Northwest Agriculture and Forestry University of Science and Technology Basic Research Funds for Humanities and Social Sciences Program(Grant No 2452022065).

Institutional Review Board Statement

Not applicable.

Informed Consent Statement

Not applicable.

Data Availability Statement

Not applicable.

Conflicts of Interest

The authors declare no conflict of interest.

References

  1. Robertson, B.; Pinstrup-Andersen, P. Global land acquisition: Neo-colonialism or development opportunity? Food Secur. 2010, 2, 271–283. [Google Scholar] [CrossRef]
  2. Toft, K.H. Are land deals unethical? The ethics of large-scale land acquisitions in developing countries. J. Agric. Environ. Ethics 2013, 26, 1181–1198. [Google Scholar] [CrossRef]
  3. Antonelli, M.; Siciliano, G.; Turvani, M.E.; Rulli, M.C. Global investments in agricultural land and the role of the EU: Drivers, scope and potential impacts. Land Use Policy 2015, 47, 98–111. [Google Scholar] [CrossRef]
  4. Deininger, K. Challenges posed by the new wave of farmland investment. J. Peasant Stud. 2011, 38, 217–247. [Google Scholar] [CrossRef]
  5. Lu, X.H.; Ke, S.G.; Cheng, T.; Chen, T. The impacts of large-scale OFI on grains import: Empirical research with double difference method. Land Use Policy 2018, 76, 352–358. [Google Scholar] [CrossRef]
  6. Chen, Y.F.; Li, X.D.; Wang, L.J.; Wang, S.H. Is China different from other investors in global land acquisition? Some observations from existing deals in China’s going global strategy. Land Use Policy 2017, 60, 362–372. [Google Scholar] [CrossRef]
  7. Grindle, A.K.; Siddiqi, A.; Anadon, L.D. Food security amidst water scarcity: Insights on sustainable food production from Saudi Arabia. Sustain. Prod. Consum. 2015, 2, 67–78. [Google Scholar] [CrossRef]
  8. FAO; UNCTAD; World Bank Group. Principles for responsible agricultural investment that respects rights, livelihoods, and resources. World Bank Publ. 2010, 1, 8–10. [Google Scholar]
  9. FAO. The Future of Food and Agriculture-Alternative Pathways to 2050s; Food and Agriculture Organization: Roma, Italy, 2018. [Google Scholar]
  10. Hall, R. Land grabbing in Southern Africa: The many faces of the investor rush. Rev. Afr. Political Econ. 2011, 38, 193–214. [Google Scholar] [CrossRef]
  11. United Nations Development Program. The Millennium Development Goals Report 2015; United Nations: New York, NY, USA, 2015. [Google Scholar]
  12. Fang, T.; Chimenson, D. The internationalization of Chinese firms and negative media coverage: The case of Geely’s acquisition of Volvo cars. Thunderbird Int. Bus. Rev. 2017, 59, 483–502. [Google Scholar] [CrossRef]
  13. Wang, Y.M.; Sarkar, A.; Ma, L.Y.; Wu, Q.; Wei, F. Measurement of Investment Potential and Spatial Distribution of Arable Land among Countries within the “Belt and Road Initiative”. Agriculture 2021, 11, 848. [Google Scholar] [CrossRef]
  14. Baird, I. The global land grab meta-narrative, Asian money laundering and elite capture: Reconsidering the Cambodian context. Geopolitics 2014, 19, 431–453. [Google Scholar] [CrossRef]
  15. Kenney-Lazar, M. Plantation rubber, land grabbing and social-property transformation in Southern Laos. J. Peasant Stud. 2012, 39, 1017–1037. [Google Scholar] [CrossRef]
  16. Siciliano, G.; Rulli, M.C.; Odorico, P.D. European large-scale farmland investments and the land-water-energy-food nexus. Adv. Water Resour. 2017, 110, 579–590. [Google Scholar] [CrossRef] [Green Version]
  17. Otsuki, K.; Schoneveld, G.; Zoomers, A. From land grabs to inclusive development? Geoforum 2017, 83, 115–118. [Google Scholar] [CrossRef]
  18. Pedersen, R.H.; Buur, L. Beyond land grabbing. Old morals and new perspectives on contemporary investments. Geoforum 2016, 72, 77–81. [Google Scholar] [CrossRef]
  19. Borras, S.M.; Hall, R.; Scoones, I.; White, B. Towards a better understanding of global land grabbing: An editorial introduction. J. Peasant Stud. 2011, 38, 209–216. [Google Scholar] [CrossRef] [Green Version]
  20. Mnmichael, P. The land grab and corporate food regime restructuring. J. Peasant Stud. 2012, 39, 681–701. [Google Scholar] [CrossRef]
  21. Seaquist, J.W.; Johansson, E.J.; Nicholas, K.A. Architecture of the global land acquisition system: Applying the tools of network science to identify key vulnerabilities. Env. Res. Lett. 2014, 9, 114006. [Google Scholar] [CrossRef]
  22. Daniel, S.; Mittal, A. The Great Land Grab: Rush for World’s Farm Land Threatens Food Security for the Poor; The Oak Land Institute: Berkeley, CA, USA, 2009. [Google Scholar]
  23. Oliveira, G.D.L.T. Chinese land grabs in Brazil? Sinophobia and foreign investments in Brazilian soybean agribusiness. Globalizations 2018, 15, 114–133. [Google Scholar] [CrossRef]
  24. Zoomers, A.; Noorloos, F.V.; Otsuki, K.; Steel, G.; Westen, G.V. The rush for land in an urbanizing world: From land grabbing toward devel oping safe, resilient, and sustainable cities and landscapes. World Dev. 2017, 92, 242–252. [Google Scholar] [CrossRef]
  25. Hak, S.; Mcandrew, J.; Neef, A. Impact of government policies and corporate land grabs on indigenous people’s access to com mon lands and livelihood resilience in Northeast Cambodia. Land 2018, 7, 122. [Google Scholar] [CrossRef] [Green Version]
  26. Partners, H.Q. Private financial sector investment in farmland and agricultural infrastructure. OECD Food Agric. Fish. Pap. 2010, 33, 5–27. [Google Scholar]
  27. Schoenberger, L.; Hall, D.; Vandergeest, P. What happened when the land grab came to Southeast Asia? J. Peasant Stud. 2017, 44, 697–725. [Google Scholar] [CrossRef]
  28. Constantin, C.; Luminita, C.; Vasile, A.J. Land grabbing: A review of extent and possible consequences in Romania. Land Use Policy 2017, 62, 143–150. [Google Scholar] [CrossRef]
  29. Mcmichael, P. Land grabbing as security mercantilism in international relations. Globalizations 2013, 10, 47–64. [Google Scholar] [CrossRef]
  30. Kolstad, I.; WIIG, A. What determines Chinese outward FDI? J. World Bus. 2012, 47, 26–34. [Google Scholar] [CrossRef]
  31. Coscieme, L.; Pulselli, F.M.; Niccolucci, V.; Patrizi, N.; Sutton, P.C. Accounting for “land-grabbing” from a biocapacity viewpoint. Sci. Total Environ. 2016, 539, 551–559. [Google Scholar] [CrossRef]
  32. Lu, X.H.; Ke, S.G. Research on China’s grain supply security based on overseas farmland investment. China Popul. Resour. Environ. 2017, 5, 102–110. [Google Scholar] [CrossRef]
  33. Aha, B.; Ayitey, J.Z. Biofuels and the hazards of land grabbing: Tenure (in) security and indigenous farmers’ investment decisions in Ghana. Land Use Policy 2017, 60, 48–59. [Google Scholar] [CrossRef]
  34. Bawa, R. Will the nanomedicine “patent land grab” thwart commercialization? Nanomedicine 2005, 1, 346–350. [Google Scholar] [CrossRef] [PubMed]
  35. Friis, C.; Nielsen, J. Small-scale land acquisitions, large-scale implications: Exploring the case of Chinese banana investments in Northern Laos. Land Use Policy 2016, 57, 117–129. [Google Scholar] [CrossRef]
  36. Hules, M.; Singh, S.J. India’s land grab deals in Ethiopia: Food security or global politics? Land Use Policy 2017, 60, 343–351. [Google Scholar] [CrossRef]
  37. Zhou, H.C. Government agreements, institutional environment and foreign land investment. Financ. Trade Econ. 2014, 8, 71–84. [Google Scholar]
  38. McCarthy, J.; Prudham, S. Neoliberal Nature and the Nature of Neoliberalism. Geoforum 2004, 35, 275–283. [Google Scholar] [CrossRef]
  39. Johanson, J.; Vahlne, J.E. The Internationalization Process of the Firm-a Model of Knowledge Development and Increasing Forei gn Market Commitments. J. Int. Bus. Stud. 1977, 8, 23–32. [Google Scholar] [CrossRef] [Green Version]
  40. Witt, M.A.; Lewin, A.Y. Outward Foreign Direct Investment as Escape Response to Home Country Institutional Constraints. J. Int. Bus. Stud. 2007, 38, 579–594. [Google Scholar] [CrossRef]
  41. Anderson, E.; Gatignon, H. Modes of Foreign Entry: A Transaction Cost Analysis and Propositions. J. Int. Bus. Stud. 1986, 17, 1–26. [Google Scholar] [CrossRef] [Green Version]
  42. Dunning, J.H. Location and the Multinational Enterprises: A Neglected Factor. J. Int. Bus. Stud. 1998, 29, 45–65. [Google Scholar] [CrossRef]
  43. Mudambi, R.; Navarra, P. Institutions and International Business: A Theoretical Overview. Int. Bus. Rev. 2002, 11, 635–646. [Google Scholar] [CrossRef]
  44. Tobin, J.; Rose-Ackerman, S. When BITs Have Some Bite: The Political-economic Environment for Bilateral Investment Treaties. Rev. Int. Organ. 2011, 6, 1–32. [Google Scholar] [CrossRef]
  45. Gao, Y.N.; Fu, J. 3D nearest neighbor index model combined with Nano-CT to analyze SiC particles in ZrB2–SiC ceramics. Ceram. Int. 2022, in press. [CrossRef]
  46. Lambert, P.J. Lidia Ceriani and Paolo Verme’s paper “The origins of the Gini index: Extracts from Variabilità e Mutabilità (1912) by Corrado Gini”. J. Econ. Inequal. 2012, 10, 419–420. [Google Scholar] [CrossRef]
  47. Zhao, L.; Wu, D.T.; Wang, Z.H.; Qu, L.P.; Yu, W. Spatio-temporal pattern and influencing factors of the allocation of rural basic education resources in China. Econ. Geogr. 2018, 38, 39–49. [Google Scholar]
  48. Hofman, I.; Ho, P. China’s ‘developmental outsourcing’: A critical examination of Chinese global ‘land grabs’ discourse. J. Peasant Stud. 2012, 39, 1–48. [Google Scholar] [CrossRef]
  49. Von, B.J.; Meinzen-Dick, R. Land grabbing’ by foreign investors in developing countries: Risks and opportunities. IFPRI Policy Brief 2009, 13, 1–4. [Google Scholar]
  50. Shin, Y.; Niu, Z. An analysis of host country determinants of China’s outward FDI. Asia-Pac. J. Bus. Commer. 2014, 6, 55–69. [Google Scholar]
  51. Holburn, G.L.F.; Zelner, B.A. Political Capabilities, Policy Risk, and International Investment Strategy: Evidence from the Global Electric Power Generation Industry. Strateg. Manag. J. 2010, 31, 1290–1315. [Google Scholar] [CrossRef]
  52. Cheung, Y.W.; Qian, X.W. Empirics of China’s Outward Direct Investment. Pac. Econ. Rev. 2009, 14, 312–341. [Google Scholar] [CrossRef] [Green Version]
  53. Rugman, A.M.; Verbeke, A. A Perspective on Regional and Global Strategies of Multinational Enterprises. J. Int. Bus. Stud. 2004, 35, 3–18. [Google Scholar] [CrossRef] [Green Version]
  54. Globerman, S.; Shapiro, D. Global Foreign Direct Investment Flows: The Role of Governance Infrastructure. World Dev. 2002, 30, 1899–1919. [Google Scholar] [CrossRef]
  55. Qi, Y.; Rao, G. Institutional risk preference and asymmetric role of institutional distance: An examination on the OFDI of China. Discret. Dyn. Nat. Soc. 2021, 6, 3506404. [Google Scholar] [CrossRef]
  56. Lu, X.H.; Li, Y.; Ke, S.G. Spatial distribution pattern and its optimization strategy of China’s overseas farmland investments. Land Use Policy. 2020, 91, 104355. [Google Scholar] [CrossRef]
  57. Mills, E.N. Framing China’s role in global land deal trends: Why Southeast Asia is key. Globalizations 2018, 15, 168–177. [Google Scholar] [CrossRef]
  58. Han, J.; Lu, X.H.; Kuang, B. Analysis of the spa tial distribution and geo-relationship factors influencing paths of host countries for China’s overseas farmland investment. China Land Sci. 2020, 34, 79–88. [Google Scholar]
  59. Han, J.; Pan, Z.C.; Lu, X.H. Spatial distribution and influencing factors analysis of China’s overseas farmland investment projects in Southeast Asia. J. Nat. Resour. 2021, 36, 1521–1534. [Google Scholar]
  60. Borras, S.; Franco, J.C. From Threat to Opportunity? Problems with the Idea of a “Code of Conduct” for Land- Grabbing. Yale Hum. Rights Dev. Law J. 2010, 13, 507–523. [Google Scholar]
Figure 1. The distribution of failed and successful projects.
Land 11 02090 g001
Table 1. Selection and description of variables.
Variable TypeVariable NameVariable DescriptionMaximumMinimumMean
Project characteristicsProduction areaArea of cultivated land that has been placedinto production (hm2).274,053.000.002602.15
ProductionWhether it has enteredinto production (Yes = 1, No = 0)1.000.000.31
Duration of investmentDuration from the earliest signing time to the statistical period (years)51.000.0012.52
Contracted area(hm2)627,072.000.0033,976.22
Hostcountry participation in the investmentYes = 1, No = 01.000.000.36
Investment purposesTypes of investment purposes4.001.001.54
Economic basisLevel of developmentGDP per capita (dollars)14,315.99423.644938.91
Economic growthGDP growth rate (%)8.36−8.103.81
Resource endowmentsArable land per capita(hectares/person)0.840.030.35
Renewable inland freshwater resources per capita(m3/person)310,880.2993.4018,821.04
The proportion of people employed in agriculture(%)72.135.8334.92
Cereal yield(kg/ha)6005.70502.503344.10
Business environmentEase of Doing Business Index1 = The most business-friendly regulations. The larger the index, the lower the convenience188.0012.00100.68
The degree of protection for small and medium-sized investorsThe greater the value, the higher the degree of protection88.0010.0048.27
Ease of contract execution72.2522.2152.34
The total tax rate as a percentage of business profits(%)83.7015.6036.37
Degree of opennessNumber of investment protection policies towards China33.000.0010.15
Globalization Index81.5543.7359.31
Percentage of FDI to GDP(%)32.76−11.623.94
Institutional qualityPublic discourse powerReflects the extent to which citizens of a country participate in the freedom of choice of government, expression, association and the media (−2.5−2.5)1.26−1.83−0.76
Political stabilityReflects the degree of political stability of a country (−2.5−2.5)1.05−2.25−0.40
Government efficiencyReflect the quality of a country’s public services, civil service, etc. (−2.5−2.5)1.00−1.66−0.38
Regulatory qualityReflects the capacity of a government to formulate and implement sound policies and regulations (−2.5−2.5)0.67−2.36−0.49
Level of the rule of lawReflects the agent’s perception of the degree of confidence and compliance with the rules of society (−2.5−2.5)0.62−2.32−0.69
Corruption control capabilitiesReflects the extent to which government control of public power is used for private gain (−2.5−2.5)1.25−1.54−0.76
Bilateral relationsLanguage similarity0.920.000.36
The length of time for signing a bilateral investment treaty(years)33.000.0025.60
Partnerships0 = other relationships, 1 = comprehensive partnership, 2 = strategic partnership, 3 = comprehensive strategic partnership3.000.002.40
The length of time for the establishment of diplomatic relationsLength of diplomatic relations between the two countries (years)72.0029.0061.68
Number of senior leadership exchange visitsLevel of political diplomacy between senior leaders (times)8.000.003.03
Table 2. Distribution of China’s investment in arable land in countries along the “Belt and Road.”.
RegionCountryContracted Area (hm2)Production Area (hm2)Number of ContractsNumber of Productions
AfricaEthiopia27,400030
Benin10,000020
Togo1200010
Democratic Republic of the Congo195,8171051
Guinea36,900010
Ghana40010
Zimbabwe16,34861541
Cameroon128,30831,42042
Côte d’Ivoire1560010
Liberia255,20020,99222
Madagascar35,970210051
Mali26,174799442
Mauritania638010
Mozambique55,06811,00062
Namibia4375010
Nigeria14,325100031
Sierra Leone22,269184541
Senegal400010
Sudan11,953201322
Tanzania7306140031
Uganda221175142
Zambia13,025301582
total866,48784,1556620
AsiaPakistan15,000010
Philippines10,38514,61143
Cambodia199,2027226214
Laos349,43875,384.543624
Malaysia6548409632
Mongolia10,011020
Bangladesh283010
Myanmar79,22029,968118
Nepal76010
Tajikistan909010
Indonesia959,588114,066359
Vietnam71,77682784
total1,702,436246,17912454
South AmericaBolivia12,50012,50011
Ecuador51,546020
Guyana627,072274,05311
Peru394,308050
Venezuela60,000010
Uruguay3988398844
total1,149,414290,541146
EuropeBelarus100,000010
Bulgaria20,000010
Russian Federation5,051,49677,220644
Romanian5772010
Ukraine3797470021
total5,181,06581,920695
North AmericaJamaica18,00018,00011
OceaniaPapua New Guinea494,010030
Total9,411,412720,79527786
Table 3. Nearest neighbor index measurement results.
RegionSuccessful ProjectsFailed Projects
Nearest Neighbor IndexZ-Test Valuep ValueNearest Neighbor IndexZ-Test Valuep Value
Entire0.385−10.9200.0000.321−17.9500.000
Asia0.497−7.0760.0000.458−8.6710.000
Africa0.722−2.3770.0170.599−5.2090.000
Other0.541−3.0440.0020.190−13.4250.000
Table 4. Gini coefficient and distribution uniformity measurement results.
RegionGini CoefficientUniformity of Distribution
SuccessfulFailedSuccessfulFailed
Entire0.7110.7170.2890.283
Asia0.650.7160.3500.284
Africa0.8150.9190.1850.081
Other0.6110.3420.3890.658
Table 5. The results of the Moran’ I measurement.
TypeMoran’s I ValueThe Z-ValueSignificance
Successful project0.1804.2430.004
Failed project0.1182.9130.014
Table 6. Factors influencing the success of China’s overseas arable land investment.
VariableModel 1Model 2Model 3Model 4Model 5Model 6Model 7
Duration of investment0.0240.0220.0240.0330.0330.0310.026
(0.025)(0.025)(0.026)(0.026)(0.026)(0.026)(0.026)
Contracted area1.706 ***1.634 ***1.696 ***1.434 **1.431 **1.485 **1.458 **
(0.587)(0.589)(0.588)(0.591)(0.590)(0.595)(0.592)
Area square−0.107 ***−0.102 ***−0.105 ***−0.092 ***−0.092 ***−0.094 ***−0.092 ***
(0.035)(0.035)(0.035)(0.035)(0.035)(0.035)(0.035)
Host country participation in the investment−1.085 ***−0.968 ***−1.035 ***−0.991 ***−0.957 **−0.884 **−0.787 **
(0.347)(0.364)(0.370)(0.368)(0.381)(0.391)(0.398)
Type of investment purpose−0.013−0.0390.0460.0130.0140.022−0.060
(0.182)(0.183)(0.190)(0.192)(0.193)(0.193)(0.199)
Economic basis −0.592−0.5230.8030.5350.6050.299
(0.594)(0.592)(0.828)(1.137)(1.145)(1.247)
Resource endowments 4.074 **4.063 **4.326 **4.460 **5.728 **
(1.940)(1.946)(2.096)(2.081)(2.250)
Business environment 2.015 **1.977 **2.049 **2.373 **
(0.880)(0.887)(0.891)(0.942)
Degree of openness 0.4880.549−0.104
(1.415)(1.414)(1.499)
Bilateral relations −0.580−0.498
(0.719)(0.733)
Institutional quality 0.923 *
(0.546)
Constant term−7.094 ***−6.707 ***−8.410 ***−8.524 ***−8.695 ***−8.690 ***−8.206 ***
(2.410)(2.436)(2.614)(2.584)(2.630)(2.640)(2.660)
Sample size277277277277277277277
Log likelihood−153.975−153.469−151.195−148.494−148.434−148.109−146.598
Pseudo R20.1030.1060.1190.1350.1350.1370.146
Prob > chi20.0000.0000.0000.0000.0000.0000.000
LR chi235.2436.2540.8046.2046.3246.9749.99
Note: *, **, *** indicate significant at the levels of 10%, 5%, and 1%, respectively, the values in parentheses are the standard errors of the coefficients.
Table 7. Factors influencing the success of China’s overseas arable land investments in different regions.
VariableModel 8 (Africa)Model 9 (Asia)Model 10 (Other)
CoefficientStandard ErrorCoefficientStandard ErrorCoefficientStandard Error
Duration of investment0.0580.0460.167 **0.0690.0910.099
Contracted area0.6121.4032.472 **1.263.424.703
Area square−0.0010.087−0.176 **0.079−0.1820.238
Host country participation in the investment−1.983 **0.9970.3150.587−20.8735335.439
Type of investment purpose−0.3160.412−0.577 *0.3440.2511.014
Economic basis5.113.6753.4064.2626.053.772
Resource endowments12.0669.4712.8845.58910.49310.509
Business environment2.0342.57−0.042.308−4.3985.249
Degree of openness6.8086.204−2.522.513−6.5819.263
Bilateral relations4.5013.7250.312.242−5.6862.84
Institutional quality−1.4661.124−0.1372.7641.291.651
A constant term−15.467 **6.967−10.259 *5.601−16.44526.157
Sample size6612487
Log likelihood−33.288−70.183−13.602
Pseudo R20.1780.1740.358
Prob>chi20.2120.0020.128
LR chi214.3929.4615.14
Note: *, ** indicate significant at the levels of 10% and 5%respectively.
Table 8. Robustness test regression results.
VariableModel 11Model 12
CoefficientStandard DeviationCoefficientStandard Deviation
Duration of investment0.0160.0160.0860.072
Contracted area0.864 **0.3423.361 **1.383
Area square−0.054 ***0.02−0.197 **0.081
Host country participation in the investment−0.486 **0.225−2.124 **1.013
Type of investment purpose−0.0330.12−0.170.562
Economic basis0.1570.7261.7083.158
Resource endowments3.335 **1.29816.243 ***5.905
Business environment1.449 **0.5636.968 ***2.567
Degree of openness−0.0160.883−0.8694.161
Bilateral relations−0.3230.434−1.9631.991
Institutional quality0.548 *0.3153.051 **1.383
A constant term−4.874 ***1.539−21.113 ***6.353
Sample size277277
Log likelihood−146.122-
Pseudo R2/R20.1480.15
Prob>chi2/prob>F00
LR chi250.94-
Note: *, **, *** indicate significant at the levels of 10%, 5%, and 1%, respectively.
Publisher’s Note: MDPI stays neutral with regard to jurisdictional claims in published maps and institutional affiliations.

