Article

A Scenario Simulation Study on the Impact of Urban Expansion on Terrestrial Carbon Storage in the Yangtze River Delta, China

1
Nanjing Institute of Geography and Limnology, Chinese Academy of Sciences, Nanjing 210008, China
2
Key Laboratory of Watershed Geographic Sciences, Nanjing Institute of Geography and Limnology, Chinese Academy of Sciences, Nanjing 210008, China
3
College of Resources and Environment, University of Chinese Academy of Sciences, Beijing 100049, China
*
Author to whom correspondence should be addressed.
Land 2023, 12(2), 297; https://doi.org/10.3390/land12020297
Submission received: 19 December 2022 / Revised: 14 January 2023 / Accepted: 17 January 2023 / Published: 20 January 2023
(This article belongs to the Special Issue Regional Sustainable Development of Yangtze River Delta, China)

Abstract

:
Assessing the impacts and drivers of urban expansion on terrestrial carbon storage (TCS) is important for urban ecology and sustainability; however, a unified accounting standard for carbon intensity and research on the drivers and economic value of TCS changes are lacking. Here, urban expansion and TCS in the Yangtze River Delta were simulated based on Patch-generating Land Use Simulation and Integrated Valuation of Ecosystem Services and Trade-offs models; scenario simulation; Literature, Correction, Ratio, Verification carbon intensity measurement; and land use transfer matrix methods. The results showed that (1) from 2000 to 2020, urbanization and TCS loss accelerated, with 61.127% of TCS loss occurring in soil, and land conversion was prominent in riverine and coastal cities, mainly driven by the urban land occupation of cropland around suitable slopes, transportation arteries, and rivers. (2) From 2020 to 2030, urban land expansion and TCS loss varied under different scenarios; economic losses from the loss of the carbon sink value under cropland protection and ecological protection were USD 102.368 and 287.266 million lower, respectively, than under the baseline scenario. Even if urban expansion slows, the loss of TCS under global warming cannot be ignored. Considering the indirect impacts of urbanization, the failure to establish a regional development master plan based on ecosystem services may affect China’s carbon targets.

1. Introduction

Terrestrial carbon storage (TCS) is the carbon stored in plant leaves, woody parts, and soil during continuous exchanges between the atmosphere, soil, and plants. It is widely recognized as an ecosystem service that plays an important role in understanding the interactive response between climate and productivity [1]. Urban expansion is the process of converting land-use attributes from non-urban to urban areas [2,3]. However, the reduction in vegetation cover and increase in impervious surfaces severely limits the provision of regional ecosystem services and ecological resilience, which in turn leads to an increased loss of carbon storage in terrestrial ecosystems [4]. In recent decades, the world has experienced significant urban expansion, with urban land growing from approximately 7.47 × 10⁵ km2 to 8.0 × 10⁵ km2 from 2001 to 2018 [5]. China underwent the most significant urban expansion during this period, accounting for 47.5% of the total [5]. Therefore, a timely and effective assessment of the impacts of urban expansion on ecosystem services (e.g., TCS) has become a critical and urgent task to better understand urban ecology and to achieve sustainable urban development.
The main methods currently used to estimate the impact of urban expansion on TCS are field sampling, image interpretation, and model simulations [6,7,8]. Model simulations are applied to estimate the impact of urban expansion on TCS owing to their advantages of low cost, speed, and predictability [9]. For example, Seto et al. [10] used a grid-based land change model to project global urbanization development in 2030 and discussed its direct impact on the carbon pool. He et al. [11] linked the Land Use Scenario Dynamics-urban model and the Integrated Valuation of Ecosystem Services and Trade-offs (InVEST) model to simulate and predict the urban expansion process in Beijing from 1990 to 2030, and they assessed the potential impacts on TCS. Wang et al. [12] integrated a scenario simulation method, system dynamics model, and InVEST model to explore future changes in land use and TCS under different climate scenarios in the Bortala Mongol Autonomous Prefecture, Xinjiang, China, in 2050, which precisely guided local regional development planning.
Models such as CA-Markov, CLUE-S, and future land-use simulation (FLUS) have become important tools for predicting future urban-land expansion [13,14,15]. However, it is difficult to reveal the underlying factors of land-use change and dynamically capture the evolution of each type of land-use patch [16]. In contrast, the Patch-generating Land Use Simulation (PLUS) model uses the Land Expansion Analysis Strategy (LEAS) module to explore the causal factors of various types of land use changes and simulate multiple land use patch-level changes [17]. The InVEST model consists of a series of modules and algorithms, of which the carbon module can directly combine land-use change and TCS dynamics based on land-use maps and carbon density; thus, carbon density is a key indicator for estimating TCS. Li et al. [18] conducted physical and chemical experiments to determine soil organic carbon density by selecting typical sample areas and land types for soil sample collection. Although field sampling methods are the most basic and effective, they are difficult to implement in large-scale areas because they require cumbersome processes. Moreover, the lack of uniform accounting standards for large-scale carbon density estimation causes the carbon density of different land types in the same region to vary significantly [19]. In the global market economy, the economic value of terrestrial ecosystem carbon sink services has been widely recognized, and some scholars have used the social cost of carbon to study the social and economic value of changes in TCS due to urban expansion [20].
As a scientific innovation, industrial, and financial hub, the Yangtze River Delta (YRD) has experienced rapid economic development and urban expansion since the Chinese economic reform and opening-up [21]. From 1980 to 2020, the per capita gross domestic product (GDP) of the YRD increased from CNY 602.526 to 103,962.565, the urbanization rate increased from 16.395% to 70.847%, and the area of urban construction land increased from 25,700 to 47,138 km2. It was shown that urban construction land in the YRD grew by 156.25% from 1990 to 2015, while all other land types declined to varying degrees, resulting in an estimated loss of 1210.54 Tg of TCS [22]. These TCS estimates were based on the consequences of shifts in all land types under the influence of climate change and human activities. However, changes in TCS due to shifts in and out of urban land use have not been accurately assessed.
This study aimed to clearly reveal the impact of TCS on urban expansion in the YRD and set three objectives to achieve this: (1) assess the urban expansion and TCS changes in the YRD from 2000 to 2020 based on the coupled PLUS and InVEST models using the Literature, Correction, Ratio, Verification (LCRV) carbon intensity measurement method; (2) analyze and predict urban expansion and the impact on TCS in the YRD in 2030 using the scenario simulation method; and (3) explore the drivers of TCS changes from urban expansion and the loss of the economic value of carbon sinks in different scenarios.

2. Materials and Methods
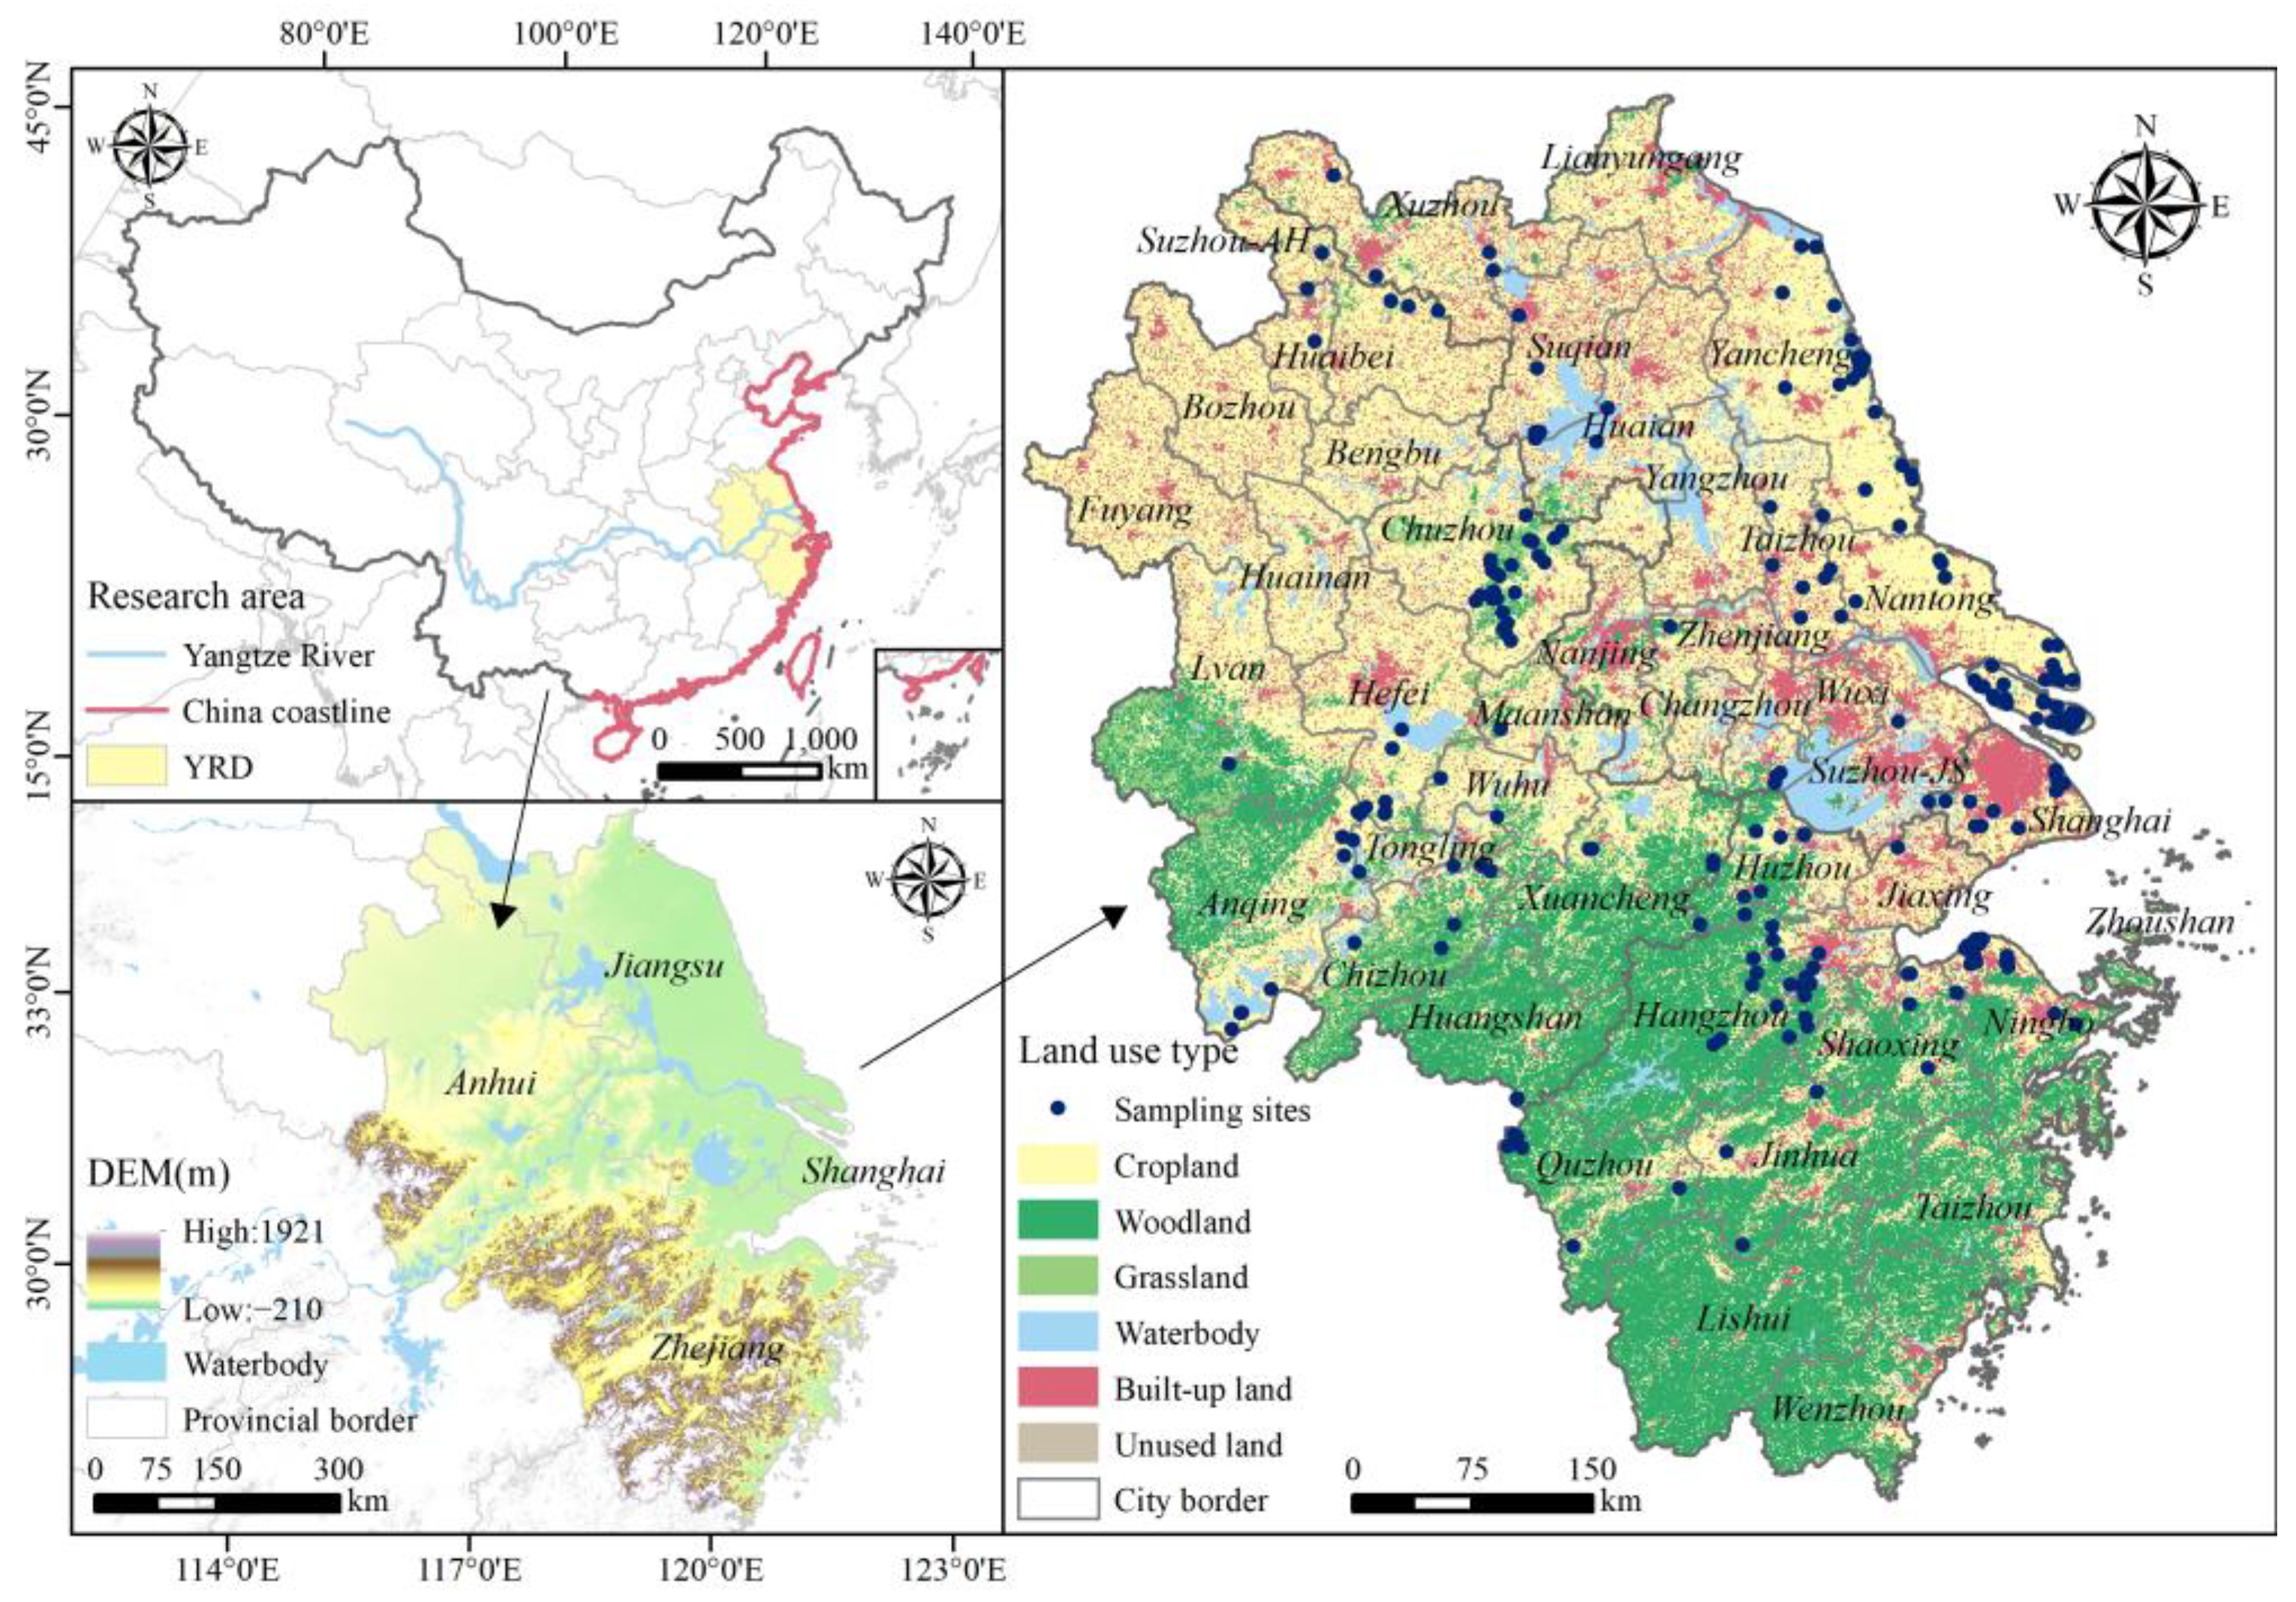
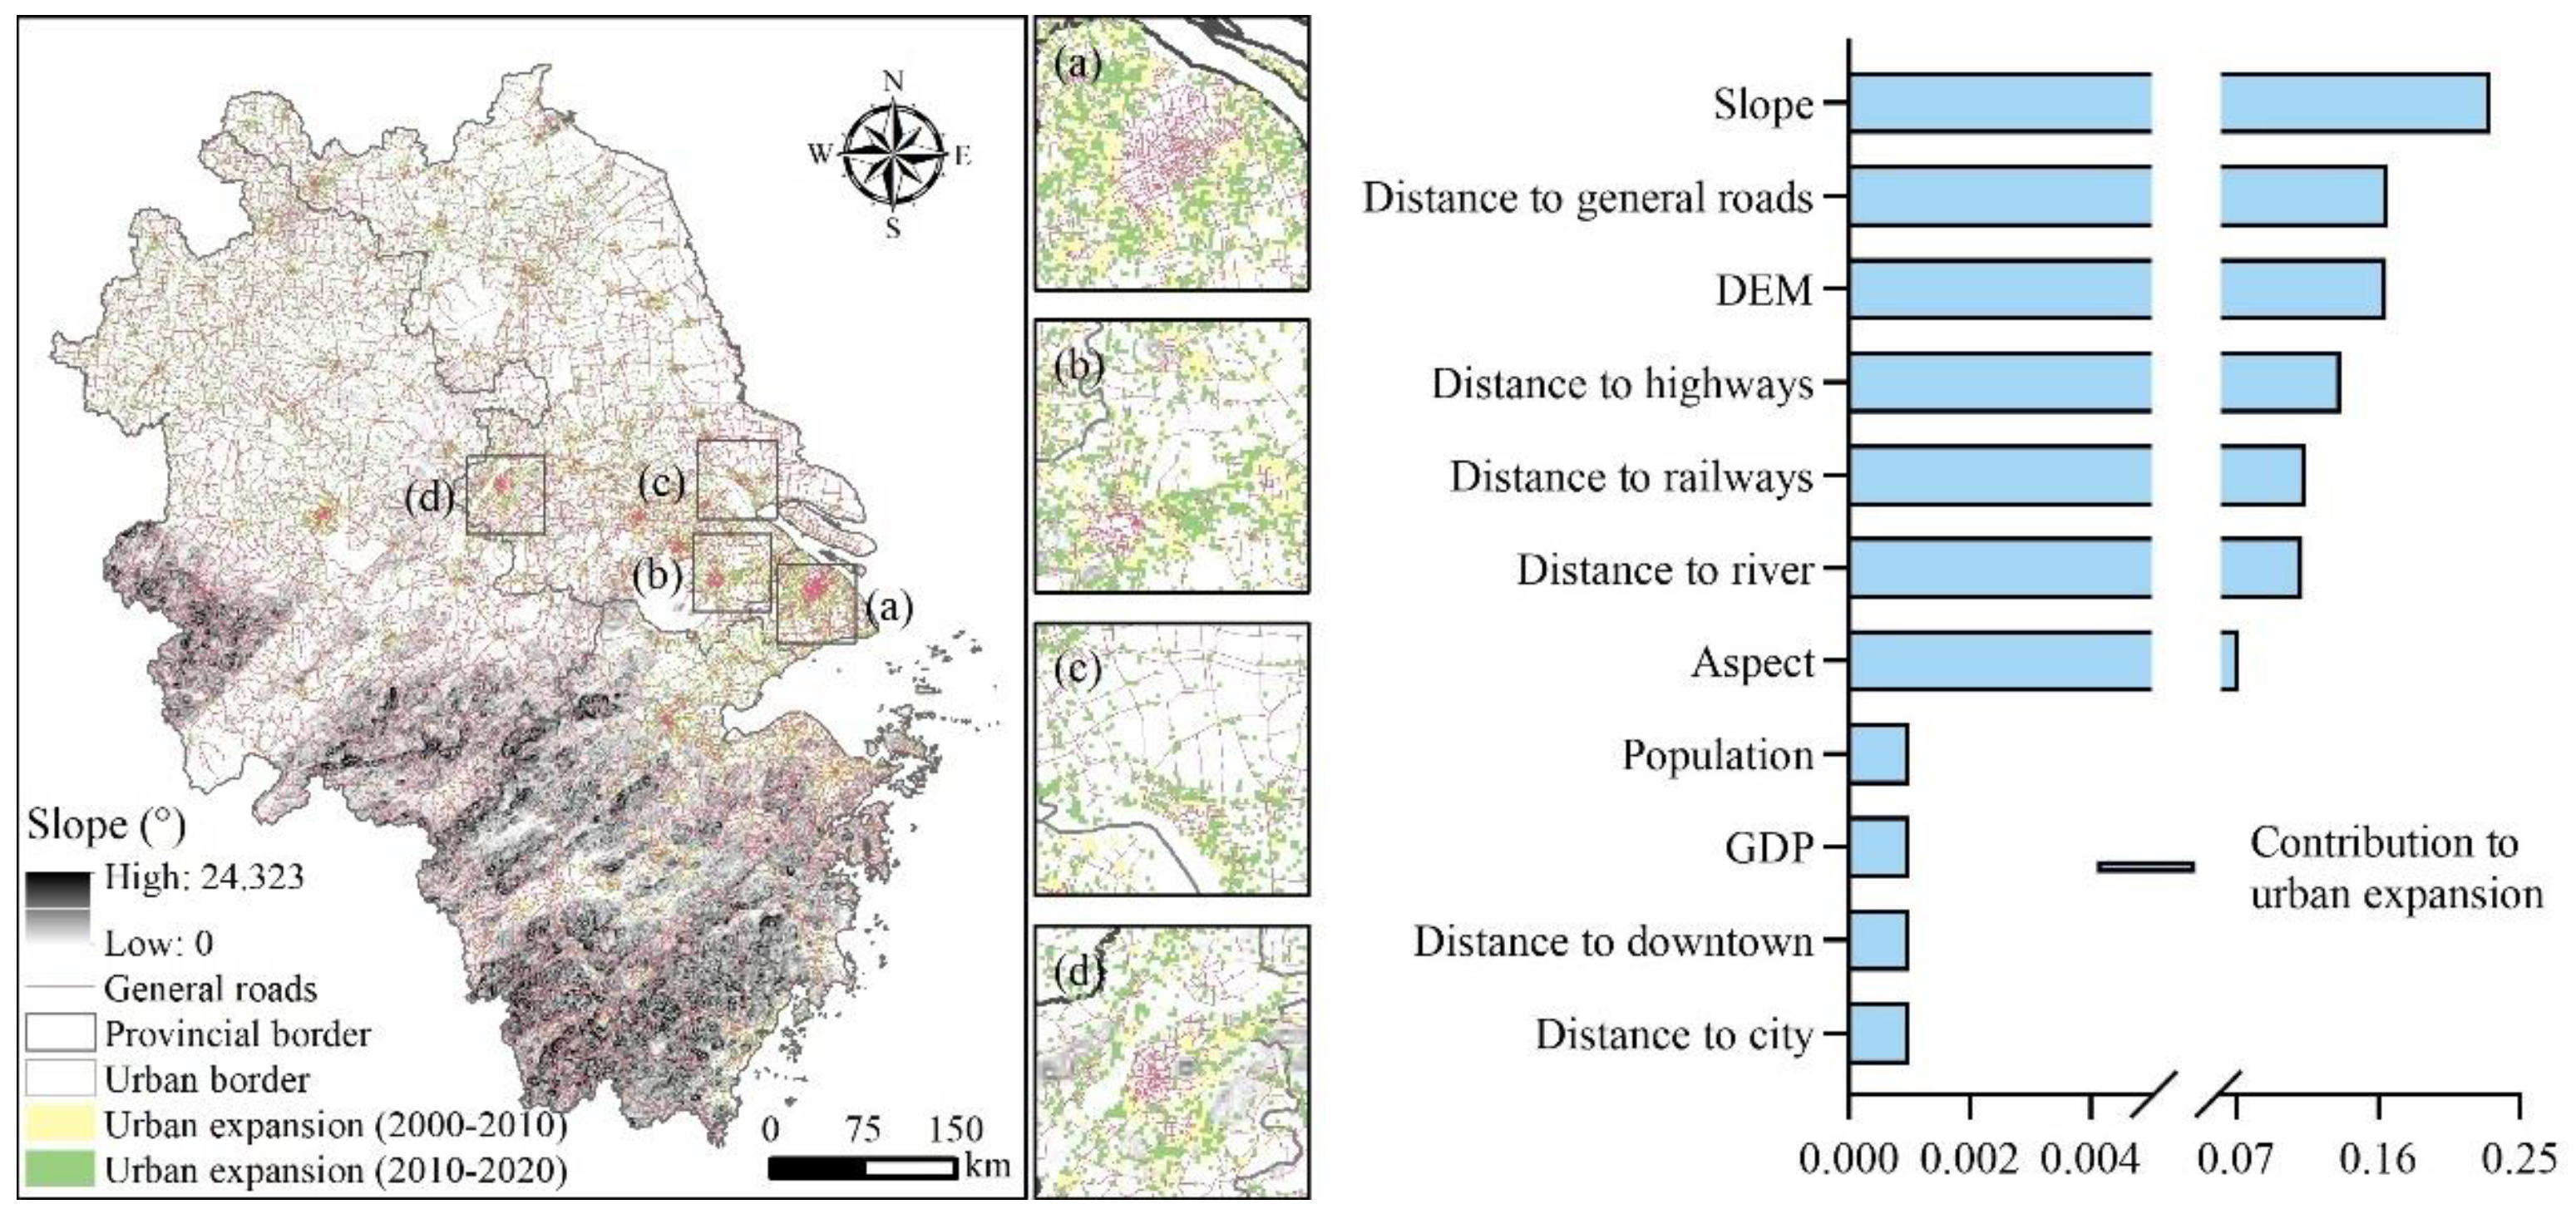
2.1. Research Area

The YRD is located at the “T” junction along the river and coast of China (114°54′–122°12′ E, 27°02′–35°08′ N), with an area of approximately 350,396.447 km2, accounting for 3.65% of China’s total area (Figure 1). The topography shows a trend of high elevation in the southwest and low elevation in the northeast, with elevations ranging from −210 to 1921 m, and mountains, hills, and plains are distributed sequentially. The YRD is located at the intersection of warm temperate and southern and northern subtropical monsoon climates, with an annual average temperature of 13.6–18 °C, an annual precipitation of 704–2000 mm, and the highest density of river networks in China, providing the region with ideal water and heat conditions. The area has complex vegetation composition, high forest cover, and a wide variety of soil types. The region includes Shanghai, Jiangsu (Nanjing, Suzhou, Nantong, etc.), Zhejiang (Hangzhou, Ningbo, Wenzhou, etc.), and Anhui (Hefei, Wuhu, Chuzhou, etc.) provinces. In 2020, the GDP of the YRD was CNY 24,471.353 billion, and the resident population was 235.386 million.

2.2. Data Sources

The land use data of the YRD were reclassified into six categories: cropland, woodland, grassland, waterbody, built-up land, and unused land by referring to the land resource classification [23]. Natural and socioeconomic factors are drivers of land use change. The natural factors include elevation, slope, and aspect. Digital Elevation Model (DEM) data were obtained by incorporating auxiliary data from ASTER GDEM, ICESat GLAS, and PRISM datasets into STRM data and reprocessing them to a spatial resolution of 30 m. Slope and aspect data were obtained using ArcGIS software to analyze the slope and aspect based on DEM data. Socioeconomic factors included GDP, population, and basic geographic information. The basic geographic information data were the distances from general roads, highways, railways, rivers, cities, and downtowns, which were calculated using the Euclidean distance method. To ensure consistency, the above data were all used in a unified Universal Transverse Mercator (UTM), and the image element sizes were resampled to 1000 m (Table 1).

2.3. Research Methods

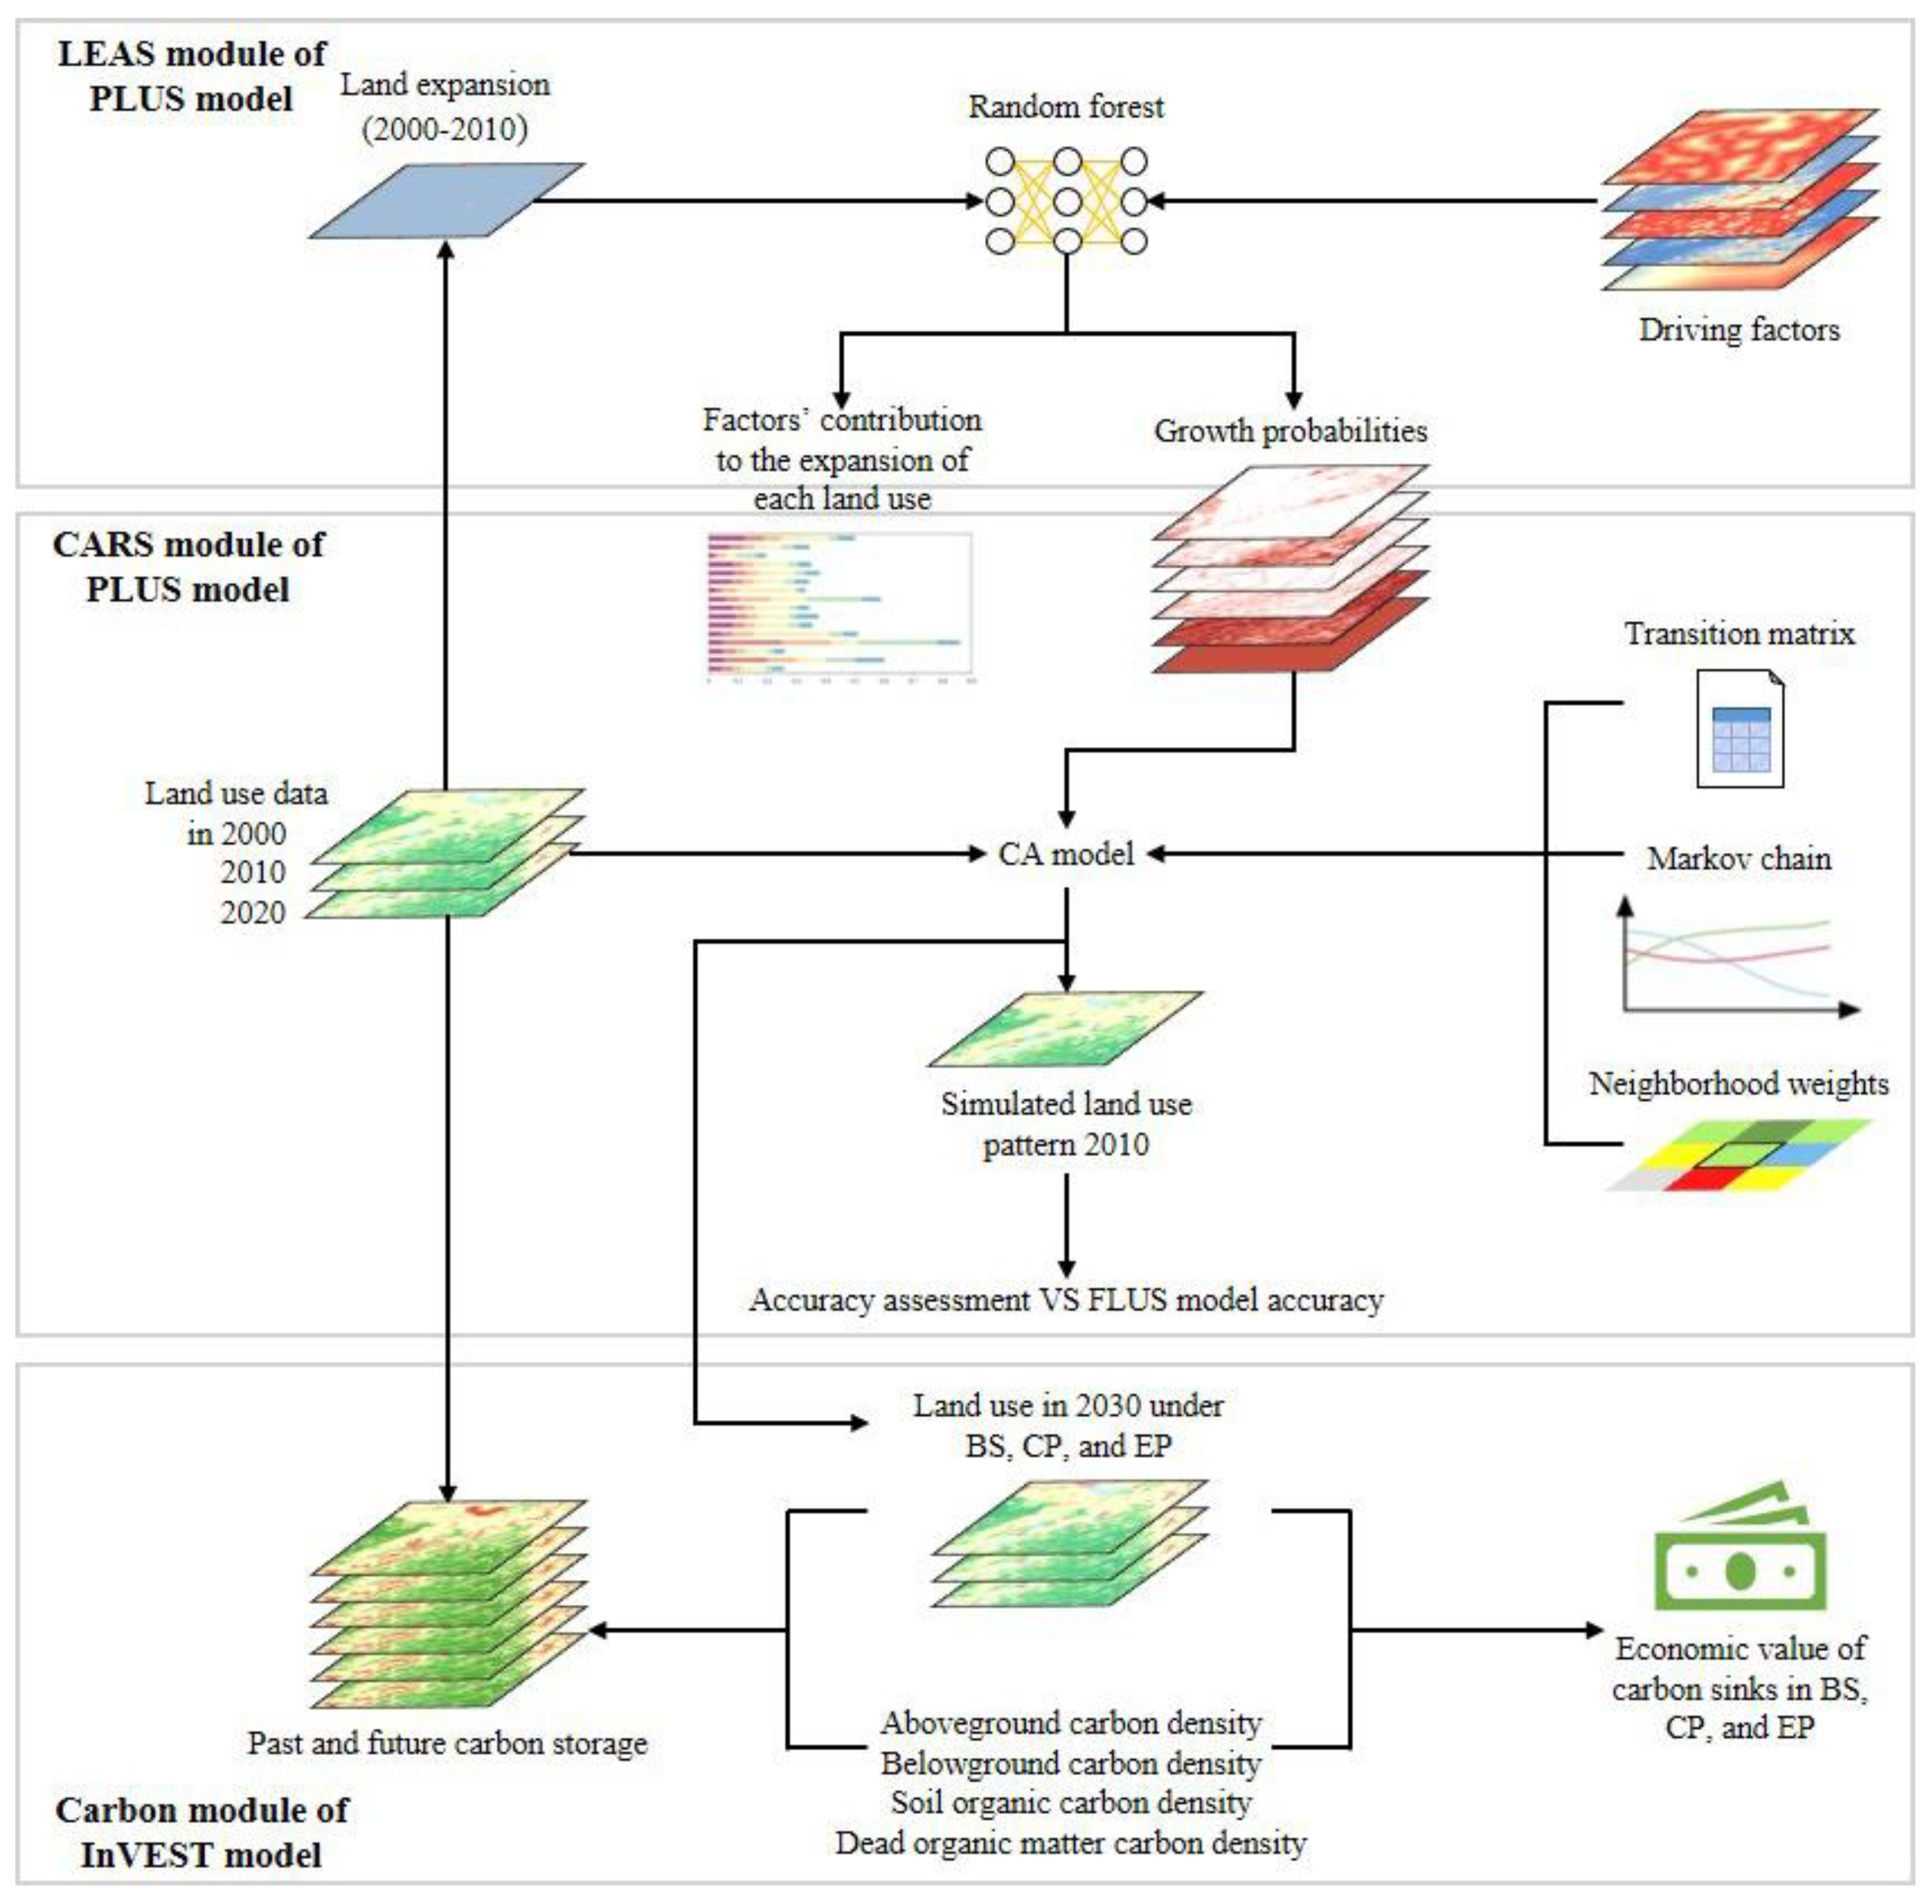
2.3.1. Research Framework

In this study, a coupled model consisting of LEAS and CA based on multiple random seed (CARS) modules of the PLUS model and the carbon module of the InVEST model was constructed to simulate urban expansion in the YRD and its impact on TCS (Figure 2). The overall experimental process was as follows: First, land use data for 2000 and 2010 were input into the PLUS model, and the extracted land use expansion data from 2000 to 2010 were used along with the data of the 11 driving factors to calculate the contribution rate of the driving factors and the growth probabilities of each land use type using the random forest method. Second, the 2000 land use data, growth probabilities of each land use type, transition matrix, neighborhood weights, and land demand derived from the Markov chain were incorporated into the CARS module, and the CA model was applied to simulate the 2010 land use data. The simulation accuracy was compared to that of the FLUS model to verify whether the PLUS model obtained a higher simulation accuracy. The above parameters and adjusted parameters were used to simulate land use under three scenarios in 2030: baseline scenario (BS), cropland protection scenario (CP), and ecological protection scenario (EP). Finally, the past and future TCS and the economic value of carbon sinks were calculated by combining the land use data of different periods and four types of carbon density data using the carbon module of the InVEST model. Urban expansion and the changes in TCS caused by it were then processed, handled, and analyzed using ArcGIS software to obtain the final result.

2.3.2. Urban Expansion Simulation Based on PLUS Model

The PLUS model is a model for patch generation land-use change simulation developed by the HPSCIL@CUG development team at the China University of Geosciences [24]. It includes two main modules, LEAS and CARS.
The LEAS module calculates the development probability of each type of land use by extracting land-use expansion data using the random forest algorithm, and it analyzes the contribution rate of the drivers of land use expansion [25]. The specific formula for the random forest algorithm is:
P i , k d ( x ) = n = 1 M I ( h n ( x ) = d ) M
where P i , k d ( x ) is the probability of growth of land-use type k in spatial cell i, function I is the indicator function of the decision tree, and hn(x) is the prediction type of the nth decision tree. A d of 1 indicates that there is a transition from other land classes to land class k, and a d of 0 indicates any other land use conversion that does not include land class k.
The CARS module simulates the automatic generation of patches in a spatio-temporal dynamic manner under the constraints of development probabilities of various types of sites combined with random seed generation and threshold-decreasing mechanisms [26]. The formula is as follows:
OP i , k d = 1 , t = P i , k d × Ω i , k t × D k t
where OP i , k d = 1 , t is the integrated probability that spatial cell i is in transition to ground class k at moment t, Ω i , k t is the domain effect of cell i, which is the proportion of land use components of land class k that are covered in the next domain, and D k t is the effect of future demand on land class k. The future demand for each land-use type was predicted using the Markov Chain module [27]. The parameters of the neighborhood weights were obtained by debugging the model based on previous research results and combining the expansion area share of each land type in the YRD from 2000 to 2010 [17,24]. In the land use transition matrix, 1 means conversion is allowed, and 0 means conversion is restricted (Table 2).
To ensure that the fitting accuracy of the PLUS model met the research requirements, the same data were input into the FLUS and PLUS models for comparison and validation. The results showed that the fitting accuracy of the PLUS model was higher, with a Figure of Merit (FOM) coefficient of 0.237 compared to 0.178 or the FLUS model, indicating that the use of the PLUS model for land change simulation in the study area is more reasonable than the FLUS model. The obtained kappa coefficient was 93.3%, and the overall accuracy (OA) was 95.6%. Generally, urban land, rural settlements, and others constitute built-up land. Influenced by China’s unique national conditions, along with economic development, a large-scale work force is clustered in urban areas, resulting in a rapid outward spreading of urban land, while rural land shows idle or shrinking status. Therefore, for the convenience of model simulation, all construction land was considered urban land.
This study referred to the outline of the YRD Regional Integrated Development Plan (2019–2035), YRD City Cluster Development Plan (2015–2030), YRD Regional Ecological and Environmental Co-protection Plan (2021–2035), and previous related studies [13,19] to set up three future scenarios: (1) BS: Based on the important parameters simulated in 2010, the land use pattern of the YRD under the historical trend was estimated by combining the land use demand in 2030 obtained from the Markov chain projection (Table 3). (2) CP: Based on the principles of national food security and social stability, guarding the red line of cropland, eliminating urban sprawling development, and improving intensive land use. Therefore, the transfer probability of cropland to built-up land was reduced by 30% compared to BS, and this was added to cropland. (3) EP: The YRD is not only the leading economic and social development in China but is the pioneer area for ecological protection. After more than 40 years of sloppy development methods, environmental pollution and ecological damage are serious, and the YRD urgently needs to promote sustainable economic development by transforming land use (protecting ecological land) and adjusting the corresponding parameters. Under the EP, the transfer probability of cropland to built-up land was reduced by 30% compared to CP, and the reduction was added to the conversion of cropland to woodland. The transfer probability of grassland and woodland to built-up land was reduced by 40% compared to CP, and this was added to grassland and woodland, respectively.

2.3.3. TCS Estimation Based on InVEST Model

The InVEST model provides a scientific basis for decision makers to weigh the benefits and impacts of human activities by simulating changes in the quantity and value of ecosystem services under different land cover scenarios [11]. The carbon module can estimate TCS based on LULC data, which can generally be divided into four basic carbon pools: aboveground carbon storage (AGC), belowground carbon storage (BGC), soil organic carbon storage (SOC), and dead organic matter carbon storage (DOC). The calculation formula is as follows:
S total = S above + S below + S soil + S dead
where Stotal is the total TCS (Tg=106 t), and Sabove, Sbelow, Ssoil and Sdead are AGC, BGC, SOC, and DOC, respectively.
Previous studies have shown that carbon density within a region varies significantly by land type [11,24,28,29]. Therefore, this study developed an LCRV carbon density measurement method. In this method (1) “Literature” refers to the collection of national level soil organic carbon density data through the literature; (2) “Correction” means to use the carbon density correction formula to modify the data to the actual soil organic carbon density in the YRD; (3) “Ratio” refers to the measurement of the remaining three carbon densities (aboveground carbon density, belowground carbon density, and dead organic matter carbon density) in the YRD with the help of carbon pool biomass ratio-carbon conversion rate [30,31,32]; (4) “Verification” refers to the selection of data (273 sampling points) from the “dataset of carbon density in Chinese terrestrial ecosystems (2010s)” created by Xu et al. [33] in the same latitude and longitude location as the YRD to verify the four types of carbon density, of which the results showed that the measured carbon density data were within their range and consistent with the regional reality (Table 4). The soil organic carbon density correction equation and carbon pool biomass ratio-carbon conversion rate equation were as follows:
C sp = 3 . 3968 × MAP + 3996 . 1
K sp = C sp 1 / C sp 2
C tc = C c _ above / 0 . 157 = C c _ below / 0 . 103 = C c _ soil / 0 . 72 = C c _ dead / 0 . 02
C tW = C W _ above / 0 . 217 = C W _ below / 0 . 043 = C W _ soil / 0 . 72 = C W _ dead / 0 . 02
C tg = C g _ above / 0 . 118 = C g _ below / 0 . 142 = C g _ soil / 0 . 72 = C g _ dead / 0 . 02
C tw = C w _ above / 0 . 025 = C w _ below / 0 . 045 = C w _ soil / 0 . 9 = C w _ dead / 0 . 03
C tb = C b _ above / 0 . 175 = C b _ below / 0 . 035 = C b _ soil / 0 . 79
C tu = C u _ above / 0 . 217 = C u _ below / 0 . 043 = C u _ soil / 0 . 72 = C u _ dead / 0 . 02
where Csp is the soil organic carbon density (t/hm2) obtained by correcting the average annual rainfall; Ksp is the soil organic carbon density correction coefficient; MAP is the average annual rainfall (mm) of 628, 640.1, 649, 1201, and 1283.403 mm for China, Beijing, Shaanxi, Wuhan, and YRD, respectively; Ctc, CtW, Ctg, Ctw, Ctb, and Ctu are the total carbon densities of cropland, woodland, grassland, waterbody, built-up land, and unused land, respectively; and Cabove, Cbelow, Csoil, and Cdead are the aboveground, belowground, soil, and dead organic matter carbon densities, respectively, for each type of land use.

3. Results and Discussion

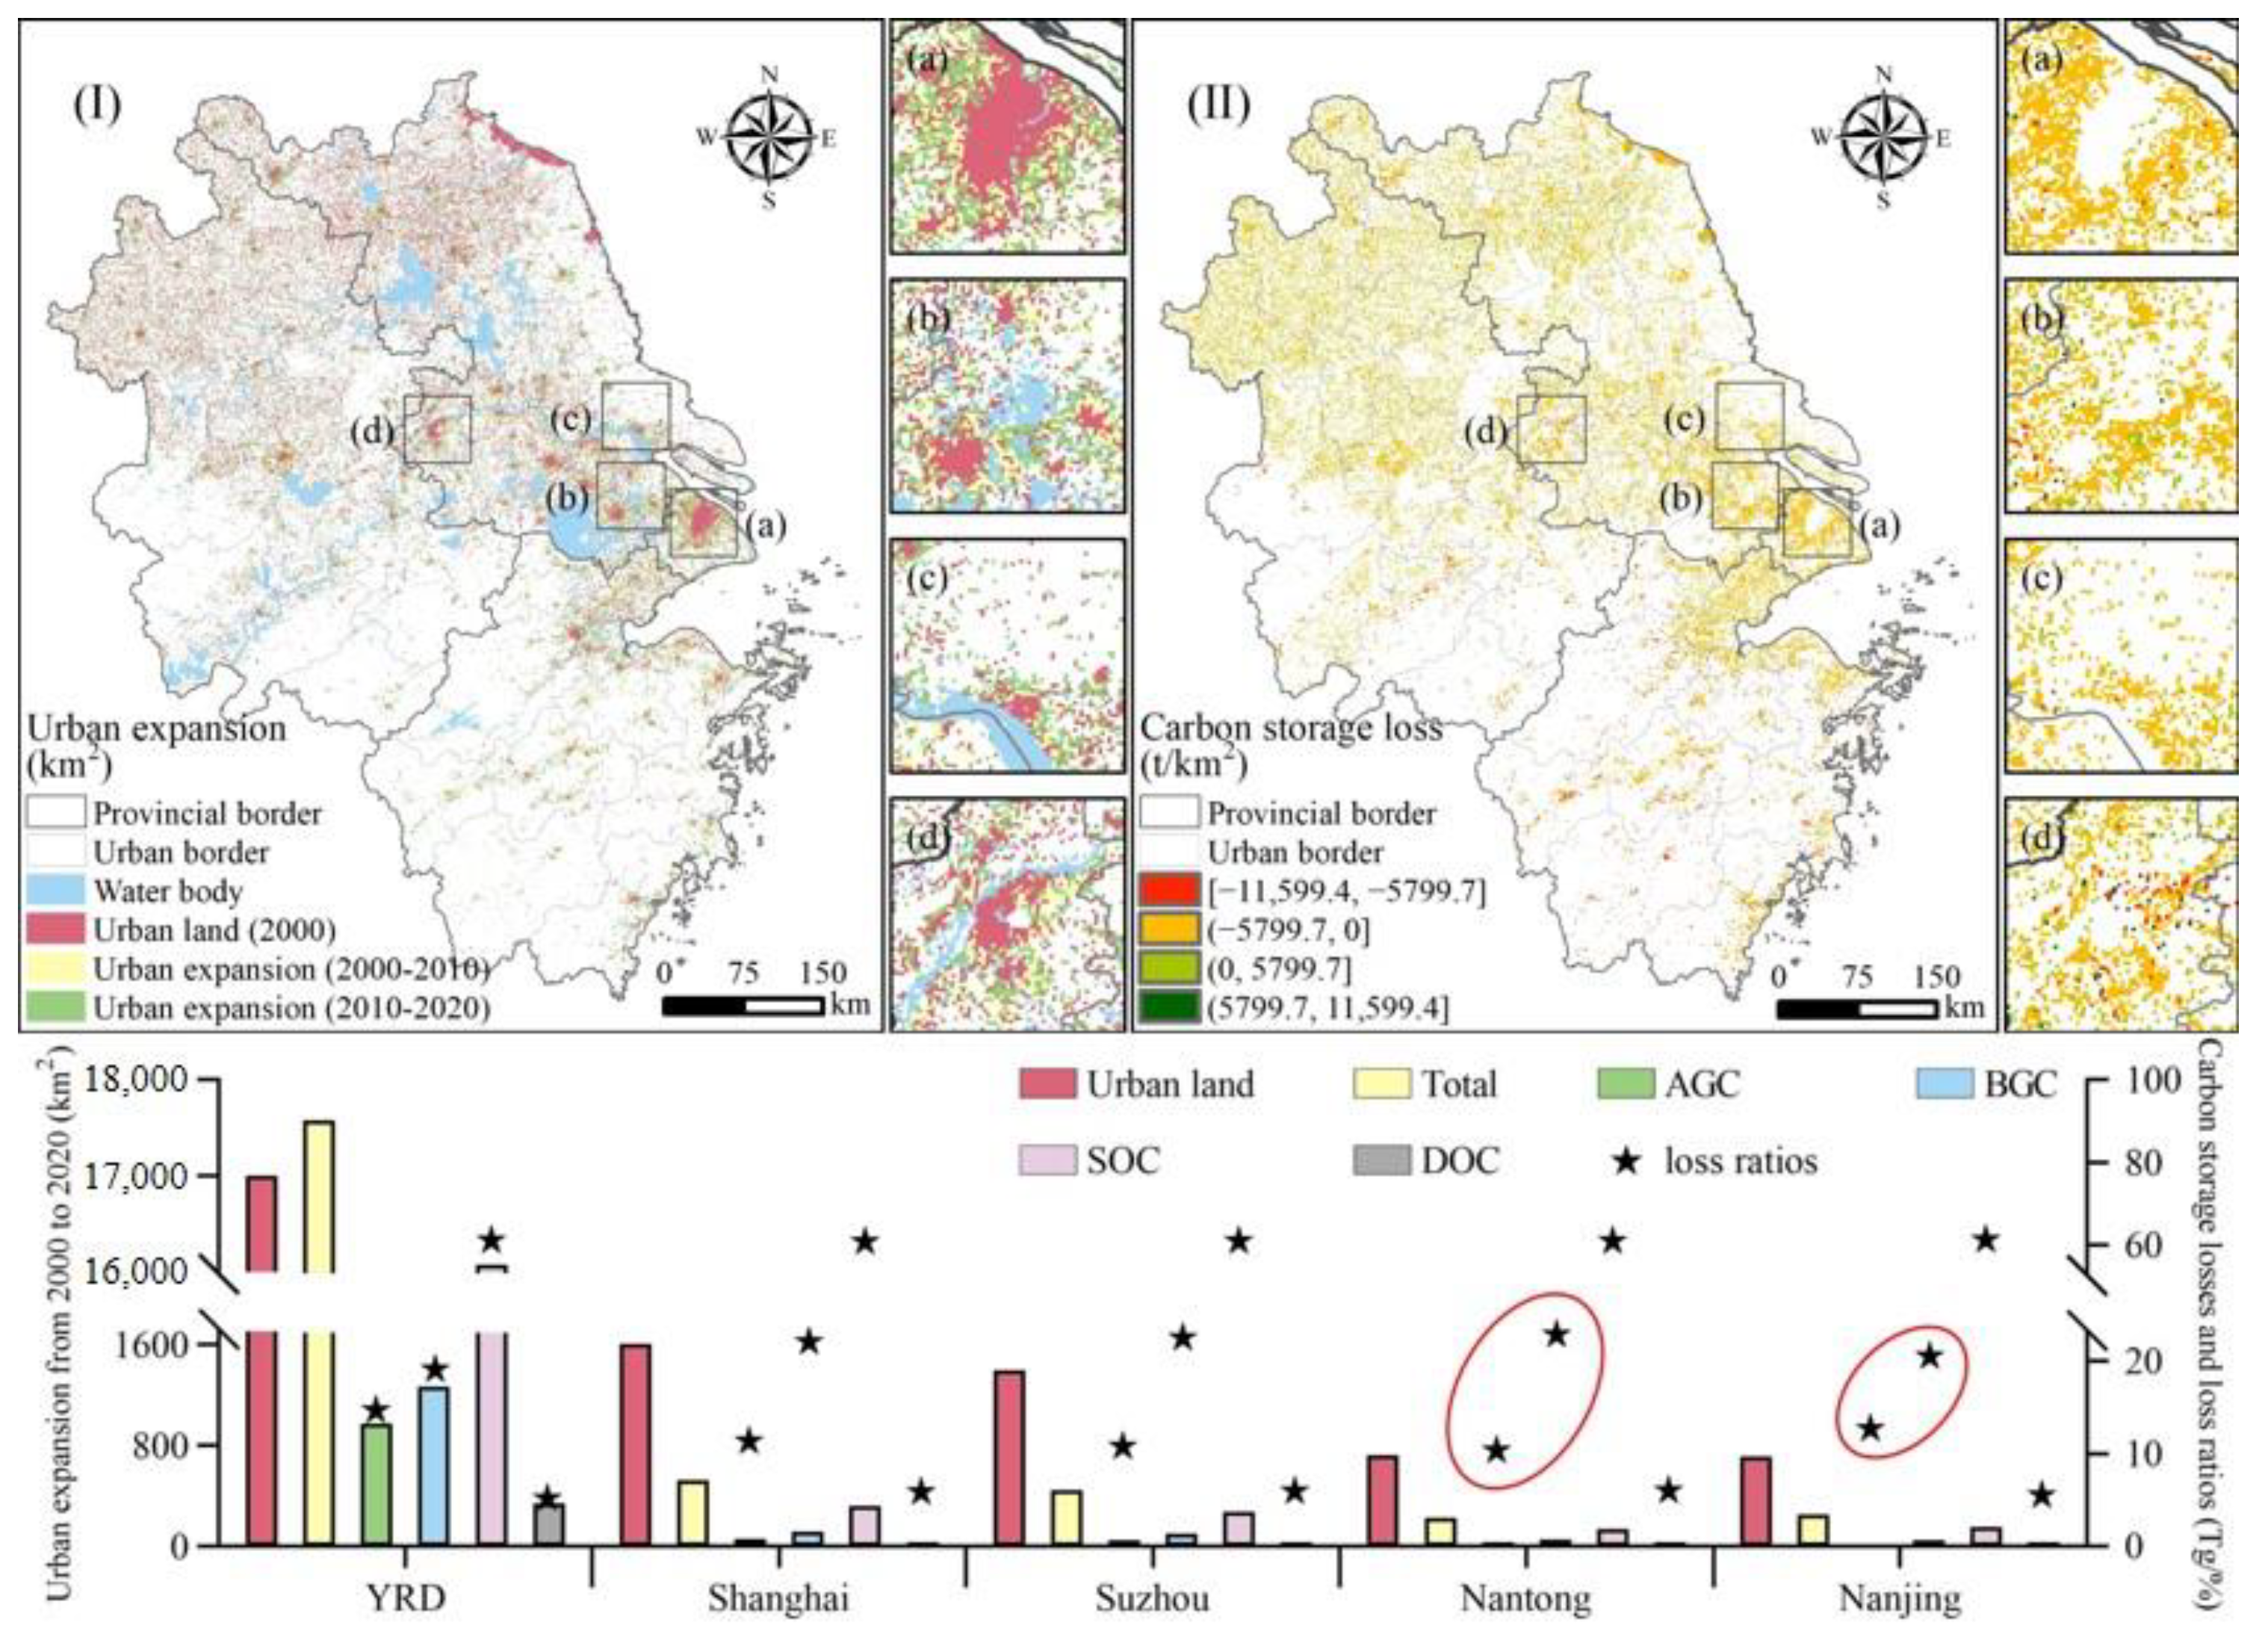
3.1. Dynamic Evolution of Urban Land Expansion and TCS in the YRD from 2000 to 2020

From 2000 to 2020, the YRD experienced large-scale urbanization acceleration, which was most evident in the riverine and coastal cities (Figure 3I). The urban land area of the YRD increased from 30,138 km2 (8.660% of the total area of the YRD) in 2000 to 36,929 km2 in 2010 and 47,138 km2 (13.545% of the total area of the YRD) in 2020, an increase of 0.564. The expansion of urban land accelerated significantly throughout the study period, with an increase of 6791 km2 from 2000 to 2010 (average annual growth rate of 2.053%) and 10,209 km2 from 2010 to 2020 (average annual growth rate of 2.471%). Shanghai’s urban land area increased from 1397 km2 (20.406% of Shanghai’s total area) in 2000 to 3000 km2 (43.821% of Shanghai’s total area) in 2020, and the expansion of the urban land area occupied almost 1/4 of the total urban area. The urban land areas of Suzhou, Nantong, and Nanjing increased by 1397, 722, and 714 km2, respectively, with average annual growth rates of 4.355, 4.533, and 2.668%, respectively.
Urban expansion leads to increasing TCS losses, most of which occur in soil (Figure 3II). From 2000 to 2020, the YRD lost 90.189 Tg of TCS. Among the four carbon pools, SOC decreased by 55.13 Tg, accounting for 61.127% of TCS loss, while AGC, BGC, and DOC decreased by 13.208, 17.216, and 4.635 Tg, accounting for 14.645, 19.089, and 5.139% of TCS loss, respectively. Shanghai’s TCS declined by 7.149 Tg, accounting for 7.927% of the TCS loss in the YRD. The TCS loss in all four carbon pools was higher than that in the remaining three case areas. Heterogeneity was observed in the proportion of TCS lost from the four carbon pools in different regions. Nanjing’s TCS decreased by 3.437 Tg, which was slightly larger than that of Nantong (3.112 Tg). The proportion of AGC loss in Nanjing (12.656%) was higher than that in Nantong (10.312%), whereas the proportion of BGC loss in Nanjing (20.502%) was lower than that in Nantong (22.812%). This stems from the fact that different types of land have been transformed into urban land during urban land expansion. Nanjing encroached on a large amount of woodland in the process of urban land expansion, resulting in increased AGC loss. In contrast, Nantong converted a large area of water bodies into urban land, resulting in increased BGC loss.

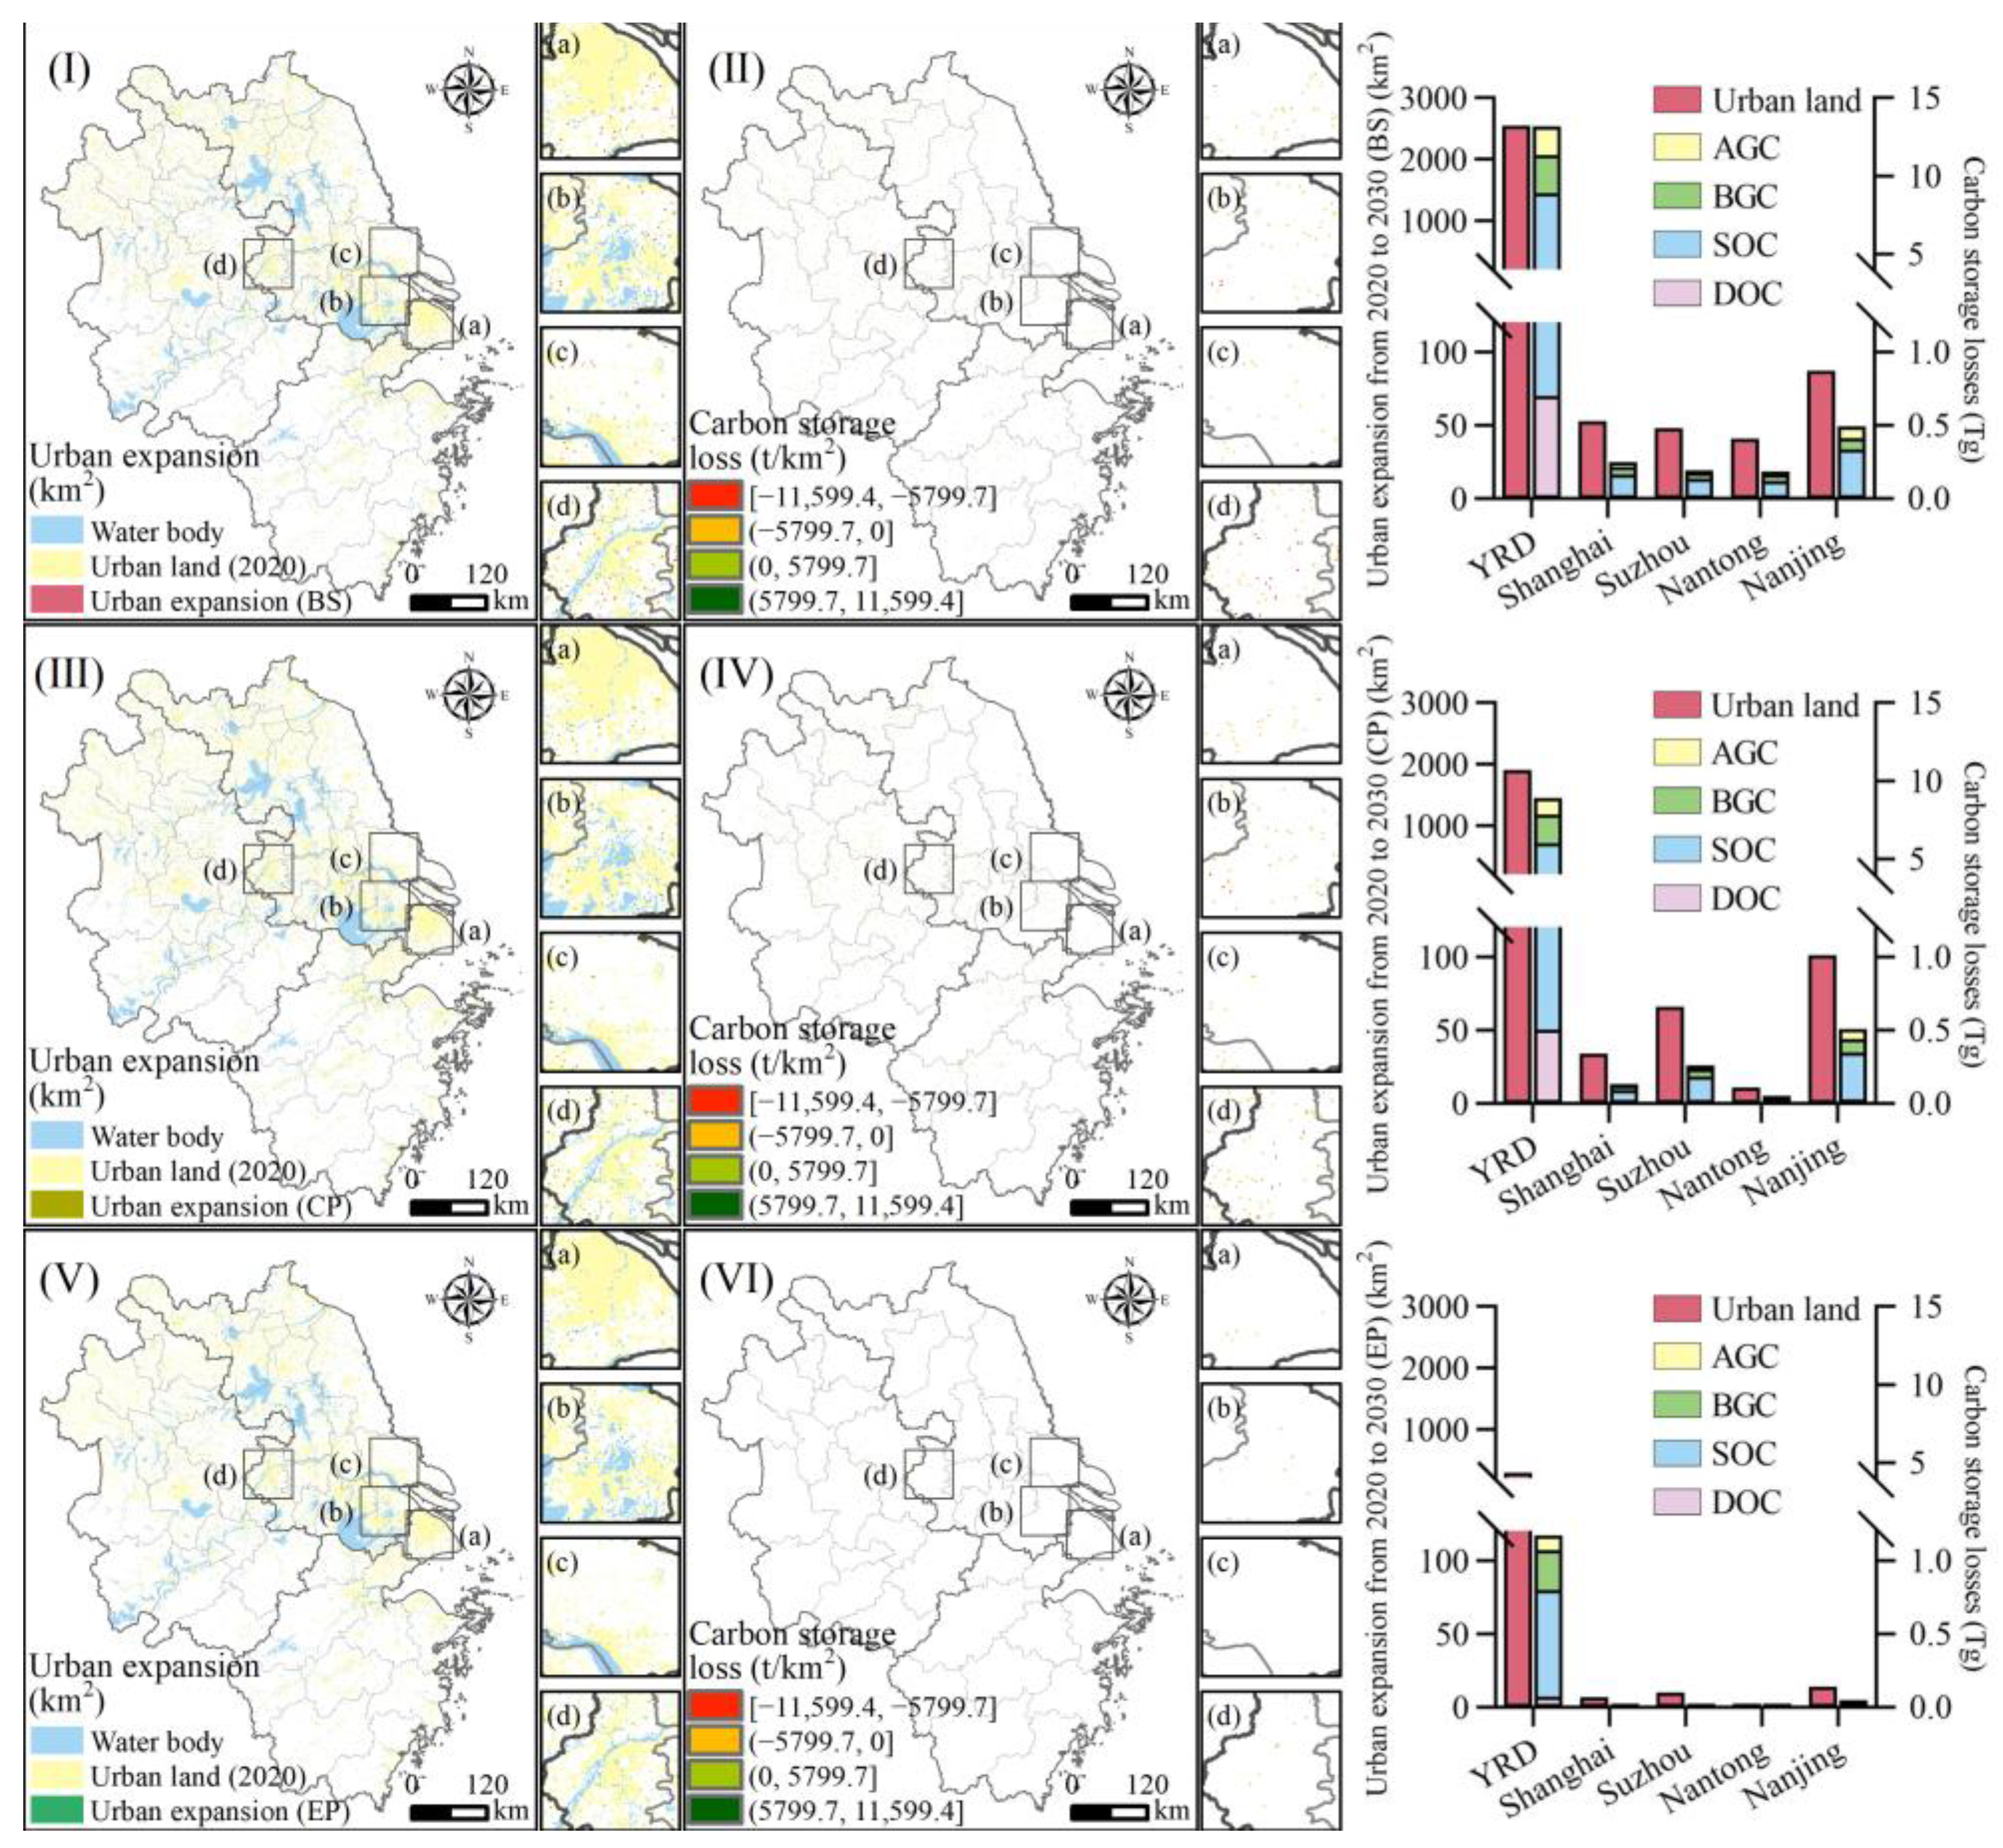
3.2. Simulation Projections of Land Use and TCS in the YRD in 2030 under Different Scenarios

Under the BS, the rates of urban expansion and TCS loss in the YRD declined significantly (Figure 4I,II). Under this scenario, the urban land area of the YRD in 2030 was 49,688 km2 (14.278% of the total area of the YRD), showing an average annual growth rate of 0.528% from 2020 to 2030. Compared to 2000–2020, the loss of TCS slowed to 13.194 Tg, among which the loss of SOC was the most serious, accounting for 62.271% of the total TCS reduction. In contrast, the loss of DOC was the lowest at 0.699 Tg, accounting for only 5.298% of the loss. The rate of land expansion slowed in all cities, with Shanghai, Suzhou, Nantong, and Nanjing increasing their urban land areas by 53, 48, 41, and 87 km2, respectively. Nanjing had a relatively larger urban land expansion area, and will lose much more TCS than the other three cities in 2030, at 0.493 Tg. AGC, BGC, SOC, and DOC decreased by 0.081 Tg, 0.074 Tg, 0.313 Tg, and 0.025 Tg, respectively.
Compared to BS, the rates of urban expansion and TCS loss were further reduced under CP (Figure 4III,IV). The urban land area of the YRD in 2030 is expected to be 49,045 km2 (14.093% of the total area of the YRD), with an average annual growth rate of 0.397% from 2020. Ecosystem function degradation would be mitigated in this scenario, with only 8.909 Tg of TCS lost. For the four carbon pools, the proportion of TCS loss was similar to that under BS and was, from highest to lowest, SOC (61.814%), BGC (20.462%), AGC (12.044%), and DOC (5.68%). The urban land expansion area of Shanghai decreased significantly, which was slightly higher than that of Nantong but significantly lower than that of Suzhou and Nanjing. Shanghai’s urbanization process began early and developed rapidly. After 2020, the land types were mainly built-up land and cropland, with little change in urban land use, as cropland protection limited encroachment on cropland. The TCS loss in Shanghai in 2030 is 0.135 Tg, and the losses of the four carbon pools are only 0.01, 0.032, 0.084, and 0.009 Tg, respectively.
Under EP, the YRD showed the lowest loss of urban expansion area and TCS (Figure 4V,VI). The urban land area of the YRD expanded to 47,433 km2 (13.63% of the total area of the YRD) by 2030, with an average annual growth rate of 0.062% from 2020 to 2030. The urban expansion area was significantly reduced, and the TCS loss was only 1.17 Tg. Moreover, owing to the strict control of the conversion of ecological land, such as woodland and grassland, to urban land, the proportion of AGC loss in the EP decreased by 5.414% compared to that under BS. Suzhou and Nantong did not experience significant urban expansion, growing by only 10 and 0 km2, respectively. The loss of TCS in Suzhou in 2030 was 0.02 Tg, with AGC increasing by 0.003 Tg due to the conversion of only a small amount of cropland and waterbody to urban land and BGC, SOC, and DOC experiencing losses of 0.006, 0.015, and 0.002 Tg, respectively.

3.3. Main Reasons for the Decline of TCS during Urban Expansion in the YRD

To analyze the main causes of TCS loss during urban expansion in the YRD, this study used the LEAS module of the PLUS model and the land-use transfer matrix to explore the drivers of urban land growth and the main causes of TCS loss, respectively.
The slope, transportation arteries (general roads, highways, and railways), and rivers were the main drivers of urban expansion in the YRD (Figure 5). This study used the LEAS module to reveal the potential drivers of urban expansion and the strengths of their contributions. Slope had the greatest impact on urban expansion, with a contribution of 0.231, followed by distance to general roads, DEM, distance to highways, distance to railways, and distance to rivers, with contributions of 0.166, 0.165, 0.136, 0.114, and 0.112, respectively. These results indicated that additional urban land was mainly distributed around transportation arteries with gentle topography and adjacent to the old city, which was verified by Dadashpoor et al. [34] and Liang et al. [24], who studied the Tehran Metropolitan Region (TMR) and Wuhan, respectively. Osman et al. [35] divided the Giza Governorate of the Greater Cairo Metropolitan Region (GCMR) into three parts according to the stage of urbanization and used a questionnaire to indicate that economic incentives, population increases, and administrative functions that were the most influential forces for urban expansion in the central, northern, and southern parts of the city, respectively.
Cropland occupation was the main cause of TCS loss in the YRD region (Table 5). The urban land transfer matrix revealed that the amount of urban land transfer in the YRD from 2000 to 2010 was small, but that from 2010 to 2020 was significant. From 2000 to 2020, 15,525 km2 of cropland was converted to urban land, accounting for 91.324% of the new urban land. This directly led to a TCS loss of 72.474 Tg, accounting for 81.156% of the total TCS loss, which differed from the 63.73% reported by He et al. [11] in Beijing, mainly because of the different proportions of each land type from those in the YRD. In addition, 1352 km2 of woodland and 157 km2 of grassland were converted to urban land, resulting in TCS losses of 15.682 and 1.105 Tg, respectively. The TCS of the water bodies and unused land remained largely unchanged. The natural resource endowments and socioeconomic development of different countries are heterogeneous; therefore, the carbon density and land use transfer are different. Li et al. [36] and Hutyra et al. [37] found that deforestation caused 5.0 ± 3.6 and 1.2 t/hm2 of TCS loss and was the main cause of TCS loss in the Amazon region and Seattle metropolitan area, respectively. Together, these findings show that when urban expansion occurs along the direction of gentle slopes, transportation arteries (general roads, highways, and railways), and rivers, the majority of the occupied land is cropland with a high carbon density, which leads to a serious loss of TCS.

3.4. Practical Implications

Carbon sinks have huge economic benefits and can effectively mitigate the loss of carbon sink value under CP and EP conditions. Similar to She et al. [38] and Carr et al. [39], this study used the InVEST model to assess the loss of economic value of carbon sinks owing to urban expansion in different scenarios. Three important parameters were required for the evaluation process: (1) the social cost of carbon emissions, which, according to Ricke et al. [40], was set as USD 24/t; (2) the market discount rate of the economic value of carbon sinks, which was set at 10%, as used in the evaluation of the project by the Asian Development Bank [41]; and (3) the interannual rate of change in the social cost of carbon emissions, which was set at 0 with reference to available research results [42]. The results under BS found that the economic value of the carbon sink reduced by USD 315.221 million with an urban land expansion of 2550 km2 in the YRD; under CP, the area of urban expansion and resulting economic value loss of carbon sink were 1907 km2 and USD 212.853 million, respectively; and under EP, these values were 295 km2 and USD 27.955 million, respectively. Therefore, with the slowdown of urban expansion under CP and EP, it is possible to reduce the economic losses from the loss of carbon sinks by USD 102.368 and 287.266 million, respectively.
In the context of global warming, future urban expansion of the YRD will further aggravate the loss of TCS and pose a serious threat to the achievement of China’s ‘double carbon’ target. TCS are highly vulnerable to climate change and human activity [43]. Prietzel et al. [44] found that carbon loss from deep soils due to global warming far exceeds the increase in plant biomass and carbon storage in litter, which causes a decline in total TCS and a further increase in global temperatures. In addition, urban expansion directly affects TCS and indirectly affects anthropogenic carbon emissions [45]. Chuai et al. [46] argued that human activities associated with anthropogenic carbon emissions always make land a carrier. This study measured regional carbon emissions based on carbon emission factors provided by the Intergovernmental Panel on Climate Change (IPCC) and found that urban land is where carbon emissions are most concentrated and intense, and promoting intensive land use can effectively mitigate the greenhouse effect. Since 2017, China’s economy has moved to a stage of high-quality development, and ecological environmental protection has received unprecedented attention and has gradually been integrated into all areas and aspects of economic and social development. In 2020, China set a strategic goal of reaching peak carbon emissions by 2030 and achieving carbon neutrality by 2060 [47]. However, the carbon emission effect of future urban land expansion in the YRD will add to the pressure on China to reduce carbon emissions and may undermine the “low carbon city” development concept and China’s commitment to the Paris Climate Agreement.
Therefore, there is an urgent need to establish a regional development plan based on ecosystem services. The loss of carbon sinks due to urbanization is not unique to the YRD. Wang et al. [41] found that, under a natural development scenario, Wuhan’s urban expansion will result in a direct loss of USD 26.5 million through carbon sink value loss by 2035. At the same time, urban expansion is a serious threat to many other ecosystem services. For example, Yuan et al. [48] found that China’s economic development has been highly dependent on increased urban land area and quantified the value loss of five ecosystem services (food production, water conservation, climate regulation, habitat support, and cultural service) during urbanization in China and found a total loss of USD 110.95 billion over the last 30 years. Campbell et al. [49] optimized the land use structure of Maryland, USA to reduce the potential loss of seven ecosystem services from increased population and economic development. Ecosystem services are an important resource for human survival and development, and their socio-cultural value should receive more scholarly attention [50]. However, at present, at both national and individual levels, the awareness of protecting ecosystem services is underdeveloped [30]. Therefore, in future regional planning, we should strengthen the protection of ecological land such as cropland and woodland, insist on the “reduction” of inefficient construction land, and establish the concept of “smart growth” and “compact city”.

3.5. Limitations and Future Directions

Dynamic changes in land use refer to changes in land use patterns and utilization levels caused by the interaction of elements in natural and human systems. In this study, 11 types of data, including DEM, slope, GDP, and population, were selected as drivers for simulating the spatial layout of future land use, and multiple models were used for comparison and validation to select the best-fitting results. Despite the high accuracy of the simulation results, the influence of policy factors, such as ecological protection red lines and urban development boundaries, on land use change was not considered. Therefore, to further improve the accuracy of land use simulations, relevant policy factors should be incorporated into the driving factor system in the future. In addition, subsequent studies using remote sensing data with a higher spatial resolution are needed.
The InVEST model is widely used to estimate the functions of ecosystem services (e.g., water production and biodiversity) and their economic value. It has been commonly applied by many researchers worldwide for its advantages of easy operation and visual representation, and it has promoted the progress of research on ecosystem carbon storage services; however, it has some limitations. The model oversimplifies the carbon cycle principle by assuming that carbon density is homogeneous and constant, ignoring that carbon density changes dynamically over time and as the environment changes [51]. Therefore, to improve the accuracy of the assessment results, future studies should supplement and correct carbon density using multi-year and continuous field observation data, and a more detailed land-use classification system should be adopted to compensate for the lack of spatial heterogeneity within land-use types [45].

4. Conclusions

Based on the coupled model of PLUS and InVEST, this study combined the scenario simulation method, LCRV carbon intensity measurement method, and land-use transfer matrix to simulate past and future urban expansion in the YRD and its impact on TCS. An attempt was made to construct a unified accounting standard for carbon density on a large scale, and the drivers and economic values of TCS changes during urban expansion were explored in depth. The main findings were as follows: (1) The urban land area of the YRD expanded 0.564 times from 2000 to 2020 (approximately 17,000 km2), and the expansion rate accelerated significantly with time, with an average annual growth rate of 2.053% from 2000 to 2010 and 2.471% from 2010 to 2020. Meanwhile, the TCS declined significantly, with an annual average reduction of 4.509 Tg. Of the TCS losses, 61.127% occurred in soil. Land conversion and the loss of TCS were particularly prominent in riverine and coastal cities with economic and population centers (Shanghai, Suzhou, Nantong, and Nanjing). (2) The rates of land expansion and TCS loss in the cities of the YRD decreased to different degrees under all three scenarios. Under BS, the urban expansion area was the largest at 2550 km2 and the associated TCS loss was 13.194 Tg. EP had the smallest urban expansion area (295 km2) and lowest TCS loss (1.17 Tg). (3) The slope, transportation arteries (general roads, highways, and railways), and rivers were the main drivers of urban expansion in the YRD, with a combined contribution of 0.924. The main reason for the loss of TCS was the encroachment of croplands by urban land. From 2000 to 2020, 91.324% of the urban expansion land originated from croplands, which directly led to a TCS loss of 72.474 Tg. Carbon sinks have huge economic benefits, and under CP and EP, the economic losses from the loss of carbon sink value can be reduced by USD 102.368 and 287.266 million, respectively, compared to that under BS.
Although we studied the impact of urban expansion on TCS in the YRD using model simulation methods, there were some shortcomings in the study. The effects of policy factors on land-use changes and the fact that carbon density changes dynamically with time and geographical environment changes were ignored. In future studies, policy factors, such as ecological protection red lines and urban development boundaries, should be included in the driving factor system to improve the accuracy of land use simulation. Simultaneously, carbon density should be supplemented and corrected using multi-year and continuous field observation data. These will be explored by land-use planners and environmental science scholars around the world because feeding this information back to urban planning and management departments will help future sustainable urban development.

Author Contributions

Z.M., J.K., and R.Y. contributed to data collection and analysis; X.D. and L.W. designed the research and provided guidance on manuscript writing; Z.M. and Y.W. wrote the manuscript. All authors have read and agreed to the published version of the manuscript.

Funding

This research was supported by the National Key R&D Program of China (2018YFD1100101), National Natural Science Foundation of China (42101318), and Natural Science Foundation of Jiangsu Province, China (BK20200109).

Data Availability Statement

Publicly available datasets were analyzed in this study. These data can be found here: GlobalLand30 (http://www.globallandcover.com/, accessed on 4 July 2022), NASA DEM (https://www.earthdata.nasa.gov/, accessed on 18 July 2022), Resource and Environment Science and Data Center (http://www.resdc.cn/, accessed on 8 October 2022), WorldPop (https://www.worldpop.org/, accessed on 6 September 2022), OpenStreetMap (https://www.openstreetmap.org/, accessed on 15 September 2022), and National Catalogue Service for Geographic Information (https://www.webmap.cn/, accessed on 24 August 2022).

Acknowledgments

We thank the reviewers for their critical and helpful criticism and recommendations, which boosted the quality of this manuscript.

Conflicts of Interest

The authors declare no conflict of interest.

References

  1. Hartley, I.P.; Hill, T.C.; Chadburn, S.E.; Hugelius, G. Temperature effects on carbon storage are controlled by soil stabilisation capacities. Nat. Commun. 2021, 121, 6713. [Google Scholar] [CrossRef]
  2. Güneralp, B.; Reba, M.; Hales, B.U.; Wentz, E.A.; Seto, K.C. Trends in urban land expansion, density, and land transitions from 1970 to 2010: A global synthesis. Environ. Res. Lett. 2020, 154, 044015. [Google Scholar] [CrossRef]
  3. Kadhim, N.; Ismael, N.T.; Kadhim, N.M. Urban Landscape Fragmentation as an Indicator of Urban Expansion Using Sentinel-2 Imageries. Civ. Eng. J. 2022, 89, 1799–1814. [Google Scholar] [CrossRef]
  4. Yan, Y.; Kuang, W.; Zhang, C.; Chen, C. Impacts of impervious surface expansion on soil organic carbon—A spatially explicit study. Sci. Rep. 2015, 5, 17905. [Google Scholar] [CrossRef] [PubMed] [Green Version]
  5. Sun, L.; Chen, J.; Li, Q.; Huang, D. Dramatic uneven urbanization of large cities throughout the world in recent decades. Nat. Commun. 2020, 111, 5366. [Google Scholar] [CrossRef]
  6. Carranza, M.L.; Drius, M.; Malavasi, M.; Frate, L.; Stanisci, A.; Acosta, A.T.R. Assessing land take and its effects on dune carbon pools. An insight into the Mediterranean coastline. Ecol. Indic. 2018, 85, 951–955. [Google Scholar] [CrossRef]
  7. Strohbach, M.W.; Haase, D. Above-ground carbon storage by urban trees in Leipzig, Germany: Analysis of patterns in a European city. Landsc. Urban Plan. 2012, 1041, 95–104. [Google Scholar] [CrossRef]
  8. Vasenev, V.I.; Stoorvogel, J.J.; Leemans, R.; Valentini, R.; Hajiaghayeva, R.A. Projection of urban expansion and related changes in soil carbon stocks in the Moscow Region. J. Clean. Prod. 2018, 170, 902–914. [Google Scholar] [CrossRef]
  9. Sohl, T.L.; Sleeter, B.M.; Zhu, Z.; Sayler, K.L.; Bennett, S.; Bouchard, M.; Reker, R.; Hawbaker, T.; Wein, A.; Liu, S.; et al. A land-use and land-cover modeling strategy to support a national assessment of carbon stocks and fluxes. Appl. Geogr. 2012, 34, 111–124. [Google Scholar] [CrossRef]
  10. Seto, K.C.; Güneralp, B.; Hutyra, L.R. Global forecasts of urban expansion to 2030 and direct impacts on biodiversity and carbon pools. Proc. Natl. Acad. Sci. 2012, 10940, 16083–16088. [Google Scholar] [CrossRef]
  11. He, C.; Zhang, D.; Huang, Q.; Zhao, Y. Assessing the potential impacts of urban expansion on regional carbon storage by linking the LUSD-urban and InVEST models. Environ. Model. Softw. 2016, 75, 44–58. [Google Scholar] [CrossRef]
  12. Wang, Z.; Li, X.; Mao, Y.; Li, L.; Wang, X.; Lin, Q. Dynamic simulation of land use change and assessment of carbon storage based on climate change scenarios at the city level: A case study of Bortala, China. Ecol. Indic. 2022, 134, 108499. [Google Scholar] [CrossRef]
  13. Zhou, L.; Dang, X.; Sun, Q.; Wang, S. Multi-scenario simulation of urban land change in Shanghai by random forest and CA-Markov model. Sustain. Cities Soc. 2020, 55, 102045. [Google Scholar] [CrossRef]
  14. Wu, W.; Luo, X.; Knopp, J.; Jones, L.; Banzhaf, E. A European-Chinese Exploration: Part 2—Urban Ecosystem Service Patterns, Processes, and Contributions to Environmental Equity under Different Scenarios. Remote Sens. 2022, 1414, 3488. [Google Scholar] [CrossRef]
  15. Liang, X.; Liu, X.; Li, X.; Chen, Y.; Tian, H.; Yao, Y. Delineating multi-scenario urban growth boundaries with a CA-based FLUS model and morphological method. Landsc. Urban Plan. 2018, 177, 47–63. [Google Scholar] [CrossRef]
  16. Sohl, T.L.; Claggett, P.R. Clarity versus complexity: Land-use modeling as a practical tool for decision-makers. J. Environ. Manag. 2013, 129, 235–243. [Google Scholar] [CrossRef] [PubMed]
  17. Zhang, S.; Yang, P.; Xia, J.; Wang, W.; Cai, W.; Chen, N.; Hu, S.; Luo, X.; Li, J.; Zhan, C. Land use/land cover prediction and analysis of the middle reaches of the Yangtze River under different scenarios. Sci. Total Environ. 2022, 833, 155238. [Google Scholar] [CrossRef]
  18. Li, M.; Zhang, X.; Pang, G.; Han, F. The estimation of soil organic carbon distribution and storage in a small catchment area of the Loess Plateau. Catena 2013, 101, 11–16. [Google Scholar] [CrossRef]
  19. Jiang, W.; Deng, Y.; Tang, Z.; Lei, X.; Chen, Z. Modelling the potential impacts of urban ecosystem changes on carbon storage under different scenarios by linking the CLUE-S and the InVEST models. Ecol. Model. 2017, 345, 30–40. [Google Scholar] [CrossRef]
  20. Dietz, S.; Hope, C.; Patmore, N. Some economics of ‘dangerous’ climate change: Reflections on the Stern Review. Glob. Environ. Change 2007, 173–174, 311–325. [Google Scholar] [CrossRef]
  21. Yu, Z.; Chen, L.; Li, L.; Zhang, T.; Yuan, L.; Liu, R.; Wang, Z.; Zang, J.; Shi, S. Spatiotemporal Characterization of the Urban Expansion Patterns in the Yangtze River Delta Region. Remote Sens. 2021, 1321, 4484. [Google Scholar] [CrossRef]
  22. Gao, J.; Wang, L. Embedding spatiotemporal changes in carbon storage into urban agglomeration ecosystem management—A case study of the Yangtze River Delta, China. J. Clean. Prod. 2019, 237, 117764. [Google Scholar] [CrossRef]
  23. Wang, L.; Duan, X. High-speed rail network development and winner and loser cities in megaregions: The case study of Yangtze River Delta, China. Cities 2018, 83, 71–82. [Google Scholar] [CrossRef] [Green Version]
  24. Liang, X.; Guan, Q.; Clarke, K.C.; Liu, S.; Wang, B.; Yao, Y. Understanding the drivers of sustainable land expansion using a patch-generating simulation (PLUS) model: A case study in Wuhan, China. Comput. Environ. Urban Syst. 2021, 85, 101569. [Google Scholar] [CrossRef]
  25. Yao, Y.; Liu, X.; Li, X.; Liu, P.; Hong, Y.; Zhang, Y.; Mai, K. Simulating urban land-use changes at a large scale by integrating dynamic land parcel subdivision and vector-based cellular automata. Int. J. Geogr. Inf. Sci. 2017, 3112, 2452–2479. [Google Scholar] [CrossRef]
  26. Zhang, S.; Zhong, Q.; Cheng, D.; Xu, C.; Chang, Y.; Lin, Y.; Li, B. Landscape ecological risk projection based on the PLUS model under the localized shared socioeconomic pathways in the Fujian Delta region. Ecol. Indic. 2022, 136, 108642. [Google Scholar] [CrossRef]
  27. Albasri, N.A.H.; Al-Jawari, S.M.; Al-Mosherefawi, O.J. Prediction of Urban Spatial Changes Pattern Using Markov Chain. Civ. Eng. J. 2022, 84, 710–722. [Google Scholar] [CrossRef]
  28. Tang, X.; Zhao, X.; Bai, Y.; Tang, Z.; Wang, W.; Zhao, Y.; Wan, H.; Xie, Z.; Shi, X.; Wu, B.; et al. Carbon pools in China’s terrestrial ecosystems: New estimates based on an intensive field survey. Proc. Natl. Acad. Sci. USA 2018, 11516, 4021–4026. [Google Scholar] [CrossRef] [Green Version]
  29. Wang, T.F.; Gong, Z.W.; Deng, Y.J. Identification of priority areas for improving quality and efficiency of vegetation carbon sinks in Shaanxi province based on land use change. J. Nat. Resour. 2022, 375, 1214–1232. [Google Scholar] [CrossRef]
  30. Goldstein, J.H.; Caldarone, G.; Duarte, T.K.; Ennaanay, D.; Hannahs, N.; Mendoza, G.; Polasky, S.; Wolny, S.; Daily, G.C. Integrating ecosystem-service tradeoffs into land-use decisions. Proc. Natl. Acad. Sci. USA 2012, 10919, 7565–7570. [Google Scholar] [CrossRef]
  31. Chuai, X.; Huang, X.; Lai, L.; Wang, W.; Peng, J.; Zhao, R. Land use structure optimization based on carbon storage in several regional terrestrial ecosystems across China. Environ. Sci. Policy 2013, 25, 50–61. [Google Scholar] [CrossRef]
  32. Zhang, F.; Zhan, J.; Zhang, Q.; Yao, L.; Liu, W. Impacts of land use/cover change on terrestrial carbon stocks in Uganda. Phys. Chem. Earth Parts A/B/C 2017, 101, 195–203. [Google Scholar] [CrossRef]
  33. Xu, L.; He, N.P.; Yu, G.R. A dataset of carbon density in Chinese terrestrial ecosystems (2010s). China Sci. Data 2019, 41, 86–92. [Google Scholar] [CrossRef]
  34. Dadashpoor, H.; Nateghi, M. Simulating spatial pattern of urban growth using GIS-based SLEUTH model: A case study of eastern corridor of Tehran metropolitan region, Iran. Environ. Dev. Sustain. 2015, 192, 527–547. [Google Scholar] [CrossRef]
  35. Osman, T.; Divigalpitiya, P.; Arima, T. Driving factors of urban sprawl in Giza Governorate of Greater Cairo Metropolitan Region using AHP method. Land Use Policy 2016, 58, 21–31. [Google Scholar] [CrossRef]
  36. Li, Y.; Brando, P.M.; Morton, D.C.; Lawrence, D.M.; Yang, H.; Randerson, J.T. Deforestation-induced climate change reduces carbon storage in remaining tropical forests. Nat. Commun. 2022, 131, 1964. [Google Scholar] [CrossRef] [PubMed]
  37. Hutyra, L.R.; Yoon, B.; Hepinstall-Cymerman, J.; Alberti, M. Carbon consequences of land cover change and expansion of urban lands: A case study in the Seattle metropolitan region. Landsc. Urban Plan. 2011, 1031, 83–93. [Google Scholar] [CrossRef]
  38. She, W.; Wu, Y.; Huang, H.; Chen, Z.; Cui, G.; Zheng, H.; Guan, C.; Chen, F. Integrative analysis of carbon structure and carbon sink function for major crop production in China’s typical agriculture regions. J. Clean. Prod. 2017, 162, 702–708. [Google Scholar] [CrossRef]
  39. Carr, E.W.; Shirazi, Y.; Parsons, G.R.; Hoagland, P.; Sommerfield, C.K. Modeling the Economic Value of Blue Carbon in Delaware Estuary Wetlands: Historic Estimates and Future Projections. J. Environ. Manage 2018, 206, 40–50. [Google Scholar] [CrossRef] [PubMed]
  40. Ricke, K.; Drouet, L.; Caldeira, K.; Tavoni, M. Country-level social cost of carbon. Nat. Clim. Change 2018, 810, 895–900. [Google Scholar] [CrossRef]
  41. Wang, Z.; Zeng, J.; Chen, W. Impact of urban expansion on carbon storage under multi-scenario simulations in Wuhan, China. Environ. Sci. Pollut. Res. Int. 2022, 2930, 45507–45526. [Google Scholar] [CrossRef] [PubMed]
  42. Babbar, D.; Areendran, G.; Sahana, M.; Sarma, K.; Raj, K.; Sivadas, A. Assessment and prediction of carbon sequestration using Markov chain and InVEST model in Sariska Tiger Reserve, India. J. Clean. Prod. 2021, 278, 123333. [Google Scholar] [CrossRef]
  43. Li, J.; Gong, J.; Guldmann, J.-M.; Li, S.; Zhu, J. Carbon Dynamics in the Northeastern Qinghai–Tibetan Plateau from 1990 to 2030 Using Landsat Land Use/Cover Change Data. Remote Sens. 2020, 123, 528. [Google Scholar] [CrossRef] [Green Version]
  44. Prietzel, J.; Zimmermann, L.; Schubert, A.; Christophel, D. Organic matter losses in German Alps forest soils since the 1970s most likely caused by warming. Nat. Geosci. 2016, 97, 543–548. [Google Scholar] [CrossRef]
  45. Liu, X.; Wang, S.; Wu, P.; Feng, K.; Hubacek, K.; Li, X.; Sun, L. Impacts of Urban Expansion on Terrestrial Carbon Storage in China. Environ Sci Technol 2019, 5312, 6834–6844. [Google Scholar] [CrossRef] [PubMed]
  46. Chuai, X.; Huang, X.; Wang, W.; Zhao, R.; Zhang, M.; Wu, C. Land use, total carbon emissions change and low carbon land management in Coastal Jiangsu, China. J. Clean. Prod. 2015, 103, 77–86. [Google Scholar] [CrossRef]
  47. Zhang, F.; Deng, X.; Xie, L.; Xu, N. China’s energy-related carbon emissions projections for the shared socioeconomic pathways. Resour. Conserv. Recycl. 2021, 168, 105456. [Google Scholar] [CrossRef]
  48. Yuan, Y.; Chen, D.; Wu, S.; Mo, L.; Tong, G.; Yan, D. Urban sprawl decreases the value of ecosystem services and intensifies the supply scarcity of ecosystem services in China. Sci. Total Environ. 2019, 697, 134170. [Google Scholar] [CrossRef]
  49. Campbell, E.; Marks, R.; Conn, C. Spatial modeling of the biophysical and economic values of ecosystem services in Maryland, USA. Ecosyst. Serv. 2020, 43, 101093. [Google Scholar] [CrossRef]
  50. Scholte, S.S.K.; van Teeffelen, A.J.A.; Verburg, P.H. Integrating socio-cultural perspectives into ecosystem service valuation: A review of concepts and methods. Ecol. Econ. 2015, 114, 67–78. [Google Scholar] [CrossRef]
  51. Gong, W.; Duan, X.; Mao, M.; Hu, J.; Sun, Y.; Wu, G.; Zhang, Y.; Xie, Y.; Qiu, X.; Rao, X.; et al. Assessing the impact of land use and changes in land cover related to carbon storage by linking trajectory analysis and InVEST models in the Nandu River Basin on Hainan Island in China. Front. Environ. Sci. 2022, 10, 1554. [Google Scholar] [CrossRef]
Figure 1. Location, DEM, and land use map of YRD.
Land 12 00297 g001
Figure 2. Overall experimental procedure of the study.
Land 12 00297 g002
Figure 3. Urban expansion in the YRD and the resulting loss of TCS from 2000 to 2020: () urban expansion, () loss of TCS, (a) Shanghai, (b) Suzhou, (c) Nantong, (d) Nanjing.
Land 12 00297 g003
Figure 4. Simulation of urban expansion in the YRD under three scenarios and its resulting loss of TCS: () urban expansion under BS, () loss of TCS under BS, () urban expansion under CP, () loss of TCS under CP, () urban expansion under EP, () loss of TCS under EP, (a) Shanghai, (b) Suzhou, (c) Nantong, (d) Nanjing.
Land 12 00297 g004
Figure 5. Contribution of drivers such as slope and general roads to urban expansion: (a) Shanghai, (b) Suzhou, (c) Nantong, (d) Nanjing.
Land 12 00297 g005
Table 1. Data sources and descriptions.
Data TypeData NameData SourceSpatial
Resolution (m)
Land use dataLand use in 2000, 2010, and 2020GlobalLand30 dataset (http://www.globallandcover.com/)30
Natural factorsDEMNASA DEM (https://www.earthdata.nasa.gov/)30
Slope 30
Aspect 30
Socioeconomic factorsPopulationWorldPop dataset (https://www.worldpop.org/)100
GDPResource and Environment Science and Data Center (http://www.resdc.cn/)1000
Distance to general roadsOpenStreetMap (https://www.openstreetmap.org/)1000
Distance to highways 1000
Distance to railways 1000
Distance to riverNational Catalogue Service for Geographic Information (https://www.webmap.cn/)1000
Distance to city 1000
Distance to downtown 1000
Table 2. Neighborhood weight parameters and transition matrix for the 2010 land use simulation.
Land Use TypesCroplandWoodlandGrasslandWaterbodyBuilt-Up LandUnused Land
Neighborhood weights0.4610.0320.0070.0330.4670.001
Cropland110111
Woodland111111
Grassland111111
Waterbody111110
Built-up land100110
Unused land011111
Table 3. The number of demand for each land use type in different scenarios in the YRD in 2030 (km2).
ScenarioCroplandWoodlandGrasslandWaterbodyBuilt-Up LandUnused Land
BS163,59799,91710,87023,67349,688255
CP164,664100,25010,68323,09849,045260
EP164,092101,66911,19923,34747,433260
Table 4. Carbon intensity of each land use type in the YRD (t/hm2).
Land Use TypesAboveground Carbon DensityBelowground Carbon DensitySoil Organic Carbon DensityDead Organic Matter Carbon DensityTotal Carbon Density
Cropland20.32913.42393.4672.596129.815
Woodland43.1518.622143.3713.983199.127
Grassland18.14921.772110.5503.071153.542
Waterbody1.9103.43768.7462.29276.385
Built-up land14.5482.91065.6750.00083.133
Unused land14.2492.84747.3421.31565.753
Table 5. Urban land transfer matrix and its TCS changes in the YRD from 2000 to 2020 (km2/Tg).
Time Period-CroplandWoodlandGrasslandWaterbodyUnused Land
2000–2010Transfer out volume900200
Transfer in volume6240359421781
TCS−29.088−4.164−0.2960.1070.002
2010–2020Transfer out volume16,9921230177143519
Transfer in volume26,286222329212592
TCS−43.386−11.518−0.810−0.119−0.030
Note: Positive values indicate an increase in TCS and negative values indicate a loss of TCS.
Disclaimer/Publisher’s Note: The statements, opinions and data contained in all publications are solely those of the individual author(s) and contributor(s) and not of MDPI and/or the editor(s). MDPI and/or the editor(s) disclaim responsibility for any injury to people or property resulting from any ideas, methods, instructions or products referred to in the content.

