
Water-Sensitive Urban Plan for Lima Metropolitan Area (Peru) Based on Changes in the Urban Landscape from 1990 to 2021


Abstract
:1. Introduction
2. Materials and Methods
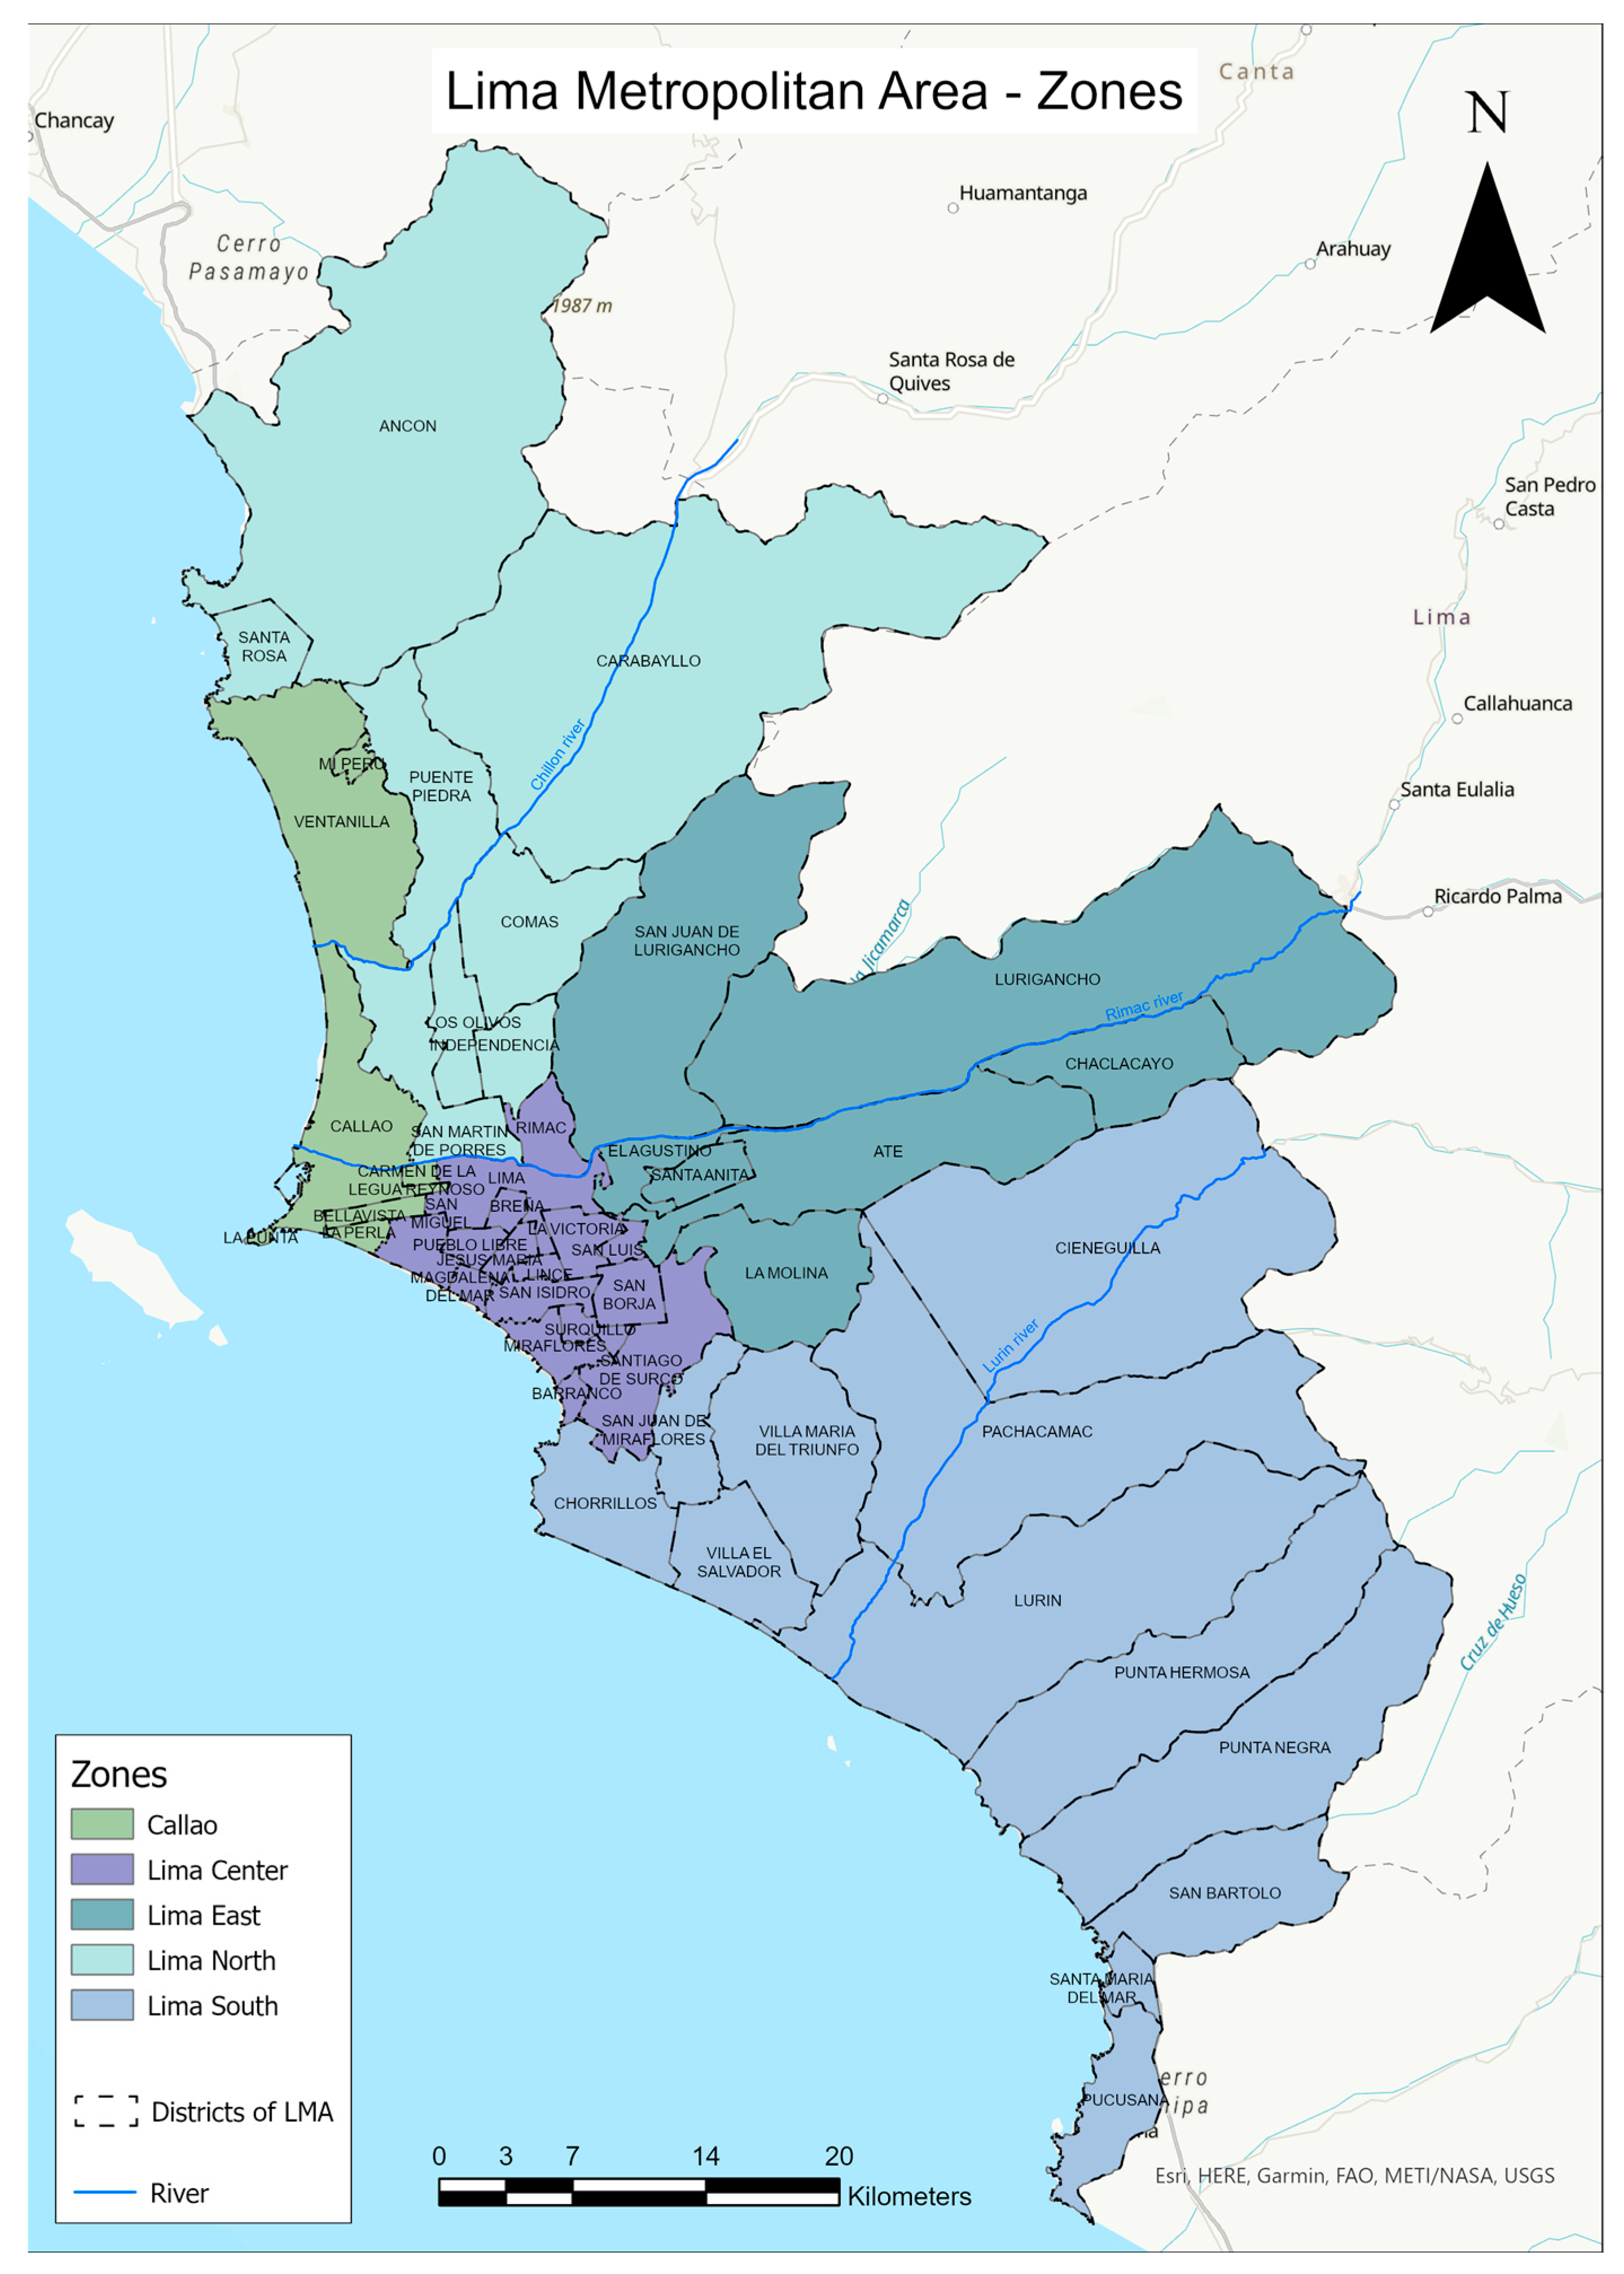
2.1. Study Area
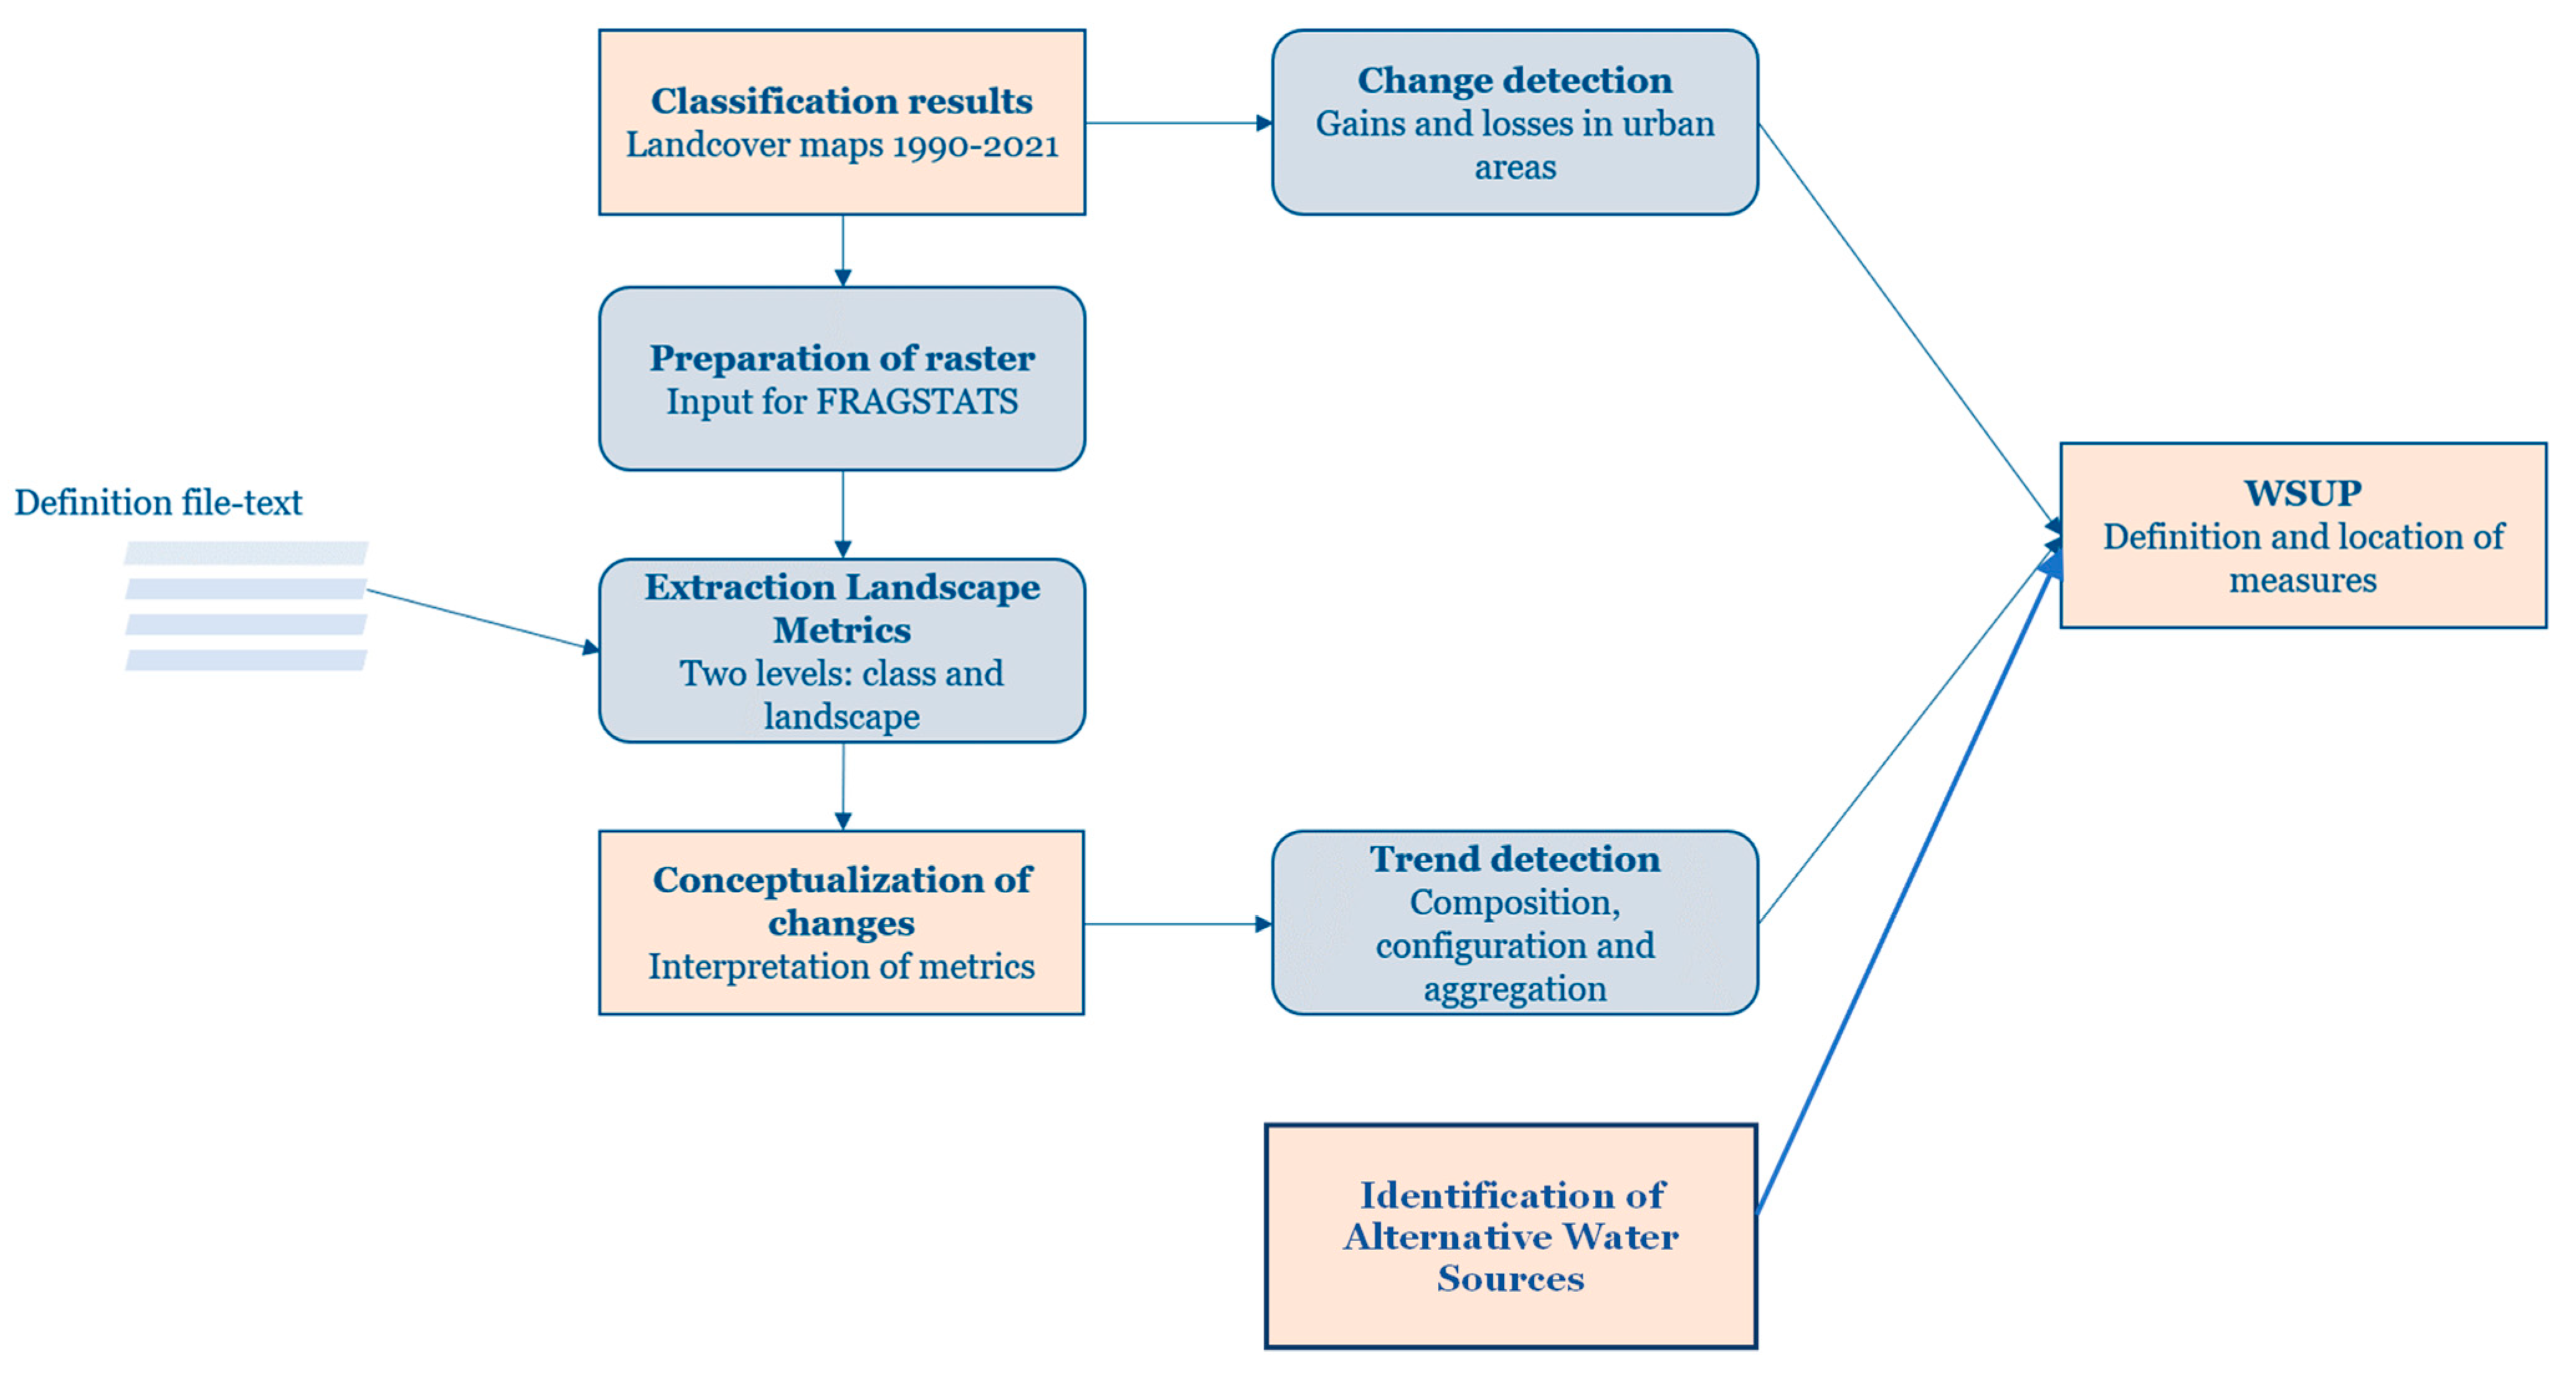
2.2. Methodology
3. Results and Discussion
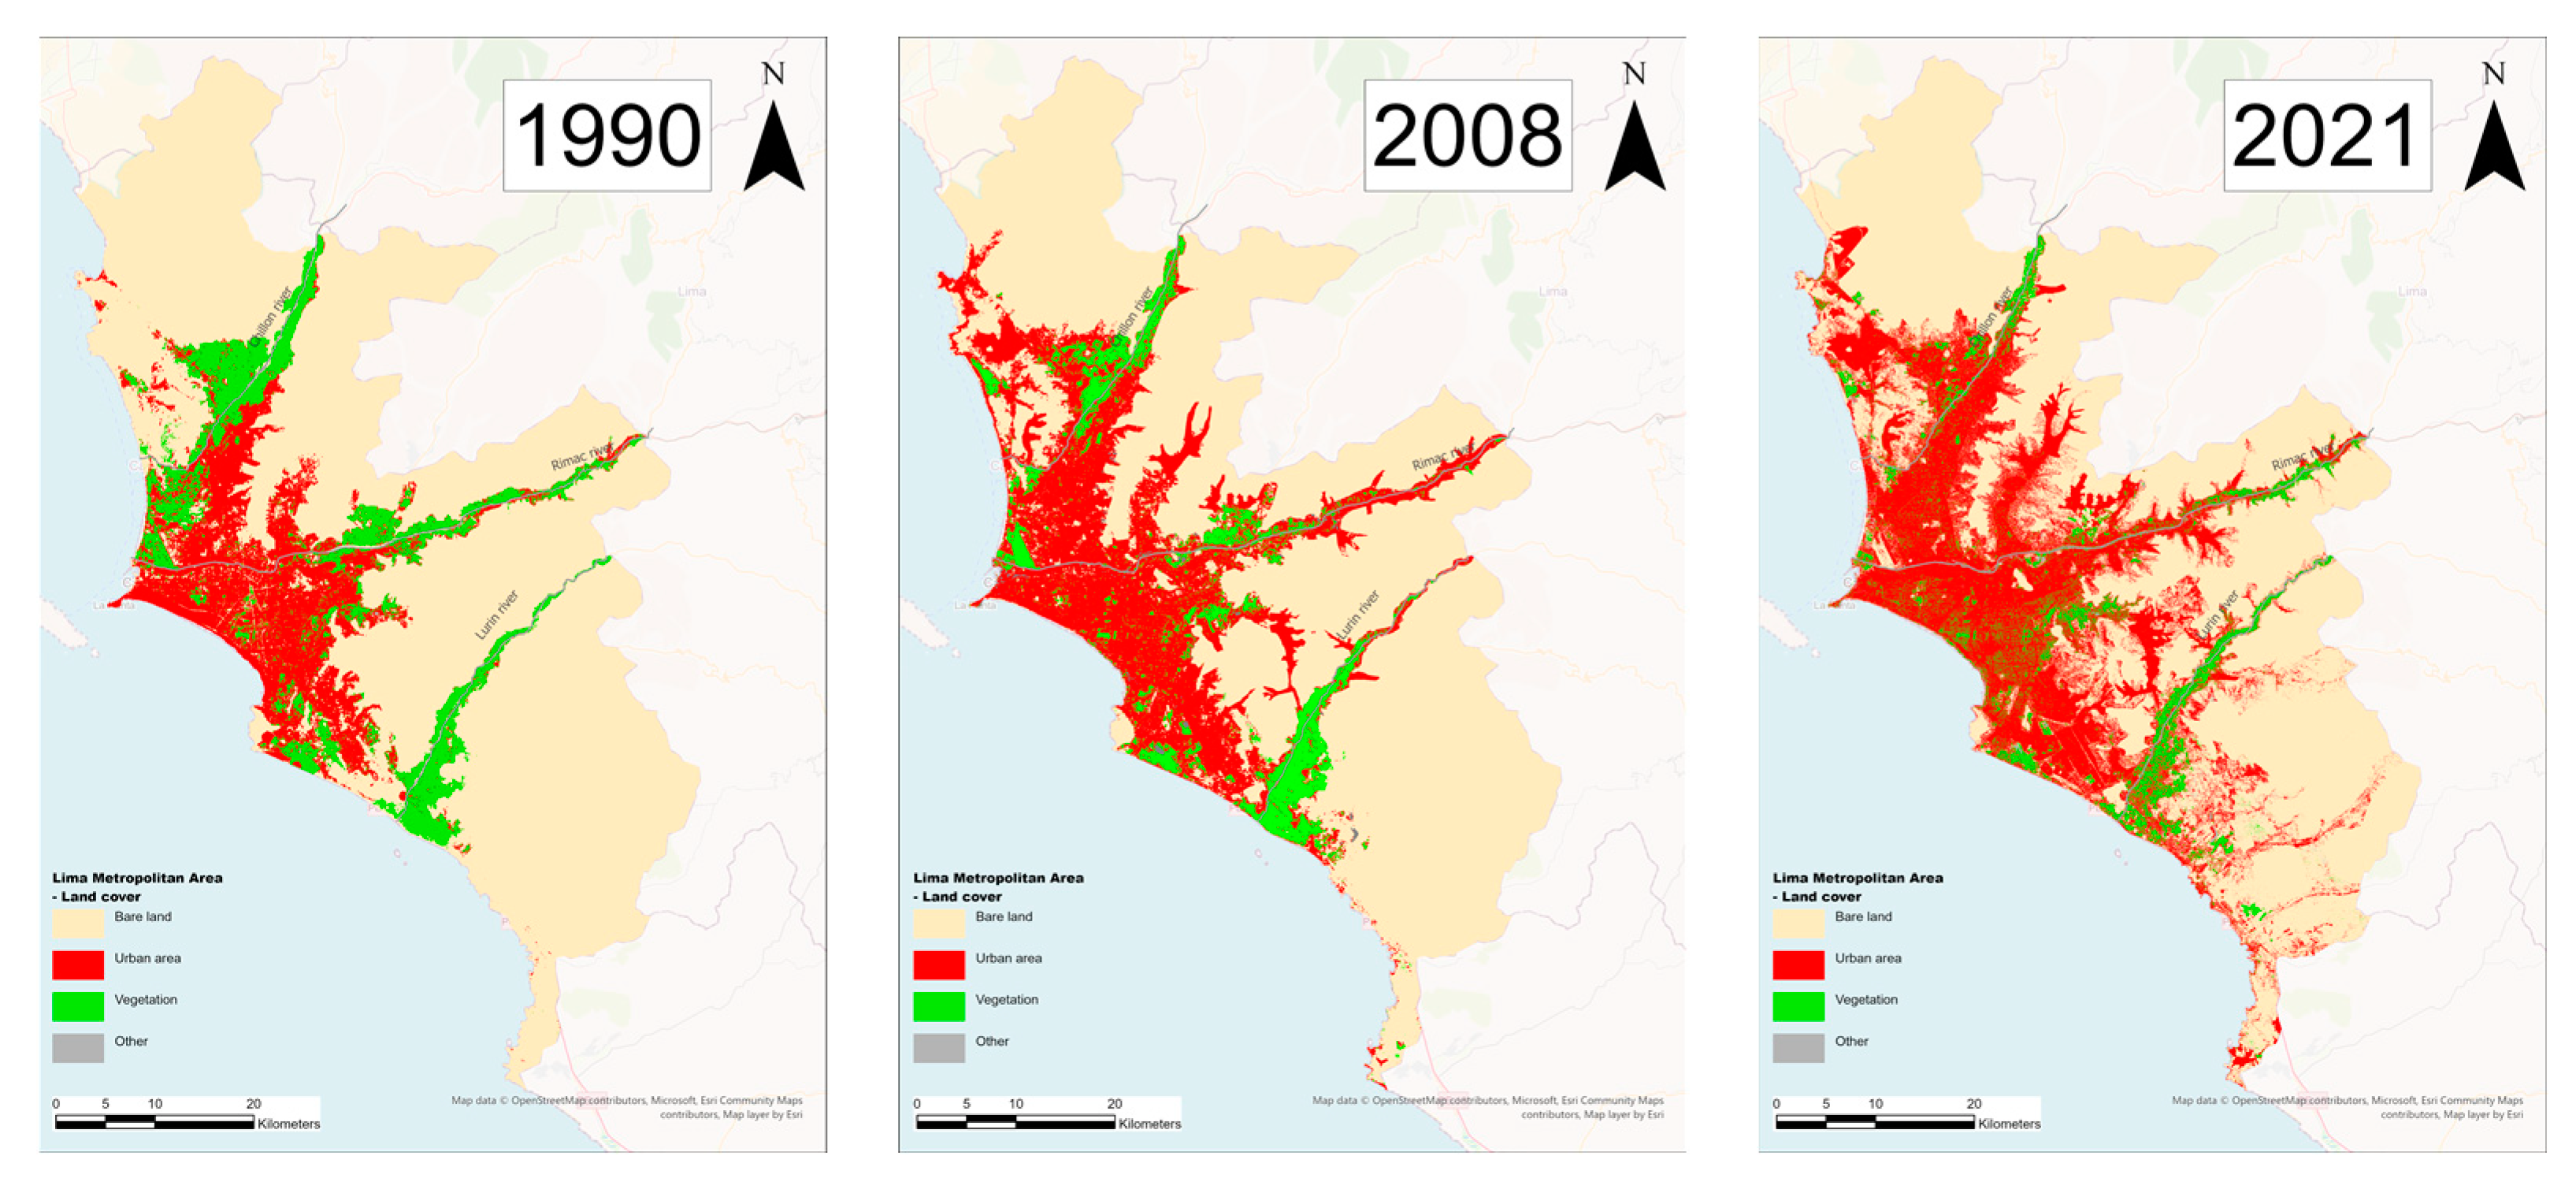
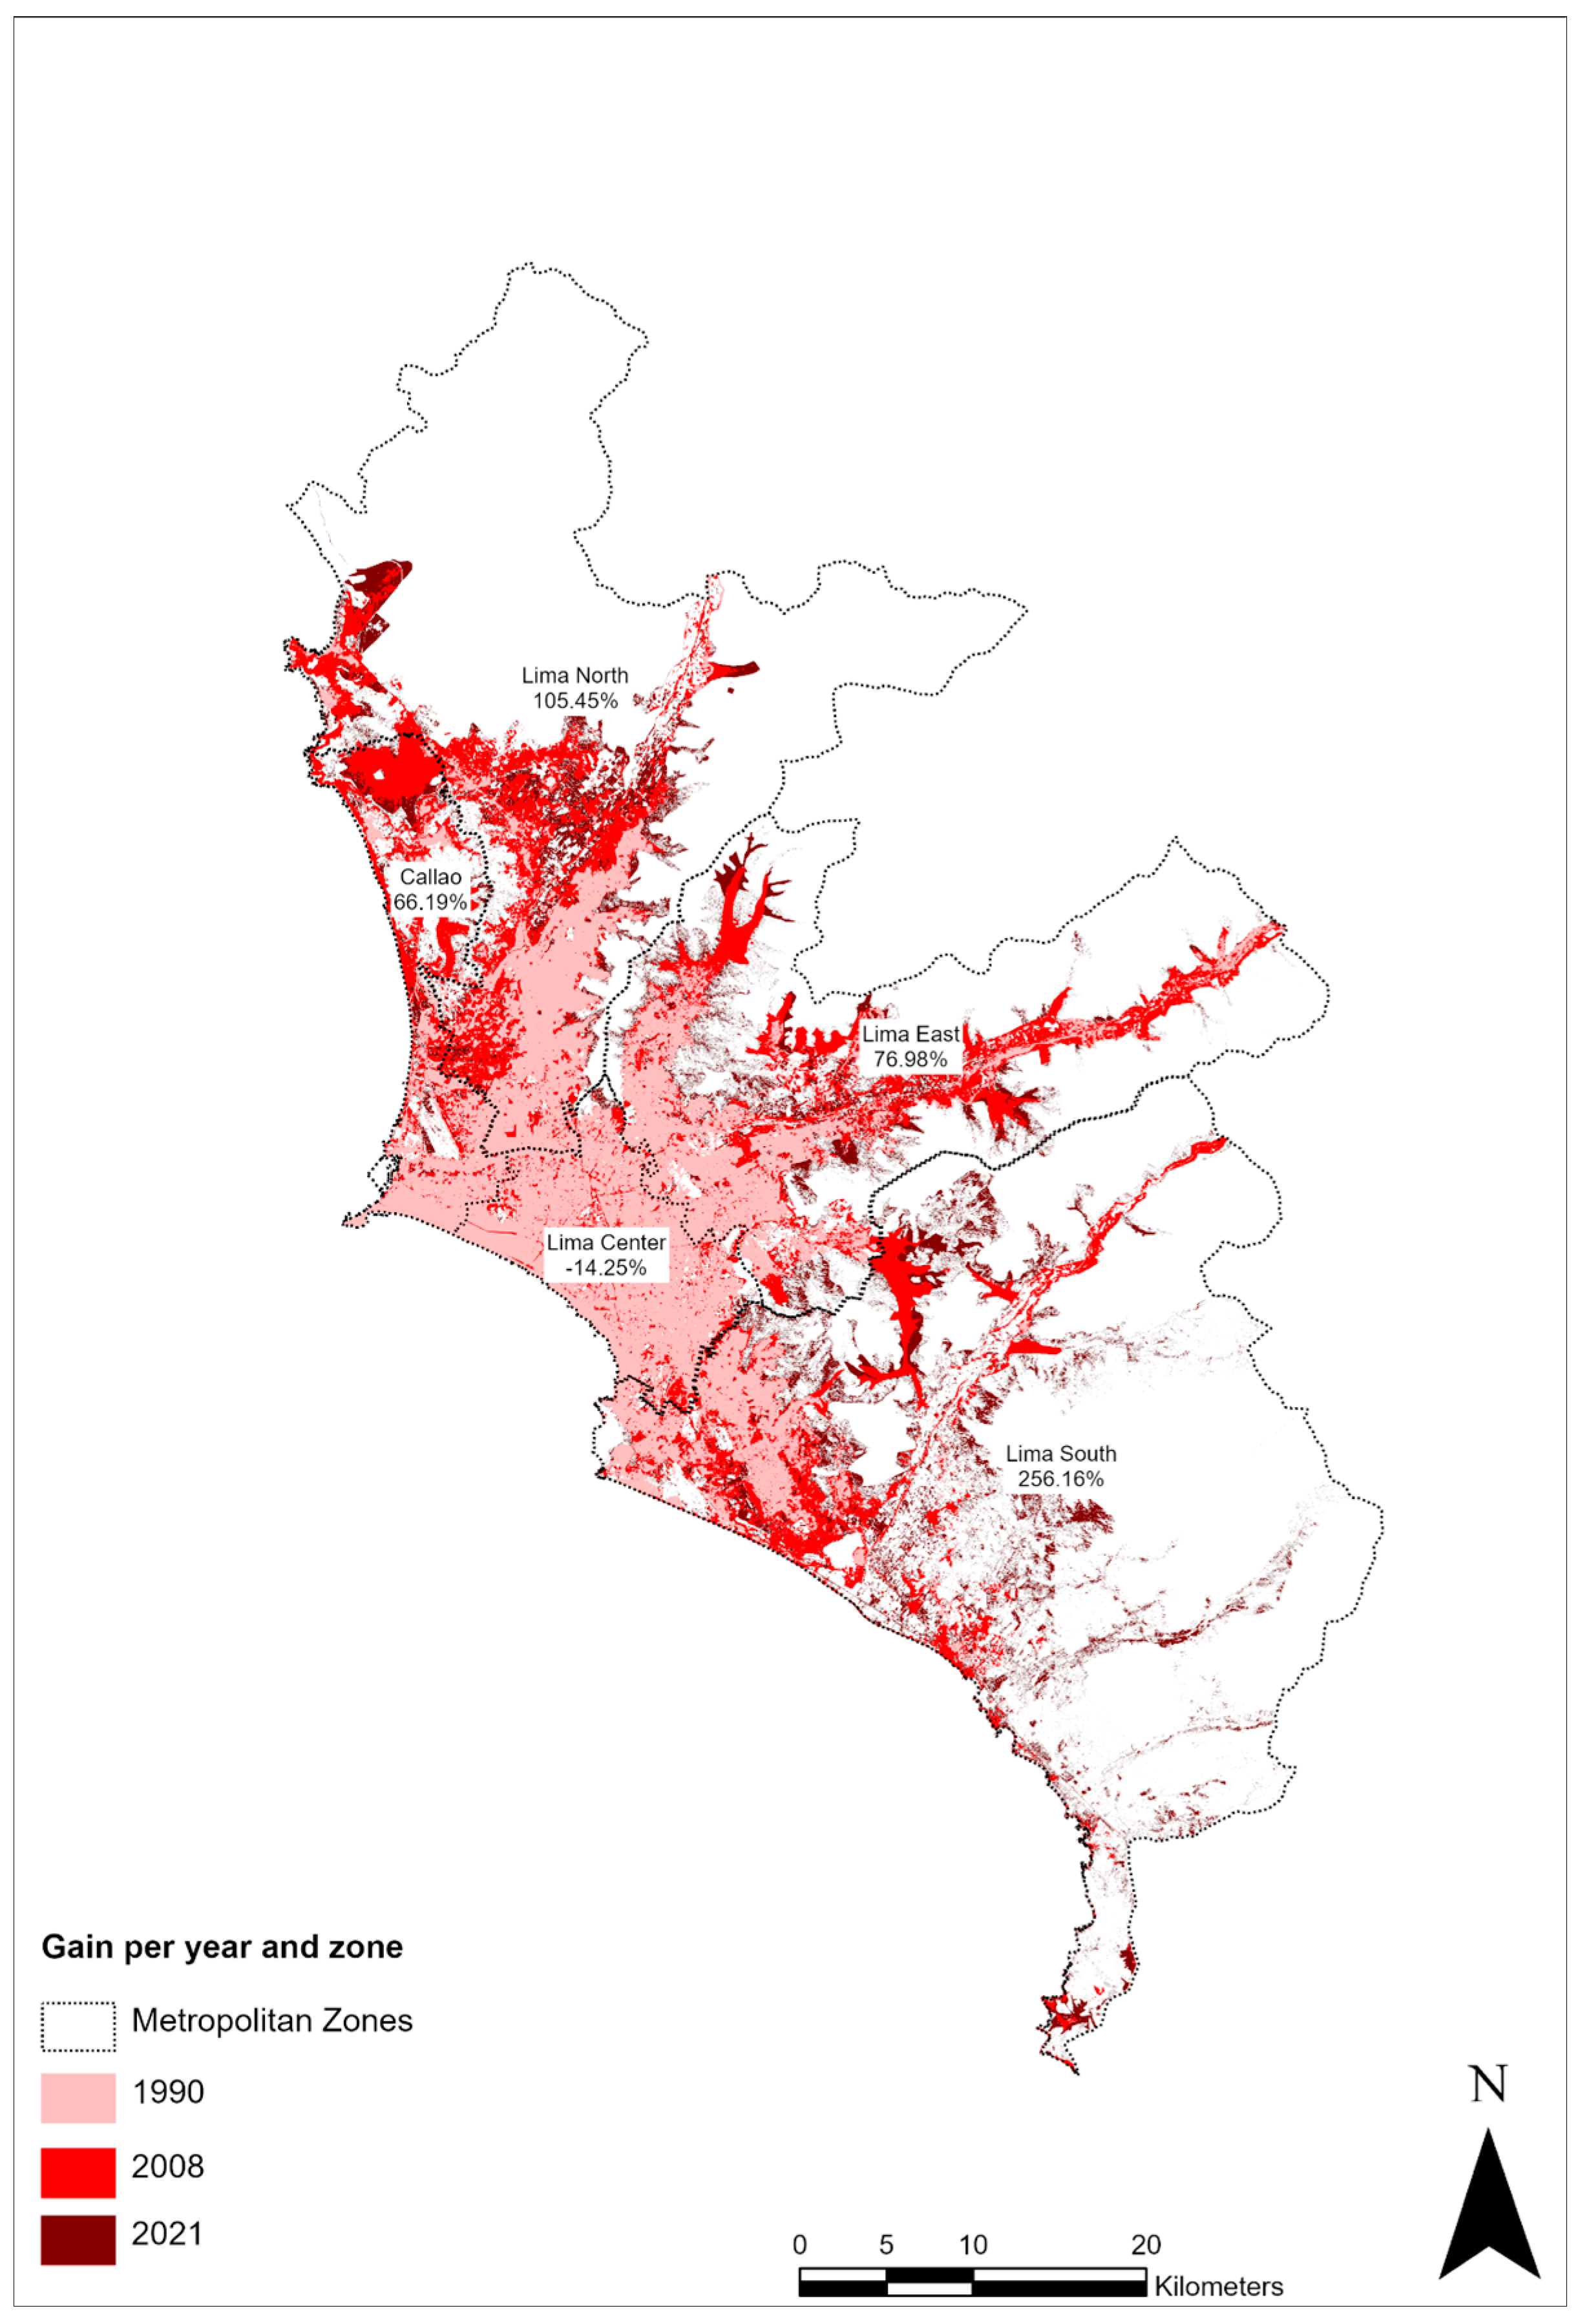
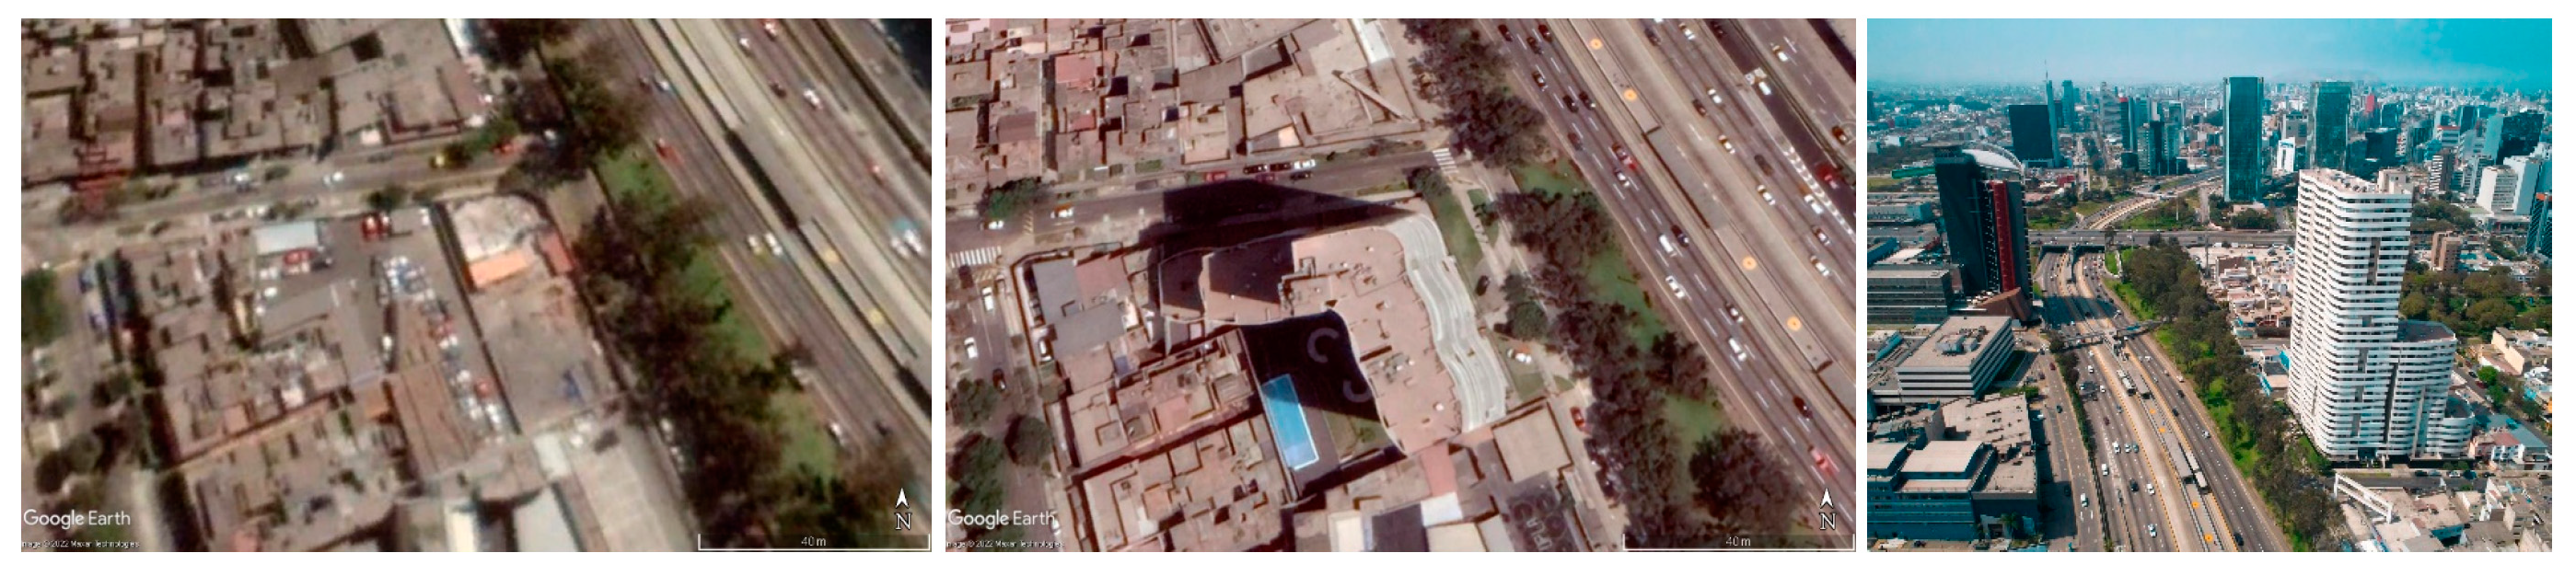
3.1. Change Detection: Gain and Losses in Urban Areas
3.2. Trend Detection: Interpretation of Landscape Metrics
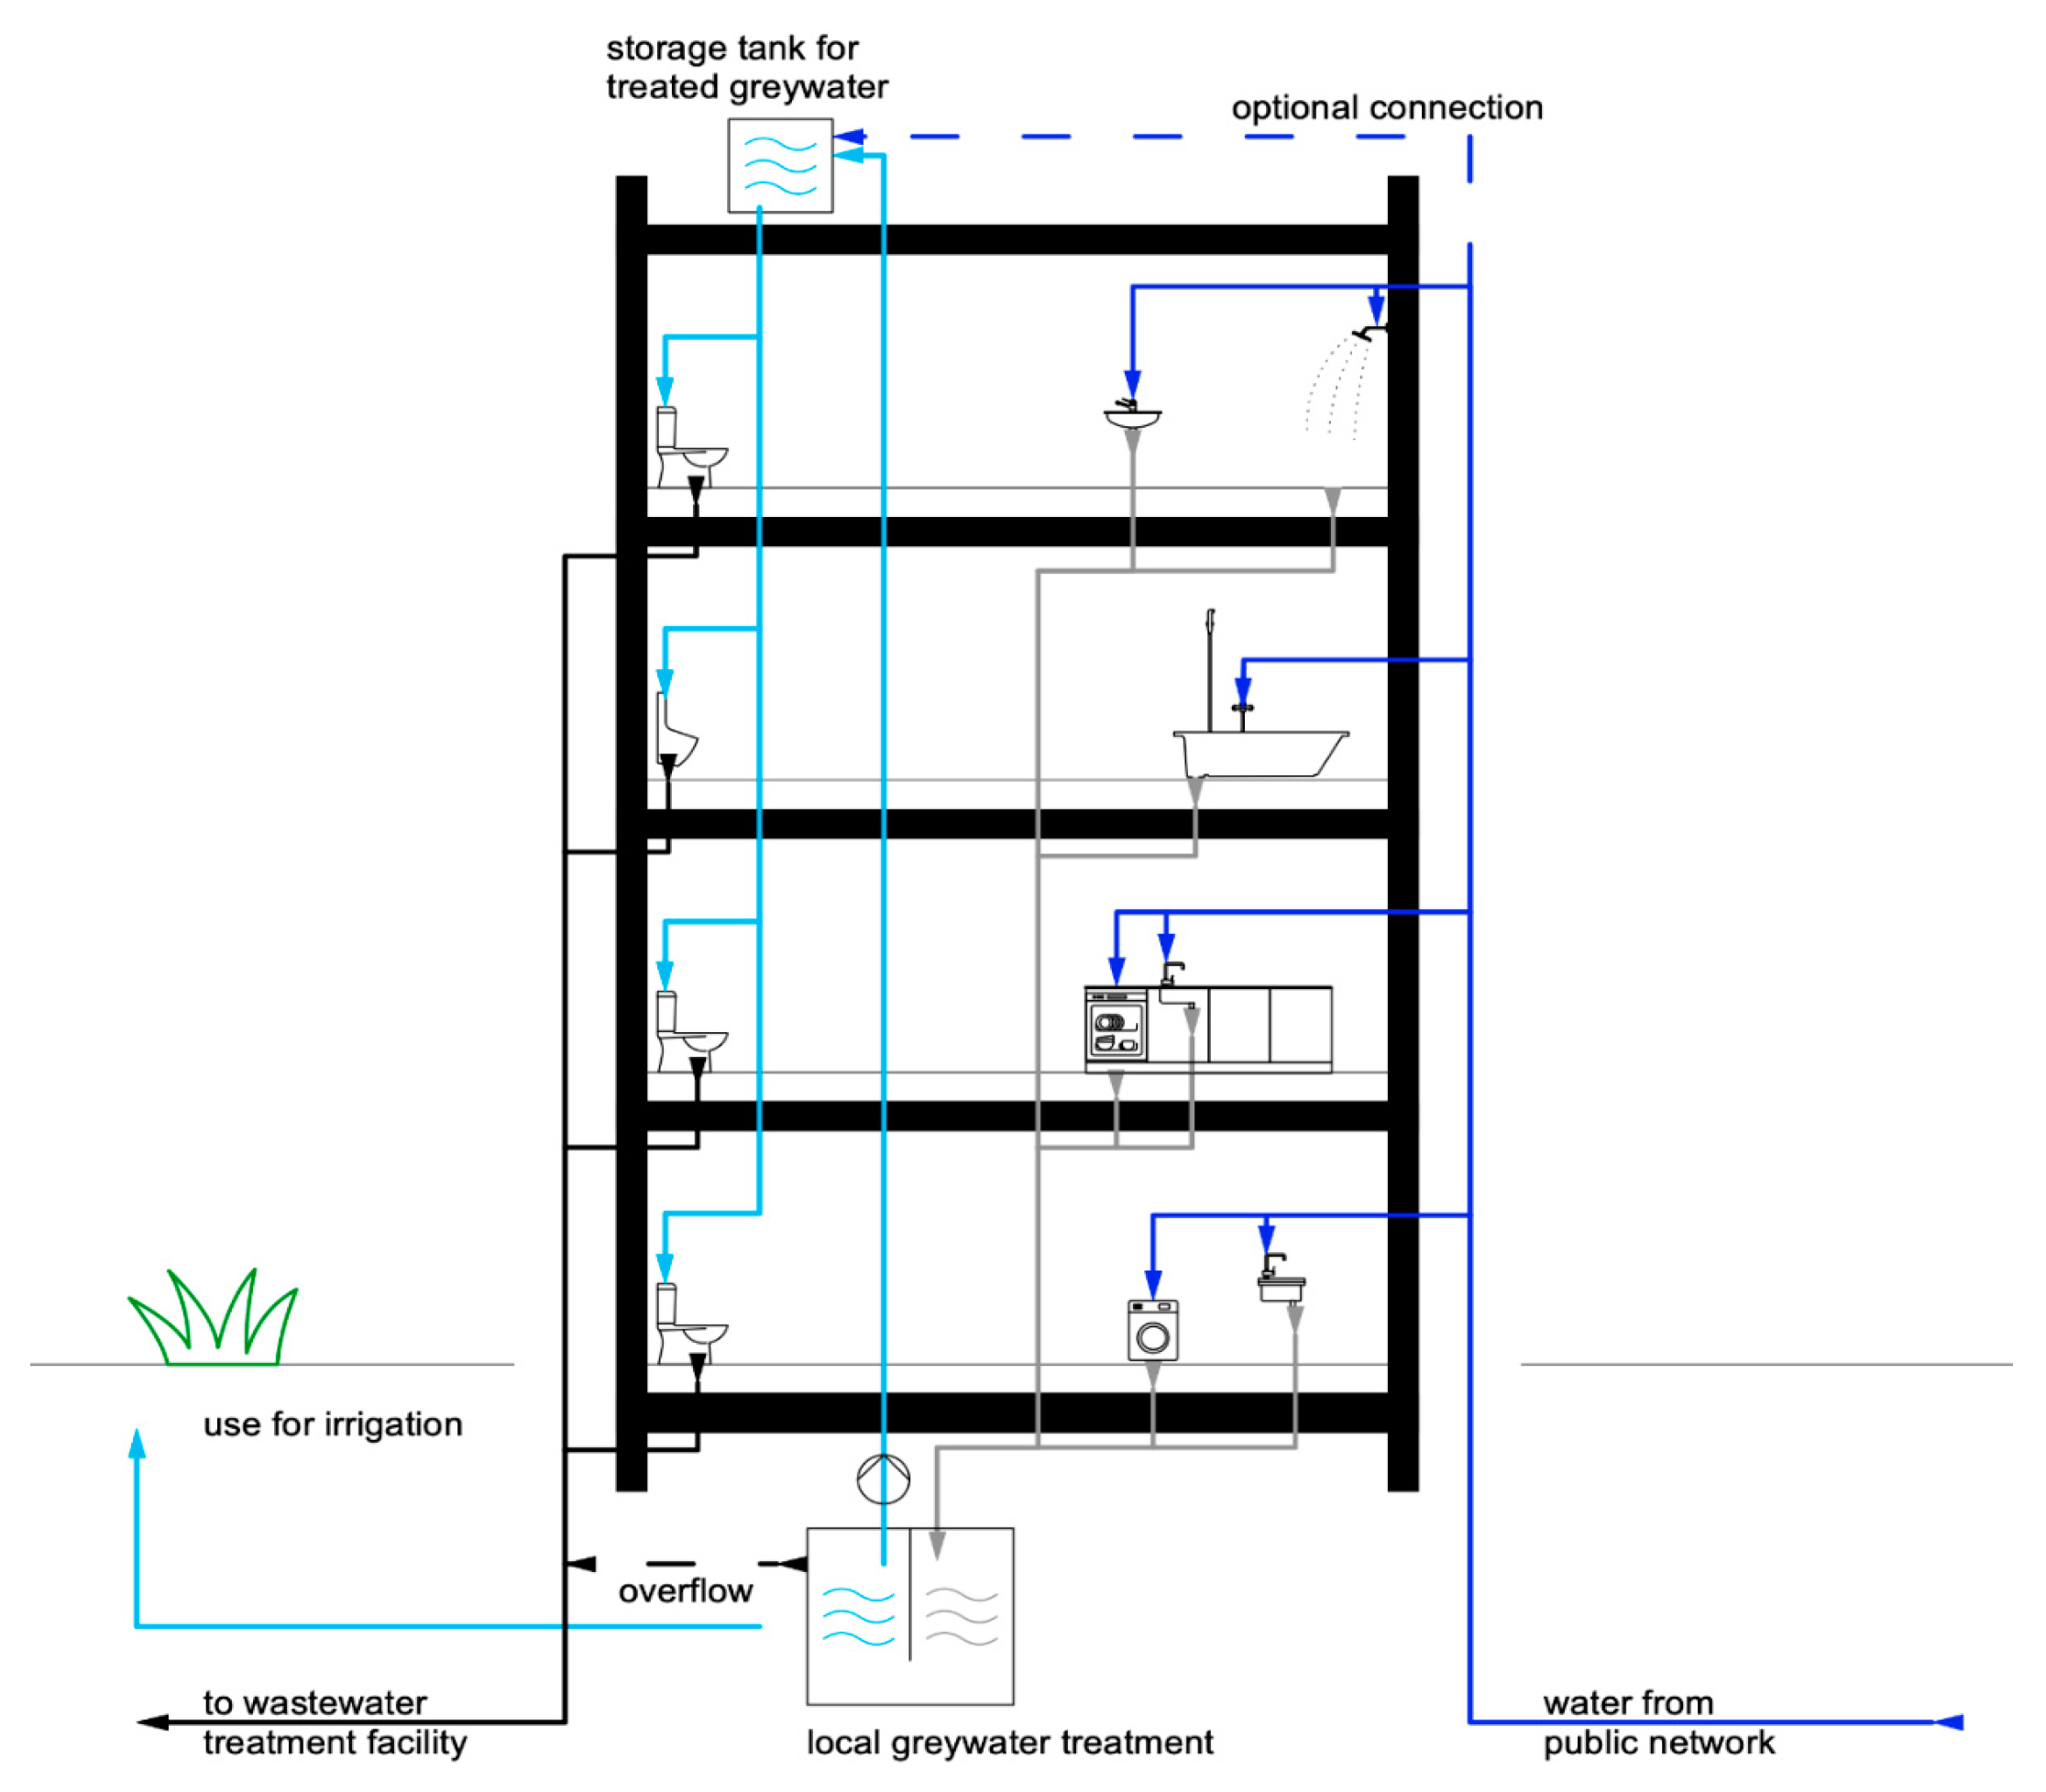
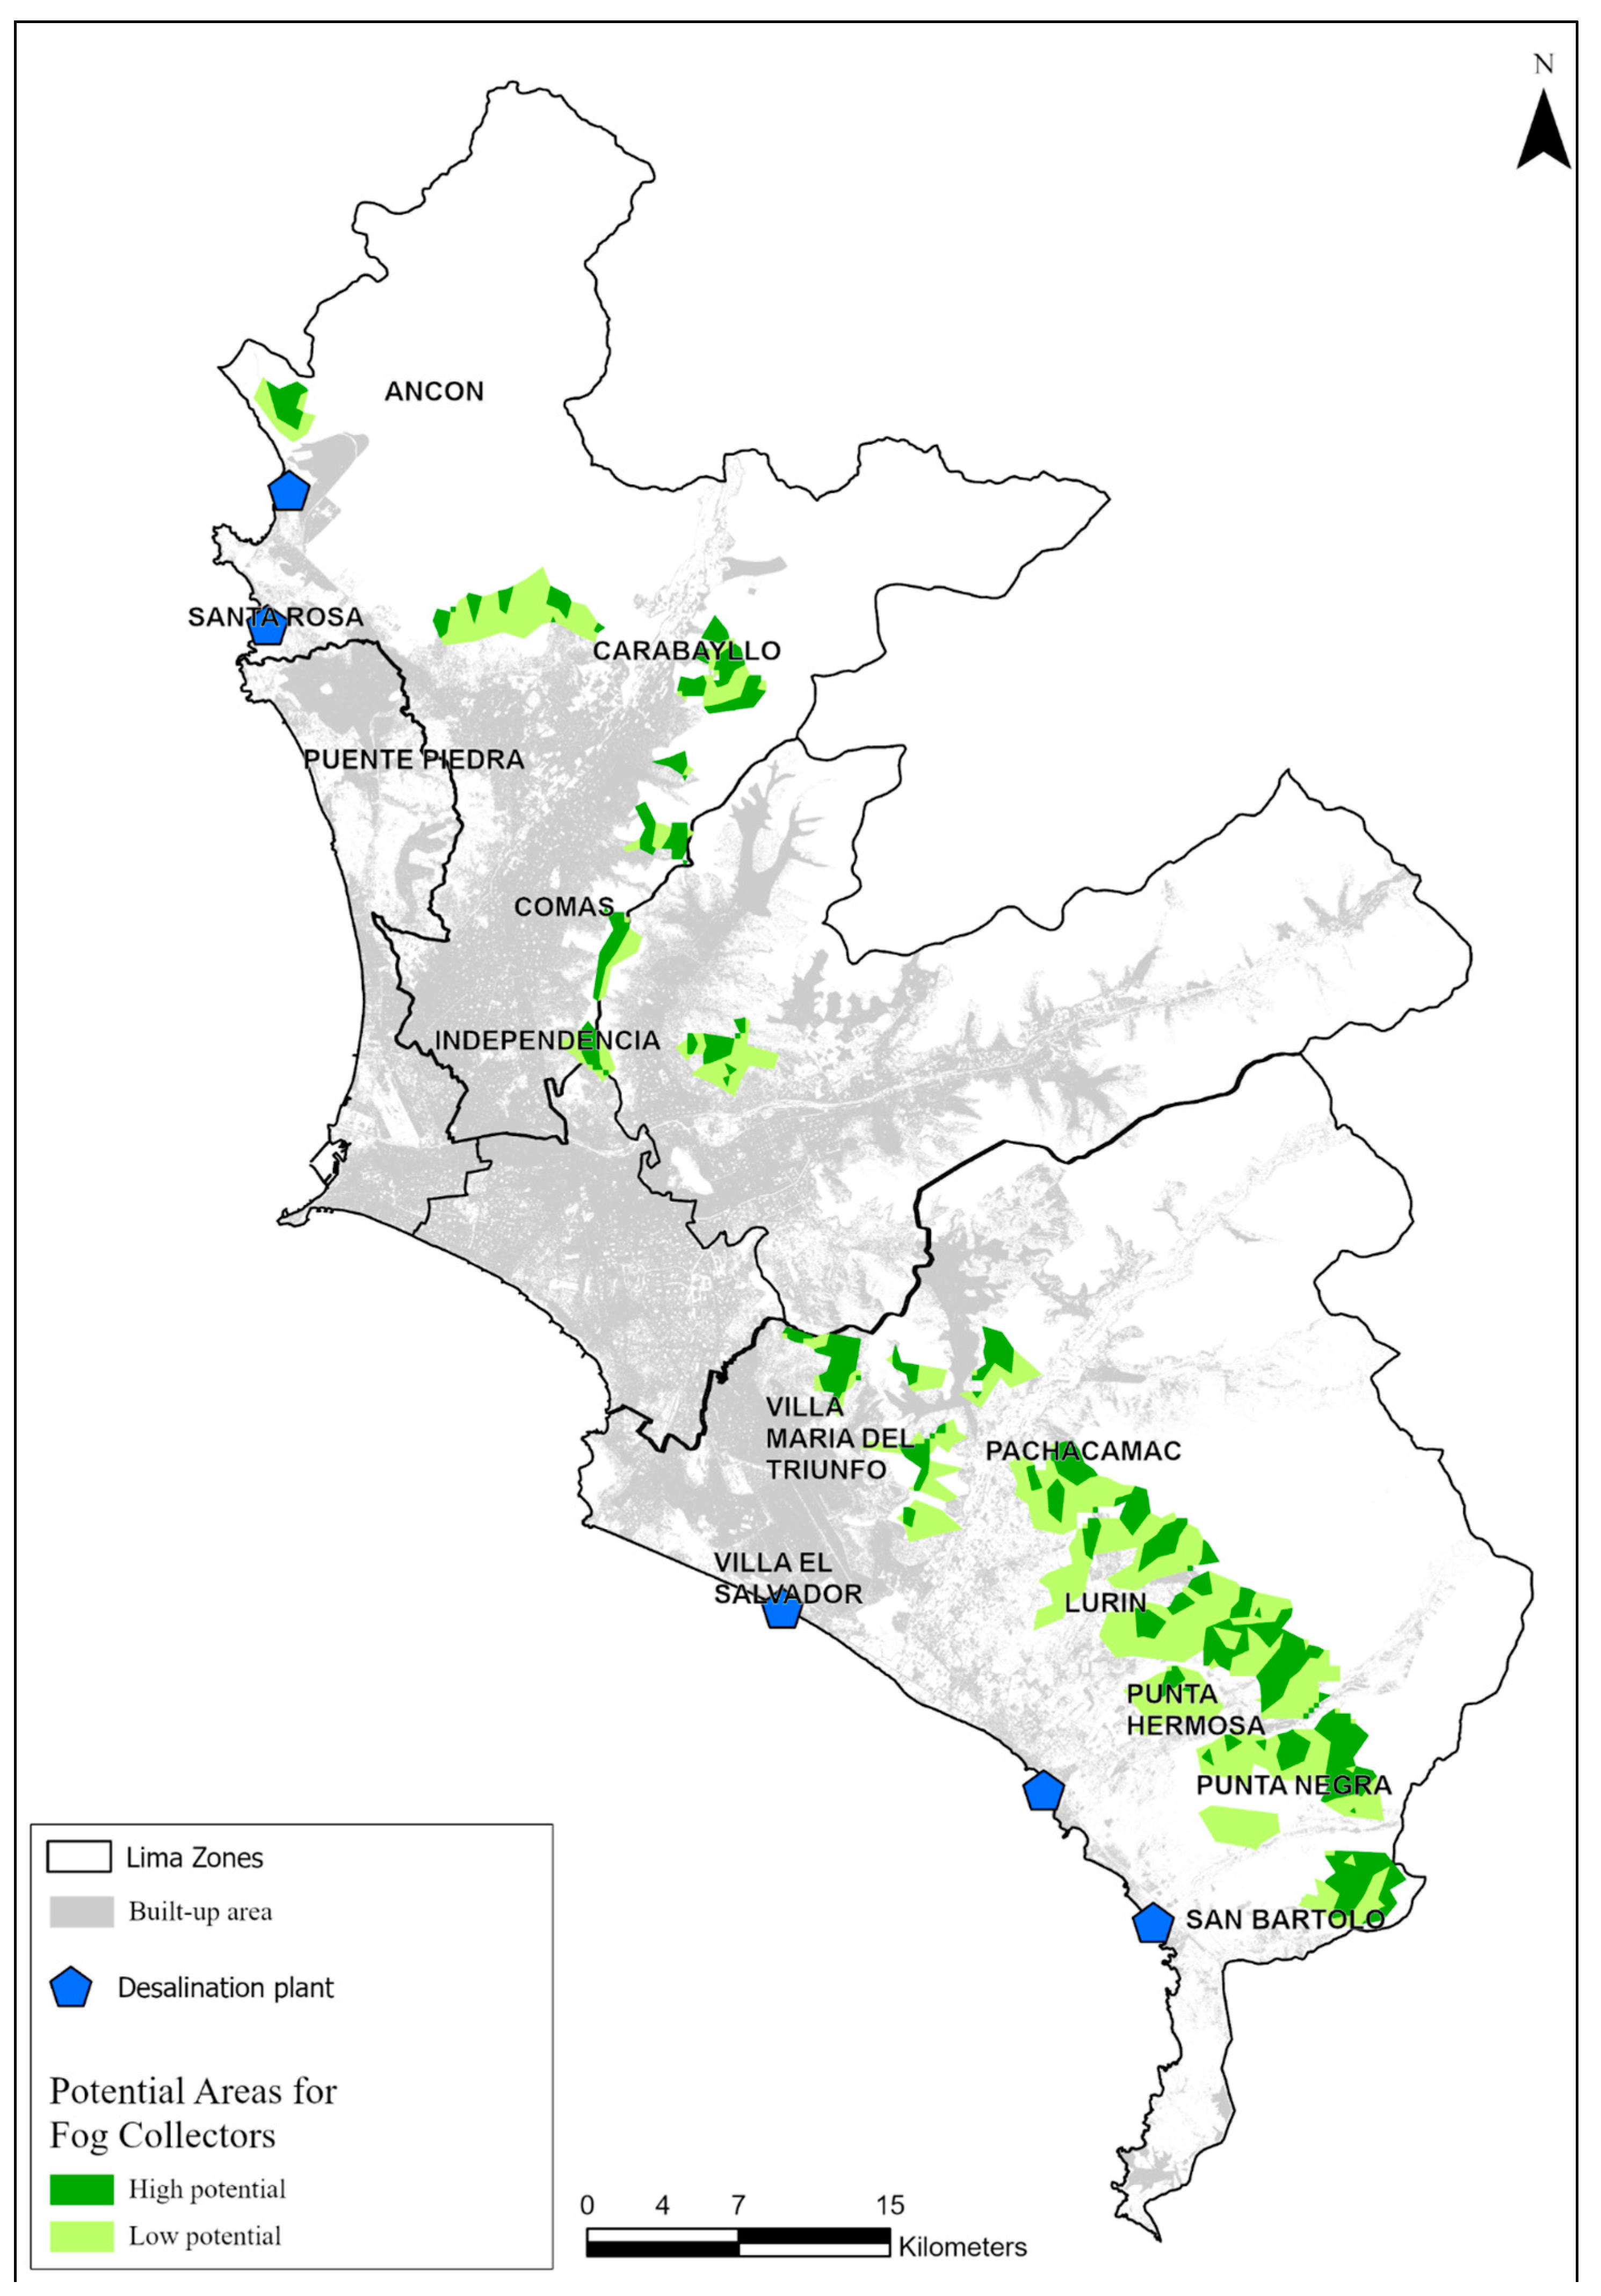
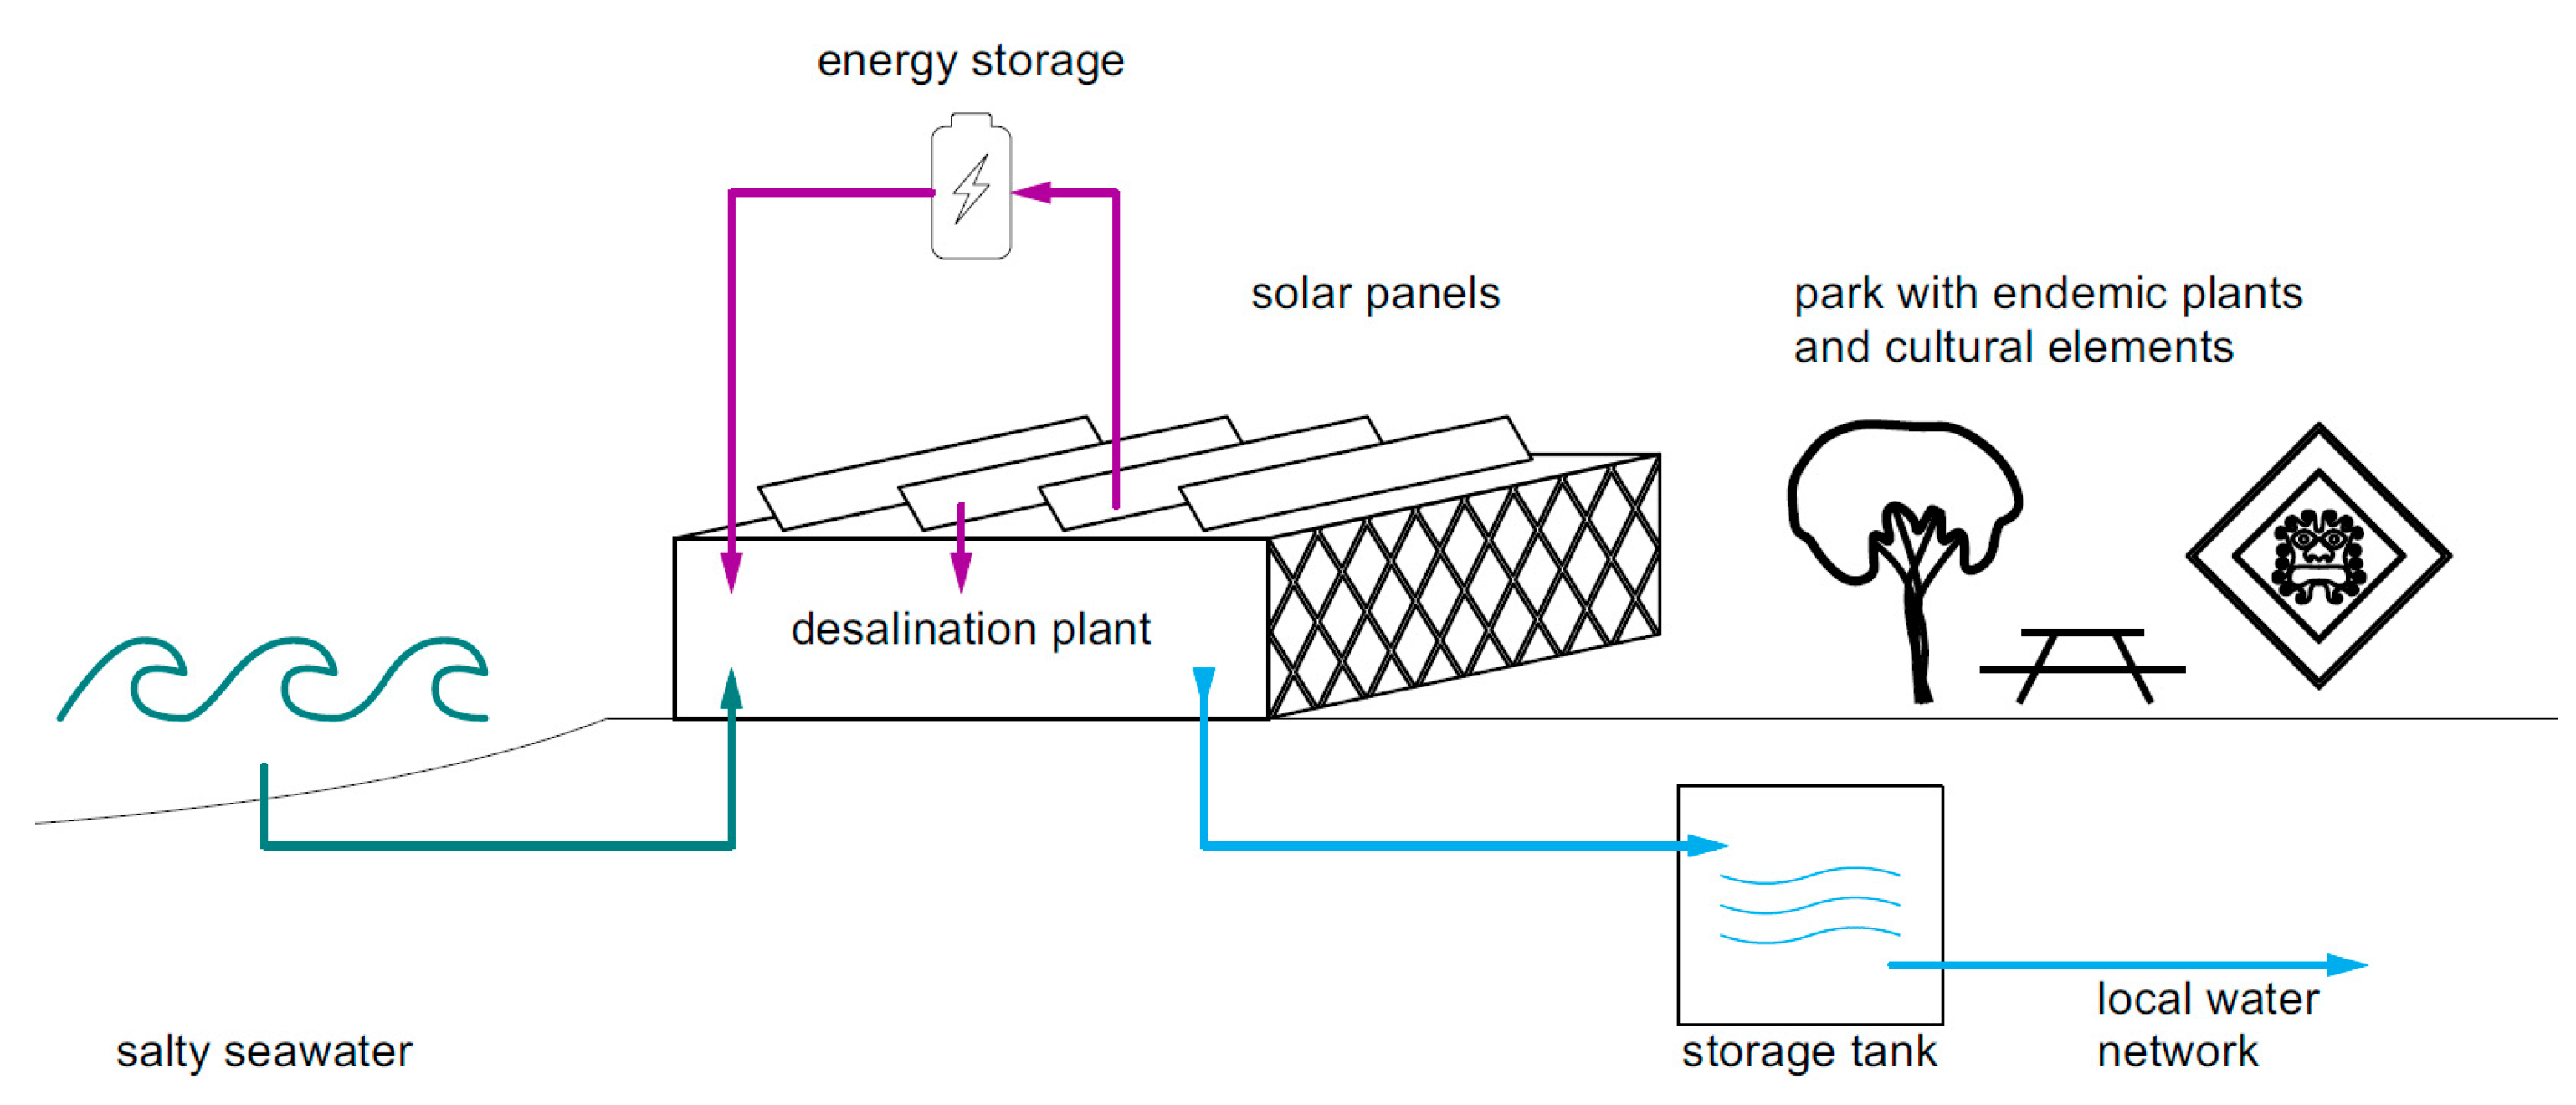
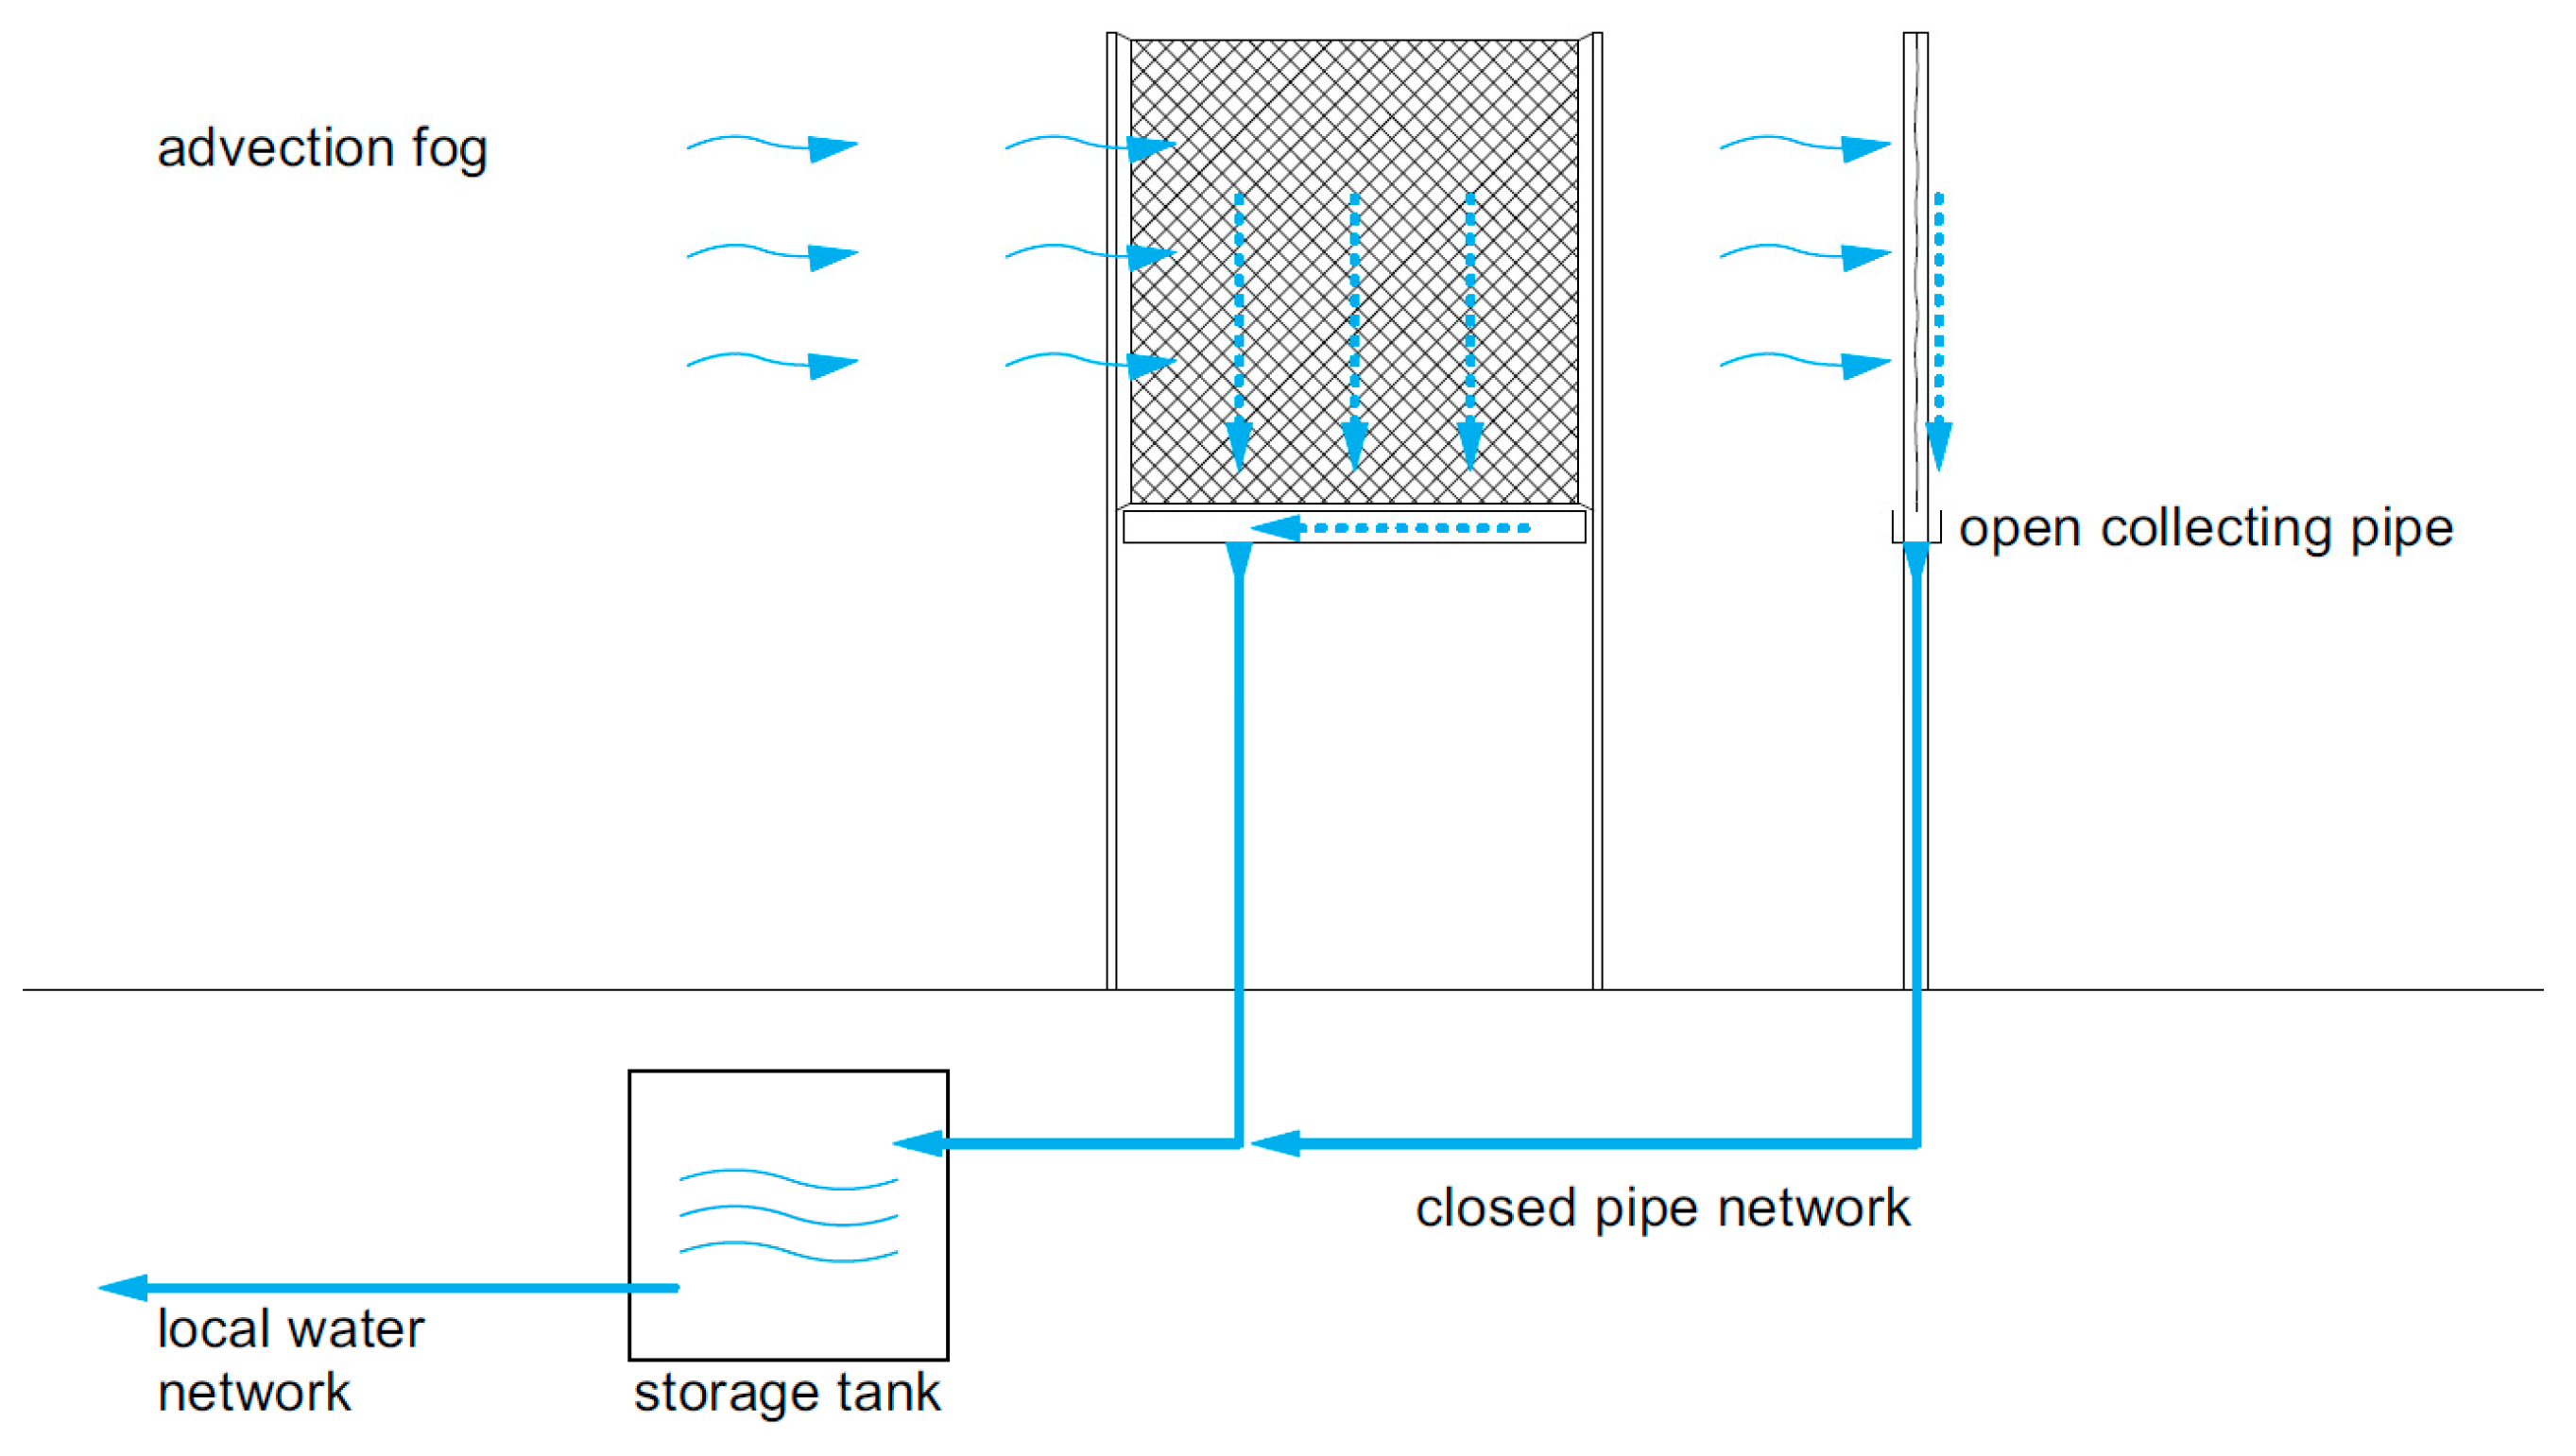
3.3. Identification of Alternative Water Sources: Water Sensitive Urban Planning
4. Water Sensitive Urban Plan for LMA
5. Conclusions
Author Contributions
Funding
Institutional Review Board Statement
Informed Consent Statement
Data Availability Statement
Conflicts of Interest
Abbreviations
| LMA | Lima Metropolitan Area |
| WSUD | Water-sensitive urban design |
| EESS | Ecosystem services |
| CA | Class area |
| PLAND | Percentage of landscape |
| SHAPE_MN | Mean shape index |
| FRACTAL_MN | Mean fractal dimension index |
| FRACTAL_AM | Area weighted fractal dimension index |
| PLADJ | Proportion of like adjacencies |
| AI | Aggregation index |
| CONTIG_MN | Mean contiguity index |
| CONTIG_AM | Area weighted contiguity index |
| DIVISION | Division index |
| CONTAG | Contagion |
| SHDI | Shannon’s diversity index |
| SHEI | Shannon’s evenness index |
| AWSS | Alternative water-source supply |
| LC | Lima Center |
| LN | Lima North |
| LS | Lima South |
References
- United Nations, Department of Economic and Social Affaird, Population Division. World Urbanization Prospects: The 2018 Revision; United Nations: New York, NY, USA, 2018. [Google Scholar]
- Muggah, R. Latin America’s Cities Are Ready to Take off. But Their Infrastructure Is Failing Them; World Economic Forum. Available online: https://www.weforum.org/agenda/2018/06/latin-america-cities-urbanization-infrastructure-failing-robert-muggah/ (accessed on 21 January 2022).
- Valdeavellano, R.; Maquet, P.; Escalante, C.; Calizaya, J.C.; Alvarez, E.; Calderon, J. El Saneamiento Básico en los Barrios Marginales de Lima Metropolitana; Instituto de Durbano-CENCA: Lima, Peru, 1998. [Google Scholar]
- Lizarralde, G.; Bornstein, L.; Robertson, M.; Gould, K.; Herazo, B.; Petter, A.M.; Páez, H.; Días, J.H.; Olivera, A.; Gonzalez, G.; et al. Does climate change cause disasters? How citizens, academics, and leaders explain climate-related risk and disasters in Latin America and the Caribbean. Int. J. Dis. Risk Reduct. 2021, 58, 102173. [Google Scholar] [CrossRef]
- Bolay, J.-C. Urban Planning Against Poverty: How to Think and Do Better Cities in the Global South. In Future City; Springer International Publishing: Cham, Switzerland, 2020; Volume 14, ISBN 978-3-030-28418-3. [Google Scholar]
- Aman, A.; Manish, P.; Varun, N.M.; Ritesh, K.; Praveen, K.R.; Romulus, C.; Milap, P.; Liping, D. Comparative evaluation of geospatial scenario-base. Ecol. Indic. 2021, 128, 107810. [Google Scholar]
- World Bank. The World Bank Urban Development; Overview; World Bank: Washington, DC, USA, 2019. [Google Scholar]
- McGarigal, K.; Marks, B.J. FRAGSTATS. Spatial Patial Pattern Analysis Program for Quantifying Landscape Structure; Version 2.0; Forest Service: Washington, DC, USA, 1994. [Google Scholar]
- Wong, T.H.; Rogers, B.C.; Brown, R.R. Transforming cities through water-sensitive principles and practices. One Earth 2020, 3, 436–447. [Google Scholar] [CrossRef]
- Gustafson, E.J. Quantifying landscape spatial pattern: What is the state of the art? Ecosystems 1998, 1, 14. [Google Scholar] [CrossRef]
- Alphan, H. Multi-Temporal analysis of urbanisation patterns as coastal development indicators: Eastern mediterranean coast of Turkey. Ecol. Indic. 2021, 121, 106994. [Google Scholar] [CrossRef]
- Magidi, J.; Ahmed, F. Assessing urban sprawl using remote sensing and landscape metrics: A case study of city of Tshwane, South Africa (1984–2015). Egypt. J. Remote Sens. Space Sci. 2019, 22, 335–346. [Google Scholar] [CrossRef]
- Arora, A.; Pandey, M.; Mishra, V.N.; Kumar, R.; Rai, P.K.; Costache, R.; Punia, M.; Di, L. Comparative evaluation of geospatial scenario-based land change simulation models using landscape metrics. Ecol. Indic. 2021, 128, 107810. [Google Scholar] [CrossRef]
- Dutta, I.; Das, A. Application of geo-spatial indices for detection of growth dynamics and forms of expansion in english bazar urban agglomeration, west bengal. J. Urban Manag. 2019, 8, 288–302. [Google Scholar] [CrossRef]
- Chen, Z.; Xu, B.; Devereux, B. Urban landscape pattern analysis based on 3D landscape models. Appl. Geogr. 2014, 55, 82–91. [Google Scholar] [CrossRef]
- Mears, M.; Brindley, P.; Jorgensen, A.; Ersoy, E.; Maheswaran, R. Greenspace spatial characteristics and human health in an urban environment: An epidemiological study using landscape metrics in Sheffield, UK. Ecol. Indic. 2019, 106, 105464. [Google Scholar] [CrossRef]
- Elmi, M.; Rouhani, A.; Keshavarz, E. Landscape Metrics for Urbanization and Urban Land-Use Change Monitoring from Remote Sensing Images: A Case of Shiraz Metropolis, Iran. Int. J. Earth Sci. Knowl. Appl. 2021, 4, 43–50. [Google Scholar]
- Aguilera, F.; Valenzuela, L.M.; Botequilha-Leitão, A. Landscape metrics in the analysis of urban land use patterns: A case study in a Spanish metropolitan area. Landsc. Urban Plan. 2011, 99, 226–238. [Google Scholar] [CrossRef]
- Wong, T.; Brown, R. The water sensitive city: Principles for practice. Water Sci. Technol. 2009, 60, 673–682. [Google Scholar] [CrossRef] [PubMed] [Green Version]
- Rashetnia, S.; Sharma, A.K.; Ladson, A.R.; Browne, D.; Yaghoubi, E. A scoping review on Water Sensitive Urban Design aims and achievements. Urban Water J. 2022, 19, 453–467. [Google Scholar] [CrossRef]
- Adem Esmail, B.; Suleiman, L. Analyzing evidence of sustainable urban water mAnagement systems: A review through the lenses of sociotechnical transitions. Sustainability 2020, 12, 4481. [Google Scholar] [CrossRef]
- Cabañas-Melo, L.S.; Santiago, L.E.; Hernández-Marín, M.; Pacheco-Martínez, J. ‘Water Sensitive Cities’: Planning and evaluation of its theoretical application in a mexican city with high hydric stress. Sustainability 2022, 14, 12246. [Google Scholar] [CrossRef]
- Ahmed, S.; Meenar, M.; Alam, A. Designing a blue-green infrastructure (BGI) network: Toward water-sensitive urban growth planning in Dhaka, Bangladesh. Land 2019, 8, 138. [Google Scholar] [CrossRef] [Green Version]
- Lindsay, J.; Rogers, B.C.; Church, E.; Gunn, A.; Hammer, K.; Dean, A.J.; Fielding, K. The role of community champions in long-term sustainable urban water planning. Water 2019, 11, 476. [Google Scholar] [CrossRef] [Green Version]
- Sharma, S.; Nahid, S.; Sharma, M.; Sannigrahi, S.; Anees, M.M.; Sharma, R.; Shekhar, R.; Basu, A.S.; Pilla, F.; Basu, B.; et al. A Long-Term and Comprehensive Assessment of urbanization-induced impacts on ecosystem services in the capital city of India. City Env. Interact. 2020, 7, 100047. [Google Scholar] [CrossRef]
- Wang, S.; Padmanaban, R.; Shamsudeen, M.; Campos, F.S.; Cabral, P. Landscape impacts on ecosystem service values using the image fusion approach. Land 2022, 11, 1186. [Google Scholar] [CrossRef]
- Instituto Nacional de Estadística e Informática (INEI). Lima Supera Los 10 Millones de Habitantes al Año 2022; Lima, Peru. Available online: https://m.inei.gob.pe/prensa/noticias/lima-supera-los-10-millones-de-habitantes-al-ano-2022-13297/ (accessed on 7 December 2022).
- Servicio Nacional de Meteorología e Hidrología SENAMHI. Lima, Peru. Available online: https://www.senamhi.gob.pe/main.php?dp=lima&p=mapa-climatico-del-peru (accessed on 3 December 2022).
- Servicio de Agua Potable y Alcantarillado de Lima y Callao. Balance Oferta Demanda. In Gerencia de Desarrollo e Investigacion Plan Maestro de Los Sistemas de Agua Potable y Alcantarillado; Perú, 2014; Volume Tomo II, Available online: https://www.google.com.hk/url?sa=t&rct=j&q=&esrc=s&source=web&cd=&ved=2ahUKEwiGsLafjO77AhVBRd4KHR1eDK4QFnoECB4QAQ&url=https%3A%2F%2Fwww.sedapal.com.pe%2Fstorage%2Fobjects%2Ftomo-i-volumen-ii-diagnostico.pdf&usg=AOvVaw2WVBNEebhbOAGSouxrsk_Z (accessed on 7 December 2022).
- Servicio de Agua Potable y Alcantarillado de Lima y Callao. Balance Oferta Demanda. In Gerencia de Desarrollo e Investigacion Plan Maestro de Los Sistemas de Agua Potable y Alcantarillado. Quinquenio Regulatorio 2020–2025; Perú, 2019; Volume Tomo III, Available online: https://www.google.com.hk/url?sa=t&rct=j&q=&esrc=s&source=web&cd=&ved=2ahUKEwiXz4e9jO77AhVS1GEKHUtXC3sQFnoECCAQAQ&url=https%3A%2F%2Fwww.sedapal.com.pe%2Fstorage%2Fobjects%2Ftomo-iii-programa-de-inversions.pdf&usg=AOvVaw34mORbWxtEhEUXRPlU4KHN (accessed on 7 December 2022).
- CEPAL. División de Comercio Internacional e Integración Datos Estadísticos Del Informe de La Actividad Portuaria de América Latina y El Caribe 2018; Naciones Unidas: Lima, Perú, 2018. [Google Scholar]
- Un Frágil Ciclo: Agua, Energía y Población En Lima. Available online: https://www.wwf.org.pe/?219571/unfragilcicloaguaenergiaypoblacinenlima (accessed on 3 December 2022).
- Carhuavilca Bonett, D.; Sánchez Aguilar, A.; Robles Franco, J.; Fajardo Castillo, M.; Vásquez Chihuán, J.; Sumalave Velásquez, F.; Blas Alcántara, R. Estadísticas Ambientales; Instituto Nacional de Estadística e Informática INEI: Lima, Perú, 2021; p. 42. [Google Scholar]
- Tola, R. El Temporal Se Extiende Por Perú Con Deslizamientos e Inundaciones. El País, 16 March 2017. [Google Scholar]
- Mark, B.G.; French, A.; Baraer, M.; Carey, M.; Bury, J.; Young, K.R.; Polk, M.H.; Wigmore, O.; Lagos, P.; Crumley, R.; et al. Glacier loss and hydro-social risks in the Peruvian Andes. Glob. Planet. Chang. 2017, 159, 61–76. [Google Scholar] [CrossRef]
- Servicio Nacional de Meteorología e Hidrología de Perú. S. El Fenómeno del Niño en el Perú; Ministerio del Ambiente: Lima, Perú, 2014. [Google Scholar]
- Anjos, L.J.S.; de Souza, E.B.; Amaral, C.T.; Igawa, T.K.; de Toledo, P.M. Future projections for terrestrial biomes indicate widespread warming and moisture reduction in forests up to 2100 in South America. Glob. Ecol. Conserv. 2021, 25, e01441. [Google Scholar] [CrossRef]
- García-Ruiz, J.M.; López-Moreno, J.I.; Vicente-Serrano, S.M.; Lasanta–Martínez, T.; Beguería, S. Mediterranean water resources in a global change scenario. Earth Sci. Rev. 2011, 105, 121–139. [Google Scholar] [CrossRef] [Green Version]
- Verdier, J.; Viollet, P.-L. Les tensions sur l’eau en Europe et dans le bassin méditerranéen. Des crises de l’eau d’ici 2050. La Houille Blanche 2015, 101, 102–107. [Google Scholar] [CrossRef] [Green Version]
- Instituto Nacional de Estadística e Informática (INEI). Lima Tendría 9 Millones 111 mil Habitantes. 2017. Lima, Peru. Available online: https://www.inei.gob.pe/prensa/noticias/lima-tendria-9-millones-111-mil-habitantes-9531/ (accessed on 3 December 2022).
- Instituto Nacional de Estadística e Informática. I. Censos Nacionales 2017; 2017. Lima, Peru. Available online: https://censo2017.inei.gob.pe/ (accessed on 7 December 2022).
- Araya, Y.H.; Cabral, P. Analysis and modeling of urban land cover change in setúbal and sesimbra, portugal. Remote Sens. 2010, 2, 1549–1563. [Google Scholar] [CrossRef] [Green Version]
- Seto, K.C.; Fragkias, M. Quantifying spatiotemporal patterns of Urban land-use change in four cities of china with time series landscape metrics. Landsc. Ecol. 2005, 20, 871–888. [Google Scholar] [CrossRef]
- Vaz, E.; Taubenböck, H.; Kotha, M.; Arsanjani, J.J. Urban change in Goa, India. Habitat Int. 2017, 68, 24–29. [Google Scholar] [CrossRef]
- Paudel, S.; Yuan, F. Assessing landscape changes and dynamics using patch analysis and GIS modeling. Int. J. Appl. Earth Obs. Geoinf. 2012, 16, 66–76. [Google Scholar] [CrossRef]
- Kowe, P.; Mutanga, O.; Odindi, J.; Dube, T. A quantitative framework for analysing long term spatial clustering and vegetation fragmentation in an urban landscape using multi-temporal landsat data. Int. J. Appl. Earth Obs. Geoinf. 2020, 88, 102057. [Google Scholar] [CrossRef]
- Hexagon Geospatial. ERDAS IMAGINE; Hexagon Geospatial: Atlanta, GA, USA, 2014. [Google Scholar]
- Environmental Systems Research Institute (ESRI). ArcGIS PRO 2.8. 2021. Redlands, CA. Available online: https://www.esri.com/en-us/esri-press/browse/gis-tutorial-for-arcgis-pro-2-8 (accessed on 7 December 2022).
- Solicitar Conexión del Servicio de Agua Potable y Alcantarillado-Solicitar Conexión en Lima Metropolitana y Callao. Available online: https://www.gob.pe/659-solicitar-conexion-del-servicio-de-agua-potable-y-alcantarillado-solicitar-conexion-en-lima-metropolitana-y-callao (accessed on 4 December 2022).
- Moscoso Cavallini, J.C. Estudio de Opciones de Tratamiento y Reuso de Aguas Residuales En Lima Metropolitana. Master Thesis, University of Stuttgart, Stuttgart, Germany, 2011. [Google Scholar]
- Alaziz, A.I.A.; Al-Saqer, N.F. The reuse ofg recycling for high rise buildings in kuwait countryn. Engineering 2014, 4, 8. [Google Scholar]
- Knutsson, J.; Knutsson, P. Water and energy savings from greywater reuse: A modelling scheme using disaggregated consumption data. Int. J. Energy Water Resour. 2021, 5, 13–24. [Google Scholar] [CrossRef]
- Boano, F.; Caruso, A.; Costamagna, E.; Ridolfi, L.; Fiore, S.; Demichelis, F.; Galvão, A.; Pisoeiro, J.; Rizzo, A.; Masi, F. A review of nature-based solutions for greywater treatment: Applications, hydraulic design, and environmental benefits. Sci. Total. Env. 2020, 711, 134731. [Google Scholar] [CrossRef]
- Filali, H.; Barsan, N.; Souguir, D.; Nedeff, V.; Tomozei, C.; Hachicha, M. Greywater as an alternative solution for a sustainable management of water resources—A review. Sustainability 2022, 14, 665. [Google Scholar] [CrossRef]
- Klemm, O.; Schemenauer, R.S.; Lummerich, A.; Cereceda, P.; Marzol, V.; Corell, D.; van Heerden, J.; Reinhard, D.; Gherezghiher, T.; Olivier, J.; et al. Fog as a fresh-water resource: Overview and perspectives. AMBIO 2012, 41, 221–234. [Google Scholar] [CrossRef] [PubMed] [Green Version]
- Fernández Calvo, L. Conoce El Proyecto de Mallas Atrapanieblas Premiado Por Google. El Comer, 24 December 2017. [Google Scholar]
- Jaén, M.V.M. Fog water collection in a rural park in the Canary Islands (Spain). Atmospheric Res. 2002, 64, 239–250. [Google Scholar] [CrossRef]
- Giurco, D.P.; Turner, A.; Fane, S.; White, S.B. Desalination for urban water: Changing perceptions and future scenarios in australia. Chem. Eng. Trans. 2014, 42, 13–18. [Google Scholar] [CrossRef]
- Pistocchi, A.; Bleninger, T.; Breyer, C.; Caldera, U.; Dorati, C.; Ganora, D.; Millán, M.M.; Paton, C.; Poullis, D.; Herrero, F.S.; et al. Can seawater desalination be a win-win fix to our water cycle? Water Res. 2020, 182, 115906. [Google Scholar] [CrossRef]
- Voutchkov, N. Energy use for membrane seawater desalination–current status and trends. Desalination 2018, 431, 2–14. [Google Scholar] [CrossRef]
- Giezen, M.; Balikci, S.; Arundel, R. Using remote sensing to analyse net land-use change from conflicting sustainability policies: The case of amsterdam. ISPRS Int. J. Geo Inf. 2018, 7, 381. [Google Scholar] [CrossRef] [Green Version]
- Vega Córdova, É. Crecimiento Inmobiliario Vertical de Lima Muestra Comportamientos Diferenciados. El Comer, 5 May 2021. [Google Scholar]
- Kookana, R.S.; Drechsel, P.; Jamwal, P.; Vanderzalm, J. Urbanisation and emerging economies: Issues and potential solutions for water and food security. Sci. Total. Env. 2020, 732, 139057. [Google Scholar] [CrossRef]
- SBR Vollbiologische Kleinkläranlage easyOne Einbehälteranlage Begehbar. Available online: https://www.graf.info/de/abwasser/kleinklaeranlagen/easyone-einbehaelteranlage/sbr-vollbiologische-kleinklaeranlage-easyone-einbehaelteranlage-begehbar.html (accessed on 4 December 2022).
- Indicador: Superficie de Area Verde Urbana por Habitante en Lima Metropolitana. Available online: https://sinia.minam.gob.pe/indicador/998 (accessed on 4 December 2022).
- Evans, D.L.; Falagán, N.; Hardman, C.A.; Kourmpetli, S.; Liu, L.; Mead, B.R.; Davies, J.A.C. Ecosystem service delivery by urban agriculture and green infrastructure—A systematic review. Ecosyst. Serv. 2022, 54, 101405. [Google Scholar] [CrossRef]
- Instituto Nacional de Estadística e Informática (INEI). Viviendas Con Abastecimiento de Agua Por Red Pública–Provincia de Lima. 2013. Lima, Perú. Available online: https://www.inei.gob.pe/media/MenuRecursivo/publicaciones_digitales/Est/Lib1411/cap01_02.pdf (accessed on 7 December 2022).
- Caldera, U.; Sadiqa, A.; Gulagi, A.; Breyer, C. Irrigation efficiency and renewable energy powered desalination as key components of Pakistan’s water management strategy. Smart Energy 2021, 4, 100052. [Google Scholar] [CrossRef]
- Redacción El Comercio. El costo del agua barata. El Comer. 27 March 2017, p. 07H00. Available online: https://elcomercio.pe/economia/costo-agua-barata-422518-noticia/ (accessed on 7 December 2022).
- Van der Ent, R.J.; Savenije, H.H.G.; Schaefli, B.; Steele-Dunne, S.C. Origin and fate of atmospheric moisture over continents. Water Resour. Res. 2010, 46, W09525. [Google Scholar] [CrossRef]
- Jimenez, R.; Zucheti, A.; Jimenez, M.; Abanto, J.; Cano Echevarria, A.; Roque Gamarra, J.; Sisniegas, H.; Mamani, J. Servicio de Parques de Lima (SERPAR) Lomas de Lima, Futuros Parques de La Ciudad; Municipalidad Metropolitana de Lima: Lima, Perú, 2014. [Google Scholar]
- Leon, T.; Ocola, L.; Rojas, J. Ubicación de La Mayor Concentración de Nieblas de Advección En La Costa Central Del Perú Usando Datos Satelitales Para Utilizarlo Como Fuente de Agua Dulce. In Proceedings of the Workshop de Mecánica de Fluidos, 50 Aniversario EPIMF, UNMSM, Lima, Perú, 4–6 November 2019. [Google Scholar]
- Abualhamayel, H.I.; Gandhidasan, P. Design and testing of large fog collectors for water harvesting in Asir region, Kingdom of Saudi Arabia. In Proceedings of the 5th International Conference on Fog, Fog Collection and Dew, Münster, Germany, 25–30 July 2010. [Google Scholar]
- Mishra, G.; Acharya, G.; Iyer, M.; Doshi, S. Deconstructing water sensitivity: Experiences from global cities. IOP Conf. Ser. Earth Env. Sci. 2020, 592, 012012. [Google Scholar] [CrossRef]


| YEAR | CLASS | CA (km2) | PLAND | SHAPE_MN | FRAC_MN | FRAC_AM | PLADJ | AI |
|---|---|---|---|---|---|---|---|---|
| 1990 | Bare land | 2126.39 | 76.426 | 1.204 | 1.041 | 1.178 | 98.745 | 98.81 |
| Urban | 381.03 | 13.695 | 1.237 | 1.043 | 1.322 | 92.064 | 92.206 | |
| Vegetation | 273.36 | 9.825 | 1.188 | 1.038 | 1.223 | 91.695 | 91.862 | |
| Other | 1.5 | 0.054 | 1.661 | 1.078 | 1.179 | 77.488 | 79.441 | |
| 2008 | Bare land | 1939.18 | 69.84 | 1.185 | 1.039 | 1.154 | 98.667 | 98.734 |
| Urban | 627.16 | 22.613 | 1.246 | 1.044 | 1.335 | 93.434 | 93.546 | |
| Vegetation | 194.88 | 7.053 | 1.192 | 1.041 | 1.208 | 89.105 | 89.297 | |
| Other | 12.69 | 0.495 | 1.224 | 1.046 | 1.1 | 64.21 | 64.736 | |
| 2021 | Bare land | 1787.96 | 64.263 | 1.181 | 1.047 | 1.385 | 95.016 | 95.038 |
| Urban | 788.37 | 28.336 | 1.183 | 1.045 | 1.472 | 85.605 | 85.635 | |
| Vegetation | 186.21 | 6.693 | 1.15 | 1.042 | 1.272 | 81.463 | 81.523 | |
| Other | 19.73 | 0.709 | 1.137 | 1.04 | 1.188 | 58.83 | 58.963 |
| YEAR | CONTIG_MN | CONTIG_AM | CONTAG | DIVISION | SHDI | SHEI | AI |
|---|---|---|---|---|---|---|---|
| 1990 | 0.2934 | 0.9678 | 69.6952 | 0.7676 | 0.7098 | 0.512 | 97.2123 |
| 2008 | 0.2854 | 0.9625 | 65.784 | 0.8543 | 0.8001 | 0.5772 | 96.7274 |
| 2021 | 0.1179 | 0.9077 | 57.2195 | 0.8699 | 0.8576 | 0.6186 | 91.2133 |
Publisher’s Note: MDPI stays neutral with regard to jurisdictional claims in published maps and institutional affiliations. |
© 2022 by the authors. Licensee MDPI, Basel, Switzerland. This article is an open access article distributed under the terms and conditions of the Creative Commons Attribution (CC BY) license (https://creativecommons.org/licenses/by/4.0/).
Share and Cite
Ramirez Herrera, A.C.; Bauer, S.; Peña Guillen, V. Water-Sensitive Urban Plan for Lima Metropolitan Area (Peru) Based on Changes in the Urban Landscape from 1990 to 2021. Land 2022, 11, 2261. https://doi.org/10.3390/land11122261
Ramirez Herrera AC, Bauer S, Peña Guillen V. Water-Sensitive Urban Plan for Lima Metropolitan Area (Peru) Based on Changes in the Urban Landscape from 1990 to 2021. Land. 2022; 11(12):2261. https://doi.org/10.3390/land11122261
Chicago/Turabian StyleRamirez Herrera, Andrea Cristina, Sonja Bauer, and Victor Peña Guillen. 2022. "Water-Sensitive Urban Plan for Lima Metropolitan Area (Peru) Based on Changes in the Urban Landscape from 1990 to 2021" Land 11, no. 12: 2261. https://doi.org/10.3390/land11122261