
Rapid Characterisation of Stakeholder Networks in Three Catchments Reveals Contrasting Land-Water Management Issues

Abstract
:1. Introduction
2. Materials and Methods
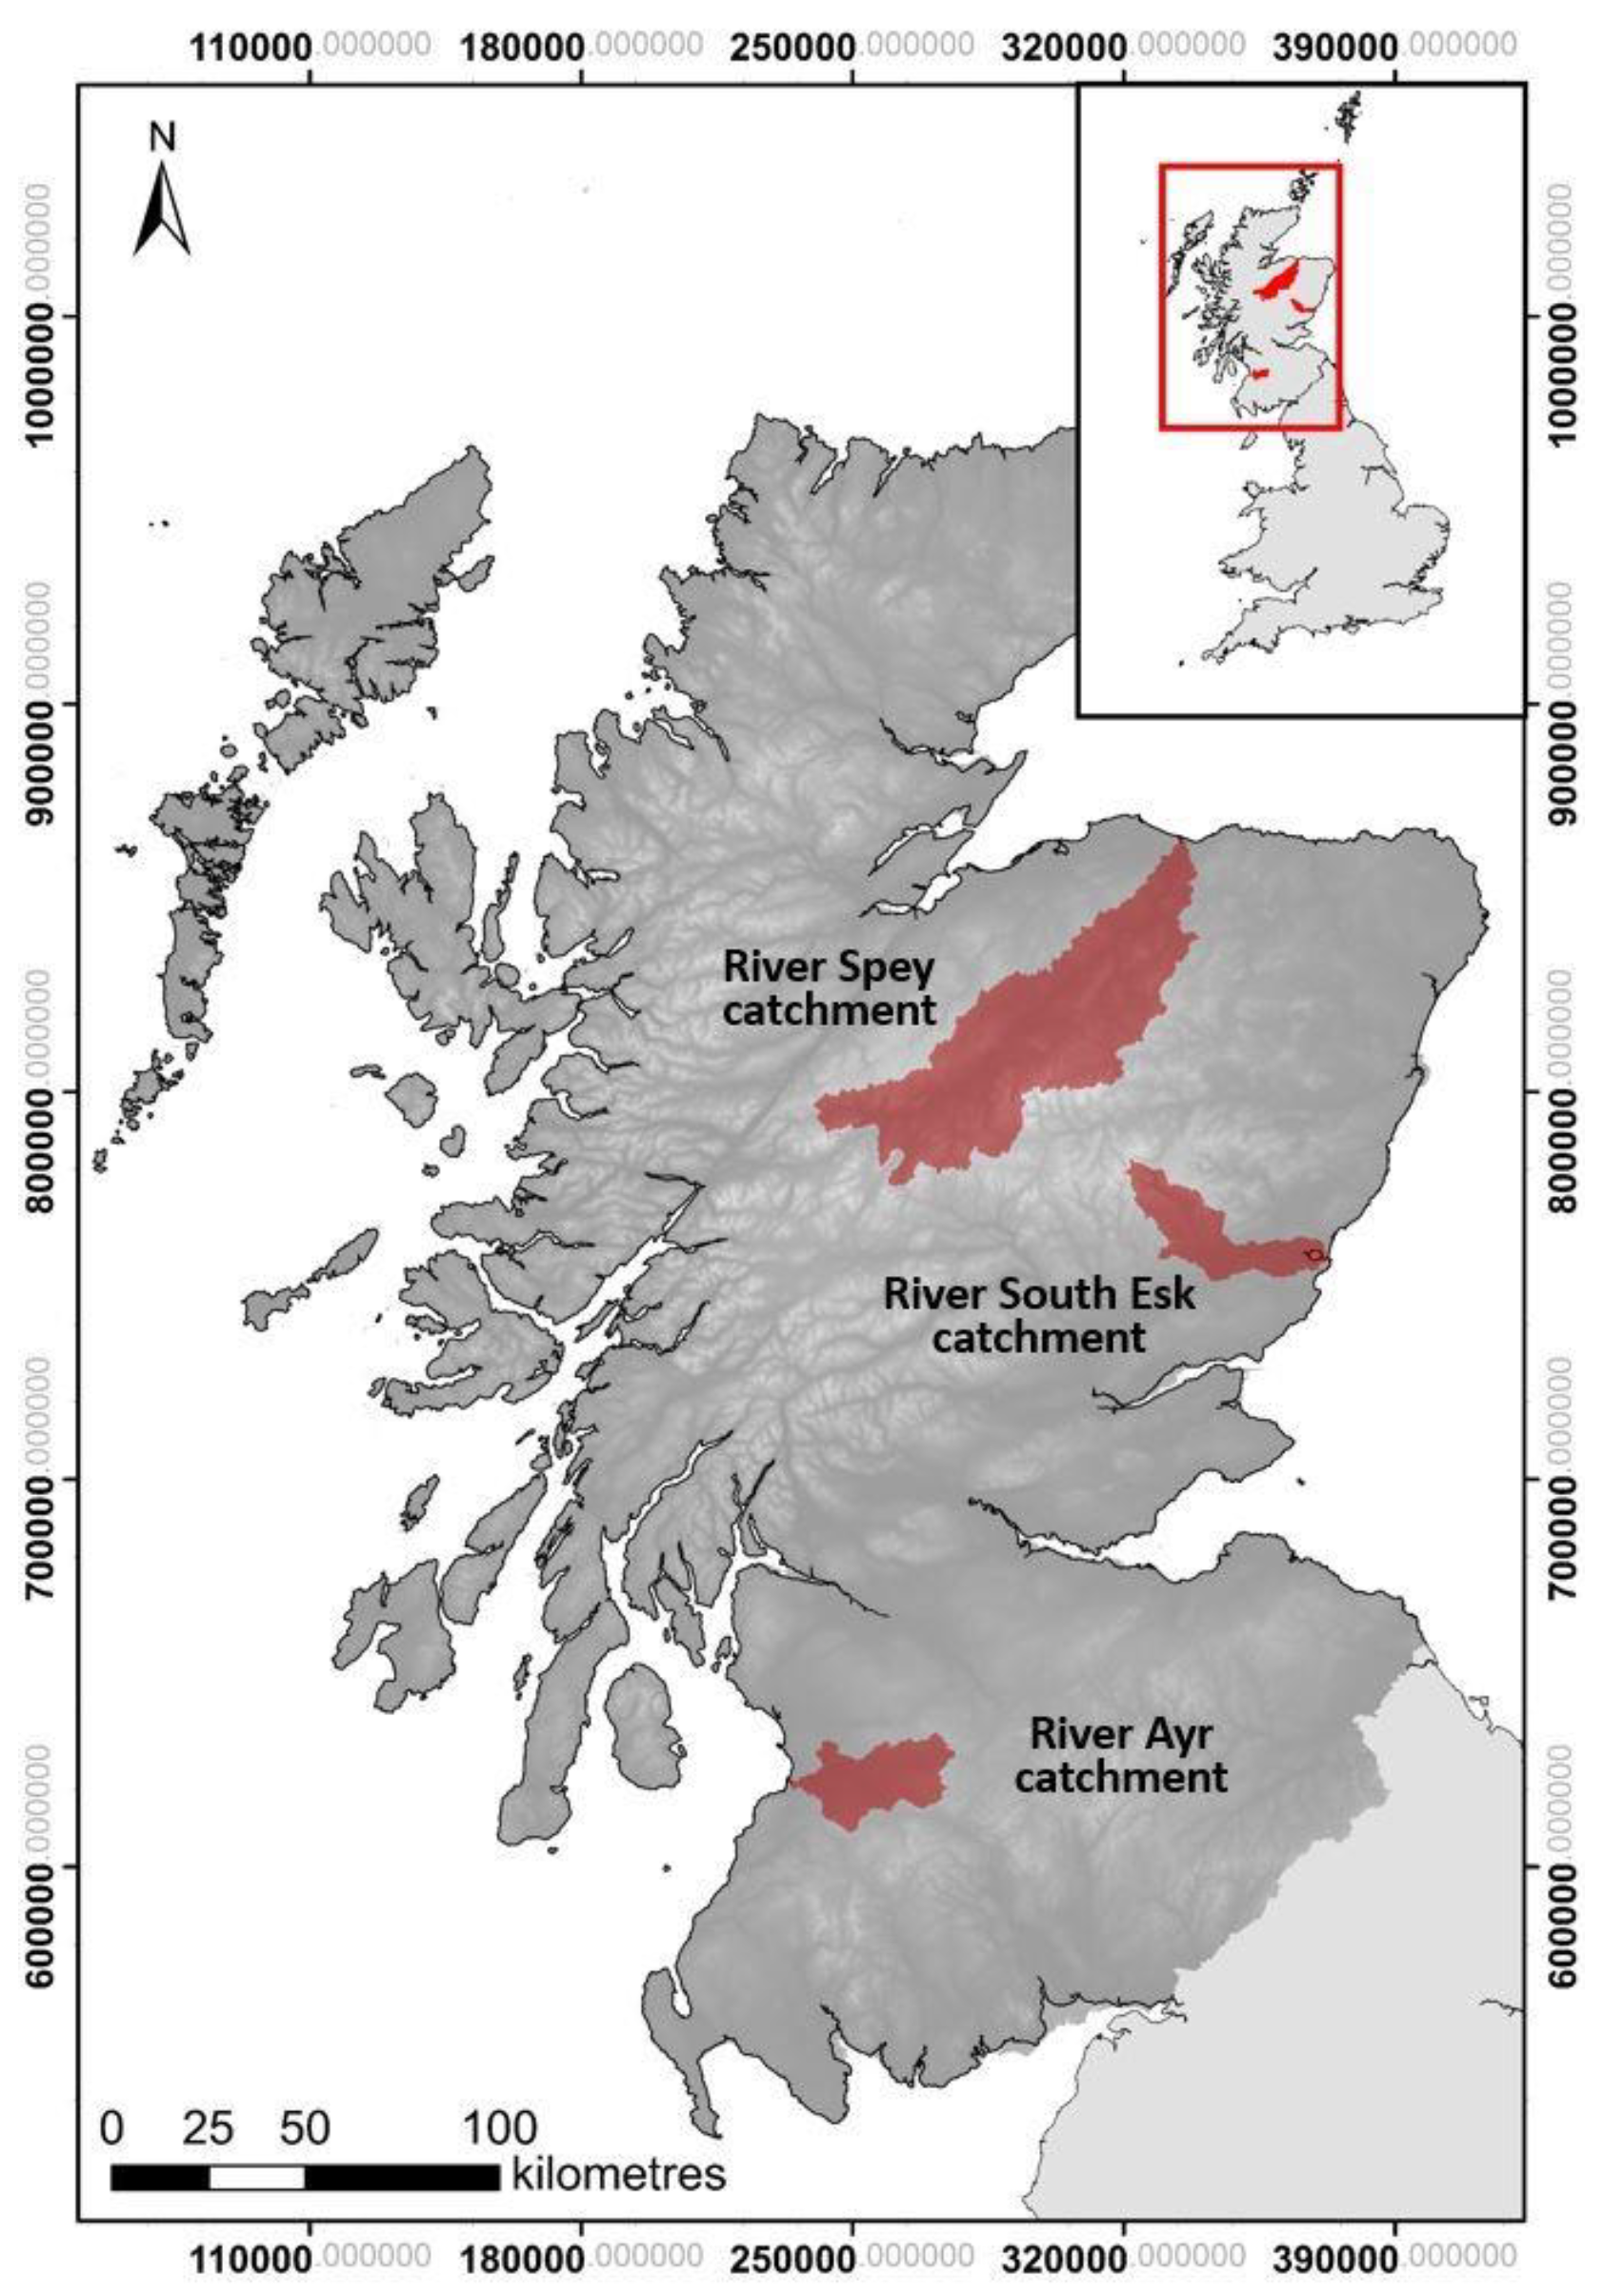
2.1. The Case Study Catchments
2.2. Sample Selection and Design of Engagement Exercise
2.3. Data Analysis
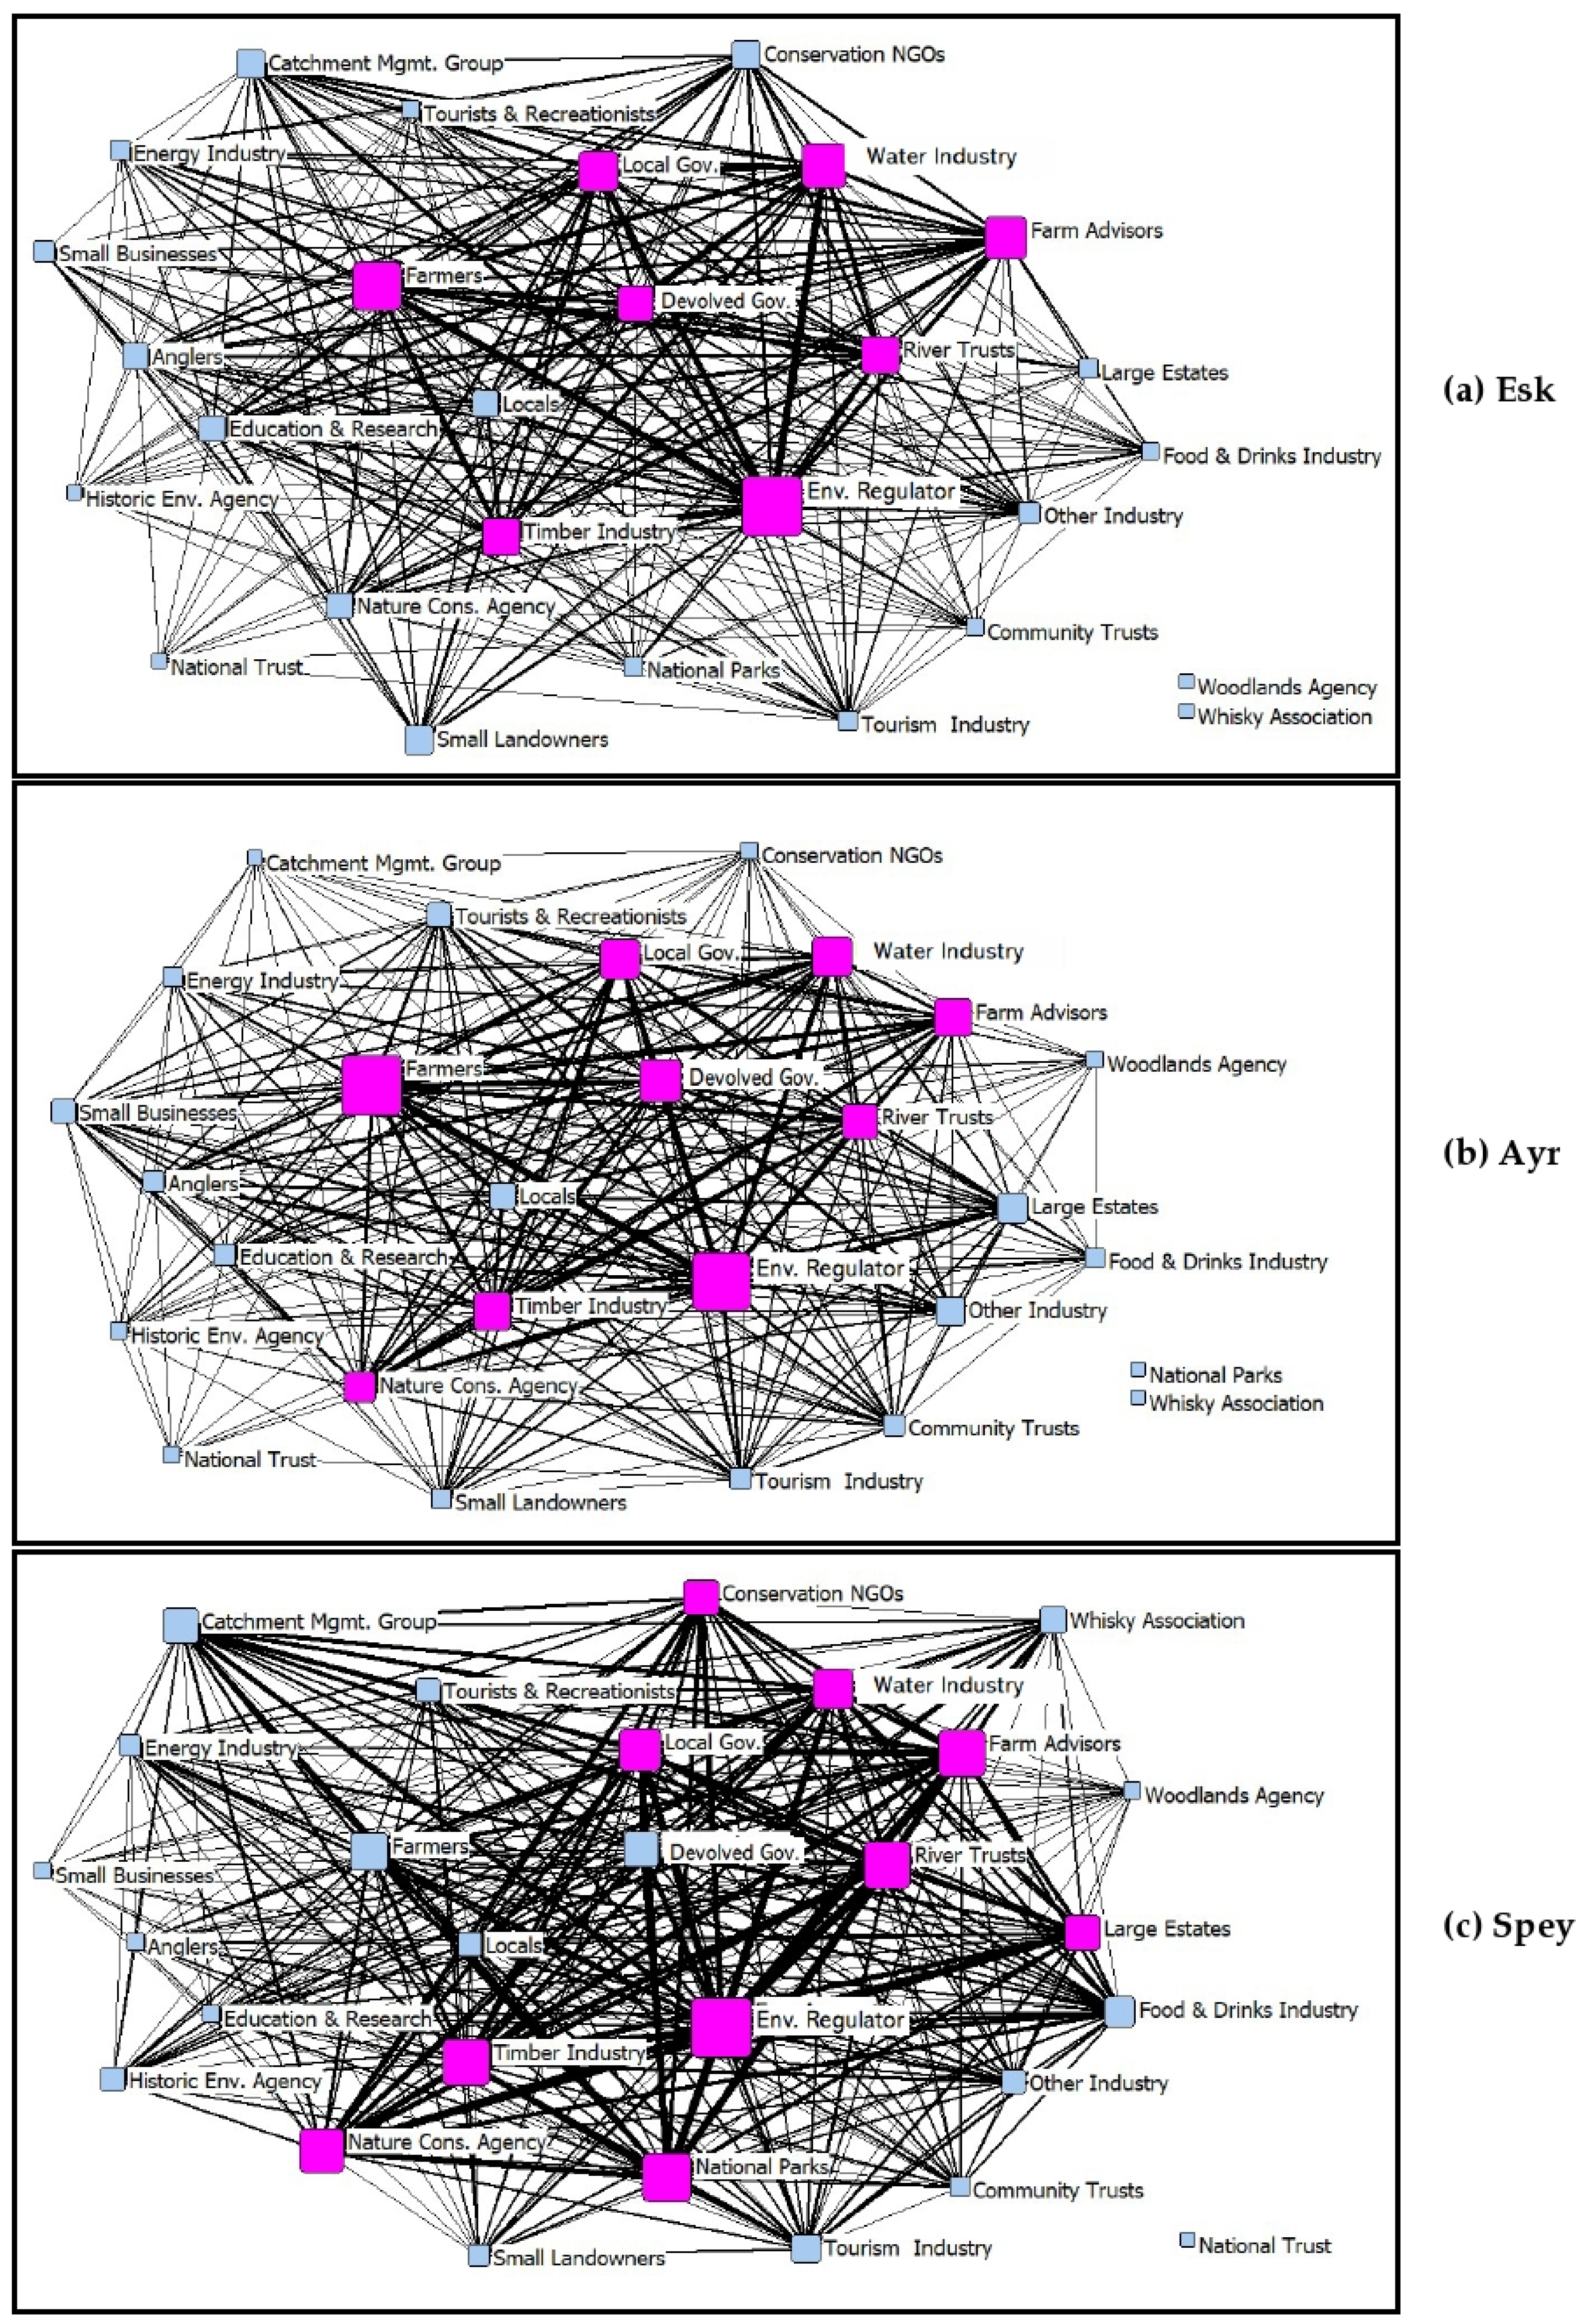
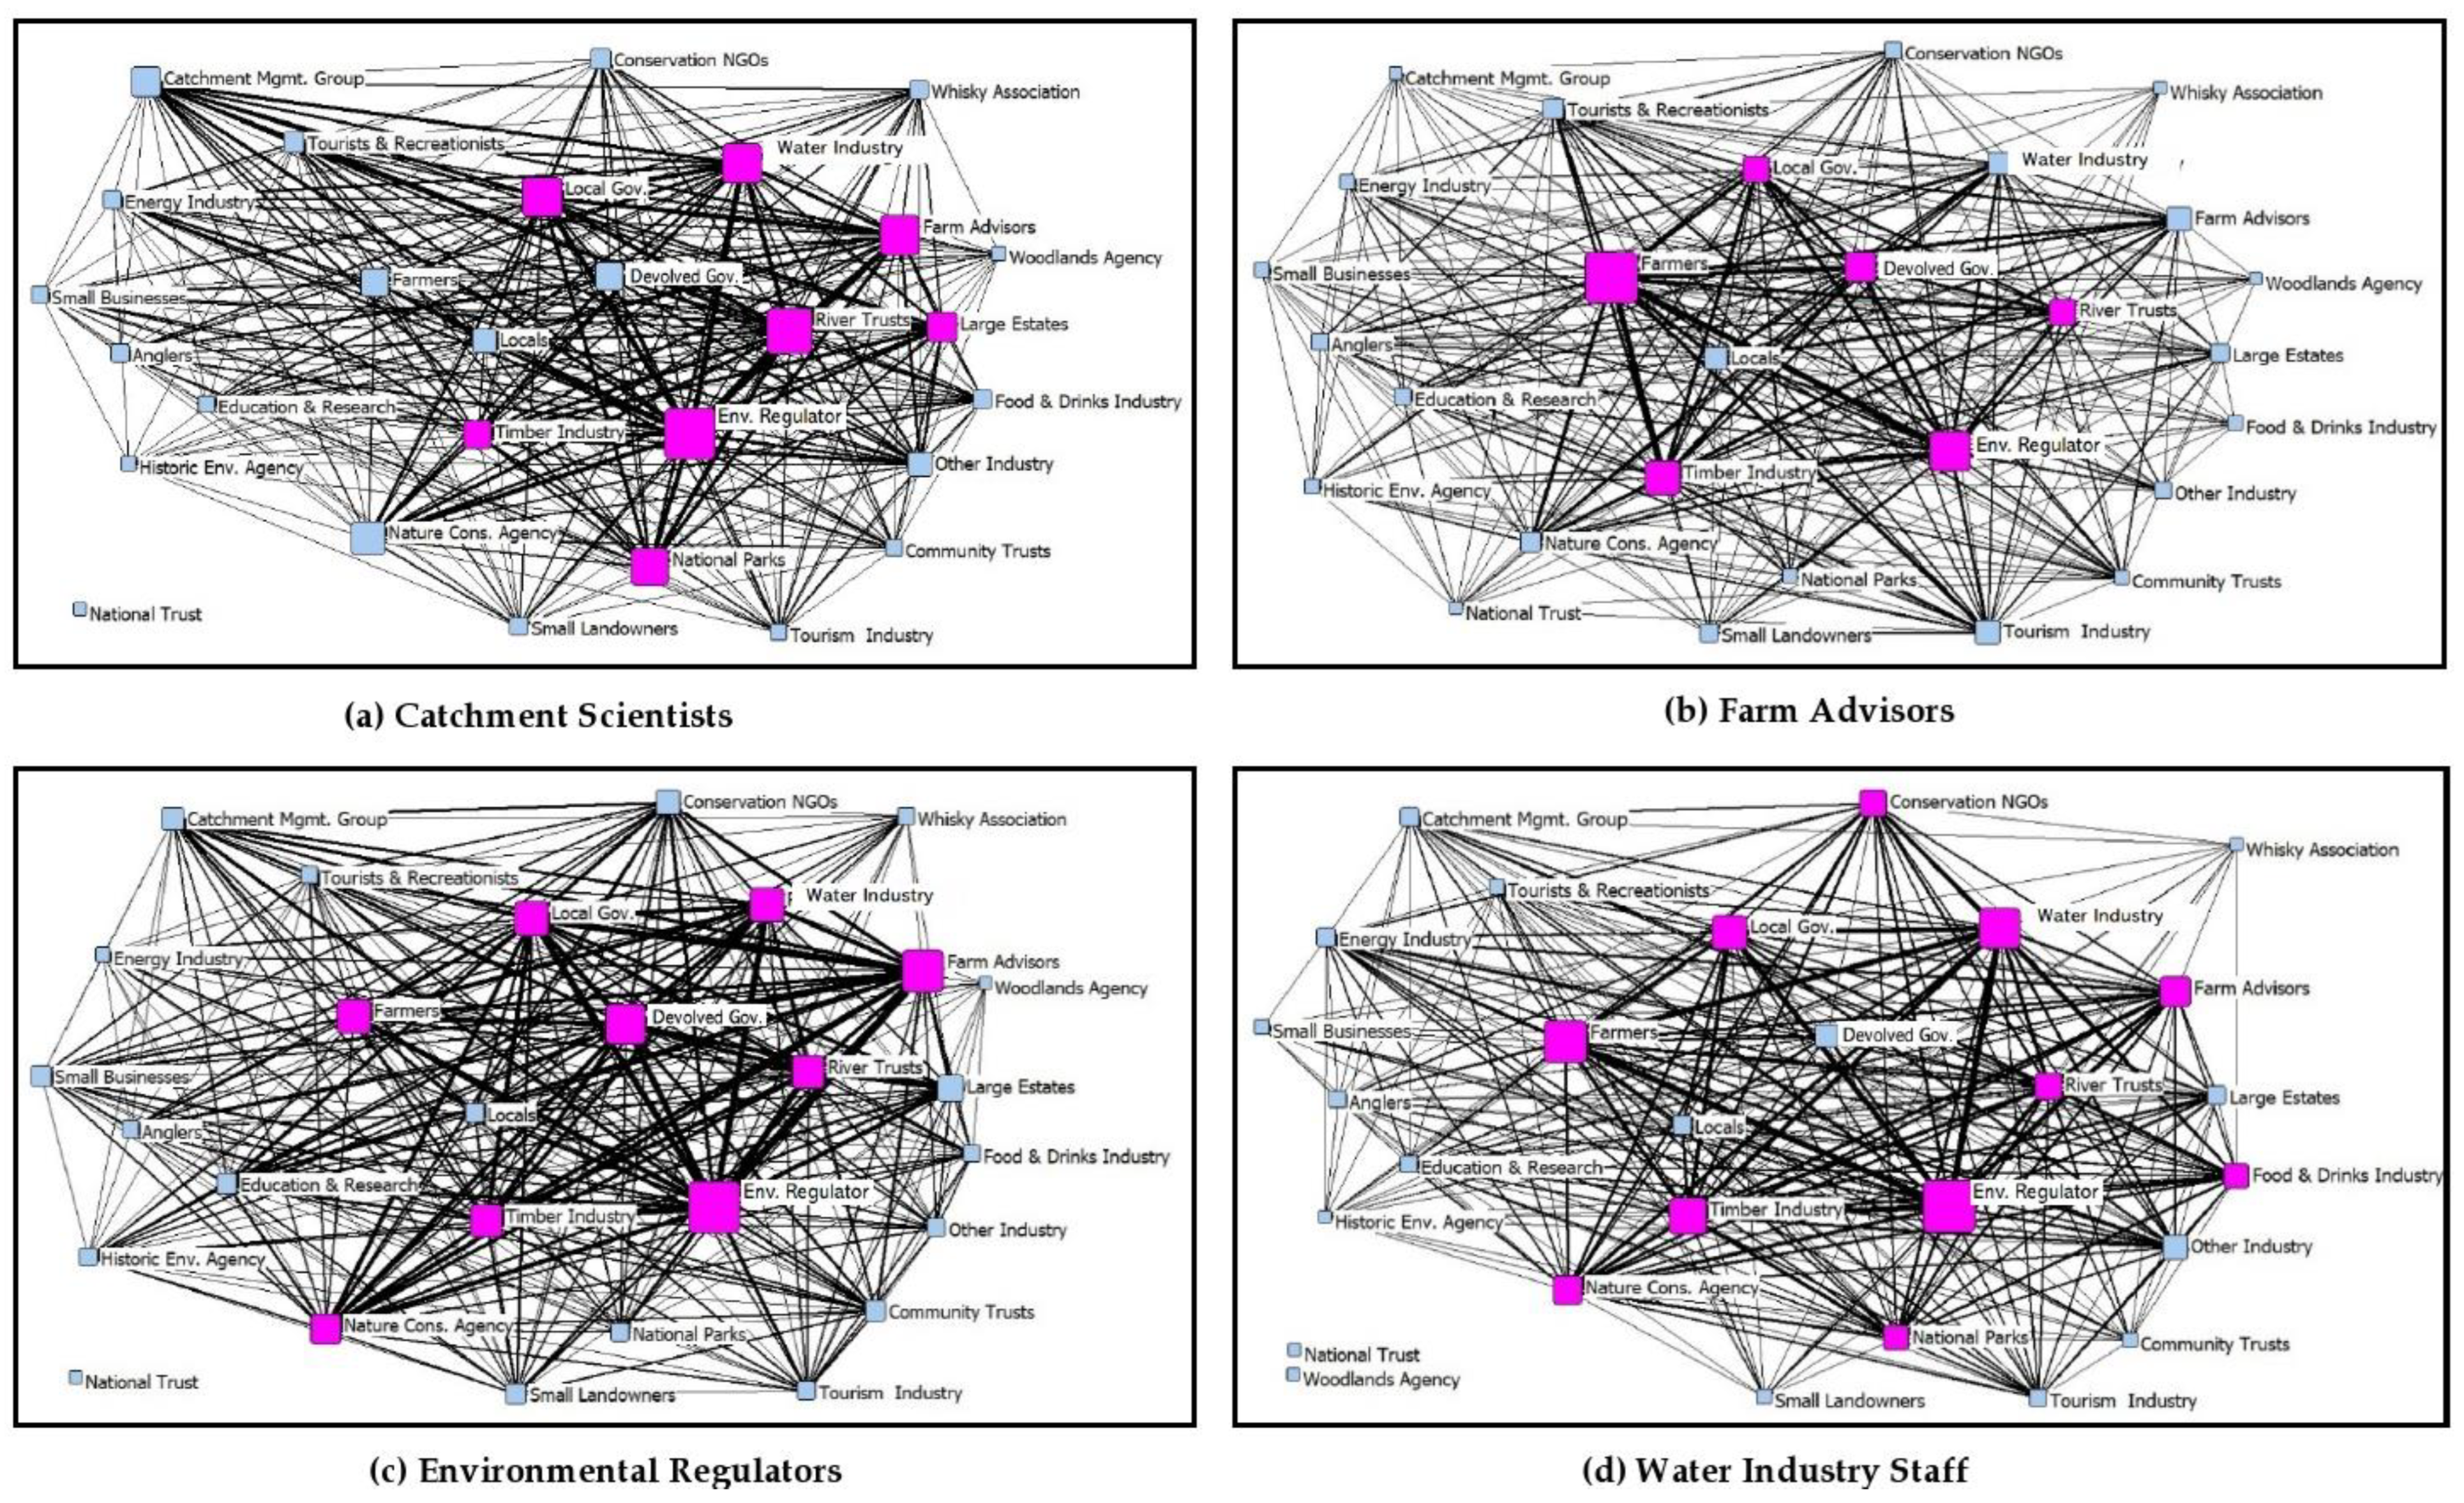
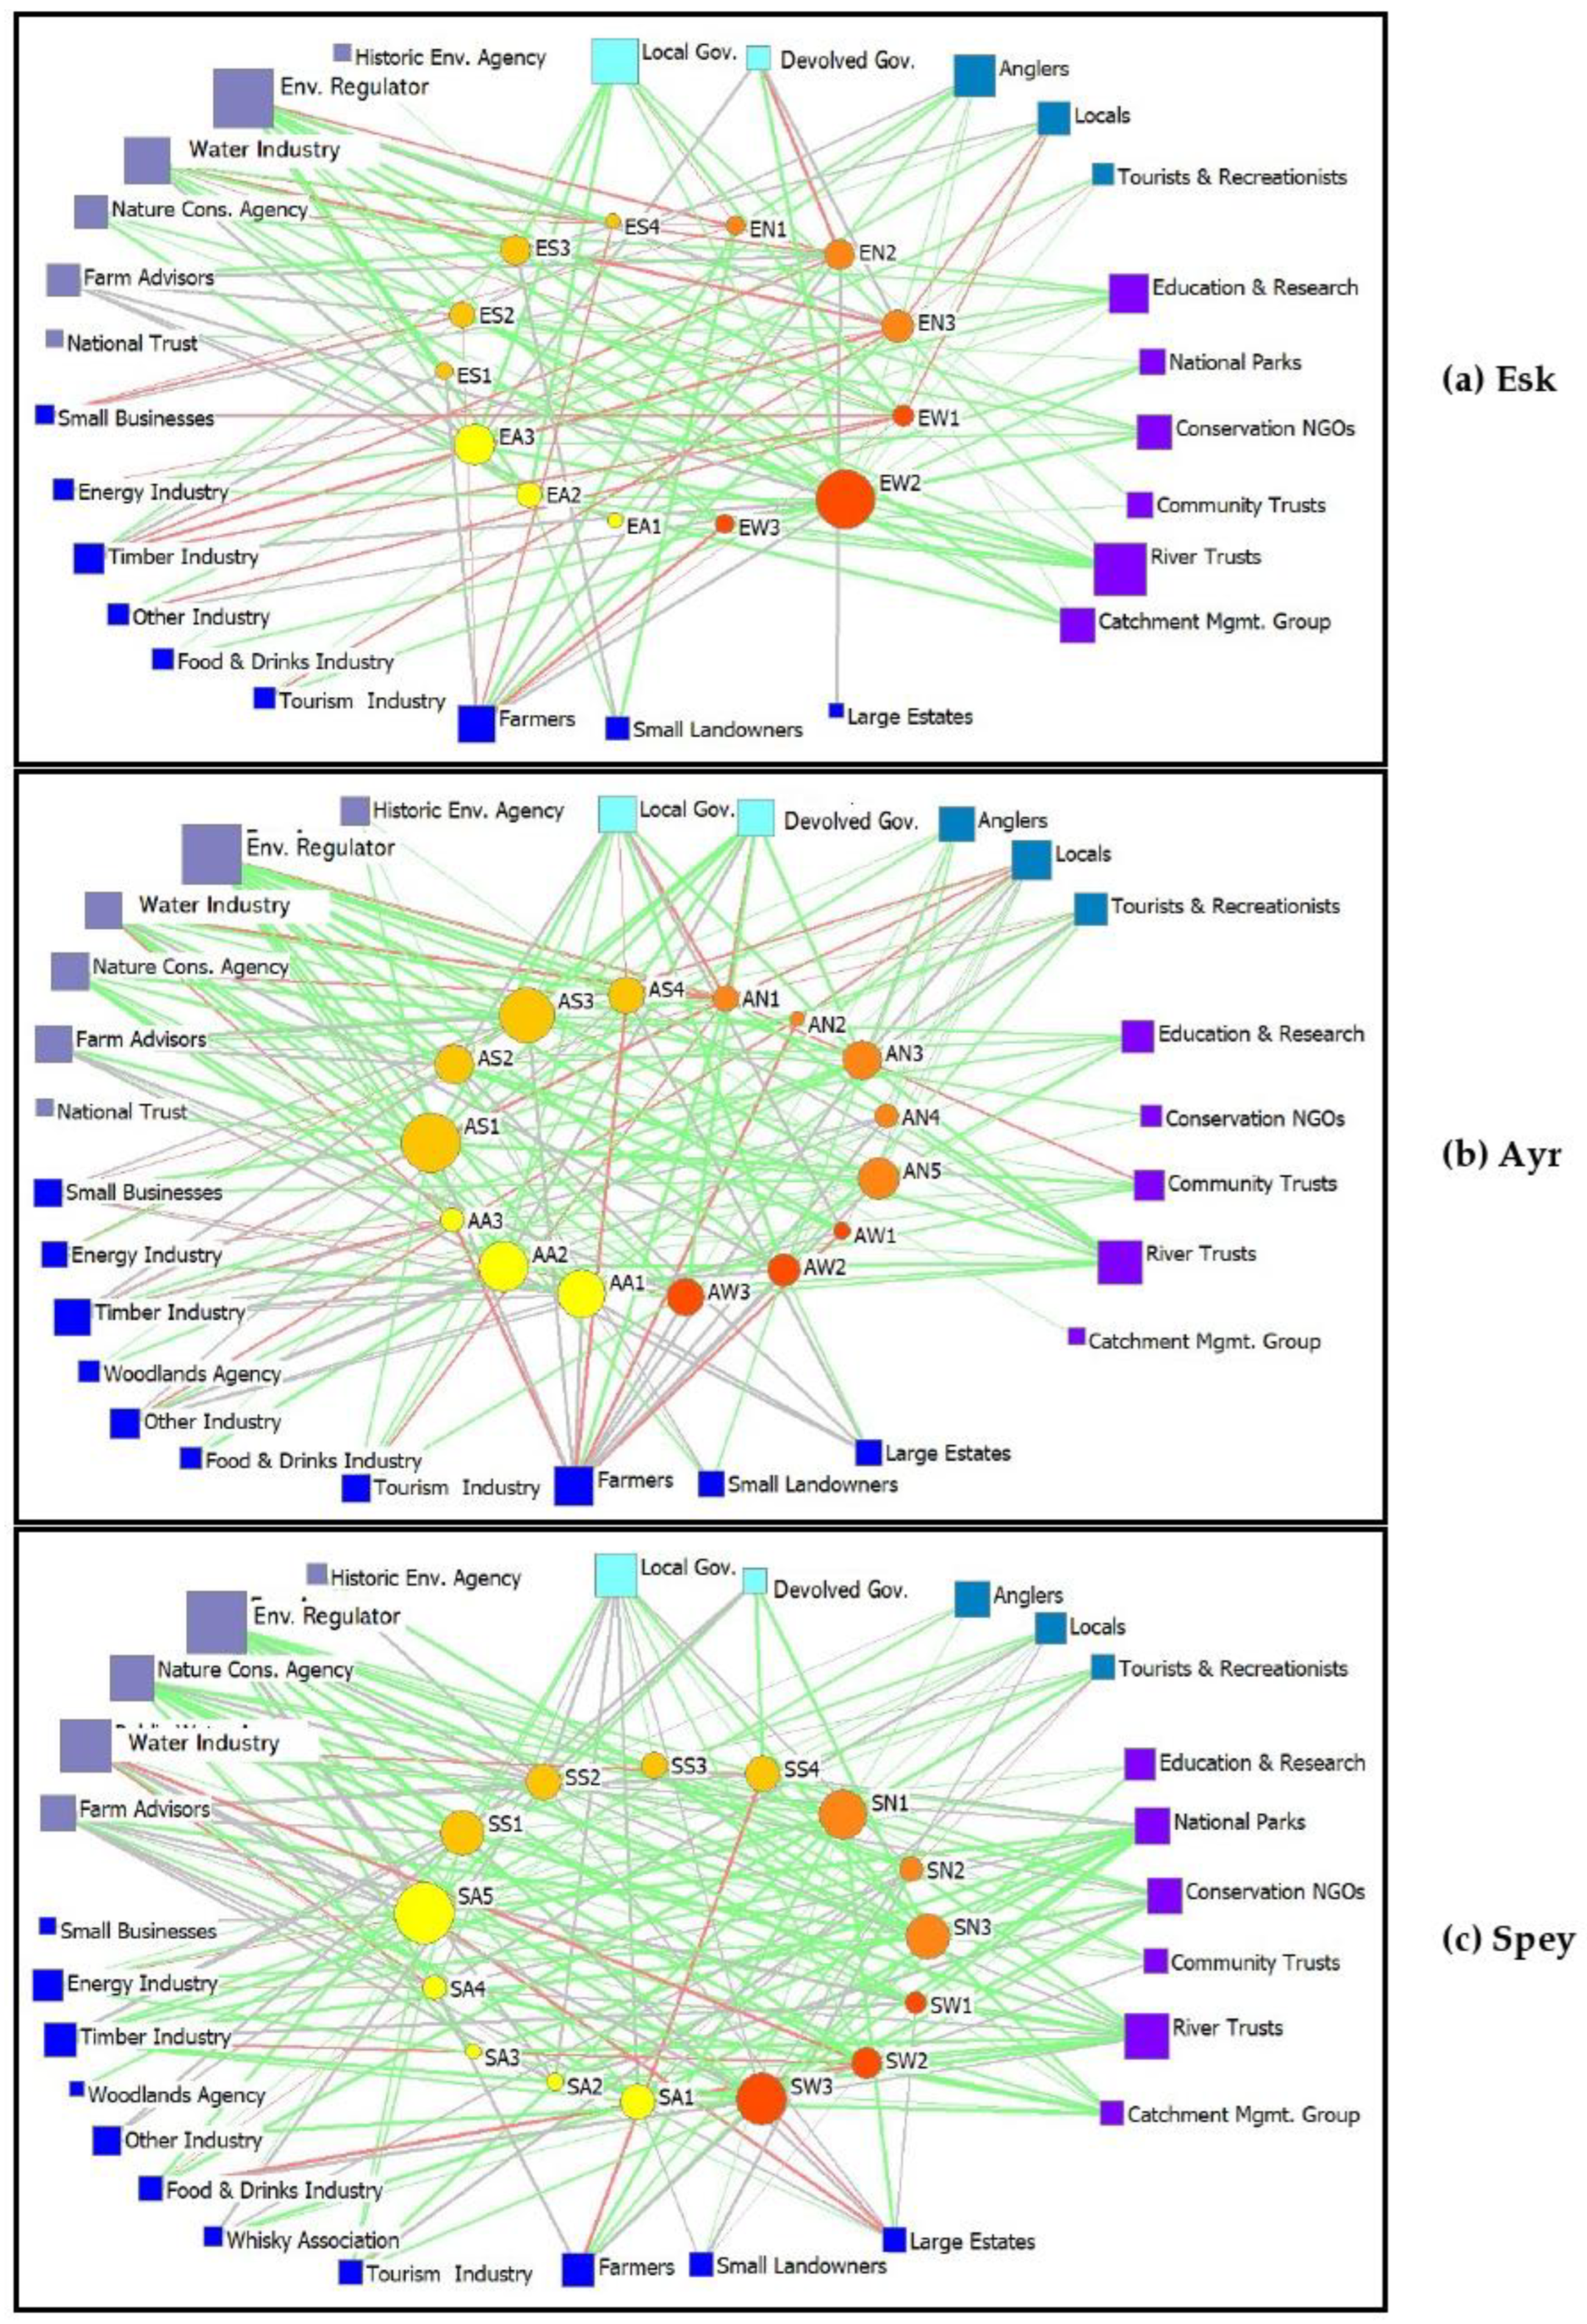
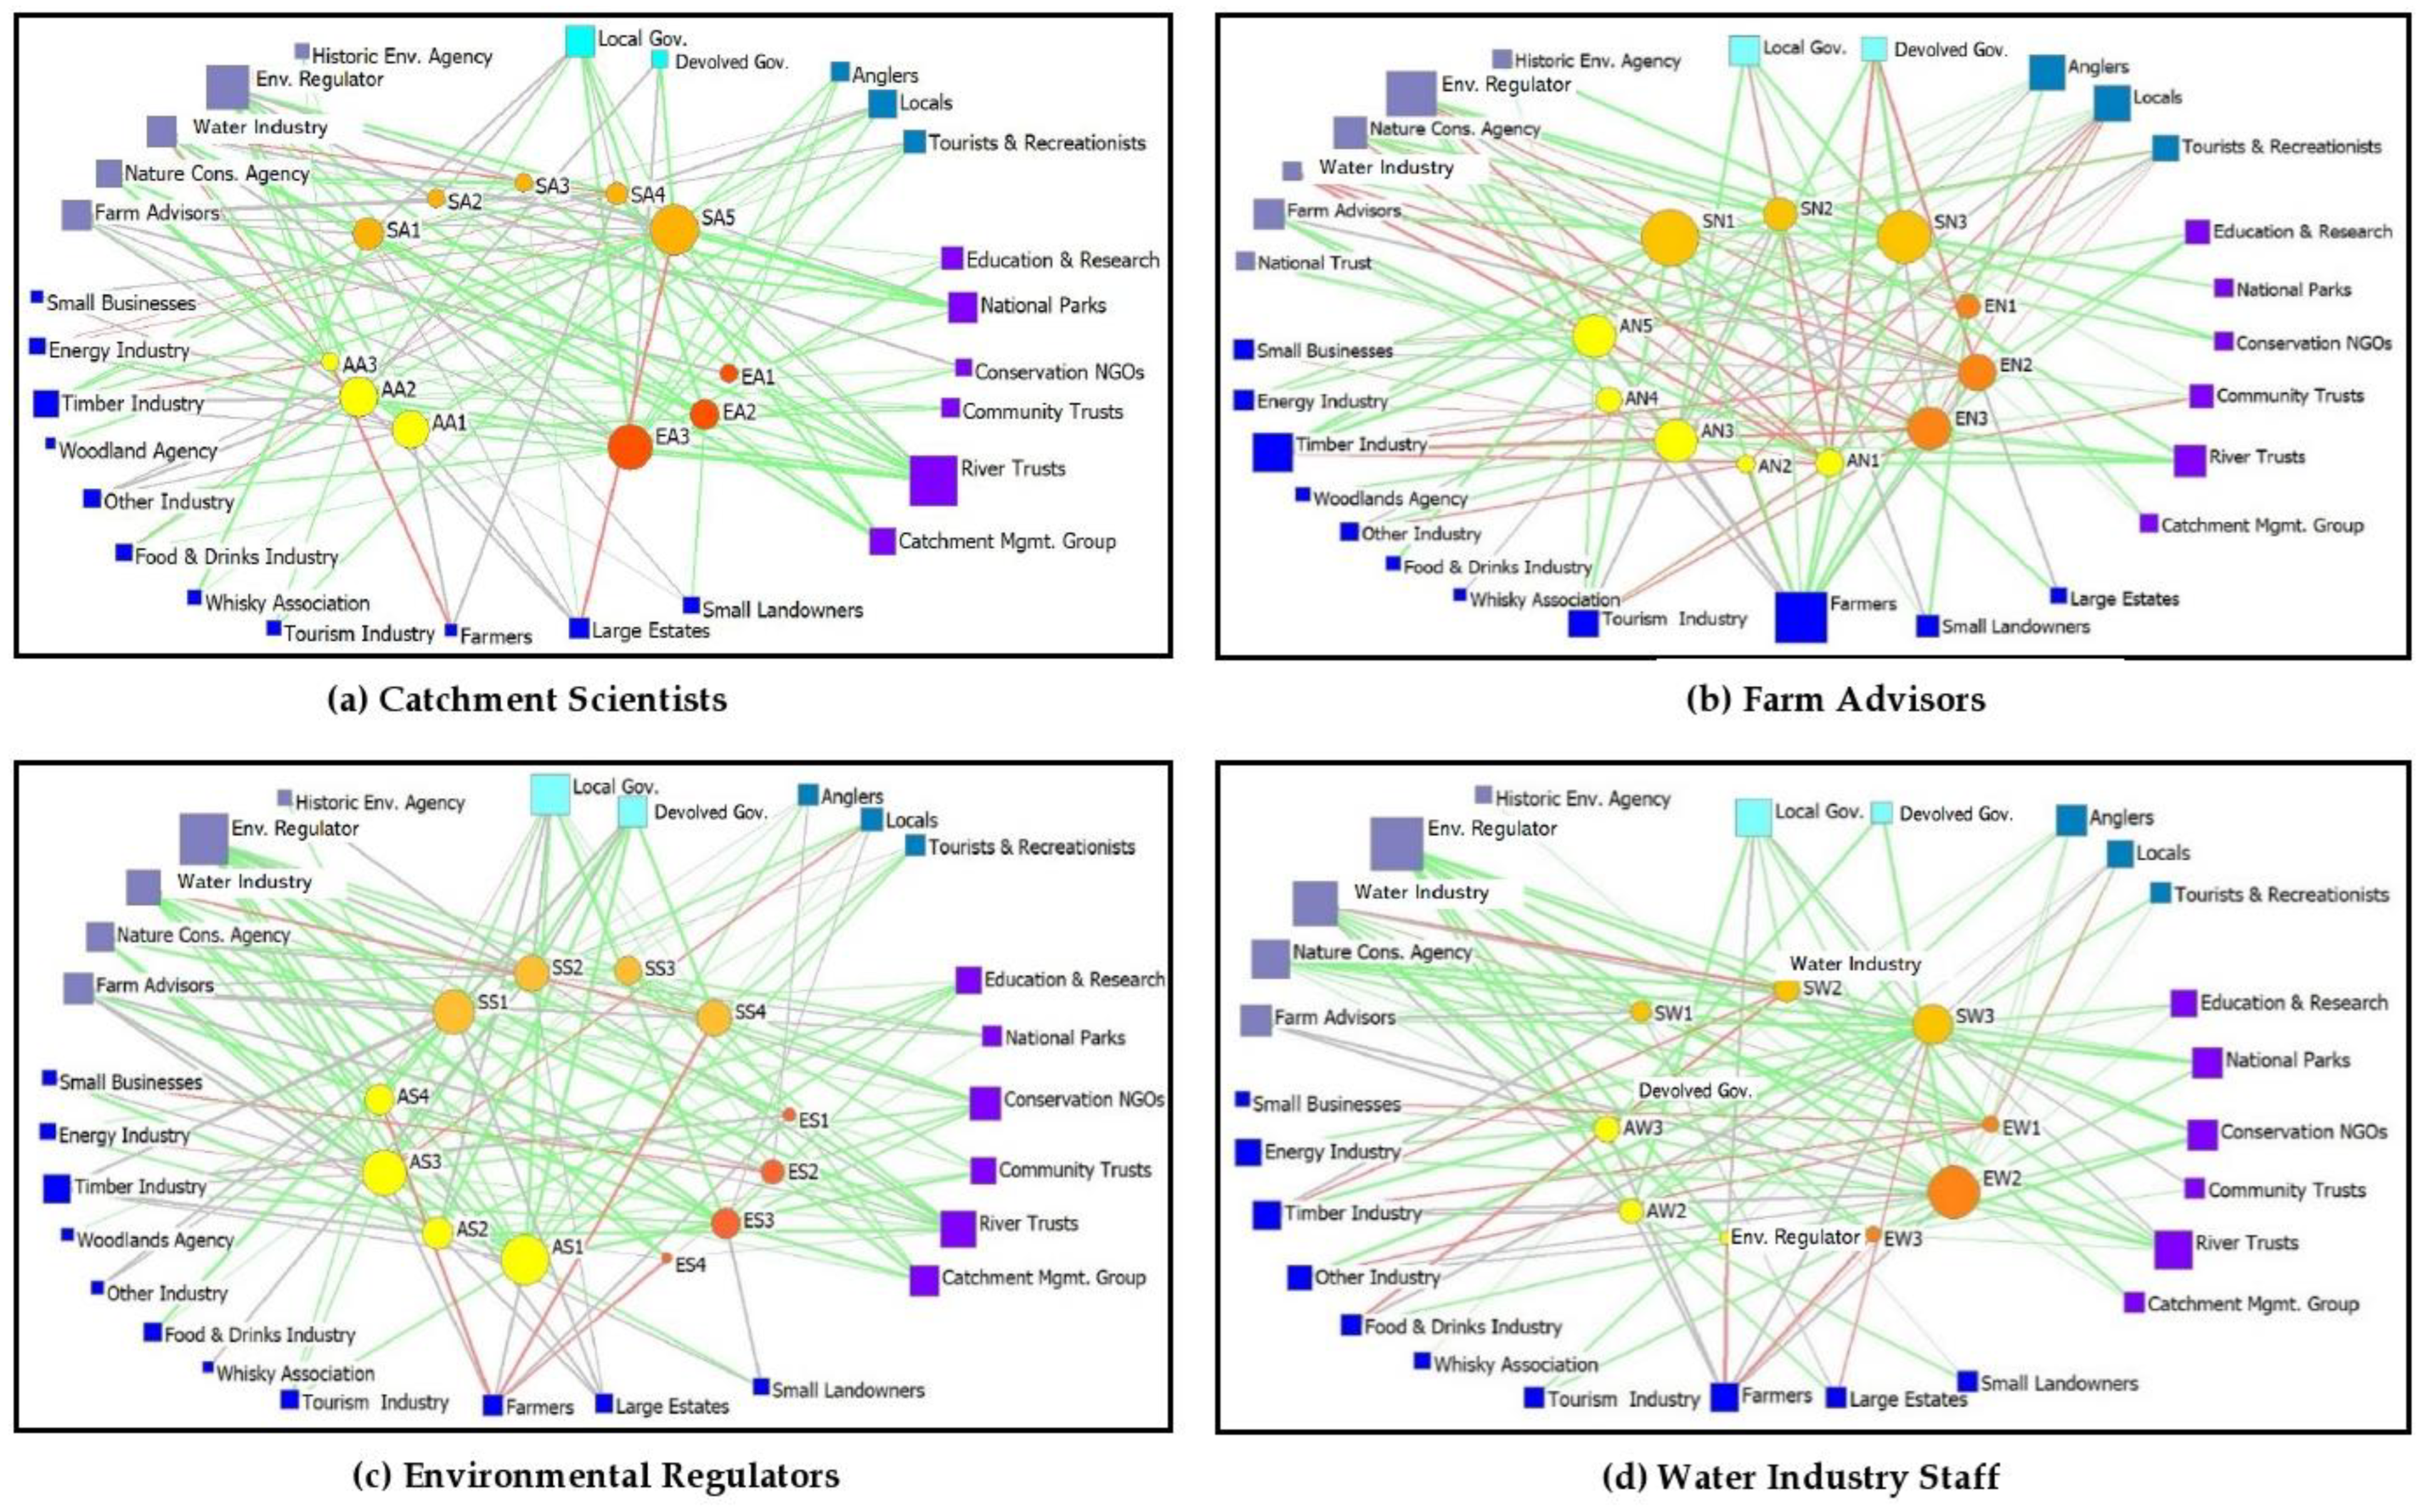
3. Results
4. Discussion
4.1. Contrasting Catchments and Their Stakeholder Typologies
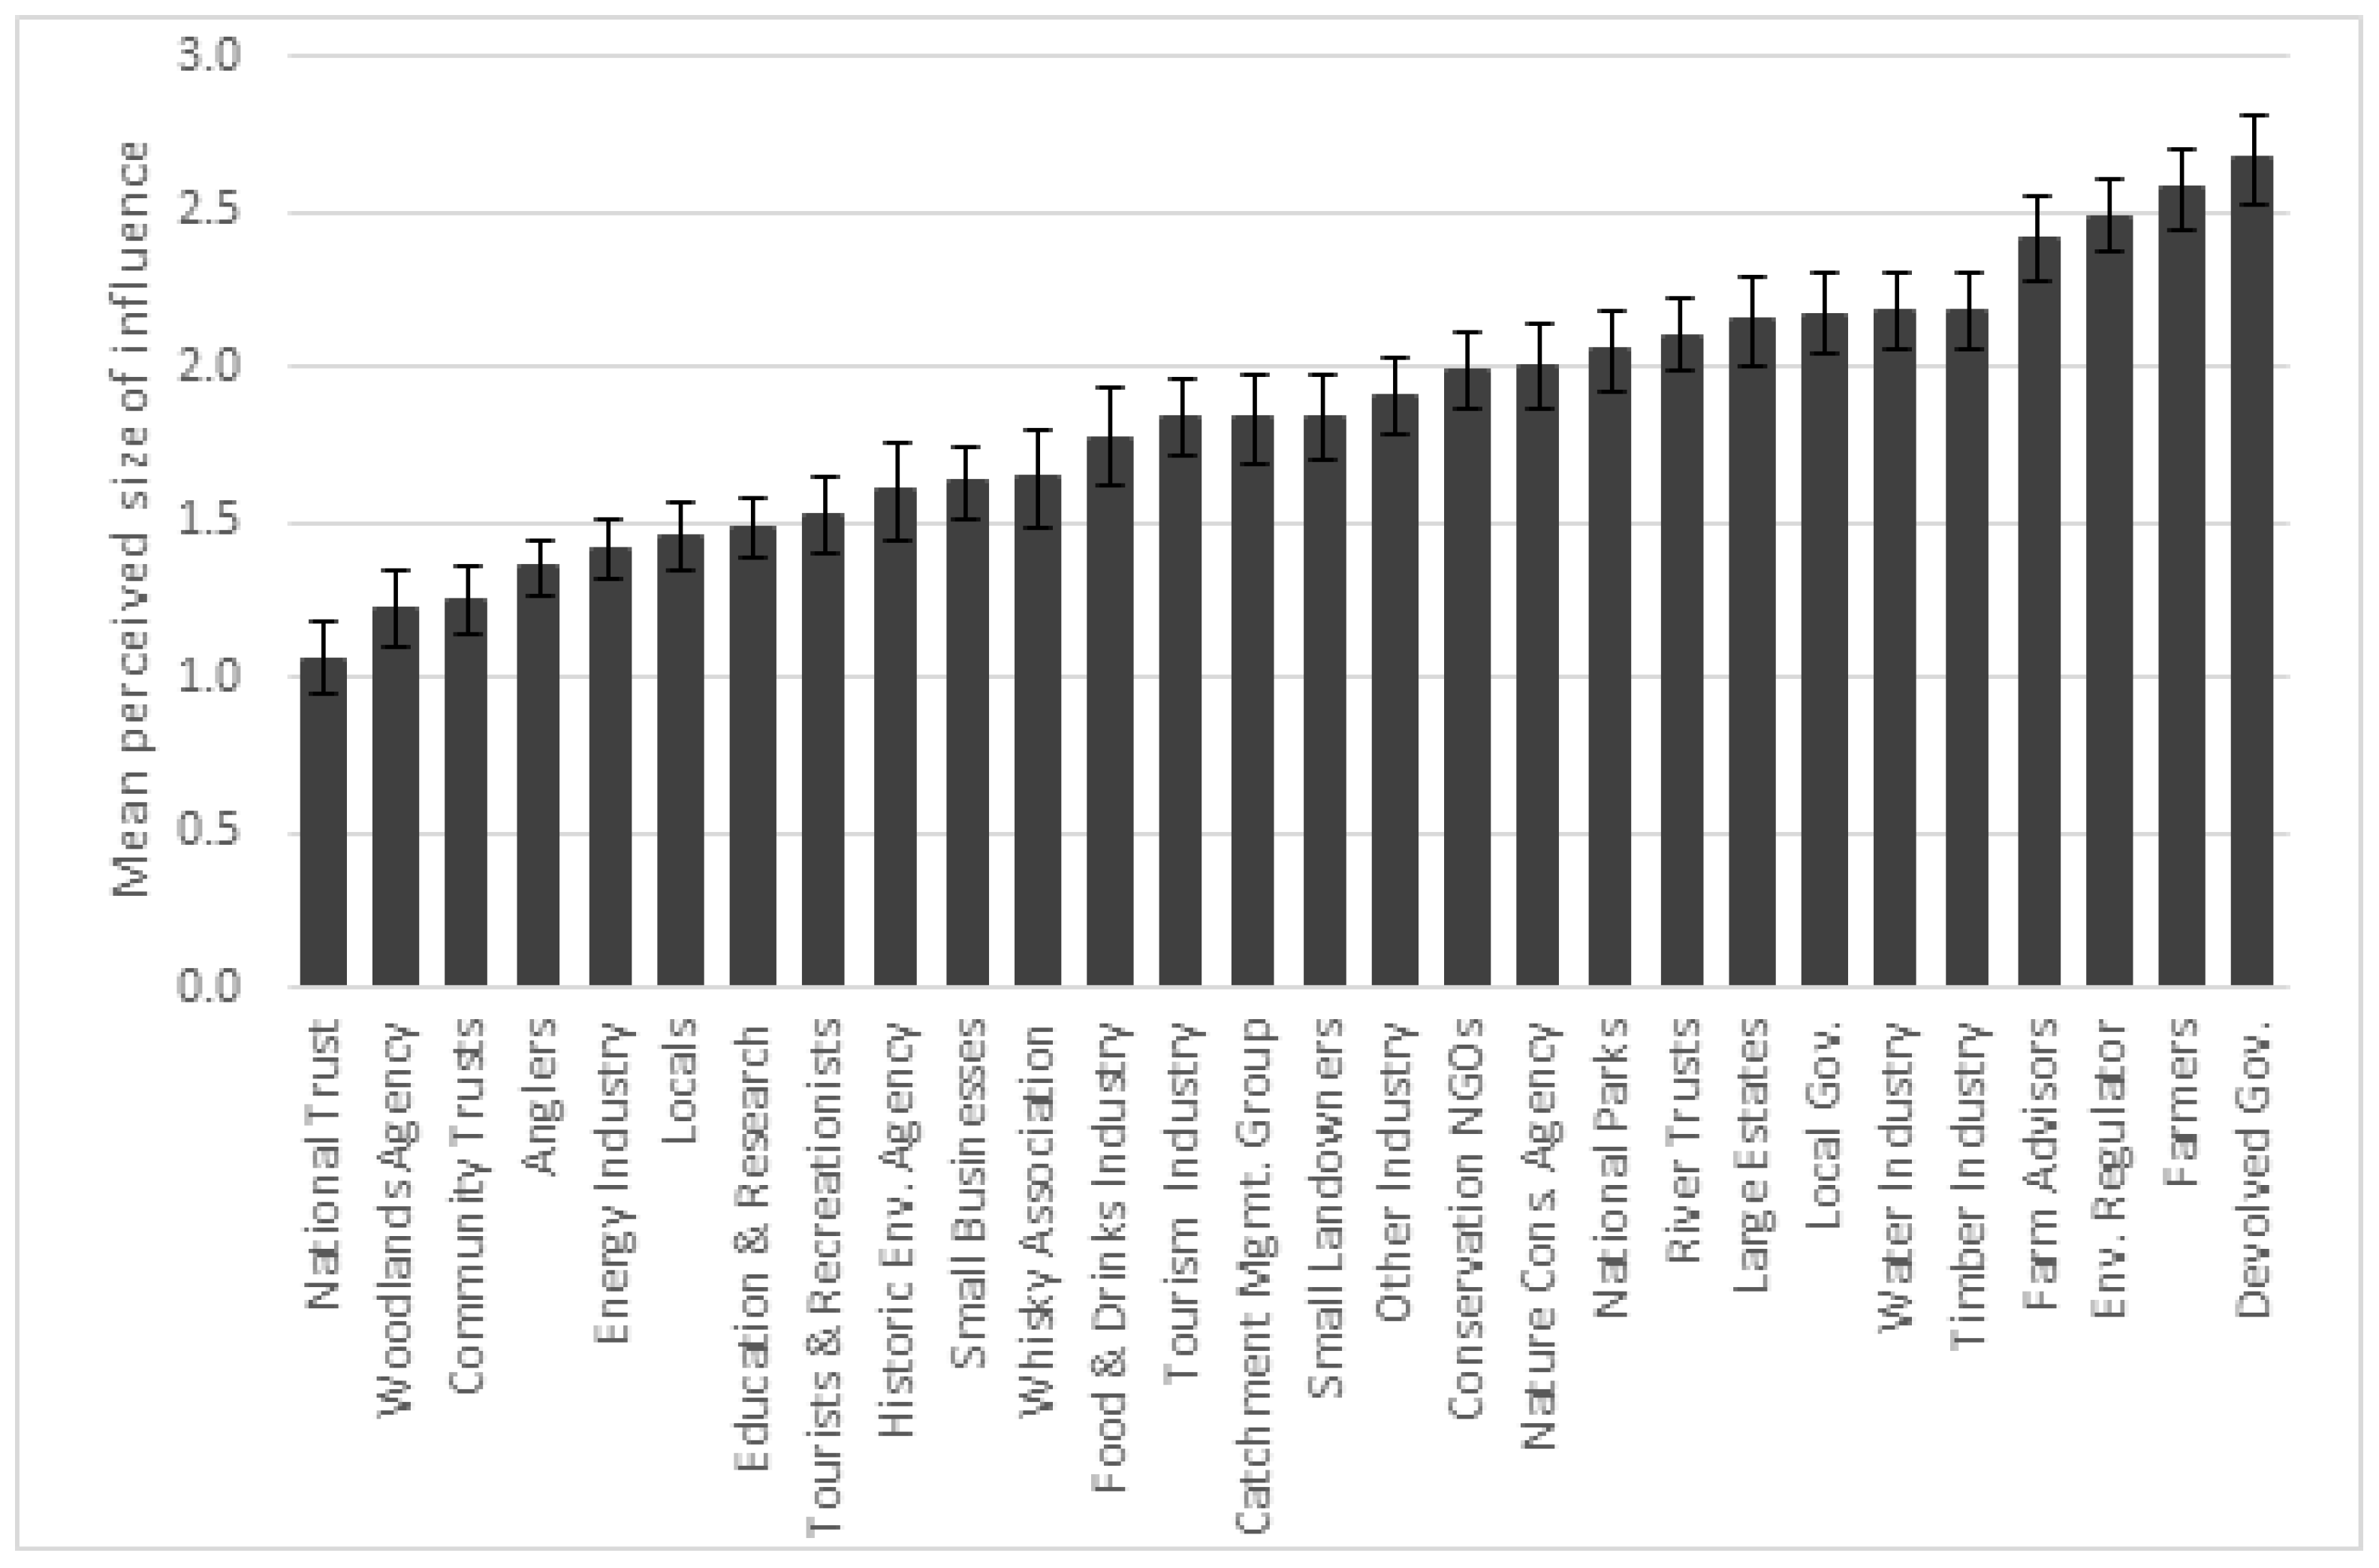
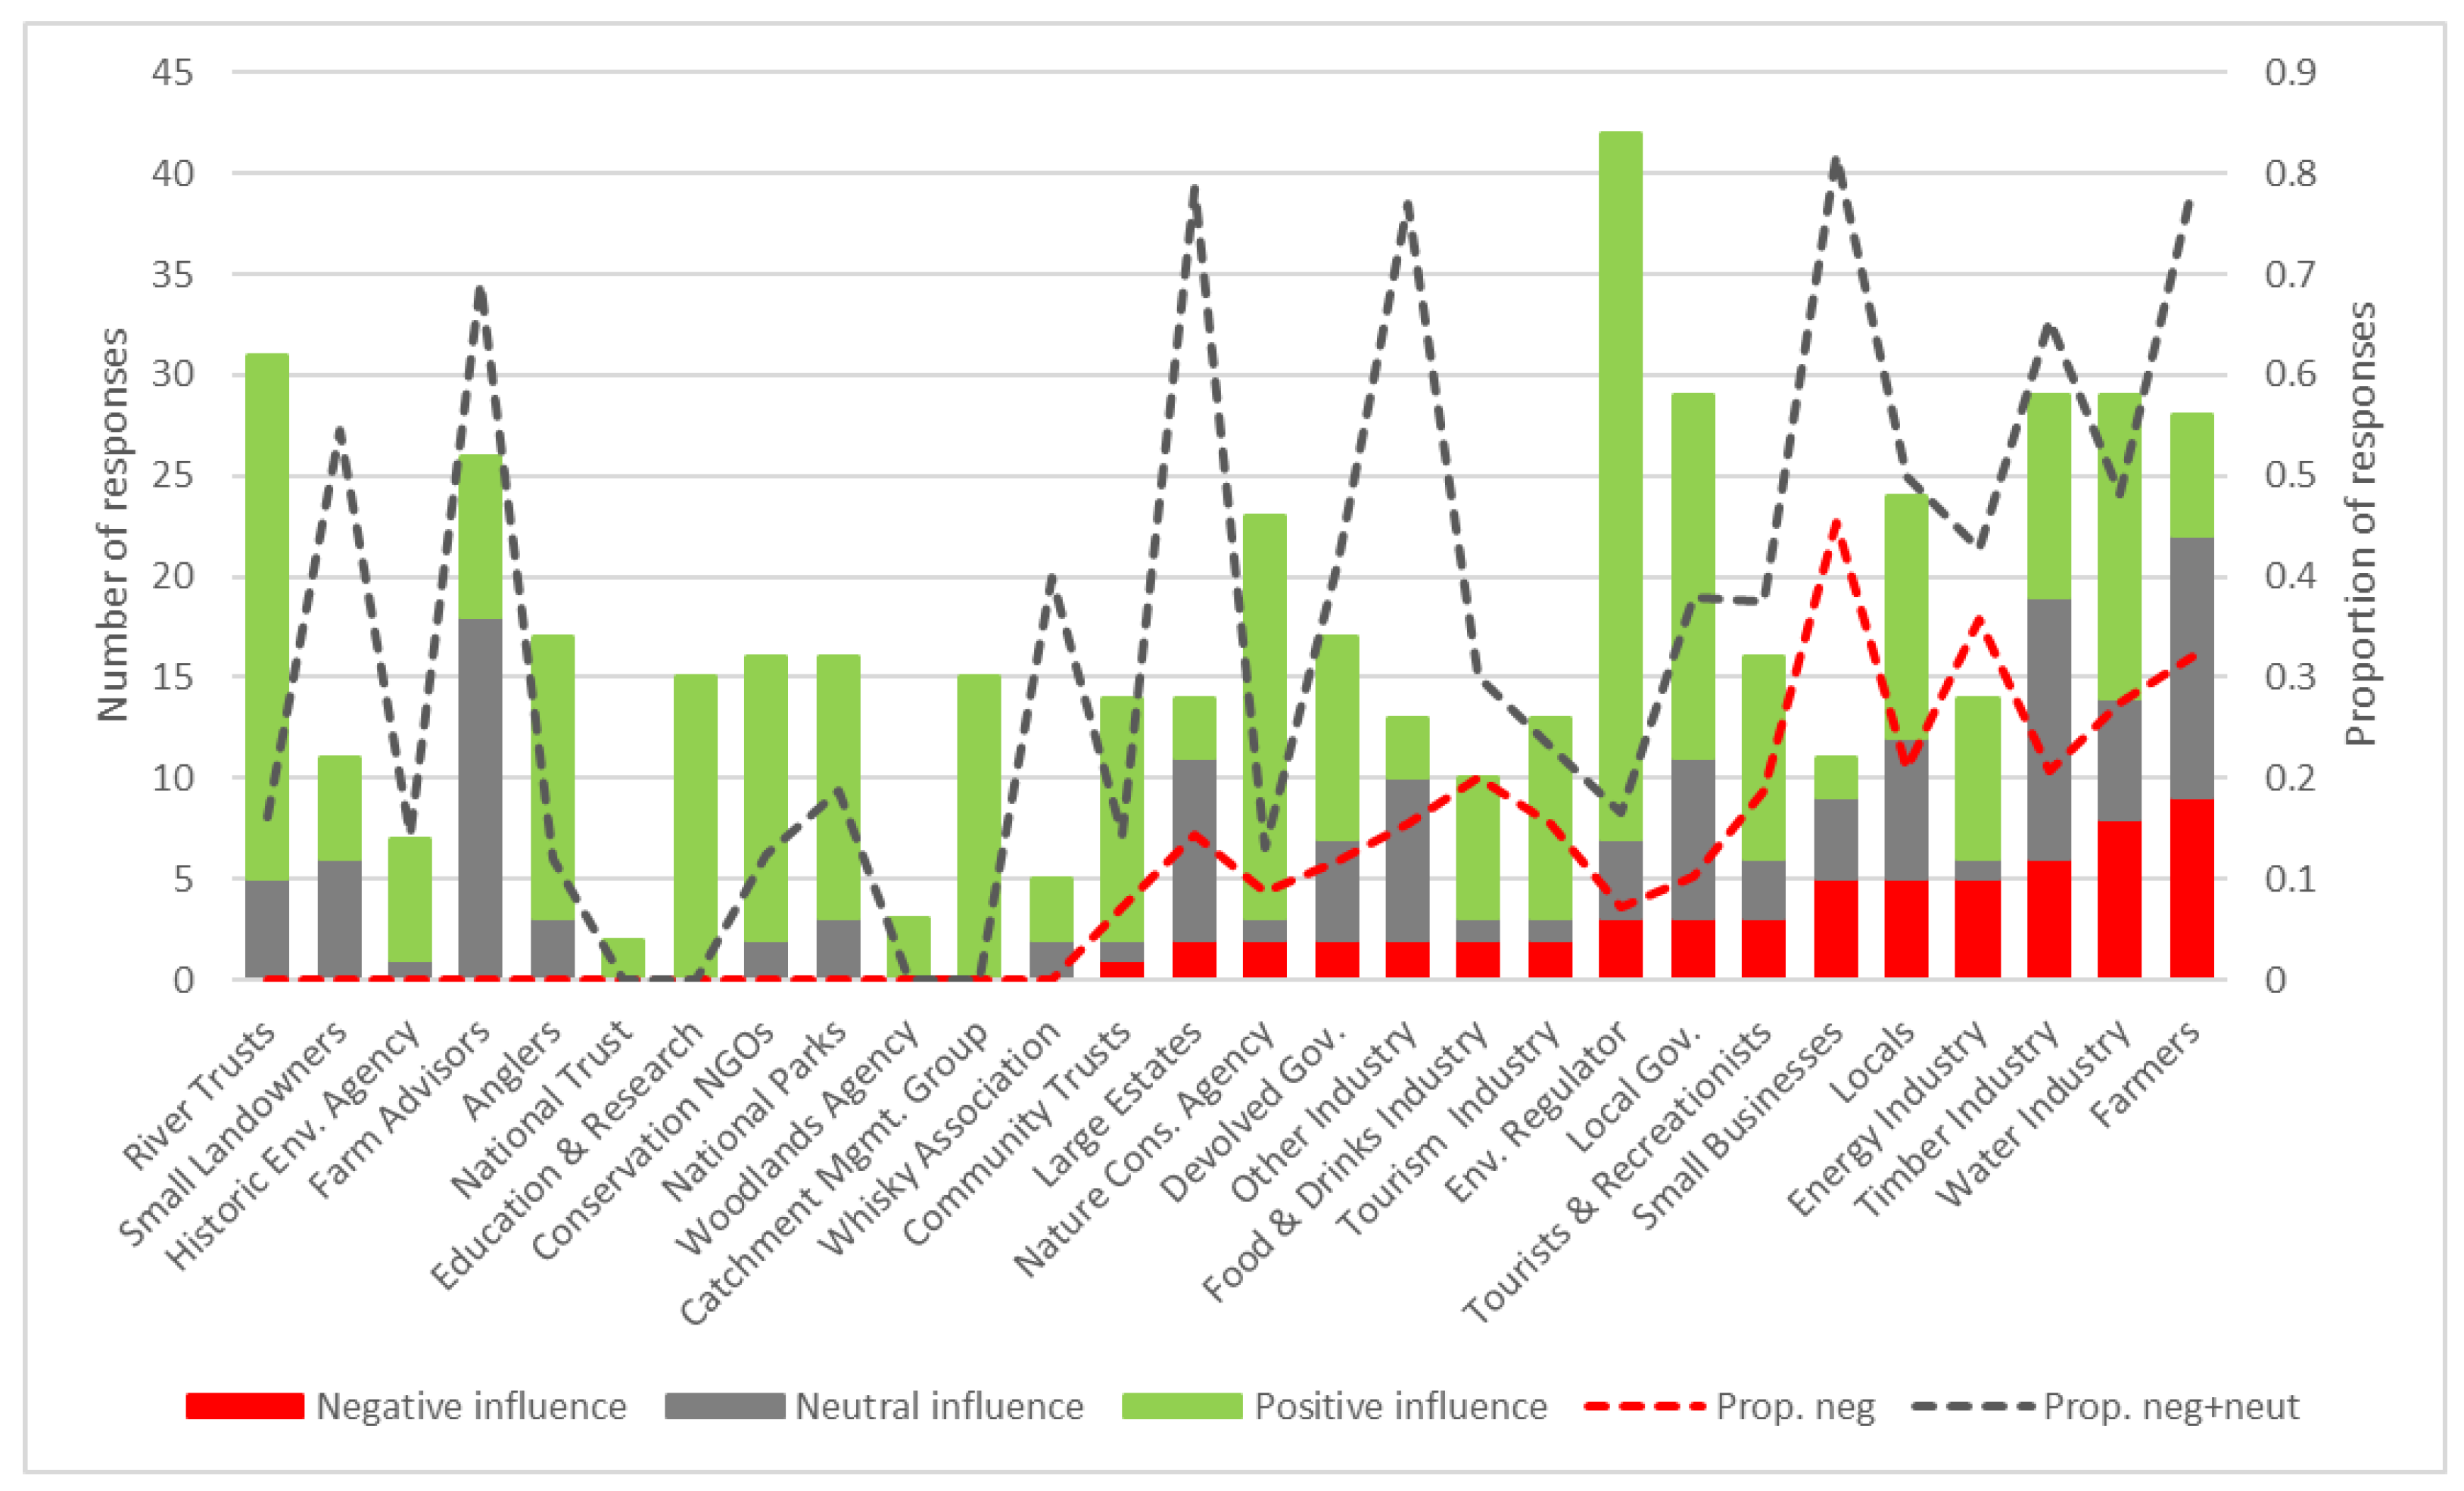
4.2. Perceived Magnitude and Value of Stakeholder Influence
4.3. Omission of Stakeholder Groups in Responses
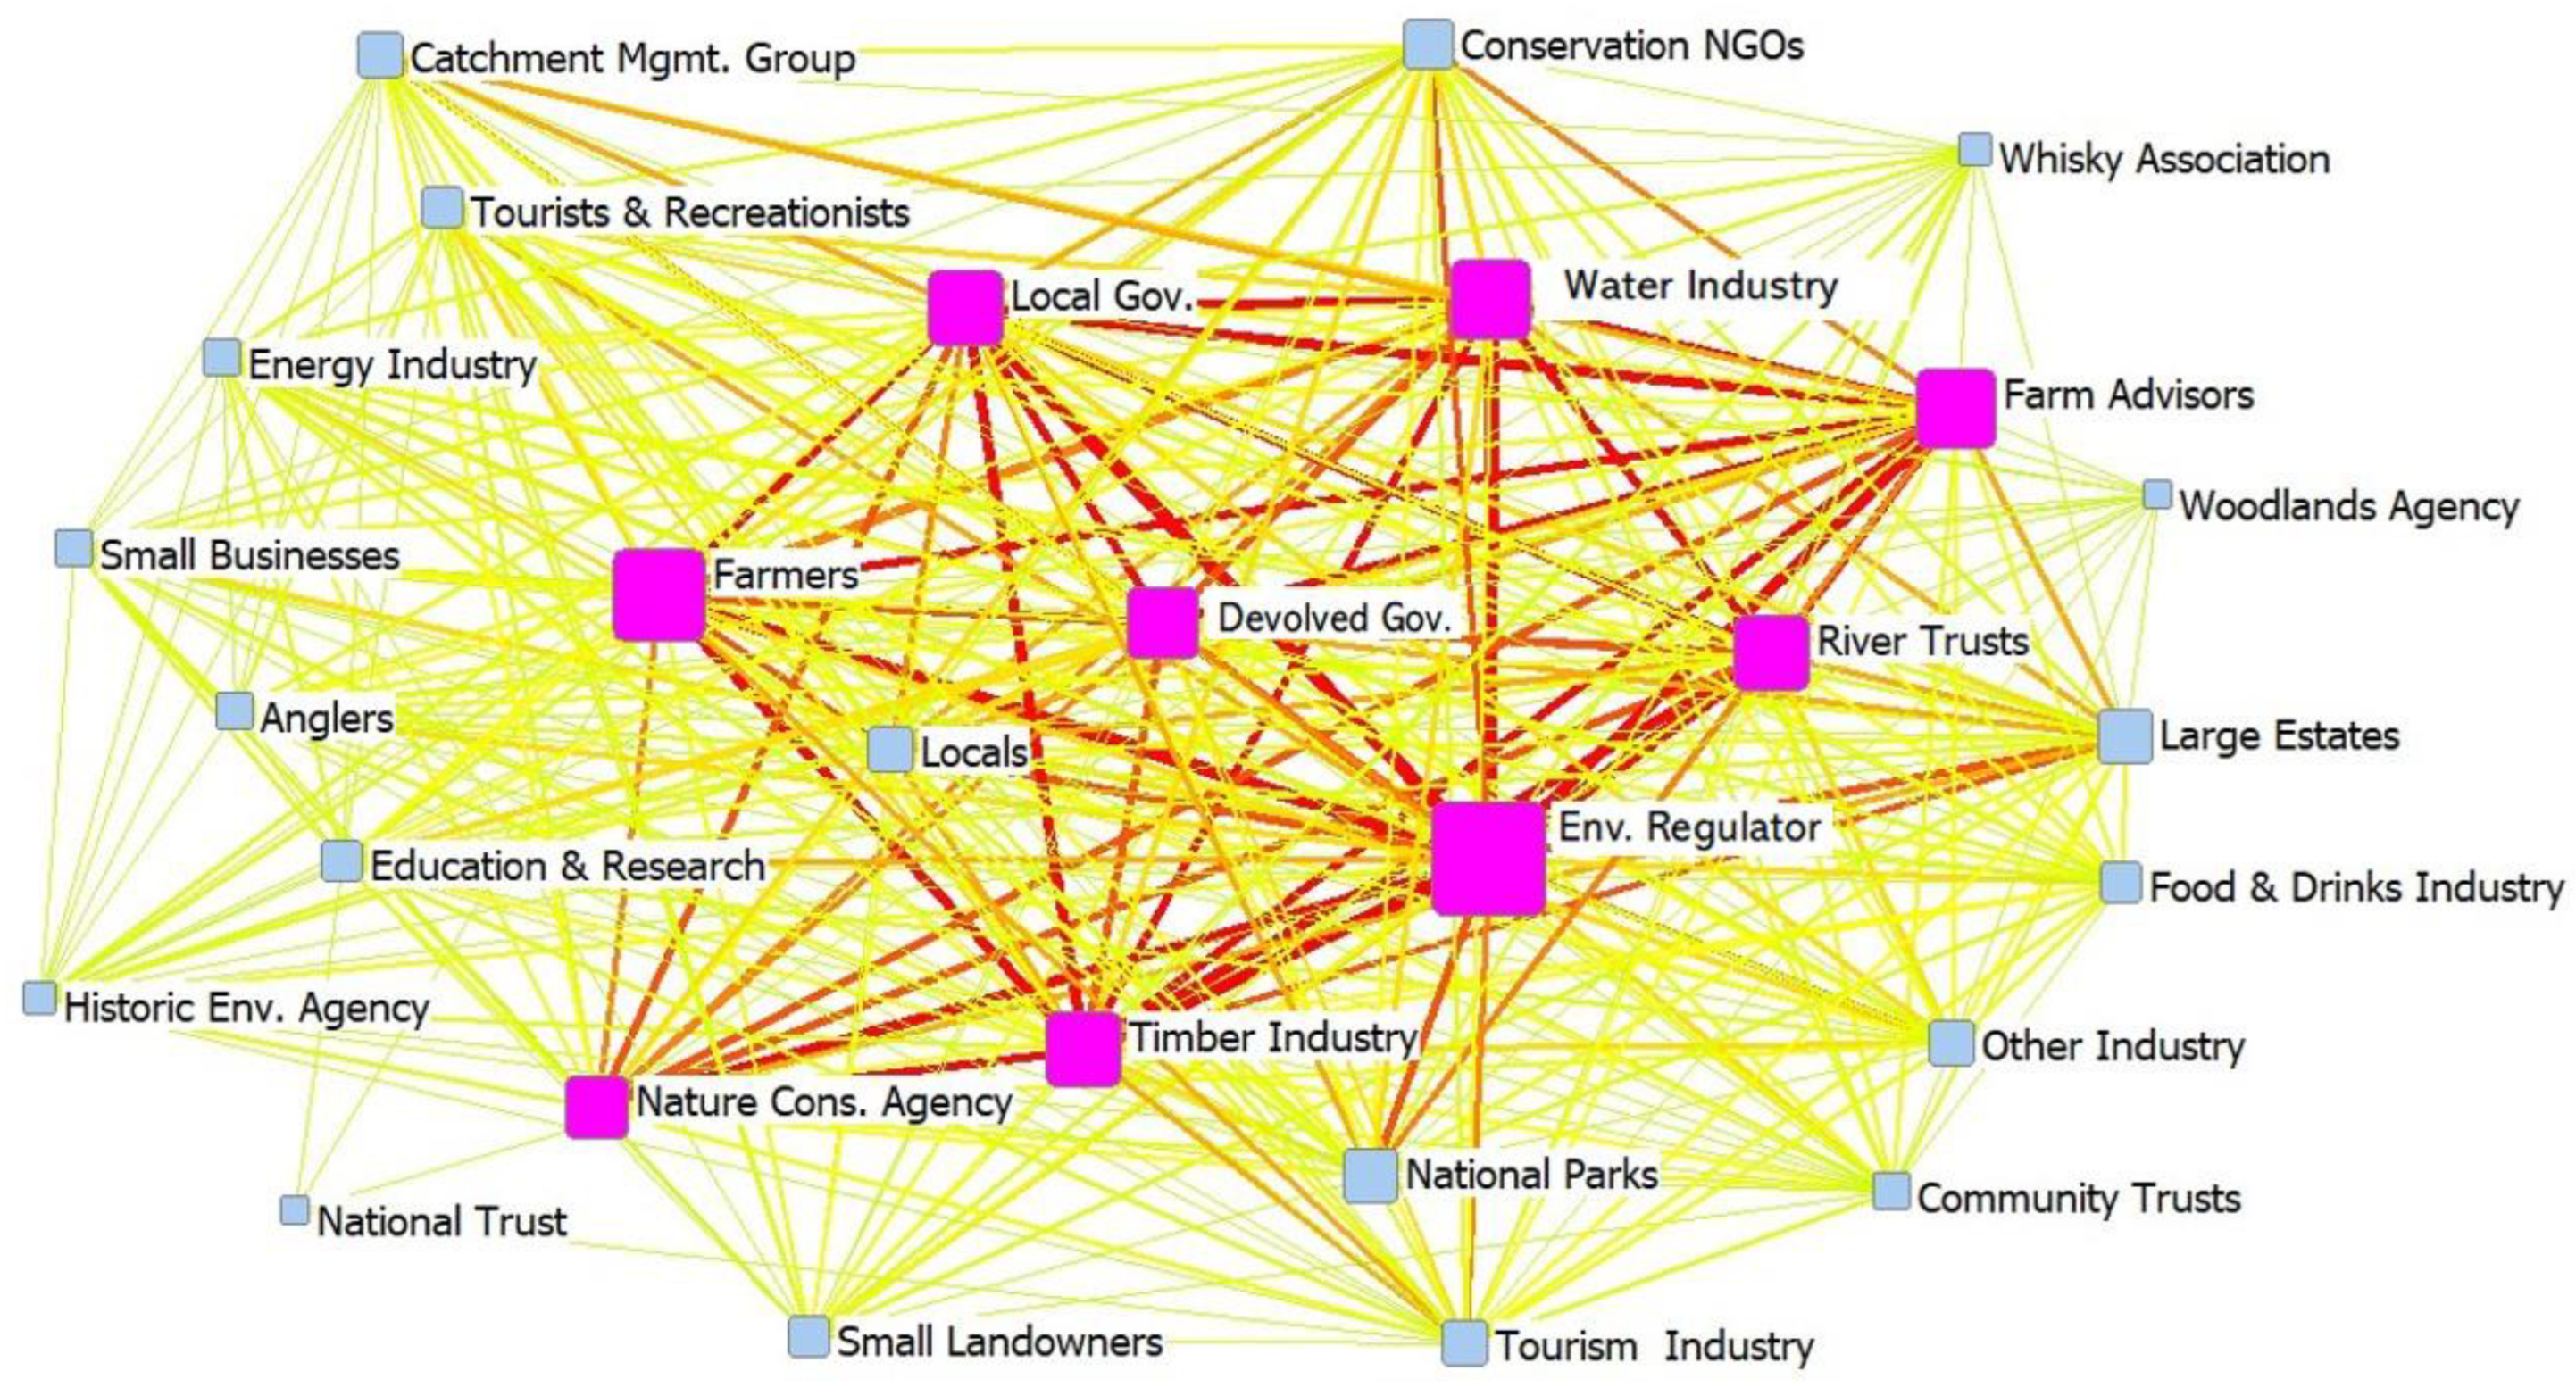
4.4. Degree and Core and Periphery Analysis
5. Conclusions
Author Contributions
Funding
Data Availability Statement
Acknowledgments
Conflicts of Interest
Appendix A

| Degree | Mean Perceived Influence ± st. Error | Proportion of Perceived Negative Influence | Prop. of Perceived Neg. and Neutral Influence | |
|---|---|---|---|---|
| Farmers | 1.81 | 2.57 ± 0.13 | 0.32 | 0.79 |
| Environ. Regulator | 2.51 | 2.48 ± 0.12 | 0.07 | 0.17 |
| Water Industry | 1.58 | 2.18 ± 0.12 | 0.28 | 0.48 |
| Large Estates | 0.81 | 2.15 ± 0.14 | 0.14 | 0.79 |
| Timber Industry | 1.58 | 2.18 ± 0.12 | 0.21 | 0.66 |
| River Trusts | 1.60 | 2.10 ± 0.12 | 0 | 0.16 |
| Community Trusts | 0.47 | 1.24 ± 0.11 | 0.07 | 0.14 |
| Nature Cons. Agency | 1.19 | 2.01 ± 0.14 | 0.09 | 0.13 |
| Small Businesses | 0.47 | 1.63 ± 0.12 | 0.45 | 0.82 |
| Small Landowners | 0.51 | 1.84 ± 0.14 | 0 | 0.55 |
| Historic Env. Agency | 0.28 | 1.60 ± 0.16 | 0 | 0.14 |
| Farm Advisors | 1.53 | 2.41 ± 0.13 | 0 | 0.69 |
| Locals | 0.88 | 1.45 ± 0.11 | 0.21 | 0.50 |
| Local Gov. | 1.56 | 2.17 ± 0.13 | 0.10 | 0.38 |
| Devolved Gov. | 1.19 | 2.67 ± 0.15 | 0.12 | 0.41 |
| Tourists and Recreationists | 0.60 | 1.53 ± 0.12 | 0.19 | 0.38 |
| Anglers | 0.58 | 1.35 ± 0.09 | 0 | 0.12 |
| Energy Industry | 0.51 | 1.41 ± 0.10 | 0.36 | 0.43 |
| Other Industry | 0.67 | 1.90 ± 0.13 | 0.15 | 0.77 |
| Food and Drinks Industry | 0.49 | 1.77 ± 0.16 | 0.20 | 0.30 |
| National Trust | 0.07 | 1.06 ± 0.11 | 0 | 0 |
| Education and Research | 0.56 | 1.48 ± 0.10 | 0 | 0 |
| Conservation NGOs | 0.79 | 1.99 ± 0.12 | 0 | 0.13 |
| National Parks | 0.84 | 2.05 ± 0.13 | 0 | 0.19 |
| Woodlands Agency | 0.12 | 1.22 ± 0.12 | 0 | 0 |
| Tourism Industry | 0.63 | 1.83 ± 0.12 | 0.15 | 0.23 |
| Catch. Mgmt. Group | 0.70 | 1.83 ± 0.14 | 0 | 0 |
| Whisky Association | 0.23 | 1.64 ± 0.16 | 0 | 0.40 |
References
- Hogeboom, R.J.; Borsje, B.W.; Deribe, M.M.; van der Meer, F.D.; Mehvar, S.; Meyer, M.A.; Özerol, G.; Hoekstra, A.Y.; Nelson, A.D. Resilience Meets the Water–Energy–Food Nexus: Mapping the Research Landscape. Front. Environ. Sci. 2021, 9, 630395. [Google Scholar] [CrossRef]
- van den Heuvel, L.; Blicharska, M.; Masia, S.; Sušnik, J.; Teutschbein, C. Ecosystem Services in the Swedish Water-Energy-Food-Land-Climate Nexus: Anthropogenic Pressures and Physical Interactions. Ecosyst. Serv. 2020, 44, 101141. [Google Scholar] [CrossRef]
- Reid, A.J.; Carlson, A.K.; Creed, I.F.; Eliason, E.J.; Gell, P.A.; Johnson, P.T.J.; Kidd, K.A.; MacCormack, T.J.; Olden, J.D.; Ormerod, S.J.; et al. Emerging Threats and Persistent Conservation Challenges for Freshwater Biodiversity. Biol. Rev. 2019, 94, 849–873. [Google Scholar] [CrossRef] [Green Version]
- Albert, J.S.; Destouni, G.; Duke-Sylvester, S.M.; Magurran, A.E.; Oberdorff, T.; Reis, R.E.; Winemiller, K.O.; Ripple, W.J. Scientists’ Warning to Humanity on the Freshwater Biodiversity Crisis. Ambio 2021, 50, 85–94. [Google Scholar] [CrossRef] [PubMed]
- Schlosser, C.A.; Strzepek, K.; Gao, X.; Fant, C.; Blanc, É.; Paltsev, S.; Jacoby, H.; Reilly, J.; Gueneau, A. The Future of Global Water Stress: An Integrated Assessment. Earth’s Future 2014, 2, 341–361. [Google Scholar] [CrossRef]
- Elosegi, A.; Sabater, S. Effects of Hydromorphological Impacts on River Ecosystem Functioning: A Review and Suggestions for Assessing Ecological Impacts. Hydrobiologia 2013, 712, 129–143. [Google Scholar] [CrossRef]
- Johnson, R.K.; Angeler, D.G.; Hallstan, S.; Sandin, L.; McKie, B.G. Decomposing Multiple Pressure Effects on Invertebrate Assemblages of Boreal Streams. Ecol. Indic. 2017, 77, 293–303. [Google Scholar] [CrossRef]
- Berger, T.; Birner, R.; Mccarthy, N.; Díaz, J.; Wittmer, H. Capturing the Complexity of Water Uses and Water Users within a Multi—Agent Framework. Water Resour. Manag. 2007, 21, 129–148. [Google Scholar] [CrossRef]
- Navarro-Navarro, L.A.; Moreno-Vazquez, J.L.; Scott, C.A. Social Networks for Management of Water Scarcity: Evidence from the San Miguel Watershed, Sonora, Mexico. Water Altern. 2017, 10, 41–64. [Google Scholar]
- García-Nieto, A.P.; Quintas-Soriano, C.; García-Llorente, M.; Palomo, I.; Montes, C.; Martín-López, B. Collaborative Mapping of Ecosystem Services: The Role of Stakeholders’ Profiles. Ecosyst. Serv. 2015, 13, 141–152. [Google Scholar] [CrossRef]
- Mason, T.H.E.; Pollard, C.R.J.; Chimalakonda, D.; Guerrero, A.M.; Kerr-Smith, C.; Milheiras, S.A.G.; Roberts, M.; Ngafack, P.R.; Bunnefeld, N. Wicked Conflict: Using Wicked Problem Thinking for Holistic Management of Conservation Conflict. Conserv. Lett. 2018, 11, e12460. [Google Scholar] [CrossRef] [PubMed]
- Mohamad Ibrahim, I.H.; Gilfoyle, L.; Reynolds, R.; Voulvoulis, N. Integrated Catchment Management for Reducing Pesticide Levels in Water: Engaging with Stakeholders in East Anglia to Tackle Metaldehyde. Sci. Total Environ. 2019, 656, 1436–1447. [Google Scholar] [CrossRef] [PubMed]
- Reed, M.S. Stakeholder Participation for Environmental Management: A Literature Review. Biol. Conserv. 2008, 141, 2417–2431. [Google Scholar] [CrossRef]
- Prell, C.; Hubacek, K.; Reed, M.; Quinn, C.; Jin, N.; Holden, J.; Burt, T.; Kirby, M.; Sendzimir, J. If You Have a Hammer Everything Looks like a Nail: Traditional versus Participatory Model Building. Interdiscip. Sci. Rev. 2007, 32, 20. [Google Scholar] [CrossRef] [Green Version]
- Stosch, K.C.; Quilliam, R.S.; Bunnefeld, N.; Oliver, D.M. Quantifying Stakeholder Understanding of an Ecosystem Service Trade-Off. Sci. Total Environ. 2019, 651, 2524–2534. [Google Scholar] [CrossRef] [PubMed]
- Ahmadi, A.; Kerachian, R.; Rahimi, R.; Emami Skardi, M.J. Comparing and Combining Social Network Analysis and Stakeholder Analysis for Natural Resource Governance. Environ. Dev. 2019, 32, 100451. [Google Scholar] [CrossRef]
- Horning, D.; Bauer, B.O.; Cohen, S.J. Missing Bridges: Social Network (Dis)Connectivity in Water Governance. Util. Policy 2016, 43, 59–70. [Google Scholar] [CrossRef]
- Sayles, J.S.; Baggio, J.A. Social-Ecological Network Analysis of Scale Mismatches in Estuary Watershed Restoration. Proc. Natl. Acad. Sci. USA 2017, 114, E1776–E1785. [Google Scholar] [CrossRef] [Green Version]
- Luzi, S.; Abdelmoghny Hamouda, M.; Sigrist, F.; Tauchnitz, E. Water Policy Networks in Egypt and Ethiopia. J. Environ. Dev. 2008, 17, 238–268. [Google Scholar] [CrossRef] [Green Version]
- Ogada, J.O.; Krhoda, G.O.; Van Der Veen, A.; Marani, M.; van Oel, P.R. Managing Resources through Stakeholder Networks: Collaborative Water Governance for Lake Naivasha Basin, Kenya. Water Int. 2017, 42, 271–290. [Google Scholar] [CrossRef]
- Mulvaney, K.K.; Lee, S.; Höök, T.O.; Prokopy, L.S. Casting a Net to Better Understand Fisheries Management: An Affiliation Network Analysis of the Great Lakes Fishery Commission. Mar. Policy 2015, 57, 120–131. [Google Scholar] [CrossRef]
- Yang, L.E.; Chan, F.K.S.; Scheffran, J. Climate Change, Water Management and Stakeholder Analysis in the Dongjiang River Basin in South China. Int. J. Water Resour. Dev. 2018, 34, 166–191. [Google Scholar] [CrossRef] [Green Version]
- He, Z.; Huang, D.; Zhang, C.; Fang, J. Toward a Stakeholder Perspective on Social Stability Risk of Large Hydraulic Engineering Projects in China: A Social Network Analysis. Sustainability 2018, 10, 1223. [Google Scholar] [CrossRef] [Green Version]
- Reed, M.S.; Graves, A.; Dandy, N.; Posthumus, H.; Hubacek, K.; Morris, J.; Prell, C.; Quinn, C.H.; Stringer, L.C. Who’s in and Why? A Typology of Stakeholder Analysis Methods for Natural Resource Management. J. Environ. Manag. 2009, 90, 1933–1949. [Google Scholar] [CrossRef]
- Darvill, R.; Lindo, Z. The Inclusion of Stakeholders and Cultural Ecosystem Services in Land Management Trade-off Decisions Using an Ecosystem Services Approach. Landsc. Ecol. 2016, 31, 533–545. [Google Scholar] [CrossRef]
- Krackhardt, D. Cognitive Social Structures. Soc. Netw. 1987, 9, 109–134. [Google Scholar] [CrossRef]
- Joint Nature Conservation Committee Natura 2000 Standard Data Form: ES0000471. Quality 2013, 1–3.
- Fleming, G.; MacDougall, K. EnviroCentre Report No: 3329 “River Spey Abstractions” to the Spey Fishery Board; 2008. [Google Scholar]
- South Esk Catchment Partnership Steering Group. The South Esk CatchmentManagement Plan; 2009. [Google Scholar]
- Freeman, R.E. Strategic Management: A Stakeholder Approach; Cambridge University Press: Cambridge, UK, 2015. [Google Scholar]
- IBM. IBM SPSS Advanced Statistics 28; IBM: Armonk, NY, USA, 2021. [Google Scholar]
- Raum, S. A Framework for Integrating Systematic Stakeholder Analysis in Ecosystem Services Research: Stakeholder Mapping for Forest Ecosystem Services in the UK. Ecosyst. Serv. 2018, 29, 170–184. [Google Scholar] [CrossRef]
- Bailey, J.J.; Boyd, D.S.; Field, R. Models of Upland Species’ Distributions Are Improved by Accounting for Geodiversity. Landsc. Ecol. 2018, 33, 2071–2087. [Google Scholar] [CrossRef] [Green Version]
- Martin, A.; Haugh, H.M. The Malt Whisky Trail: The Tourism and Marketing Potential of the Whisky Distillery Visitor Centre. Int. J. Wine Mark. 1999, 11, 42–52. [Google Scholar] [CrossRef]
- Dunn, S.M.; Sample, J.; Potts, J.; Abel, C.; Cook, Y.; Taylor, C.; Vinten, A.J.A. Recent Trends in Water Quality in an Agricultural Catchment in Eastern Scotland: Elucidating the Roles of Hydrology and Land Use. Environ. Sci. Process. Impacts 2014, 16, 1659–1675. [Google Scholar] [CrossRef] [PubMed]
- Greig, B.; Rathjen, J. Promoting Sustainable Industrial Water Use: Scotland’s “Hydro Nation” at Home and Abroad. In Sustainable Industrial Water Use: Perspectives, Incentives, and Tools; IWA Publishing: London, UK, 2021. [Google Scholar]
- The Scottish Government. Key Scottish Environment: Statistics 2016-October 2016; Directorate for Environment and Forestry, Scottish Government: Edinburgh, UK, 2016.
- Stosch, K.C.; Quilliam, R.S.; Bunnefeld, N.; Oliver, D.M. Catchment-Scale Participatory Mapping Identifies Stakeholder Perceptions of Land and Water Management Conflicts. Land 2022, 11, 300. [Google Scholar] [CrossRef]
- Westerink, J.; Opdam, P.; van Rooij, S.; Steingröver, E. Landscape Services as Boundary Concept in Landscape Governance: Building Social Capital in Collaboration and Adapting the Landscape. Land Use Policy 2017, 60, 408–418. [Google Scholar] [CrossRef]
- Maréchal, A.; Baldock, D.; Erjavec, E.; Juvancˇicˇ, L.; Rac, I.; Dwyer, J.; Hart, K. Towards a Step Change for Enhanced Delivery of Environmental and Social Benefits from EU Farming and Forestry. EuroChoices 2018, 17, 11–15. [Google Scholar] [CrossRef]
- Saunders, F.P. Complex Shades of Green: Gradually Changing Notions of the ‘Good Farmer’ in a Swedish Context. Sociol. Rural. 2016, 56, 391–407. [Google Scholar] [CrossRef]
- Collins, H.M. Dairy Farmers’ Responses to Water Quality Interventions: A Case Study in the Manawatu-Wanganui Region of New Zealand. Ph.D. Thesis, Massey University, Palmerston North, New Zealand, 2018. [Google Scholar]
- Barnes, A.P.; Willock, J.; Hall, C.; Toma, L. Farmer Perspectives and Practices Regarding Water Pollution Control Programmes in Scotland. Agric. Water Manag. 2009, 96, 1715–1722. [Google Scholar] [CrossRef]
- Thomas, E.; Riley, M.; Spees, J. Good Farming beyond Farmland—Riparian Environments and the Concept of the ‘Good Farmer. ’ J. Rural Stud. 2019, 67, 111–119. [Google Scholar] [CrossRef]
- Curșeu, P.L.; Schruijer, S.G. Stakeholder Diversity and the Comprehensiveness of Sustainability Decisions: The Role of Collaboration and Conflict. Curr. Opin. Environ. Sustain. 2017, 28, 114–120. [Google Scholar] [CrossRef]
- Cebrián-Piqueras, M.A.; Karrasch, L.; Kleyer, M. Coupling Stakeholder Assessments of Ecosystem Services with Biophysical Ecosystem Properties Reveals Importance of Social Contexts. Ecosyst. Serv. 2017, 23, 108–115. [Google Scholar] [CrossRef]
- Brunet, L.; Tuomisaari, J.; Lavorel, S.; Crouzat, E.; Bierry, A.; Peltola, T.; Arpin, I. Actionable Knowledge for Land Use Planning: Making Ecosystem Services Operational. Land Use Policy 2018, 72, 27–34. [Google Scholar] [CrossRef]
- Raymond, C.M.; Bieling, C.; Fagerholm, N.; Martin-Lopez, B.; Plieninger, T. The Farmer as a Landscape Steward: Comparing Local Understandings of Landscape Stewardship, Landscape Values, and Land Management Actions. Ambio 2016, 45, 173–184. [Google Scholar] [CrossRef] [PubMed] [Green Version]
- D’Agostino, D.; Borg, M.; Hallett, S.H.; Sakrabani, R.S.; Thompson, A.; Papadimitriou, L.; Knox, J.W. Multi-Stakeholder Analysis to Improve Agricultural Water Management Policy and Practice in Malta. Agric. Water Manag. 2020, 229, 105920. [Google Scholar] [CrossRef]
- Hart, S.L.; Sharma, S. Engaging Fringe Stakeholders for Competitive Imagination. IEEE Eng. Manag. Rev. 2004, 18, 7–18. [Google Scholar] [CrossRef]
- Zingraff-Hamed, A.; Hüesker, F.; Lupp, G.; Begg, C.; Huang, J.; Oen, A.; Vojinovic, Z.; Kuhlicke, C.; Pauleit, S. Stakeholder Mapping to Co-Create Nature-Based Solutions: Who Is on Board? Sustainability 2020, 20, 8625. [Google Scholar] [CrossRef]
- Lienert, J.; Schnetzer, F.; Ingold, K. Stakeholder Analysis Combined with Social Network Analysis Provides Fine-Grained Insights into Water Infrastructure Planning Processes. J. Environ. Manage. 2013, 125, 134–148. [Google Scholar] [CrossRef] [PubMed] [Green Version]
- de Lange, E.; Milner-Gulland, E.J.; Keane, A. Improving Environmental Interventions by Understanding Information Flows. Trends Ecol. Evol. 2019, 34, 1034–1047. [Google Scholar] [CrossRef] [PubMed] [Green Version]
- Heidrich, O.; Harvey, J.; Tollin, N. Stakeholder Analysis for Industrial Waste Management Systems. Waste Manag. 2009, 29, 965–973. [Google Scholar] [CrossRef]
- Skarlatidou, A.; Suskevics, M.; Göbel, C.; Prūse, B.; Tauginiené, L.; Mascarenhas, A.; Mazzonetto, M.; Sheppard, A.; Barrett, J.; Haklay, M.; et al. The Value of Stakeholder Mapping to Enhance Co-Creation in Citizen Science Initiatives. Citiz. Sci. Theory Pract. 2019, 4, 24. [Google Scholar] [CrossRef] [Green Version]
- Fish, R.D.; Winter, M.; Oliver, D.M.; Chadwick, D.R.; Hodgson, C.J.; Heathwaite, A.L. Employing the Citizens’ Jury Technique to Elicit Reasoned Public Judgments about Environmental Risk: Insights from an Inquiry into the Governance of Microbial Water Pollution. J. Environ. Plan. Manag. 2013, 57, 233–253. [Google Scholar] [CrossRef] [Green Version]
- Nuno, A.; Bunnefeld, N.; Milner-Gulland, E.J. Managing Social-Ecological Systems under Uncertainty: Implementation in the Real World. Ecol. Soc. 2014, 19, 52. [Google Scholar] [CrossRef] [Green Version]
- Bodin, Ö. Collaborative Environmental Governance: Achieving Collective Action in Social-Ecological Systems. Science 2017, 357, eaan1114. [Google Scholar] [CrossRef] [PubMed] [Green Version]
- Barnes, M.L.; Bodin, Ö.; Guerrero, A.M.; McAllister, R.R.J.; Alexander, S.M.; Robins, G. The Social Structural Foundations of Adaptation and Transformation in Social–Ecological Systems. Ecol. Soc. 2017, 22, 16. [Google Scholar] [CrossRef]
- Cinner, J.E.; Barnes, M.L. Social Dimensions of Resilience in Social-Ecological Systems. One Earth 2019, 1, 51–56. [Google Scholar] [CrossRef] [Green Version]
- Barnhart, B.L.; Golden, H.E.; Kasprzyk, J.R.; Pauer, J.J.; Jones, C.E.; Sawicz, K.A.; Hoghooghi, N.; Simon, M.; McKane, R.B.; Mayer, P.M.; et al. Embedding Co-Production and Addressing Uncertainty in Watershed Modeling Decision-Support Tools: Successes and Challenges. Environ. Model. Softw. 2018, 109, 368–379. [Google Scholar] [CrossRef]


| Ayr Catchment | South Esk Catchment | Spey Catchment | Catchment Scientists | Farm Advisors | Environmental Regulator Staff | Water Industry Staff | |
|---|---|---|---|---|---|---|---|
| Mean number of responses | 11.53 (±0.90) | 9.92 (±1.34) | 12.53 (±0.98) | 11.27 (±1.36) | 11.18 (±0.88) | 11.55 (±1.22) | 11.44 (±1.68) |
| Mean Degree | 1.02 (±0.10) | 0.87 (±0.13) | 1.15 (±0.09) | 1.03 (±0.13) | 0.95 (±0.10) | 1.06 (±0.11) | 1.03 (±0.18) |
| Mean influence | 2.45 (±0.09) | 2.46 (±0.11) | 2.58 (±0.08) | 2.58 (±0.09) | 2.38 (±0.14) | 2.55 (±0.08) | 2.48 (±0.10) |
| Proportion of perceived negative influence | 0.04 (±0.02) | 0.04 (±0.02) | 0.02 (±0.01) | 0.02 (±0.01) | 0.06 (±0.02) | 0.02 (±0.01) | 0.03 (±0.02) |
| Prop. of perceived neg. and neutral influence | 0.11 (±0.01) | 0.08 (±0.02) | 0.11 (±0.02) | 0.11 (±0.02) | 0.10 (±0.02) | 0.10 (±0.03) | 0.10 (±0.02) |
| Core/Periphery fit (correlation) | 0.912 | 0.889 | 0.897 | 0.864 | 0.861 | 0.902 | 0.872 |
Publisher’s Note: MDPI stays neutral with regard to jurisdictional claims in published maps and institutional affiliations. |
© 2022 by the authors. Licensee MDPI, Basel, Switzerland. This article is an open access article distributed under the terms and conditions of the Creative Commons Attribution (CC BY) license (https://creativecommons.org/licenses/by/4.0/).
Share and Cite
Stosch, K.C.; Quilliam, R.S.; Bunnefeld, N.; Oliver, D.M. Rapid Characterisation of Stakeholder Networks in Three Catchments Reveals Contrasting Land-Water Management Issues. Land 2022, 11, 2324. https://doi.org/10.3390/land11122324
Stosch KC, Quilliam RS, Bunnefeld N, Oliver DM. Rapid Characterisation of Stakeholder Networks in Three Catchments Reveals Contrasting Land-Water Management Issues. Land. 2022; 11(12):2324. https://doi.org/10.3390/land11122324
Chicago/Turabian StyleStosch, Kathleen C., Richard S. Quilliam, Nils Bunnefeld, and David M. Oliver. 2022. "Rapid Characterisation of Stakeholder Networks in Three Catchments Reveals Contrasting Land-Water Management Issues" Land 11, no. 12: 2324. https://doi.org/10.3390/land11122324