Article

How Does Change in Rural Residential Land Affect Cultivated Land Use Efficiency? An Empirical Study Based on 42 Cities in the Middle Reaches of the Yangtze River

1
School of Public Administration, Central South University, Changsha 410083, China
2
School of Public Administration, South China University of Technology, Guangzhou 510641, China
*
Author to whom correspondence should be addressed.
Land 2022, 11(12), 2263; https://doi.org/10.3390/land11122263
Submission received: 9 November 2022 / Revised: 6 December 2022 / Accepted: 9 December 2022 / Published: 11 December 2022

Abstract

:
The growth of rural residential land (RRL) areas has led to the encroachment of cultivated land, which has seriously reduced cultivated land use efficiency (CLUE). This paper takes 42 cities in the middle reaches of the Yangtze River (MRYR) as an example, using the kernel density estimation method, the Super-SBM model, and mediating effect test methods to explore the impact of RRL change on CLUE during 2000–2020. Specifically, based on the analysis of the spatiotemporal distribution characteristics of RRL and CLUE, this paper attempts to further explore the influence path of RRL change on CLUE and test whether there is a mediating effect. The results show that (1) the overall RRL area increased by 30,386.34 hm2, except for the decrease in RRL area in a few regions of Hunan Province, and the RRL area in other regions increased. (2) The hot-spot and sub-hot-spot regions of CLUE in the MRYR were mainly concentrated in northwestern Hubei Province and eastern Hunan Province, and the hot-spot and sub-hot-spot regions in Hunan Province are the highest among the three provinces. (3) Under the control of socioeconomic variables, the change in RRL has a significant negative impact on CLUE. (4) The area of cultivated land occupied by rural residential land (CLRRL) has a mediating role during 2000–2020, while the per capita cultivated land area (PCLA) and the rural permanent population (RPP) only have a mediating role during 2000–2010. In the future, the government should strictly prohibit the occupation of cultivated land by RRL and to improve the CLUE.

1. Introduction

Food security is crucial for maintaining the social development, economic prosperity, and national security of all countries worldwide [1,2,3]. The Global Report on Food Crisis 2021 shows that 53 countries/regions faced a “crisis” level of sudden food insecurity in 2021, an increase of nearly 40 million compared with 2020, indicating that global food security is facing a severe crisis [4]. However, although food security has been affected by many factors, such as COVID-19, an extreme climate, war, and poverty [5], cultivated land is the material basis for food production, and the efficiency of cultivated land use directly determines grain output, thus affecting the world’s food security [6,7]. The essence of cultivated land use efficiency (CLUE) is to maximize social, economic, and ecological benefits through fixed and reasonable agricultural factor input [8], which directly reflects the rationality of the allocation of agricultural production factors in food production [9,10]. Notably, the current global CLUE has strong dynamic and heterogeneous characteristics, which are mainly affected by factors such as the land scale economy, natural climate environment, and scientific and technological input [11], and there is a spatiotemporal imbalance in the input and output of cultivated land in different countries [12]. This kind of unbalanced difference in CLUE is particularly obvious between developed countries and developing countries [13]. Due to the advantages of scientific and technological level and farmers’ asset portfolio, CLUE in developed countries is far higher than that in developing countries, so the food security issue in developing countries is more prominent [14,15].
China’s food security issue has been at the height of national strategy because of its “large population and less, per capita, arable land” [16,17]. In 2022, China’s No. 1 Central Document pointed out that food security is the bottom line of the country and emphasized the implementation of the food security responsibility system to stabilize food production and ensure food supply [18]. Although China has taken a variety of measures to stabilize food production [19], CLUE has been affected by many factors, such as large-scale land management, land fragmentation, land quality, and population mobility [20,21,22], but few scholars have focused on the impact of changes in rural residential land (RRL) on CLUE [23,24,25]. Nowadays, China’s RRL still has problems, such as too much idle land and disorderly expansion, which not only causes the occupation of cultivated land resources but also restricts the improvement of CLUE [26]. This phenomenon is more obvious in the Yangtze River Economic Belt (YREB), which is the economic hinterland of China [6]. Significantly, the area of the YREB accounts for 21.4% of the total land area of China, but the proportion of the population and gross domestic product (GDP) exceed 40% of the total of China. The YREB is the core area of China with rich cultivated land and economy [27,28], so it is valuable to study the CLUE in this region.
The previous studies on CLUE can be summarized into the following three aspects: the evaluation system of CLUE [29,30], the spatiotemporal distribution characteristics of CLUE [31], and the influencing factors of CLUE [9]. First, in the research on the evaluation system of the CLUE, Ge et al. used the data envelopment method to evaluate land use efficiency and found that the level of industrial and economic development is the main factor affecting land use efficiency [32]. Han et al. used the Super-SBM Model, which is widely used in existing research, to calculate the CLUE [33]. This model not only makes up for the defect that the data envelopment method cannot be included in the unexpected output, but it also obtains better evaluation results. Second, in research on the spatiotemporal distribution characteristics of CLUE, scholars have mainly carried out relevant research based on different research scales [31,34]. Duro et al. analyzed the CLUE in 123 countries based on the global scale and found that the difference among countries is still significant, and the CLUE in developed countries is far higher than that in developing countries, making the food output of most developing countries far from meeting their food demand [12]. Sari et al. assessed the land use efficiency of smallholder palm oil plantations in Indonesia on a national scale and found that there were significant differences in the land use efficiency of plantations in different regions of the country. Meanwhile, the negative impact caused by low land use efficiency also varied greatly in different regions [35]. For special regions, Ferreira and Féres focus on the Amazon region of Brazil and use the stochastic production frontier model to explore the relationship between farm size and CLUE and suggested that the significant reason for the decline in CLUE was the concentrating cultivated land size [36]. Finally, previous researchers found that natural, socioeconomic, and ecological environment dimensions were the main influencing factors of CLUE [9,28]. Among them, Liu et al., based on the perspective of sustainable land use, found that the quality of cultivated land, multiple cropping index, vegetation coverage index, soil conservation index, carbon fixation index, and other natural factors play crucial roles in improving CLUE [37]. In terms of socioeconomic factors, Wang et al. found that agricultural production conditions (including pesticides, fertilizers, cultivated land, agricultural machinery, irrigation, etc.) have an important impact on CLUE based on the perspective of production factors [38]. Meanwhile, Chen et al. focused on nonpoint source pollution and explored nonpoint source pollution (including improper use of pesticides, fertilizers, agricultural film, etc.) caused by the process of input and output of cultivated land [39].
Although predecessors have carried out extensive research around the theme of CLUE, there is a lack of relevant research to explore the impact of RRL change on CLUE. Moreover, the change in RRL not only has a direct impact on CLUE but also indirectly affects CLUE through factors such as the rural population. Therefore, this paper attempts to achieve the following three research purposes: (1) From the perspective of RRL change, according to previous studies and combined with the actual situation of the study area, this paper constructs the evaluation index system of CLUE and uses the Super-SBM model to measure CLUE in different areas. (2) ArcGIS 10.5 software was used to explore the spatiotemporal evolution characteristics of RRL and CLUE in the middle reaches of the Yangtze River (MRYR) through hot-spot analysis. (3) In this paper, we used the mediating effect test model to explore whether there is a mediating effect when RRL change affects CLUE, and further analyze the specific transmission path and mechanism of the impact of RRL change on CLUE. It is expected that grain production in the MRYR will be stabilized to ensure food security while constraining the growth of RRL and improving CLUE.

2. Theoretical Framework and Research Hypothesis

The change in RRL not only has a direct impact on CLUE but also indirectly affects CLUE through mediating variables. To verify these, we have constructed a theoretical framework and composed research hypotheses (Figure 1). The RRL not only includes the houses that farmers live in but also includes the production and living facilities attached to the houses, and it is an important part of land use types [40,41]. The CLUE emphasizes the maximization of the output value of economic, social, and ecological comprehensive benefits with reasonable factor input [42]. However, with the rapid development of China’s social economy and urbanization, the rapid expansion of RRL has led to the occupation of a large amount of cultivated land [43]. To maintain the total amount of cultivated land, large amounts of slope cultivated land and other cultivated land with low production potential are supplemented [44]. However, on such cultivated land, it is difficult to maintain the original grain yield and meet the growing food demand of human beings. This also led to a large number of agricultural means of production such as pesticides, fertilizers, and agricultural plastic films being invested to improve the grain production capacity of the cultivated land [45]. Notably, this mode of production is unsustainable and has caused great damage to the quality of the cultivated land and the ecological environment, which will also lead to the reduction in CLUE. Therefore, this paper proposes hypothesis H1: The expansion of RRL has a negative impact on CLUE.
Meanwhile, the expansion of RRL occupation of cultivated land has led to the decline in the overall cultivated land area, because although some regions make full use of various natural advantages to supplement cultivated land, there are still some regions that cannot fully compensate for the occupied cultivated land area due to the limitation of land resources [46]. In the case of little change in the total population, the decrease in cultivated land area will lead to the decrease in the per capita cultivated land area (PCLA) [47], which will also lead to the decrease in grain yield and then to the decline in CLUE. Therefore, this paper proposes hypothesis H2: RRL change has an impact on CLUE through the PCLA; that is, the PCLA has a mediating effect.
Moreover, with the rapid development of China’s social economy and the rapid improvement of the urbanization rate, more people in rural areas are moving to cities and towns to engage in higher-income non-agricultural labor, which leads to the widespread reduction in the rural permanent population (RPP). While the expansion of RRL leads to less cultivated land, the loss of RRP leads to the reduction in the rural labor force that can engage in agricultural production [48], which will seriously restrict the input and output of agricultural production factors and have a greater impact on CLUE. Therefore, this paper proposes hypothesis H3: RRL change has an impact on CLUE through the RPP; that is, the RRP has a mediating effect.
Last but not least, due to the flat terrain of cultivated land, coupled with the insufficient supervision of the relevant government on the illegal occupation of cultivated land in early years and the weak legal awareness of farmers on the protection of cultivated land, it has become the first choice for farmers to build houses directly on cultivated land with desirable location conditions, which is also the main reason why a large amount of farmland is occupied in the process of RRL expansion. Moreover, the cultivated land occupied by RRL not only reduces the total area of cultivated land but also leads to the fragmentation of cultivated land distribution [49], thereby limiting the development of agricultural mechanization and scale, which will also lead to the decline in CLUE. Therefore, this paper proposes hypothesis H4: RRL change has an impact on the CLUE through the area of cultivated land occupied by rural residential land (CLRRL); that is, the CLRRL has a mediating effect.

3. Materials and Methods

3.1. Study Area

The MRYR, 955 km in length to the east of the Three Gorges, covers Hubei, Hunan, and Jiangxi provinces in China (Figure 2), including 42 prefecture-level cities, with a drainage area of 68 × 104 km2 [50,51]. The MRYR are located in the second- and third-step transitional zones of China. The landform types are complex and diverse, mainly hills and mountains, belonging to the northern subtropical monsoon climate. In 2021, the permanent population of the MRYR was 169.694 million, accounting for 12% of China’s total population. Moreover, the annual GDP was 12,569.573 billion RMB, accounting for 10.99% of China’s total GDP. As the region’s economy grows, the land use in the MRYR has also undergone rapid transformation. From 2000 to 2020, the cultivated land decreased by 5950.8 km2, the RRL increased by 303.9 km2, and other construction land increased by 7645.8 km2, which had a huge impact on local food security. Specifically, there are three main reasons for choosing MRYR as the study area in this paper: (1) In the past 20 years, the urbanization speed in the MRYR has accelerated, and the spatiotemporal change characteristics of RRL are obvious. (2) The three provinces in the MRYR are the main parts of China’s main grain-producing regions. The level of CLUE has a greater impact on China’s overall grain output. (3) With the population growth and the improvement of the economic level in the MRYR, the disorderly expansion of RRL has led to the occupation of a large amount of cultivated land, which not only inhibits the improvement of the CLUE but also seriously threatens the national food security.

3.2. Data Sources

The land use data and provincial and municipal boundary vector data in this paper are from the Institute of Geographic Science and Resources, Chinese Academy of Sciences (http://www.resdc.cn/, accessed on 5 August 2022), and the spatial resolution of the data is 30 × 30 m. Referring to the existing land use classification system and the actual land use characteristics of the study area, this paper uses the reclassify function of ArcGIS 10.5 software to divide the land types in the MRYR into eight types, i.e., cultivated land, forestland, grassland, water area, RRL, other construction land, and unused land. In addition, the socioeconomic data involved in this study are derived from the corresponding provincial and municipal statistical yearbooks and statistical bulletins, while the carbon emission data are derived from China’s Carbon Emission Accounts and Datasets (https://www.ceads.net.cn/, accessed on 10 September 2022). Some missing data are supplemented by interpolation and moving average methods [52,53]. Meanwhile, according to the previous studies and the availability and representativeness of the research data, this paper selects 2000, 2010, and 2020 as the research time nodes, and the relevant data also use the corresponding years.

3.3. Indicator Selection and Data Characteristics

3.3.1. Indicator Selection

The CLUE can be expressed as the interrelation between the input of cultivated land resources and the funds, labor, and energy carried by them in the region and the social, economic, and ecological benefits they produce, and it reflects the realization degree of the cultivated land resource value [9,54]. To make the measurement results of CLUE more scientific, this paper establishes an evaluation index system from the two aspects of “input-output” based on the principles of scientificity, comprehensiveness, and operability, referring to previous relevant studies (Table 1) [2,55,56]. In terms of input, this paper selects 7 aspects to evaluate, namely labor force, cultivated land, agricultural machinery, irrigation, pesticide, fertilizer, and agricultural plastic film input [54,57]. In terms of cultivated land output, this paper takes full account of social benefits, economic benefits, and ecological benefits from the perspective of the expected and unexpected output of cultivated land and finally selects the three variables of total grain output, total agricultural output value, and total carbon emissions of cultivated land use as evaluation indicators [58,59,60].
In addition, to deeply explore the impact of RRL change on CLUE, this paper considers the impact of mediating variables and control variables (Table 2) [10]. Among them, the mediating variable includes 3 indicators, namely PCLA, RPP, and CLRRL, mainly to explore whether it has a mediating effect in the process of RRL change affecting CLUE. Meanwhile, to clarify the causal relationship between the change in RRL and CLUE and exclude the impact of other indicators on the research results, including GDP, total regional population (TRP), per capita disposable income of farmers (PDIF), urban construction land area (UCLA), the proportion of the primary industry (PPI), and the proportion of nongrain crop sown area (PNG), are included in the model analysis as control variables [28,61].

3.3.2. Basic Characteristics of Research Data

The basic characteristics of the research data are shown in Table 3. Among the input indicators of cultivated land utilization, the LF, CL, and FE show a sharp downward trend, PE shows a fluctuating downward trend, and AM, IR, and APF show a continuous growth trend. Comparatively speaking, among the output indicators of cultivated land utilization, the SB and ELB show a wave dynamic trend, and reached the highest output around 2010, while the ENB shows a trend of continuous growth. In addition, for the influencing factors of CLUE, there was a growing trend in 2000–2010 and 2010–2020. The influencing factors with larger growth rates in 2010–2020 compared with 2000–2010 were PCLA, RPP, GDP, and PDIF, while the influencing factors with smaller growth rates were RRL, UCLA, and PNG. In addition, the influencing factors for the decline in the change range are CLRRL, TRP, and PPI.

3.4. Methodology

3.4.1. Kernel Density Estimation

As a nonparametric estimation method, kernel density estimation is suitable for analyzing point and line geographical elements. This method calculates the density of spatial points or lines in the surrounding neighborhood, optimizes and simulates the density distribution of elements [62], and then reflects the spatial distribution characteristics of elements according to the kernel density value [63,64]. Meanwhile, because this method retains the original dynamic information destroyed when constructing the transition probability matrix, there is no need to limit the Markov property of the data generation process, so it can better restore the characteristics of the data itself and has strong adaptability. The calculation formula is as follows:
f ( x ) = i = 1 n 1 π r 2 φ ( d i x r )
where f ( x ) is the estimated nuclear density at x , r is the search radius, n is the total number of samples, d i x is the distance between the estimated points i and x , and φ is the weight of the distance.

3.4.2. Dynamic Degree of Land Use Change

The dynamic degree of land use change can reflect the range and rate of change of each land type in a certain period [65]. Among them, a single dynamic degree describes the change rate of the area of a certain land use type within a certain time range in the region. The larger the index value is, the higher the severity of the area change of this land use type. The calculation formula is as follows:
P = U b U a U a × 1 T × 100 %
where P is the dynamic degree of a certain type of land use; U a and U b are the areas of a certain type of land use at the beginning and end of the study, respectively; and T is the length of the study period.

3.4.3. Getis-Ord G i * Hot-Spot Analysis

Getis-Ord G i * hot-spot analysis is a judgment method of local spatial clustering distribution characteristics, which is used to measure the clustering relationship between each unit and its surrounding units [66,67]. Based on the hot-spot analysis tool in the spatial analysis module of ArcGIS 10.5 software, this paper uses Getis-Ord G i * statistics to determine whether there are high-value and low-value clusters with significant statistical significance and identify their spatial distribution positions. The calculation formula is as follows:
G i * = j n w i j x i j n x j
Z = G i * E ( G i * ) Var ( G i * )
where G i * is the agglomeration index of spatial unit i; G i * is the significance of the agglomeration index; w i j is the spatial weight defined by distance; x i and x j represent the attribute value of spatial units i and j ; and E ( G i * ) and Var ( G i * ) represent mathematical expectation and variance. If the p-value is significant, the z score is positive, and the higher the value is, the higher the spatial concentration (hot-spot) of the high-value cluster is. The opposite indicates the lower spatial concentration (cold-spot) of the low-value cluster.

3.4.4. Super-SBM Model

Tone [68] combines the advantages of the SBM model and super-efficiency DEA to propose the Super-SBM model, which makes up for the defect that the SBM model cannot compare and sort the efficiency of multiple effective decision-making units. Meanwhile, the relaxation improvement part is also added to solve the issue that the DEA model cannot include the unexpected output [69,70]. The calculation formula is as follows:
ρ * = m i n 1 m i = 1 m x i ¯ x i o 1 q + w ( r = 1 q y ¯ r g y ¯ r o g + u = 1 w y ¯ u b y ¯ u o b )
S . t . { x ¯ j = 1 , j 0 n λ j x j ; j = 1 , , m y ¯ g j = 1 , j 0 n λ j y j g ; r = 1 , , q y ¯ b j = 1 , j 0 n λ j y j b ; u = 1 , , w x ¯ x o , y ¯ g y o g , y ¯ b y o b λ 0 , j = 1 , j 0 n λ j = 1
where ρ * is the efficiency value; m is the input element; q is the expected output; w is the unexpected output; x is the input vector; y g is the expected output vector; y b is the unexpected output vector; x i ¯ , y ¯ r g , and y ¯ u b are relaxation vectors of input, expected output, and unexpected output, respectively; λ is the weight vector; the horizontal line above the letter represents the projection value of the corresponding input and output in the model; and the subscript o represents the evaluated decision-making unit. ρ * > 0; the higher the ρ * value is, the higher the efficiency level.

3.4.5. Mediating Effect Test

The mediating effect test can effectively explore whether there are mediating variables in the relationship between variables and further reveal the mechanism behind the relationship [71,72]. Therefore, this paper uses the stepwise regression method and bootstrap mediating effect test method to explore the mediating variables of RRL change in the process of affecting CLUE. The stepwise regression method is used to verify whether the mediating effect is established, and the bootstrap mediating effect test method is used to test the stability of the results. The calculation formula is as follows:
Y = c X + e 1
M = a X + e 2
Y = c X + b M + e 3
where c represents the total effect of independent variable X on dependent variable Y ; a is the effect of independent variable X on mediating variable M ; b is the effect of mediating variable M on dependent variable Y after controlling the influence of independent variable X ; c is the direct effect of independent variable X on dependent variable Y after controlling the influence of mediating variable M ; and e 1 , e 2 , and e 3 represent residuals.

4. Results

4.1. Spatiotemporal Characteristics of RRL

4.1.1. Transfer in and Transfer out of RRL during 2000–2020

ArcGIS 10.5 software was used to overlay the changes in RRL during 2000–2020, and the spatiotemporal distribution of the transfer in and transfer out of RRL was obtained (Figure 3). On the whole, the transfer in the RRL area is higher than the transfer out of the area. From 2000 to 2020, the RRL area increased by 30,386.34 hm2, a net increase of 3.9%. The cities with large net growth areas of RRL include Yichun, Xiangyang, Ji’an, Jingzhou, Yueyang, etc. The red column of these cities in Figure 3 is significantly higher than the green column, which also proves this. The main reason is that the growth area of RRL is affected not only by the level of socioeconomic development but also by policy factors, such as new rural construction. In the early period, farmers continued to expand the RRL to build new houses, while the demolition of dilapidated houses on the original site to build new houses was not common, which made the RRL area show a growing trend in most cities in the past two decades. In addition, the RRL area in Xiangxi, Hunan Province, decreased by 4414.77 hm2, a decrease of 2.08%, during 2000–2010. The main reason for this phenomenon is that the local government implemented the policy of ecological migration and poverty alleviation and relocation to protect environment and reduce the number of poor people, which makes the agricultural population continue to gather in cities and towns, and the area of RRL continues to decrease.

4.1.2. Dynamic Degree of RRL Change
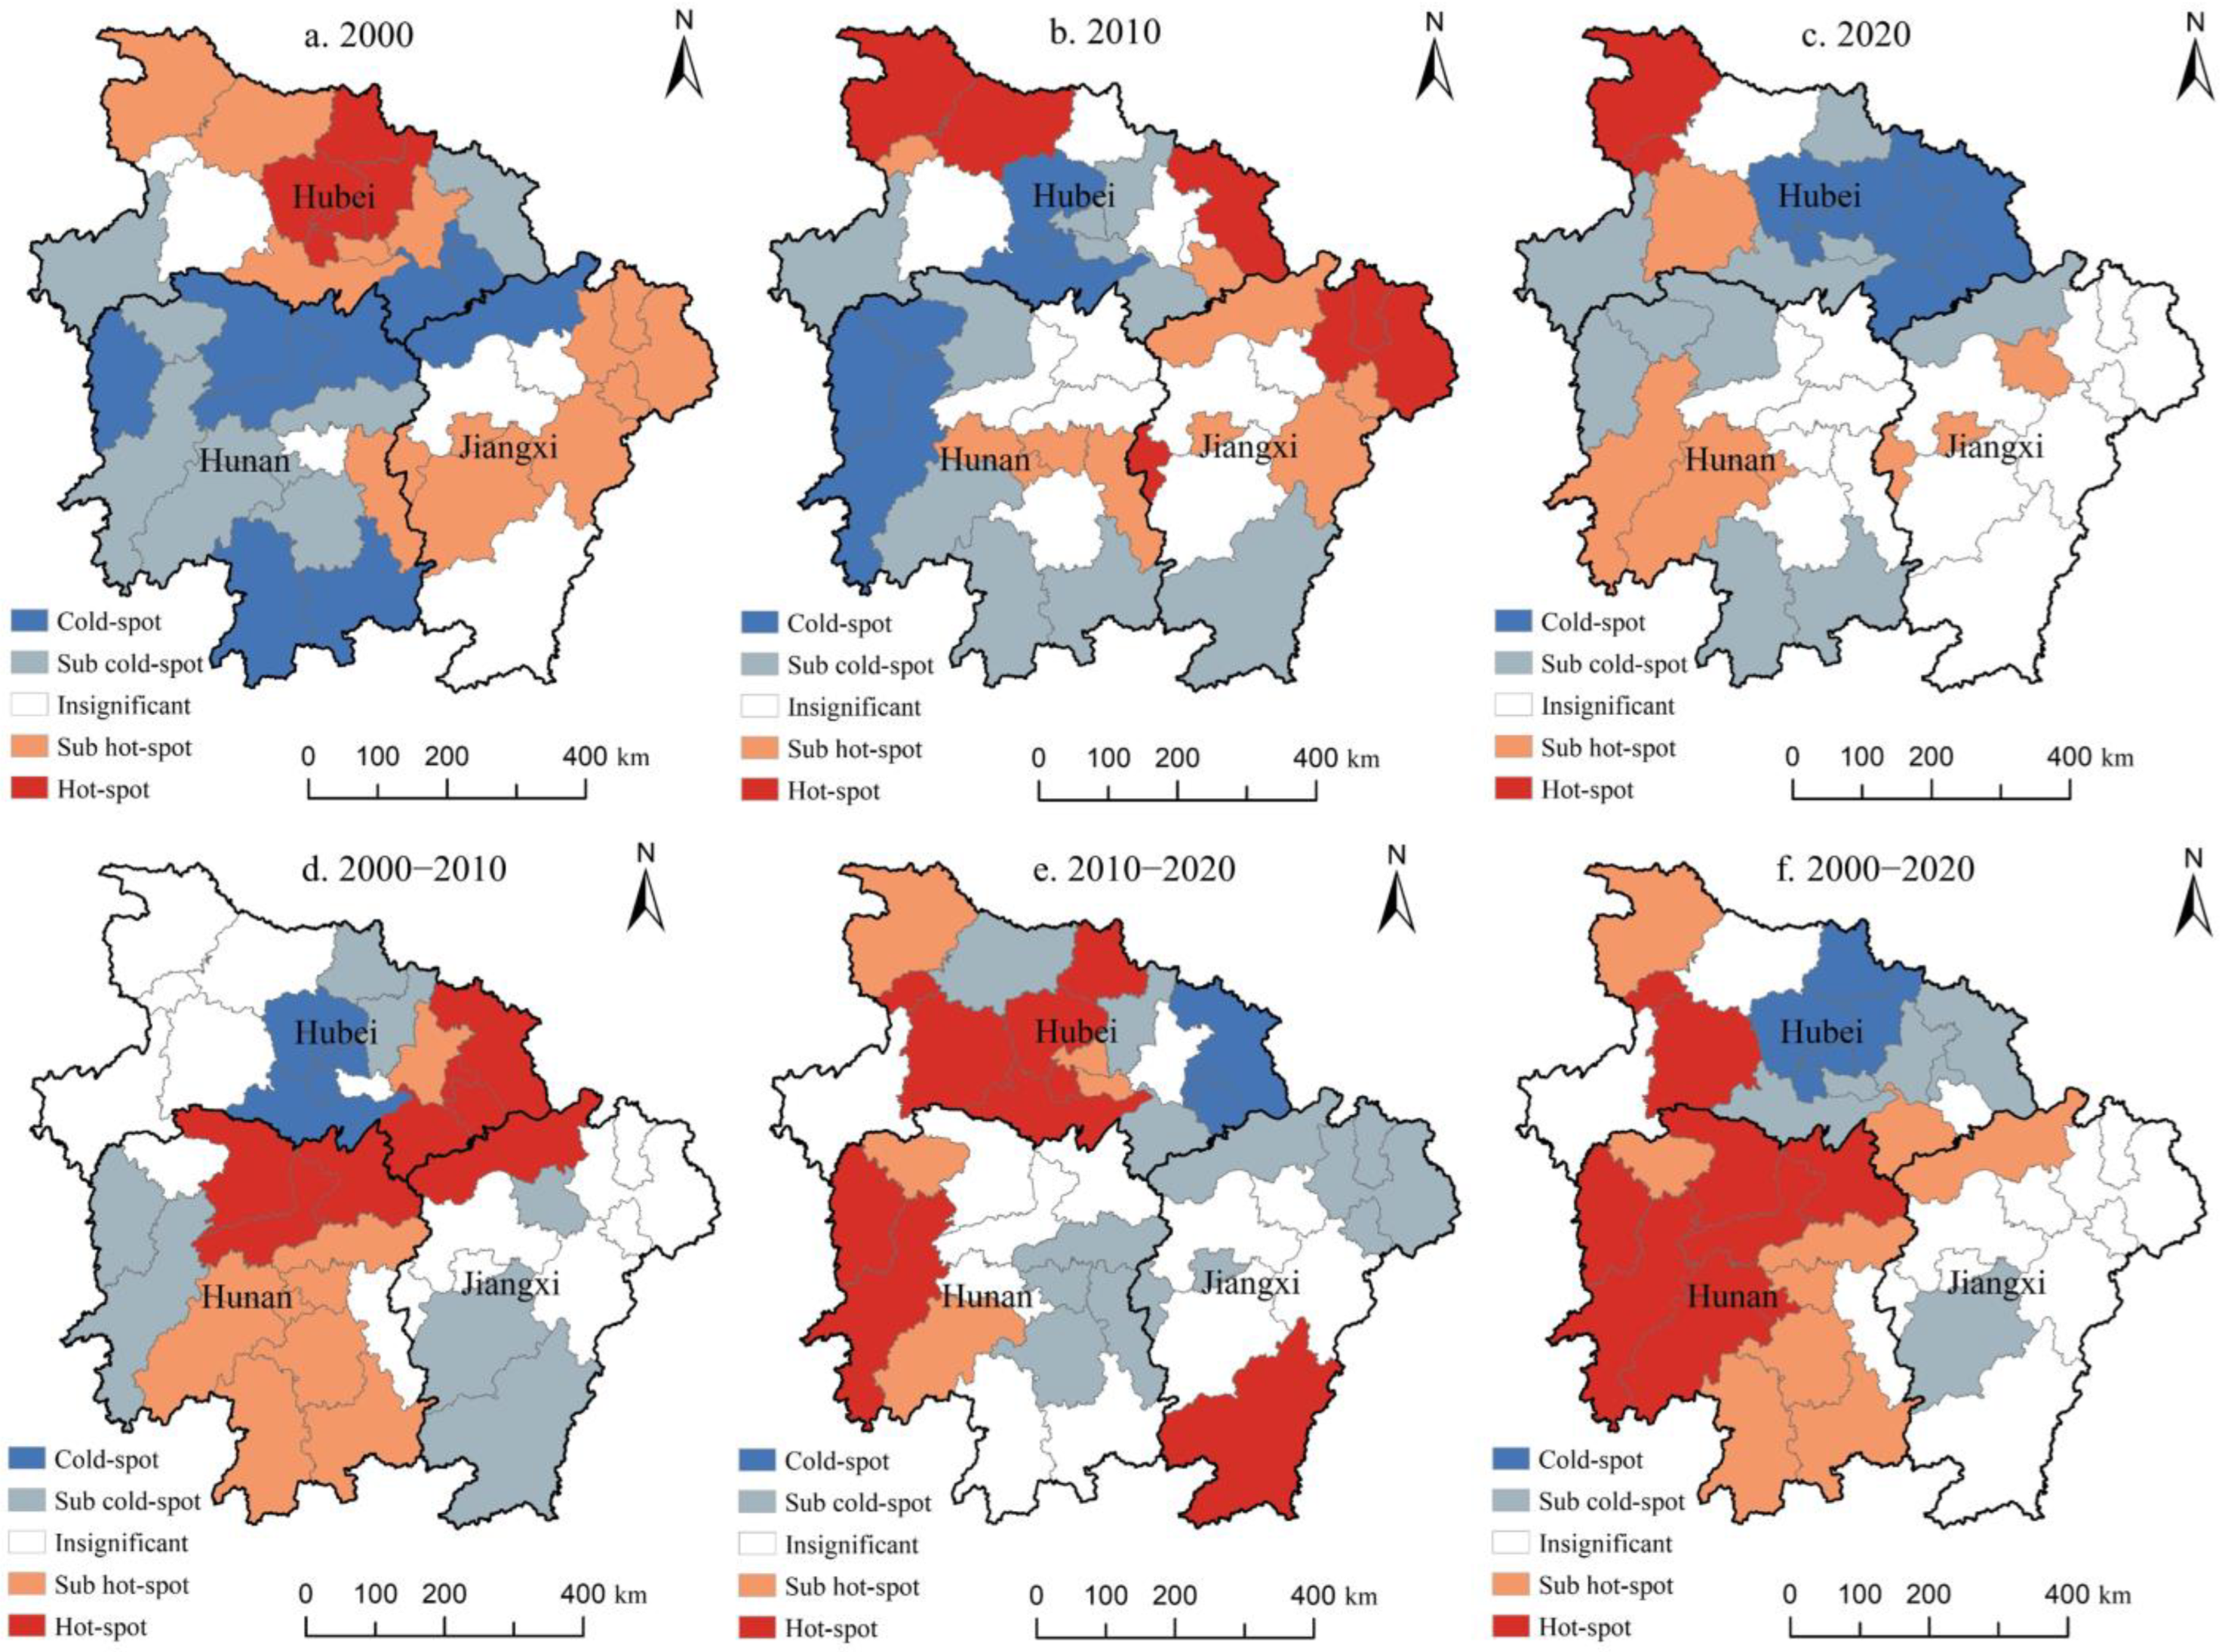
The change dynamics of the RRL area reflect the change in speed and range in the study area over a period of time (Figure 4 and Table 4). The RRL area in the MRYR showed an overall growth trend during 2000–2020 but showed different distribution characteristics in different periods. Among them, the RRL growth areas were mainly distributed throughout Jiangxi Province, the central and southwestern cities of Hubei Province, and the southwestern cities of Hunan Province during 2000–2010 (Figure 4a). The growth area of RRL mainly covered the cities in the middle of Jiangxi Province, the cities in the east and northwest of Hubei Province, and all cities in Hunan Province except the northwest during 2010–2020 (Figure 4b). The RRL area in Jiangxi Province and Hubei Province increased, while that in Hunan Province decreased in a small number of cities during 2000–2020 (Figure 4c).
In addition, in the dynamic degree of RRL change during 2000–2020 (Figure 4d–f), except for Xiangxi (−2.08%), Zhangjiajie (−0.15%), Yiyang (−0.07%), Xiangtan (−0.08%), and Yongzhou (−0.02%) in Hunan Province, which showed a decreasing trend, the other regions showed a growing trend, of which Pingxiang (2.52%) in Jiangxi Province and Shennongjia (2.78%) and Enshi (1.88%) in Hubei Province had the largest growth rate. Specifically, the regions with large growth rates of RRL area were mainly Pingxiang (4.38%), Yichun (2.32%), and Xinyu (2.02%) in Jiangxi Province and Xiangyang (2.23%) and Enshi (6.52%) in Hubei Province, while the region with the largest reduction rate of RRL area was Xiangxi (4.12%) in Hunan Province during 2000–2010. Subsequently, northwestern Hubei Province was a region with a large increase in RRL area, while northern and southern Jiangxi Province, northern and southwestern Hubei Province, and northwestern Hunan Province were regions with a large decrease in RRL area during 2010–2020.

4.2. Getis-Ord G i * Hot-Spot Analysis of CLUE Change

The hot-spot analysis function in ArcGIS 10.5 software was used to identify the statistically significant cold-spot and hot-spot distribution characteristics in the current situation and change dynamics of CLUE in the MRYR. According to the natural break method, the value of G i * was divided into five categories: hot-spot, sub-hot-spot, insignificant, sub-cold-spot, and cold-spot (Figure 5). In 2000, 2010 and 2020, there was a significant difference between the cold-spot and hot-spot in the current situation of CLUE in the MRYR. Specifically, in 2000 (Figure 5a), the hot-spot and sub-hot-spot areas were mainly concentrated in the middle and east of Jiangxi Province and the middle and north of Hubei Province, while the cold-spot and sub-cold-spot areas were mainly distributed in the northwest of Jiangxi Province, the southeast of Hubei Province, and other regions in Hunan Province except Zhuzhou. In 2010 (Figure 5b), the northeast of Jiangxi Province, the east and northwest of Hubei Province, and the middle and east of Hunan Province were mainly hot-spot and sub-hot-spot areas, while the south of Jiangxi Province, the middle and southwest of Hubei Province, and the west and south of Hunan Province were mainly cold-spot and sub-cold-spot areas. However, in 2020 (Figure 5c), the hot-spot and sub-hot-spot areas were mainly distributed in northwestern Hubei Province, western Hunan Province, and some areas of Jiangxi Province, while the cold-spot and sub-cold-spot areas were mainly distributed in eastern Hubei Province and southern and northwestern Hunan Province.
Meanwhile, as far as the dynamic degree of changes in CLUE is concerned, the hot-spot and sub-hot-spot areas were mainly concentrated in the whole of Hunan Province and the northwest of Hubei and Jiangxi Province, while the cold-spot and sub-cold-spot areas were mainly concentrated in the middle of Jiangxi Province and the middle and east of Hubei Province during 2000–2020 (Figure 5f). Specifically, during 2000–2010 (Figure 5d), the northwest of Jiangxi Province, the east of Hubei Province, and the middle and north of Hunan Province were mainly hot-spot and sub-hot-spot areas, while the south of Jiangxi Province, the middle of Hubei Province, and the west of Hunan Province were cold-spot and sub-cold-spot areas. However, during 2010–2020 (Figure 5e), the hot-spot and sub-hot-spot areas mainly included the south of Jiangxi Province, the middle of Hubei Province, and the west of Hunan Province, while the cold-spot and sub-cold-spot areas were mainly concentrated in the northeast of Jiangxi Province and the east of Hubei and Hunan Provinces.

4.3. Analysis of the Influence of RRL Change on CLUE and Its Mediating Factors

4.3.1. Direct Impact of RRL Change on CLUE

To explore the direct impact of RRL area change on CLUE, we conducted regression model analysis on the data of 2000–2010, 2010–2020, and 2000–2020 (Table 5). We first performed a basic analysis of the research data and found that the data present a normal distribution, the dependent variable and the independent variable have a linear relationship, and there is no multicollinearity, which meets the preconditions for using the ordinary least squares (OLS) model [73]. Meanwhile, because the units and magnitudes of each indicator are quite different, we standardized the data [74]. On the whole, the RRL area and CLUE showed a significant negative correlation at the 5% level during 2000–2020, indicating that the growth of the RRL area would lead to the decline in the CLUE when the control variables remained unchanged. Meanwhile, except for GDP and PNG, the other control variables have a significant negative correlation with CLUE at the 1% level. In addition, the RRL area and CLUE showed a significant negative correlation at the 5% level during 2000–2010, but there was no correlation between them during 2010–2020, indicating that the RRL area has a negative impact on the CLUE only during 2000–2010. Among the control variables, GDP and PNG during 2000–2010 and TRP during 2010–2020 are not significantly related to CLUE, while other control variables are significantly related to CLUE at the 5% level.
Based on the research results of Hangartner et al. [75] and Zhou et al. [76], this paper mainly conducts robustness tests by transforming regression samples and replacement regression methods (Table 6). First, we excluded the data of Wuhan, Changsha, and Nanchang, the three provincial capital cities. Because the social and economic level of the provincial capital cities is at the forefront of the province, there is a significant difference from other prefecture-level cities in the province. Second, we selected the Ordered Logit model to replace the OLS model. At present, the data samples in this paper conform to the assumptions of the Ordered Logit model, which can be used as the robustness test method [77]. The results of the robustness test show that although the RRL coefficient has some fluctuations, the negative direction and significance level of the coefficient are always consistent with the regression results of the OLS model. In addition, we can find that after replacing the regression method and removing some data, the model regression results are also robust, so the research results show that hypothesis H1 is valid; that is, RRL has a negative impact on the CLUE.

4.3.2. Analysis of the Mediating Factors of RRL Change on CLUE

According to the process of a stepwise regression test, we conducted a mediating effect test on PCLA, RPP, and CLRRL during 2000–2010, 2010–2020, and 2000–2020 (Table 7 and Table 8). During 2000–2020, the RRL area was correlated with CLRRL at the level of 1% but not with the PCLA and RPP. However, CLRRL was significantly correlated with the CLUE at the level of 5%, which indicates that CLRRL plays a mediating role in the process of RRL change affecting the CLUE, while the PCLA and the RPP do not play a mediating role. Meanwhile, during 2000–2010, the RRL area was related to the PCLA, RPP, and CLRRL at the level of 1%. Moreover, the PCLA, the RPP, and CLRRL were also correlated with the CLUE at the 1% level. These results indicate that the PCLA, RPP, and CLRRL play a mediating role in the process of RRL change affecting CLUE. In addition, during 2010–2020, the RRL area had a significant correlation with CLRRL at the 5% level but not with the PCLA and the RPP. The PCLA and CLRRL had a significant correlation with CLUE at the 1% level, while the RPP had no significant correlation. These results indicate that CLRRL plays a mediating role in the process of RRL change affecting CLUE. The RPP does not have a mediating effect, while the PCLA needs to be further tested by the bootstrap method.
To ensure the stability of the stepwise regression test results, this paper uses the bootstrap test method to verify the mediating effect results (Table 9), and the sample size of the bootstrap test is 5000. On the whole, the PCLA has no mediating effect on the RPP, while CLRRL has a mediating effect during 2000–2020. Specifically, PCLA, RPP, and CLRRL had mediating effects during 2000–2010. However, the PCLA and RPP had no mediating effect, while CLRRL had a mediating effect during 2010–2020. In summary, the results of the bootstrap mediating effect test are consistent with those of the stepwise regression test, indicating that the mediating effect test results in this paper are reliable, so the research results show that hypotheses H2, H3, and H4 are valid.

5. Discussion

5.1. The Change in RRL and CLUE Shows a Significant Spatiotemporal Difference

During 2000–2020, the RRL area increased by 30,386.34 hm2, of which Pingxiang in Jiangxi Province and Shennongjia in Hubei Province showed a large increase. The main reason is that with the socioeconomic development, the income level of farmers has also increased. In addition, in the early period, rural collective organizations had weak approval and control over RRL, leading to the expansion of RRL. Of course, the RRL area in a small number of areas has decreased, among which Xiangxi in Hunan Province has a large reduction range [67]. The main reason for this phenomenon is that the government has implemented the policy of ecological migration and poverty alleviation and relocation, which makes a large amount of the local rural population gather in cities and towns, and thus the RRL area has decreased. Xiang et al. also reached a similar conclusion in the study on land use types in Xiangxi, Hunan province, China [78]. Therefore, it can be found that the factors that affect RRL change are not only the spontaneous behavior of farmers in consideration of economic interests but also various policies implemented by the government for rural areas, and the reduction in RRL area is mainly influenced by government policy factors [49]. Meanwhile, regarding the spatiotemporal change characteristics of CLUE during 2000–2020, the hot-spot and sub-hot-spot areas were mainly concentrated in the whole of Hunan Province and the northwest of Hubei Province and Jiangxi Province, while the cold-spot and sub-cold-spot areas were mainly concentrated in the middle of Jiangxi Province and the middle and east of Hubei Province. From the perspective of socioeconomic factors, the reason for this phenomenon is that the economic development speed of regions with a large increase in CLUE is also fast, which has promoted the improvement of CLUE. Moreover, the government needs to pay more attention to the improvement of RRL use mode and increase CLUE [43]. Due to the significant spatiotemporal differences between the changes in RRL and CLUE, local governments must adopt differentiated policies to restrict the growth of the RRL area and promote the improvement of CLUE.

5.2. Growth of RRL Will Reduce CLUE

Without adding the control variable, the overall RRL change had a significant negative impact on the CLUE during 2000–2020, indicating that the growth of the RRL area will reduce the CLUE, so the government must restrict the growth of the RRL area. However, the change in RRL has no significant impact on CLUE during 2010–2020. These results indicate that although the overall RRL change has a significant impact on CLUE, it has obvious differences in different periods. The reason for this difference may be the mismatch in quantity and space between RRL and cultivated land [79]. In addition, to better clarify the causal relationship between the change in RRL and CLUE, this paper adds GDP, TRP, and other control variables. The results show that the GDP and PNG were positively correlated with the CLUE at the level of 1% during 2000–2020, which promoted the improvement of the CLUE. However, TRP, PDIF, UCLA, and PPI are negatively related to CLUE, which to some extent hinders the improvement of CLUE. This shows that in the process of the impact of RRL change on CLUE, control variables, such as GDP and TRP, are disturbing. Therefore, bringing these control variables into the regression model will make the causal analysis results between rural RRL and CLUE clearer and more reliable. As the model analysis results confirm that the growth of RRL will reduce CLUE, the implementation of village planning and RRL consolidation measures to limit the further growth of RRL will improve CLUE.

5.3. Impact of RRL on CLUE Is Affected by Mediating Variables

The impact of RRL change on CLUE may be affected by other factors, so this paper further introduces PCLA, RPP, and CLRRL as mediating variables to test. The analysis results of the stepwise regression method and bootstrap test method show that CLRRL has a mediating effect in the process of RRL affecting CLUE during 2000–2020. This shows that the occupation of cultivated land in the process of RRL area growth is the main factor restricting the improvement of CLUE, which is mainly because the input of cultivated land area decreases and then restricts the improvement of CLUE. In addition, PCLA and RPP had a significant mediating role during 2000–2010 but did not have a mediating role during 2010–2020, indicating that mediating variables played different roles in different periods. Among them, the PCLA and RPP both played a positive mediating role during 2000–2010; that is, the improvement of the PCLA and RPP increased the input of cultivated land area and labor force, which helped to improve the CLUE, to a certain extent. However, during 2010–2020, the PCLA and RPP did not have a mediating effect in the first half (RRL → PCLA, RRL → RPP) but had a mediating effect in the second half (PCLA → CLUE, RPP → CLUE), indicating that the PCLA and RPP did not have a complete mediating effect. Therefore, the effect path of RRL on CLUE is only “RRL → CLRRL → CLUE” in this study.

5.4. Research Contribution and Deficiency

The main contributions of this study are as follows: (1) Exploring the spatiotemporal change characteristics of RRL and CLUE in the MRYR. (2) Fully considering the influence of mediating variables and control variables, the paper clarifies the action path of RRL change affecting CLUE. However, this study also has shortcomings: (1) This paper takes the MRYR as the research area, and its research results may not be applicable to other regions in the world, but it can be used as a reference for research in regions with similar socioeconomic conditions. (2) Based on previous studies and fully considering the actual impact of RRL change on CLUE, this paper only selects the PCLA, RPP, and CLRRL as mediating variables, while there may be missing mediating variables that have not been tested.

6. Conclusions

We used kernel density estimation, the Super-SBM model, and mediating effect test methods to analyze the spatiotemporal change distribution characteristics of RRL and CLUE in the MRYR during 2000–2020 and explore the impact path of RRL change on CLUE. There are four main conclusions: (1) RRL showed an overall growth trend, but its distribution characteristics showed significant heterogeneity differences during 2000–2020. In the changing dynamics of the RRL area, except for a few regions in Hunan Province that decreased, the RRL area in other regions increased. (2) The CLUE of each region showed significant spatial differentiation characteristics during 2000–2020, of which the cold-spot and sub-cold-spot regions accounted for the vast majority, while the hot-spot and sub-hot-spot regions were mainly concentrated in northwestern Hubei Province and eastern Hunan Province. Meanwhile, the whole territory of Hunan Province, the northwest of Hubei Province and Jiangxi Province are the regions where CLUE has increased significantly, while the central and eastern regions of Hubei Province are the regions where CLUE has decreased significantly. (3) Under the control of socioeconomic variables, such as GDP and TRP, the change in RRL has a significant negative impact on CLUE; that is, the growth of the RRL area will reduce CLUE as a whole. (4) The process of the impact of RRL on CLUE is regulated by mediating variables. Among them, CLRRL has a mediating role during 2000–2020, while the PCLA and RPP only have a mediating role during 2000–2010.
This paper puts forward two policy recommendations: (1) The growth of RRL will lead to a decline in CLUE, while RRL and CLUE have significant spatiotemporal change differentiation characteristics. Therefore, 42 cities in the MRYR should optimize the distribution and area of RRL through village planning, RRL consolidation, and other measures according to actual local conditions to promote the benign development balance between RRL and CLUE. (2) CLRRL has a mediating effect in the process of RRL affecting CLUE. Therefore, while limiting the growth area of RRL, the government should strictly prohibit the occupation of cultivated land to restrict the use of RRL to ensure the relative stability of cultivated land.

Author Contributions

Conceptualization, H.T. and Y.W.; methodology, H.T.; software, H.T. and J.C.; writing—original draft preparation, H.T.; writing—review and editing, H.T., Y.W., J.C., L.D. and M.Z.; supervision, Y.W.; funding acquisition, Y.W. All authors have read and agreed to the published version of the manuscript.

Funding

This research received no external funding.

Data Availability Statement

The data presented in this study are available on request from the corresponding author.

Conflicts of Interest

The authors declare no conflict of interest.

References

  1. Charles, H.; Godfray, J.; Beddington, J.R.; Crute, I.R.; Haddad, L.; Lawrence, D.; Muir, J.F.; Pretty, J.; Robinson, S.; Thomas, S.M.; et al. Food Security: The challenge of feeding 9 billion people. Science 2010, 327, 812–818. [Google Scholar] [CrossRef] [Green Version]
  2. Foley, J.A.; Ramankutty, N.; Brauman, K.A.; Cassidy, E.S.; Gerber, J.S.; Johnston, M.; Mueller, N.D.; O’Connell, C.; Ray, D.K.; West, P.C.; et al. Solutions for a cultivated planet. Nature 2011, 478, 337–342. [Google Scholar] [CrossRef] [PubMed] [Green Version]
  3. Farrukh, M.U.; Bashir, M.K.; Hassan, S.; Adil, S.A.; Kragt, M.E. Mapping the food security studies in India, Pakistan and Bangladesh: Review of research priorities and gaps. Glob. Food Sec. 2020, 26, 100370. [Google Scholar] [CrossRef]
  4. FSIN. Global Report on Food Crises 2021: Building Resilience to Prevent Food Crises and Conflict. IFPRI. 2021. Available online: https://www.ifpri.org/event/global-report-food-crises-2021-building-resilience-prevent-food-crises-and-conflict (accessed on 20 August 2022).
  5. Liu, Y.; Zhou, Y. Reflections on China’s food security and land use policy under rapid urbanization. Land Use Policy 2021, 109, 105699. [Google Scholar] [CrossRef]
  6. Yin, Y.; Hou, X.; Liu, J.; Zhou, X.; Zhang, D. Detection and attribution of changes in cultivated land use ecological efficiency: A case study on Yangtze River Economic Belt, China. Ecol. Indic. 2022, 137, 108753. [Google Scholar] [CrossRef]
  7. Cai, J.; Ma, E.; Lin, J.; Liao, L.; Han, Y. Exploring global food security pattern from the perspective of spatio-temporal evolution. J. Geogr. Sci. 2020, 30, 179–196. [Google Scholar] [CrossRef]
  8. Ke, N.; Zhang, X.; Lu, X.; Kuang, B.; Jiang, B. Regional disparities and influencing factors of eco-efficiency of arable land utilization in China. Land 2022, 11, 257. [Google Scholar] [CrossRef]
  9. Yu, J.; Zhou, K.; Yang, S. Land use efficiency and influencing factors of urban agglomerations in China. Land Use Policy 2019, 88, 104143. [Google Scholar] [CrossRef]
  10. Sui, F.; Yang, Y.; Zhao, S. Labor structure, land fragmentation, and land-use efficiency from the perspective of mediation effect: Based on a survey of Garlic Growers in Lanling, China. Land 2022, 11, 952. [Google Scholar] [CrossRef]
  11. Gao, X.; Zhang, A.; Sun, Z. How regional economic integration influence on urban land use efficiency? A case study of Wuhan metropolitan area, China. Land Use Policy 2020, 90, 104329. [Google Scholar] [CrossRef]
  12. Duro, J.A.; Lauk, C.; Kastner, T.; Erb, K.H.; Haberl, H. Global inequalities in food consumption, cropland demand and land-use efficiency: A decomposition analysis. Glob. Environ. Chang. 2020, 64, 102124. [Google Scholar] [CrossRef]
  13. Zhan, X.; Shao, C.; He, R.; Shi, R. Evolution and efficiency assessment of pesticide and fertiliser inputs to cultivated land in China. Int. J. Environ. Res. Public Health 2021, 18, 3771. [Google Scholar] [CrossRef] [PubMed]
  14. Lambin, E.F.; Meyfroidt, P. Global land use change, economic globalization, and the looming land scarcity. Proc. Natl. Acad. Sci. USA 2011, 108, 3465–3472. [Google Scholar] [CrossRef] [PubMed] [Green Version]
  15. Mellaku, M.T.; Sebsibe, A.S. Potential of mathematical model-based decision making to promote sustainable performance of agriculture in developing countries: A review article. Heliyon 2022, 8, e08968. [Google Scholar] [CrossRef] [PubMed]
  16. Cheng, P.; Tang, H.; Dong, Y.; Liu, K.; Jiang, P.; Liu, Y. Knowledge mapping of research on land use change and food security: A visual analysis using CiteSpace and VOSviewer. Int. J. Environ. Res. Public Health 2021, 18, 13065. [Google Scholar] [CrossRef]
  17. Wu, X.; Wang, Y.; Zhu, H. Does economic growth lead to an increase in cultivated land pressure? Evidence from China. Land 2022, 11, 1515. [Google Scholar] [CrossRef]
  18. Liang, X.; Jin, X.; Han, B.; Sun, R.; Xu, W.; Li, H.; He, J.; Li, J. China’s food security situation and key questions in the new era: A perspective of farmland protection. J. Geogr. Sci. 2022, 32, 1001–1019. [Google Scholar] [CrossRef]
  19. Pu, M.; Zhong, Y. Rising concerns over agricultural production as COVID-19 spreads: Lessons from China. Glob. Food Sec. 2020, 26, 100409. [Google Scholar] [CrossRef]
  20. Tian, Y.; Liu, Y.; Liu, X.; Kong, X.; Liu, G. Restructuring rural settlements based on subjective well-being (SWB): A case study in Hubei province, central China. Land Use Policy 2017, 63, 255–265. [Google Scholar] [CrossRef]
  21. Yang, H.; Wu, Q. Land use eco-efficiency and its convergence characteristics under the constraint of carbon emissions in China. Int. J. Environ. Res. Public Health 2019, 16, 3172. [Google Scholar] [CrossRef]
  22. Zhu, S.; Kong, X.; Jiang, P. Identification of the human-land relationship involved in the urbanization of rural settlements in Wuhan city circle, China. J. Rural Stud. 2020, 77, 75–83. [Google Scholar] [CrossRef]
  23. Cheng, P.; Qin, Y.; Zhu, S.; Kong, X. Ecological disturbance of rural settlement expansion: Evidence from Nantong, Eastern China. Land 2022, 11, 1741. [Google Scholar] [CrossRef]
  24. Kong, X.; Liu, D.; Tian, Y.; Liu, Y. Multi-objective spatial reconstruction of rural settlements considering intervillage social connections. J. Rural Stud. 2021, 84, 254–264. [Google Scholar] [CrossRef]
  25. He, Q.; Tan, S.; Yin, C.; Zhou, M. Collaborative optimization of rural residential land consolidation and urban construction land expansion: A case study of Huangpi in Wuhan, China. Comput. Environ. Urban Syst. 2019, 74, 218–228. [Google Scholar] [CrossRef]
  26. Dong, Y.; Cheng, P.; Kong, X. Spatially explicit restructuring of rural settlements: A dual-scale coupling approach. J. Rural Stud. 2022, 94, 239–249. [Google Scholar] [CrossRef]
  27. Zhang, Y.; Dai, Y.; Chen, Y.; Ke, X. Coupling coordination development of new-type urbanization and cultivated land low-carbon utilization in the Yangtze River Delta, China. Land 2022, 11, 919. [Google Scholar] [CrossRef]
  28. Cui, J.; Kong, X.; Chen, J.; Sun, J.; Zhu, Y. Spatially explicit evaluation and driving factor identification of land use conflict in yangtze river economic belt. Land 2021, 10, 43. [Google Scholar] [CrossRef]
  29. Herzig, A.; Nguyen, T.T.; Ausseil, A.G.E.; Maharjan, G.R.; Dymond, J.R.; Arnhold, S.; Koellner, T.; Rutledge, D.; Tenhunen, J. Assessing resource-use efficiency of land use. Environ. Model. Softw. 2018, 107, 34–49. [Google Scholar] [CrossRef]
  30. Ma, L.; Long, H.; Tang, L.; Tu, S.; Zhang, Y.; Qu, Y. Analysis of the spatial variations of determinants of agricultural production efficiency in China. Comput. Electron. Agric. 2021, 180, 105890. [Google Scholar] [CrossRef]
  31. Zhang, R.; Lu, J. Spatial-temporal pattern and convergence characteristics of provincial urban land use efficiency under environmental constraints in China. Int. J. Environ. Res. Public Health 2022, 19, 10729. [Google Scholar] [CrossRef]
  32. Ge, X.J.; Liu, X. Urban land use efficiency under resource-based economic transformation—A case study of shanxi province. Land 2021, 10, 850. [Google Scholar] [CrossRef]
  33. Han, X.; Zhang, A.; Cai, Y. Spatio-econometric analysis of urban land use efficiency in china from the perspective of natural resources input and undesirable outputs: A case study of 287 cities in china. Int. J. Environ. Res. Public Health 2020, 17, 7297. [Google Scholar] [CrossRef] [PubMed]
  34. Noda, K.; Iida, A.; Watanabe, S.; Osawa, K. Efficiency and sustainability of land-resource use on a small island. Environ. Res. Lett. 2019, 14, 54004. [Google Scholar] [CrossRef]
  35. Sari, D.W.; Hidayat, F.N.; Abdul, I. Efficiency of land use in smallholder palm oil plantations in indonesia: A stochastic frontier approach. For. Soc. 2021, 5, 75–89. [Google Scholar] [CrossRef]
  36. Ferreira, M.D.P.; Féres, J.G. Farm size and Land use efficiency in the Brazilian Amazon. Land Use Policy 2020, 99, 104901. [Google Scholar] [CrossRef]
  37. Liu, J.; Jin, X.; Xu, W.; Gu, Z.; Yang, X.; Ren, J.; Fan, Y.; Zhou, Y. A new framework of land use efficiency for the coordination among food, economy and ecology in regional development. Sci. Total Environ. 2020, 710, 135670. [Google Scholar] [CrossRef] [PubMed]
  38. Wang, G.; Liu, Y.; Li, Y.; Chen, Y. Dynamic trends and driving forces of land use intensification in the cultivated land of China. J. Geogr. Sci. 2015, 25, 45–57. [Google Scholar] [CrossRef] [Green Version]
  39. Chen, Y.; Li, S.; Cheng, L. Evaluation of cultivated land use efficiency with environmental constraints in the dongting lake eco-economic zone of hunan province, China. Land 2020, 9, 440. [Google Scholar] [CrossRef]
  40. Chen, Z.; Liu, X.; Lu, Z.; Li, Y. The expansion mechanism of rural residential land and implications for sustainable regional development: Evidence from the Baota District in China’s Loess Plateau. Land 2021, 10, 172. [Google Scholar] [CrossRef]
  41. Wang, Y.; Chen, L.; Long, K. Farmers’ identity, property rights cognition and perception of rural residential land distributive justice in China: Findings from Nanjing, Jiangsu Province. Habitat Int. 2018, 79, 99–108. [Google Scholar] [CrossRef]
  42. Han, H.; Zhang, X. Static and dynamic cultivated land use efficiency in China: A minimum distance to strong efficient frontier approach. J. Clean. Prod. 2020, 246, 119002. [Google Scholar] [CrossRef]
  43. Wang, H.; Wang, L.; Su, F.; Tao, R. Rural residential properties in China: Land use patterns, efficiency and prospects for reform. Habitat Int. 2012, 36, 201–209. [Google Scholar] [CrossRef]
  44. Chen, L.; Zhao, H.; Song, G.; Liu, Y. Optimization of cultivated land pattern for achieving cultivated land system security: A case study in Heilongjiang Province, China. Land Use Policy 2021, 108, 105589. [Google Scholar] [CrossRef]
  45. Han, H.; Zhang, X. Exploring environmental efficiency and total factor productivity of cultivated land use in China. Sci. Total Environ. 2020, 726, 138434. [Google Scholar] [CrossRef] [PubMed]
  46. Zhou, Y.; Li, X.; Liu, Y. Cultivated land protection and rational use in China. Land Use Policy 2021, 106, 105454. [Google Scholar] [CrossRef]
  47. Qu, Y.; Jiang, G.; Li, Z.; Tian, Y.; Wei, S. Understanding rural land use transition and regional consolidation implications in China. Land Use Policy 2019, 82, 742–753. [Google Scholar] [CrossRef]
  48. Qu, Y.; Zhan, L.; Jiang, G.; Ma, W.; Dong, X. How to Address “Population Decline and Land Expansion (PDLE)” of rural residential areas in the process of Urbanization: A comparative regional analysis of human-land interaction in Shandong Province. Habitat Int. 2021, 117, 102441. [Google Scholar] [CrossRef]
  49. Wen, Y.; Zhang, Z.; Liang, D.; Xu, Z. Rural residential land transition in the Beijing-Tianjin-Hebei region: Spatial-temporal patterns and policy implications. Land Use Policy 2020, 96, 104700. [Google Scholar] [CrossRef]
  50. Zhang, M.; Tan, S.; Zhang, Y.; He, J.; Ni, Q. Does land transfer promote the development of new-type urbanization? New evidence from urban agglomerations in the middle reaches of the Yangtze River. Ecol. Indic. 2022, 136, 108705. [Google Scholar] [CrossRef]
  51. Zhu, Y.; Zhang, R.; Cui, J. Spatial differentiation and influencing factors in the ecological well-being performance of Urban Agglomerations in the Middle Reaches of the Yangtze River: A hierarchical perspective. Int. J. Environ. Res. Public Health 2022, 19, 12867. [Google Scholar] [CrossRef]
  52. Demirhan, H.; Renwick, Z. Missing value imputation for short to mid-term horizontal solar irradiance data. Appl. Energy 2018, 225, 998–1012. [Google Scholar] [CrossRef]
  53. Mu, L.; Wang, L.; Wang, Y.; Chen, X.; Han, W. Urban Land Use and Land Cover Change Prediction via Self-Adaptive Cellular Based Deep Learning with Multisourced Data. IEEE J. Sel. Top. Appl. Earth Obs. Remote Sens. 2019, 12, 5233–5247. [Google Scholar] [CrossRef]
  54. Liu, Z.; Zhang, L.; Rommel, J.; Feng, S. Do land markets improve land-use efficiency? evidence from Jiangsu, China. Appl. Econ. 2020, 52, 317–330. [Google Scholar] [CrossRef]
  55. Zhu, X.; Zhang, P.; Wei, Y.; Li, Y.; Zhao, H. Measuring the efficiency and driving factors of urban land use based on the DEA method and the PLS-SEM model—A case study of 35 large and medium-sized cities in China. Sustain. Cities Soc. 2019, 50, 101646. [Google Scholar] [CrossRef]
  56. Kuang, B.; Lu, X.; Zhou, M.; Chen, D. Provincial cultivated land use efficiency in China: Empirical analysis based on the SBM-DEA model with carbon emissions considered. Technol. Forecast. Soc. Chang. 2020, 151, 119874. [Google Scholar] [CrossRef]
  57. Yang, X.; Wu, Y.; Dang, H. Urban land use efficiency and coordination in China. Sustainability 2017, 9, 410. [Google Scholar] [CrossRef] [Green Version]
  58. Cheng, P.; Tang, H.; Lin, F.; Kong, X. Bibliometrics of the nexus between food security and carbon emissions: Hotspots and trends. Environ. Sci. Pollut. Res. 2022. [Google Scholar] [CrossRef]
  59. Yuan, J.; Bian, Z.; Yan, Q.; Pan, Y. Spatio-temporal distributions of the land use effciency coupling coordination degree in mining cities of western China. Sustainability 2019, 11, 5288. [Google Scholar] [CrossRef] [Green Version]
  60. Su, Q.; Jiang, X. Evaluate the economic and environmental efficiency of land use from the perspective of decision-makers’ subjective preferences. Ecol. Indic. 2021, 129, 107984. [Google Scholar] [CrossRef]
  61. Qu, Y.; Zong, H.; Su, D.; Ping, Z.; Guan, M. Land use change and its impact on landscape ecological risk in typical areas of the Yellow River Basin in China. Int. J. Environ. Res. Public Health 2021, 18, 11301. [Google Scholar] [CrossRef]
  62. Anderson, T.K. Kernel density estimation and K-means clustering to profile road accident hotspots. Accid. Anal. Prev. 2009, 41, 359–364. [Google Scholar] [CrossRef] [PubMed]
  63. Chen, Z.; Liu, Y.; Feng, W.; Li, Y.; Li, L. Study on spatial tropism distribution of rural settlements in the Loess Hilly and Gully Region based on natural factors and traffic accessibility. J. Rural Stud. 2022, 93, 441–448. [Google Scholar] [CrossRef]
  64. Chu, H.J.; Liau, C.J.; Lin, C.H.; Su, B.S. Integration of fuzzy cluster analysis and kernel density estimation for tracking typhoon trajectories in the Taiwan region. Expert Syst. Appl. 2012, 39, 9451–9457. [Google Scholar] [CrossRef]
  65. Kong, X.; Fu, M.; Zhao, X.; Wang, J.; Jiang, P. Ecological effects of land-use change on two sides of the Hu Huanyong Line in China. Land Use Policy 2022, 113, 105895. [Google Scholar] [CrossRef]
  66. Tan, M.J.; Guan, C.H. Are people happier in locations of high property value? Spatial temporal analytics of activity frequency, public sentiment and housing price using twitter data. Appl. Geogr. 2021, 132, 102474. [Google Scholar] [CrossRef]
  67. Wu, Y.; Tang, H.; Jiang, P.; Chen, J. What is the impact of the establishment of natural reserves on rural residential land? An empirical study from Hunan Province, China. Front. Environ. Sci. 2022, 10, 706. [Google Scholar] [CrossRef]
  68. Tone, K. A slacks-based measure of super-efficiency in data envelopment analysis. Eur. J. Oper. Res. 2002, 143, 32–41. [Google Scholar] [CrossRef] [Green Version]
  69. Tang, K.; Qiu, Y.; Zhou, D. Does command-and-control regulation promote green innovation performance? Evidence from China’s industrial enterprises. Sci. Total Environ. 2020, 712, 136362. [Google Scholar] [CrossRef]
  70. Tone, K.; Toloo, M.; Izadikhah, M. A modified slacks-based measure of efficiency in data envelopment analysis. Eur. J. Oper. Res. 2020, 287, 560–571. [Google Scholar] [CrossRef]
  71. Fan, J.; Zhou, L. Three-dimensional intergovernmental competition and urban sprawl: Evidence from Chinese prefectural-level cities. Land Use Policy 2019, 87, 104035. [Google Scholar] [CrossRef]
  72. Cheng, P.; Dong, Y.; Wang, Z.; Tang, H.; Jiang, P.; Liu, Y. What are the impacts of livelihood capital and distance effect on farmers’ willingness to pay for coastal zone ecological protection? Empirical analysis from the Beibu Gulf of China. Ecol. Indic. 2022, 140, 109053. [Google Scholar] [CrossRef]
  73. Salmerón Gómez, R.; Rodríguez Sánchez, A.; García, C.G.; García Pérez, J. The VIF and MSE in raise regression. Mathematics 2020, 8, 605. [Google Scholar] [CrossRef]
  74. Cheng, P.; Tang, H.; Zhu, S.; Jiang, P.; Wang, J.; Kong, X.; Liu, K. Distance to river basin affects residents’ willingness to pay for ecosystem services: Evidence from the Xijiang river basin in China. Ecol. Indic. 2021, 126, 107691. [Google Scholar] [CrossRef]
  75. Hangartner, D.; Kopp, D.; Siegenthaler, M. Monitoring hiring discrimination through online recruitment platforms. Nature 2021, 589, 572–576. [Google Scholar] [CrossRef]
  76. Zhou, K.; Yang, J.; Yang, T.; Ding, T. Spatial and temporal evolution characteristics and spillover effects of China’s regional carbon emissions. J. Environ. Manag. 2023, 325, 116423. [Google Scholar] [CrossRef]
  77. Shao, S.; Tian, Z.; Fan, M. Do the rich have stronger willingness to pay for environmental protection? New evidence from a survey in China. World Dev. 2018, 105, 83–94. [Google Scholar] [CrossRef]
  78. Xiang, H.; Yang, Q.-Y.; Su, K.; Zhang, Z.-X. Spatiotemporal dynamics and obstacles of the multi-functionality of land use in Xiangxi, China. Appl. Sci. 2019, 9, 3649. [Google Scholar] [CrossRef] [Green Version]
  79. Liu, X.; Xin, L. Assessment of the efficiency of cultivated land occupied by urban and rural construction land in China from 1990 to 2020. Land 2022, 11, 941. [Google Scholar] [CrossRef]
Figure 1. Theoretical framework.
Land 11 02263 g001
Figure 2. Study area.
Land 11 02263 g002
Figure 3. Transfer in and transfer out of RRL in 42 cities in the MRYR during 2000–2020.
Land 11 02263 g003
Figure 4. Distribution of RRL area change in 42 cities in the MRYR. (ac) Change in the RRL area during 2000–2010, 2010–2020, and 2000–2020, respectively. (df) Change dynamics of the RRL area during 2000–2010, 2010–2020, and 2000–2020, respectively.
Land 11 02263 g004
Figure 5. The cold-spot and hot-spot distribution characteristics in the current situation and change dynamics of CLUE in the MRYR. (ac) Cold-spot and hot-spot areas of the current situation of CLUE in 42 cities in the MRYR in 2000, 2010, and 2020, respectively. (df) Cold-spot and hot-spot areas of CLUE change dynamics in 42 cities in the MRYR during 2000–2010, 2010–2020, and 2000–2020, respectively.
Land 11 02263 g005
Table 1. Evaluation index system of CLUE.
VariablesIndicatorsIndicator DescriptionUnit
InputLabor force (LF)Number of agricultural employees104 people
Cultivated land (CL)Total area of cultivated land104 hm2
Agricultural machinery (AM)Total power of agricultural machinery104 kW
Irrigation (IR)Effective irrigation area104 hm2
Pesticide (PE)Pesticide usage104 t
Fertilizer (FE)Agricultural chemical fertilizer usage104 t
Agricultural plastic film (APF)Agricultural plastic film usage104 t
Expected outputSocial benefits (SB)Total grain output104 t
Economic benefits (ENB)Gross value of agricultural output108 RMB
Unexpected outputEcological benefits (ELB)Total carbon emissions from cultivated land use106 t
Table 2. Impact indicators of RRL use change on CLUE.
VariablesIndicatorsIndicator DescriptionUnit
Dependent variableCultivated land use efficiency (CLUE)Actual utilization efficiency of cultivated land%
Independent variableRural residential land (RRL)RRL area104 hm2
Mediating variablesPer capita cultivated land area (PCLA)Total area of cultivated land/total permanent population of the citym2
Rural permanent population (RPP)104 people
The area of cultivated land occupied by rural residential land (CLRRL)104 hm2
Control variablesGross domestic product (GDP)Regional GDP104 RMB
Total regional population (TRP)Total permanent population of the city104 people
Per capita disposable income of farmers (PDIF)104 RMB
Urban construction land area (UCLA)104 hm2
Proportion of the primary industry (PPI)Proportion of output value of the primary industry in the total output value of primary, secondary, and tertiary industries%
Proportion of nongrain crop sown area (PNG)Nongrain crop sown area/total crop sown area%
Table 3. Basic characteristics of research data.
VariablesUnit200020102020VariablesUnit2000–20102010–2020
M.S.D.M.S.D.M.S.D.M.S.D.M.S.D.
LF104 people278.5324.86260.0425.04193.618.96RRL104 hm20.620.070.670.08
CL104 hm241.973.6440.963.5640.553.54PCLAm2145.0111.98751.7924.89
AM104 kW107.5410.26284.4325.79307.0329.06RPP104 people103.058.47250.5113.45
IR104 hm216.191.4516.121.5420.131.91CLRRL104 hm20.520.030.490.02
PE104 t0.610.060.880.090.550.06GDP104 RMB757.15129.631665.89281.86
FE104 t25.013.7117.341.8215.191.71TRP104 people97.966.9997.579.84
APF104 t0.270.020.430.040.440.04PDIF104 RMB0.360.021.190.04
SB104 t163.1914.51194.5118.39188.4718.86UCLA104 hm20.040.010.060.02
ENB108 RMB59.726.18137.8215.55205.0819.19PPI%0.140.010.110.01
ELB106 t6.360.9317.893.0813.723.07PNG%0.160.010.240.01
Notes: M. represents the mean, and S.D. represents the standard deviation.
Table 4. Statistics on the RRL area change in 42 cities in the MRYR.
ProvincesCities2000–20102010–20202000–2020
Area Change (hm2)Change Dynamics (%)Area Change (hm2)Change Dynamics (%)Area Change (hm2)Change Dynamics (%)
JiangxiNanchang843.840.50924.930.531768.770.53
Jingdezhen369.090.51−133.74−0.18235.350.16
Pingxiang2327.224.38351.180.462678.42.52
Jiujiang2574.991.19−1574.64−0.651000.350.23
Xinyu2583.992.02−1796.85−1.17787.140.31
Yingtan842.401.53−501.21−0.79341.190.31
Ganzhou2751.840.99−467.19−0.152284.650.41
Ji’an2298.060.6124.480.012322.540.31
Yichun8431.382.32−2801.34−0.635630.040.78
Fuzhou1301.850.8992.430.061394.280.47
Shangrao1884.420.73−259.38−0.091625.040.31
HubeiWuhan−346.32−0.131341.810.52995.490.19
Huangshi499.140.32−266.40−0.17232.740.08
Shiyan−187.74−0.75559.622.41371.880.74
Yichang720.090.34340.560.161060.650.25
Xiangyang7747.202.23−4973.04−1.172774.160.40
Ezhou−264.60−0.25613.710.58349.110.16
Jingmen1447.560.55−264.42−0.091183.140.22
Xiaogan119.880.04678.150.20798.030.12
Jingzhou1530.360.27256.320.041786.680.15
Huanggang25.290.00715.860.14741.150.07
Xianning−201.06−0.20309.600.31108.540.05
Suizhou293.130.9013.320.04306.450.47
Enshi534.966.52−227.34−1.68307.621.88
Xiantao51.300.02254.880.10306.180.06
Qianjiang295.740.16−238.50−0.1357.240.02
Tianmen−756.00−0.27898.200.33142.20.03
Shennongjia−4.68−0.8435.646.9830.962.78
HunanChangsha−39.15−0.0387.660.0748.510.02
Zhuzhou−548.73−0.45706.500.60157.770.06
Xiangtan−131.85−0.2445.450.08−86.4−0.08
Hengyang124.380.09385.290.29509.670.19
Shaoyang439.740.38143.370.12583.110.25
Yueyang574.290.35562.860.331137.150.35
Changde−707.76−0.271204.380.47496.620.09
Zhangjiajie−116.82−0.4438.700.15−78.12−0.15
Yiyang−429.12−0.35270.270.23−158.85−0.07
Chenzhou−61.74−0.04243.360.17181.620.06
Yongzhou−62.64−0.0410.800.01−51.84−0.02
Huaihua48.960.05114.210.13163.170.09
Loudi115.830.15162.900.20278.730.17
Xiangxi−4375.44−4.12−39.33−0.06−4414.77−2.08
Table 5. Analysis of the direct impact of RRL change on CLUE.
Variables2000–20102010–20202000–2020
C.S.D.C.S.D.C.S.D.
Constant0.939621 ***0.0470040.520387 ***0.0565170.579584 ***0.045357
RRL−0.127247 **0.053144−0.0099090.060372−0.157018 **0.057842
GDP0.1085730.1053580.513858 ***0.1410181.135845 ***0.114932
TRP−0.389996 ***0.0587360.0413160.088263−0.451061 ***0.073171
PDIF0.155043 **0.062931−0.509704 ***0.082945−0.316739 ***0.064036
UCLA0.228848 **0.092503−0.283182 **0.109524−0.579463 ***0.083946
PPI−0.301542 ***0.0430410.153766 ***0.042263−0.181923 ***0.034911
PNG0.0395270.038681−0.331165 ***0.0702380.489428 ***0.042902
F13.218.4045.89
R-squared0.21990.15210.4948
p value0.0000.0000.000
Notes: (1) C. represents the coefficient, and S.D. represents the standard deviation. (2) *** and ** represent p < 1% and p < 5%, respectively.
Table 6. Robustness test.
VariablesRemoved Provincial Capital City DataOrdered Logit Model
2000–20102010–20202000–20202010–20202010–20202000–2020
C.S.D.C.S.D.C.S.D.C.S.D.C.S.D.C.S.D.
RRL−0.13731 **0.05501−0.004060.06531−0.14824 **0.06111−1.24713 **0.70001−0.198210.69258−1.87082 **0.74112
GDP−0.179320.146410.41826 **0.163731.42148 ***0.128833.53442 **1.394169.10687 ***1.5534914.0963 ***1.72662
TRP−0.25952 ***0.06843−0.061560.10386−0.45061 ***0.08996−6.99636 ***082588−0.570160.93038−4.31402 ***1.01505
PDIF0.29945 ***0.06738−0.61751 ***0.09836−0.31604 ***0.073340.932390.79891−6.50564 ***0.84933−5.40867 ***0.99855
UCLA1.11422 ***0.20143−0.520240.48476−2.09671 ***0.309871.073551.15748−5.39479 ***1.05603−7.73185 ***1.17954
PPI−0.41844 **0.047970.15233 ***0.04469−0.11255 **0.04021−1.44119 **0.660172.71976 ***0.43585−2.09945 ***0.53446
PNG0.09256 ***0.0403−0.37452 ***0.075230.52978 ***0.04376−1.11937 **0.51745−1.585710.982156.69406 ***0.73265
p-value0.0000.0000.0000.0000.0000.000
Notes: (1) C. represents the coefficient, and S.D. represents the standard deviation. (2) *** and ** represent p < 1% and p < 5%, respectively.
Table 7. Regression results of mediating variables.
Variables2000–20102010–20202000–2020
PCLARPPCLRRLPCLARPPCLRRLPCLARPPCLRRL
Constant0.911686 ***0.0477310.206975 ***0.546806 ***0.577096 ***0.788445 ***0.601736 ***0.379316 ***0.187229 ***
RRL−0.174552 ***0.388241 ***0.832353 ***0.000146−0.042281−0.118101 **−0.0086670.0265430.842947 ***
GDP0.158959−0.870447 ***0.453512 ***0.677937 ***−0.965634 ***0.563437 ***0.627969 ***−0.372766 **0.793678 ***
TRP−0.998076 ***0.450798 ***−0.444819 ***−0.625535 ***−0.230604 **0.001496−0.789471 ***−0.516846 ***−0.115712
PDIF−0.256741 ***0.163413 **−0.077721−0.0369810.756335 ***−0.247157 ***0.0373610.236381 **−0.291865 ***
UCLA0.1056470.338092 **0.148308−0.253552 ***0.994001 ***−0.128424−0.0458910.611912 ***−0.310729 **
PPI0.157919 ***0.252383 ***0.0635530.0282850.070417−0.335185 ***−0.130632 ***0.404827 ***−0.138858 ***
PNG−0.053527−0.093955 *−0.277488 ***0.238443 ***0.033784−0.555086 ***0.201429 ***−0.179173 ***−0.538831 ***
F101.9928.7052.5535.6919.2147.1138.4359.1178.75
R-squared0.68520.37990.52860.43230.29080.50130.45060.55780.6270
p value0.0000.0000.0000.0000.0000.0000.0000.0000.000
Notes: ***, **, and * represent p < 1%, p < 5%, and p < 10%, respectively.
Table 8. Regression results of CLUE (including mediating variables).
Variables2000–20102010–20202000–2020
MNL-1MNL-2MNL-3MNL-1MNL-2MNL-3MNL-1MNL-2MNL-3
Constant1.223971 ***0.928423 ***0.978189 ***0.959923 ***0.545352 ***0.692641 ***0.568219 ***0.579098 ***0.573263 ***
RRL−0.072806−0.036162−0.282348 ***−0.010027−0.008081−0.015892−0.157182 **−0.156984 **−0.128561 *
PCLA−0.311894 *** −0.803823 *** 0.018887
RPP 0.234611 *** −0.043259 0.001282
CLRRL −0.186340 *** −0.218471 *** 0.033759 **
GDP0.1581520.312789 **0.193081 *1.058801 ***0.472085 **0.636953 ***1.123984 ***1.136323 ***1.109051 ***
TRP−0.701291 ***−0.495758 ***−0.472884 ***−0.461503 ***0.0313410.041643−0.436149 ***−0.450397 ***−0.447153 ***
PDIF0.0749670.116705 *0.140561 **−0.539431 ***−0.476986 ***−0.563701 ***−0.317444 ***−0.317042 ***−0.306886 ***
UCLA0.261799 ***0.149528 *0.256484 **−0.486993 ***−0.240182 **−0.311239 **−0.578596 ***−0.580247 ***−0.568973 ***
PPI−0.252288 ***−0.360754 ***−0.289699 ***0.176503 ***0.156812 ***0.080538 *−0.179456 ***−0.182442 ***−0.177235 ***
PNG0.0228320.061571 *−0.012179−0.139499 **−0.329704 ***−0.452435 ***0.485623 ***0.489658 ***0.507619 ***
F17.3016.4214.6917.967.449.0440.0540.0440.18
R-squared0.29740.28660.26440.30530.15410.18120.49490.49480.4957
p value0.0000.0000.0000.0000.0000.0000.0000.0000.000
Notes: ***, **, and * represent p < 1%, p < 5%, and p < 10%, respectively.
Table 9. Bootstrap mediating effect test results.
Mediating VariablesMediating EffectS.D.Lower 95% Confidence IntervalUpper 95% Confidence IntervalTest Results
2000–2010RRL → PCLA → CLUE0.054441 ***0.0124350.0300680.078815Establish
RRL → RPP → CLUE0.091085 **0.0332160.0259820.156188Establish
RRL → CLRRL → CLUE−0.155101 ***0.037825−0.229236−0.080964Establish
2010–2020RRL → PCLA → CLUE−0.0001170.020922−0.0411240.040889Not Established
RRL → RPP → CLUE0.0018290.008629−0.0150840.018743Not Established
RRL → CLRRL → CLUE0.025801 **0.0095440.0070950.044507Establish
2000–2020RRL → PCLA → CLUE−0.0001630.005893−0.0117140.011387Not Established
RRL → RPP → CLUE0.0000340.003339−0.0065110.006579Not Established
RRL → CLRRL → CLUE0.028457 **0.0392550.0484810.105396Establish
Notes: *** and ** represent p < 1% and p < 5%, respectively.
Publisher’s Note: MDPI stays neutral with regard to jurisdictional claims in published maps and institutional affiliations.

