
The Coupling Coordination between the Competitiveness Level and Land Use Efficiency of Green Food Industry in China

Abstract
:1. Introduction
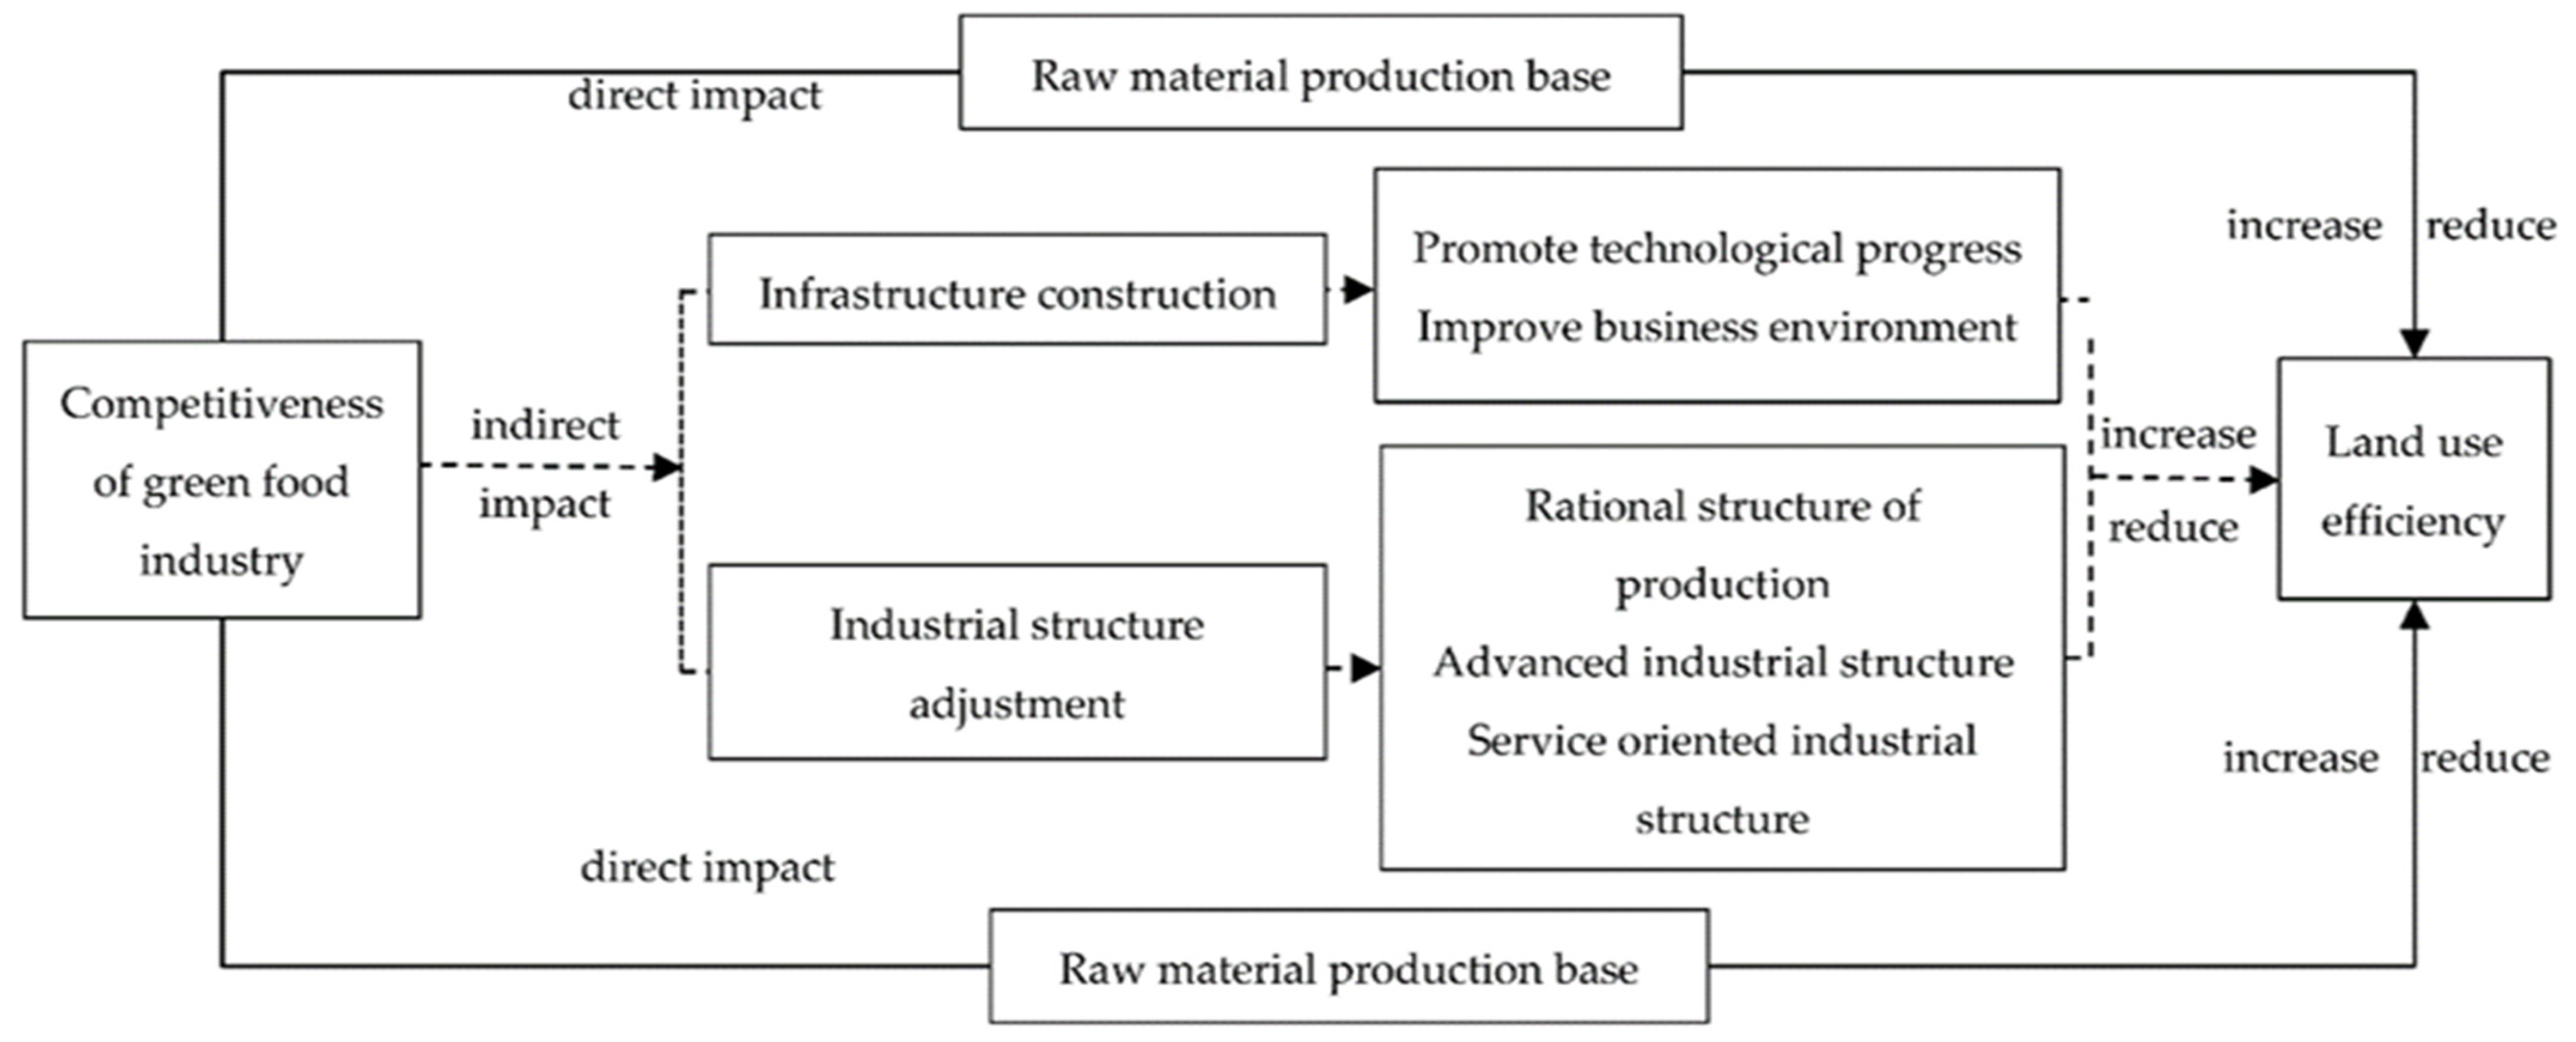
2. Mechanism of Action
2.1. Direct Impact
2.2. Indirect Impact
3. Data and Methods
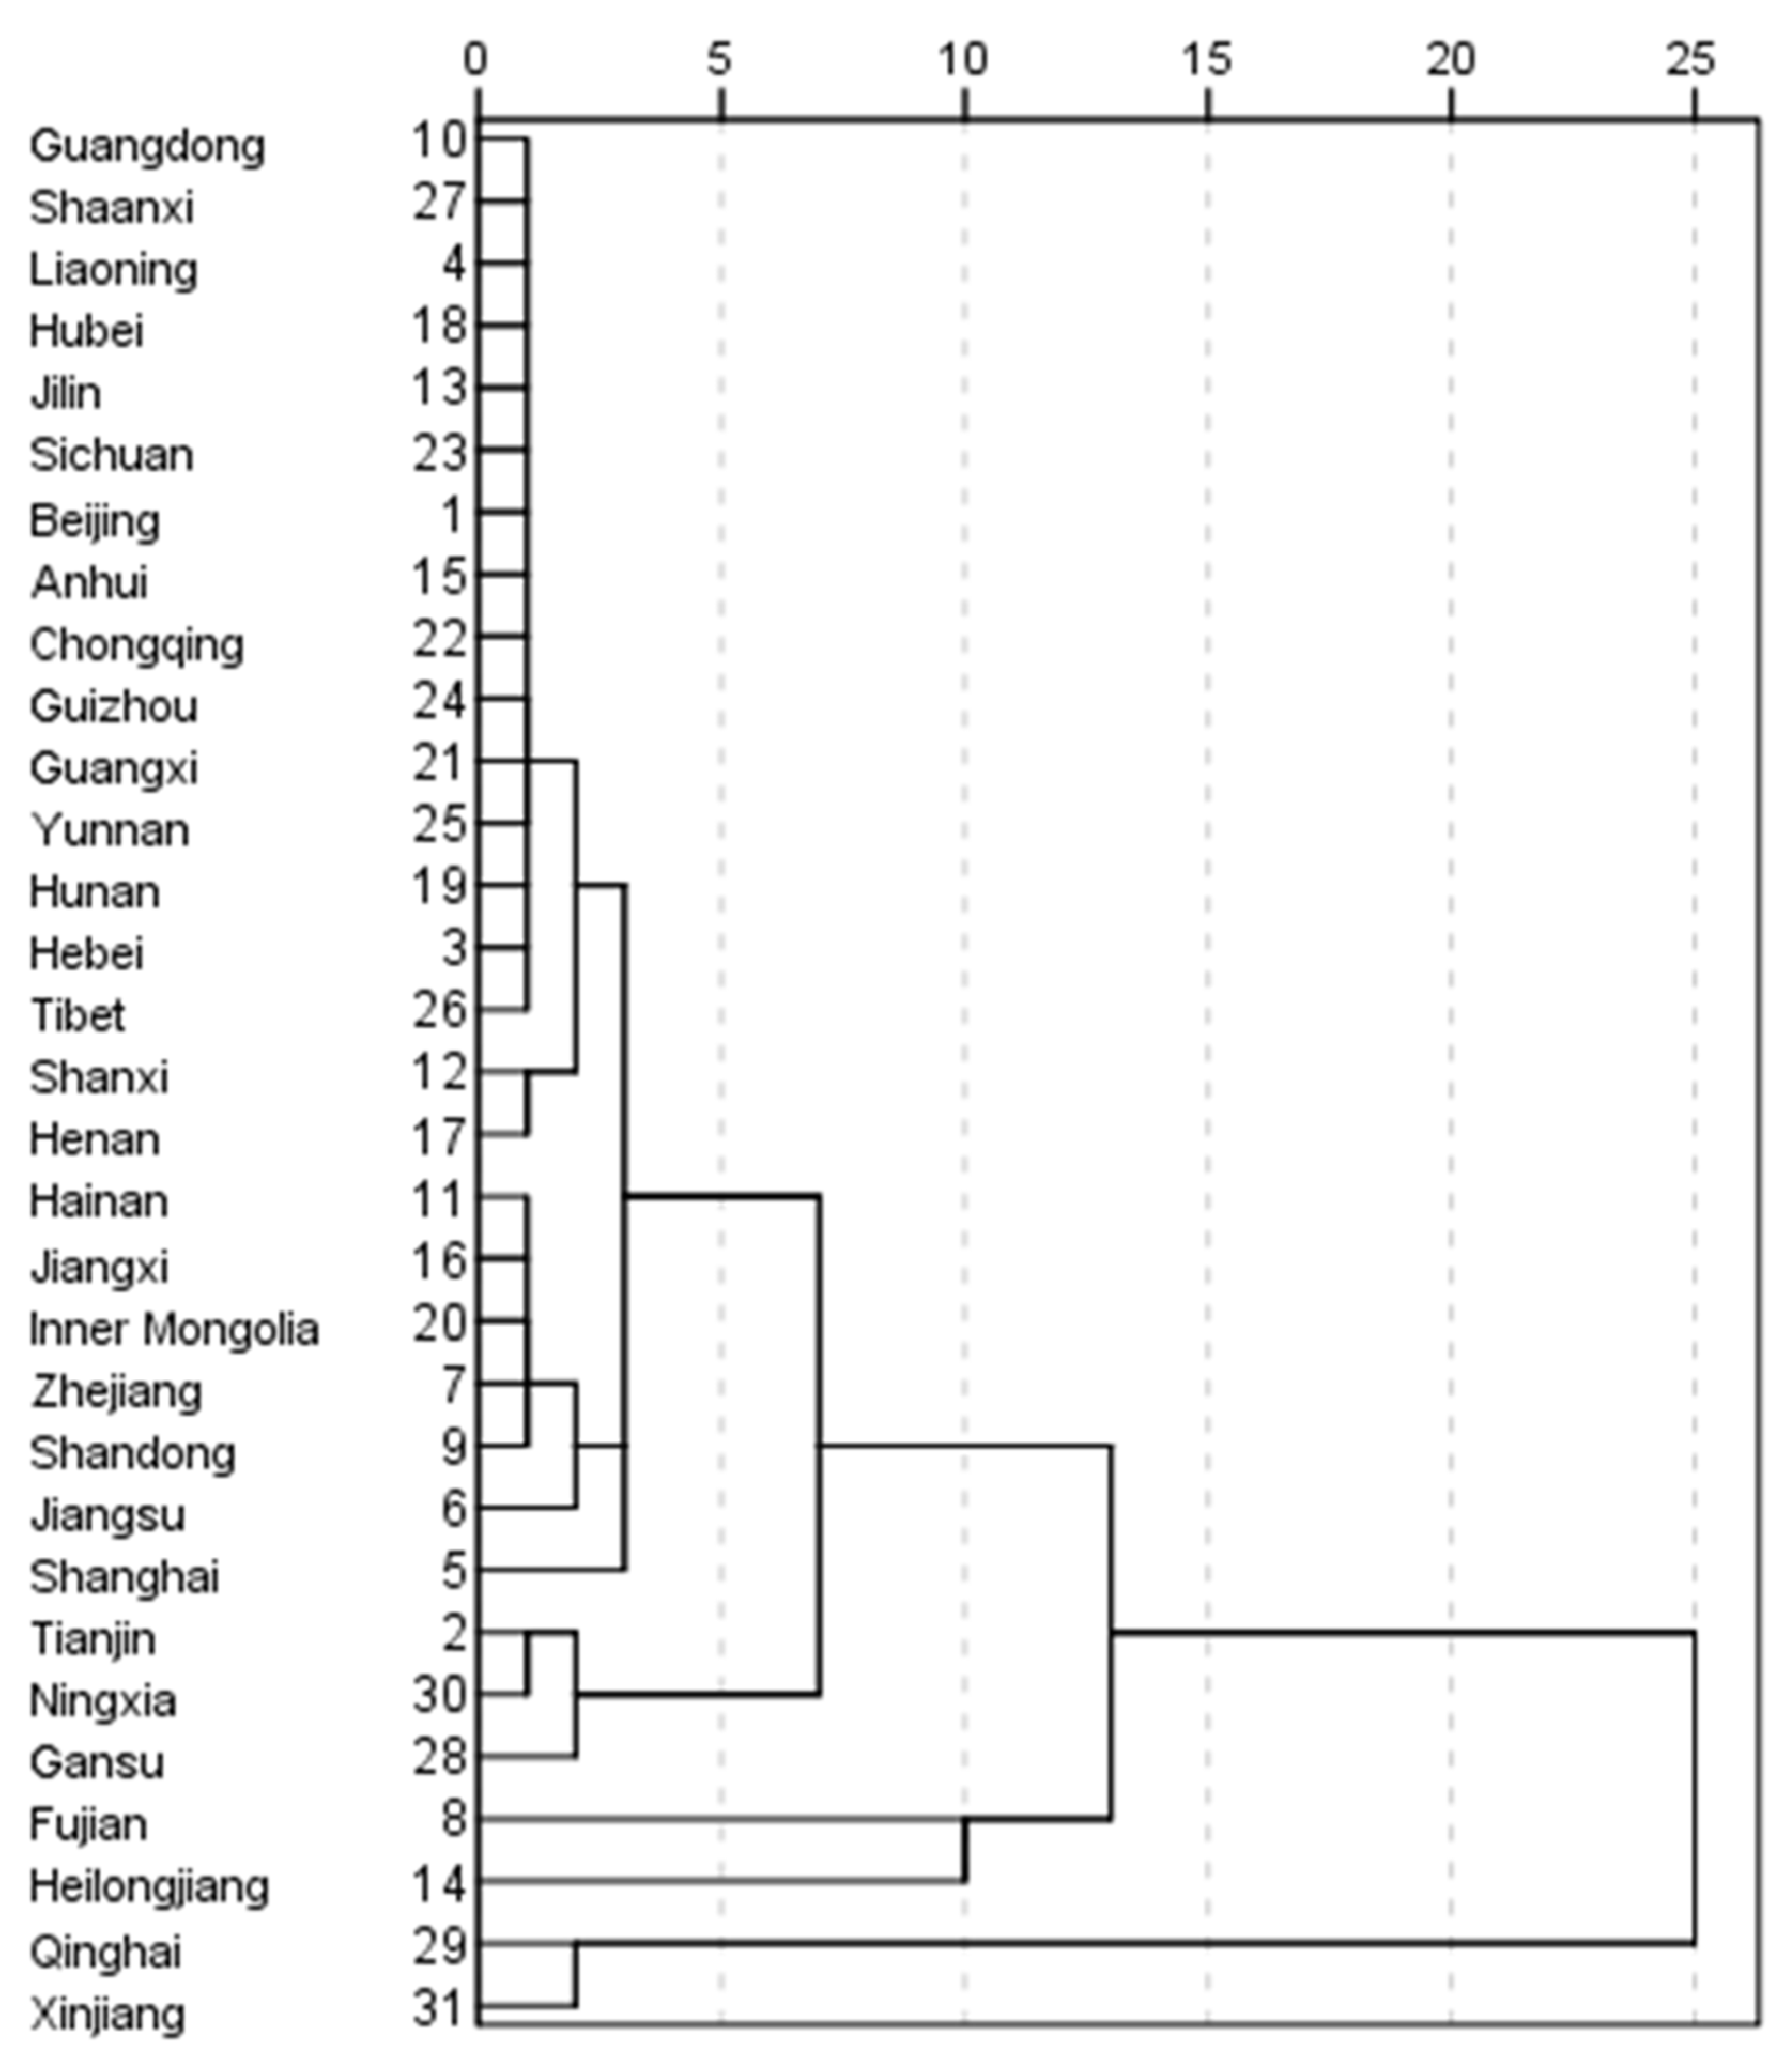
3.1. Study Area
3.2. Indicator System Construction
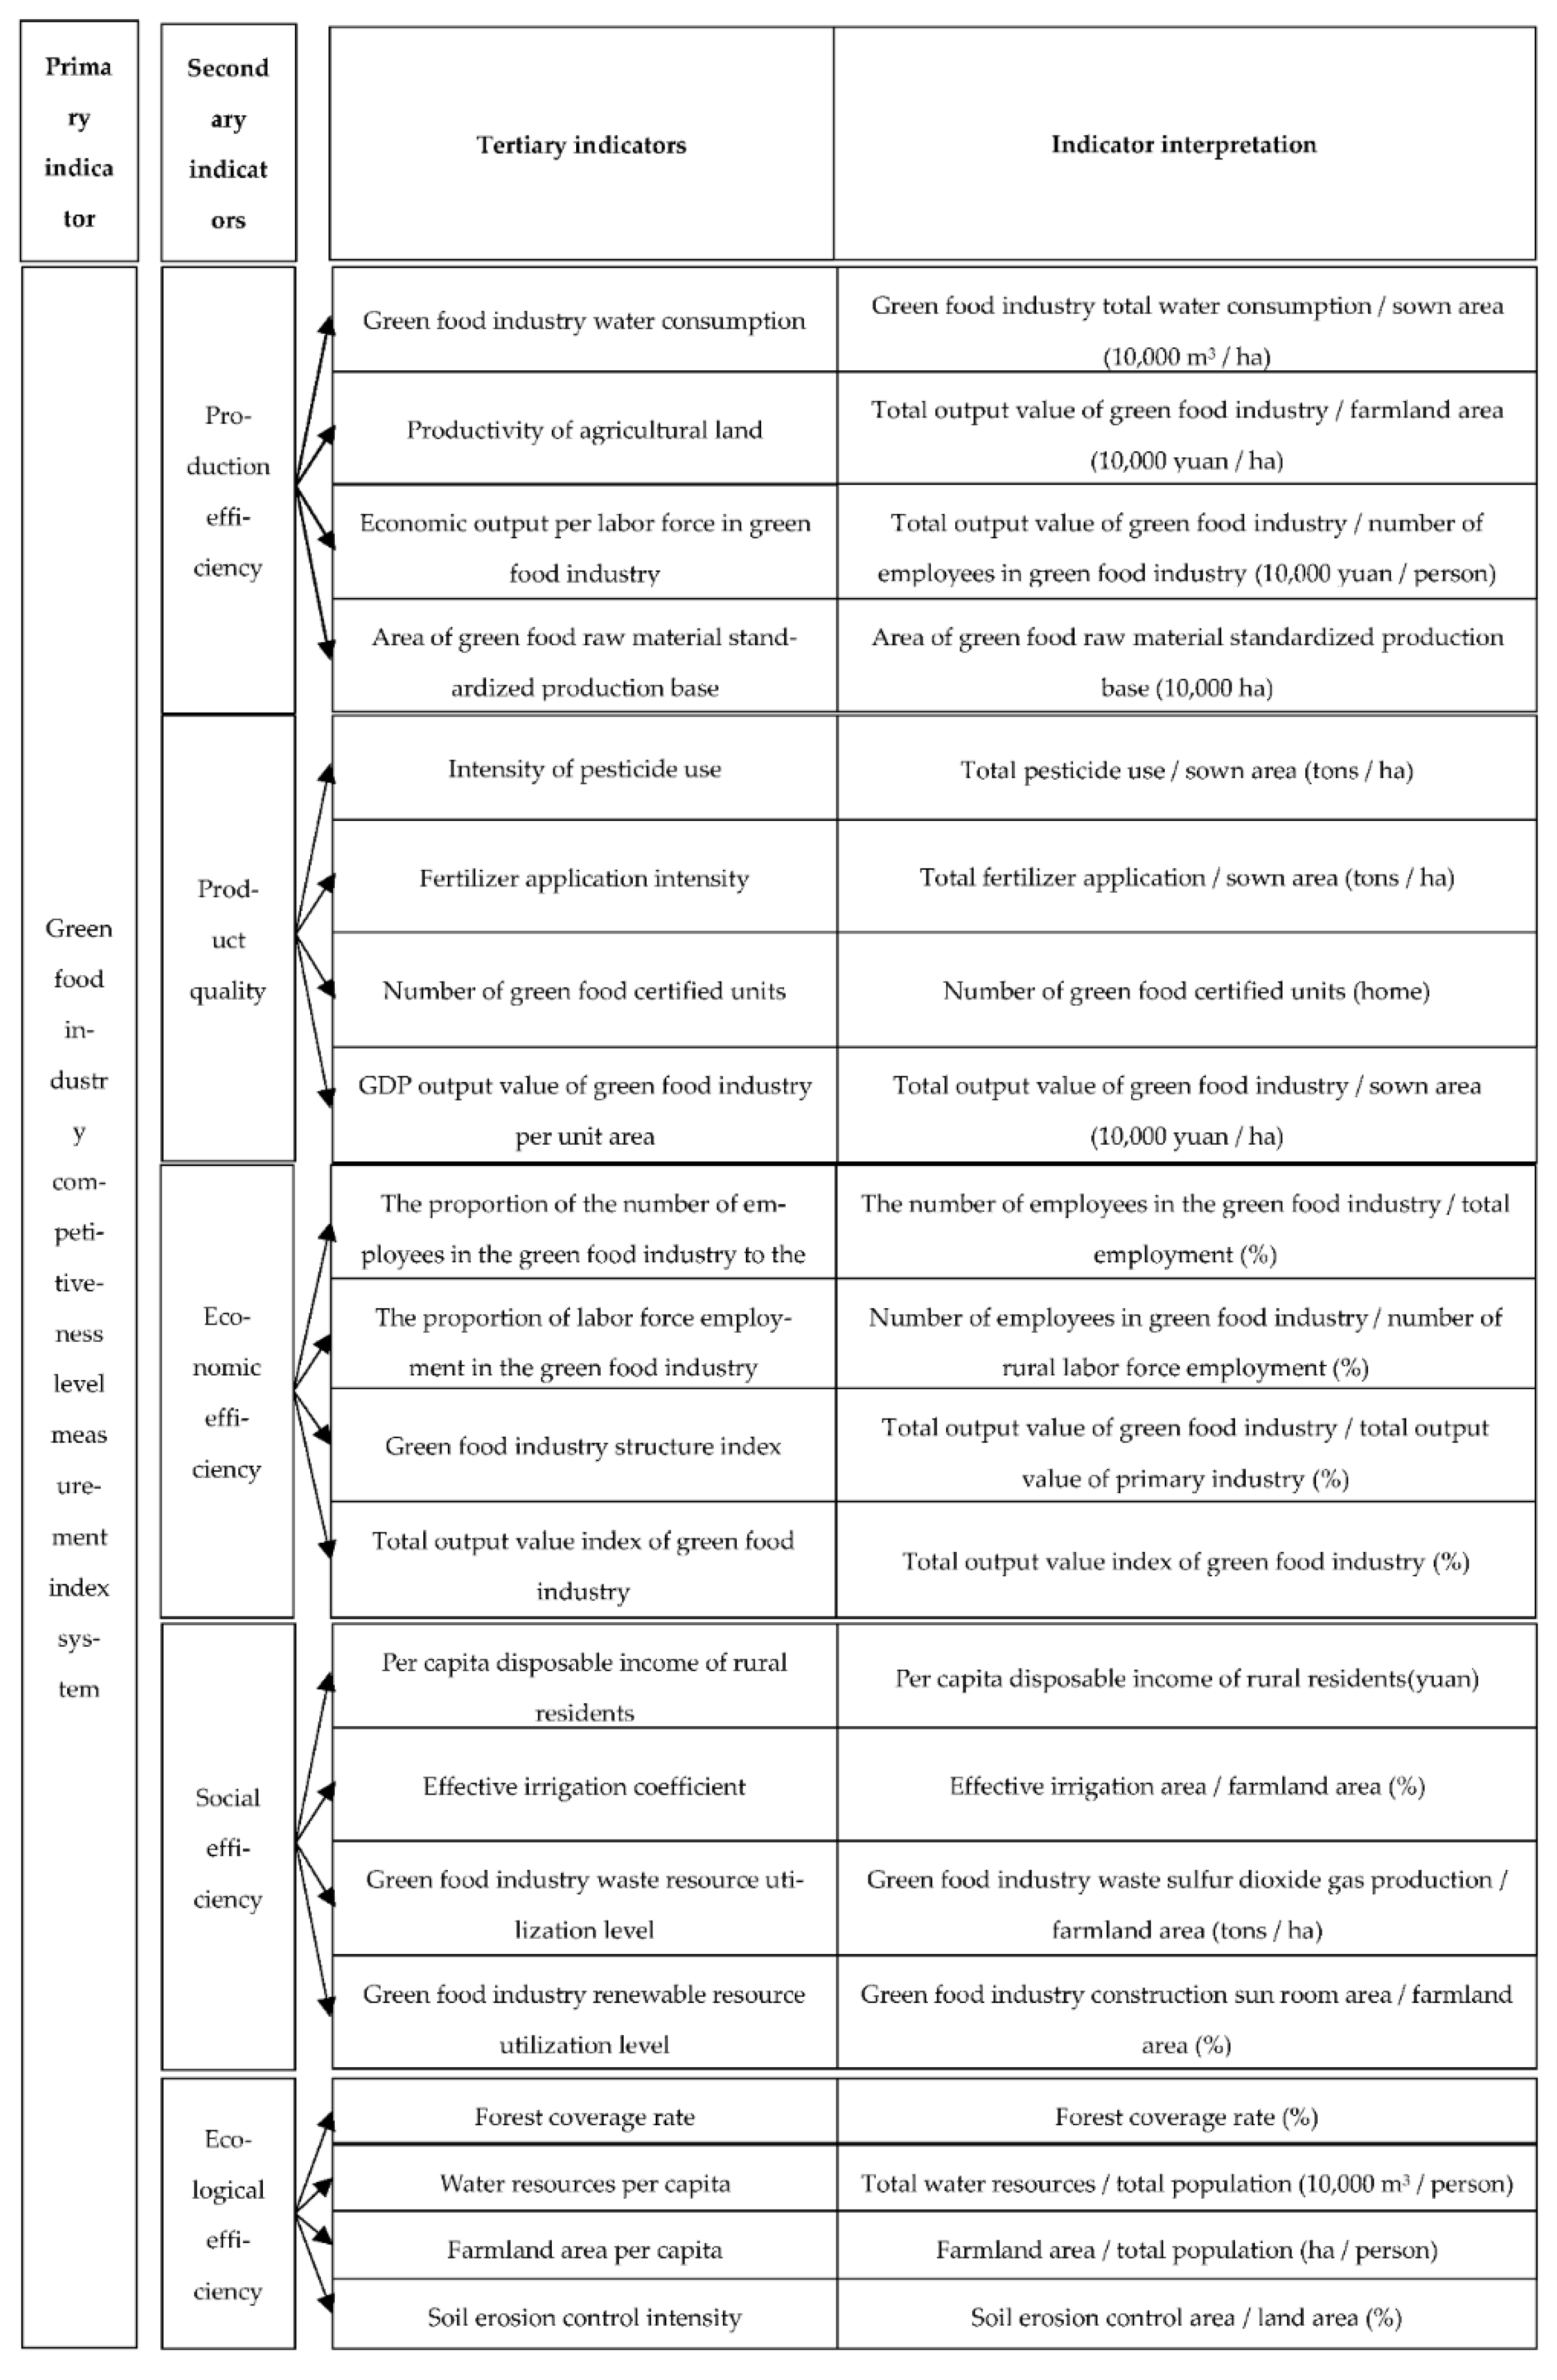
3.2.1. Green Food Industry Competitiveness Level Measurement Index System
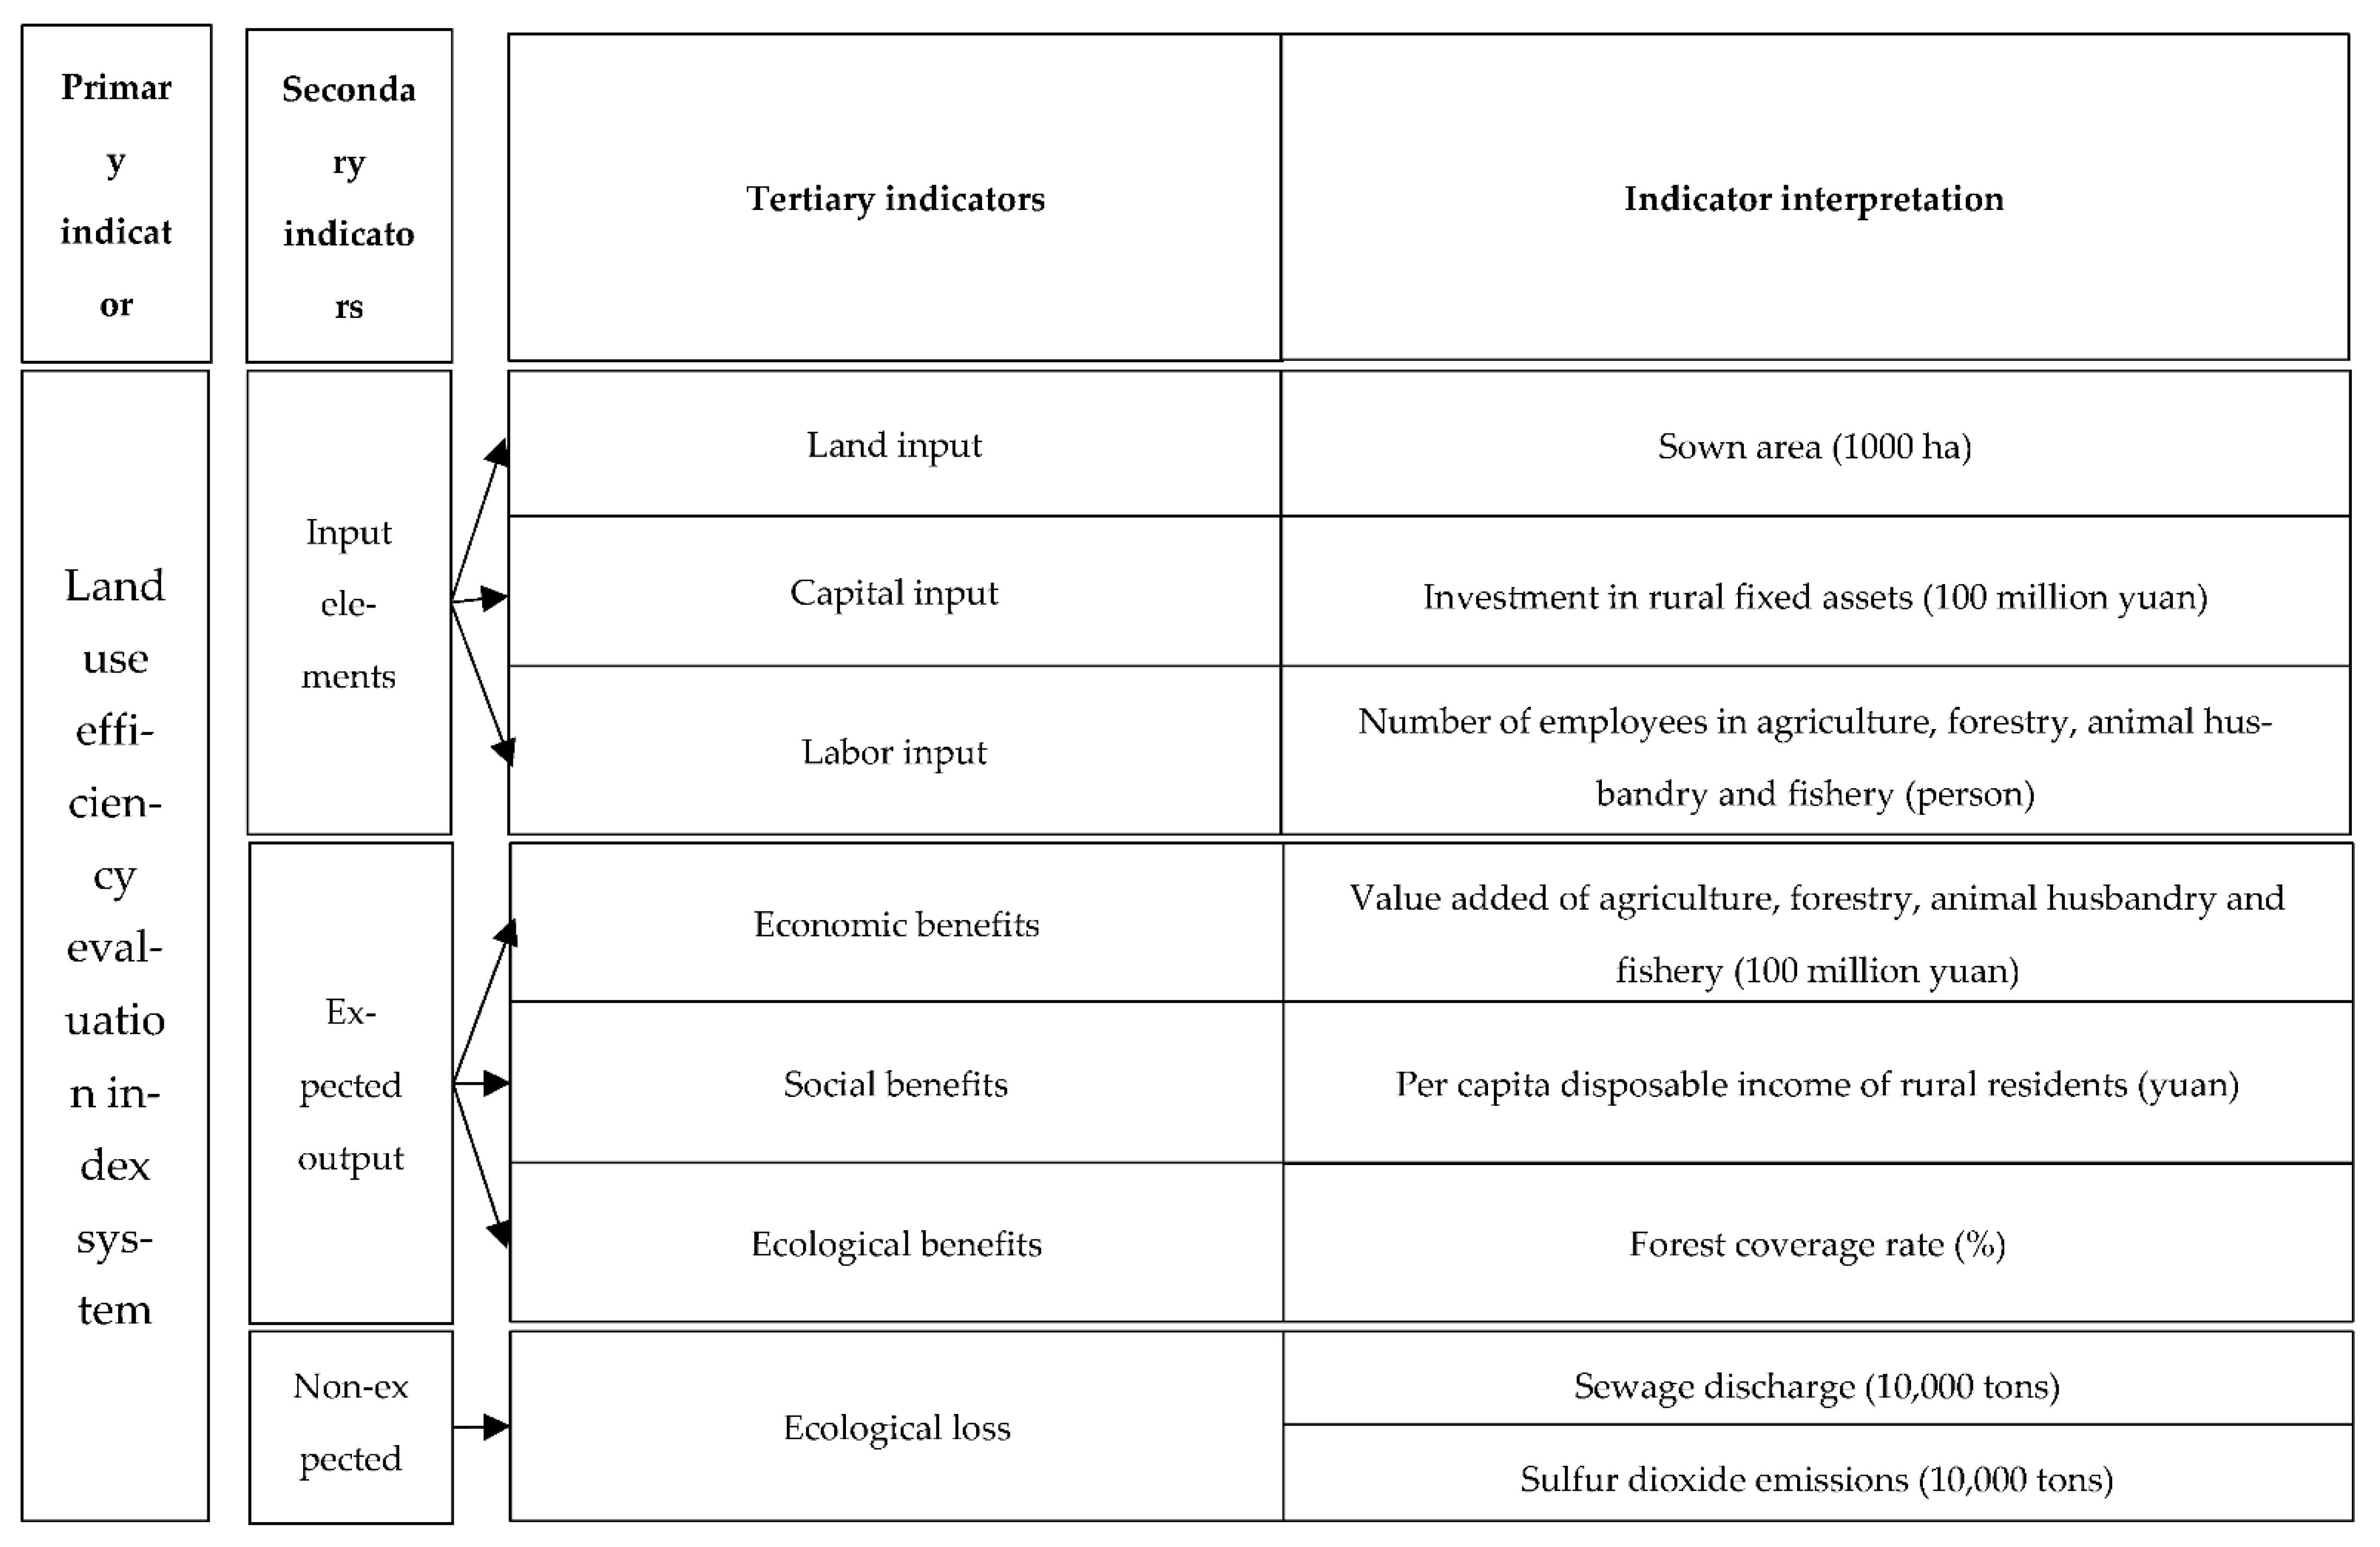
3.2.2. Land Use Efficiency Evaluation Index System
3.3. Data Sources
3.4. Methods
3.4.1. Entropy Method
3.4.2. VIKOR Method
3.4.3. Super-Efficient SBM Model
3.4.4. Coupling Coordination Model
4. Empirical Analysis
4.1. Competitiveness Level of Green Food Industry by Provinces and Cities in China
4.2. Land Use Efficiency of Green Food Industry by Provinces and Cities in China
4.3. Coupling Coordination between the Competitiveness Level and Land Use Efficiency of Green Food Industry by Provinces and Cities in China
4.3.1. Temporal Characteristics
- (1)
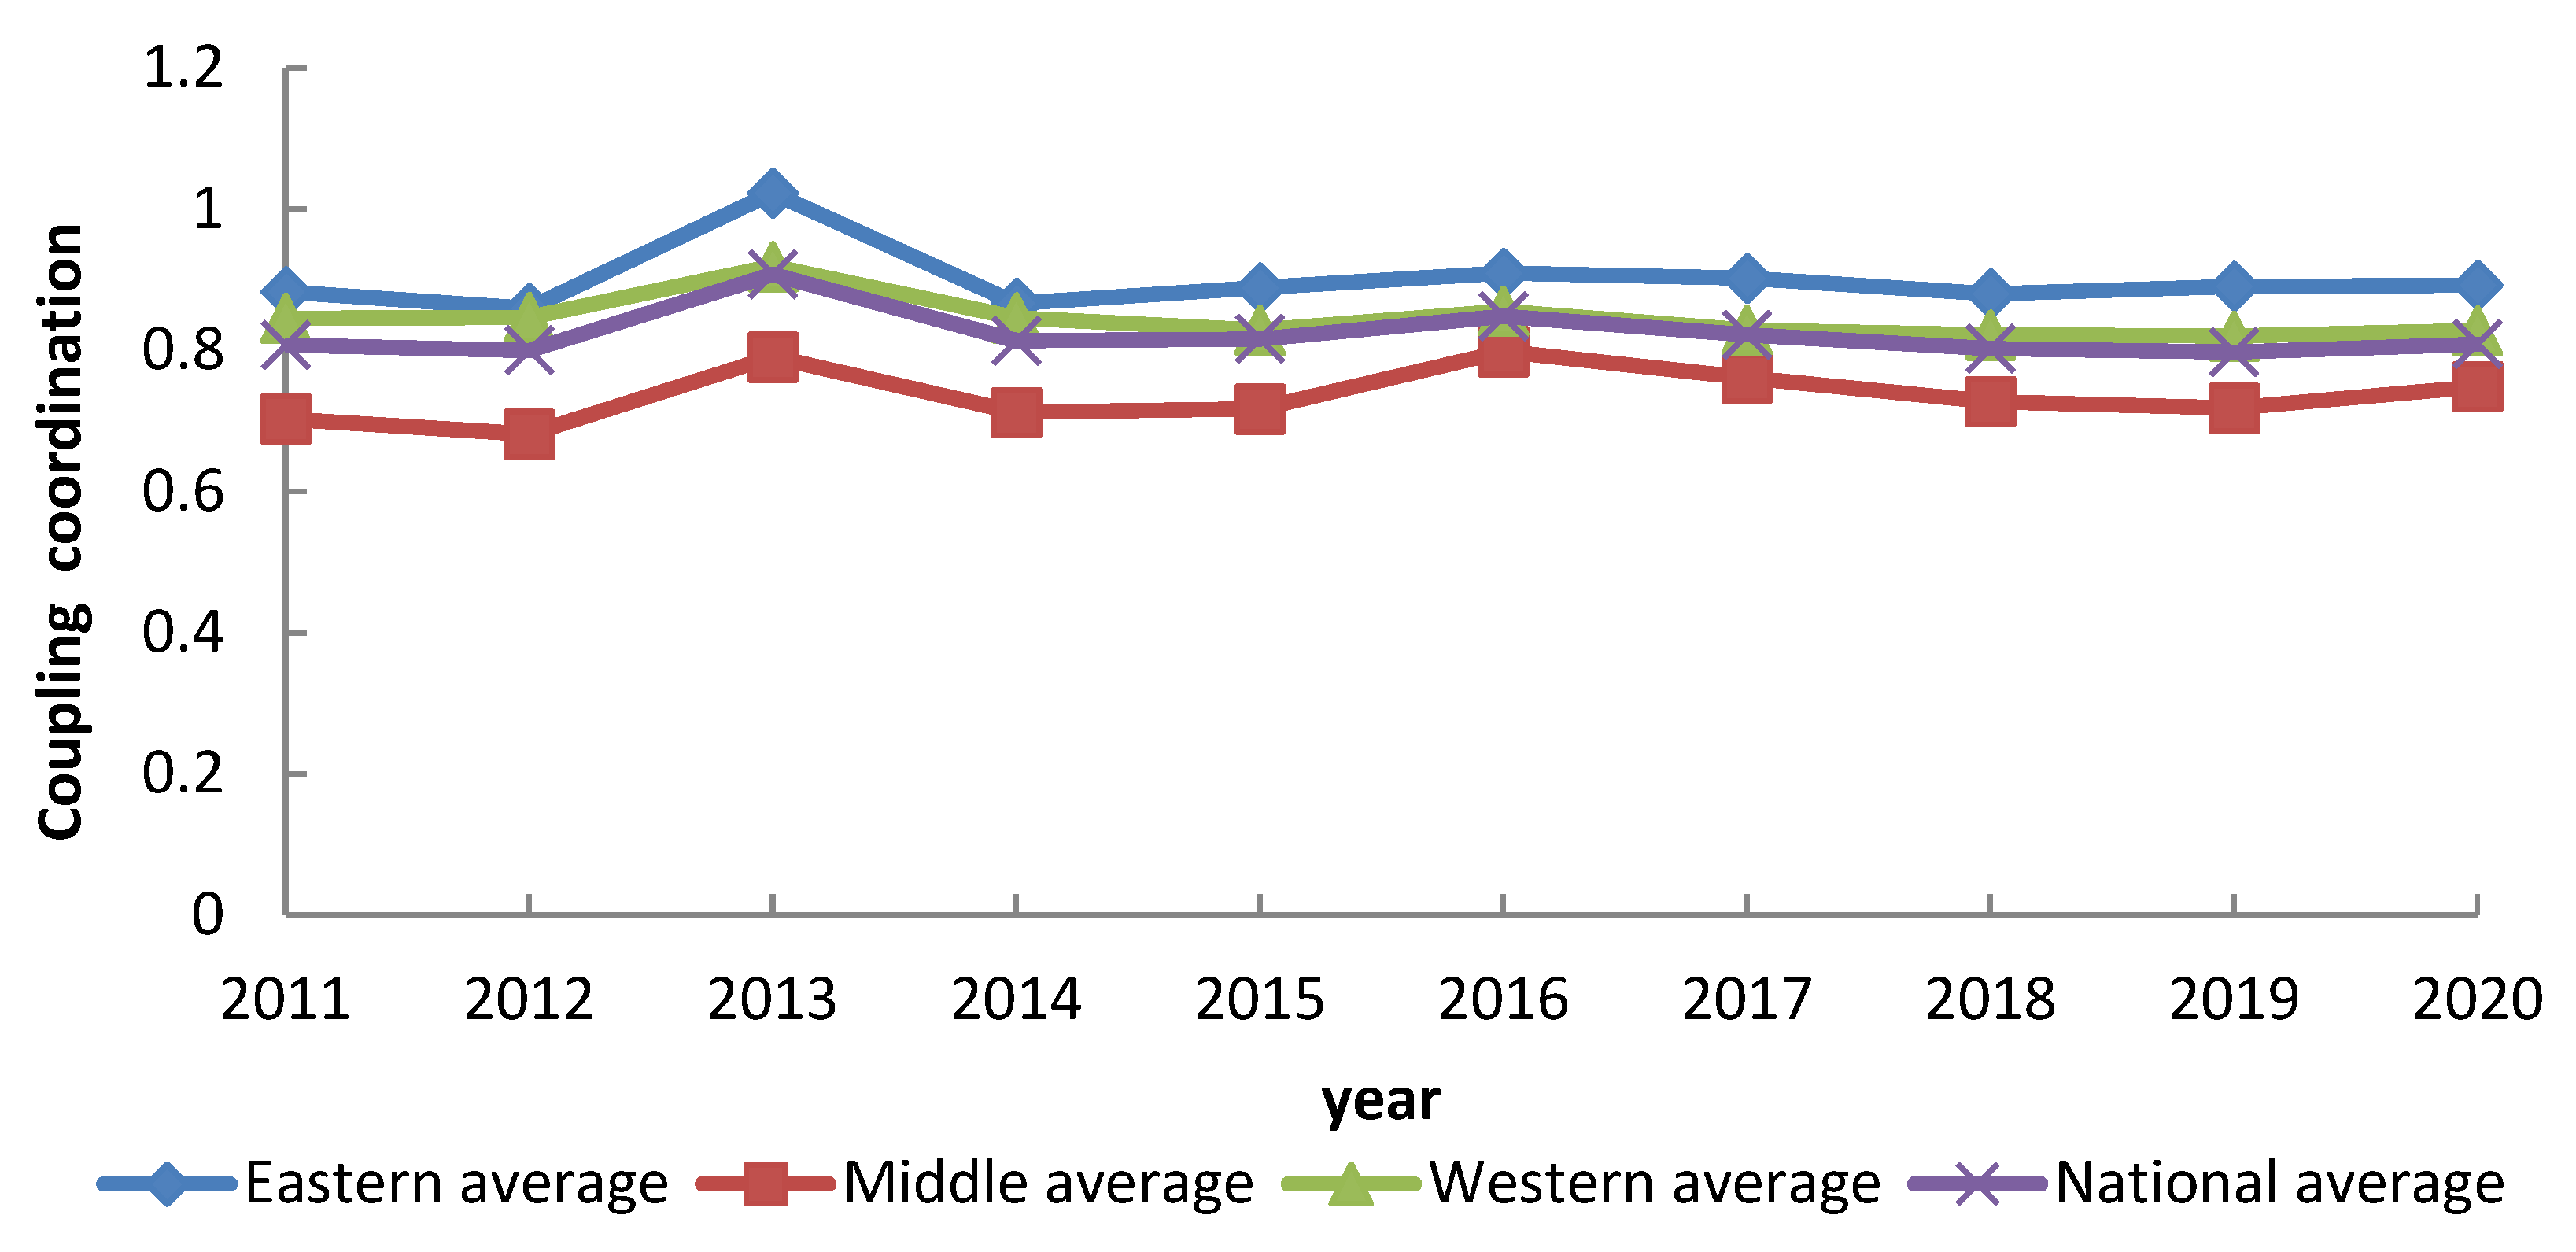
- The average value of coupling coordination between the competitiveness level and land use efficiency of China’s green food industry from 2011 to 2020 floats at the boundary of high-quality coordination, indicating that the competitiveness and land use efficiency of China’s green food industry develop in a more coordinated manner. All three regions show a rising and then declining and leveling-off trend, with the eastern and western remaining in high-quality coordination over the decade and the middle being good coordination except for 2012, when it was moderate coordination, as shown in Figure 7. In 2013, the coupling coordination between the competitiveness level and land use efficiency in all three regions reached a peak. The main reason is that the number of employment and fixed asset investment in China’s green food industry in 2013 was significantly higher compared to 2012 and 2014, indicating that the development of the green food industry in China’s provinces and cities was on the rise in 2013, attracting more labor to join the green food industry. The government also actively supported the green food industry, and governments at all levels increased their investment in fixed assets for the green food industry. At the same time, national urbanization accelerated in 2013; the reverse of urban space expansion caused a decrease in the production base area of the green food industry, resulting in an increase in the land use efficiency of the green food industry in that year and an increase in the coupling coordination of all regions to varying degrees:Coordinated development of the eastern region.
- (2)
- Stable development in the west.
- (3)
- Uneven development in the middle.
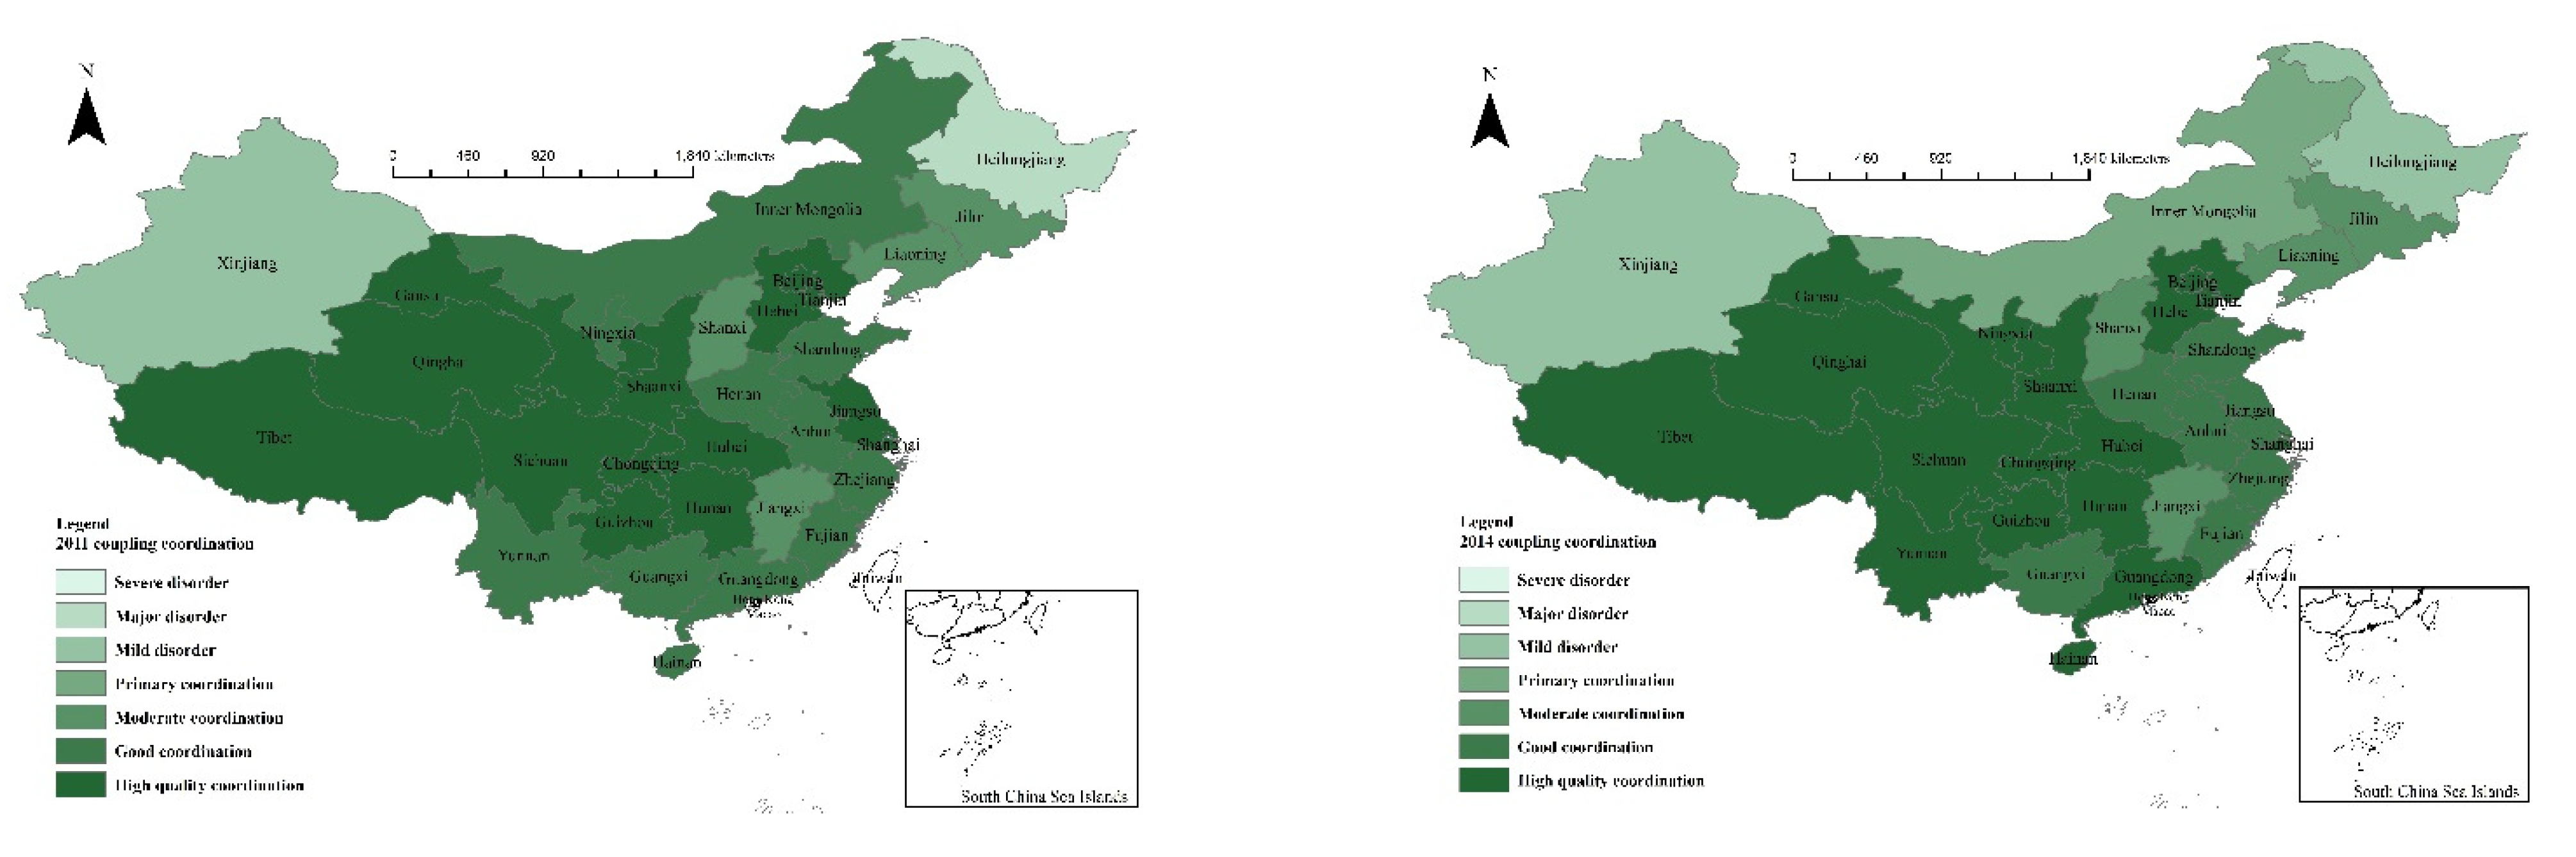
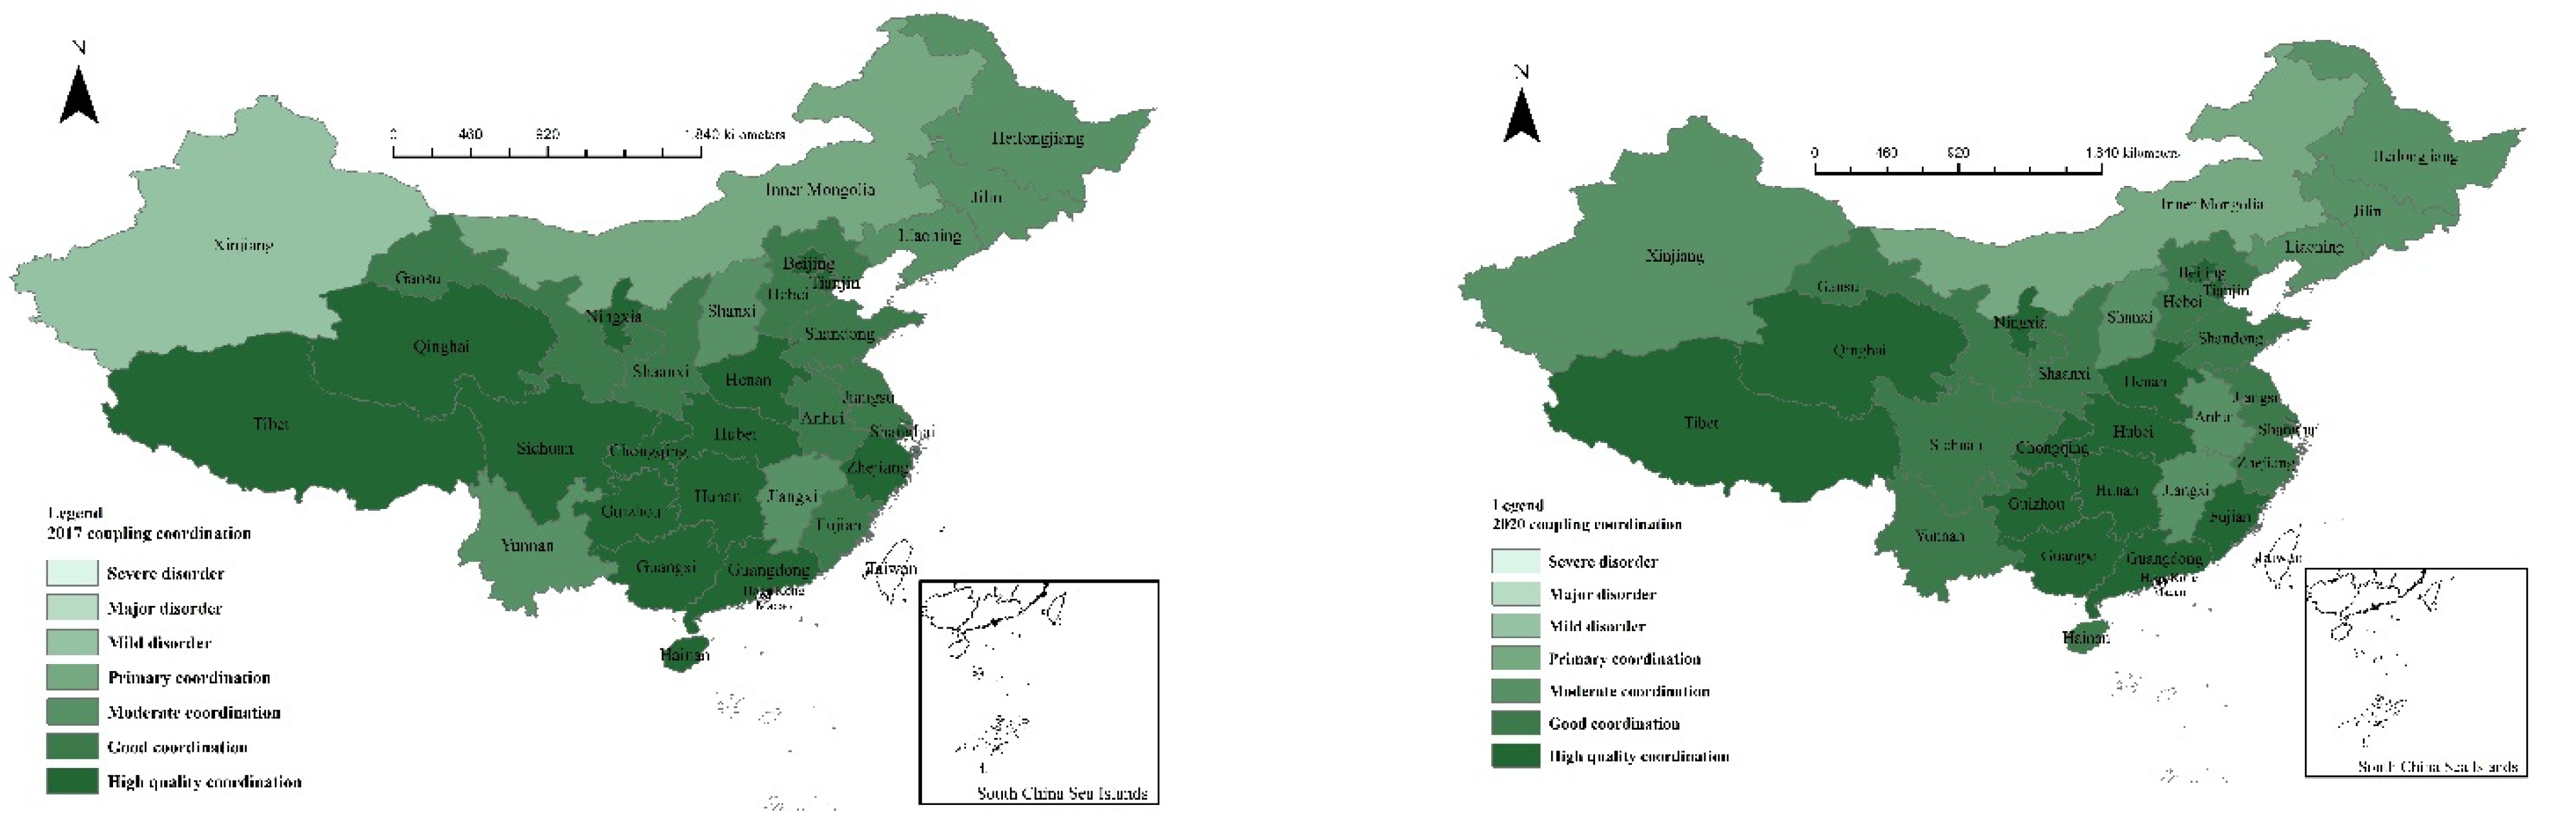
4.3.2. Spatial Characteristics
- (1)
- The eastern is centered on the economic belt.
- (2)
- The western gap decreases and tends to be intermediate.
- (3)
- The middle is in good shape and actively developing.
5. Discussion
6. Conclusions
- (1)
- The competitiveness level of China’s green food industry shows a trend of “high in the west and low in the east”, with a small gap between the competitiveness level of the middle and the eastern. Highly competitive provinces are concentrated in the northwest, and most Chinese provinces and cities are in the middle of competitiveness.
- (2)
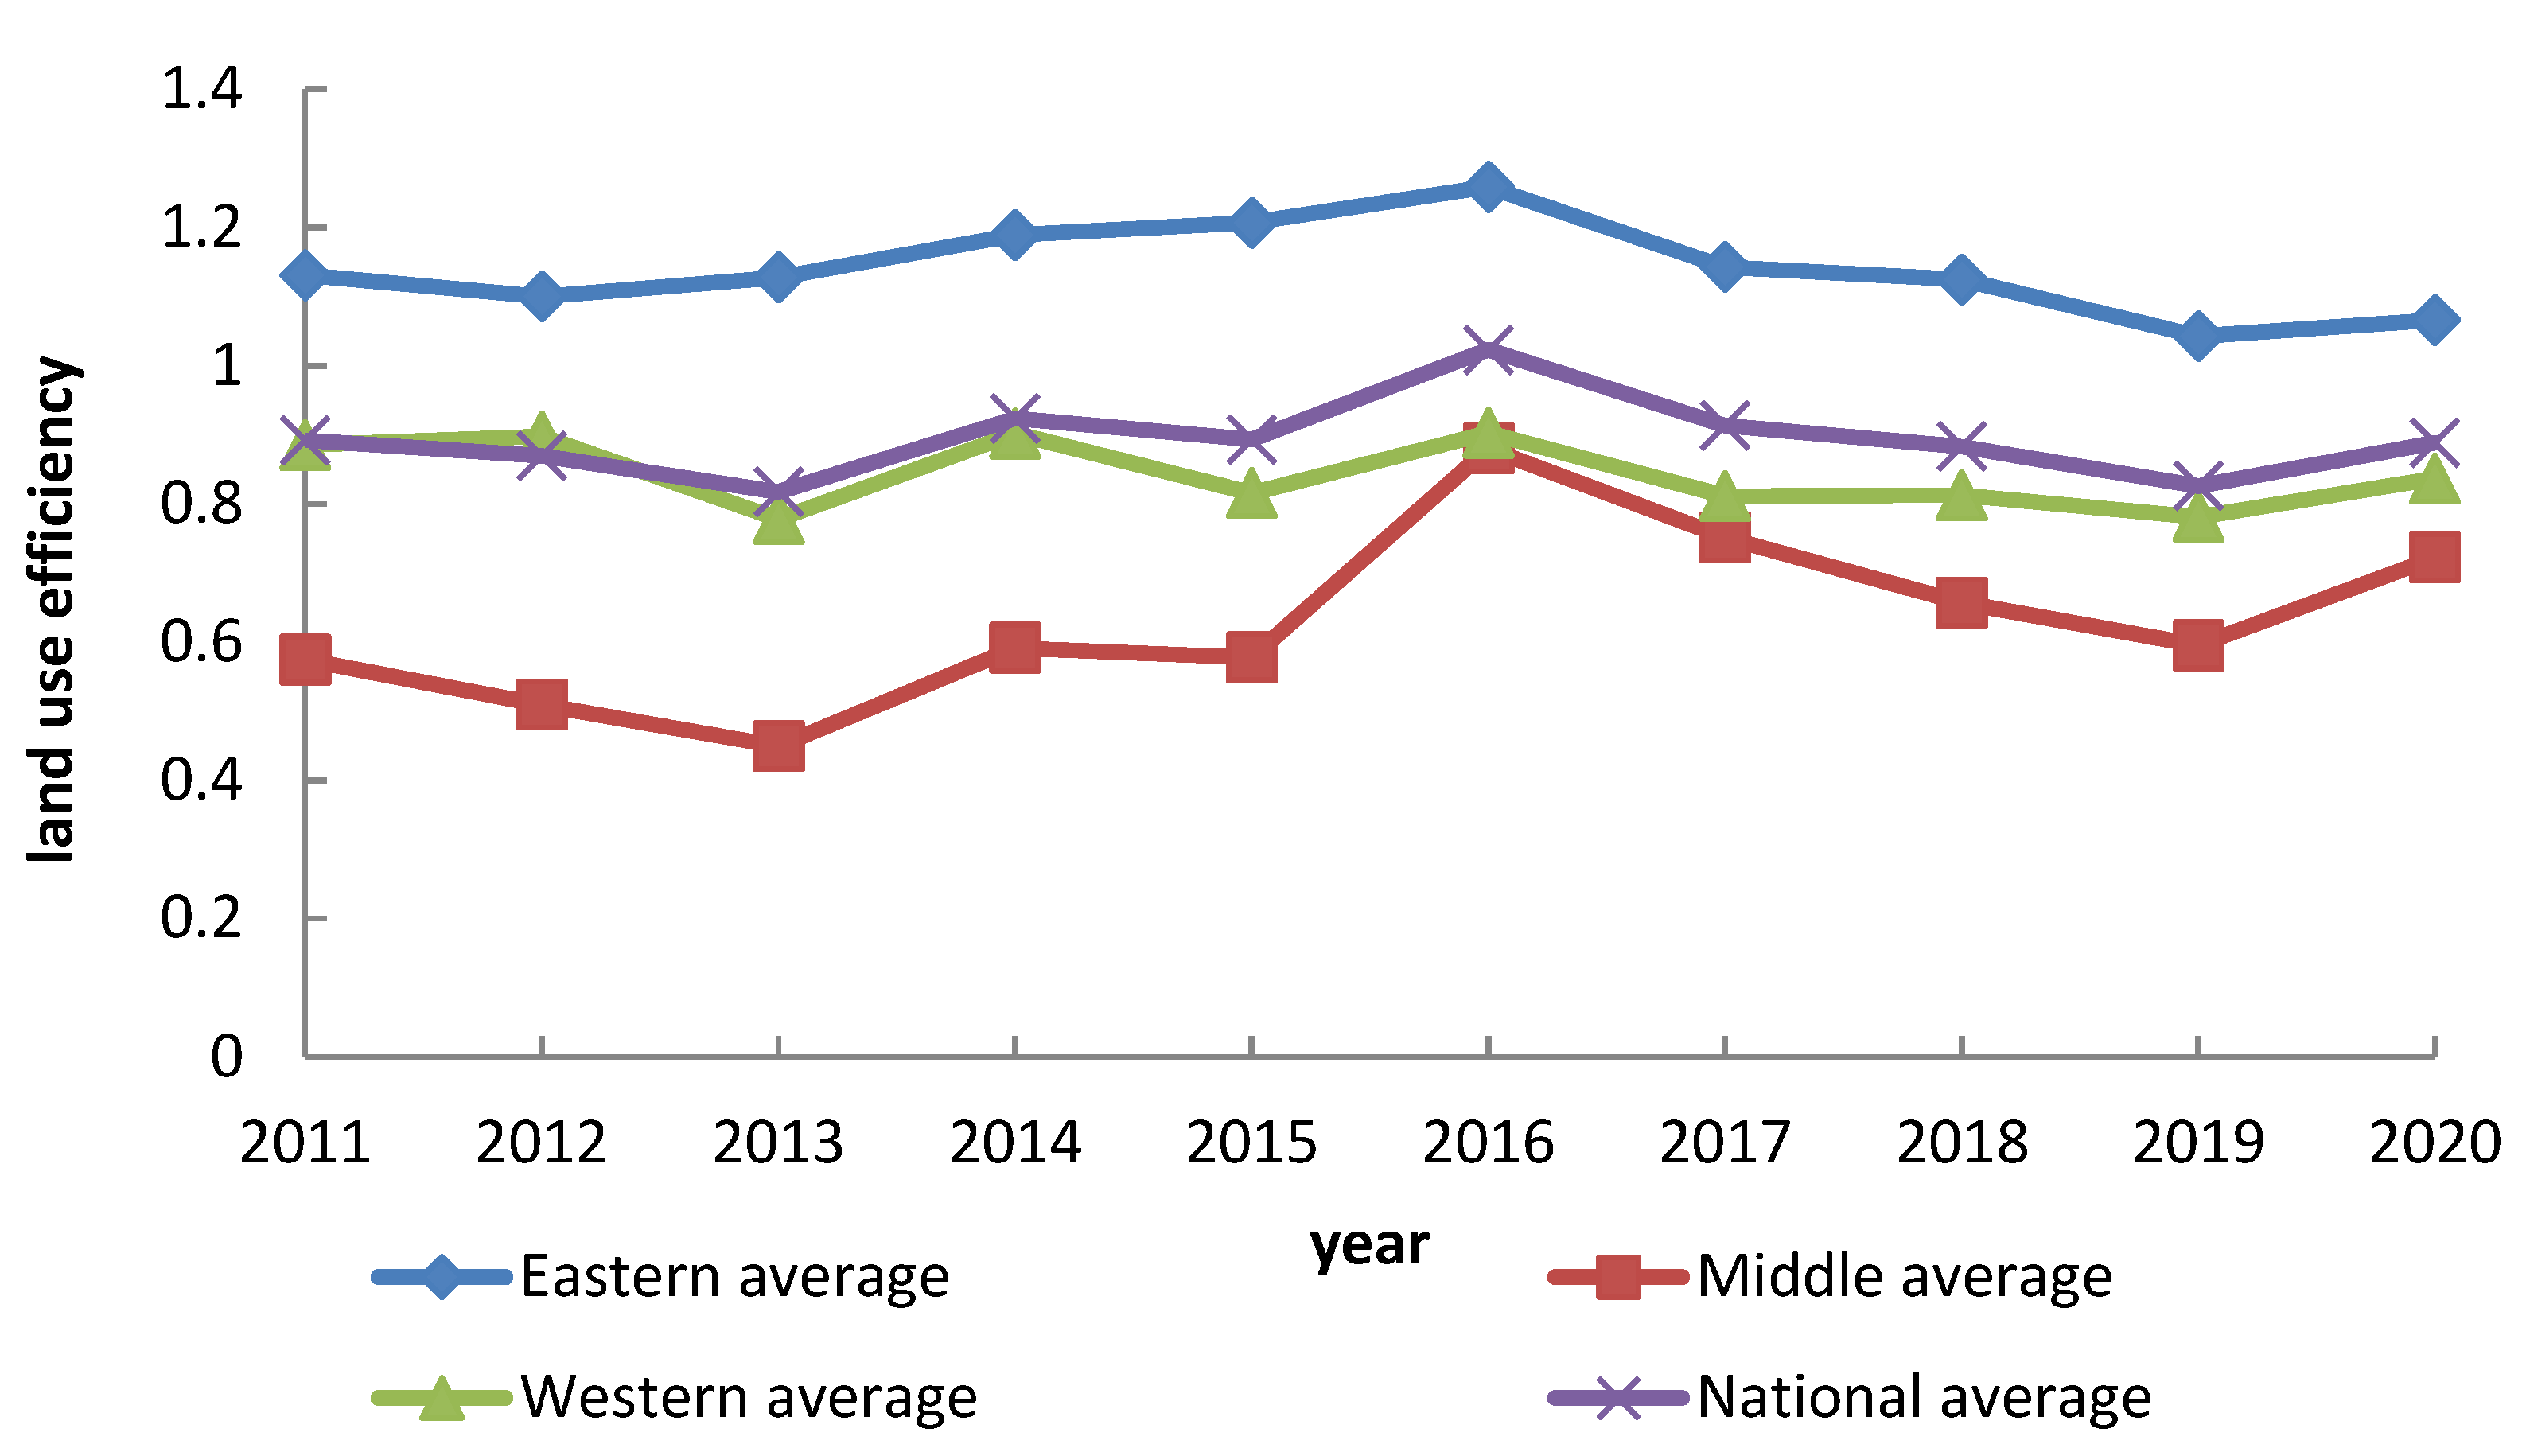
- The land use efficiency of China’s green food industry generally showed a trend of rising and then falling and peaked in 2016. The average value of land use efficiency of the green food industry in the three regions is ranked as eastern > western > middle, and the middle and western are lower than the national average in most years.
- (3)
- The average value of coupling coordination between the competitiveness level and land use efficiency of China’s green food industry floats at the boundary of high-quality coordination, with all three regions showing a rising and then declining trend and leveling off and peaking in 2013. The eastern and western are in high-quality coordination all year round, and the middle is in good coordination most years. The number of provinces and cities in high-quality coordination in China is shifting from the north to the south in terms of geographic location, with the eastern relying on the development of the three major economic belts, the western having a smaller gap between provinces and cities, and the middle having an overall positive posture.
Author Contributions
Funding
Institutional Review Board Statement
Informed Consent Statement
Data Availability Statement
Acknowledgments
Conflicts of Interest
References
- Xu, J.; Zhong, J.; Zhang, B.; Li, X. Green labelled rice shows a higher nutritional and physiochemical quality than conventional rice in China. Foods 2021, 10, 915. [Google Scholar] [CrossRef] [PubMed]
- Yu, X.; Gao, Z.; Zeng, Y. Willingness to pay for the “Green Food” in China. Food Policy 2014, 45, 80–87. [Google Scholar] [CrossRef]
- Ayyub, S.; Wang, X.; Asif, M.; Ayyub, R.M. Antecedents of trust in organic foods: The mediating role of food related personality traits. Sustainability 2018, 10, 3597. [Google Scholar] [CrossRef] [Green Version]
- Shaqiri, F.; Vasa, L.; Arben, M.; Ymeri, P. Evaluating consumer behavior for consumption of milk and cheese in Gjilan Region, Kosovo. Ann. Agrar. Sci. 2019, 17, 375–382. [Google Scholar]
- Paull, J. Green food in China. Elem. J. Bio-Dyn. Tasman. 2008, 91, 48–53. [Google Scholar]
- Qi, X.; Ploeger, A. Explaining consumers’ intentions towards purchasing green food in Qingdao, China: The amendment and extension of the theory of planned behavior. Appetite 2019, 133, 414–422. [Google Scholar] [CrossRef]
- ul Hassan, M.; Wen, X.; Xu, J.; Zhong, J.; Li, X. Development and challenges of green food in China. Front. Agric. Sci. Eng. 2020, 7, 56–66. [Google Scholar] [CrossRef] [Green Version]
- Zhang, Z.; Yu, H.; Li, X.; Liu, B.; Tian, Y. Research on the development strategy of green food industry in China. Chin. J. Agric. Resour. Reg. Plan. 2015, 36, 35–38. (In Chinese) [Google Scholar]
- Qi, X.; Ploeger, A. Explaining Chinese consumers’ green food purchase intentions during the COVID-19 pandemic: An extended Theory of Planned Behaviour. Foods 2021, 10, 1200. [Google Scholar] [CrossRef] [PubMed]
- Liu, B.; He, Q. Impact factors and promotion countermeasures on regulatory effectiveness of green food in China. Qual. Saf. Agroproducts 2017, 6, 49–52. (In Chinese) [Google Scholar]
- Xu, J.; Zhang, Z.; Zhang, X.; Ishfaq, M.; Zhong, J.; Li, W.; Zhang, F.; Li, X. Green food development in China: Experiences and challenges. Agriculture 2020, 10, 614. [Google Scholar] [CrossRef]
- Yadav, R.; Pathak, G.S. Intention to purchase organic food among young consumers: Evidences from a developing nation. Appetite 2016, 96, 122–128. [Google Scholar] [CrossRef] [PubMed]
- Meemken, E.M.; Qaim, M. Organic agriculture, food security, and the environment. Annu. Rev. Resour. Econ. 2018, 10, 39–63. [Google Scholar] [CrossRef] [Green Version]
- Jeyakumar Nathan, R.; Victor, V.; Popp, J.; Fekete-Farkas, M.; Oláh, J. Food innovation adoption and organic food consumerism—A cross national study between Malaysia and Hungary. Foods 2021, 10, 363. [Google Scholar] [CrossRef]
- Sun, C.; Huang, D.; Li, H.; Chen, C.; Wang, C.; Li, M.; Wang, Z. Green Food Industry in China: Spatial Pattern and Production Concentration Drivers. Front. Environ. Sci. 2021, 9, 665990. [Google Scholar] [CrossRef]
- Su, Q.; Jiang, X. Evaluate the economic and environmental efficiency of land use from the perspective of decision-makers’ subjective preferences. Ecol. Indic. 2021, 129, 107984. [Google Scholar] [CrossRef]
- Fei, R.; Lin, Z.; Chunga, J. How land transfer affects agricultural land use efficiency: Evidence from China’s agricultural sector. Land Use Policy 2021, 103, 105300. [Google Scholar] [CrossRef]
- Assandri, G.; Bogliani, G.; Pedrini, P.; Brambilla, M. Beautiful agricultural landscapes promote cultural ecosystem services and biodiversity conservation. Agric. Ecosyst. Environ. 2018, 256, 200–210. [Google Scholar] [CrossRef]
- Kuang, B.; Lu, X.; Zhou, M.; Chen, D. Provincial cultivated land use efficiency in China: Empirical analysis based on the SBM-DEA model with carbon emissions considered. Technol. Forecast. Soc. Change 2020, 151, 119874. [Google Scholar] [CrossRef]
- Kang, W.; Kang, S.; Liu, S.; Han, Y. Assessing the degree of land degradation and rehabilitation in the Northeast Asia dryland region using net primary productivity and water use efficiency. Land Degrad. Dev. 2020, 31, 816–827. [Google Scholar] [CrossRef]
- Yerseitova, A.; Issakova, S.; Jakisheva, L.; Nauryzbekova, A.; Moldasheva, A. Efficiency of using agricultural land in Kazakhstan. Entrep. Sustain. Issues 2018, 6, 558–576. [Google Scholar] [CrossRef] [PubMed] [Green Version]
- Xie, H.; Chen, Q.; Lu, F.; Wu, Q.; Wang, W. Spatial-temporal disparities, saving potential and influential factors of industrial land use efficiency: A case study in urban agglomeration in the middle reaches of the Yangtze River. Land Use Policy 2018, 75, 518–529. [Google Scholar] [CrossRef]
- Chen, J.; Gao, J.; Chen, W. Urban land expansion and the transitional mechanisms in Nanjing, China. Habitat Int. 2016, 53, 274–283. [Google Scholar] [CrossRef]
- Liu, J.; Jin, X.; Xu, W.; Gu, Z.; Yang, X.; Ren, J.; Fan, Y.; Zhou, Y. A new framework of land use efficiency for the coordination among food, economy and ecology in regional development. Sci. Total Environ. 2020, 710, 135670. [Google Scholar] [CrossRef] [PubMed]
- Zhao, Y.; Zhang, M.; Cui, J. Land-use transition and its driving forces in a minority mountainous area: A case study from Mao County, Sichuan Province, China. Environ. Monit. Assess. 2022, 194, 688. [Google Scholar] [CrossRef]
- Zhu, G.; Xu, X.; Ma, Z.; Xu, L.; Porter, J.H. Spatial dynamics and zoning of coastal land-use change along Bohai Bay, China, during 1979–2008. J. Coast. Res. 2012, 28, 1186–1196. [Google Scholar]
- Chen, H.; Chen, Y.; Chen, X.; Zhang, X.; Wu, H.; Li, Z. Impacts of Historical Land Use Changes on Ecosystem Services in Guangdong Province, China. Land 2022, 11, 809. [Google Scholar] [CrossRef]
- Jiang, X.; Lu, X.; Liu, Q.; Chang, C.; Qu, L. The effects of land transfer marketization on the urban land use efficiency: An empirical study based on 285 cities in China. Ecol. Indic. 2021, 132, 108296. [Google Scholar] [CrossRef]
- Jiang, S.; Meng, J.; Zhu, L.; Cheng, H. Spatial-temporal pattern of land use conflict in China and its multilevel driving mechanisms. Sci. Total Environ. 2021, 801, 149697. [Google Scholar] [CrossRef]
- Jiang, L.; Guo, S.; Wang, G.; Kan, S.; Jiang, H. Changes in agricultural land requirements for food provision in China 2003–2011: A comparison between urban and rural residents. Sci. Total Environ. 2020, 725, 138293. [Google Scholar] [CrossRef] [PubMed]
- Redlichová, R.; Chmelíková, G.; Blažková, I.; Svobodová, E.; Vanderpuje, I.N. Organic food needs more land and direct energy to be produced compared to food from conventional farming: Empirical evidence from the czech republic. Agriculture 2021, 11, 813. [Google Scholar] [CrossRef]
- Paz, D.B.; Henderson, K.; Loreau, M. Agricultural land use and the sustainability of social-ecological systems. Ecol. Model. 2020, 437, 109312. [Google Scholar]
- Underwood, T.; McCullum-Gomez, C.; Harmon, A.; Roberts, S. Organic agriculture supports biodiversity and sustainable food production. J. Hunger. Environ. Nutr. 2011, 6, 398–423. [Google Scholar] [CrossRef]
- Chigbu, U.E.; Ntihinyurwa, P.D.; de Vries, W.T.; Ngenzi, E.I. Why tenure responsive land-use planning matters: Insights for land use consolidation for food security in Rwanda. Int. J. Environ. Res. Public Health 2019, 16, 1354. [Google Scholar] [CrossRef] [Green Version]
- Ahammad, R.; Stacey, N.; Sunderland, T. Assessing land use changes and livelihood outcomes of rural people in the Chittagong Hill Tracts region, Bangladesh. Land Degrad. Dev. 2021, 32, 3626–3638. [Google Scholar] [CrossRef]
- Liu, H.; Zhou, Y. Urbanization, land use behavior and land quality in rural china: An analysis based on pressure-response-impact framework and sem approach. Int. J. Environ. Res. Public Health 2018, 15, 2621. [Google Scholar] [CrossRef]
- Mohammady, M. Land use change optimization using a new ensemble model in Ramian County, Iran. Environ. Earth Sci. 2021, 80, 780. [Google Scholar] [CrossRef]
- Yawson, D.O.; Mohan, S.; Armah, F.A.; Ball, T.; Mulholland, B.; Adu, M.O.; White, P.J. Virtual water flows under projected climate, land use and population change: The case of UK feed barley and meat. Heliyon 2020, 6, e03127. [Google Scholar] [CrossRef] [Green Version]
- Lindstrom, H.; Lundberg, S.; Marklund, P.O. How Green Public Procurement can drive conversion of farmland: An empirical analysis of an organic food policy. Ecol. Econ. 2020, 172, 106622. [Google Scholar] [CrossRef]
- Li, Z.; Fu, W.; Udimal, T.B.; Luo, M.; Chen, J. The measurement of competitiveness of forest green food industry in Yunnan Province. PLoS ONE 2021, 16, e0261133. [Google Scholar] [CrossRef] [PubMed]
- Yu, J.; Zhou, K.; Yang, S. Land use efficiency and influencing factors of urban agglomerations in China. Land Use Policy 2019, 88, 104143. [Google Scholar] [CrossRef]
- Qian, Z. Land acquisition compensation in post-reform China: Evolution, structure and challenges in Hangzhou. Land Use Policy 2015, 46, 250–257. [Google Scholar] [CrossRef]
- Liu, Y.; Fang, F.; Li, Y. Key issues of land use in China and implications for policy making. Land Use Policy 2014, 40, 6–12. [Google Scholar] [CrossRef]
- Zhang, R.; Lu, J. Spatial–Temporal Pattern and Convergence Characteristics of Provincial Urban Land Use Efficiency under Environmental Constraints in China. Int. J. Environ. Res. Public Health 2022, 19, 10729. [Google Scholar] [CrossRef]
- Bao, C.; Xu, M.; Sun, S. China’s Land Uses in the Multi-Region Input–Output Framework. Int. J. Environ. Res. Public Health 2019, 16, 2940. [Google Scholar] [CrossRef] [Green Version]
- Zhang, M.; Wang, J.; Zhou, R. Entropy value-based pursuit projection cluster for the teaching quality evaluation with interval number. Entropy 2019, 21, 203. [Google Scholar] [CrossRef]
- Opricovic, S.; Tzeng, G.H. Extended VIKOR method in comparison with outranking methods. Eur. J. Oper. Res. 2007, 178, 514–529. [Google Scholar] [CrossRef]
- Zhao, X.; Long, L.; Sun, Q.; Zhang, W. How to Evaluate Investment Efficiency of Environmental Pollution Control: Evidence from China. Int. J. Environ. Res. Public Health 2022, 19, 7252. [Google Scholar] [CrossRef] [PubMed]
- Cheng, K.; Yao, J.; Ren, Y. Evaluation of the coordinated development of regional water resource systems based on a dynamic coupling coordination model. Water Supply 2019, 19, 565–573. [Google Scholar] [CrossRef]
- Li, R.; Ding, Z.; An, Y. Examination and Forecast of Relationship among Tourism, Environment, and Economy: A Case Study in Shandong Province, China. Int. J. Environ. Res. Public Health 2022, 19, 2581. [Google Scholar] [CrossRef]
- Han, L.; He, T.; Yang, Y. Coupling Coordination Evaluation of High Quality Development and Land Use Efficiency of Urban Agglomeration——Empirical Analysis of Seven Urban Agglomerations in the Yellow River Basin. J. Henan Norm. Univ. (Philos. Soc. Sci.) 2021, 48, 95–101. (In Chinese) [Google Scholar]


| Region | Scope |
|---|---|
| Eastern | Beijing, Tianjin, Hebei, Liaoning, Shanghai, Jiangsu, Zhejiang, Fujian, Shandong, Guangdong, Hainan |
| Middle | Shanxi, Jilin, Heilongjiang, Anhui, Jiangxi, Henan, Hubei, Hunan |
| Western | Inner Mongolia, Guangxi, Chongqing, Sichuan, Guizhou, Yunnan, Tibet, Shaanxi, Gansu, Qinghai, Ningxia, Xinjiang |
| Range of Values | Coupling Coordination Level |
|---|---|
| 0 ≤ D < 0.3 | Severe disorder |
| 0.3 ≤ D < 0.4 | Major disorder |
| 0.4 ≤ D < 0.5 | Mild disorder |
| 0.5 ≤ D < 0.6 | Primary coordination |
| 0.6 ≤ D < 0.7 | Moderate coordination |
| 0.7 ≤ D < 0.8 | Good coordination |
| D ≥ 0.8 | High-quality coordination |
| Provinces and Cities | 2011 | 2012 | 2013 | 2014 | 2015 | 2016 | 2017 | 2018 | 2019 | 2020 |
|---|---|---|---|---|---|---|---|---|---|---|
| Beijing | 0.47 | 0.46 | 0.87 | 0.48 | 0.48 | 0.52 | 0.55 | 0.49 | 0.50 | 0.53 |
| Tianjin | 0.73 | 0.70 | 0.82 | 0.65 | 0.66 | 0.70 | 0.71 | 0.57 | 0.58 | 0.59 |
| Hebei | 0.42 | 0.38 | 0.81 | 0.48 | 0.51 | 0.51 | 0.50 | 0.47 | 0.49 | 0.51 |
| Liaoning | 0.47 | 0.45 | 0.91 | 0.47 | 0.48 | 0.49 | 0.46 | 0.44 | 0.47 | 0.44 |
| Shanghai | 0.36 | 0.37 | 0.55 | 0.36 | 0.37 | 0.41 | 0.48 | 0.38 | 0.52 | 0.55 |
| Jiangsu | 0.46 | 0.46 | 0.63 | 0.33 | 0.40 | 0.38 | 0.31 | 0.32 | 0.24 | 0.27 |
| Zhejiang | 0.24 | 0.26 | 0.79 | 0.26 | 0.33 | 0.32 | 0.35 | 0.34 | 0.35 | 0.33 |
| Fujian | 0.31 | 0.32 | 0.00 | 0.31 | 0.34 | 0.35 | 0.38 | 0.36 | 0.39 | 0.37 |
| Shandong | 0.33 | 0.28 | 0.71 | 0.38 | 0.48 | 0.39 | 0.39 | 0.35 | 0.36 | 0.38 |
| Guangdong | 0.44 | 0.45 | 0.94 | 0.46 | 0.49 | 0.49 | 0.50 | 0.46 | 0.49 | 0.47 |
| Hainan | 0.33 | 0.34 | 0.87 | 0.36 | 0.36 | 0.39 | 0.41 | 0.38 | 0.37 | 0.36 |
| Eastern average | 0.42 | 0.41 | 0.72 | 0.41 | 0.44 | 0.45 | 0.46 | 0.41 | 0.43 | 0.44 |
| Shanxi | 0.61 | 0.60 | 0.93 | 0.57 | 0.61 | 0.62 | 0.58 | 0.55 | 0.57 | 0.56 |
| Jilin | 0.43 | 0.48 | 0.97 | 0.50 | 0.53 | 0.53 | 0.51 | 0.49 | 0.50 | 0.52 |
| Heilongjiang | 0.15 | 0.16 | 0.67 | 0.16 | 0.16 | 0.16 | 0.16 | 0.16 | 0.21 | 0.16 |
| Anhui | 0.48 | 0.44 | 0.87 | 0.50 | 0.55 | 0.52 | 0.48 | 0.49 | 0.47 | 0.43 |
| Jiangxi | 0.32 | 0.31 | 0.93 | 0.35 | 0.36 | 0.38 | 0.37 | 0.34 | 0.38 | 0.39 |
| Henan | 0.51 | 0.49 | 0.85 | 0.54 | 0.55 | 0.58 | 0.58 | 0.54 | 0.53 | 0.51 |
| Hubei | 0.46 | 0.49 | 0.89 | 0.43 | 0.48 | 0.47 | 0.47 | 0.44 | 0.48 | 0.48 |
| Hunan | 0.43 | 0.42 | 0.86 | 0.42 | 0.43 | 0.44 | 0.42 | 0.41 | 0.43 | 0.43 |
| Middle average | 0.43 | 0.42 | 0.87 | 0.44 | 0.46 | 0.46 | 0.45 | 0.43 | 0.45 | 0.44 |
| Inner Mongolia | 0.29 | 0.38 | 0.92 | 0.36 | 0.38 | 0.38 | 0.38 | 0.35 | 0.35 | 0.32 |
| Guangxi | 0.42 | 0.41 | 0.97 | 0.43 | 0.44 | 0.46 | 0.47 | 0.43 | 0.46 | 0.43 |
| Chongqing | 0.55 | 0.53 | 0.92 | 0.51 | 0.43 | 0.54 | 0.53 | 0.48 | 0.48 | 0.45 |
| Sichuan | 0.48 | 0.46 | 0.94 | 0.50 | 0.54 | 0.53 | 0.49 | 0.47 | 0.51 | 0.52 |
| Guizhou | 0.56 | 0.54 | 0.98 | 0.50 | 0.50 | 0.51 | 0.49 | 0.43 | 0.47 | 0.45 |
| Yunnan | 0.45 | 0.43 | 0.97 | 0.41 | 0.43 | 0.44 | 0.46 | 0.42 | 0.43 | 0.44 |
| Tibet | 0.45 | 0.46 | 0.75 | 0.48 | 0.49 | 0.53 | 0.53 | 0.52 | 0.56 | 0.56 |
| Shaanxi | 0.46 | 0.46 | 0.94 | 0.48 | 0.48 | 0.50 | 0.50 | 0.48 | 0.51 | 0.48 |
| Gansu | 0.72 | 0.69 | 0.87 | 0.71 | 0.75 | 0.74 | 0.71 | 0.74 | 0.74 | 0.73 |
| Qinghai | 0.98 | 0.98 | 0.94 | 0.95 | 0.95 | 0.95 | 0.95 | 0.97 | 0.97 | 0.97 |
| Ningxia | 0.72 | 0.70 | 0.95 | 0.65 | 0.67 | 0.67 | 0.61 | 0.58 | 0.60 | 0.55 |
| Xinjiang | 0.87 | 0.84 | 0.85 | 0.86 | 0.89 | 0.88 | 0.88 | 0.87 | 0.89 | 0.86 |
| Western average | 0.58 | 0.57 | 0.92 | 0.57 | 0.58 | 0.59 | 0.58 | 0.56 | 0.58 | 0.56 |
| National average | 0.48 | 0.47 | 0.83 | 0.48 | 0.50 | 0.51 | 0.50 | 0.47 | 0.49 | 0.48 |
| Provinces and Cities | 2011 | 2012 | 2013 | 2014 | 2015 | 2016 | 2017 | 2018 | 2019 | 2020 |
|---|---|---|---|---|---|---|---|---|---|---|
| Beijing | 1.29 | 1.28 | 1.31 | 1.42 | 1.43 | 1.43 | 1.46 | 1.51 | 1.55 | 1.48 |
| Tianjin | 1.14 | 1.15 | 1.16 | 1.24 | 1.36 | 1.16 | 1.23 | 1.15 | 1.07 | 1.15 |
| Hebei | 1.00 | 0.66 | 1.00 | 1.02 | 1.00 | 1.04 | 0.65 | 1.00 | 0.50 | 0.62 |
| Liaoning | 0.35 | 0.40 | 0.28 | 0.38 | 0.37 | 0.92 | 0.31 | 0.30 | 0.33 | 0.37 |
| Shanghai | 2.08 | 2.06 | 1.94 | 1.89 | 1.82 | 1.64 | 1.60 | 1.18 | 1.18 | 1.25 |
| Jiangsu | 1.02 | 1.04 | 1.05 | 1.05 | 1.06 | 1.09 | 1.06 | 1.05 | 1.02 | 1.04 |
| Zhejiang | 1.28 | 1.43 | 1.38 | 1.50 | 1.64 | 1.79 | 1.66 | 1.54 | 1.19 | 1.14 |
| Fujian | 1.08 | 1.11 | 1.05 | 1.12 | 1.11 | 1.16 | 1.07 | 1.06 | 1.11 | 1.18 |
| Shandong | 1.03 | 1.03 | 1.08 | 1.08 | 1.06 | 1.00 | 1.06 | 1.10 | 1.04 | 1.02 |
| Guangdong | 0.70 | 0.59 | 0.64 | 1.00 | 1.01 | 1.10 | 1.02 | 1.01 | 1.03 | 1.01 |
| Eastern average | 1.13 | 1.10 | 1.13 | 1.19 | 1.21 | 1.26 | 1.14 | 1.12 | 1.04 | 1.07 |
| Hainan | 1.47 | 1.35 | 1.53 | 1.37 | 1.41 | 1.52 | 1.45 | 1.46 | 1.46 | 1.45 |
| Shanxi | 0.34 | 0.32 | 0.36 | 0.36 | 0.35 | 0.37 | 0.31 | 0.32 | 0.27 | 0.25 |
| Jilin | 0.47 | 0.47 | 0.30 | 0.47 | 0.48 | 1.03 | 0.34 | 0.32 | 0.39 | 0.46 |
| Heilongjiang | 0.15 | 0.19 | 0.17 | 0.22 | 0.24 | 1.04 | 1.07 | 1.05 | 1.06 | 1.05 |
| Anhui | 0.62 | 0.53 | 0.49 | 0.53 | 0.50 | 0.64 | 0.63 | 0.58 | 0.37 | 0.43 |
| Jiangxi | 0.49 | 0.42 | 0.46 | 0.56 | 0.55 | 1.04 | 0.58 | 0.53 | 0.46 | 0.47 |
| Henan | 0.48 | 0.42 | 0.43 | 0.53 | 0.75 | 1.02 | 1.05 | 1.06 | 1.05 | 1.09 |
| Hubei | 1.01 | 0.66 | 0.34 | 1.01 | 0.70 | 1.03 | 1.01 | 0.38 | 0.33 | 1.02 |
| Hunan | 1.03 | 1.06 | 1.06 | 1.06 | 1.05 | 0.89 | 1.03 | 1.03 | 0.83 | 1.00 |
| Middle average | 0.57 | 0.51 | 0.45 | 0.59 | 0.58 | 0.88 | 0.75 | 0.66 | 0.60 | 0.72 |
| Inner Mongolia | 1.00 | 1.05 | 1.01 | 0.30 | 0.31 | 0.61 | 0.28 | 0.25 | 0.50 | 0.40 |
| Guangxi | 0.72 | 0.62 | 0.43 | 0.76 | 0.72 | 1.09 | 1.00 | 1.00 | 0.52 | 1.03 |
| Chongqing | 1.18 | 1.14 | 1.15 | 1.13 | 1.10 | 1.10 | 1.15 | 1.21 | 1.19 | 1.25 |
| Sichuan | 1.02 | 1.03 | 1.02 | 1.01 | 1.02 | 0.81 | 1.02 | 1.02 | 1.03 | 0.69 |
| Guizhou | 1.09 | 1.06 | 1.06 | 1.07 | 1.14 | 1.11 | 1.23 | 1.24 | 1.17 | 1.12 |
| Yunnan | 0.58 | 0.67 | 0.48 | 1.01 | 0.61 | 0.49 | 0.51 | 0.49 | 0.52 | 0.76 |
| Tibet | 1.35 | 1.36 | 1.31 | 1.31 | 1.41 | 1.97 | 1.25 | 1.25 | 1.25 | 1.26 |
| Shaanxi | 1.02 | 1.02 | 1.01 | 1.02 | 0.76 | 0.62 | 0.75 | 0.77 | 0.54 | 0.57 |
| Gansu | 1.01 | 1.02 | 0.29 | 1.01 | 0.50 | 0.61 | 0.36 | 0.29 | 0.38 | 0.51 |
| Qinghai | 1.10 | 1.12 | 1.08 | 1.12 | 1.09 | 1.07 | 1.04 | 1.05 | 1.08 | 1.08 |
| Ningxia | 0.48 | 0.63 | 0.45 | 1.03 | 1.07 | 1.13 | 1.07 | 1.08 | 1.03 | 1.10 |
| Xinjiang | 0.07 | 0.07 | 0.05 | 0.05 | 0.06 | 0.22 | 0.06 | 0.09 | 0.16 | 0.27 |
| Western average | 0.89 | 0.90 | 0.78 | 0.90 | 0.82 | 0.90 | 0.81 | 0.81 | 0.78 | 0.84 |
| National average | 0.89 | 0.87 | 0.82 | 0.92 | 0.89 | 1.02 | 0.91 | 0.88 | 0.83 | 0.89 |
Publisher’s Note: MDPI stays neutral with regard to jurisdictional claims in published maps and institutional affiliations. |
© 2022 by the authors. Licensee MDPI, Basel, Switzerland. This article is an open access article distributed under the terms and conditions of the Creative Commons Attribution (CC BY) license (https://creativecommons.org/licenses/by/4.0/).
Share and Cite
Li, Z.; Fu, W.; Luo, M.; Chen, J. The Coupling Coordination between the Competitiveness Level and Land Use Efficiency of Green Food Industry in China. Land 2022, 11, 2116. https://doi.org/10.3390/land11122116
Li Z, Fu W, Luo M, Chen J. The Coupling Coordination between the Competitiveness Level and Land Use Efficiency of Green Food Industry in China. Land. 2022; 11(12):2116. https://doi.org/10.3390/land11122116
Chicago/Turabian StyleLi, Zhongming, Wei Fu, Mingcan Luo, and Jiancheng Chen. 2022. "The Coupling Coordination between the Competitiveness Level and Land Use Efficiency of Green Food Industry in China" Land 11, no. 12: 2116. https://doi.org/10.3390/land11122116