Article

Response of Ecosystem Service Value to Spatio-Temporal Pattern Evolution of Land Use in Typical Heavy Industry Cities: A Case Study of Taiyuan City, China

1
College of Geography and Remote Sensing Sciences, Xinjiang University, Urumqi 830017, China
2
Key Laboratory of Tourism and Resources and Environment in Shandong Province, Taishan University, Tai’an 271000, China
3
School of Civil and Architectural Engineering, Shandong University of Technology, Zibo 255000, China
4
Piesat Information Technology Co., Ltd., Beijing 100195, China
*
Author to whom correspondence should be addressed.
Land 2022, 11(11), 2035; https://doi.org/10.3390/land11112035
Submission received: 20 October 2022 / Revised: 8 November 2022 / Accepted: 11 November 2022 / Published: 13 November 2022

Abstract

:
Ecosystem services value (ESV) has been one index of quantitative evaluation for the ecological livability of heavy industry cities in the new era, which is intimately relevant to patterns of spatio-temporal changes in land use. This study aims to reveal the response of ecosystem service value in heavy industrial cities to the spatial-temporal evolution structure of land use and to analyze the cold and hot spots and sensitivity. In this study, Taiyuan was taken as an example, and Landsat images were adopted as the basic data. This study used intensity analysis, revised ESV, fishing nets, sensitivity analysis, and the methods of hotspot analysis and spatial overlay. The results showed as follows, (1) The characteristics of land use structure evolution mainly focus on the increase of construction land in the early and the rapid development stage of heavy industry cities. All land use types were partly transferred to construction land, but farmland was the main source, with the largest change intensity in the rapid development stage in Taiyuan; (2) The low-value zones of ESV were mostly distributed in the main urban area for construction and farmland, while the high-value zones were primarily distributed in the forestland and grassland. They were distributed in the Fenhe River valley, western and northern mountainous and hilly areas of Taiyuan. The total ESV continued to decline from 2003 to 2018, with a loss amount of RMB 29 million; (3) The patches of land use change were more and more broken, and the spatial distribution of the cold and hot spots was more and more dispersed. The cold and hot spots of ESV were concentrated in the eastern main urban area and its surrounding areas and expanded to the north and south; (4) The forestland was the most sensitive land factor of ESV. The study provides a theoretical method for land use planning, environmental governance, and ecological restoration in heavy industry cities in the new era.

Graphical Abstract

1. Introduction

Ecosystem service (ES) means the environmental conditions and utilities formed and maintained by an ecosystem that support the survival and development of humans [1]. It could be divided into the supply of resources, environmental regulation, cultural entertainment, production support, and other functions [2,3]. Ecosystem service value (ESV) is a valid way to quantitatively assess the magnitude of ES. ESV is directly driven by land use changes caused by human activities [4]. The area of each type of land use, land uses, and patterns of spatial variation could affect ecological processes such as material cycle, energy conversion, biological production, and biodiversity, thereby affecting ESV changes [5,6,7,8]. Resource-based heavy industrial cities are areas where economic and environmental conflicts gather, and how to take into account the protection of the ecological environment while the urban economy is sustainable is one of the important issues to be considered in this region. Strong human activities like open-pit mining, land reclamation, and the construction of domestic and industrial infrastructure could directly change the surface through land occupation and geological disasters, leading to problems such as water and soil loss, vegetation degradation, and biodiversity loss [9,10,11,12]. However, with the global sustainable development strategy and the proposal of carbon peak and carbon neutrality, the global vegetation growth improvement area has reached 18,090,800 km2 from 2010 to 2020, and the area of China alone is as high as 2.065 million km2 [13]. Meanwhile, the government has also actively carried out mine governance and ecological restoration measures for resource-based heavy industry cities, and the restoration area has reached more than 2600 km2 in China. Hence to this, exploring the characteristics of land use pattern evolution caused by human activities has significant guidance for the ecological assessment and eco-environmental protection policy formulation in heavy industrial cities.
Nowadays, the quantitative structure and spatial pattern of land use types are important components in the study of land use change [14,15]. In terms of quantitative structure characteristics, transfer matrix [16,17], single or comprehensive dynamic index of land use [18,19], comprehensive index of land use degree [20], and other methods are applied. However, in practice, the transfer matrix focuses more on the area and quantity structure of transfer-in and transfer-out by types in a single period. The dynamic index of land use could only analyze the one-way conversion process of land types. The comprehensive index of land use degrees ignores the internal transformation among various categories. These methods failed to realize the in-depth mining of land use change information [21,22]. The intensity analysis is a top-down explanatory mathematical framework proposed by Aldwaik et al. and Pontius et al. [23,24] based on the transfer matrix, which sequentially compares the magnitude of the difference between the surveyed change intensity and the uniform intensity (annual change, not absolute change) at the time level, category level, and transition level, to accurately quantify the internal structural change of land use and the two-way transition process between types at continuous periods. After then, Aldwaik et al. [24] applied the intensity analysis to analyze the conversion between land types on Gershm island and compared it with the Markov matrix. It is concluded that intensity analysis could make up for the shortcomings of the Markov matrix in revealing the stability of the transfer process and analyzing the conversion of continuous periods and categories. Meanwhile, in the analysis of the spatial pattern of land use in Longhai County, China, Huang et al. [25] concluded that the intensity analysis could better explain the intensity and relative size of categories at all levels than the single and comprehensive dynamics index of land use. After testing, the intensity analysis is better than the analysis methods mentioned above [22,26,27,28]. Consequently, intensity analysis could dig out more information on land use change.
Costanza et al. [2] proposed the concept of ESV to measure the services output of ecosystems. However, there are some problems in the application of the value coefficient in China, such as the overall ESV being overestimated, the ESV of farmland being underestimated, and the evaluation of some ecosystem services being missing [29,30,31]. Thus Xie et al. [30] established the “Ecological Service Value Equivalent of Ecosystem Unit Area in China” based on expert knowledge methodology, which was applied in the ESV evaluation of internal regions. Considering spatial heterogeneity and regional differences, Xie et al. [32] adopted the value equivalence factor to revise the value of 11 ecosystem service function types in China. On the basis of Xie et al. [30], ESV has been continuously revised to adopt parameters such as biomass factors, social development stage coefficients, the ratio of supply to demand for land area, and climate productivity over the years [33,34,35]. Based on the improvement of the ESV evaluation, the research on ESV evaluation at the national and regional scales [36,37,38], basins [4,39], single ecosystem [36], and single ecosystem service function value [31] has been gradually carried out. Resource-based heavy industry cities are regions with apparent conflicts between humans and land, fragile ecosystems, and the significant reflection of ecological protection and restoration on a regional scale. Therefore, it is urgent to evaluate heavy industry cities’ ESV to determine the impact of human positive and negative ecological behaviors on the regional ecological environment.
Taiyuan is located in the center of the coal mines in Shanxi Province, an industrial base with concentrated energy and heavy chemical industry. Intense human activities (mining, afforestation, ecological restoration, etc.) have changed the quantitative structure and spatial pattern of land use in Taiyuan, which have impacted the natural ecological environment. In this study, we relied on the Landsat remote sensing image data of 2003, 2008, 2013, and 2018 to make land use type maps and applied the intensity analysis method to explain the spatial and temporal change in land use and land type conversion in Taiyuan in the past 16 years. Meanwhile, we revised the "Ecosystem Service Value Per Unit Area Scale" based on climate productivity and characterized the spatial and temporal evolution of ESVs by constructing fishing nets. Moreover, hotspot analysis was combined with a spatial overlay method to explore the response mechanism between LUCC and ESV. This study can provide the scientific basis for land use management, spatial pattern optimization, and ecological governance and protection in heavy industry cities in the new era.

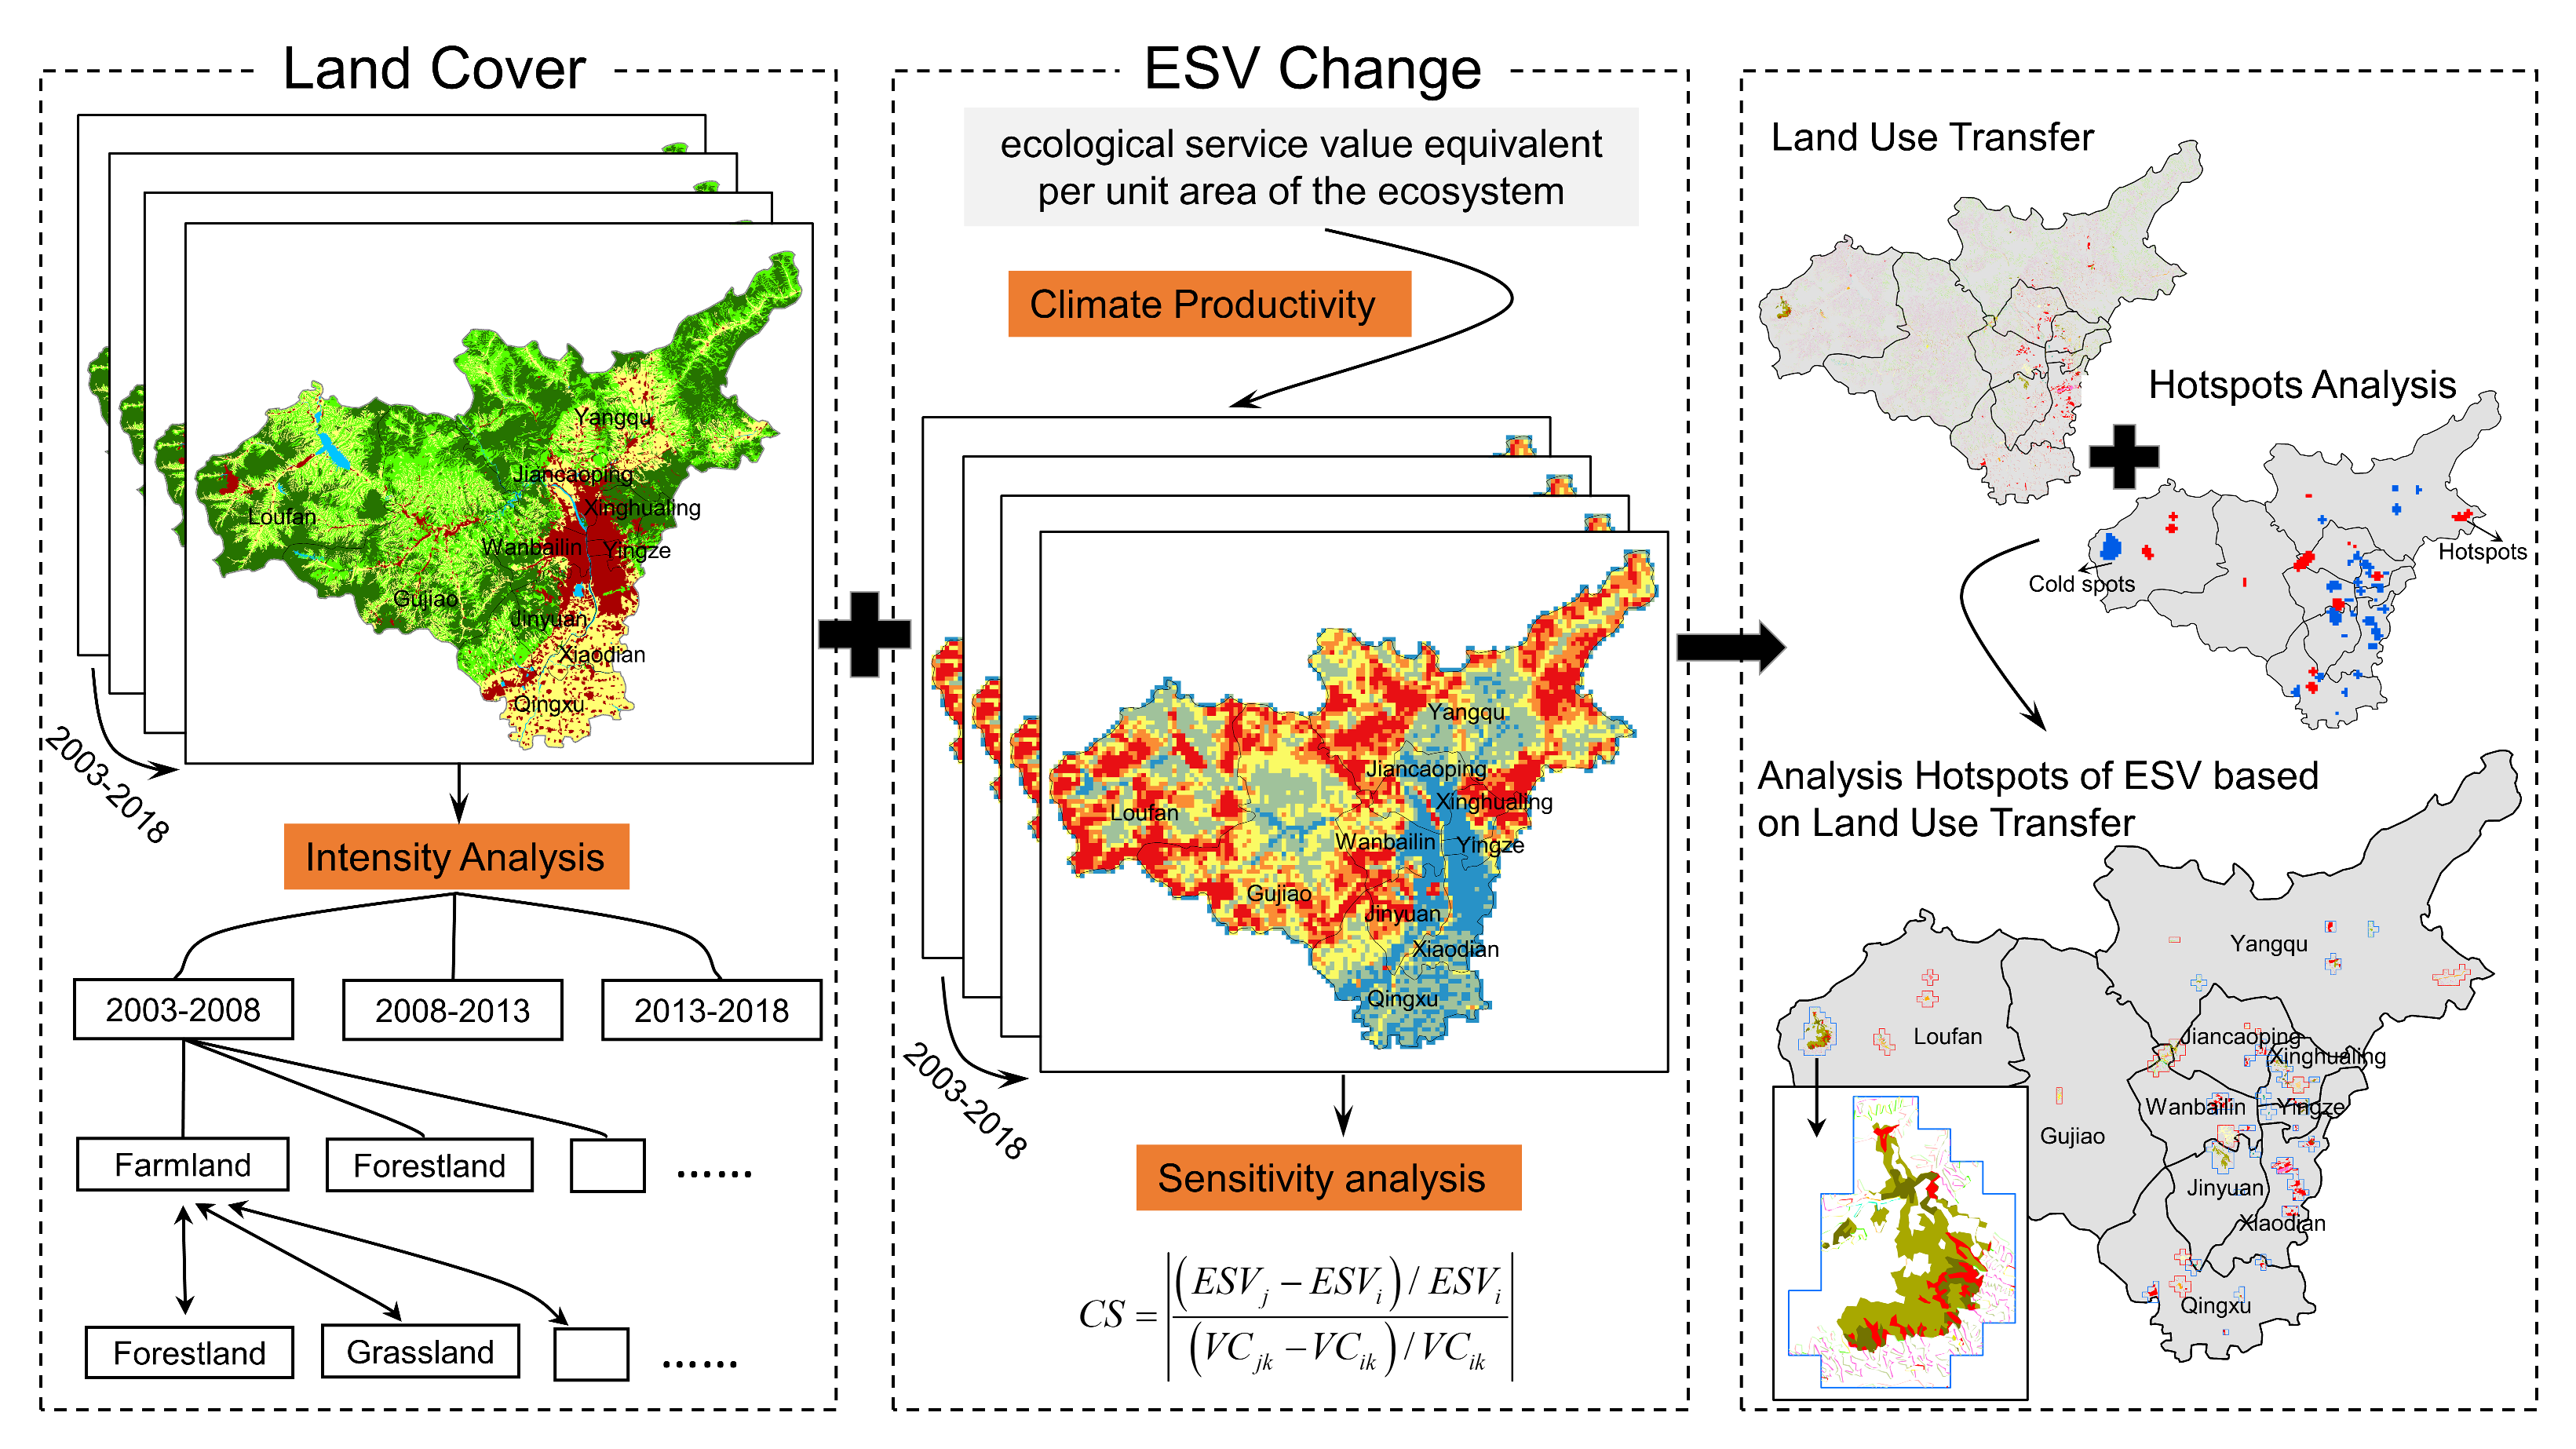
2. Materials and Methods
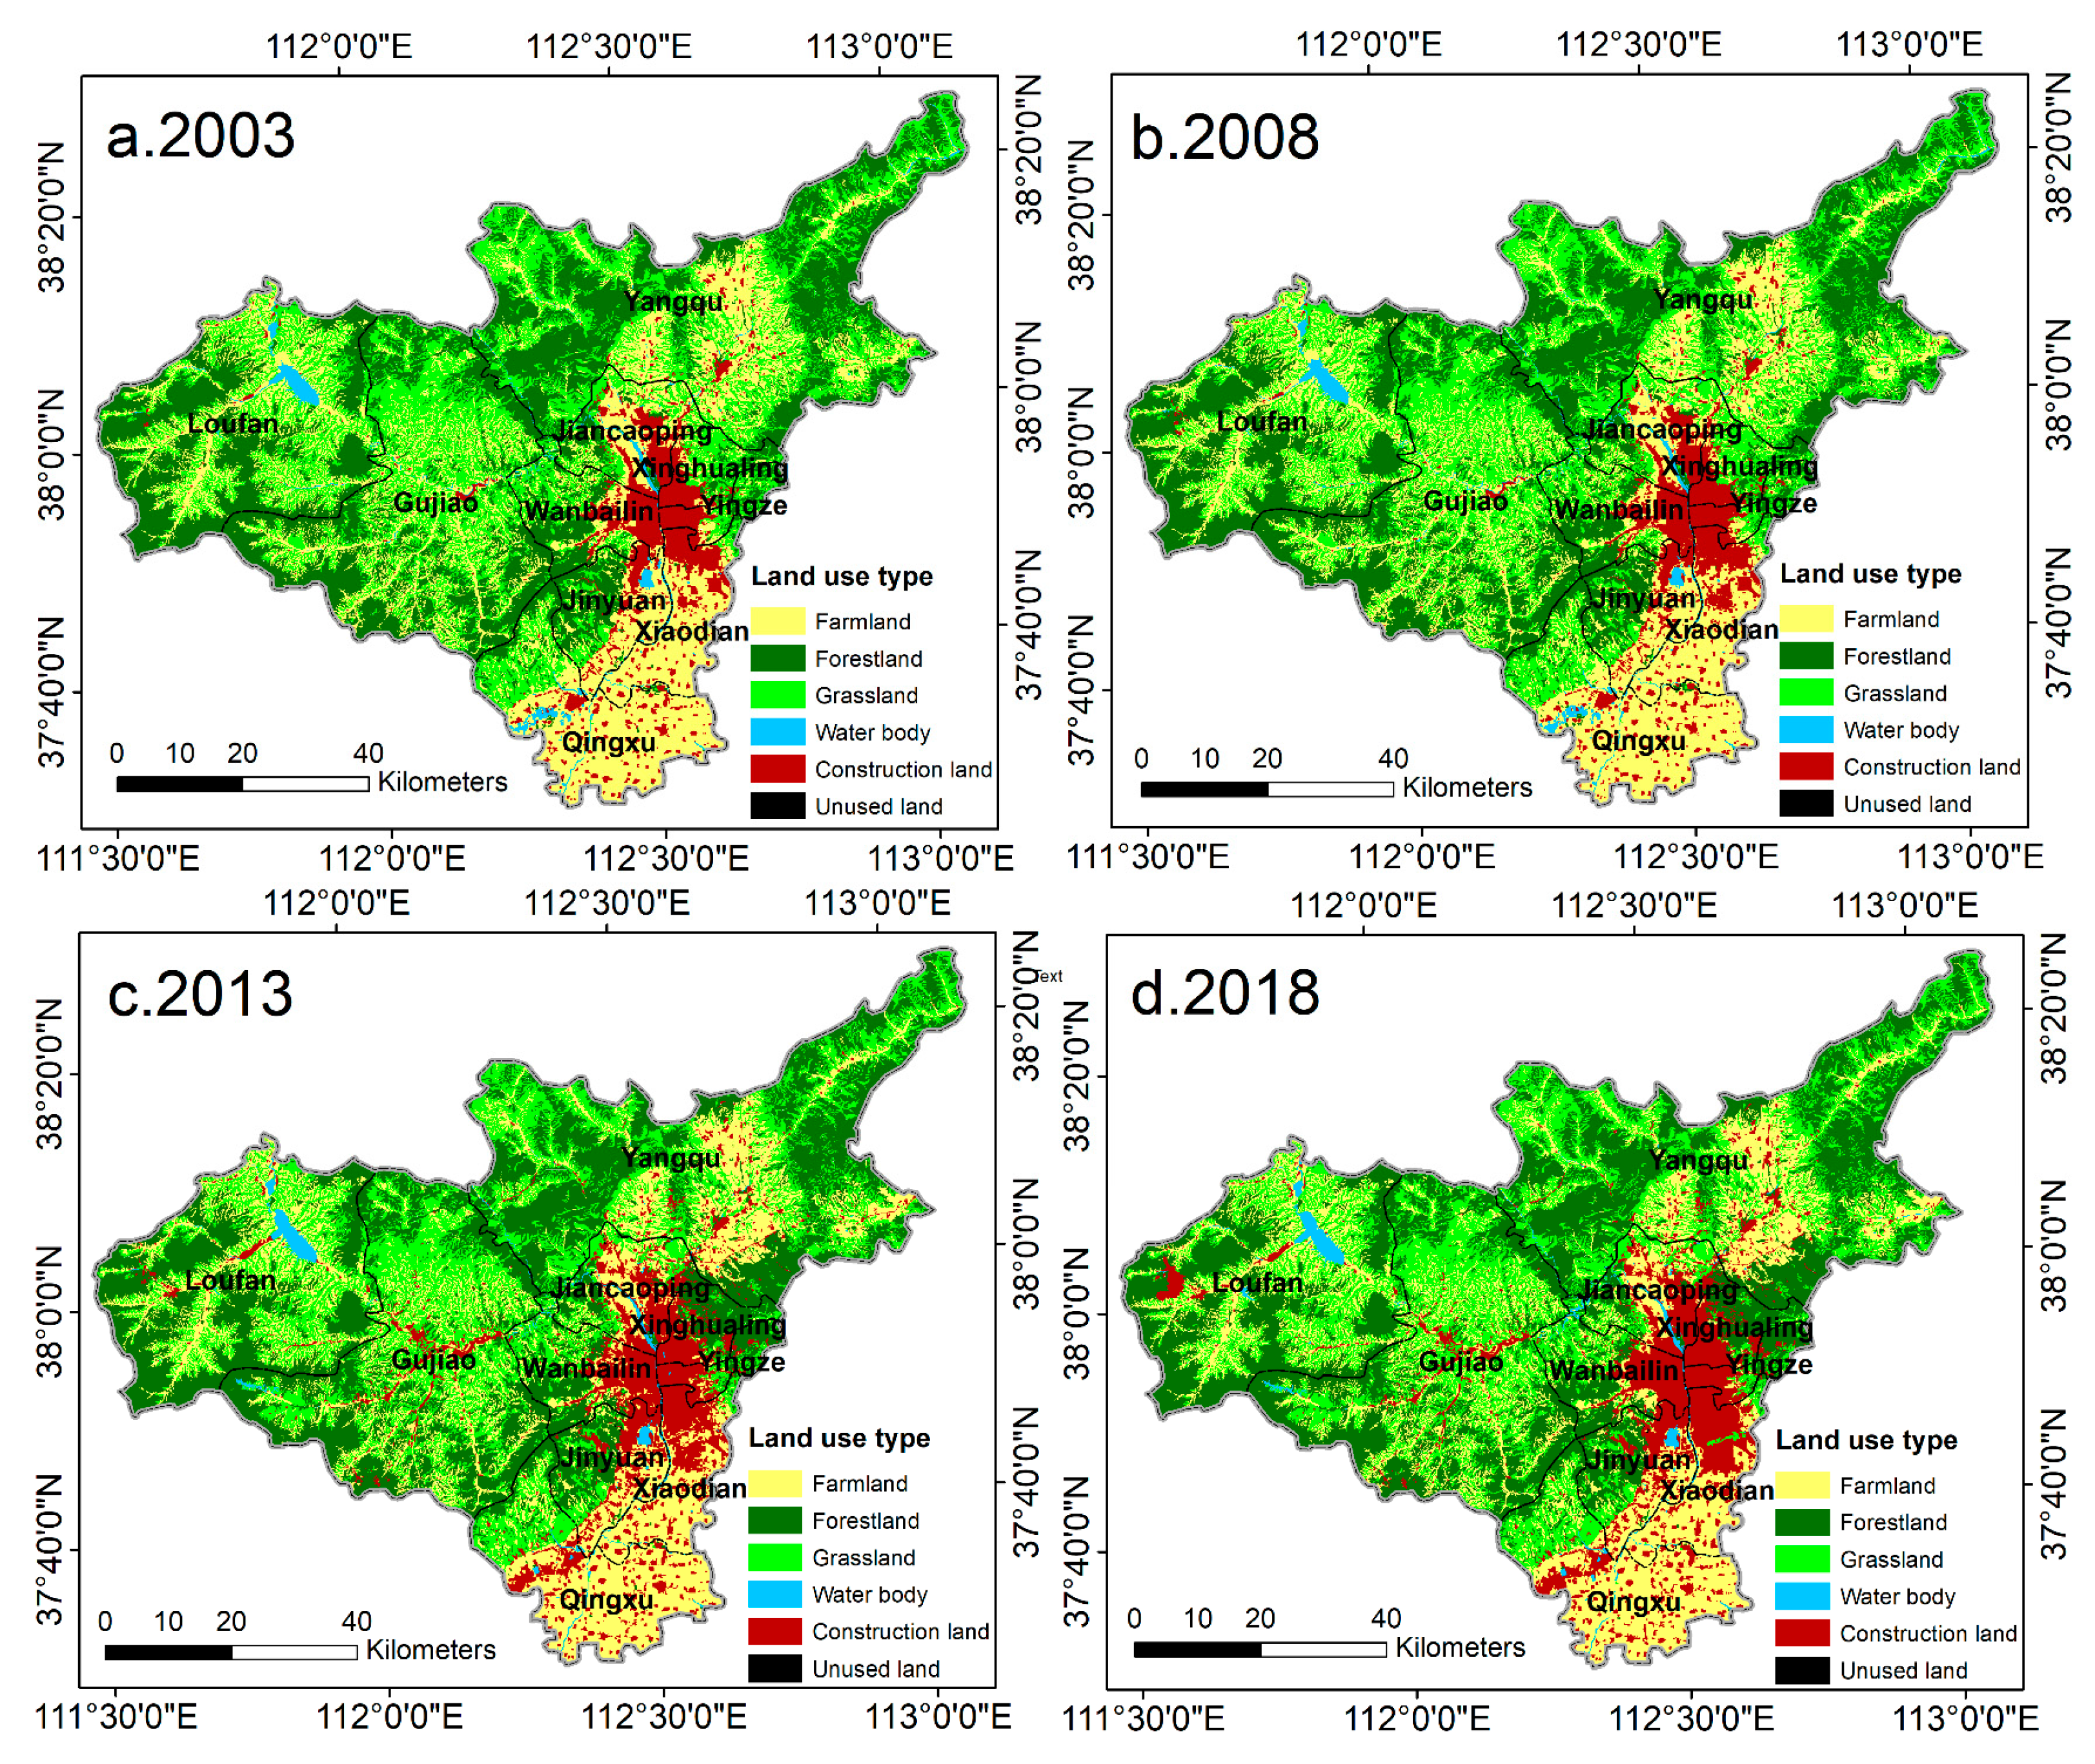
2.1. Study Area

Taiyuan (111°30′–113°09′ E, 37°27′–38°25′ N) is located in the central part of Shanxi Province, covering an area of 6988 km2 (Figure 1). It governs six municipal districts, three counties, and one county-level city, of which six municipal districts are the main urban areas of Taiyuan City. Fenhe River valley plain is located in the middle and south, surrounded by mountains in the west, north, and east. The overall terrain is high in the north and low in the south, in the shape of a dustpan, with an average elevation of about 800 m. Taiyuan has a continental monsoon climate in the north temperate zone. The climate is dry, with low and concentrated precipitation. The Fenhe River, the mainstream of the Yellow River, and the Hutuo River, the Haihe River system, are the two major water systems in Taiyuan. The Fenhe River runs through the whole city from north to south. Taiyuan is rich in coal and iron, among which coal mines are mainly distributed in Dongshan, Xishan, and the northern part of Loufan. With abundant mineral resources, Taiyuan’s heavy industry has developed rapidly, which has promoted the urbanization process of Taiyuan but caused many problems, such as soil erosion, forest vegetation degradation, environmental pollution, etc., at the same time. In recent years, Taiyuan has carried out a series of afforestation, mine ecological restoration, urban greening, and other measures to improve the environment. In 2018, the afforestation area was 17.28 km2, and the green coverage rate in the built-up area reached 42.78% [40]. These data show that the environmental situation has gradually improved.

2.2. Data Sources and Processing

The remote sensing data were collected from the geospatial data cloud platform (http://www.gscloud.cn/, accessed on 21 August 2020). In 2003 and 2008, landsat5 TM digital products were selected for remote sensing images, and in 2013 and 2018, Landsat8 OLI digital products were selected for remote sensing images, which had been systematically corrected for radiation, geometry, and elevation. The fourth phase of image data was processed by GIS software, such as band synthesis, mask extraction, and clipping. The combination of supervised classification and unsupervised classification was applied to classify land use in Taiyuan, and the accuracy of classification results was evaluated by the AOI District method. The overall accuracy of phase 4 image interpretation is 0.95, 0.95, 0.94, and 0.90.
The temperature and precipitation data of Taiyuan are from the daily data set of surface climate data in China provided (V3.0) by the National Meteorological Information Center of the China Meteorological Administration (https://data.cma.cn/, accessed on 21 October 2021). For the date and month of partial data vacancy, the data of the same site in the same period in the previous and next two years of the year were applied, and the average value was taken for interpolation.

2.3. Intensity Analysis

The method of intensity analysis was first introduced and applied by Aldwaik et al. [24]. Based on the cross matrix, it explains changes in the intensity and area of land use at time points at a certain location from the levels of time, category, and transition. The interval level explains the rate of land use change in different time periods, the category level elucidates the changes in loss and gain of different land use types, and the transition level indicates the inter-conversion between land use categories. The program is encapsulated in Excel 2007 software (https://sites.google.com/site/intensityanalysis/, accessed on 15 October 2021).
The C t i j variable is used in all three levels of strength analysis and C t i j is a number of pixels that transition from category i at a time Y t to category j at a time Y t + 1 .
At the interval level, S t (the annual change percentage during each time interval) and U (the uniform annual change percentage) were compared to reflect which time interval the land use change is rapid ( S t > U ) or slow ( S t < U ) at all time intervals.
S t = { j = 1 J [ ( i = 1 J C t i j ) C t j j ] } / [ j = 1 J ( i = 1 J C t i j ) ] Y t + 1 Y t × 100 %
U = t = 1 T 1 { j = 1 J [ ( i = 1 J C t i j ) C t j j ] } / [ j = 1 J ( i = 1 J C t i j ) ] Y T Y 1 × 100 %
At the category level, Equation (1) is defined as the uniform intensity at each time interval. G t j (the intensity of the annual gain during a time interval [ Y t , Y t + 1 ] ) and L t i (the intensity of the annual loss during a time interval [ Y t , Y t + 1 ] ) for each category are compared with Equation (1) to determine how active the change of the category is at each time interval.
G t j = [ ( i = 1 J C t i j ) C t j j ] / ( Y t + 1 Y t ) i = 1 J C t i j × 100 %
L t i = [ ( j = 1 J C t i j ) C t i i ] / ( Y t + 1 Y t ) j = 1 J C t i j × 100 %
The analysis on the transition level reflects whether the transition between different land use types is strong in a certain time interval. Equations (5) and (6) correspond to the transition-in pattern for the category n , and Equations (7) and (8) correspond to the transition-out pattern for the category m . When the annual intensity of transition R t i n exceeds the uniform intensity W t n , it means that the increase of category n is due to the occupation of the category i . On the contrary, it means that the increase of category n avoids the occupation of the category i . On the transition-out pattern of the category m Q t m j m , Q t m j and V t m represents the annual intensity of transition and uniform intensity during the time interval [ Y t , Y t + 1 ] , respectively; moreover, the analysis of the transition-out pattern is the same as that on the transition-in pattern.
R t i n = C t i n / ( Y t + 1 Y t ) j = 1 J C t i j × 100 %
W t n = [ ( i = 1 J C t i n ) C t n n ] / ( Y t + 1 Y t ) j = 1 J [ ( i = 1 J C t i j ) C t n j ] × 100 %
Q t m j = C t m j / ( Y t + 1 Y t ) i = 1 J C t i j × 100 %
V t m = [ ( j = 1 J C t m j ) C t m m ] / ( Y t + 1 Y t ) i = 1 J [ ( j = 1 J C t i j ) C t i m ] × 100 %

2.4. Ecosystem Services Value Calculation

The size of biomass reflects the differences in ecosystem service functions to some extent. Climate productivity reflects the plant growth rate and the degree of biomass accommodation by the environment under certain climatic and soil conditions and is an important factor affecting the size of biomass, and the differences in regional environmental conditions of the ecosystem itself also directly affect the type and size of the service function [41,42]. Therefore, based on the research of Xie et al. [32], we adopted two factors of temperature and precipitation in calculating climate productivity to conduct the regional revision for the ecological service value equivalent [34,35]. Moreover, the six types of land use in this paper were sorted as each ecosystem type, among which farmland corresponds to farmland, forestland corresponds to forest, grassland corresponds to grassland, and water body represents the average value of wetlands, rivers, and lakes, unused land corresponds to the desert, and construction land was not taken into account [2]. The calculation process is as follows:
L = 3000 + 25 t + 0.05 t 3
V = 1.05 r / 1 + ( 1.05 r / L + 1 ) 2
N P P = 30 × [ 1 e 0.0000659 ( V 20 ) ]
S k = N P P a / N P P q
E a = E a × S k
E S V = i n A i × E a
In this formula, t is the annual average temperature, °C; r is annual average precipitation, mm; L is the annual average evaporation, mm; V is actual annual evaporation, mm; N P P is the climate productivity; S k is the coefficient of climate difference; N P P a is the climate productivity in the study area; N P P q is the national climate productivity; E a is the economic value of unit equivalent factor in the study area, RMB·hm−2; E a is the economic value of the national unit equivalent factor, RMB·hm−2; E S V is the value of ecosystem services in the study area, RMB; i is the type of land use; n is the number of types; A i is the area of the land type i .
After calculation, the climate difference coefficients S k of Taiyuan in 2003, 2008, 2013 and 2018 are 0.64, 0.41, 0.57 and 0.41. Then, the research team took the average value of 0.51 as the climate productivity in 2003–2018 to obtain the economic value of the unit ecosystem, service equivalent factor in Taiyuan is 229.041 RMB·hm−2. Thus, Taiyuan’s ecosystem service value per unit area is obtained (Table 1).

2.5. Sensitivity Analysis

In economics, elasticity is a measure of how buyers and sellers react to changes in market conditions [43]. The elasticity in economics was wielded to quantify the sensitivity of regional ESV to each 1% change in the coefficient of service value of different ecosystem types, which is defined as the sensitivity index (CS). The calculation formula is as follows:
C S = | ( E S V j E S V i ) / E S V i ( V C j k V C i k ) / V C i k |
Among them, V C i k V C i j , V C i k and V C i j are the ecosystem service value coefficient before and after the adjustment of land types k ; E S V i and E S V j are before and after the adjustment of the coefficient of value. When CS > 1, it means that ESV is elastic to CS; if CS is less than 1, it expresses that ESV lacks elasticity to CS, which means that the value coefficient changes in the same direction as the ecosystem service value. Meanwhile, if the value coefficient changes by 1%, the change of ecosystem service value will be less than 1%, then the result is credible.

3. Results

3.1. Analysis of Spatio-Temporal Characteristics of Land Use

From 2003 to 2018, the farmland, grassland, water body, and unused land both decreased in Taiyuan, while the area of forestland and construction land increased. Among these lands, the reduction rate of farmland area was the largest, 0.12%, and the increase rate of construction land area was the most prominent, 0.71%.
The construction land of Taiyuan is mainly concentrated in the east. From 2003 to 2018, it continued to expand to the periphery. However, due to the limitation of terrain, its expansion is mainly along the river valley to the south to occupy the area of farmland and water body (Figure 2). The northern and western regions are mountains and hilly, mainly grassland and woodland. In addition, the forestland area of Xinghualing District had a significant increase from 2003 to 2018, primarily as a result of the greening and forestry construction area of the East and West Mountains, and it belongs to the security control area of ecological environment in the overall land use planning of Taiyuan (2006–2020). The spatial pattern of land use in Taiyuan is consistent with its natural characteristics, such as topography, topography, and hydrology [44].

3.2. Analysis of Spatio-Temporal Characteristics of Land Use

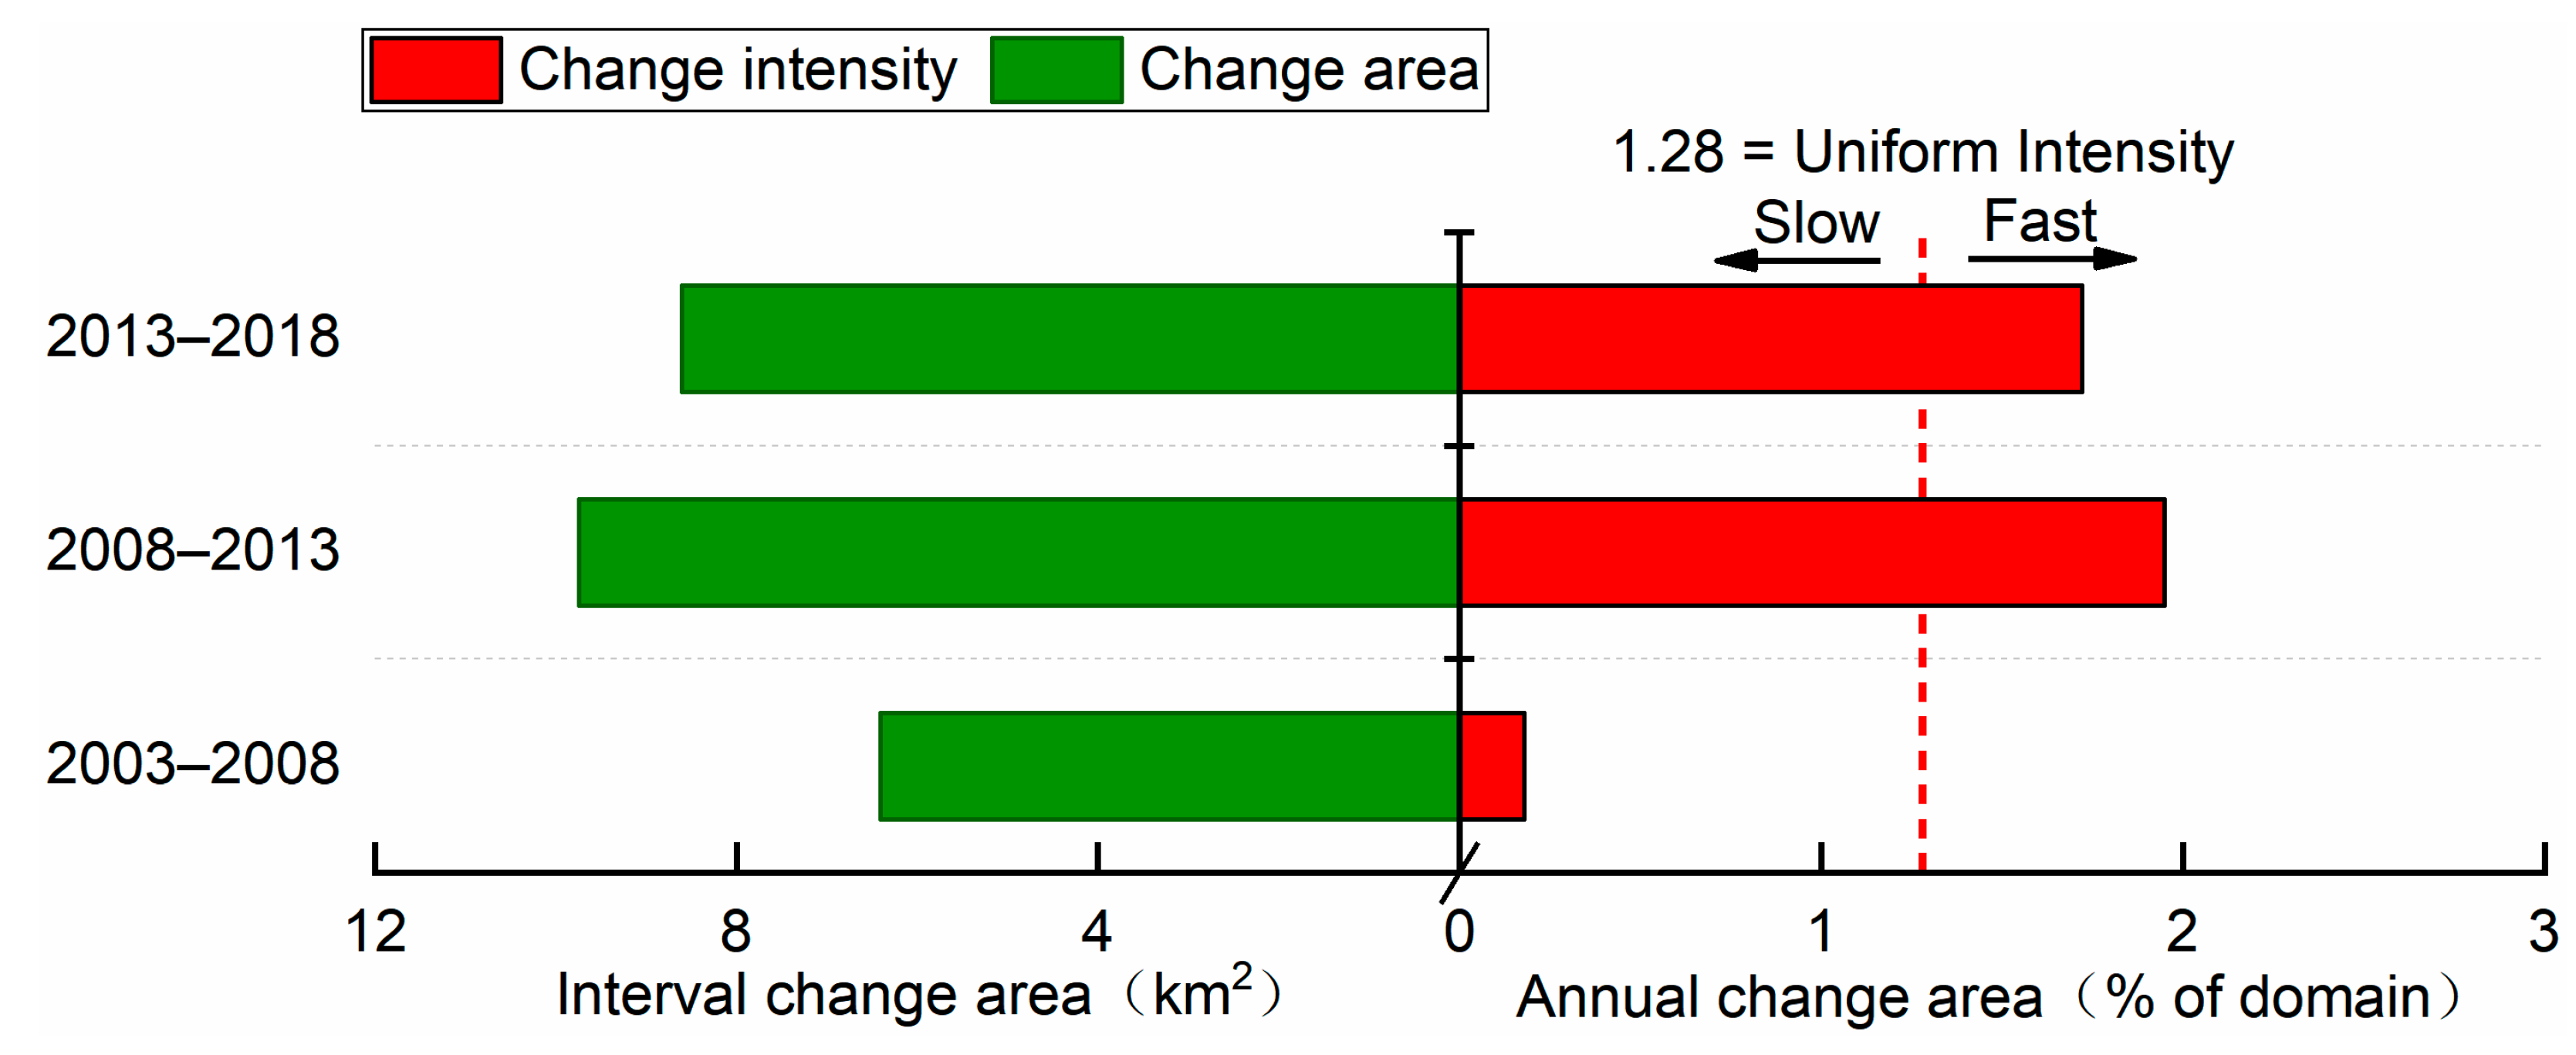
3.2.1. Interval Level

The rapid changes in land use were mainly focused on the two periods of 2008–2013 and 2013–2018, with the uniform annual changing areas accounting for 1.95% and 1.72% of the study area, respectively, which are greater than the average intensity of 1.28%, illustrating that Taiyuan is in a period of rapid development in two intervals (Figure 3). However, the average annual changing areas from 2003 to 2018 accounted for only 0.18% of the study area, which was a slowly increasing trend. The economic development and urban expansion of Taiyuan were dilatory and in the early stage of development.

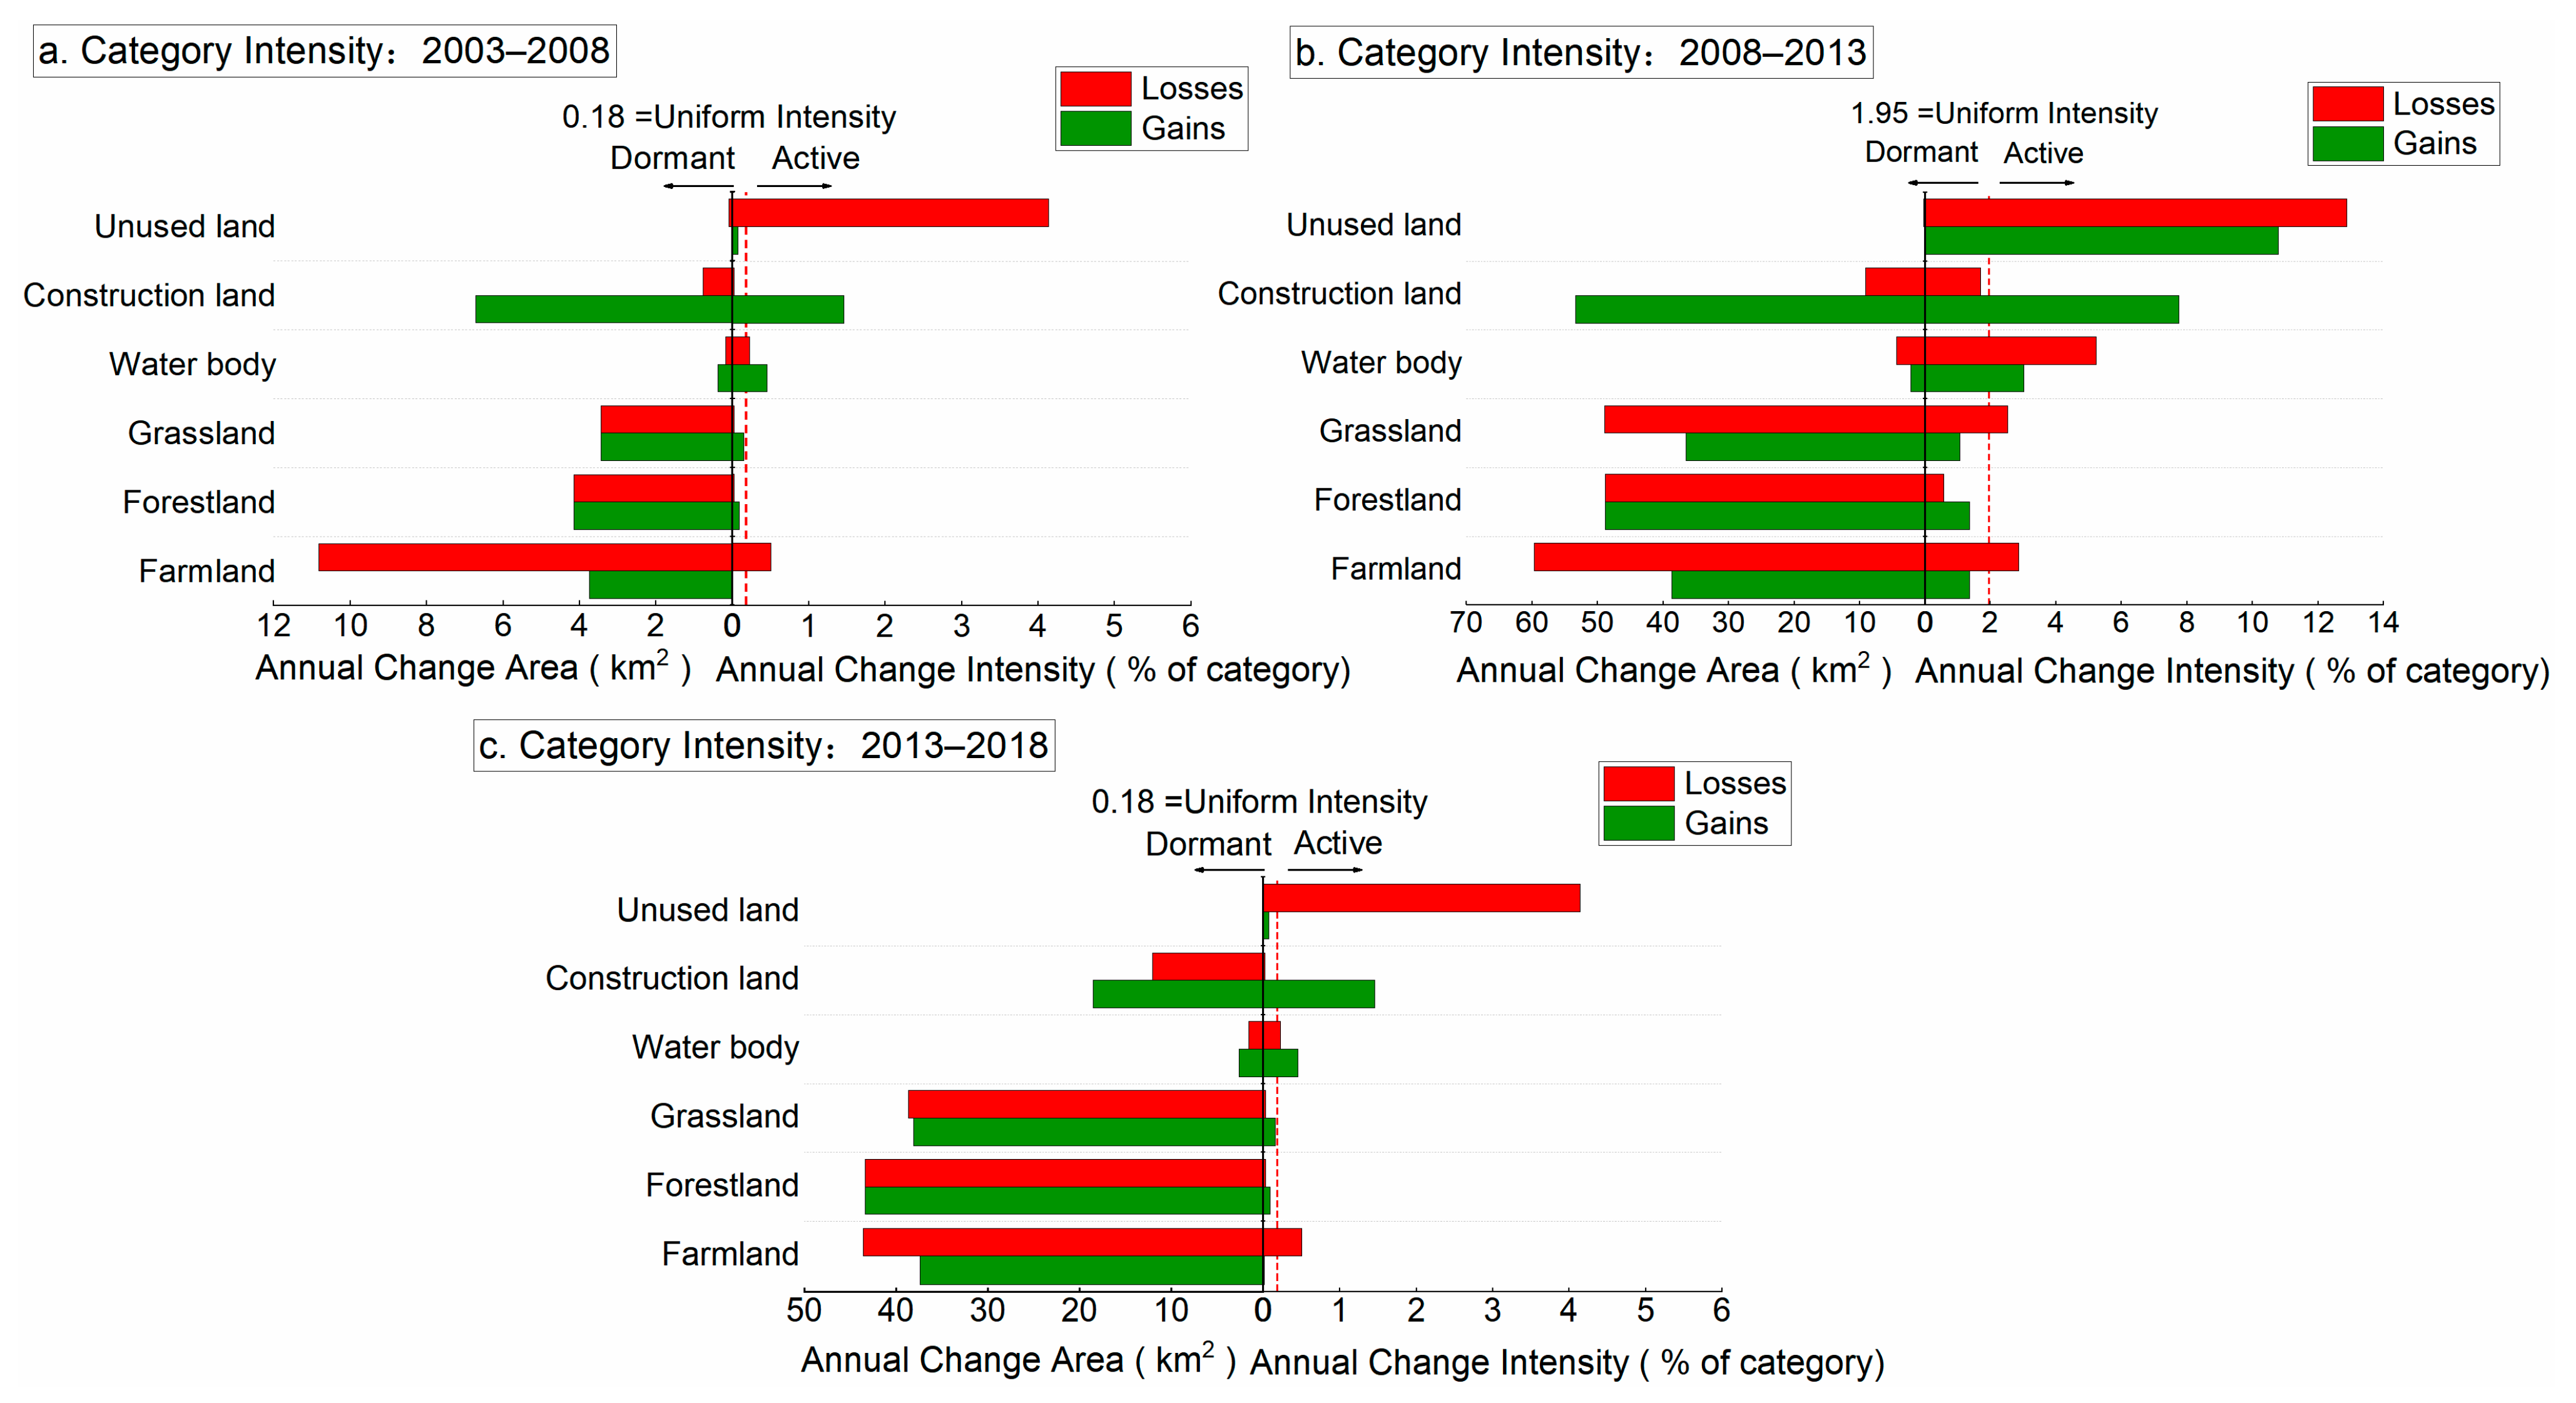
3.2.2. Category Level

The category hierarchy further explains the interval level (Figure 4). From 2003 to 2008, except for unused land (small base of unused land area, large fluctuation in intensity), the loss and gain intensity of each type were slight (Figure 4a). Among them, the loss intensity of unused land and farmland exceeds the average intensity, and farmland is the type of land with the largest loss (right side of Figure 4a), while the gain intensity of construction land and water bodies exceeds the average intensity, but the change is relatively small.
Compared with the period from 2003 to 2008 (Figure 4a), the intensity and area of the transformation of each land type in Taiyuan changed dramatically from 2008 to 2018 (Figure 4b,c), and the urbanization process began to accelerate gradually. From 2008 to 2018, the gain intensity of construction land exceeded the average change intensity and was greater than the loss intensity, and the area continued to increase. The loss intensity of farmland and grassland was more significant than the gain intensity from 2008 to 2018, and the area continued to decrease. However, the imbalance difference in gain and loss of each type mainly occurred in the periods from 2008 to 2013. From 2013–2018, only two types of land were concentrated, construction land and farmland. The overall changes in the number of land types tended to balance, showing a spatial transfer. From 2003 to 2018, the loss intensity of farmland and unused land and the gain intensity of construction land and water body were in excess of uniform intensity, which fit with the definition of stability [22,45].

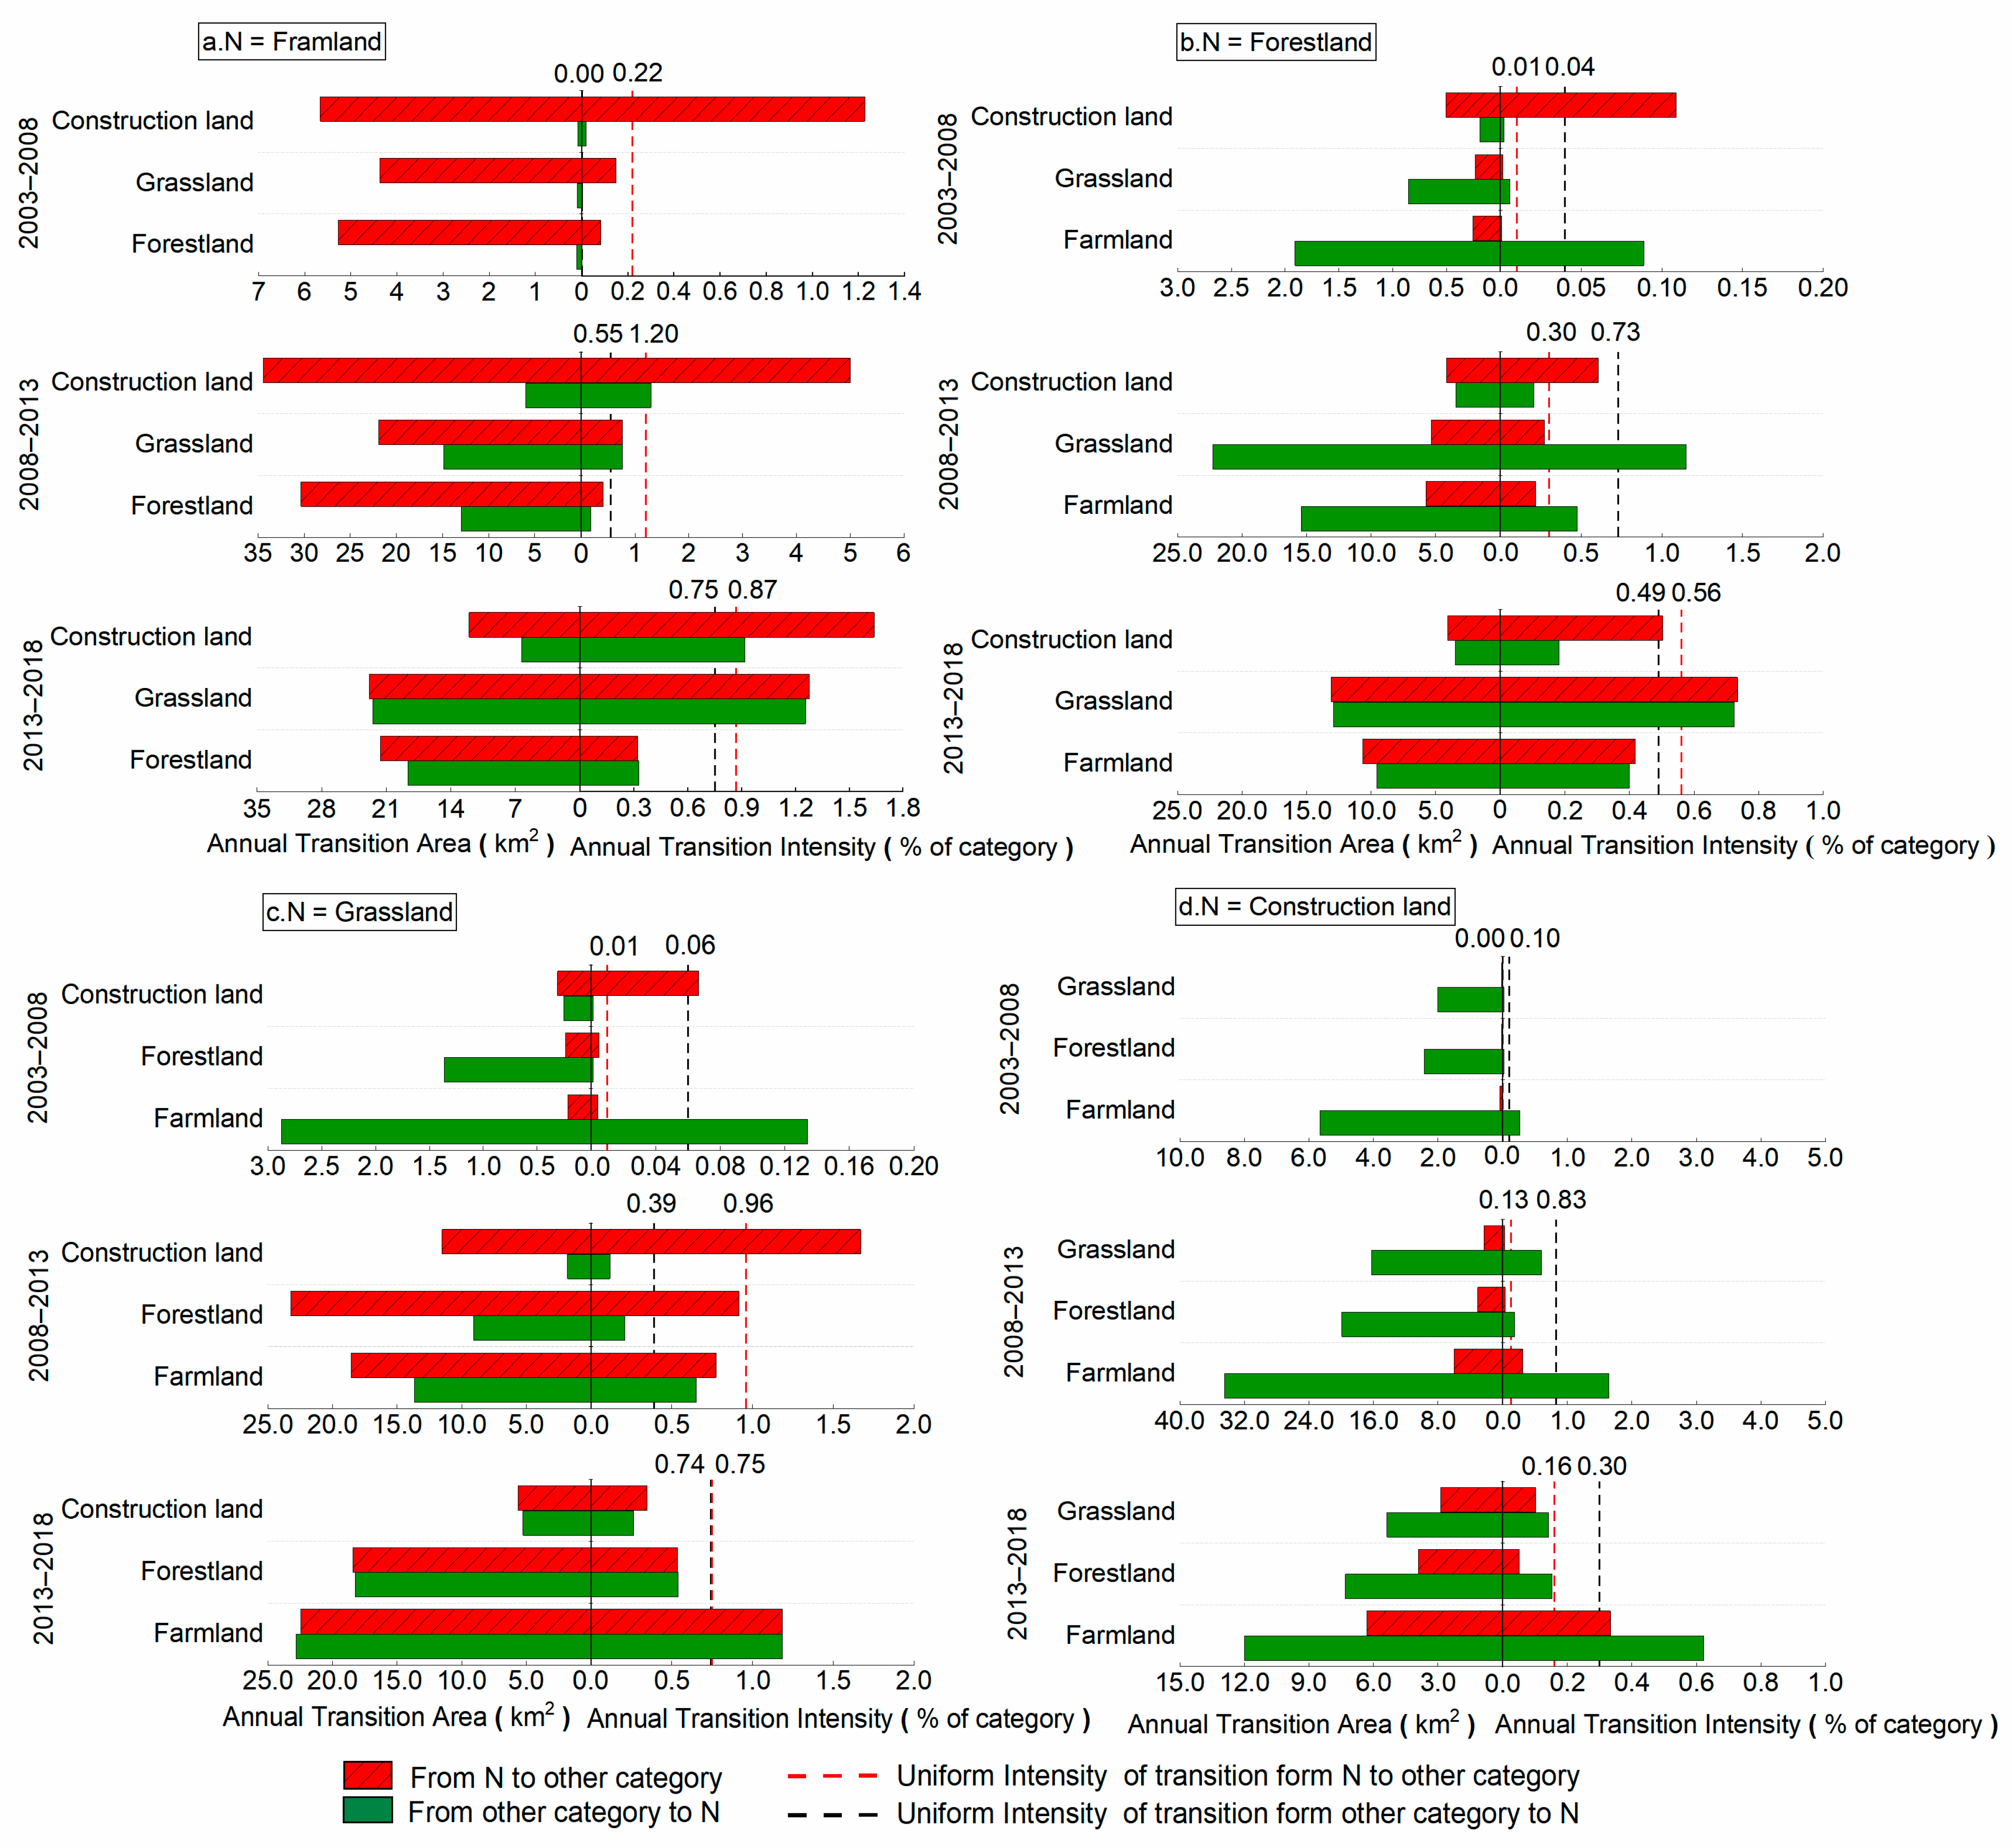
3.2.3. Transition Level

Due to the small proportion of unused land and water body, its changes have little impact on the overall pattern of land use, so only farmland, forestland, grassland, and construction land are analyzed at the transition level.
The intensity that farmland transformed into construction land in three periods was above the uniform intensity, and the stable transformation reached the largest, with a transition area of 28.47 km2 (Figure 5a) in 2008–2013. In 2003–2008 and 2008–2013, farmland and grassland were the main sources of the increase in forestland, while from 2013 to 2018, there was a small transfer from farmland, grassland, and construction land to forestland (Figure 5b), which resulted from the grain-for-green policy, the implementation of forestry ecological construction, and the further consolidation of future achievements. From 2003–2008, the increased area of grassland stemmed from land. In the same period, the intensity of grassland transfer to construction land overtook the average intensity. From 2013–2018, although there was an area conversion between land types, the area remained relatively stable (Figure 5c). In the whole period, construction land was mainly transferred from various land types, and farmland was the main source, but the average reduction intensity in each period gradually enhanced (from 0 to 0.13 to 0.16) (Figure 5d).
The transfer of various land types in Taiyuan mainly occurred from 2008 to 2013, while the conversion of land types from 2003 to 2008 behaved an evident one-way increase (construction land) or decrease (farmland) in a certain land type. Moreover, two-way transitions among forestland, grassland, and farmland were gradually flat from 2013 to 2018 because 2003–2008 is the initial stage of urban development, and urban development relies solely on the increase of construction land. From 2013 to 2018, the urban development of Taiyuan was gradually stable, the construction land area was charged, and the policy of Farmland Protection, ecological environment construction, and the adjustment of land layout optimized the urban spatial pattern step by step.

3.3. Analysis of Changes in ESV

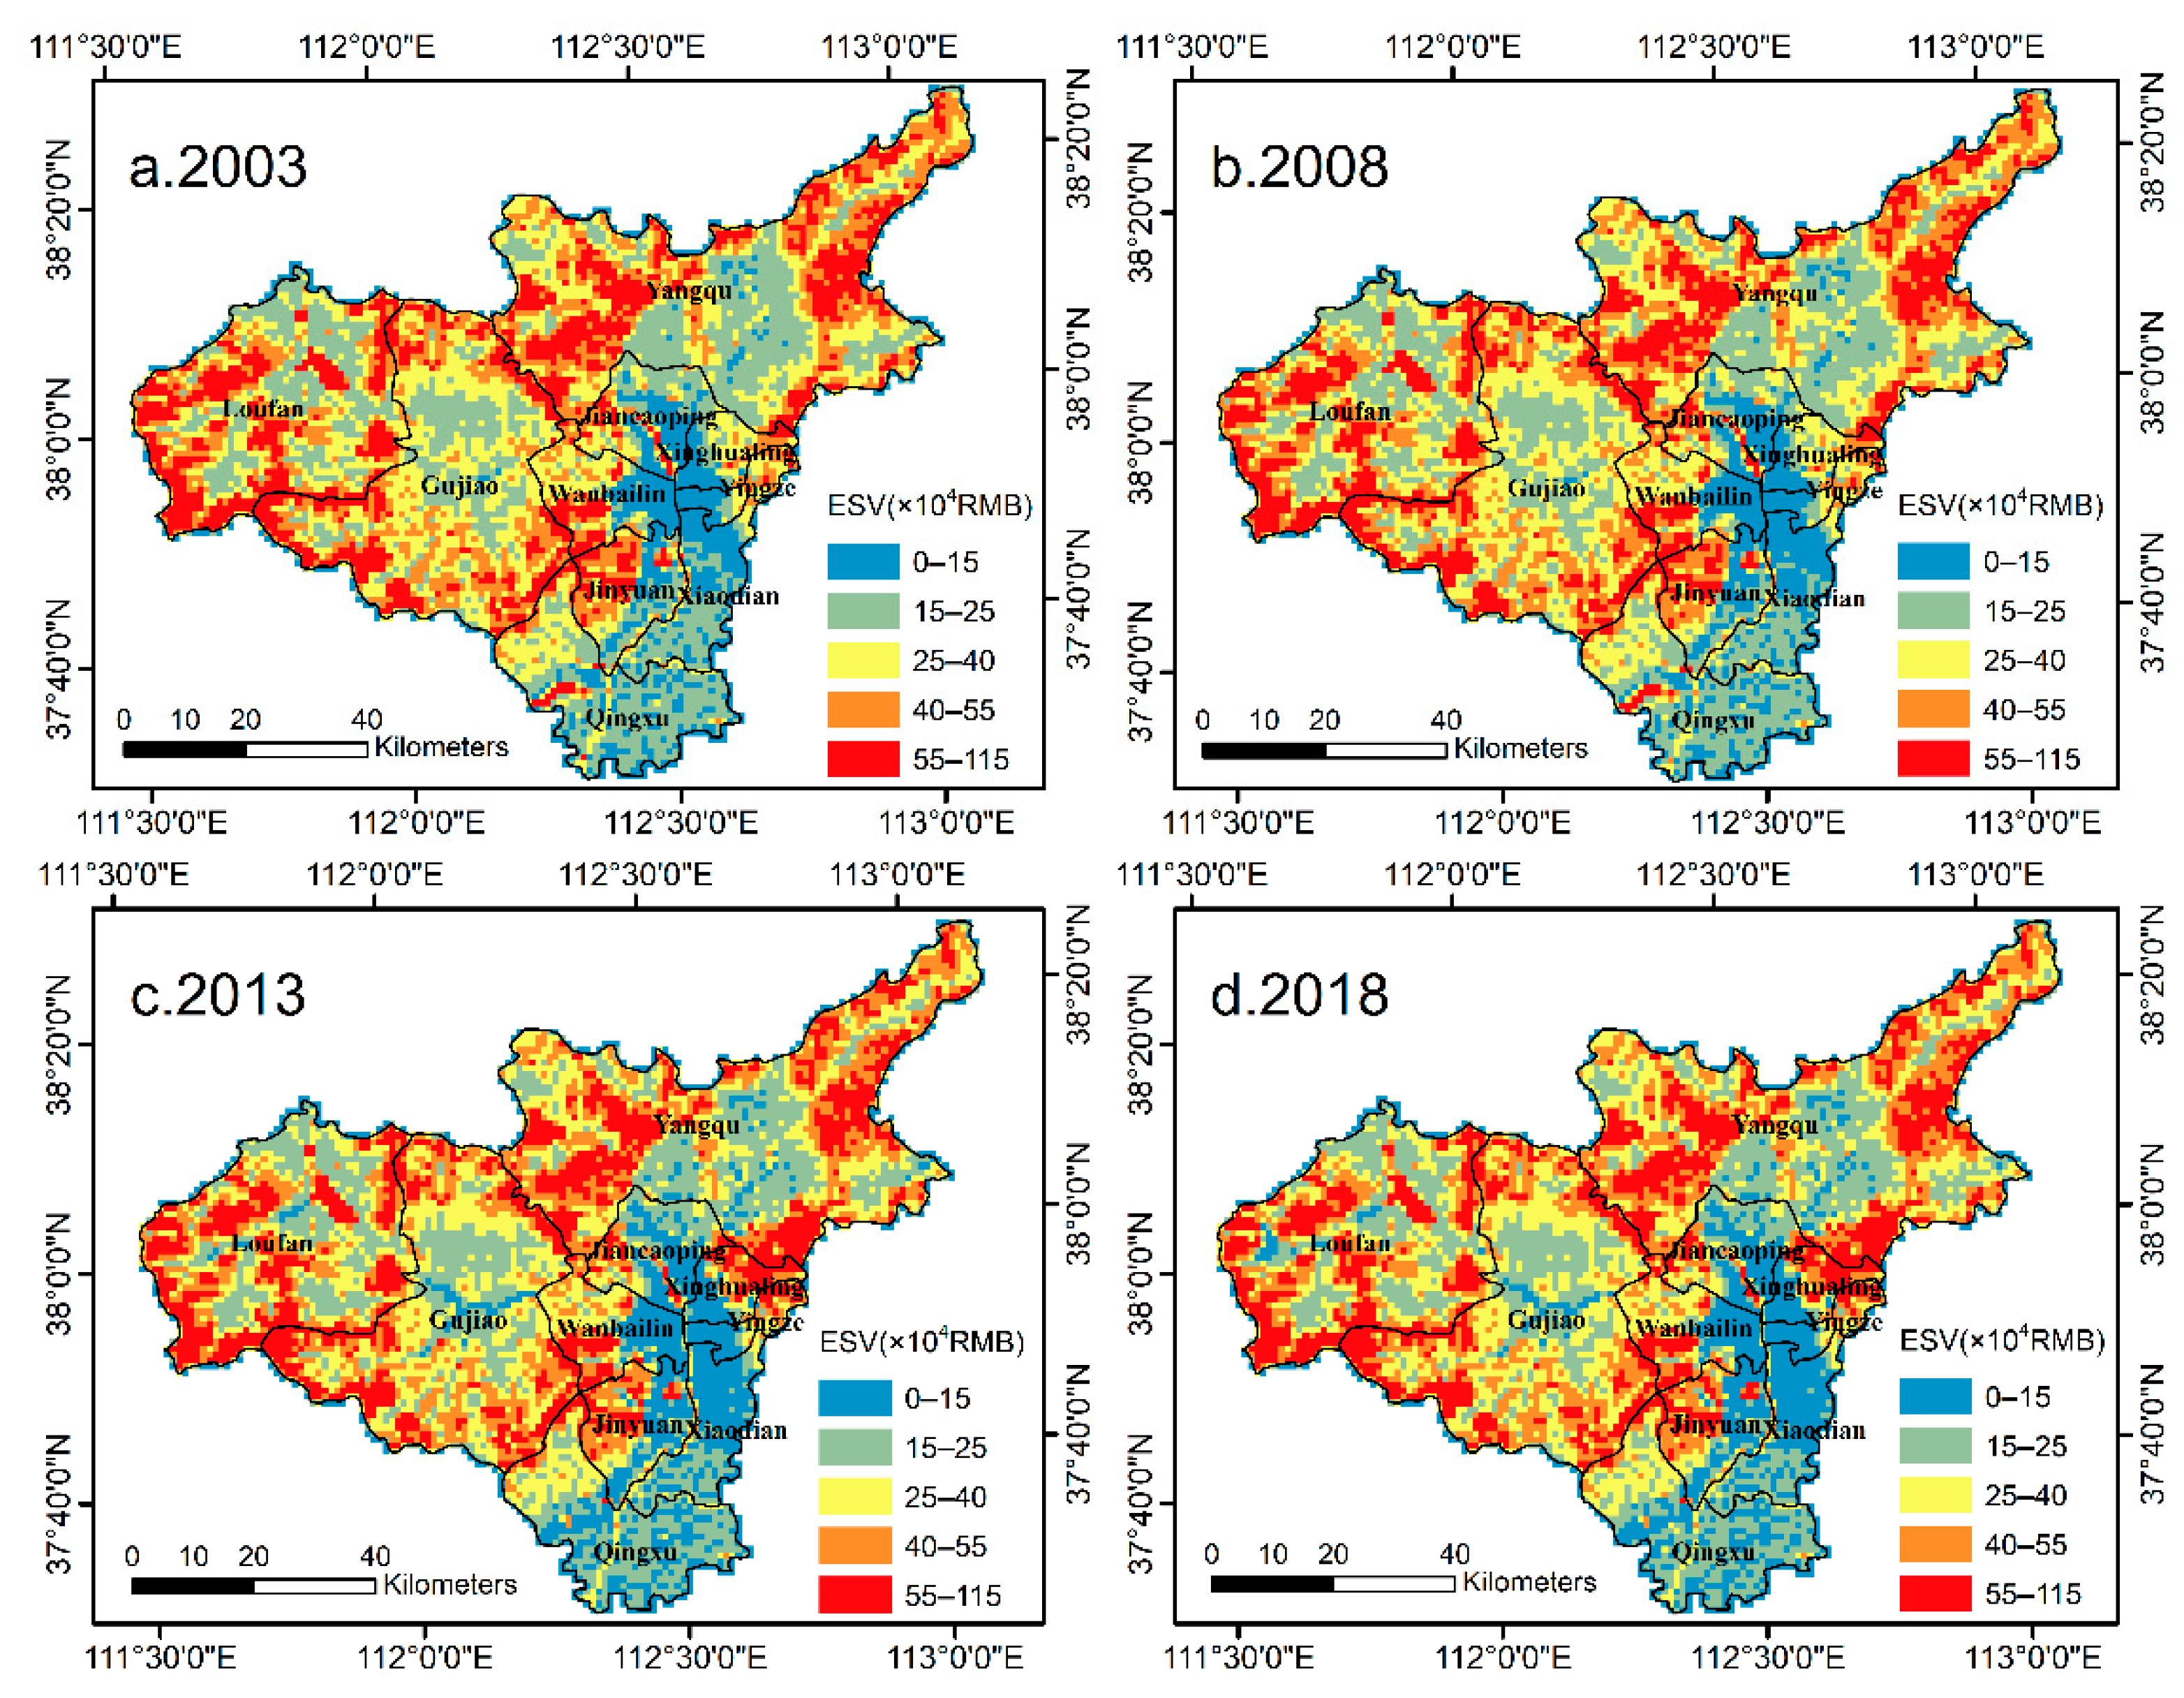
3.3.1. The Spatial-Temporal Pattern of ESV

The total ESV of Taiyuan in 2003, 2008, 2013, and 2018 was RMB 24.94 billion, RMB 24.93 billion, RMB 24.74 billion, and RMB 24.65 billion, respectively, presenting a steady decline. The period of significant change was 2008–2013. From the perspective of land use types, only the ESV of forestland showed an upward trend, and the ESV of other land use types generally declined from 2003 to 2018, mainly due to the loss of farmland, grassland, water body, unused land and other land aroused by the increase of construction land. The ESV of forestland contributes the most to the overall ESV of Taiyuan. In 2018, the ESV of forestland accounted for 63.06% of the total ESV, followed by grassland and farmland.
In combination with the spatial comparability and visualization effect of ESV, researchers selected the grid of 1 × 1 km to figure the sum of ESV of each land type in the grid, which is the spatial distribution of ESV (Figure 6). The low-value zones are mainly located in the Fenhe Valley, with flat terrain. It is the main urban area of Taiyuan, which mainly consists of construction land and farmland. The high-value zones are distributed in mountains and hilly regions in the west and north, and the land types are mainly forestland and grassland. Due to the difference in ESV of various land types, the spatial trend of ESV in Taiyuan is roughly consistent with the distribution of ESV in a single grid, demonstrating that the ESV of grids with mixed land types is transitory in space.
From 2003 to 2008, the minor change in ESV of Taiyuan showed no significant regional spatial difference, and the conversion intensity between land uses was also tiny during this period. In the same term, due to the increase of forestland area in Xinghualing District and Yangqu County, the ESV in Xinghualing District and the east of Yangqu County increased. The forestland area in the two counties increased by 1396.31 km2 and 649.00 km2. Otherwise, in the east of Qingxu County and the center of Gujiao County, there is an obvious transition from the high-value zone to the low-value zone. From 2013 to 2018, the area of construction land in Taiyuan increased by 43.16 km2, which lowered its overall ESV. Meanwhile, the increase in construction land area (303.89 km2 from 2003 to 2018) was an important factor in the decline of ESV (RMB 28.57 million from 2003 to 2018).

3.3.2. Sensitivity Analysis

We adjusted the ESV coefficient of each land type in Taiyuan by 50% up and down. The sensitivity index of the ESV to the values coefficient of Taiyuan in four years is less than (Table 2), indicating that the ESV of Taiyuan is inelastic for value change. Furthermore, the research results are reliable. In addition, the CS of farmland, grassland, and water bodies showed a decreasing trend as a whole. Meanwhile, the CS value of forestland gradually increased and was the highest in all years, which was closely associated with the large proportion of forestland and annual growth in the area in Taiyuan. In 2018, the CS value of the forestland in Taiyuan was 0.631, stating that the ESV in the study area increased by 0.631 percentage points with the 1% change in the ESC coefficient of the forestland.

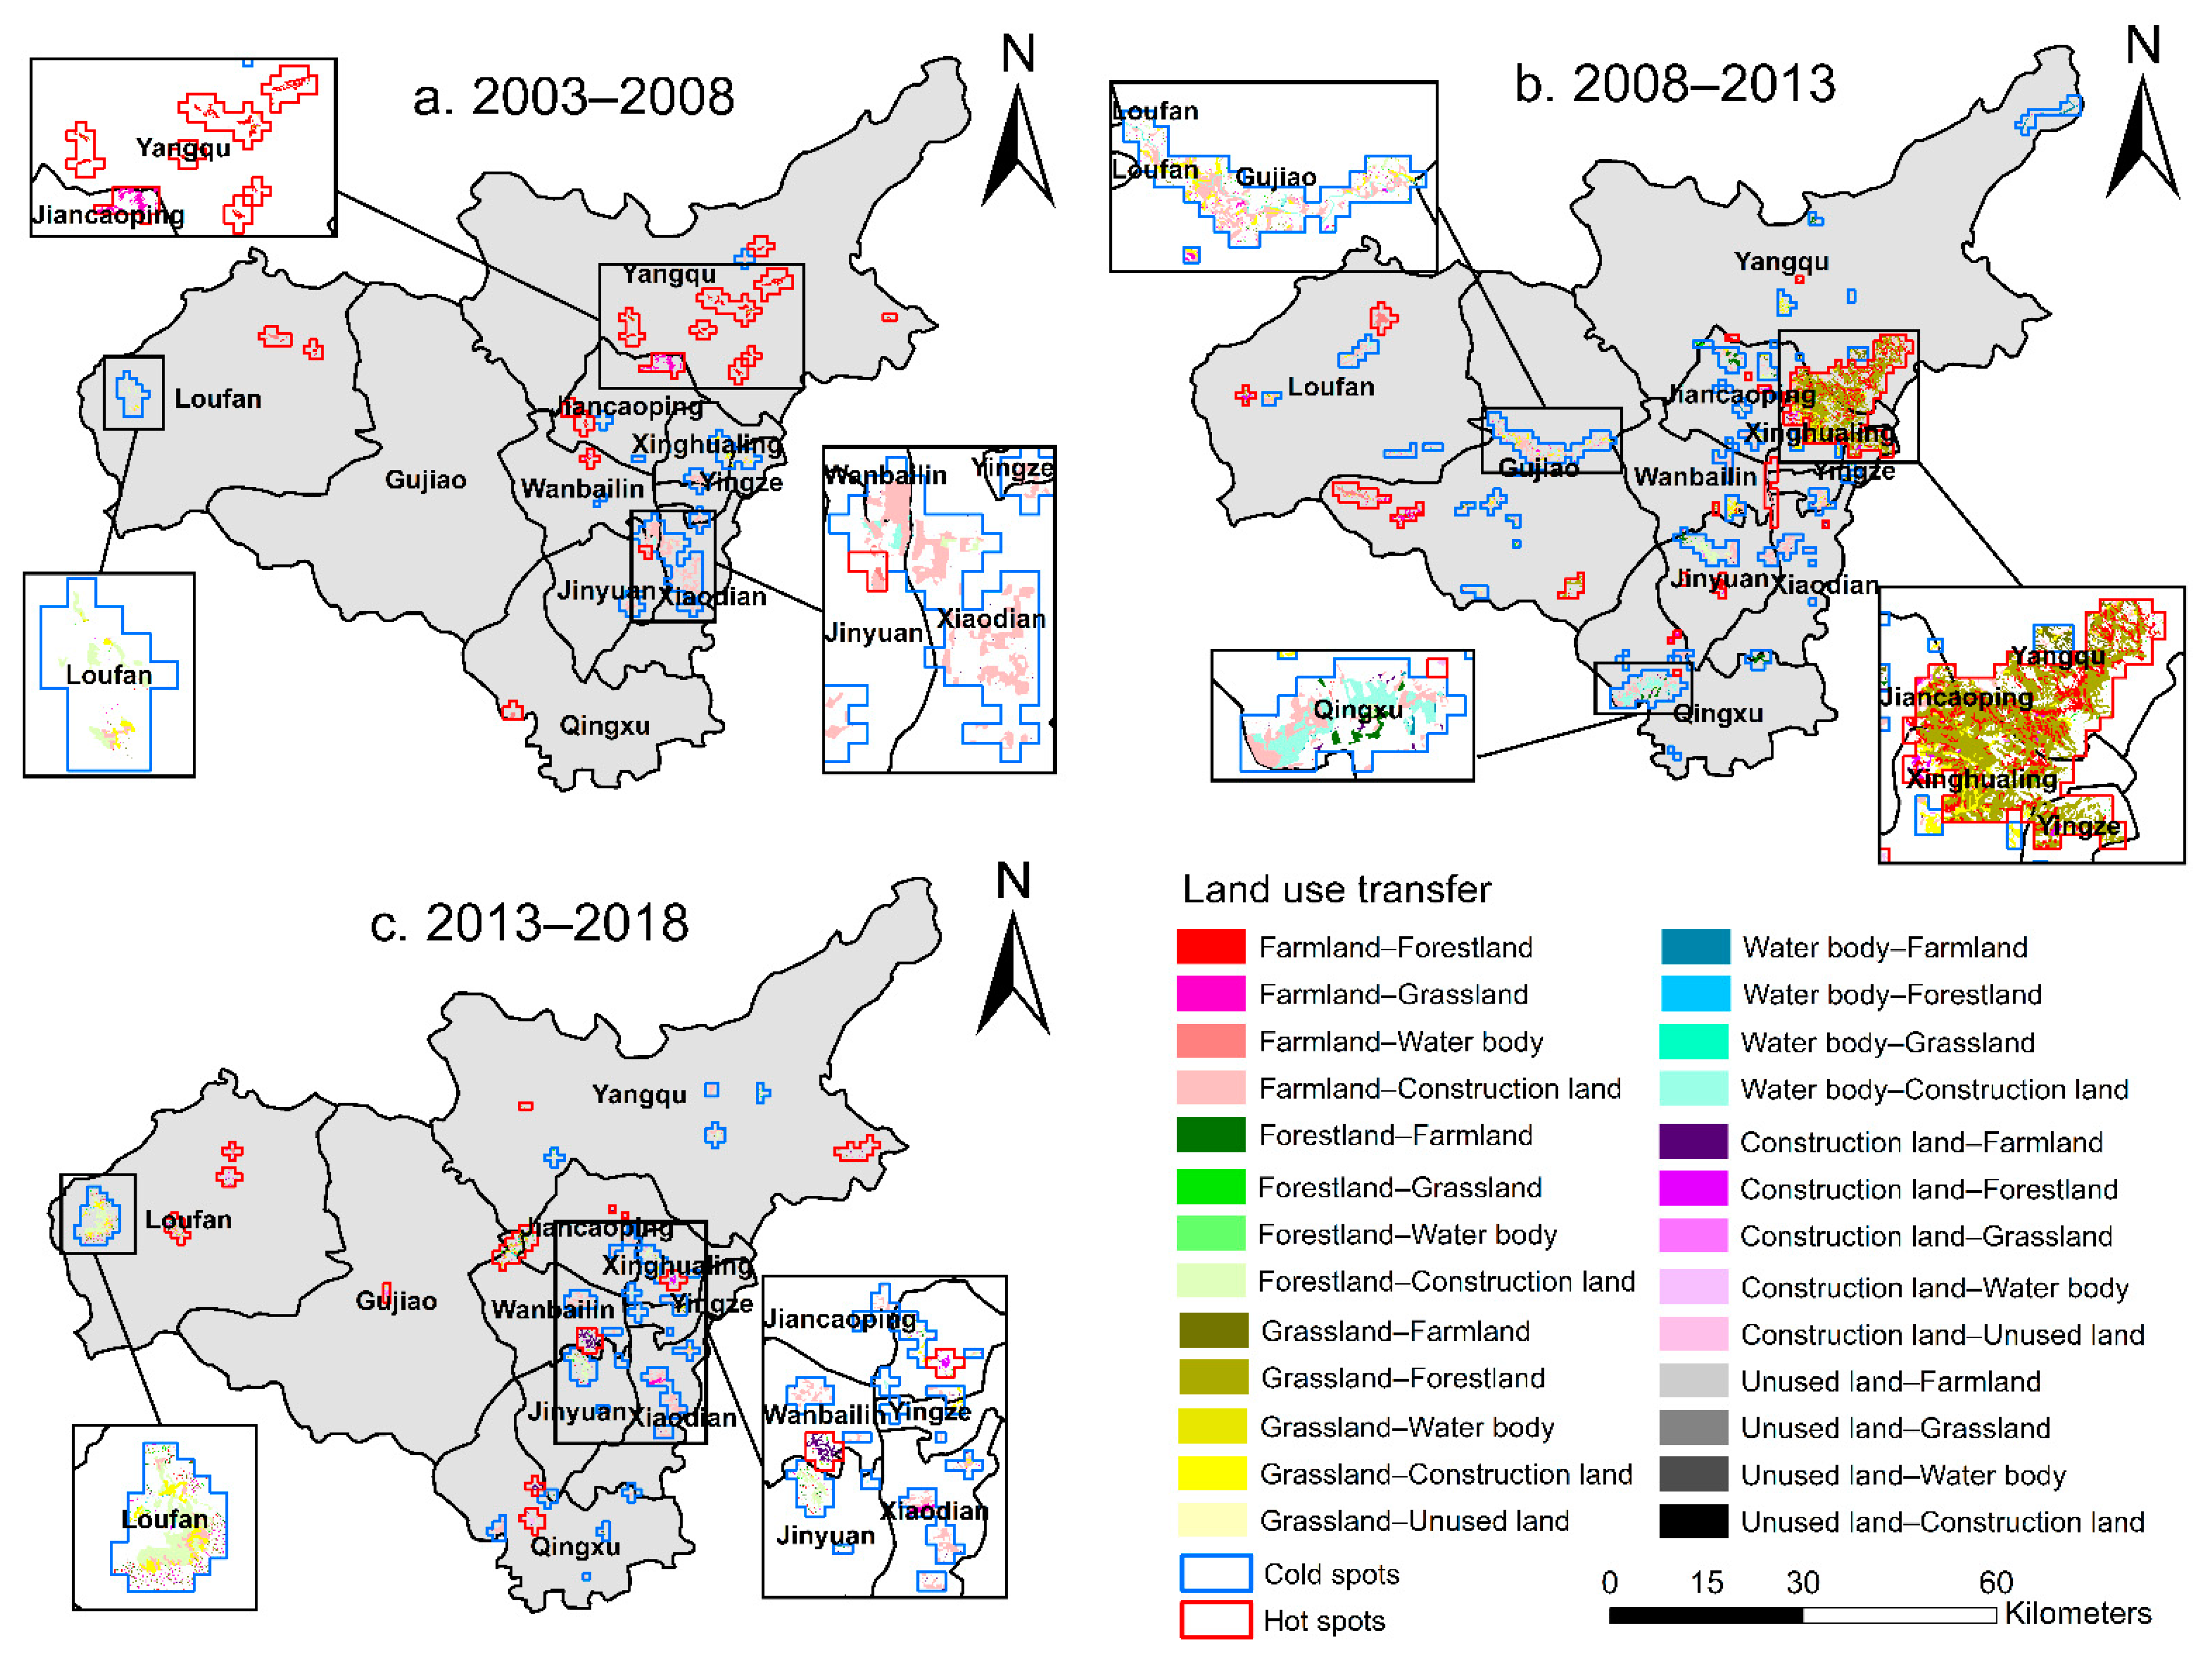
3.3.3. Analysis of ESV Cold and Hot Spots Based on Land Use Transfer

To discuss the response relationship between ESV and land use change in Taiyuan, we overlaid the results of the hotspot analysis of ESVs with layers of land use transfer from 2003 to 2018. The hot and cold spots of ESV in Taiyuan were mostly concentrated in the eastern main urban area and its surrounding areas and expanded to the south and north (Figure 7).
From 2003 to 2008, the hot spots of ESV mainly gathered in the central part of Yangqu County, which was mainly aroused by the transfer of farmland to forestland and grassland. Cold spots were distributed in the main urban area in the east of Taiyuan City, and the amount of farmland transferred to construction land is up to 22.35 km2, which led to a significant reduction of the ESV in this area. From 2008 to 2013, the number of cold and hot spots was more, the distribution scope was wider, and the spatial distribution was relatively diffuse. The hot spots were distributed in Xinghualing District and Yangqu County in the east, and the spatial distribution of ESV cold spots was more dispersed. Large areas of cold spots appeared on both sides of the Fenhe River in Gujiao County and in the west of Qingxu County due to the increase of construction land. From 2013 to 2018, the cold and hot spots of ESV were small and scattered, and the patches of the change in land use were relatively broken, mainly due to the transfer of farmland, forestland, and grassland around the construction land. The urban development tended to be gentle and steadily expanded to the periphery (Figure 7).

4. Discussion

The change in land use reflects the relationship between people and land [46]. It could announce not only spatial allocation and development of land resources but also the concentrated expression of the changes in spatial layout and structure during urban development [47]. Economic development, the grain-for-green policy, ecological governance, and resto-ration policies make the dynamic changes in land use in Taiyuan from 2003 to 2018 mainly occur among farmland, forestland, and construction land. For instance, the southern expansion of the farmland reflects the urban spatial planning of transferring from the north to the south in Taiyuan. According to the analysis of land use intensity at the three levels of time, category, and transition, the farmland has been stably transferred to construction land within three periods, indicating that the progress of urbanization is based on the reduction of farmland. In addition, from 2003 to 2013, the main source of forestland was farmland, which further proved the actual effect of the national policies, such as the grain-for-green policy, forestry ecological construction, and the ecological restoration of the mining area. However, the fact that the transition between forestland and farmland was gradually balanced from 2013 to 2018 indicates the equilibrium between economic development and the ecological environment. The focus of ecological environment protection transformed from the increase in the quantity of forestland to the structural balance between the economy and the environment.
Through the comparison between the transfer matrix, dynamic change of land use, and comprehensive index of land degree, the application of intensity analysis in this paper could quantify the impact of human activities and the internal structural change in regional urban land use, which has been affirmed in the test of Sun et al. [48] and Wang et al. [49]. However, the intensity analysis failed to express the intensity at all levels in the spatial dimension, and it is difficult to prove the impact of spatial adjacency on the change in land use. Hence to this, how to solve this problem is the emphasis of future research [50]. Moreover, the intensity analysis also provides the interpretation for the error in the classification of remote sensing images [51,52], which could better precisely its changing process. This interpretation will be the next step of this paper.
According to the report of the Millennium Ecosystem Assessment (MA), the change in land cover is one of the two most crucial direct driving forces leading to changes in terrestrial ecosystem services in the past 50 years [3]. Changes in the type of land use, the pattern of land use, and the intensity of land use will lead to linkage changes in ES [7]. Based on the revision of climate productivity, researchers obtained the ecosystem service of Taiyuan. From 2003–2018, the ESV of Taiyuan showed a declining trend year by year. During this period, the ESV in 2003 and 2008 had little difference, which was consistent with the changing trend of the ESV in the same period calculated by Liu et al. [53] and Song et al. [37], and the sensitivity analysis verified that the change depends on the forest ecosystem. However, it is difficult to conduct a comprehensive assessment of the regional ecosystem service due to the lack of consideration towards the positive and negative effects of construction land and the single climatic factor in the revised indicator. Otherwise, the heterogeneity of the natural environment, complex multi-scale effects of ecosystem services [7], market failure, and price vacancy [54] all make it more difficult to calculate the ESV. Despite that, it is still of great practical significance to explore the characteristics of changes in ecosystem service value over time [53] and the mechanism process [7]. Meanwhile, according to the sensitivity and hotspots analysis, the dynamic change in forestland, farmland and construction land is an important driving force for the ESV change in Taiyuan. The change in land use is a specific manifestation of urban expansion, so clarifying the impact of urbanization (spatial expansion, expansion forms, etc.) on ESV [18,55] and the response relationship between the two [56] is also one of the key directions in the future study.

5. Conclusions

Heavy industry cities need to optimize the allocation of land use from the response of land use structure to the spatial and temporal evolution of ESV to improve the ecological environment and the quality of livable ecology. Optimizing the spatial pattern of land use and strengthening the construction of the ecological environment has been urgent issues in heavy industry cities. Meanwhile, the yearly decrease in the area of farmland, grassland, and water body should also be valued. In the later stage of the development of the heavy industry cities, the industrial layout is gradually concentrated, and the environmental problems left are prominent after the relocation of industrial and mining land. Through land reclamation, ecological restoration and other measures to optimize the land use structure, so as to achieve the purpose of increasing the value of ecosystem services. For example, the ecological restoration of the East Mountain in Taiyuan City resulted in the transfer of grassland to woodland and thus increased ESV. According to the research, the intensity of land use in Tai-yuan increases first and then decreases with time. Particularly, farmland has become the main source of the stable increase in construction land. Therefore, it is necessary to coordinate the relationship between urban development and food security. Moreover, the construction of regional ecological civilization is also significant. The above changes in the intensity of land and structure directly affect the temporal and spatial evolution of its ESV. The most obvious is that the ESV in Taiyuan is decreasing year by year, with the greatest change from 2008 to 2013. The cold and hot spots are mainly concentrated in the eastern region, expanding to the south and the north. The research results can provide some references for the early warning of farmland and water area control, the optimization and adjustment of land use structure, and the spatial layout of ecological environment restoration measures in heavy industrial cities.

Author Contributions

Conceptualization, X.D., W.Z. and T.Y.; methodology, X.D. and W.Z.; software, X.D. and W.Z.; validation, X.D. and W.Z.; formal analysis, X.D. and W.Z.; investigation, X.D., W.Z., T.Y. and L.W.; resources, X.D., W.Z., T.Y. and L.W.; data curation, X.D. and W.Z.; writing—original draft preparation, X.D. and W.Z.; writing—review and editing, X.D. and W.Z.; visualization, T.Y. and L.W.; supervision, W.Z., T.Y. and L.W.; project administration, W.Z., T.Y. and L.W.; funding acquisition, W.Z. All authors have read and agreed to the published version of the manuscript.

Funding

This research was funded by the National Natural Science Foundation of China (41907050); the Natural Science Foundation of Shandong Province (ZR2019MD031); and the Shandong Colleges and Universities Scientific Research Program (J18KA197).

Institutional Review Board Statement

Not applicable.

Informed Consent Statement

Not applicable.

Data Availability Statement

The data used in this study are from the geospatial data cloud platform (http://www.gscloud.cn/, accessed on 21 August 2020), the National Meteorological Information Center of the China Meteorological Administration (https://data.cma.cn/, accessed on 21 October 2021).

Conflicts of Interest

The authors declare no conflict of interest.

References

  1. Daily, G.C. Nature’s Services: Societal Dependence on Natural Ecosystems (1997). In Nature’s Services: Societal Dependence on Natural Ecosystems (1997); Yale University Press: New Haven, CT, USA, 2013; pp. 454–464. ISBN 978-0-300-18847-9. [Google Scholar]
  2. Costanza, R.; d’Arge, R.; de Groot, R.; Farber, S.; Grasso, M.; Hannon, B.; Limburg, K.; Naeem, S.; O’Neill, R.V.; Paruelo, J.; et al. The Value of the World’s Ecosystem Services and Natural Capital. Nature 1997, 387, 253–260. [Google Scholar] [CrossRef]
  3. Reid, W.V. Millennium Ecosystem Assessment; World Resources Institute: Washington, DC, USA, 2005. [Google Scholar]
  4. Xie, L.; Wang, H.; Liu, S. The Ecosystem Service Values Simulation and Driving Force Analysis Based on Land Use/Land Cover: A Case Study in Inland Rivers in Arid Areas of the Aksu River Basin, China. Ecol. Indic. 2022, 138, 108828. [Google Scholar] [CrossRef]
  5. Sutton, P.C.; Anderson, S.J.; Costanza, R.; Kubiszewski, I. The Ecological Economics of Land Degradation: Impacts on Ecosystem Service Values. Ecol. Econ. 2016, 129, 182–192. [Google Scholar] [CrossRef]
  6. Wang, J.; Dun, Y. A Review on the Effects of Land Use Change on Ecosystem Services. Resour. Environ. Yangtze Basin 2015, 24, 798–808. [Google Scholar] [CrossRef]
  7. Fu, B.; Zhang, L. Land-Use Change and Ecosystem Services: Concepts, Methods and Progress. Prog. Geogr. 2014, 33, 441–446. [Google Scholar] [CrossRef]
  8. Khaledian, Y.; Kiani, F.; Ebrahimi, S.; Brevik, E.C.; Aitkenhead-Peterson, J. Assessment and Monitoring of Soil Degradation during Land Use Change Using Multivariate Analysis. Land Degrad. Dev. 2017, 28, 128–141. [Google Scholar] [CrossRef]
  9. Erener, A. Remote Sensing of Vegetation Health for Reclaimed Areas of Seyitömer Open Cast Coal Mine. Int. J. Coal Geol. 2011, 86, 20–26. [Google Scholar] [CrossRef]
  10. Hou, H.; Ding, Z.; Zhang, S.; Guo, S.; Yang, Y.; Chen, Z.; Mi, J.; Wang, X. Spatial Estimate of Ecological and Environmental Damage in an Underground Coal Mining Area on the Loess Plateau: Implications for Planning Restoration Interventions. J. Clean. Prod. 2021, 287, 125061. [Google Scholar] [CrossRef]
  11. Ji, S.; Ma, S. The Effects of Industrial Pollution on Ecosystem Service Value: A Case Study in a Heavy Industrial Area, China. Environ. Dev. Sustain. 2022, 24, 6804–6833. [Google Scholar] [CrossRef]
  12. Qian, D.; Yan, C.; Xing, Z.; Xiu, L. Monitoring Coal Mine Changes and Their Impact on Landscape Patterns in an Alpine Region: A Case Study of the Muli Coal Mine in the Qinghai-Tibet Plateau. Environ. Monit. Assess. 2017, 189, 559. [Google Scholar] [CrossRef]
  13. National Remote Sensing Center of China Sustainable Development Trend of Global Terrestrial Ecosystems. Available online: http://old.chinageoss.cn/geoarc/2021/ (accessed on 25 September 2022).
  14. Long, K.; Omrani, H.; Pijanowski, B.C. Impact of Local Payments for Ecosystem Services on Land Use in a Developed Area of China: A Qualitative Analysis Based on an Integrated Conceptual Framework. Land Use Policy 2020, 96, 104716. [Google Scholar] [CrossRef]
  15. Najmuddin, O.; Li, Z.; Khan, R.; Zhuang, W. Valuation of Land-Use/Land-Cover-Based Ecosystem Services in Afghanistan—An Assessment of the Past and Future. Land 2022, 11, 1906. [Google Scholar] [CrossRef]
  16. Romero-Ruiz, M.H.; Flantua, S.G.A.; Tansey, K.; Berrio, J.C. Landscape Transformations in Savannas of Northern South America: Land Use/Cover Changes since 1987 in the Llanos Orientales of Colombia. Appl. Geogr. 2012, 32, 766–776. [Google Scholar] [CrossRef]
  17. Zhang, C.; Zhao, L.; Zhang, H.; Chen, M.; Fang, R.; Yao, Y.; Zhang, Q.; Wang, Q. Spatial-Temporal Characteristics of Carbon Emissions from Land Use Change in Yellow River Delta Region, China. Ecol. Indic. 2022, 136, 108623. [Google Scholar] [CrossRef]
  18. Zhao, Q.; Wen, Z.; Chen, S.; Ding, S.; Zhang, M. Quantifying Land Use/Land Cover and Landscape Pattern Changes and Impacts on Ecosystem Services. Int. J. Environ. Res. Public. Health 2020, 17, 126. [Google Scholar] [CrossRef] [Green Version]
  19. Yao, Z.; Wang, B.; Huang, J.; Zhang, Y.; Yang, J.; Deng, R.; Yang, Q. Analysis of Land Use Changes and Driving Forces in the Yanhe River Basin from 1980 to 2015. J. Sens. 2021, 2021, 1–11. [Google Scholar] [CrossRef]
  20. Li, S.; Dong, B.; Gao, X.; Xu, H.; Ren, C.; Liu, Y.; Peng, L. Study on Spatio-Temporal Evolution of Habitat Quality Based on Land-Use Change in Chongming Dongtan, China. Environ. Earth Sci. 2022, 81, 220. [Google Scholar] [CrossRef]
  21. Qiao, W.; Sheng, Y.; Fang, B.; Wang, Y. Land Use Change Information Mining in Highly Urbanized Area Based on Transfer Matrix: A Case Study of Suzhou, Jiangsu Province. Geogr. Res. 2013, 32, 1497–1507. [Google Scholar]
  22. Yang, Y.; Xia, X.; Zhao, X. Study on the land use/cover changes in Xiushan Island based on intensity analytical method. J. Mar. Sci. 2015, 33, 17–25. [Google Scholar] [CrossRef]
  23. Pontius, R.G.; Shusas, E.; McEachern, M. Detecting Important Categorical Land Changes While Accounting for Persistence. Agric. Ecosyst. Environ. 2004, 101, 251–268. [Google Scholar] [CrossRef]
  24. Aldwaik, S.Z.; Pontius, R.G. Intensity Analysis to Unify Measurements of Size and Stationarity of Land Changes by Interval, Category, and Transition. Landsc. Urban Plan. 2012, 106, 103–114. [Google Scholar] [CrossRef]
  25. Huang, B.; Huang, J.; Gilmore Pontius, R.; Tu, Z. Comparison of Intensity Analysis and the Land Use Dynamic Degrees to Measure Land Changes Outside versus inside the Coastal Zone of Longhai, China. Ecol. Indic. 2018, 89, 336–347. [Google Scholar] [CrossRef]
  26. Pontius, R.G.; Gao, Y.; Giner, N.M.; Kohyama, T.; Osaki, M.; Hirose, K. Design and Interpretation of Intensity Analysis Illustrated by Land Change in Central Kalimantan, Indonesia. Land 2013, 2, 351–369. [Google Scholar] [CrossRef]
  27. Mallinis, G.; Koutsias, N.; Arianoutsou, M. Monitoring Land Use/Land Cover Transformations from 1945 to 2007 in Two Peri-Urban Mountainous Areas of Athens Metropolitan Area, Greece. Sci. Total Environ. 2014, 490, 262–278. [Google Scholar] [CrossRef] [PubMed]
  28. Niu, L.; Zhang, B.; Jia, T.; She, D. Analysis on Intensity and Stability of Land Use Change in Haixi Mongolian and Tibetan Autonomous Prefecture of Qinghai Province. J. Soil Water Conserv. 2021, 35, 152–159. [Google Scholar] [CrossRef]
  29. Wang, Z.; Zhang, B.; Zhang, S. Study on the Effects of Land Use Change on Ecosystem Service Values of Jilin Province. J. Nat. Resour. 2004, 19, 55–61. [Google Scholar] [CrossRef]
  30. Xie, G.; Zhen, L.; Lu, C.; Xiao, Y.; Chen, C. Expert Knowledge Based Valuation Method of Ecosystem Services in China. J. Nat. Resour. 2008, 23, 911–919. [Google Scholar]
  31. Bao, D.; Li, J.; Liu, F.; Hu, J. Impact of land-use/land-cover change on ecosystem service values in Myanmar from 1995 to 2015. Acta Ecol. Sin. 2021, 6960–6969. [Google Scholar] [CrossRef]
  32. Xie, G.; Zhang, C.; Zhang, L.; Chen, W.; Li, S. Improvement of the Evaluation Method for Ecosystem Service Value Based on per Unit Area. J. Nat. Resour. 2015, 30, 1243. [Google Scholar]
  33. Shi, H.; Shi, X.; Liu, L.; He, J.; Liu, W.; Wan, H. Comparison on Methods and Results of Urban Ecological System Service Value in Lanzhou City. China Popul. Res. Environ. 2013, 23, 30–35. [Google Scholar] [CrossRef]
  34. Li, Y.; Han, L.; Zhu, H.; Zhao, Y.; Liu, Z.; Chen, R. Changes of Ecological Service Value in Yan´an City Pre and Post Returning Farmland to Forestland Based on Land Use. J. Northwest For. Univ. 2020, 203–211. [Google Scholar] [CrossRef]
  35. Fang, L.; Cai, J.; Liu, Y.; Yang, B. Spatial Pattern and Dynamic Evolution of Value of HuoShan County during 1990 to 2020. Resour. Ind. 2022, 24, 119. [Google Scholar] [CrossRef]
  36. Xiao, Q.; Xiao, Y.; Ouyang, Z.Y.; Xu, W.H.; Xiang, S.; Li, Y.Z. Value Assessment of the Function of the Forest Ecosystem Services in Chongqing. Acta Ecol. Sin. 2014, 34. [Google Scholar] [CrossRef]
  37. Song, W.; Deng, X. Land-Use/Land-Cover Change and Ecosystem Service Provision in China. Sci. Total Environ. 2017, 576, 705–719. [Google Scholar] [CrossRef]
  38. Xing, L.; Xue, M.; Wang, X. Spatial Correction of Ecosystem Service Value and the Evaluation of Eco-Efficiency: A Case for China’s Provincial Level. Ecol. Indic. 2018, 95, 841–850. [Google Scholar] [CrossRef]
  39. Anley, M.A.; Minale, A.S.; Haregeweyn, N.; Gashaw, T. Assessing the Impacts of Land Use/Cover Changes on Ecosystem Service Values in Rib Watershed, Upper Blue Nile Basin, Ethiopia. Trees For. People 2022, 7, 100212. [Google Scholar] [CrossRef]
  40. National Bureau of Statistics of China. Statistical Communiqué of National Economic and Social Development of Taiyuan City in 2018. Available online: http://stats.taiyuan.gov.cn/doc/2019/05/14/845586.shtml (accessed on 25 September 2022).
  41. Zhou, G.; Zheng, Y.; Luo, T.; Chen, S. NPP Model of Natural Vegetation and Its Application in China. Sci. Silvae Sin. 1998, 34, 2. [Google Scholar]
  42. Han, W.; Han, Y.; Yang, S. Spatial-Temporal Change of Climate Resources and Climatic Productivity in Shandong Province during 1961–2011. Prog. Geogr. 2013, 32, 425. [Google Scholar] [CrossRef]
  43. Mankiw, N.G. Principles of Economics, 3rd ed.; Mason ThomsonSouth-Western: Mason, OH, USA, 2004. [Google Scholar]
  44. Ma, X.; Su, Y.; Lin, F.; Dai, C. Land use/cover change and its driving factors in Taiyuan city. Ecol. Sci. 2021, 40, 201–210. [Google Scholar] [CrossRef]
  45. Sang, X.; Guo, Q.; Wu, X.; Fu, Y.; Xie, T.; He, C.; Zang, J. Intensity and Stationarity Analysis of Land Use Change Based on CART Algorithm. Sci. Rep. 2019, 9, 12279. [Google Scholar] [CrossRef] [Green Version]
  46. Ma, L.; Su, H. Land use dynamic change in Guyuan County of Hebei Province. J. Arid Land Resour. Environ. 2010, 24, 131–136. [Google Scholar] [CrossRef]
  47. Lu, C.; Yang, Q.; Jin, D.; Li, X.; Wen, F. Research Progress and Prospects of the Researches on Urban Land Use Structure in China. Prog. Geogr. 2010, 29, 861–868. [Google Scholar] [CrossRef]
  48. Sun, Y.; Guo, T.; Cui, X. Intensity Analysis and Stationarity of Land Use Change in Kunming City. Prog. Geogr. 2016, 35, 245–254. [Google Scholar] [CrossRef]
  49. Wang, Y.; Ding, J.; Li, X.; Zhang, J.; Ma, G. Impact of LUCC on Ecosystem Services Values in the Yili River Basin Based on an Intensity Analysis Model. Acta Ecol. Sin. 2022, 42, 3106–3118. [Google Scholar] [CrossRef]
  50. Geng, X.; Zhang, J.; Wei, C.; Cheng, M. Study on the change of land use intensity in mining cities based on multi level decision:take Wuan city of Hebei province as an example. China Min. Mag. 2018, 27, 106–112. [Google Scholar] [CrossRef]
  51. Aldwaik, S.Z.; Pontius, R.G., Jr. Map Errors That Could Account for Deviations from a Uniform Intensity of Land Change. Int. J. Geogr. Inf. Sci. 2013, 27, 1717–1739. [Google Scholar] [CrossRef]
  52. Tankpa, V.; Wang, L.; Atanga, R.A.; Awotwi, A.; Guo, X. Evidence and Impact of Map Error on Land Use and Land Cover Dynamics in Ashi River Watershed Using Intensity Analysis. PLoS ONE 2020, 15, e0229298. [Google Scholar] [CrossRef] [PubMed] [Green Version]
  53. Liu, Y.; Li, J.; Zhang, H. An Ecosystem Service Valuation of Land Use Change in Taiyuan City, China. Ecol. Model. 2012, 225, 127–132. [Google Scholar] [CrossRef]
  54. Xie, G.; Lu, C.; Cheng, S. Progress in Evaluating the Global Ecosystem Services. Resour. Sci. 2001, 23, 5–9. [Google Scholar]
  55. Gao, X.; Fang, C.; Mu, X.; Chen, D. Coupling and Coordination Analysis of Urbanization and Ecosystem Service Value in Beijing-Tianjin-Hebei Urban Agglomeration. Ecol. Indic. 2022, 137, 108782. [Google Scholar] [CrossRef]
  56. Xiao, R.; Lin, M.; Fei, X.; Li, Y.; Zhang, Z.; Meng, Q. Exploring the Interactive Coercing Relationship between Urbanization and Ecosystem Service Value in the Shanghai–Hangzhou Bay Metropolitan Region. J. Clean. Prod. 2020, 253, 119803. [Google Scholar] [CrossRef]
Figure 1. Location of the study area.
Land 11 02035 g001
Figure 2. The land use classification maps of Taiyuan in 2003–2018.
Land 11 02035 g002
Figure 3. Analysis of interval level for three-time intervals: 2003–2008, 2008–2013, and 2013–2018.
Land 11 02035 g003
Figure 4. The category-level intensity of 2003–2008, 2008–2013, and 2013–2018 are shown in figures (ac), respectively.
Land 11 02035 g004
Figure 5. The transition level of land use reflected the directional magnitude among different categories in three-time intervals of 2003–2008, 2008–2013, and 2013–2018 (ad).
Land 11 02035 g005
Figure 6. Spatial distribution of ESV of Taiyuan City from 2003 to 2018.
Land 11 02035 g006
Figure 7. The transition between land use types and the spatial distribution of ESV cold spots and hot spots in Taiyuan City.
Land 11 02035 g007
Table 1. The ecological service value per unit area of the ecosystem in Taiyuan City.
Primary TypeSecondary TypeForestGrasslandFarmlandWetland & Rivers and LakesDesserts
Land UseForestlandGrasslandFarmlandWaterbodyUnused Land
Supply servicesFood production75.5898.49229.04101.924.58
Raw material production682.5482.4689.3367.579.16
Regulatory servicesGas regulation989.46343.56164.91334.4013.74
Climate regulation932.20357.31222.171787.6729.77
Hydrological regulation936.78348.14176.363688.7116.03
Waste disposal393.95302.33318.373349.7359.55
Support ServicesSoil conservation920.74513.05336.69274.8538.94
Protection of biodiversity1032.97428.31233.62815.3991.62
Cultural servicesProvision of aesthetic landscape476.40199.2738.941045.5754.97
Total6440.632673.361809.4211465.79318.37
1 Note: Units, RMB·hm−2.
Table 2. Sensitivity index of ecosystem service value in Taiyuan.
EcosystemsVC20032008201320182003–2018
FarmlandVC ± 50%0.1560.1520.1410.139−0.017
ForestlandVC ± 50%0.5990.6020.6320.6310.031
GrasslandVC ± 50%0.2060.2070.1930.193−0.013
Water bodyVC ± 50%0.0390.0390.0340.037−0.002
Unused landVC ± 50%0.0000.0000.0000.0000.000
Publisher’s Note: MDPI stays neutral with regard to jurisdictional claims in published maps and institutional affiliations.

