Article

Spatial–Temporal Evolution of Ecosystem Service Value in Yunnan Based on Land Use

1
College of Economics and Management, Southwest Forestry University, Kunming 650224, China
2
College of Economics and Management, Beijing Forestry University, Beijing 100083, China
*
Author to whom correspondence should be addressed.
Land 2022, 11(12), 2217; https://doi.org/10.3390/land11122217
Submission received: 5 November 2022 / Revised: 27 November 2022 / Accepted: 2 December 2022 / Published: 6 December 2022

Abstract

:
Exploring the changes in ecosystem service value (ESV) caused by land use transition is important for regional ecological protection. According to the land use data from 2000 to 2020, the alterations in the land use and ESV in Yunnan over the past 20 years were calculated and analyzed. At the same time, spatial autocorrelation analysis was established to analyze the spatial relationships of ESV in 16 states and cities. The results show that from 2000 to 2020, cultivated land, grassland and unused land are on a decreasing trend, while forest land, water body and built-up land are on an increasing trend, with the largest change in built-up land. The total ESV is on an increasing trend, with water supply, gas regulation, climate regulation, environmental purification and hydrological regulation being the highest value of individual services. Spatially, the total ESV showed that high levels were in the northwest, southwest and east, and low levels were in the northeast, west and central parts. At the same time, it shows a positive spatial correlation with a weakening trend. It is dominated by high–high cluster and low–low cluster. The change in the value of ecological services in forest land, grassland and water body have a greater impact on the change in total service value in the region, and was the main contributing and sensitive factor.

1. Introduction

Ecosystem services are services and products provided directly or indirectly to humans by specific ecosystems under ecological conditions of good structural and functional integrity that play an important role in making ecological conservation and economic green development decisions [1,2,3]. The stock and flow of ecosystem services affect the functioning of modern societies and economies [4], and land use is the most significant contributor to changes in ecosystem services [5], while having economic advantages in maintaining ecological environments and enhancing human health and living standards [6]. The systematic study of land use change and the impact of different land types on ecosystem services can improve the planning and management of land use [7]. Starting from the 21st century, the world has entered a phase of rapid land urbanization at the expense of ecosystem service value [8], and optimizing land use structure has also become the best means to balance economic development and ecosystem service value.
Human research on ecosystem services has been conducted since the 1960s, but quantifying them only from an ecological perspective has made it difficult for the public to understand their meaning and to analyze them in comparison with economic indicators [9]. In 1997, Costanza et al. [10] proposed a monetary approach to valuing global ecosystem services. In 2003, Xie et al. [11] synthesized various research results on ecosystems and developed the “ecological service value per unit area equivalence scale for terrestrial ecosystems in China”, which has been continuously revised in the light of economic development and land use status [12]. In addition, scholars have also conducted a lot of research on this topic. As for research scale, it primarily concentrated on watersheds [13], plateaus [14], nature reserves [2], urban agglomerations [15,16,17], arid regions [18], islands [19], lakes [20,21], water reserves [22], basins [23] and other levels of physical geographic units and socioeconomic functional areas. As for research content, it included the spatial and temporal patterns of ecosystem service value [24], factors influencing ecosystem service value [25] and the impact of land use change on the value of ecosystem services [26]. Research methods used to evaluate the worth of ecosystem services include the benefit transfer method [27], equivalent coefficients table method [28], meta-analysis [29,30], land cover proxy method [14] and shadow project approach [31]. In summary, scholars have paid attention to the influence of land use situation on ecosystem service value. It also formed a complete and scientific ecosystem service value assessment system, but there are relatively few spatial analyses on the mutual transfer situation between different land use types and the change of ecosystem service value, and few scholars have analyzed the influence of different land use types on ecosystem service value.
Yunnan is the ecological security barrier in southwest China, and it bears the strategic task and great responsibility of maintaining national ecological security. However, Yunnan is mostly dominated by plateaus and mountains, and also has unique karst landscapes and a relative lack of land resources, which seriously restricts regional economic development. Rapid population growth and accelerated urbanization have an impact on ecosystem services; it is important to establish a sound territorial spatial development and protection system, strengthen ecological space management and protect natural ecological security boundaries. By quantitatively analyzing the spatial evolution characteristics of ecosystem service values in 16 states and cities, changes in ecosystem service value under land use change were revealed. It provides a foundation for the development of land use planning to achieve sustainable social, economic and ecological development. The objective of this study are as follows: (1) Arcgis 10.7 software was used to analyze the characteristics of land use change, land use dynamic change, land use transfer and land use degree. (2) The equivalent factor method was used to measure the value of ecosystem services in Yunnan, and a spatial autocorrelation model was used to study the spatial and temporal evolution of the value of ecosystem services for various land use types in 16 states and cities. (3) Ecological contribution ratios were used to determine the contribution of different land use types to changes in ecosystem service value.

2. Materials and Methods
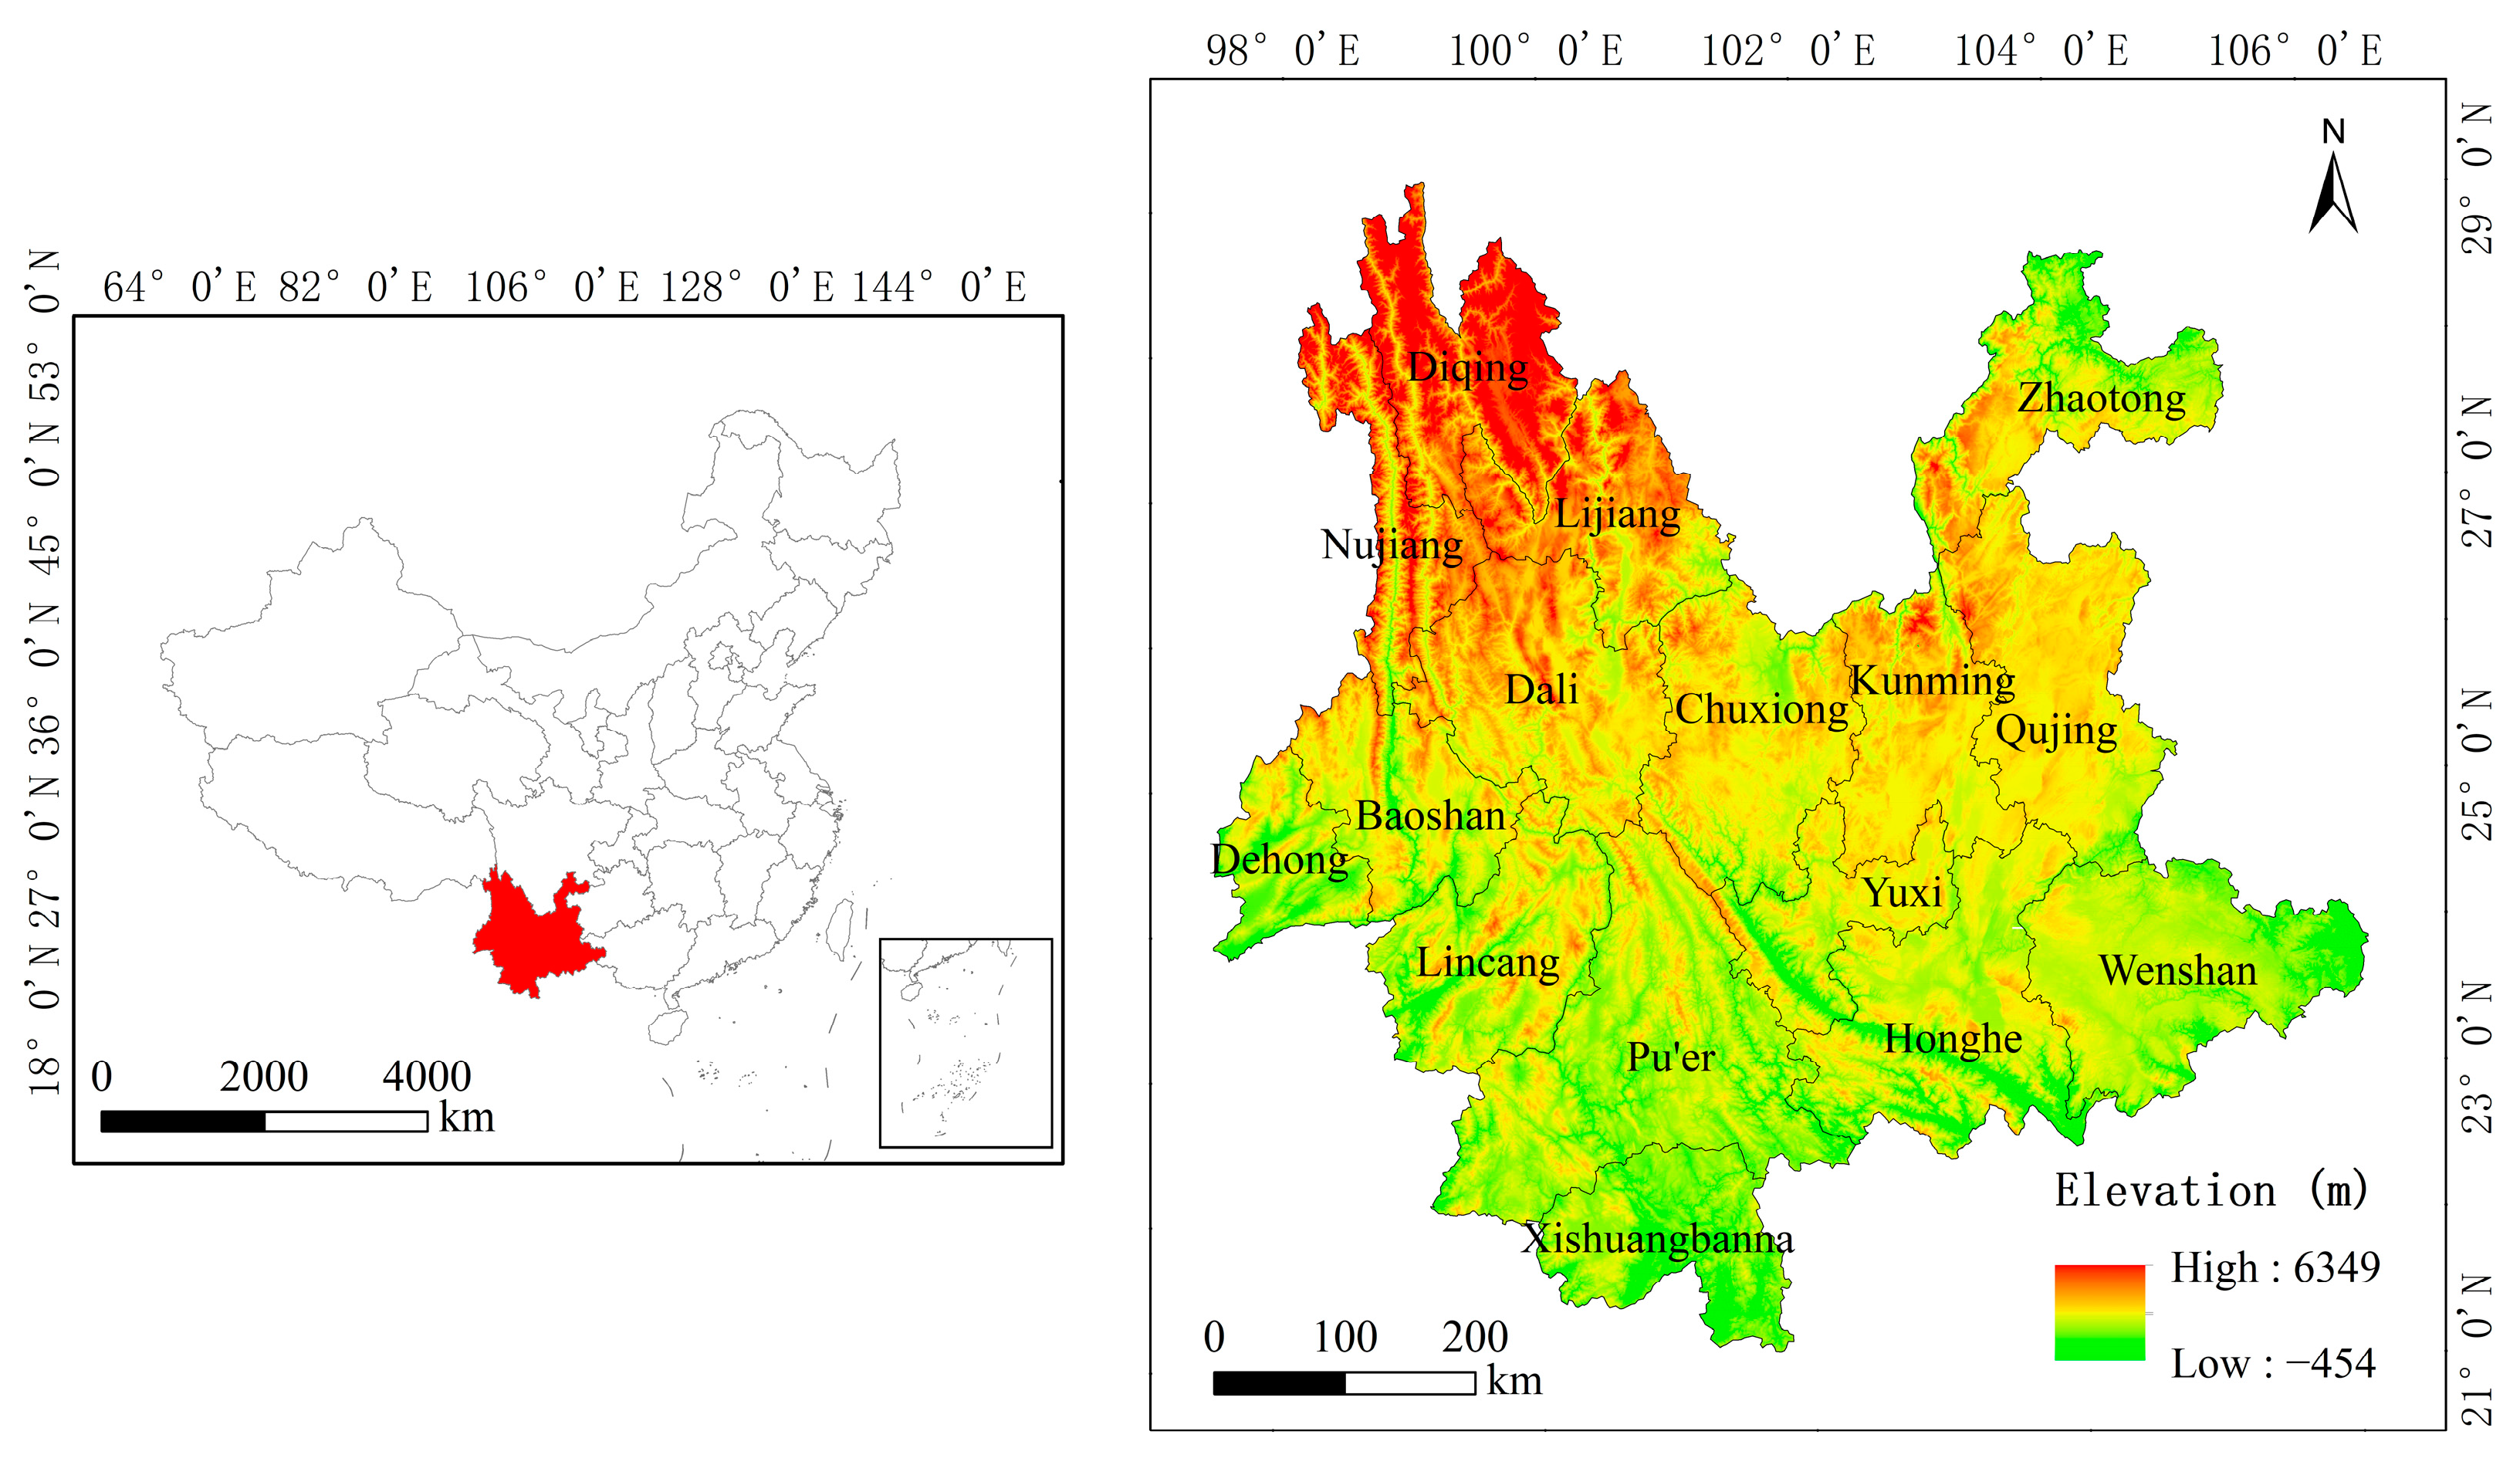
2.1. Study Area

Yunnan, which forms part of China’s southwest border and consists of 16 states and cities (Figure 1), is the region’s ecological barrier. The geography in Yunnan is separated into two parts, east and west, by the Yuanjiang Valley and the large valley in the southern part of the Yunling Mountains. The topography of the region exhibits a high northwest and low southeast. The western part is the longitudinal valley of the Hengduan Mountains, with deep valleys between high mountains, large elevation differences, and treacherous terrain, forming remarkable three-dimensional climate characteristics. The eastern part is the plateau of eastern and central Yunnan, mostly undulating and gently rolling low mountains and rounded hills, breeding various types of karst terrain. The study area has a climate of the subtropical plateau monsoon type with an average annual temperature of 17.6 °C. Yunnan has 65.04% forest cover and a storage capacity of 2.067 billion cubic meters. Yunnan has diverse soil types and a complex environment that creates the conditions for breeding a rich variety of species, making it one of the richest species hotspots in the world [32]. The economic development level of Yunnan has improved significantly, from 2030.08 billion yuan in 2000 to 24,521.90 billion yuan in 2020, with an average annual growth rate of 55.40%. In addition, the urbanization process of Yunnan Province has accelerated, with the total population growing from 42.41 million in 2000 to 47.22 million in 2020, of which the proportion of urban population has increased from 23.36% to 50.05%.

2.2. Data Source

The remote sensing data of land use in Yunnan for a total of 5 periods from 2000 to 2020 were obtained from the Resource and Environment Science and Data Center of the Chinese Academy of Sciences (http://www.resdc.cn, accessed on 15 September 2022), and the land use types were classified into: cultivated land, forest land, grassland, water body, built-up land and unused land according to land resources and attributes. Data on grain production, prices and planted area were obtained from the China Agricultural Products Price Survey Yearbook and the China Statistical Yearbook.

2.3. Research Methods

2.3.1. Land Use Change Study

The parameters of land use dynamics, transfer Matrix, and land use degree were used to describe land use changes in the study area.
(1) Land use dynamics is a measure of the speed of change of land use types, which is divided into single land use dynamics and comprehensive land use dynamics; the single land use dynamics were used to evaluate the rate of conversion between different land use types during the study period [33].
K = U b U a U a × 1 T × 100 %
where K is the single dynamics of land use type (%); U a is the area of a land use type at the beginning of the study period (ha); U b is the area of a land use type at the end of the study period (ha); T is the time year interval of the study period.
The comprehensive land use dynamics represents the rate and magnitude of land use-type change in the study area as a whole, with the following equation.
L c = i = 1 n Δ L U i j 2 i = 1 n L U i × 1 T × 100 %
where L c is the comprehensive land use dynamics (%); L U i is the area of land use type i at the beginning of the study (ha); Δ L U i j   is the absolute value of the area of land use type i changing to non-i land use type during the study period (ha).
(2) The land use transfer matrix is used to study the dynamic transformation of each land use type in the research period [18]. ArcGIS 10.7 is used to perform spatial superposition and statistical analysis of land use remote sensing maps in Yunnan at different periods to obtain land use transfer matrices, so as to determine the status and number of land use mutual transformations.
S i j = [ S 11 S 12 S 1 n s n 1 S n 2 S n n ]
where S i j is the area of change (ha), i and j represent the study start time and end time, respectively, and n is the number of land use types.
(3) Land use degree (L) reflects the extent to which human activities have led to land use change [34].
L = 100 × i = 1 n A i P i A T
where A i is the area of the land use type of Category I (ha); A T is the total area of the study area (ha); P i is the i-type land use degree parameter, of which the unused land is assigned 1, the forest land, grassland and water body are assigned 2, the cultivated land is assigned 3, and the built-up land is assigned 4.

2.3.2. Ecosystem Service Value Assessment

The value of service functions in ecosystems is calculated by equivalent factor method, and the economic value created per unit area of grain production is revised based on the revised ecological service equivalent scale of China’s ecosystem per unit area by Xie et al. [12], and the economic value created per unit area of grain production is revised in combination with the socioeconomic development of Yunnan [19]. Among them, the ESV of the built-up land is low and the degree and scope of influence are small, and its coefficient is set to 0 in this equivalent scale [35]. The coefficient of the ESV is calculated as follows.
E i j = 1 7 α × P × Q × E 0 i j
where E i j is coefficient of j ecosystem services value for land use type i in Yunnan the j ecosystem service value factor for the modified i land use type (yuan/ha); p is the average price of grain in Yunnan (yuan/kg); Q is the grain yield per unit sown area (kg/ha) in Yunnan; α is correction factor and expressed as the ratio of Yunnan’s economic income per hectare of grain to the national economic income per hectare of grain; E 0 i j is the ecosystem service equivalence in China, from the Chinese ESV equivalence scale established by Xie et al. Coefficient of the ESV in Yunnan ( E i j ) is shown in Table 1:
ESV is the total value of ecosystem service functions and is calculated as follows.
E S V = i = 1 m j = 1 n A i E i j
where ESV represents the total value of ecosystem services in the study area (yuan); Ai is the area of land use for Category i (ha); m is the total number of land-use types; n is the total number of ecosystem service species.

2.3.3. Spatial Statistical Analysis

Global spatial autocorrelation is used to verify the clustering potential of a certain attribute value in the spatial distribution of the region as a whole, which is mainly measured using Moran’s I index [36], and this paper is used to assess whether the distribution of ESV in each state and city of Yunnan Province is clustered. ArcMap10.7 was used to analyze spatial autocorrelation to determine whether correlation exists between ESV and the spatial distribution phenomenon, and to understand the spatial distribution characteristics of Yunnan ESV more intuitively. The expression of Moran’s I index is as follows.
M o r a n s   I = n i = 1 n j = 1 n W i j ( x i x ¯ ) ( x j x ¯ ) i = 1 n j = 1 n W i j i = 1 n ( x i x ¯ ) 2
where n is the number of spatial cells; x i , x j is the ESV value of the i , j spatial cells respectively; x ¯ is the average value of ESV; W i j is the spatial weight matrix. Where M o r a n s   I < 0 indicates negative spatial correlation and discrete distribution, M o r a n s   I > 0 indicates positive spatial correlation and spatial clustering; where M o r a n s   I = 0 indicates no spatial autocorrelation and random distribution of spatial units.

2.3.4. Ecological Contribution Rate

Ecological contribution rate indicates the magnitude of influence of the amount of change in ecological service value generated by different land use types in a certain time period on the amount of change in total regional service value, and can be used to reveal the main contributing and sensitive factors affecting the change in regional ecological service value [33].
G i t = | Δ E S V i t | i = 1 6   | Δ E S V i t | × 100 %
where G i t represents the ecological contribution rate of the Type i land-use type over time period t (%); Δ E S V i t represents the amount of ESV change in the Type i land-use type over time period t.

3. Results

3.1. Land Use Changes in Yunnan Province from 2000 to 2020

3.1.1. The Overall Characteristics of Land Use Change

The classification results of the land use changes in Yunnan between 2000 and 2020 is shown in Figure 2. Yunnan is mainly dominated by grassland and forest, with the highest proportion of forest area (57%). Forest land, water body, and built-up land all show an increasing trend during the study period, increasing by 1348.52 km2, 784.60 km2 and 2457.02 km2, with built-up land increasing the most (135.99%). Cultivated land, grassland and unused land show a decreasing trend, with decreases of 1620.03 km2, 2250.80 km2 and 495.16 km2.
Over the past 20 years, accelerated urbanization and the application of ecological civilization strategies have led to significant changes in land use types in Yunnan. In order to meet peoples’ needs for livelihood, more land is taken up for additional housing and road transport infrastructure construction. Cropland and forest land occupations require extensive permission processes and come at a considerable cost. As a result, while investing in infrastructure, grassland occupancy is given precedence. This has led to a decrease in grassland area. With the backing of ecological civilization, people have become more aware of the need to protect ecological land such as forests and water bodies.

3.1.2. Land Use Dynamic Change

The change of land use dynamics in Yunnan from 2000 to 2020 is shown in Table 2. The comprehensive land use dynamics in Yunnan are small during the whole study period, but the degree of land use change gradually increases by 0.19% from 2015 to 2020. This suggests that as Yunnan’s economic development level has risen, as has the dependence of human economic activity on land resources. Among them, the expansion rate of built-up land is the most dramatic (27.20%), and the dynamic degree of land use reached 12.59% from 2015 to 2020. From 2000 to 2005, there was a decrease in the water bodies’ degree of dynamics, and from 2005 to 2020, there was an increase. The dynamics of cultivated land and grassland were negative, and the overall dynamic of forest land shows positive changes, with a dynamic degree of 0.14%, which only showed a slight decrease from 2010 to 2015. There is no change in the land use dynamics of unused land from 2000 to 2015, but there is a significant decline from 2015 to 2020.

3.1.3. Land Use Transfer

The change in the transfer of land use types from 2000 to 2020 is shown in Table 3. The area of forest land transferred in and out is the largest, 51,177 km2 and 50,018 km2, respectively. The main types of transfer in and out are cultivated land, grassland and water body. The main reason is that the rich forest resources have created a unique advantage for the development of forestry industry in Yunnan. Forest conservation, ecological tourism and the forest economy are developing rapidly. The forest industry has become an important pillar for the economic development of forest people, requiring the occupation of more forest land. With the rapid development of economy and society, built-up land has increased significantly, resulting in a 2742 km2 increase in its transfer in and out area between 2000 and 2020. The main sources of transfer in are cultivated land, forest land and grassland. Since the 21st century, Yunnan has gradually entered a phase of rapid urbanization and industrialization, with a large influx of people to the cities and increased construction of houses and factories to solve the employment problem as well as the housing problem.
The area of arable land and grassland transferred out is larger than the area transferred in, the total area decreased by 1928 km2 and 2384 km2, respectively. The main sources of this transfer were forest land, grassland and built-up land. The main reason is that under the policy of “returning farmland to forest and grass” and the concept of ecological civilization, Yunnan gradually establishes and improves the management system of forest and grass industry, and actively carries out scientific implementation of artificial forestation, grass planting and subsequent nurturing and management work. In order to maintain food security and to prevent the red line of cultivated land, Yunnan is actively dealing with the relationship between the return of cultivated land to forest land and grassland and the protection of cultivated land, and some of the grassland has been transferred to cultivated land.

3.1.4. Land Use Degree Analysis

The land use degree and the rate of change are shown in Figure 3. The land use degree shows a fluctuating upward trend, of which the land use degree reached the highest of 219.63 in 2020, while the lowest land use degree in 2010 was 218.52, and the rate of change of land use degree from 2005 to 2010 was −0.01%, indicating that Yunnan is in a period of land use adjustment. In addition, from 2010 to 2020, the land use degree in Yunnan gradually increased, of which the change rate of land use degree in Yunnan has increased to 0.42% from 2015 to 2020, the growth rate has accelerated significantly, and land use degree has intensified.

3.2. Spatiotemporal Variation of Ecosystem Service Value

3.2.1. Changes in the Total Ecosystem Service Value

Land use changes have caused ESV in Yunnan to show a certain degree of change, and the specific changes are shown in Table 4. From 2000 to 2020, the value of ecosystem services in Yunnan showed an increasing trend, with the total value increasing from 7143.52 × 108 yuan to 7198.28 × 108 yuan, an increase of 0.77%. The ESV of cultivated land and grassland show a decreasing trend during the study period, decreasing by 8.43 × 10⁸ yuan and 44.10 × 10⁸ yuan respectively, with the largest decreases of 1.08% and 2.48% from 2015 to 2020. The main reason is that the implementation of the cultivated land reforestation policy and the accelerated urbanization construction are important factors leading to the decrease in ESV of cultivated land. The ESV of forest land, water body and unused land show an increasing trend, and the order of growth rate is unused land > water body > forest land. The ESV of unused land is the lowest, but the increase is the largest during the study period (135.99%). ESV in water body increased by 70.20 × 10⁸ yuan, but the growth tends to slow down in 2015–2020. The overall ESV of forest land increases by 0.69%, and the share of total ESV remains above 70%. As the area of forest land declines from 2010 to 2015, it also leads to a decreasing trend of forest land ESV, with a decrease of 0.17%.

3.2.2. Changes in the Value of Individual Ecosystem Services

From 2000 to 2020, the value and proportion of individual ecosystem services in Yunnan are shown in Table 5. Among the individual ecosystem service functions in the study area, ESV-regulating services, namely water supply, gas regulation, climate regulation, environmental purification and hydrological regulation, account for the highest proportion (67%). From the perspective of changes in various service functions, food production, raw material production, soil conservation and maintenance of nutrient cycles show a gradual decreasing trend, the main reason is the reduction in cultivated land. The importance of water supply and hydrological regulation is increased by the enormous increase of water body. The value of other service category has an increasing and then diminishing tendency. In the early stage, the economic development level of Yunnan was relatively backward. Cultivated land, forest land and grassland were not destroyed due to human economic activities and ESV showed a growing trend. In the medium term, the process of urbanization and industrialization has accelerated, which has led to changes in the mode of economic development, industrial structure and land use, resulting in a significant reduction in the area of cultivated land and grassland. This leads to a decline in the value of total ecosystem services. In the later period, under the guidance of policies such as the construction of ecological civilization and the green “three cards”, Yunnan begins to transform the economic development model and pursue the coordination of economic, social and ecological benefits, so as to enhance the value of ecosystem services. In the process of urbanization and industrialization in the future, Yunnan should also optimize the structure and layout of land use, alleviate the pressure of economic growth on the ecological environment and strengthen the protection of ecological land such as forest land, grassland and cultivated land.

3.2.3. Spatial Distribution of Ecosystem Service Value

This study calculates the changes of ESV in 16 states and cities from 2000 to 2015 (Table 6), and overall, 50% of Yunnan’s cities and towns have low and lower ESV, with Pu’er having the highest ESV at 867.11 × 10⁸ yuan in 2020. Dehong is the lowest ESV at only 203.17 × 10⁸ yuan in 2020. The natural breakpoint method was used to classify the levels of ESV in 16 states and cities into five classes (Figure 4), where darker colors represent higher ESV levels. Nujiang, Yuxi and Dehong had the lowest levels. Lincang, Kunming, Xishuangbanna, Zhaotong and Baoshan had lower levels. Qujing, Diqing and Lijiang are at an intermediate level. Honghe, Wenshan, Dali and Chuxiong are at a higher level. Pu’er was at the highest level.
Figure 4 and Table 6 show that: (1) From 2000 to 2020, no significant changes in ESV are observed in all the states and cities. The ESV of Kunming, Baoshan, Yuxi and Qujing show a decreasing trend, decreasing by 2.16%, 1.71%, 0.22% and 0.17%, respectively. The remaining states and cities show an increasing trend, with the largest increase of 2.21% in Pu’er. This outcome is mostly attributable to the enhancement of ecosystem services brought about by the proper preservation of forest land and the restoration of cultivated land. (2) Spatially, ESV in Yunnan shows high levels in the northwest, southwest and east, mainly because the ecological civilization strategy is well-practiced, which makes ecological land such as forest land and water body increase, contributing to high ESV levels. The low level of ESV is located at the northeast, west and central parts, mainly because of the high increase in the proportion of construction land caused by urban expansion, which reduced the ESV levels.

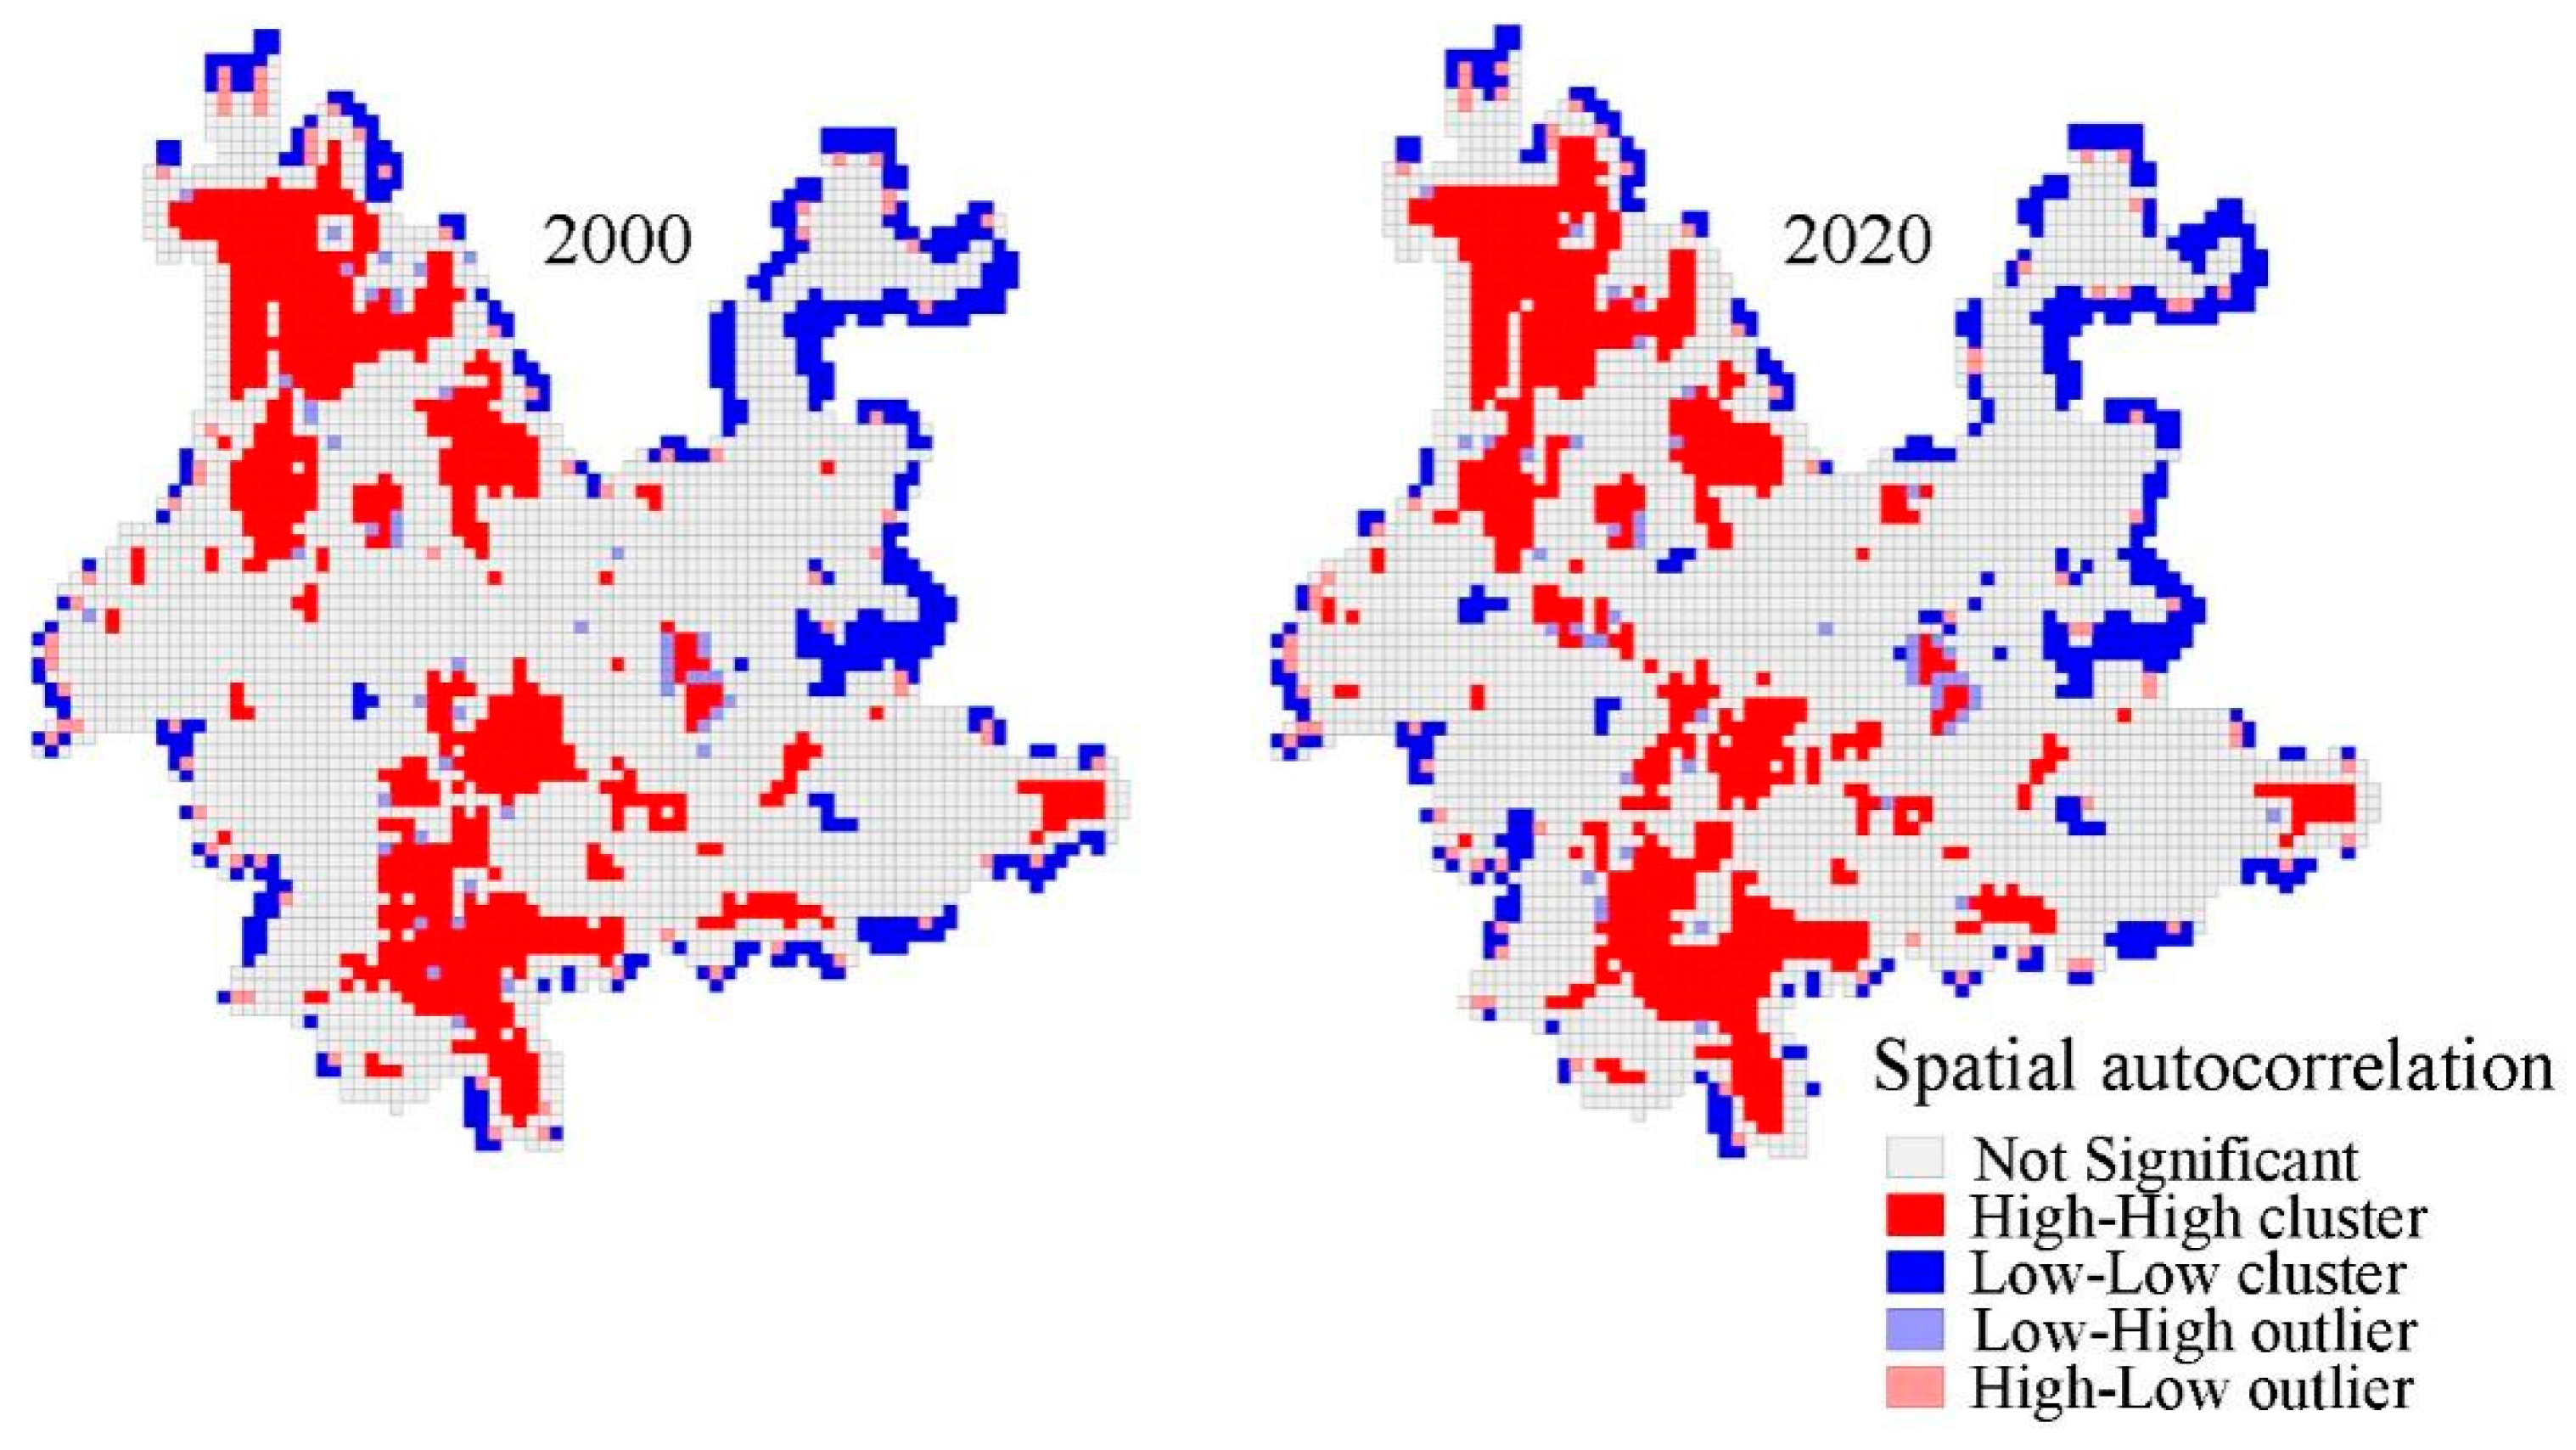
3.2.4. Spatial Autocorrelation Analysis of ESV in Yunnan

Through the spatial autocorrelation analysis of Yunnan ESV by Moran’s I, it was found that the Moran’s I index of Yunnan ESV from 2000 to 2015 is above 0.400 and the p value is less than 0.001, indicating that Yunnan ESV had significant spatial positive correlation and aggregation at the level of 0.001. Among them, the Moran’s I index in 2020 is the lowest, only 0.3993. The spatial positive correlation had a weakening trend, as shown in Table 7.
Figure 5 shows the spatial autocorrelated aggregation of ESV in 2000 and 2020. The high–high cluster area is dispersed, but the changes are not significant. On the whole, the spatial autocorrelation of ESV in Yunnan presents a distribution pattern of “west high-east low”, of which the high–high clusters are concentrated in Diqing, Nujiang, Lijiang, Pu’er and Xishuangbanna. Low–low clusters are concentrated in Zhaotong and Qujing. Not significant areas are widely distributed throughout the province.

3.3. Contribution of Different Land Use Types to Changes in the Value of Ecological Services

Table 8 shows the ecological contribution rates of different land use types from 2000 to 2020. The changes of ecological contribution rates in different land use types from 2000 to 2010 is similar. Forest land has the largest contribution rates to the change of ecosystem service value, 59.23% and 60.13%, respectively. The ecological contribution rates of cultivated land, water body, grassland and unused land decrease sequentially. From 2010 to 2015, the ecological contribution rates of different land use types show great differences. The largest ecological contribution rate is seen from water body, accounting for 68.01%. The ecological contribution rates of forest land decrease from 60.13% to 15.01%. This mainly related to the significant increase in water body and the decrease of forest land at this stage. From 2015 to 2020, grassland contributed the most to the change in the value of ecosystem services, followed by forest land and water body, with 31.82% and 28.72%, respectively. Based on the conditions of the four stages, it is demonstrated that the key contributor and sensitivity element is the change in ecological service value produced by forest land, grassland and water body, which has a significant impact on the change in overall service value in the region.

4. Discussion

Understanding the pattern and extent of land use change is conducive to improving the quality of the global ecological environment and promoting the coordinated development of human–land relations [37]. The implementation of Western development has led to rapid population growth, accelerated urbanization and rapid economic development in Yunnan, which has also led to changes in the land use structure. This study investigated land use and the value of ecosystem services in Yunnan based on five periods of land use data from 2000 to 2020 and analyzed the spatial and temporal evolution characteristics of the value of ecosystem services under land use change. The findings were largely consistent with Yang et al. [38], which showed that forest land is the main type of land use in Yunnan, and that cultivated land, grassland, water body and built-up land increased. Meanwhile, it also confirmed the prediction that the main features of land use change is a rapid expansion of building land and an upward trend in the value of ecosystem services in Yunnan in 2020 [39].
Some scholars also believe that land use change is driven by human economic activities, increasing human demand for food, water, shelter [40] and human actions [41], which have changed the way humans use land. Chen [42] argued that changes in forest land area are mainly associated with timber harvesting and urban expansion. Accelerated urbanization [43], massive labor migration out of the country, and the need for infrastructure construction, etc., to occupy large amounts of land, have changed the pattern of land use. In addition to this, the implementation of land policies, such as two different policies of deforestation and afforestation in different regions, has led to significant spatial heterogeneity in forest land change [44].
Land use change is the main driver of ecosystem services value. Wu [45] concluded that changes in land use and land cover cause ecosystem structure and function. Tariq Aziz [46] argued that the reduction of forest and grassland area makes the value of climate services decrease, while the increase in watershed area makes the value of water supply services increase. This study also maintained that the amount of change in the value of ecological services generated by woodlands, grasslands and watersheds are the main contributors and sensitive factors that affect the total value of regional services. At the same time, natural factors such as climate and topography, as well as socioeconomic factors such as population and industrial structure also have an impact on the value of ecosystem services [47]. Factors that quantitatively analyze ecosystem service value changes were not considered. Therefore, we will consider the influence of economic, social and ecological factors on the value of ecosystem services in the context of Yunnan in future research.

5. Conclusions

In this paper, the value of ecosystem services under different land use types was investigated with Yunnan as an example. We can draw the following conclusions:
(1)
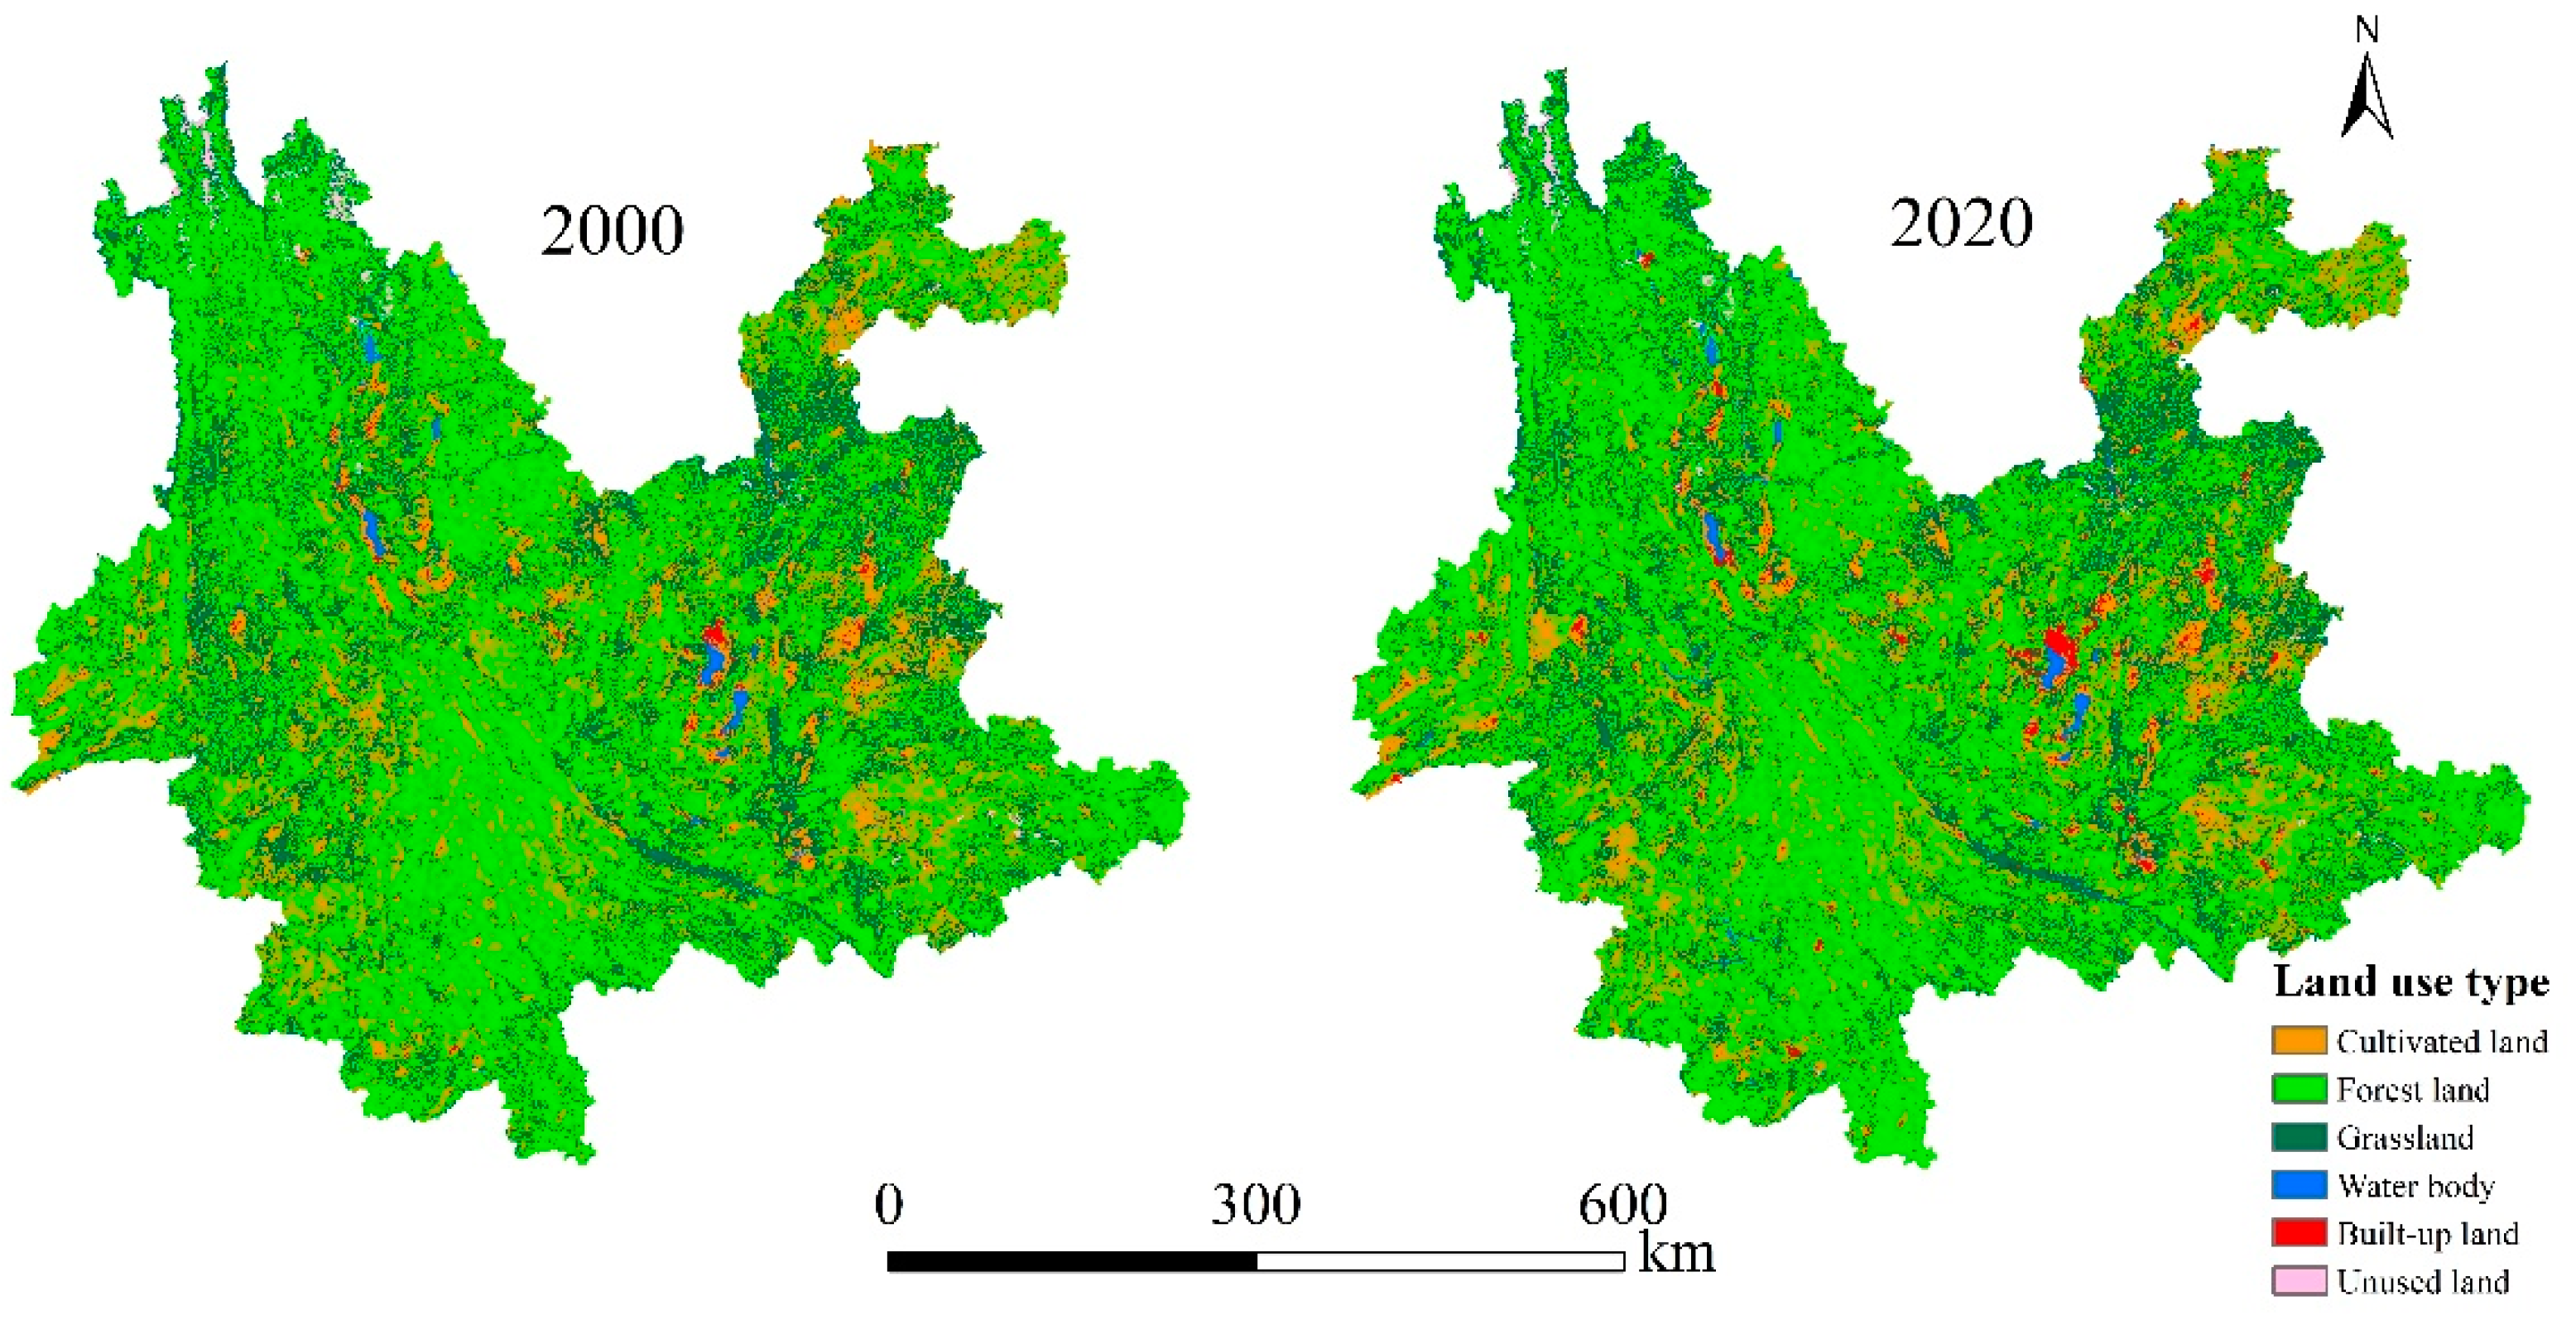
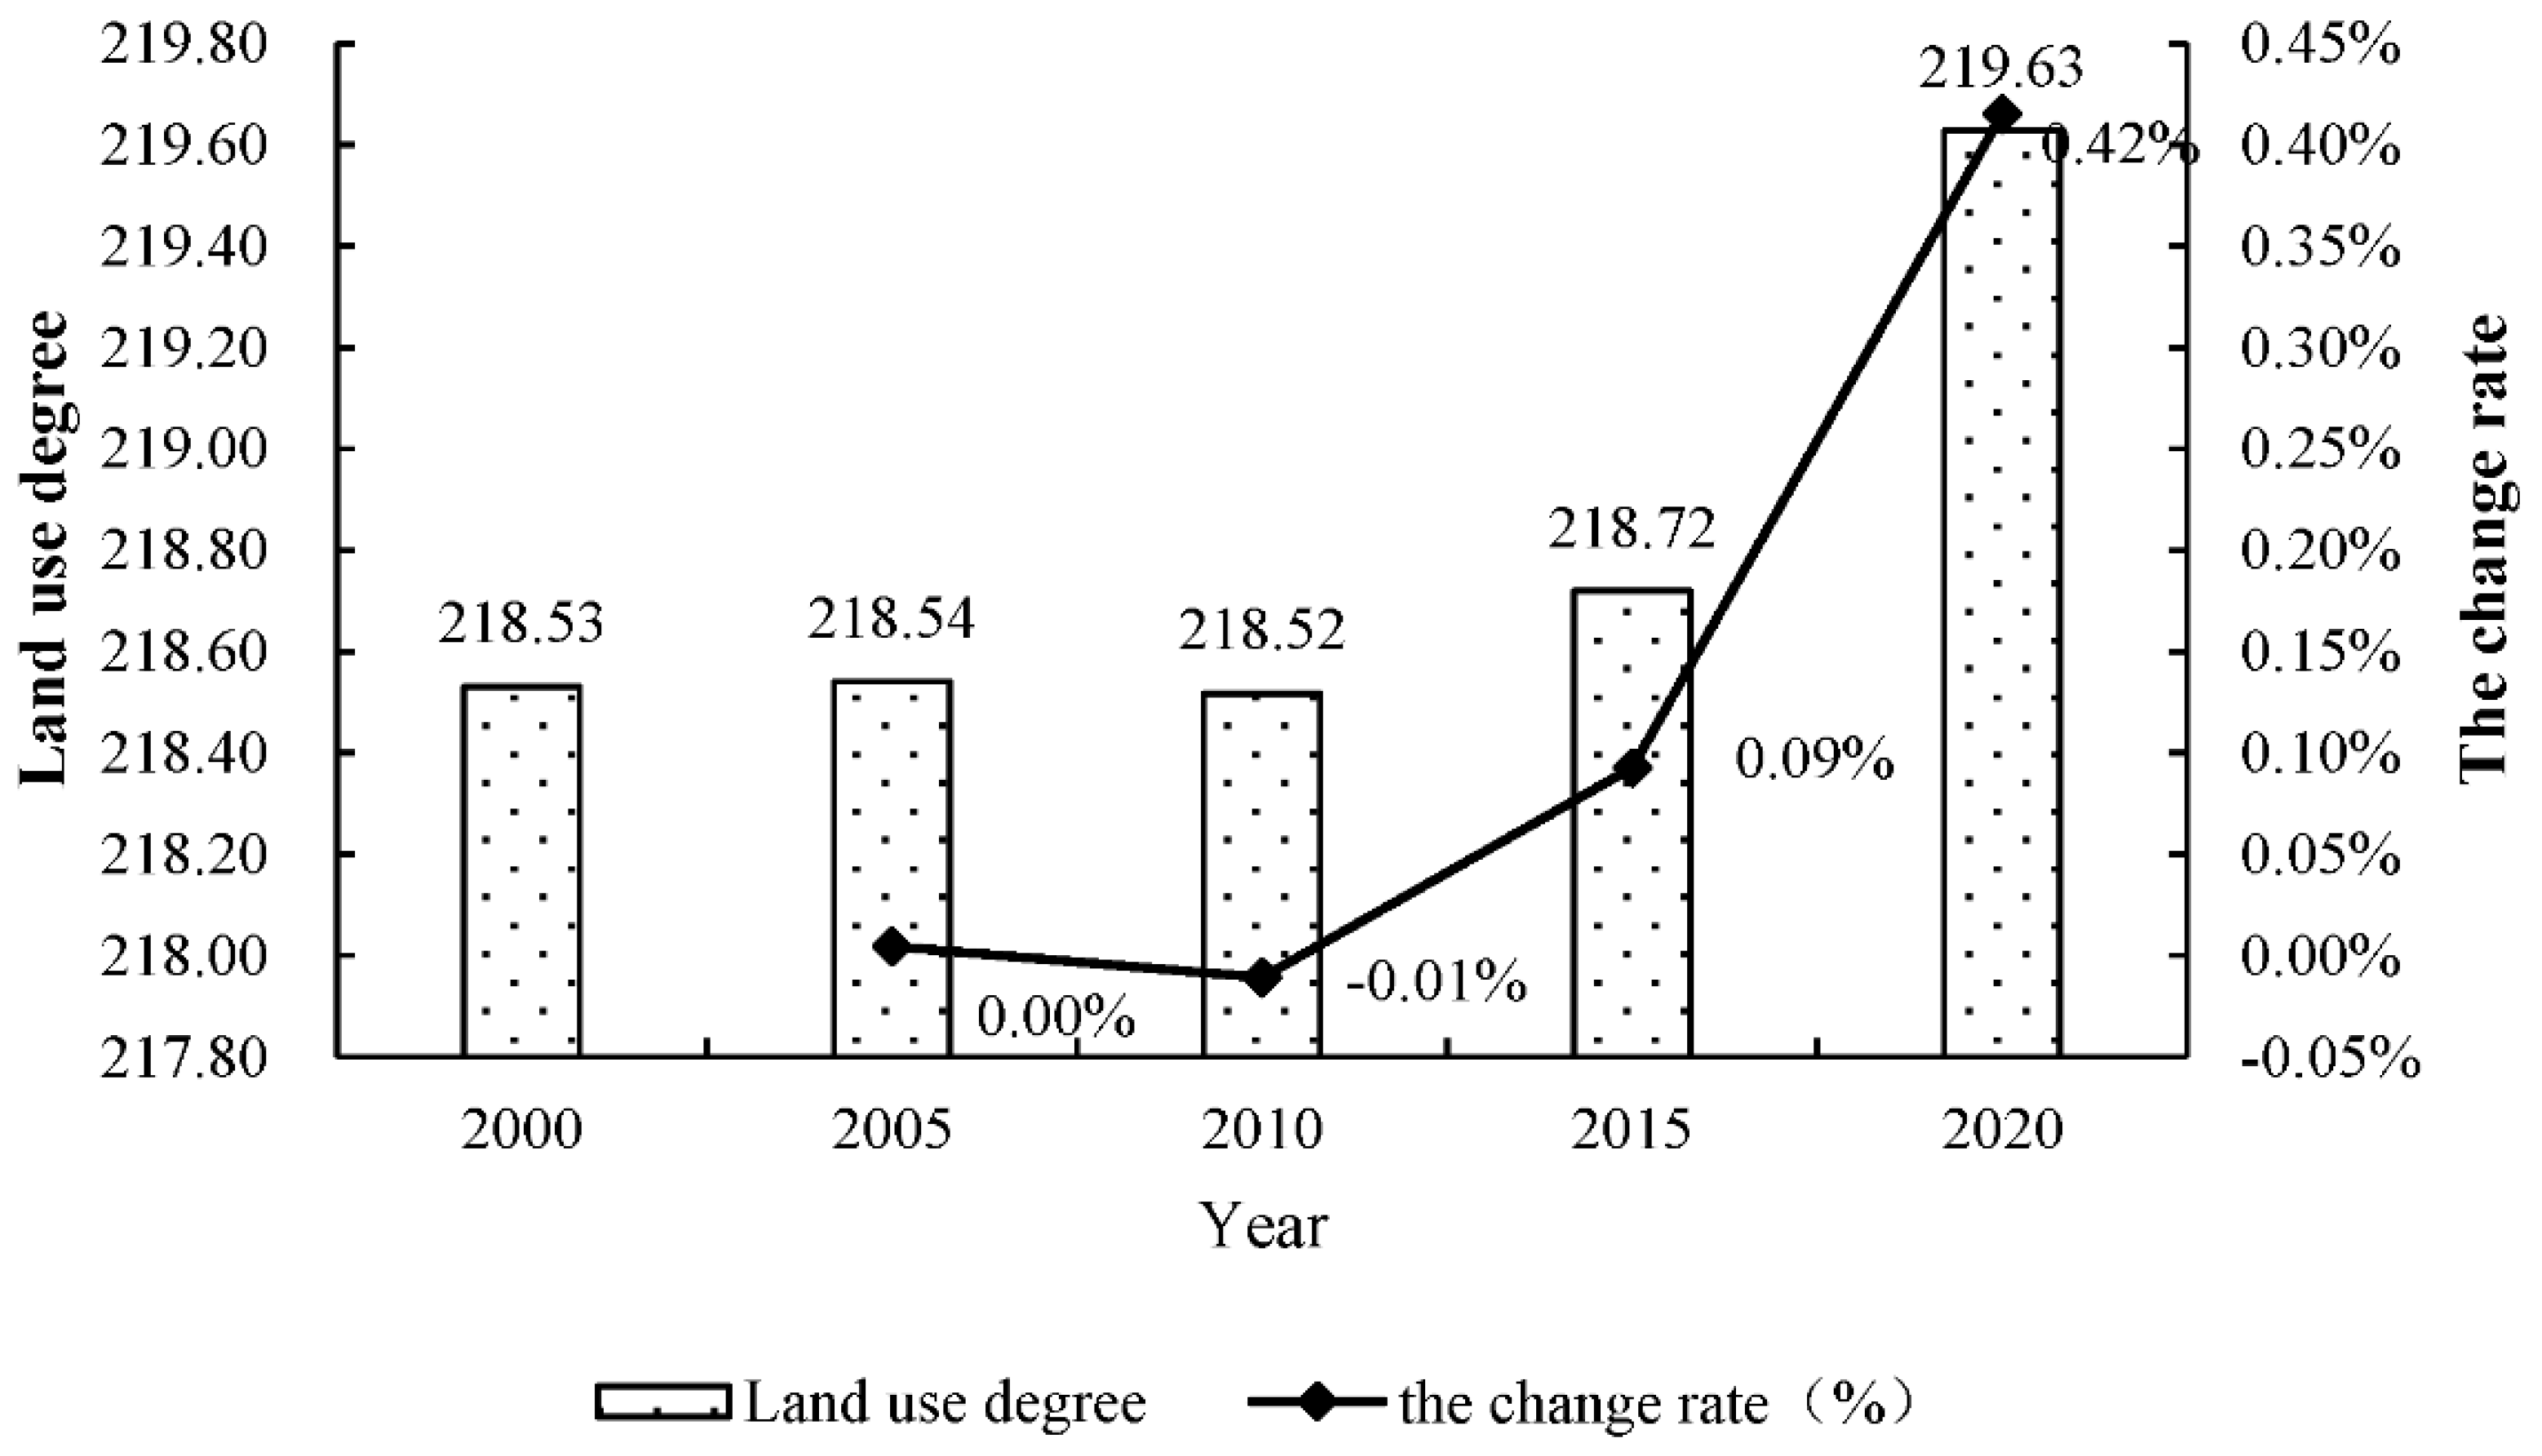
Yunnan is mainly based on cultivated land, grassland and forest land, accounting for about 97% of the total area, of which the forest land area accounted for the largest proportion (more than 57%). From 2000 to 2020, cultivated land, grassland and unused land show a decreasing trend. Forest land, water body and built-up land show an increasing trend. During the study period, the dynamics change of comprehensive land use is small, of which the change in built-up land is the most obvious, and the positive change in water body and forest land was positive. The dynamics of cultivated land, grassland and built-up land were all negative. The transfer of forest land is the most obvious, and the main sources of transfer in and transfer out are cultivated land, grassland and water body. The rate of change of the land use degree composite index shows a fluctuating upward trend, of which the land use degree reaches a maximum of 219.63 in 2020.
(2)
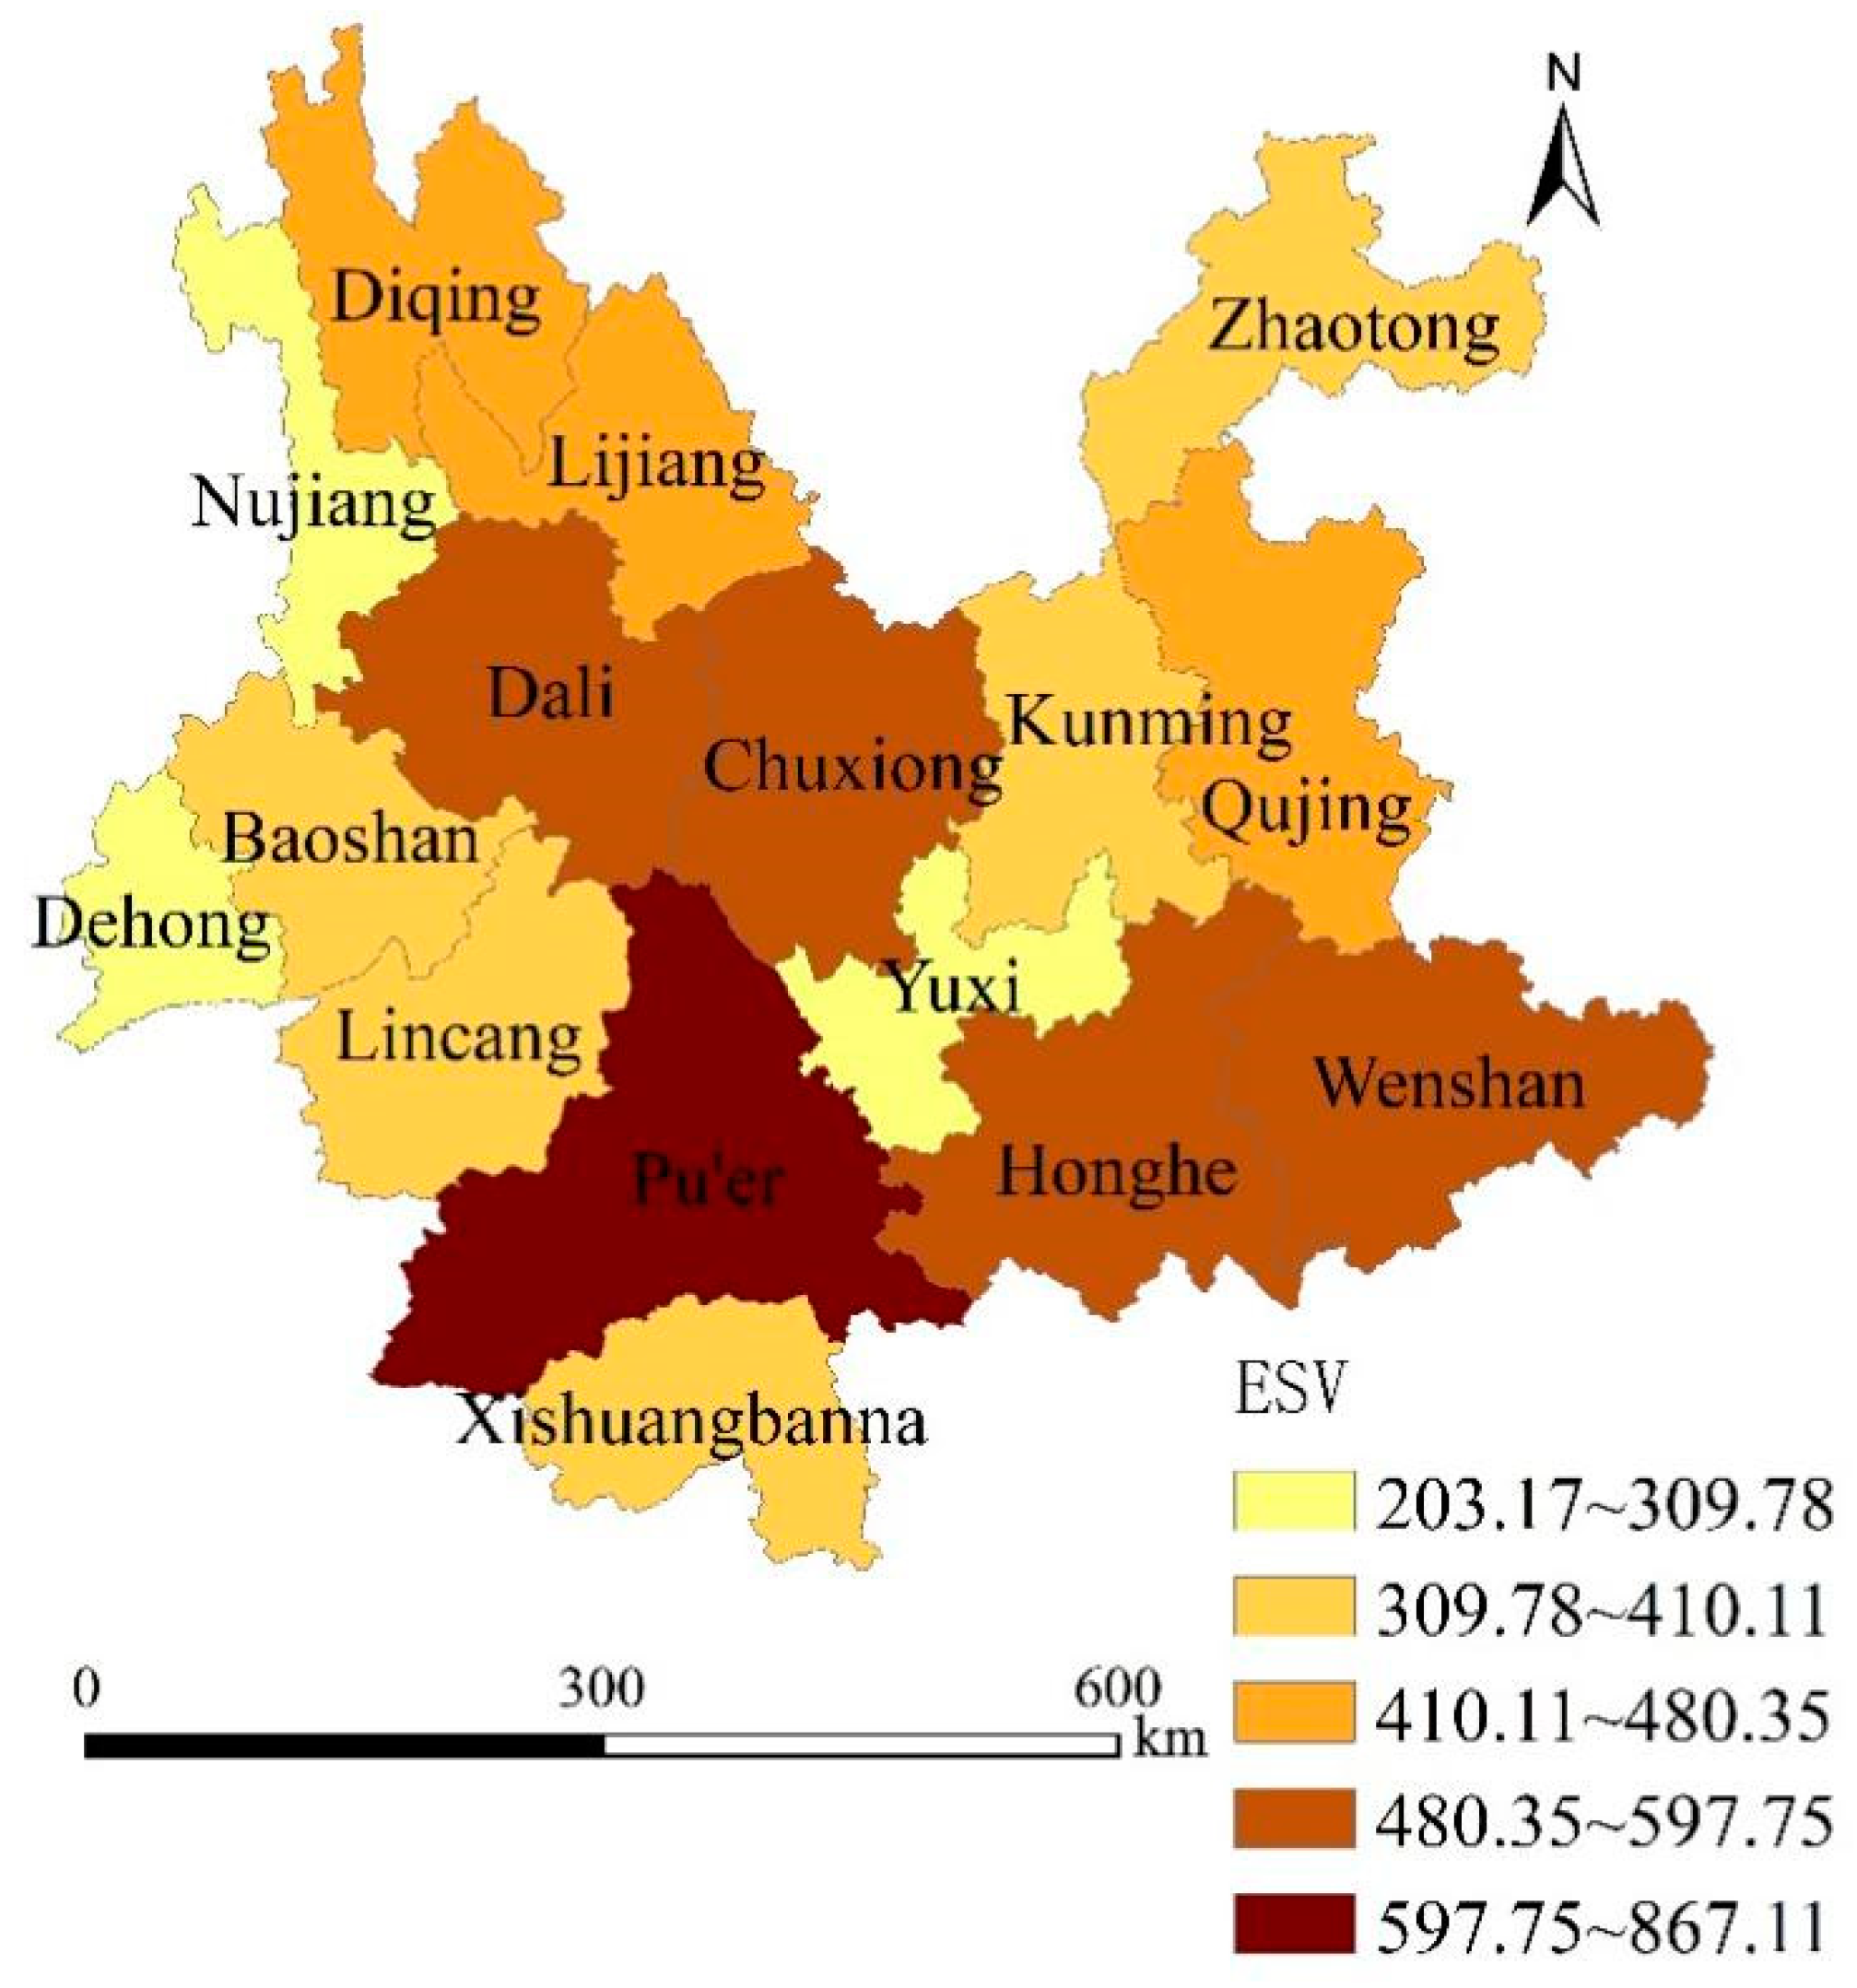
The ecosystem service value in Yunnan shows an increasing trend from 2000 to 2020, with the total value increasing by 0.77%. The ESV of cultivated land and grassland decreases, and the ESV of forest land, water body and unused land increases. ESV for water supply, gas regulation, climate regulation, environmental purification, and hydrological regulation account for 67% of total ESV. The value of food production, raw material production, soil conservation, and maintenance of nutrient cycles show a gradual decreasing trend, and the value of water resources supply and hydrological regulation increases. The values of other service functions show a trend of first increasing and then decreasing. The ESV of Kunming, Qujing, Yuxi and Baoshan decline, while the remaining states and cities show an upward trend, of which Pu’er is the largest.
(3)
From 2000 to 2020, the Moran’s I index of Yunnan ESV is above 0.400 and the p-value is less than 0.001, which has significant spatial positive correlation and aggregation, but the spatial positive correlation of ESV weakens. On the whole, the spatial autocorrelation of ESV in Yunnan shows a distribution pattern of “west high-east low”, and high–high type and low–low type have significant aggregation effects in the study area.
(4)
From 2000 to 2010, the ecological contribution rate of forest land is the largest, and the ecological contribution rate of cultivated land, water body, grassland and unused land decreases sequentially. From 2010 to 2015, the ecological contribution rate of water body to the change in the value of ecosystem services is the largest, accounting for 68.01%, while the ecological contribution rate of forest land is only 15.01%. From 2015 to 2020, grassland contributed the most to changes in the value of ecosystem services, followed by forest land and water body, with 31.82% and 28.72%, respectively. In summary, forest land, grassland and water body are the main contributors and sensitive factors causing ESV change.

Author Contributions

Conceptualization, F.W. and W.F.; methodology, W.F.; software, F.W.; validation, F.W., W.F. and J.C.; formal analysis, J.C.; investigation, F.W.; resources, W.F.; data curation, F.W.; writing—original draft preparation, F.W.; writing—review and editing, W.F. and J.C.; visualization, W.F.; supervision, J.C.; project administration, F.W.; funding acquisition, W.F. All authors have read and agreed to the published version of the manuscript.

Funding

This research was funded by the National Natural Science Foundation of China (No. 72264035).

Data Availability Statement

The data presented in this study are available on request from the first author.

Acknowledgments

The land use remote sensing data set is provided by Data Center for Resources and Environmental Sciences, Chinese Academy of Sciences (RESDC) (http://www.resdc.cn, accessed on 15 September 2022). We are also grateful for the data support provided by the Resource and Environmental Science Data Center of the RESDC.

Conflicts of Interest

The authors declare no conflict of interest.

References

  1. De Groot, R.S.; Wilson, M.A.; Boumans, R.M. A typology for the classification, description and valuation of ecosystem functions, goods and services. Ecol. Econ. 2002, 41, 393–408. [Google Scholar] [CrossRef] [Green Version]
  2. Sannigrahi, S.; Chakraborti, S.; Joshi, P.K.; Keesstra, S.; Sen, S.; Paul, S.K.; Dang, K.B. Ecosystem service value assessment of a natural reserve region for strengthening protection and conservation. J. Environ. Manag. 2019, 244, 208–227. [Google Scholar] [CrossRef] [PubMed]
  3. Fu, J.; Zhang, Q.; Wang, P.; Zhang, L.; Tian, Y.; Li, X. Spatio-Temporal Changes in Ecosystem Service Value and Its Coordinated Development with Economy: A Case Study in Hainan Province, China. Remote Sens. 2022, 14, 970. [Google Scholar] [CrossRef]
  4. Rawlins, J.M.; De Lange, W.J.; Fraser, G.C.G. An ecosystem service value chain analysis framework: A conceptual paper. Ecol. Econ. 2018, 147, 84–95. [Google Scholar] [CrossRef]
  5. Mooney, H.A.; Duraiappah, A.; Larigauderie, A. Evolution of natural and social science interactions in global change research programs. Proc. Natl. Acad. Sci. USA 2013, 110 (Suppl. 1), 3665–3672. [Google Scholar] [CrossRef] [PubMed] [Green Version]
  6. Morshed, S.R.; Fattah, M.A.; Haque, M.N.; Morshed, S.Y. Future ecosystem service value modeling with land cover dynamics by using machine learning based Artificial Neural Network model for Jashore city, Bangladesh. Phys. Chem. Earth Parts A/B/C 2022, 126, 103021. [Google Scholar] [CrossRef]
  7. Jiang, B.; Bai, Y.; Chen, J.; Alatalo, J.M.; Xu, X.; Liu, G.; Wang, Q. Land management to reconcile ecosystem services supply and demand mismatches—A case study in Shanghai municipality, China. Land Degrad. Dev. 2020, 31, 2684–2699. [Google Scholar] [CrossRef]
  8. Cao, Y.; Kong, L.; Zhang, L.; Ouyang, Z. The balance between economic development and ecosystem service value in the process of land urbanization: A case study of China’s land urbanization from 2000 to 2015. Land Use Policy 2021, 108, 105536. [Google Scholar] [CrossRef]
  9. Ouyang, Z.; Song, C.; Zheng, H.; Polasky, S.; Xiao, Y.; Bateman, I.J.; Daily, G.C. Using gross ecosystem product (GEP) to value nature in decision making. Proc. Natl. Acad. Sci. USA 2020, 117, 14593–14601. [Google Scholar] [CrossRef]
  10. Costanza, R.; Darge, R.; Deroot, R.; Farber, S.; Grasso, M.; Hannon, B.; Limburg, K.; Naeem, S.; ONeill, R.V.; Paruelo, J. The value of the world’s ecosystem services and natural capital. Nature 1997, 387, 253–260. [Google Scholar] [CrossRef]
  11. Xie, G.D.; Lu, C.X.; Leng, Y.F.; Zheng, D.; Cheng, L.S. Ecological assets valuation of the Tibetan Plateau. J. Nat. Res. 2003, 18, 189–196. [Google Scholar]
  12. Xie, G.D.; Zhang, C.X.; Zhang, L.M.; Chen, W.H.; Li, S.M. Improvement of the evaluation method for ecosystem service valuebased onper unit area. J. Nat. Resour. 2015, 30, 1243–1254. [Google Scholar]
  13. Wu, C.; Ma, G.; Yang, W.; Zhou, Y.; Peng, F.; Wang, J.; Yu, F. Assessment of Ecosystem Service Value and Its Differences in the Yellow River Basin and Yangtze River Basin. Sustainability 2021, 13, 3822. [Google Scholar] [CrossRef]
  14. Jiang, W.; Lü, Y.; Liu, Y.; Gao, W. Ecosystem service value of the Qinghai-Tibet Plateau significantly increased during 25 years. Ecosyst. Serv. 2020, 44, 101146. [Google Scholar] [CrossRef]
  15. Peng, K.; Jiang, W.; Ling, Z.; Hou, P.; Deng, Y. Evaluating the potential impacts of land use changes on ecosystem service value under multiple scenarios in support of SDG reporting: A case study of the Wuhan urban agglomeration. J. Clean. Prod. 2021, 307, 127321. [Google Scholar] [CrossRef]
  16. Li, C.; Wu, Y.; Gao, B.; Zheng, K.; Wu, Y.; Li, C. Multi-scenario simulation of ecosystem service value for optimization of land use in the Sichuan-Yunnan ecological barrier, China. Ecol. Indic. 2021, 132, 108328. [Google Scholar] [CrossRef]
  17. Rahman, M.M.; Szabó, G. Impact of Land Use and Land Cover Changes on Urban Ecosystem Service Value in Dhaka, Bangladesh. Land 2021, 10, 793. [Google Scholar] [CrossRef]
  18. Pan, N.; Guan, Q.; Wang, Q.; Sun, Y.; Li, H.; Ma, Y. Spatial differentiation and driving mechanisms in ecosystem service value of Arid Region: A case study in the middle and lower reaches of Shule River Basin, NW China. J. Clean. Prod. 2021, 319, 128718. [Google Scholar] [CrossRef]
  19. Xie, Z.; Li, X.; Chi, Y.; Jiang, D.; Zhang, Y.; Ma, Y.; Chen, S. Ecosystem service value decreases more rapidly under the dual pressures of land use change and ecological vulnerability: A case study in Zhujiajian Island. Ocean. Coast. Manag. 2021, 201, 105493. [Google Scholar] [CrossRef]
  20. Gu, X.; Long, A.; Liu, G.; Yu, J.; Wang, H.; Yang, Y.; Zhang, P. Changes in Ecosystem Service Valuein the 1 km Lakeshore Zone of Poyang Lake from 1980 to 2020. Land 2021, 10, 951. [Google Scholar] [CrossRef]
  21. Makwinja, R.; Kaunda, E.; Mengistou, S.; Alamirew, T. Impact of land use/land cover dynamics on ecosystem service value—A case from Lake Malombe, Southern Malawi. Environ. Monit. Assess. 2021, 193, 492. [Google Scholar] [CrossRef]
  22. Guo, C.; Gao, J.; Zhou, B.; Yang, J. Factors of the ecosystem service value in water conservation areas considering the natural environment and human activities: A case study of Funiu mountain, China. Int. J. Environ. Res. Public Health 2021, 18, 11074. [Google Scholar] [CrossRef] [PubMed]
  23. Woldeyohannes, A.; Cotter, M.; Biru, W.D.; Kelboro, G. Assessing changes in ecosystem service values over 1985–2050 in response to land use and land cover dynamics in Abaya-Chamo Basin, Southern Ethiopia. Land 2020, 9, 37. [Google Scholar] [CrossRef] [Green Version]
  24. He, Y.; Wang, W.; Chen, Y.; Yan, H. Assessing spatio-temporal patterns and driving force of ecosystem service value in the main urban area of Guangzhou. Sci. Rep. 2021, 11, 3027. [Google Scholar] [CrossRef] [PubMed]
  25. Hou, L.; Wu, F.; Xie, X. The spatial characteristics and relationships between landscape pattern and ecosystem service value along an urban-rural gradient in Xi’an city, China. Ecol. Indic. 2020, 108, 105720. [Google Scholar] [CrossRef]
  26. Yuan, K.; Li, F.; Yang, H.; Wang, Y. The influence of land use change on ecosystem service value in Shangzhou District. Int. J. Environ. Res. Public Health 2019, 16, 1321. [Google Scholar] [CrossRef] [PubMed] [Green Version]
  27. Zhang, X.; Xie, H.; Shi, J.; Lv, T.; Zhou, C.; Liu, W. Assessing changes in ecosystem service values in response to land cover dynamics in Jiangxi Province, China. Int. J. Environ. Res. Public Health 2020, 17, 3018. [Google Scholar] [CrossRef]
  28. Mamat, A.; Wang, J.; Ma, Y. Impacts of Land-Use Change on Ecosystem Service Value of Mountain–Oasis–Desert Ecosystem: A Case Study of Kaidu–Kongque River Basin, Northwest China. Sustainability 2021, 13, 140. [Google Scholar] [CrossRef]
  29. Magalhães Filho, L.; Roebeling, P.; Bastos, M.I.; Rodrigues, W.; Ometto, G. A Global Meta-Analysis for Estimating Local Ecosystem Service Value Functions. Environments 2021, 8, 76. [Google Scholar] [CrossRef]
  30. Kang, B.; Shao, Q.; Xu, H.; Jiang, F.; Wei, X.; Shao, X. Research on grassland ecosystem service value in China under climate change based on meta-analysis: A case study of Qinghai province. Int. J. Clim. Chang. Strateg. Manag. 2020, 12, 617–637. [Google Scholar] [CrossRef]
  31. Ye, S.; Laws, E.A.; Costanza, R.; Brix, H. Ecosystem service value for the common reed wetlands in the Liaohe Delta, Northeast China. Open J. Ecol. 2016, 6, 129–137. [Google Scholar] [CrossRef] [Green Version]
  32. Peng, J.; Yang, Y.; Liu, Y.; Du, Y.; Meersmans, J.; Qiu, S. Linking ecosystem services and circuit theory to identify ecological security patterns. Sci. Total Environ. 2018, 644, 781–790. [Google Scholar] [CrossRef] [PubMed]
  33. Feng, J.; Guo, L.; Li, X. Temporal and Spatial Variations of Land Uses and Their Influences on Ecosystem Service Function Values in Hanzhong City. Res. Soil Water Conserv. 2020, 27, 275–282. (In Chinese) [Google Scholar]
  34. Hu, S.; Chen, L.; Li, L.; Wang, B.; Yuan, L.; Cheng, L.; Yu, Z.; Zhang, T. Spatiotemporal Dynamics of Ecosystem Service Value Determined by Land-Use Changes in the Urbanization of Anhui Province, China. Int. J. Environ. Res. Public Health 2019, 16, 5104. [Google Scholar] [CrossRef] [Green Version]
  35. Gu, M.; Ye, C.; Li, X.; Hu, H. Land-Use Optimization Based on Ecosystem Service Value: A Case Study of Urban Agglomeration around Poyang Lake, China. Sustainability 2022, 14, 7131. [Google Scholar] [CrossRef]
  36. Zhao, Y.; Han, Z.; Xu, Y. Impact of Land Use/Cover Change on Ecosystem Service Value in Guangxi. Sustainability 2022, 14, 10867. [Google Scholar] [CrossRef]
  37. Lou, Y.; Yang, D.; Zhang, P.; Zhang, Y.; Song, M.; Huang, Y.; Jing, W. Multi-Scenario Simulation of Land Use Changes with Ecosystem Service Value in the Yellow River Basin. Land 2022, 11, 992. [Google Scholar] [CrossRef]
  38. Yang, L.; Liu, F. Spatio-Temporal Evolution and Driving Factors of Ecosystem Service Value of Urban Agglomeration in Central Yunnan. Sustainability 2022, 14, 10823. [Google Scholar] [CrossRef]
  39. Zhang, H.; Liao, X.; Zhai, T. Evaluation of ecosystem service based on scenario simulation of land use in Yunnan Province. Phys. Chem. Earth Parts A/B/C 2018, 104, 58–65. [Google Scholar] [CrossRef]
  40. De Jong, L.; De Bruin, S.; Knoop, J.; van Vliet, J. Understanding land-use change conflict: A systematic review of case studies. J. Land Use Sci. 2021, 16, 223–239. [Google Scholar] [CrossRef]
  41. Alam, A.; Bhat, M.S.; Maheen, M. Using Landsat satellite data for assessing the land use and land cover change in Kashmir valley. GeoJournal 2020, 85, 1529–1543. [Google Scholar] [CrossRef] [Green Version]
  42. Chen, L.; Sun, Y.; Saeed, S. Monitoring and predicting land use and land cover changes using remote sensing and GIS techniques—A case study of a hilly area, Jiangle, China. PLoS ONE 2018, 13, e0200493. [Google Scholar]
  43. Estoque, R.C.; Murayama, Y. Quantifying landscape pattern and ecosystem service value changes in four rapidly urbanizing hill stations of Southeast Asia. Landsc. Ecol. 2016, 31, 1481–1507. [Google Scholar] [CrossRef]
  44. Chen, H.; Chen, Y.; Chen, X.; Zhang, X.; Wu, H.; Li, Z. Impacts of Historical Land Use Changes on Ecosystem Services in Guangdong Province, China. Land 2022, 11, 809. [Google Scholar] [CrossRef]
  45. Wu, C.; Chen, B.; Huang, X.; Wei, Y.D. Effect of land-use change and optimization on the ecosystem service value and its interaction with human activities in Xinjiang, China. Ecol. Indic. 2020, 110, 105826. [Google Scholar]
  46. Aziz, T. Changes in land use and ecosystem services values in Pakistan, 1950–2050. Environ. Dev. 2021, 37, 100576. [Google Scholar] [CrossRef]
  47. Díaz-Caravantes, R.E.; Sánchez-Flores, E. Water transfer effects on peri-urban land use/land cover: A case study in a semi-arid region of Mexico. Appl. Geogr. 2011, 31, 413–425. [Google Scholar] [CrossRef]
Figure 1. Geographic location and topography of the study area.
Land 11 02217 g001
Figure 2. Spatial distribution of land use type between 2000 and 2020.
Land 11 02217 g002
Figure 3. Land use degree and change rate.
Land 11 02217 g003
Figure 4. Spatial distribution of ESV in 2020.
Land 11 02217 g004
Figure 5. Spatial autocorrelation aggregation of ESV in 2000 and 2020.
Land 11 02217 g005
Table 1. Coefficient of the ESV in Yunnan (yuan/ha).
Service TypeService Type
Subcategories
Cultivated LandForest LandGrasslandWater BodyUnused Land
Provisioning
service
Food production1455.17332.52307.28526.766.58
Raw material production322.64763.80559.68151.4419.75
Regulating
service
Water supply−1718.55395.07309.736880.8013.17
Gas regulation1172.042511.991967.05625.5385.60
Climate regulation612.367516.215200.171863.4165.85
Purifying the environment177.782202.521717.093759.75269.96
Hydrological regulation1968.774918.623809.1172,014.69158.03
Supporting
service
Soil conservation684.793058.502396.32612.3698.77
Maintaining nutrient circulation204.12233.75184.7546.096.58
Biodiversity223.872785.242178.971685.6392.18
Cultural
service
Aesthetic landscape98.771221.42961.791303.7339.51
Total5201.7625,939.6419,591.9489,470.20855.99
Table 2. Land use dynamics change in Yunnan from 2000 to 2020.
PeriodSingle Land Use Dynamics (%)Comprehensive Land Use Dynamics (%)
Cultivated LandForest LandGrasslandWater BodyBuilt-Up LandUnused Land
2000–2005−0.080.010.00−0.051.540.000.01
2005–2010−0.110.02−0.010.121.300.000.02
2010–2015−0.13−0.03−0.073.355.240.100.06
2015–2020−0.220.14−0.502.3612.59−5.370.19
2000–2020−0.530.14−0.576.2027.20−5.290.26
Table 3. Transfer of land use types in Yunnan from 2000 to 2020 (unit: km2).
20002020
Cultivated LandForest LandGrasslandWater BodyBuilt-Up LandUnused LandTotal Transfer OutTransfer Out Ratio (%)
Cultivated land32,23721,82111,78367424064636,73027.44
Forest land20,530168,25127,54091673030250,01837.37
Grassland12,74128,42145,13281281129743,08232.19
Water body5634303891340951114881.11
Built-up land90320015539728513020.97
Unused land6530583124287012270.92
Total transfer in34,80251,17740,69824654044661
Transfer-in ratio (%)26.0038.2430.411.843.020.49
Net transfer in−19281159−23849772742−566
Table 4. ESV and change rate in Yunnan from 2000 to 2020.
TypesEcosystem Service Value (108 Yuan)Change Rate (%)
200020052010201520202000–20052005–20102010–20152015–20202000–2020
Cultivated land319.93318.65316.92314.90311.50−0.40 −0.54 −0.64 −1.08 −2.63
Forest land5049.875052.865058.535050.125084.850.06 0.11 −0.17 0.69 0.69
Grassland1545.791545.731545.201539.951501.690.00 −0.03 −0.34 −2.48 −2.85
Water body226.39225.78227.17265.24296.59−0.27 0.61 16.76 11.82 31.01
Built-up land0.000.000.000.000.000.00 0.00 0.00 0.00 0.00
Unused land1.551.671.772.243.657.71 6.51 26.22 62.97 135.99
Total7143.527144.697149.597172.467198.280.02 0.07 0.32 0.36 0.77
Table 5. Changes in the value and proportion of individual services in land ecosystems in Yunnan from 2000 to 2020 (unit: 108 yuan).
Category20002005201020152020
ESVPercent
Age (%)
ESVPercent
Age (%)
ESVPercent
Age (%)
ESVPercent
Age (%)
ESVPercent
Age (%)
Food production179.822.52179.502.51179.092.50178.562.49177.652.47
Raw material213.122.98213.132.98213.172.98212.732.97212.532.95
Water supply13.090.1813.510.1914.270.2017.660.2521.140.29
Gas regulation718.0510.05718.0510.05718.1810.05716.709.99715.819.94
Climate regulation1916.0226.821916.7226.831918.0626.831914.8226.701915.0926.60
Purifying the environment585.198.19585.418.19585.888.19586.388.18587.628.16
Hydrological regulation1561.6721.861561.2821.851562.7321.861590.0922.171613.4422.41
Soil conservation828.3311.60828.5211.60828.9211.59827.3411.53826.6811.48
Maintaining nutrient circulation72.771.0272.741.0272.721.0272.541.0172.391.01
Biodiversity732.3410.25732.6110.25733.1210.25732.3110.21732.3810.17
Aesthetic Landscape323.114.52323.224.52323.464.52323.344.51323.564.49
Total7143.52100.007144.69100.007149.59100.007172.46100.007198.28100.00
Table 6. ESV in Yunnan states and cities from 2000 to 2020.
AreaESV (108 Yuan)Change Rate (%)
20002005201020152020
Kunming388.11387.75388.32386.09379.73−2.16
Qujing481.14481.02480.71480.67480.35−0.17
Yuxi291.02290.95291.04290.85290.36−0.22
Baoshan354.64354.91354.84357.31348.57−1.71
Zhaotong370.31370.56371.04371.77376.831.76
Lijiang431.65431.60431.74435.38432.420.18
Pu’er848.33848.74849.36860.09867.112.21
Lincang403.31404.11404.48410.49410.111.69
Chuxiong528.25528.29528.76528.87533.280.95
Honghe596.67596.62597.02595.17597.750.18
Wenshan560.82560.76561.40560.70565.590.85
Xishuangbanna369.56369.48370.06369.59377.322.10
Dali541.27541.31541.80543.64544.370.57
Dehong202.96202.97203.10204.83203.170.11
Nujiang305.56305.56305.72305.62309.781.38
Diqing469.98469.98470.04470.77479.061.93
Table 7. Spatial autocorrelation of ESV in Yunnan from 2000 to 2020.
YearMoran’s IZ-Scorep-Value
2000 0.4113 36.8344 0.001
2005 0.4110 36.8122 0.001
2010 0.4102 36.7354 0.001
2015 0.4091 36.6358 0.001
2020 0.3993 35.7759 0.001
Table 8. Ecological contribution rates of different land use types from 2000 to 2020 (unit: %).
PeriodCultivated LandForest LandGrasslandWater BodyBuilt-Up LandUnused Land
2000–200525.25 59.23 1.13 12.02 0.00 2.37
2005–201018.41 60.13 5.63 14.68 0.00 1.15
2010–20153.59 15.01 9.38 68.01 0.00 4.00
2015–20203.12 31.82 35.05 28.72 0.00 1.29
Publisher’s Note: MDPI stays neutral with regard to jurisdictional claims in published maps and institutional affiliations.

