
Acceptance of Tourist Offers and Territory: Cluster Analysis of Ibiza Residents (Spain)


Abstract
:1. Introduction
2. Literature Review
- Between 10% (mature destinations) and 50% (incipient destinations) of the sample are clear enthusiastic advocates of tourism development in the region [19]. The most enthusiastic supporters are given different names: lovers [11,33,34,35,36,37], enthusiasts [38,39,40], supporters [1,41,42,43,44,45], development supporters [46,47,48], tourism supporters [49], favorers [50], optimists [51,52], absolute supporters [53], developers [49], high-supporters [54], enthusiastic supporters [55], etc. This resident profile magnifies the positive effects of tourism development, especially economic improvements, and minimizes the negative effects, usually social and environmental. They are usually people who have greatly improved, or hope to greatly improve, their personal economic situation thanks to tourism.
- Between 10% (emerging destinations) and 30% (mature destinations) are critical or contrary to tourism development in the region [19]. The tourism detractors are called: haters [33,34,35,36], somewhat irritated [39,40,55], opponents [44,45,56], cynics [44], critics [37,38,41], protectionists [46,47,49], opposers [1,50], pessimists [51], skeptics [48], low-supporters [54], etc. This group shows higher concern about the negative effects of tourism and would prefer a decrease in the tourism sector. Normally, they are people without a personal economic benefit derived directly from the tourism sector and who work in sectors that are very disconnected from tourism. For them, tourism only contributes negatively and is a nuisance or inconvenience.

| Ref. | Destination | Country | Clusters |
|---|---|---|---|
| [46] | Balearic Islands | Spain | Development supporters; prudent developers; ambivalent and cautious; protectionists; alternative developers. |
| [65] | Crete | Greece | Advocates; socially and environmentally concerned; economic sceptics. |
| [47] | Folgaria (Trentino) | Italy | Environmental supporters; development supporters; protectionists; ambivalents. |
| [49] | Folgaria (Trentino) | Italy | Protectionists; ambivalent and cautious; tourism supporters. |
| [56] | Cruise Tourism, Cartagena de Indias | Colombia | Opponents; neutrals; developers; tourism workers. |
| [66] | Oporto; Coast of Alentejo | Portugal | Residents with low expenditures; visitors with medium expenditures; more attractive visitors. |
| [57] | Eight annual events in Macao | China | Embracers; realists; experiencers. |
| [33] | Florida | United States | Lovers; haters; cautious romantics; in-betweeners; love ‘em for a reason. |
| [38] | Arzachena (Sardinia) | Italy | Enthusiastics; moderate supporters; critics; indifferents. |
| [60] | Naples | Italy | Indifferents; moderate lovers; moderate critics; cautious. |
| [51] | Cruise Tourism, Valencia | Spain | Pessimists; cautious supporters; optimists. |
| [41] | FIA World Rally Championship, Olbia (Sardinia) | Italy | Supporters; neutrals; enthusiasts but culturally and environmentally concerned; critics. |
| [67] | Pafos | Cyprus | Engagers; pragmatists; adherents; ambivalents. |
| [34] | Gold Coast Indy Car Race | Australia | Ambivalent supporters (cautious romantics); haters; realists; lovers; concerned for a reason. |
| [68] | Australian Formula 1 Grand Prix | Australia | Very negative; negative; unconcerned; positive; very positive. |
| [61] | Tenerife; Majorca | Spain | Positive; cautious; critics. |
| [42] | Adriatic Coast | Italy | Supporters; cautious; sceptics. |
| [55] | Erdaobaihe | China | Somewhat irritated; enthusiastic supporters; cautious romantics; in-betweeners. |
| [69] | Shanghai | China | Pecuniary benefit seeker; nature advocator; family life reliever. |
| [70] | Goldfields; The Grampians; The Murray; Gippsland Natural Discovery; Goulburn Murray Water (Victoria) | Australia | Tourism industry connection; low tourism connection; neutral tourism development; high tourism connection. |
| [58] | Shenzhen | China | Neutrals; boosters; realists; objectors. |
| [48] | Björholmen; Käringön; Marstrand | Sweden | Development supporters; prudent developers; ambivalent/cautious; skeptics. |
| [35] | Sedona; York | United States; United Kingdom | Haters; lovers; realists. |
| [36] | Gran Canarias | Spain | (1) Extreme tourist lovers; extreme tourist haters; ambivalents. (2) Lovers; haters; ambivalents. |
| [43] | Spring Break, Acapulco | Mexico | Supporters; ambivalents; realistics. |
| [62] | Old City of Dubrovnik | Croatia | Cultural and safety carers; cultural illuminators; phlegmatics. |
| [50] | Termoli | Italy | Activists; disenchanted; opposers; favorers. |
| [52] | Cape Verde | Cape Verde | Optimistic; rational; indifferent. |
| [39] | Bakewell | United Kingdom | Enthusiast; somewhat irritated; middle-of-the-roaders. |
| [63] | Rangitikei | New Zealand | Moderate enthusiasts; extreme enthusiast; cautious supporters. |
| [1] | Ibiza | Spain | Supporters; opposers; mild opposers. |
| [64] | Goynuk; Camyuva | Turkey | Public service and environment focused; community focused; community public service; inconsequential. |
| [71] | Eilat | Israel | Nature aesthete; appreciator; critical. |
| [37] | Southern Lakes Region | New Zealand | Lovers; we miss out; self-interest supporters; critics. |
| [72] | Guimarães | Portugal | Sceptics; moderately optimistic; enthusiasts. |
| [53] | Ecotourism | Cambodia | Absolute supporter; beneficiary supporter; concerned supporter; ambivalent. |
| [54] | Central Vietnam | Vietnam | High-support; low-support; neutral. |
| [40] | Hong Kong | China | Middle-of-the-roaders; enthusiasts; somewhat irritated. |
| [44] | Tamborine Mountain (Queensland) | Australia | Supporters; opponents; neutrals. |
| [45] | Gold Coast | Australia | Supporters; conditional supporters; conditional opponents; opponents. |
| [11] | Auckland; Blenheim; Christchurch; Hokitika; Kaikoura; Napier; Queenstown; Rotorua; Taupo; Whangarei | New Zealand | Lovers; cynics; taxpayers; innocents. |
3. Methodology
4. Results
- Disappointed (11.02%). The members of this cluster provided moderate responses, close to indifference, for most offers (Table 3). Only family sun and beach tourism (acceptable with 3.54) and “all inclusive” (unacceptable with 2.45) obtained clearly different ratings of 3 (indifference). The most common sociodemographic profile was people under 30 years of age and mostly residents of the municipalities of Eivissa and Sant Joan, with little presence in the municipality of Sant Antoni (Table 4).
- Favorable with nuances (20.19%). The members of this cluster valued sport, nautical, MICE (“Meetings, Incentives, Conferences & Exhibitions”), nature, rural, cultural, and family tourism very positively. They valued moderately positively the tourism of second residences and vacation homes for rent. Nightlife tourism was considered unacceptable, while golf tourism and “all inclusive” were very unacceptable (Table 3). The most common sociodemographic profile was people under 46 years old, with a higher education level, and mostly residents in the municipality of Santa Eulària, with little presence in the municipality of Sant Antoni (Table 4). This cluster showed a more complex and selective response to the proposed offers.
- Moderate (21.74%). The members of this cluster positively valued all tourist offers, except “all inclusive” (Table 3). The most common sociodemographic profile was people over 60 years old, with primary education, and mostly residents in the municipality of Sant Antoni, with little presence in the municipality of Sant Josep (Table 4). These were elderly people living in the center of the island and partially isolated from tourism.
- Enthusiasts but anti-nightclub (21.58%). The members of this cluster positively valued the majority of tourist offers (scores higher than four), but rejected the offers of nightlife and “all inclusive” (Table 3). The most common sociodemographic profile was people over 45 years old and mostly residents of the municipality of Eivissa, with little presence in the municipality of Santa Eulària (Table 4).
- Enthusiasts (25.47%). The members of this cluster demonstrated very high levels of acceptance for most tourist offers (scores above four), but rejected “all inclusive” (Table 3). The sociodemographic profile corresponds to people who were mainly residents in the municipalities of Sant Antoni and Sant Josep, with little presence in the municipality of Santa Eulària (Table 4). There was only a scarce presence of people over 60 years of age.
5. Discussion
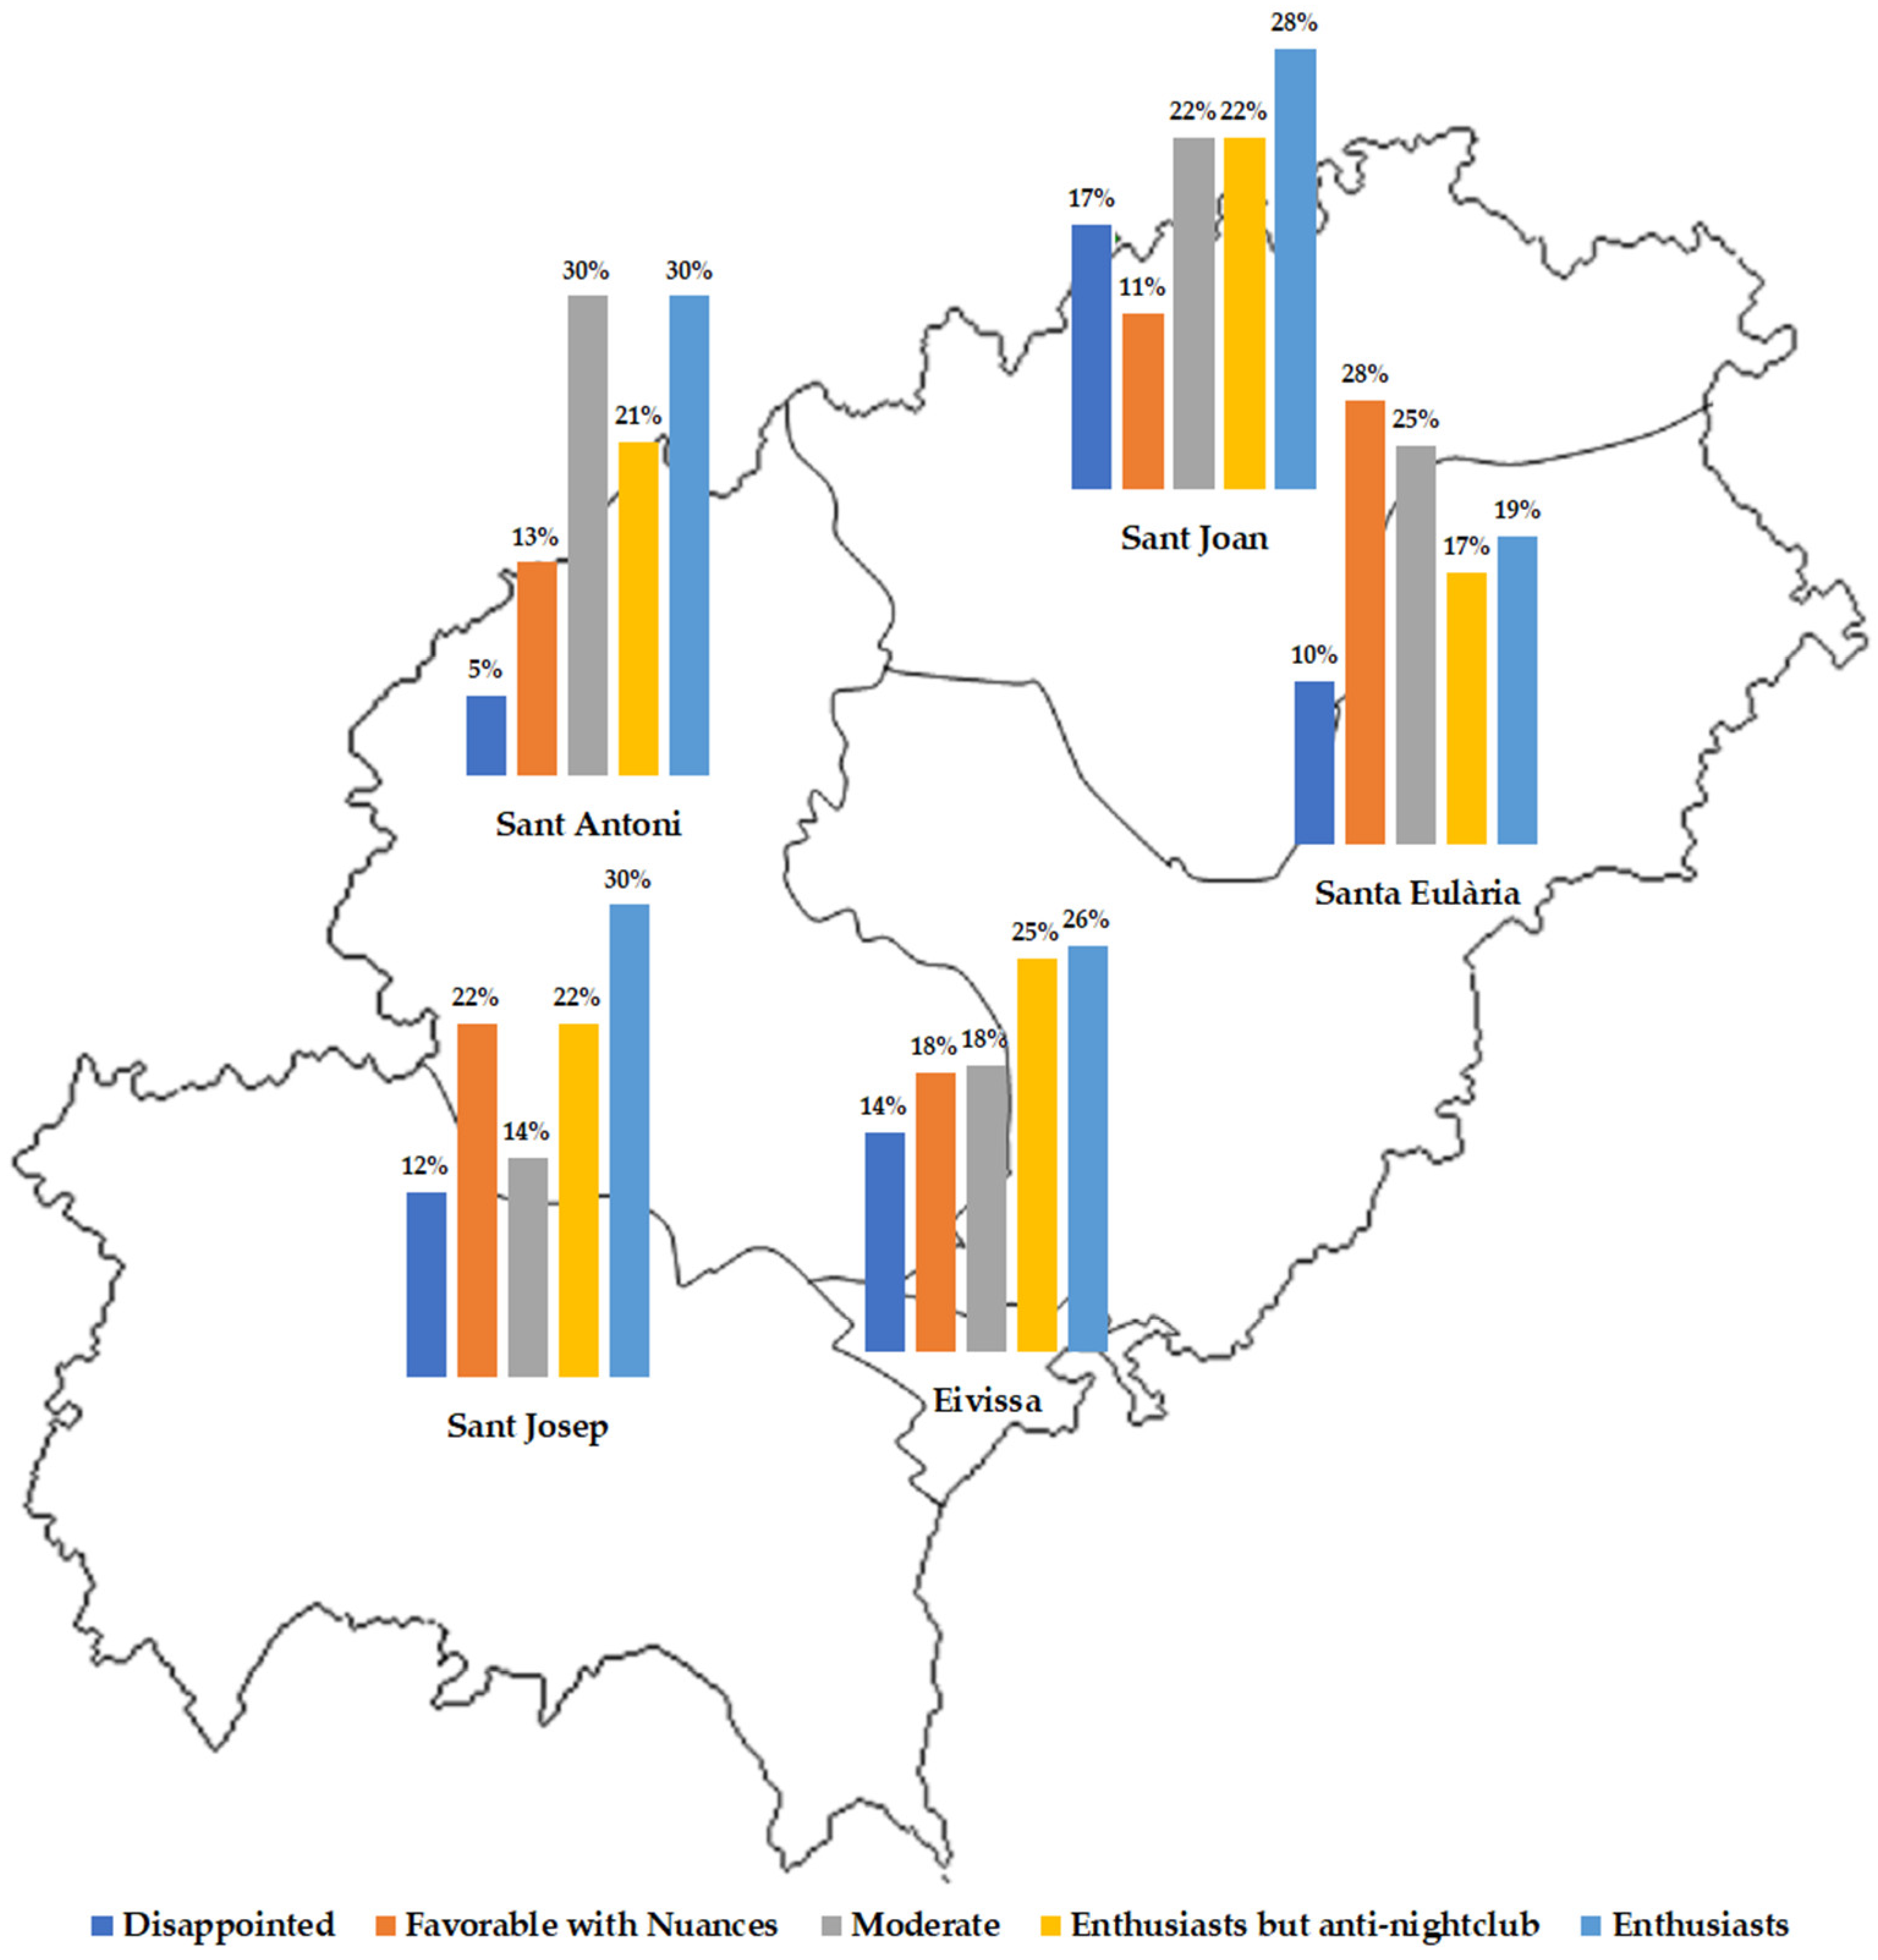
- The capital of the island is located in the municipality of Eivissa, eminently urban (little surface and a lot of population) and located between different areas of nightlife. Therefore, it has a higher proportion of enthusiasts but anti-nightclub members than the rest of the municipalities, since many residents suffer from noise and traffic generated by the large nightclubs of Playa d’en Bossa (Sant Josep), Sant Rafel (Sant Antoni), and, to a lesser extent, the promenade of the city itself.
- Sant Antoni is the municipality that first developed tourism and concentrates much of the nightlife. The rest of the nightlife areas of the island are less problematic and of later creation. In Sant Antoni, there are few disappointed and favorable with nuances members and enough moderate and enthusiast members, due to the dependency of tourism that the municipality possesses.
- Sant Joan is the municipality located further north, with a smaller population and less tourist development. The north of the island is where the culture, heritage, farmlands, and forests are preserved in the best condition, Es Amunts (an area parallel to the north and northwest coast, and located almost entirely in the municipality of Sant Joan) being the main landscape attraction of Ibiza. Sant Joan has more people with a moderate response (disappointed) and fewer people with a nuanced response (favorable with nuances) than the average, which is logical since it is the most distant area from the tourist centers and has more to lose in uncontrolled tourist and urban development.
- Sant Josep was the second municipality to develop tourism, showing fewer moderate responses than the average (moderate) and more clearly favorable answers, with (favorable with nuances) or without (enthusiasts) nuances. It is a municipality with high tourism development, especially on its coast, depending greatly on the sector but also crowded and with little margin for developments that involve large consumption of land.
- Santa Eulària extends through the center and northeast of the island; it developed tourism later than Sant Antoni and Sant Josep, and from the beginning decided to learn from the other municipalities and avoided potentially conflictive tourism. Santa Eulària stands out for the presence of moderate (moderate) or nuanced (favorable with nuances) opinions and has a lower presence of enthusiastic positions than the rest of the municipalities (enthusiasts and enthusiasts but anti-nightclub). It is a municipality that has been applying a tourism policy that fits completely with the vision of the favorable with nuances cluster, with some offers being highly valued and enhanced while others are avoided due to their negative impact on the population, quality of life, and land.
6. Conclusions
Author Contributions
Funding
Data Availability Statement
Conflicts of Interest
References
- Serra, A.; Ramón, J. Host community resignation to nightclub tourism. Curr. Issues Tour. 2017, 20, 566–579. [Google Scholar] [CrossRef]
- Sharpley, R. Host perceptions of tourism: A review of the research. Tour. Manag. 2014, 42, 37–49. [Google Scholar] [CrossRef]
- Stylidis, D.; Terzidou, M. Tourism and the economic crisis in Kavala, Greece. Ann. Tour. Res. 2014, 44, 210–226. [Google Scholar] [CrossRef]
- Tovar, C.; Lockwood, M. Social impacts of tourism: An Australian regional case study. Int. J. Tour. Res. 2008, 10, 365–378. [Google Scholar] [CrossRef]
- Vargas, A.; Plaza, M.A.; Porras, N. Understanding residents’ attitudes toward the development of industrial tourism in a former mining community. J. Travel Res. 2009, 47, 373–387. [Google Scholar] [CrossRef]
- Ap, J.; Crompton, J.L. Developing and testing a tourism impact scale. J. Travel Res. 2018, 37, 120–130. [Google Scholar] [CrossRef]
- Byrd, E.T.; Bosley, H.E.; Dronberger, M.G. Comparisons of stakeholder perceptions of tourism impacts in rural eastern North Carolina. Tour. Manag. 2009, 30, 693–703. [Google Scholar] [CrossRef]
- Eusébio, C.; Vieira, A.L.; Lima, S. Place attachment, host–tourist interactions, and residents’ attitudes towards tourism development: The case of Boa Vista Island in Cape Verde. J. Sustain. Tour. 2018, 26, 890–909. [Google Scholar] [CrossRef]
- Gursoy, D.; Chi, C.G.; Dyer, P. Locals’ attitudes toward mass and alternative tourism: The case of Sunshine Coast, Australia. J. Travel Res. 2010, 49, 381–394. [Google Scholar] [CrossRef]
- Nunkoo, R.; Ramkissoon, H. Power, trust, social exchange and community support. Ann. Tour. Res. 2012, 39, 997–1023. [Google Scholar] [CrossRef]
- Williams, J.; Lawson, R. Community issues and resident opinions of tourism. Ann. Tour. Res. 2001, 28, 269–290. [Google Scholar] [CrossRef]
- Almeida, F.; Balbuena, A.; Cortés, R. Resident’s attitudes towards the impacts of tourism. Tour. Manag. Perspect. 2015, 13, 33–40. [Google Scholar] [CrossRef]
- Brida, J.G.; Chiappa, G.D.; Meleddu, M.; Pulina, M. A comparison of residents’ perceptions in two cruise ports in the Mediterranean Sea. Int. J. Tour. Res. 2014, 16, 180–190. [Google Scholar] [CrossRef]
- Cornell, D.A.V.; Tugade, L.O.; de Sagun, R. Tourism quality of life (TQOL) and local residents’ attitudes towards tourism development in Sagada, Philippines. J. Tour. Dev. 2019, 31, 9–34. [Google Scholar] [CrossRef]
- Gursoy, D.; Ouyang, Z.; Nunkoo, R.; Wei, W. Residents’ impact perceptions of and attitudes towards tourism development: A meta-analysis. J. Hosp. Mark. Manag. 2019, 28, 306–333. [Google Scholar] [CrossRef]
- Lundberg, E. The importance of tourism impacts for different local resident groups: A case study of a Swedish seaside destination. J. Dest. Mark. Manag. 2017, 6, 46–55. [Google Scholar] [CrossRef]
- Shen, H.L.; Luo, J.; Zhao, A. The sustainable tourism development in Hong Kong: An analysis of Hong Kong residents’ attitude towards mainland Chinese tourist. J. Qual. Assur. Hosp. Tour. 2017, 18, 45–68. [Google Scholar] [CrossRef]
- Yu, C.; Huang, Y.; Yeh, P.; Chao, P. Residents’ attitudes toward island tourism development in Taiwan. Isl. Stud. J. 2017, 12, 159–176. [Google Scholar] [CrossRef]
- Ramón, J.; Serra, A. Segmentando residentes según sus actitudes: Revisión de la literatura. PASOS Rev. Tur. Patrim. Cult. 2015, 13, 837–848. [Google Scholar] [CrossRef]
- Ibestat. Estadísticas. Institut d’Estadística de les Illes Balears. Available online: https://ibestat.caib.es/ (accessed on 10 January 2021).
- Ramón, J.; Serra, A. Historia del turismo en Ibiza: Aplicación del Ciclo de Vida del Destino Turístico en un destino maduro del Mediterráneo. PASOS Rev. Tur. Patrim. Cult. 2014, 12, 899–913. [Google Scholar] [CrossRef]
- Frleta, D.S. Island destinations’ tourism offer-tourists’ vs. residents’ attitudes. Tour. Hosp. Manag. 2014, 20, 1–14. [Google Scholar] [CrossRef]
- Vargas, A.; Porras, N.; Plaza, M.A. Residents’ attitude to tourism and seasonality. J. Travel Res. 2014, 53, 581–596. [Google Scholar] [CrossRef]
- Vivek. An empirical study of residents’ attitudes for sustainable tourism development in Himachal Pradesh. Int. J. Hosp. Tour. Syst. 2021, 14, 128–137. [Google Scholar]
- Doxey, G.V. A causation theory of visitor-resident irritants: Methodology and research inferences. In Proceedings of the Conference Proceedings: Sixth Annual Conference of Travel and Tourism Research Association, San Diego, CA, USA, 8–11 September 1975; pp. 195–198. [Google Scholar]
- Butler, R.W. The concept of a tourist area cycle of evolution: Implications for the management of resources. Can. Geogr. 1980, 24, 5–12. [Google Scholar] [CrossRef]
- Fan, D.X.F.; Liu, A.; Qiu, R.T.R. Revisiting the relationship between host attitudes and tourism development: A utility maximization approach. Tour. Econom. 2019, 25, 171–188. [Google Scholar] [CrossRef]
- Belisle, F.J.; Hoy, D.R. The perceived impact of tourism by residents: A case study in Santa Marta, Colombia. Ann. Tour. Res. 1980, 7, 83–101. [Google Scholar] [CrossRef]
- Jurowski, C.; Uysal, M.; Williams, R.D. A theoretical analysis of host community resident reactions to tourism. J. Travel Res. 1997, 36, 3–11. [Google Scholar] [CrossRef]
- Lankford, S.V.; Howard, D.R. Developing a tourism impacts attitude scale. Ann. Tour. Res. 1994, 21, 121–139. [Google Scholar] [CrossRef]
- Um, S.; Crompton, J.L. Measuring resident’s attachment levels in a host community. J. Travel Res. 1987, 26, 27–29. [Google Scholar] [CrossRef] [Green Version]
- Brougham, J.E.; Butler, R.W. A segmentation analysis of resident attitudes to the social impact of tourism. Ann. Tour. Res. 1981, 8, 569–590. [Google Scholar] [CrossRef]
- Davis, D.; Allen, J.; Cosenza, R.M. Segmenting local residents by their attitudes, interests and opinions toward tourism. J. Travel Res. 1988, 27, 2–8. [Google Scholar] [CrossRef]
- Fredline, E.; Faulkner, B. Host community reactions: A cluster analysis. Ann. Tour. Res. 2000, 27, 763–784. [Google Scholar] [CrossRef]
- Madrigal, R. Residents’ perceptions and the role of government. Ann. Tour. Res. 1995, 22, 86–102. [Google Scholar] [CrossRef]
- Martín, J.C.; Moreira, P.; Román, C. A hybrid-fuzzy segmentation analysis of residents’ perception towards tourism in Gran Canaria. Tour. Econ. 2020, 26, 1282–1304. [Google Scholar] [CrossRef]
- Thyne, M.; Lawson, R. Addressing tourism public policy issues through attitude segmentation of host communities. Curr. Issues Tour. 2001, 4, 392–400. [Google Scholar] [CrossRef]
- Del Chiappa, G.; Atzeni, M.; Ghasemi, V. Community-based collaborative tourism planning in islands: A cluster analysis in the context of Costa Smeralda. J. Destin. Mark. Manag. 2018, 8, 41–48. [Google Scholar] [CrossRef]
- Ryan, C.; Montgomery, D. The attitudes of Bakewell residents to tourism and issues in community responsive tourism. Tour. Manag. 1994, 15, 358–369. [Google Scholar] [CrossRef]
- Wassler, P.; Schuckert, M.; Hung, K.; Petrick, J.F. You’re welcome? Hong Kong’s attitude towards the individual visit scheme. Intern. J. Tour. Res. 2018, 20, 637–649. [Google Scholar] [CrossRef]
- Del Chiappa, G.; Presenza, A.; Yücelen, M. Profiling residents based on their perceptions and attitude toward sport event: Insights from the FIA world rally championship. Tourismos 2016, 11, 26–51. [Google Scholar]
- Gon, M.; Osti, L.; Pechlaner, H. Leisure boat tourism: Residents’ attitudes towards nautical tourism development. Tour. Rev. 2016, 71, 180–191. [Google Scholar] [CrossRef]
- Monterrubio, J.C.; Andriotis, K. Social representations and community attitudes towards spring breakers. Tour. Geogr. 2014, 16, 288–302. [Google Scholar] [CrossRef]
- Weaver, D.B.; Lawton, L.J. Resident perceptions in the urban-rural fringe. Ann. Tour. Res. 2001, 28, 439–458. [Google Scholar] [CrossRef]
- Weaver, D.B.; Lawton, L.J. Resident perceptions of a contentious tourism event. Tour. Manag. 2013, 37, 165–175. [Google Scholar] [CrossRef]
- Aguiló, E.; Rosselló, J. Host community perceptions: A cluster analysis. Ann. Tour. Res. 2005, 32, 925–941. [Google Scholar] [CrossRef]
- Brida, J.G.; Osti, L.; Barquet, A. Segmenting Resident Perceptions towards Tourism-a Cluster Analysis with a Multinomial Logit Model of a Mountain Community. Int. J. Tour. Res. 2010, 12, 591–602. [Google Scholar] [CrossRef]
- Lundberg, E. The level of tourism development and resident attitudes: A comparative case study of coastal destinations. Scand. J. Hosp. Tour. 2015, 15, 266–294. [Google Scholar] [CrossRef]
- Brida, J.G.; Osti, L.; Faccioli, M. Residents’ perception and attitudes towards tourism impacts: A case study of the small rural community of Folgaria (Trentino—Italy). Benchmark. Int. J. 2011, 18, 359–385. [Google Scholar] [CrossRef]
- Presenza, A.; Del Chiappa, G.; Sheehan, L. Residents’ engagement and local tourism governance in maturing beach destinations. Evidence from an Italian case study. J. Dest. Mark. Manag. 2013, 2, 22–30. [Google Scholar] [CrossRef]
- Del Chiappa, G.; Lorenzo-Romero, C.; Gallarza, M. Host community perceptions of cruise tourism in a homeport: A cluster analysis. J. Dest. Mark. Manag. 2018, 7, 170–181. [Google Scholar] [CrossRef]
- Ribeiro, M.A.; Valle, P.O.; Silva, J.A. Residents’ attitudes towards tourism development in Cape Verde islands. Tour. Geogr. 2013, 15, 654–679. [Google Scholar] [CrossRef]
- Ven, S. Residents’ participation, perceived impacts, and support for community-based ecotourism in Cambodia: A latent profile analysis. Asia Pac. J. Tour. Res. 2016, 21, 836–861. [Google Scholar] [CrossRef]
- Wassler, P.; Nguyen, T.H.H.; Mai, L.Q.; Schuckert, M. Social representations and resident attitudes: A multiple-mixed-method approach. Ann. Tour. Res. 2019, 78, e102740. [Google Scholar] [CrossRef]
- Gu, X.; Hunt, C.A.; Lengieza, M.L.; Niu, L.; Wu, H.; Wang, Y.; Jia, X. Evaluating residents’ perceptions of nature-based tourism with a factor-cluster approach. Sustainbility 2021, 13, e119. [Google Scholar] [CrossRef]
- Brida, J.G.; Riaño, E.; Aguirre, S.Z. Residents’ attitudes and perceptions towards cruise tourism development: A case study of Cartagena de Indias (Colombia). Tour. Hosp. Res. 2011, 11, 181–196. [Google Scholar] [CrossRef]
- Chen, S.C. Residents’ perceptions of the impact of major annual tourism events in Macao: Cluster analysis. J. Conv. Environ. Tour. 2011, 12, 106–128. [Google Scholar] [CrossRef]
- Liang, Z.; Hui, T. Residents’ quality of life and attitudes toward tourism development in China. Tour. Manag. 2016, 57, 56–67. [Google Scholar] [CrossRef] [Green Version]
- Chen, Z.; Wang, Y.; Li, X.; Lawton, L. It’s not just black or white: Effects of ambivalence on residents’ support for a mega-event. J. Hosp. Tour. Res. 2019, 43, 283–313. [Google Scholar] [CrossRef]
- Del Chiappa, G.; Atzeni, M.; Pung, J.M.; Risitano, M. Residents’ views on cruise tourism in Naples profiles and insights from a Mediterranean home-port destination. Eur. J. Tour. Res. 2019, 23, 71–85. [Google Scholar]
- Garau, J.B.; Díaz, R.J.; Gutiérrez, D. Residents’ perceptions of tourism impacts on island destinations: A comparative analysis. Int. J. Tour. Res. 2014, 16, 578–585. [Google Scholar] [CrossRef]
- Pavlić, I.; Portolan, A.; Puh, B. Segmenting local residents by perceptions of tourism impacts in an urban world heritage site: The case of Dubrovnik. J. Herit. Tour. 2020, 15, 398–409. [Google Scholar] [CrossRef]
- Ryan, C.; Scotland, A.; Montgomery, D. Resident attitudes to tourism development-A comparative study between the Rangitikei, New Zealand and Bakewell, United Kingdom. Prog. Tour. Hosp. Res. 1998, 4, 115–130. [Google Scholar] [CrossRef]
- Sinclair-Maragh, G.; Gursoy, D.; Vieregge, M. Residents’ perceptions toward tourism development: A factor-cluster approach. J. Dest. Mark. Manag. 2015, 4, 36–45. [Google Scholar] [CrossRef]
- Andriotis, K.; Vaughan, R.D. Urban residents’ attitudes toward tourism development: The case of Crete. J. Travel Res. 2003, 42, 172–185. [Google Scholar] [CrossRef] [Green Version]
- Carneiro, M.J.; Eusébio, C.; Pelicano, M. An expenditure patterns segmentation of the music festivals’ market. Int. J. Sustain. Dev. 2011, 14, 290–308. [Google Scholar] [CrossRef]
- Farmaki, A.; Christou, P.; Saveriades, A.; Spanou-Tripinioti, E. Perceptions of Pafos as European capital of culture: Tourism stakeholder and resident perspectives. Int. J. Tour. Res. 2019, 21, 234–244. [Google Scholar] [CrossRef]
- Fredline, L.; Deery, M.; Jago, L. A longitudinal study of the impacts of an annual event on local residents. Tour. Plan. Dev. 2013, 10, 416–432. [Google Scholar] [CrossRef]
- Guo, Y.; Kim, S.; Chen, Y. Shanghai residents’ perceptions of tourism impacts and quality of life. J. China Tour. Res. 2014, 10, 142–164. [Google Scholar] [CrossRef]
- Inbakaran, R.; Jackson, M. Resident attitudes inside Victoria’s tourism product regions: A cluster analysis. J. Hosp. Tour. Manag. 2006, 13, 59–74. [Google Scholar] [CrossRef]
- Stylidis, D. Residents’ place image: A cluster analysis and its links to place attachment and support for tourism. J. Sustain. Tour. 2018, 26, 1007–1026. [Google Scholar] [CrossRef]
- Vareiro, L.M.C.; Remoaldo, P.C.; Ribeiro, J.A.C. Residents’ perceptions of tourism impacts in Guimarães (Portugal): A cluster analysis. Curr. Issues Tour. 2013, 16, 535–551. [Google Scholar] [CrossRef]
- Ahmed, M.; Seraj, R.; Islam, S.M.S. The k-means algorithm: A comprehensive survey and performance evaluation. Electronics 2020, 9, e1295. [Google Scholar] [CrossRef]
- Chen, J.; Ching, R.K.H.; Lin, Y. An extended study of the K-means algorithm for data clustering and its applications. J. Opt. Res. Soc. 2004, 55, 976–987. [Google Scholar] [CrossRef]
- Zeebaree, D.Q.; Haron, H.; Abdulazeez, A.M.; Zeebaree, S.R.M. Combination of k-means clustering with genetic algorithm: A review. Int. J. Appl. Eng. Res. 2017, 12, 14238–14245. [Google Scholar]
- Mooser, A.; Anfuso, G.; Gómez-Pujol, L.; Rizzo, A.; Williams, A.T.; Aucelli, P.P.C. Coastal Scenic Beauty and Sensitivity at the Balearic Islands, Spain: Implication of Natural and Human Factors. Land 2021, 10, 456. [Google Scholar] [CrossRef]
- Wang, Z.; Marafa, L. Tourism Imaginary and Landscape at Heritage Site: A Case in Honghe Hani Rice Terraces, China. Land 2021, 10, 439. [Google Scholar] [CrossRef]

| Variable | Frequency | % |
|---|---|---|
| Sex: | ||
| Man | 242 | 37.58% |
| Woman | 401 | 62.27% |
| Did not respond | 1 | 0.16% |
| Age: | ||
| Under 30 years old | 160 | 24.84% |
| Between 30 and 45 years old | 241 | 37.42% |
| Between 46 and 60 years old | 169 | 26.24% |
| Greater than 60 years old | 47 | 7.30% |
| Did not respond | 27 | 4.19% |
| Education: | ||
| None | 15 | 2.33% |
| Primary school | 171 | 26.55% |
| Secondary school | 256 | 39.75% |
| University | 196 | 30.43% |
| Did not respond | 6 | 0.93% |
| Municipality: | ||
| Eivissa | 238 | 36.96% |
| Sant Antoni de Portmany | 119 | 18.48% |
| Sant Joan de Labritja | 18 | 2.80% |
| Sant Josep de sa Talaia | 94 | 14.60% |
| Santa Eulària des Riu | 175 | 27.17% |
| It feels integrated: | ||
| Yes | 500 | 77.64% |
| No | 115 | 17.86% |
| I do not know | 27 | 4.19% |
| Did not respond | 2 | 0.31% |
| Work in the tourism sector: | ||
| Yes | 375 | 58.23% |
| No | 259 | 40.22% |
| Did not respond | 10 | 1.55% |
| Type of Offer | Statistics | Total Sample | Disappointed | Favorable with Nuances | Moderate | Enthusiasts but Anti-Nightclub | Enthusiasts | Snedecor’s F | p Value |
|---|---|---|---|---|---|---|---|---|---|
| All Inclusive | Average: | 2.189 | 2.451 | 1.623 | 2.629 | 1.669 | 2.591 | 24.792 | 0.000 |
| Deviation: | 1.262 | 1.059 | 0.844 | 1.359 | 0.940 | 1.426 | |||
| Golf Tourism | Average: | 3.413 | 2.718 | 1.731 | 3.629 | 4.079 | 4.299 | 199.726 | 0.000 |
| Deviation: | 1.294 | 0.937 | 0.762 | 0.805 | 0.796 | 0.995 | |||
| Cycle Tourism | Average: | 4.228 | 2.930 | 4.177 | 3.829 | 4.626 | 4.835 | 126.243 | 0.000 |
| Deviation: | 0.889 | 0.811 | 0.818 | 0.726 | 0.579 | 0.432 | |||
| Another Sport | Average: | 4.351 | 3.070 | 4.354 | 3.964 | 4.755 | 4.890 | 172.080 | 0.000 |
| Deviation: | 0.789 | 0.757 | 0.666 | 0.566 | 0.446 | 0.366 | |||
| Nautical Tourism | Average: | 4.331 | 3.099 | 4.015 | 4.121 | 4.813 | 4.884 | 121.576 | 0.000 |
| Deviation: | 0.867 | 0.695 | 1.052 | 0.567 | 0.473 | 0.356 | |||
| MICE Tourism | Average: | 4.287 | 3.042 | 4.292 | 3.836 | 4.676 | 4.878 | 147.442 | 0.000 |
| Deviation: | 0.838 | 0.759 | 0.684 | 0.628 | 0.614 | 0.395 | |||
| Nature Tourism | Average: | 4.460 | 3.014 | 4.731 | 4.021 | 4.842 | 4.921 | 203.921 | 0.000 |
| Deviation: | 0.815 | 0.847 | 0.444 | 0.732 | 0.402 | 0.292 | |||
| Rural Tourism | Average: | 4.523 | 3.225 | 4.669 | 4.236 | 4.842 | 4.945 | 163.266 | 0.000 |
| Deviation: | 0.738 | 0.826 | 0.532 | 0.628 | 0.420 | 0.228 | |||
| Vacation Homes for Rent | Average: | 4.107 | 3.239 | 3.900 | 3.750 | 4.410 | 4.695 | 59.147 | 0.000 |
| Deviation: | 0.917 | 0.721 | 0.919 | 0.887 | 0.785 | 0.567 | |||
| Cultural Tourism | Average: | 4.402 | 3.099 | 4.608 | 4.007 | 4.719 | 4.872 | 131.545 | 0.000 |
| Deviation: | 0.825 | 0.875 | 0.488 | 0.742 | 0.612 | 0.401 | |||
| Nightlife Tourism | Average: | 3.002 | 2.873 | 2.277 | 3.236 | 1.950 | 4.323 | 137.834 | 0.000 |
| Deviation: | 1.317 | 1.233 | 1.164 | 1.099 | 0.762 | 0.634 | |||
| Tourism of Second Residence | Average: | 3.882 | 3.042 | 3.515 | 3.579 | 4.108 | 4.604 | 49.324 | 0.000 |
| Deviation: | 1.067 | 0.971 | 1.132 | 0.964 | 0.942 | 0.668 | |||
| Family Sun and Beach Tourism | Average: | 4.337 | 3.535 | 4.223 | 4.050 | 4.554 | 4.835 | 47.932 | 0.000 |
| Deviation: | 0.845 | 0.976 | 0.757 | 0.856 | 0.770 | 0.402 |
| Variable | Total Sample | Disappointed | Favorable with Nuances | Moderate | Enthusiasts but Anti-Nightclub | Enthusiasts | Chi-Square | p Value |
|---|---|---|---|---|---|---|---|---|
| Sex: | 5.545 | 0.236 | ||||||
| Man | 37.58% | 39.44% | 29.23% | 37.86% | 38.85% | 42.07% | ||
| Woman | 62.27% | 59.15% | 70.77% | 62.14% | 61.15% | 57.93% | ||
| Did not respond | 0.16% | 1.41% | 0.00% | 0.00% | 0.00% | 0.00% | ||
| Age: | 38.335 | 0.000 | ||||||
| Under 30 years old | 24.84% | 35.21% | 31.54% | 25.71% | 12.23% | 25.00% | ||
| Between 30 and 45 years old | 37.42% | 29.58% | 43.08% | 33.57% | 33.81% | 42.68% | ||
| Between 46 and 60 years old | 26.24% | 22.54% | 18.46% | 28.57% | 35.25% | 24.39% | ||
| Greater than 60 years old | 7.30% | 4.23% | 6.15% | 10.00% | 12.23% | 3.05% | ||
| Did not respond | 4.19% | 8.45% | 0.77% | 2.14% | 6.47% | 4.88% | ||
| Education: | 29.359 | 0.004 | ||||||
| None | 2.33% | 5.63% | 1.54% | 1.43% | 4.32% | 0.61% | ||
| Primary school | 26.55% | 25.35% | 19.23% | 35.71% | 26.62% | 25.00% | ||
| Secondary school | 39.75% | 40.85% | 37.69% | 42.14% | 38.85% | 39.63% | ||
| University | 30.43% | 25.35% | 41.54% | 18.57% | 30.22% | 34.15% | ||
| Did not respond | 0.93% | 2.82% | 0.00% | 2.14% | 0.00% | 0.61% | ||
| Municipality: | 32.100 | 0.010 | ||||||
| Eivissa | 36.96% | 46.48% | 32.31% | 30.71% | 42.45% | 37.20% | ||
| Sant Antoni de Portmany | 18.48% | 8.45% | 12.31% | 25.71% | 17.99% | 21.95% | ||
| Sant Joan de Labritja | 2.80% | 4.23% | 1.54% | 2.86% | 2.88% | 3.05% | ||
| Sant Josep de sa Talaia | 14.60% | 15.49% | 16.15% | 9.29% | 15.11% | 17.07% | ||
| Santa Eulària des Riu | 27.17% | 25.35% | 37.69% | 31.43% | 21.58% | 20.73% | ||
| It feels integrated: | 9.540 | 0.299 | ||||||
| Yes | 77.64% | 64.79% | 76.15% | 82.14% | 80.58% | 78.05% | ||
| No | 17.86% | 26.76% | 20.00% | 13.57% | 16.55% | 17.07% | ||
| I do not know | 4.19% | 7.04% | 3.85% | 3.57% | 2.88% | 4.88% | ||
| Did not respond | 0.31% | 1.41% | 0.00% | 0.71% | 0.00% | 0.00% | ||
| Work in the tourism sector: | 4.705 | 0.319 | ||||||
| Yes | 58.23% | 50.70% | 53.08% | 60.71% | 59.71% | 62.20% | ||
| No | 40.22% | 45.07% | 46.92% | 37.86% | 38.85% | 35.98% | ||
| Did not respond | 1.55% | 4.23% | 0.00% | 1.43% | 1.44% | 1.83% |
Publisher’s Note: MDPI stays neutral with regard to jurisdictional claims in published maps and institutional affiliations. |
© 2021 by the authors. Licensee MDPI, Basel, Switzerland. This article is an open access article distributed under the terms and conditions of the Creative Commons Attribution (CC BY) license (https://creativecommons.org/licenses/by/4.0/).
Share and Cite
Ramón-Cardona, J.; Peña-Miranda, D.D.; Sánchez-Fernández, M.D. Acceptance of Tourist Offers and Territory: Cluster Analysis of Ibiza Residents (Spain). Land 2021, 10, 734. https://doi.org/10.3390/land10070734
Ramón-Cardona J, Peña-Miranda DD, Sánchez-Fernández MD. Acceptance of Tourist Offers and Territory: Cluster Analysis of Ibiza Residents (Spain). Land. 2021; 10(7):734. https://doi.org/10.3390/land10070734
Chicago/Turabian StyleRamón-Cardona, José, David Daniel Peña-Miranda, and María Dolores Sánchez-Fernández. 2021. "Acceptance of Tourist Offers and Territory: Cluster Analysis of Ibiza Residents (Spain)" Land 10, no. 7: 734. https://doi.org/10.3390/land10070734