
Land Use and Land Cover Pattern as a Measure of Tourism Impact on a Lakeshore Zone


Abstract
:1. Introduction
2. Materials and Methods
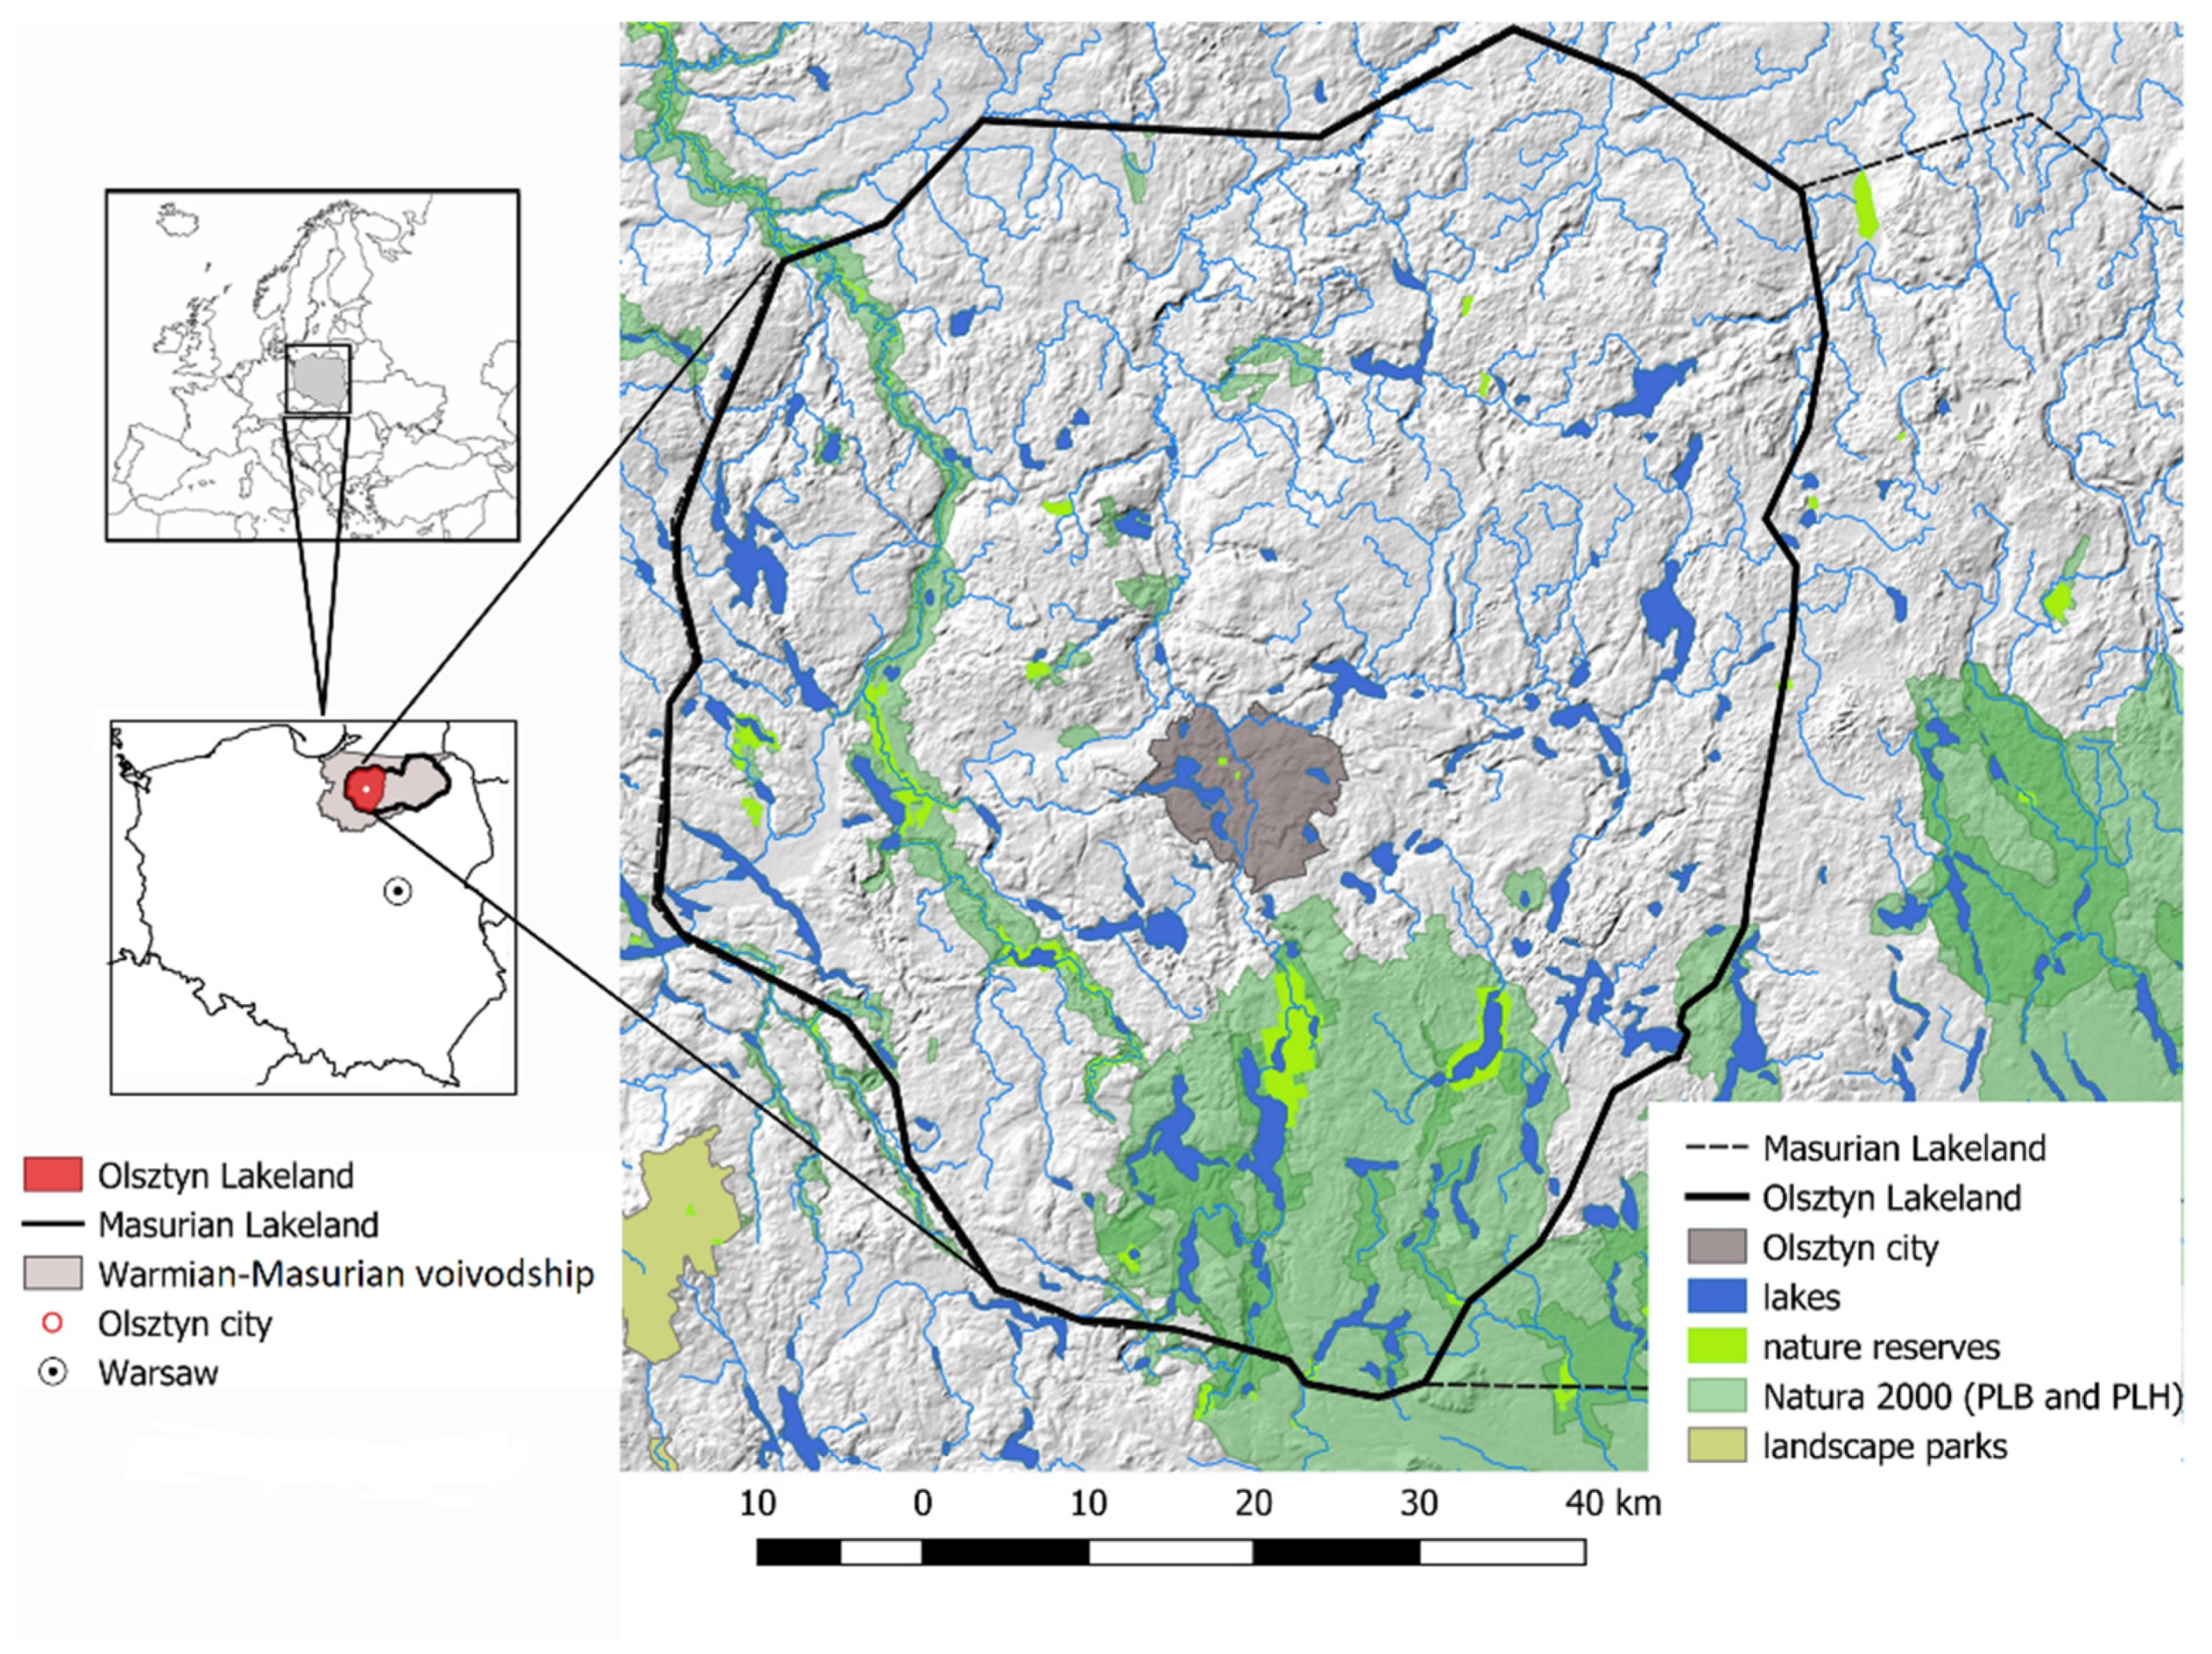
2.1. Study Area
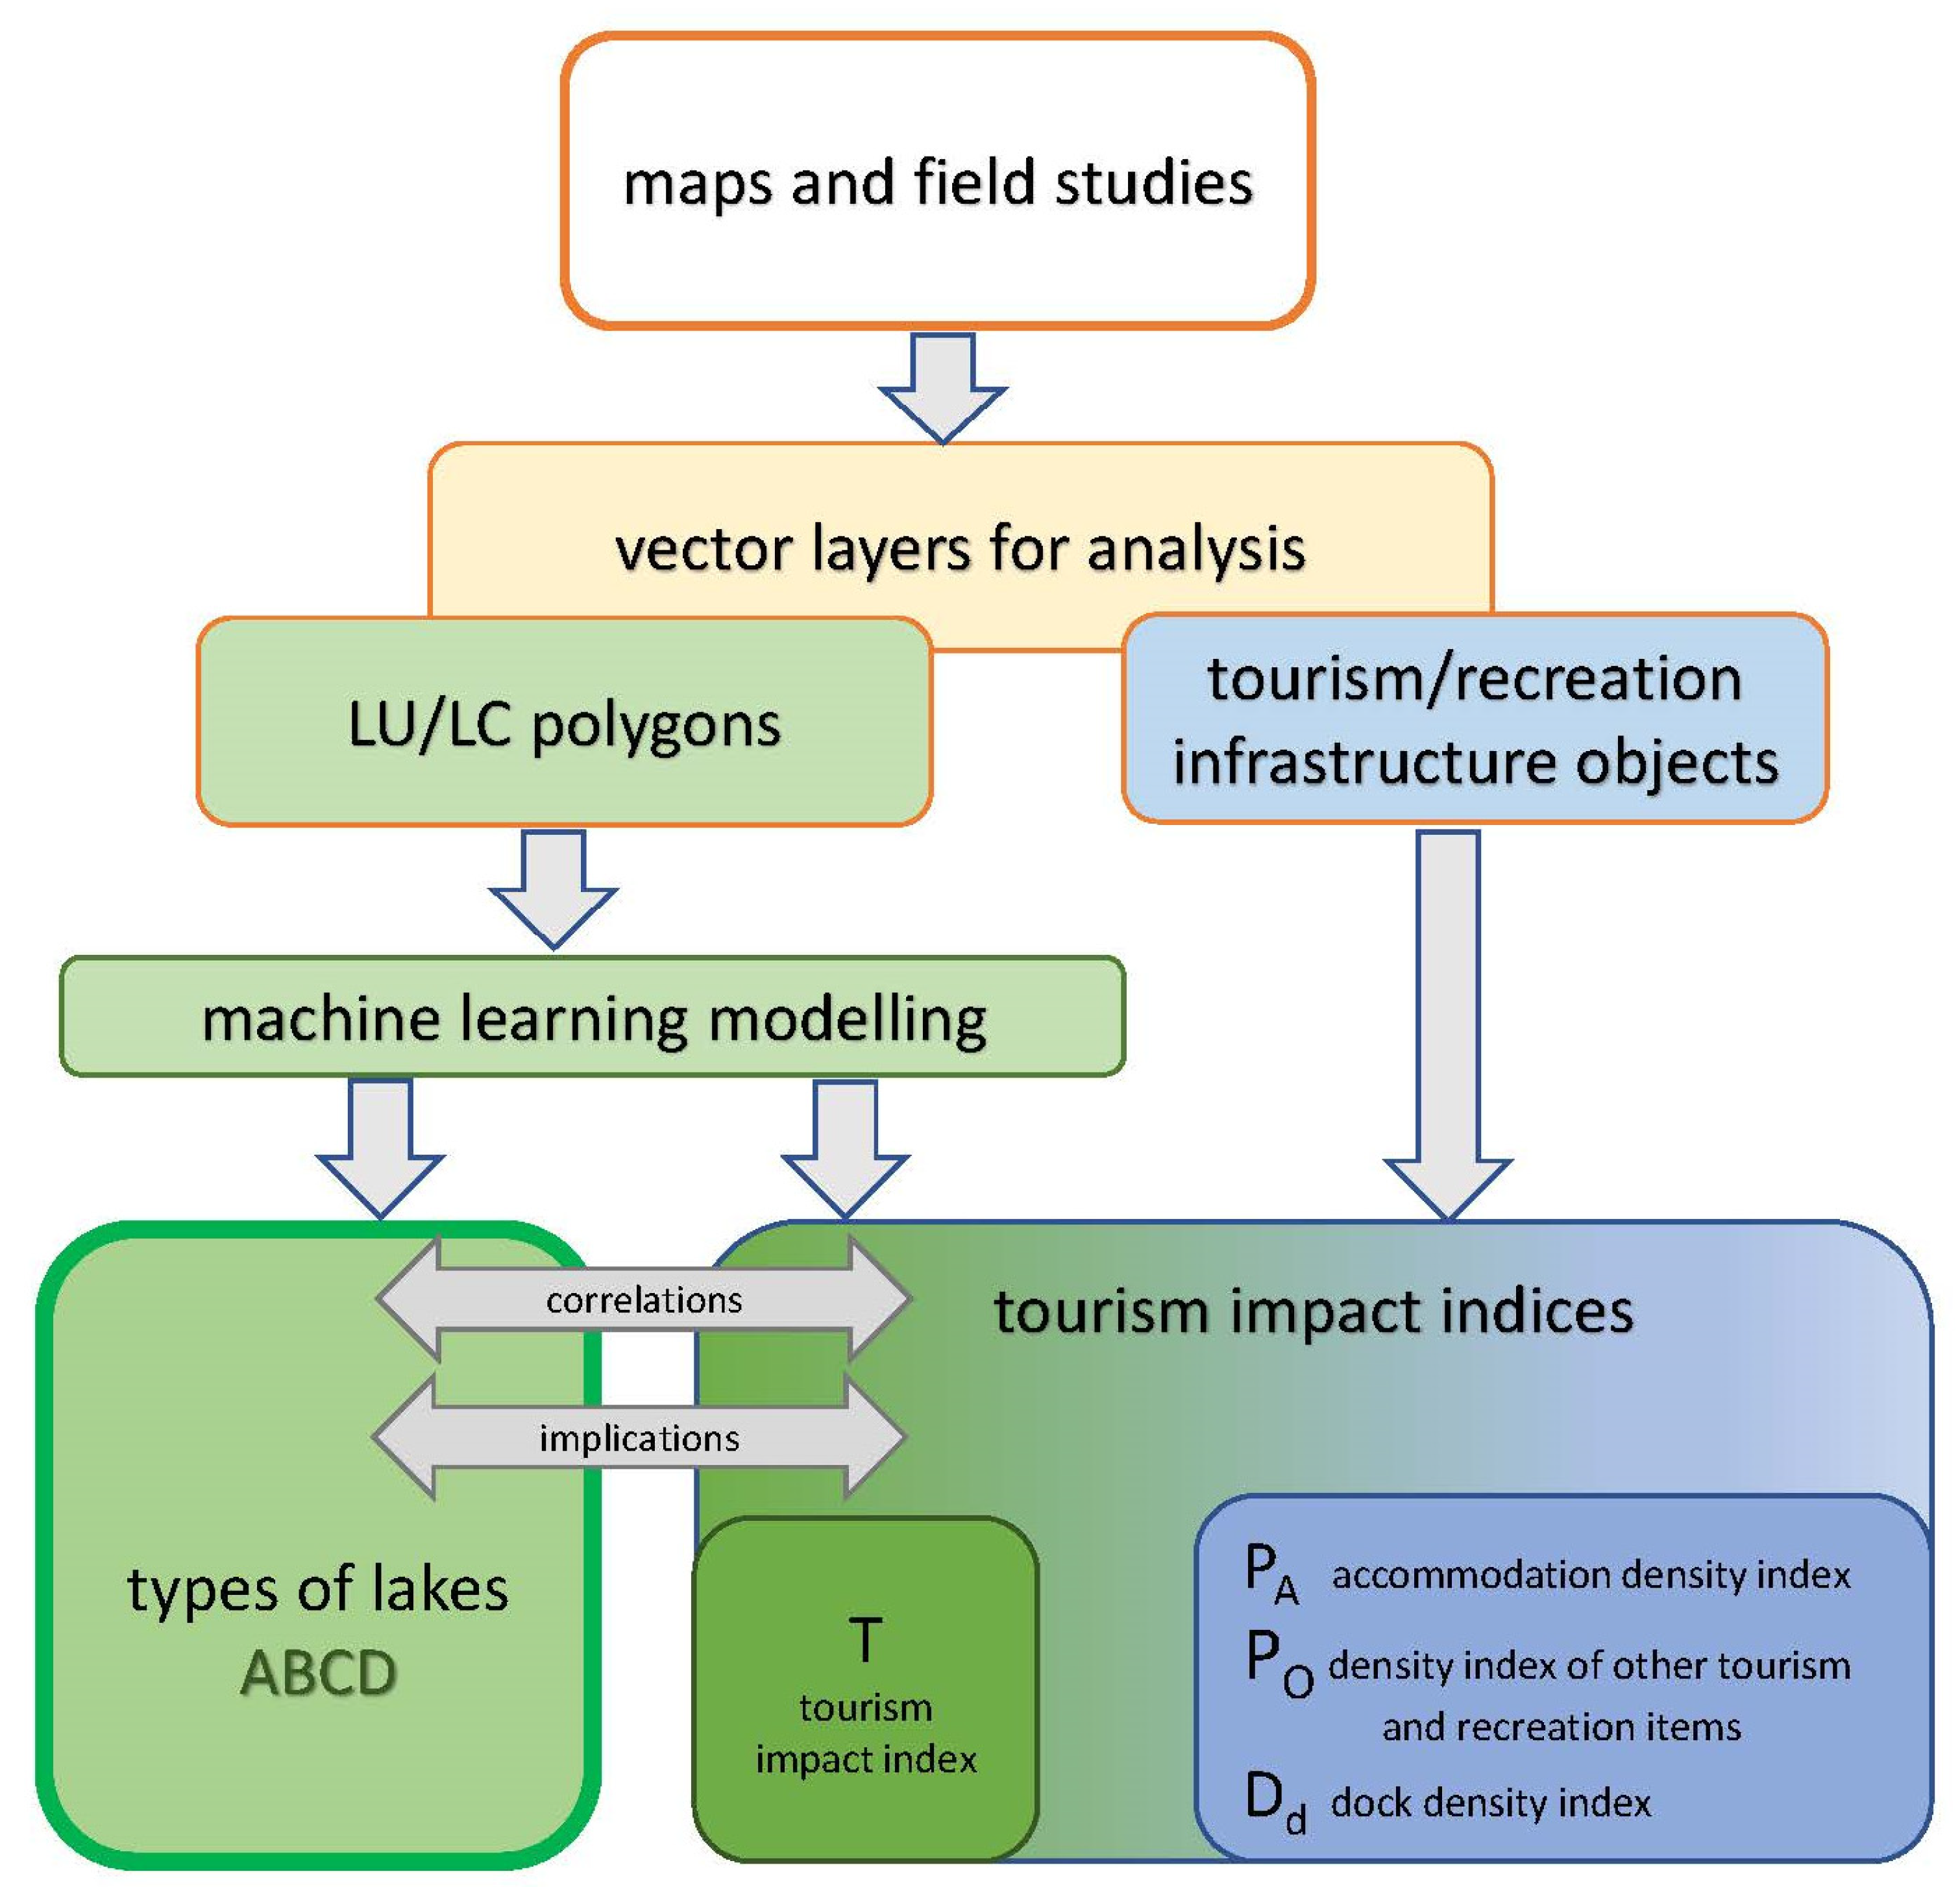
2.2. Methods
2.2.1. Machine Learning Modelling
2.2.2. Tourism Impact Indices
2.2.3. Statistics
3. Results
3.1. LU/LC Type Importance for Tourism Function of Lakes
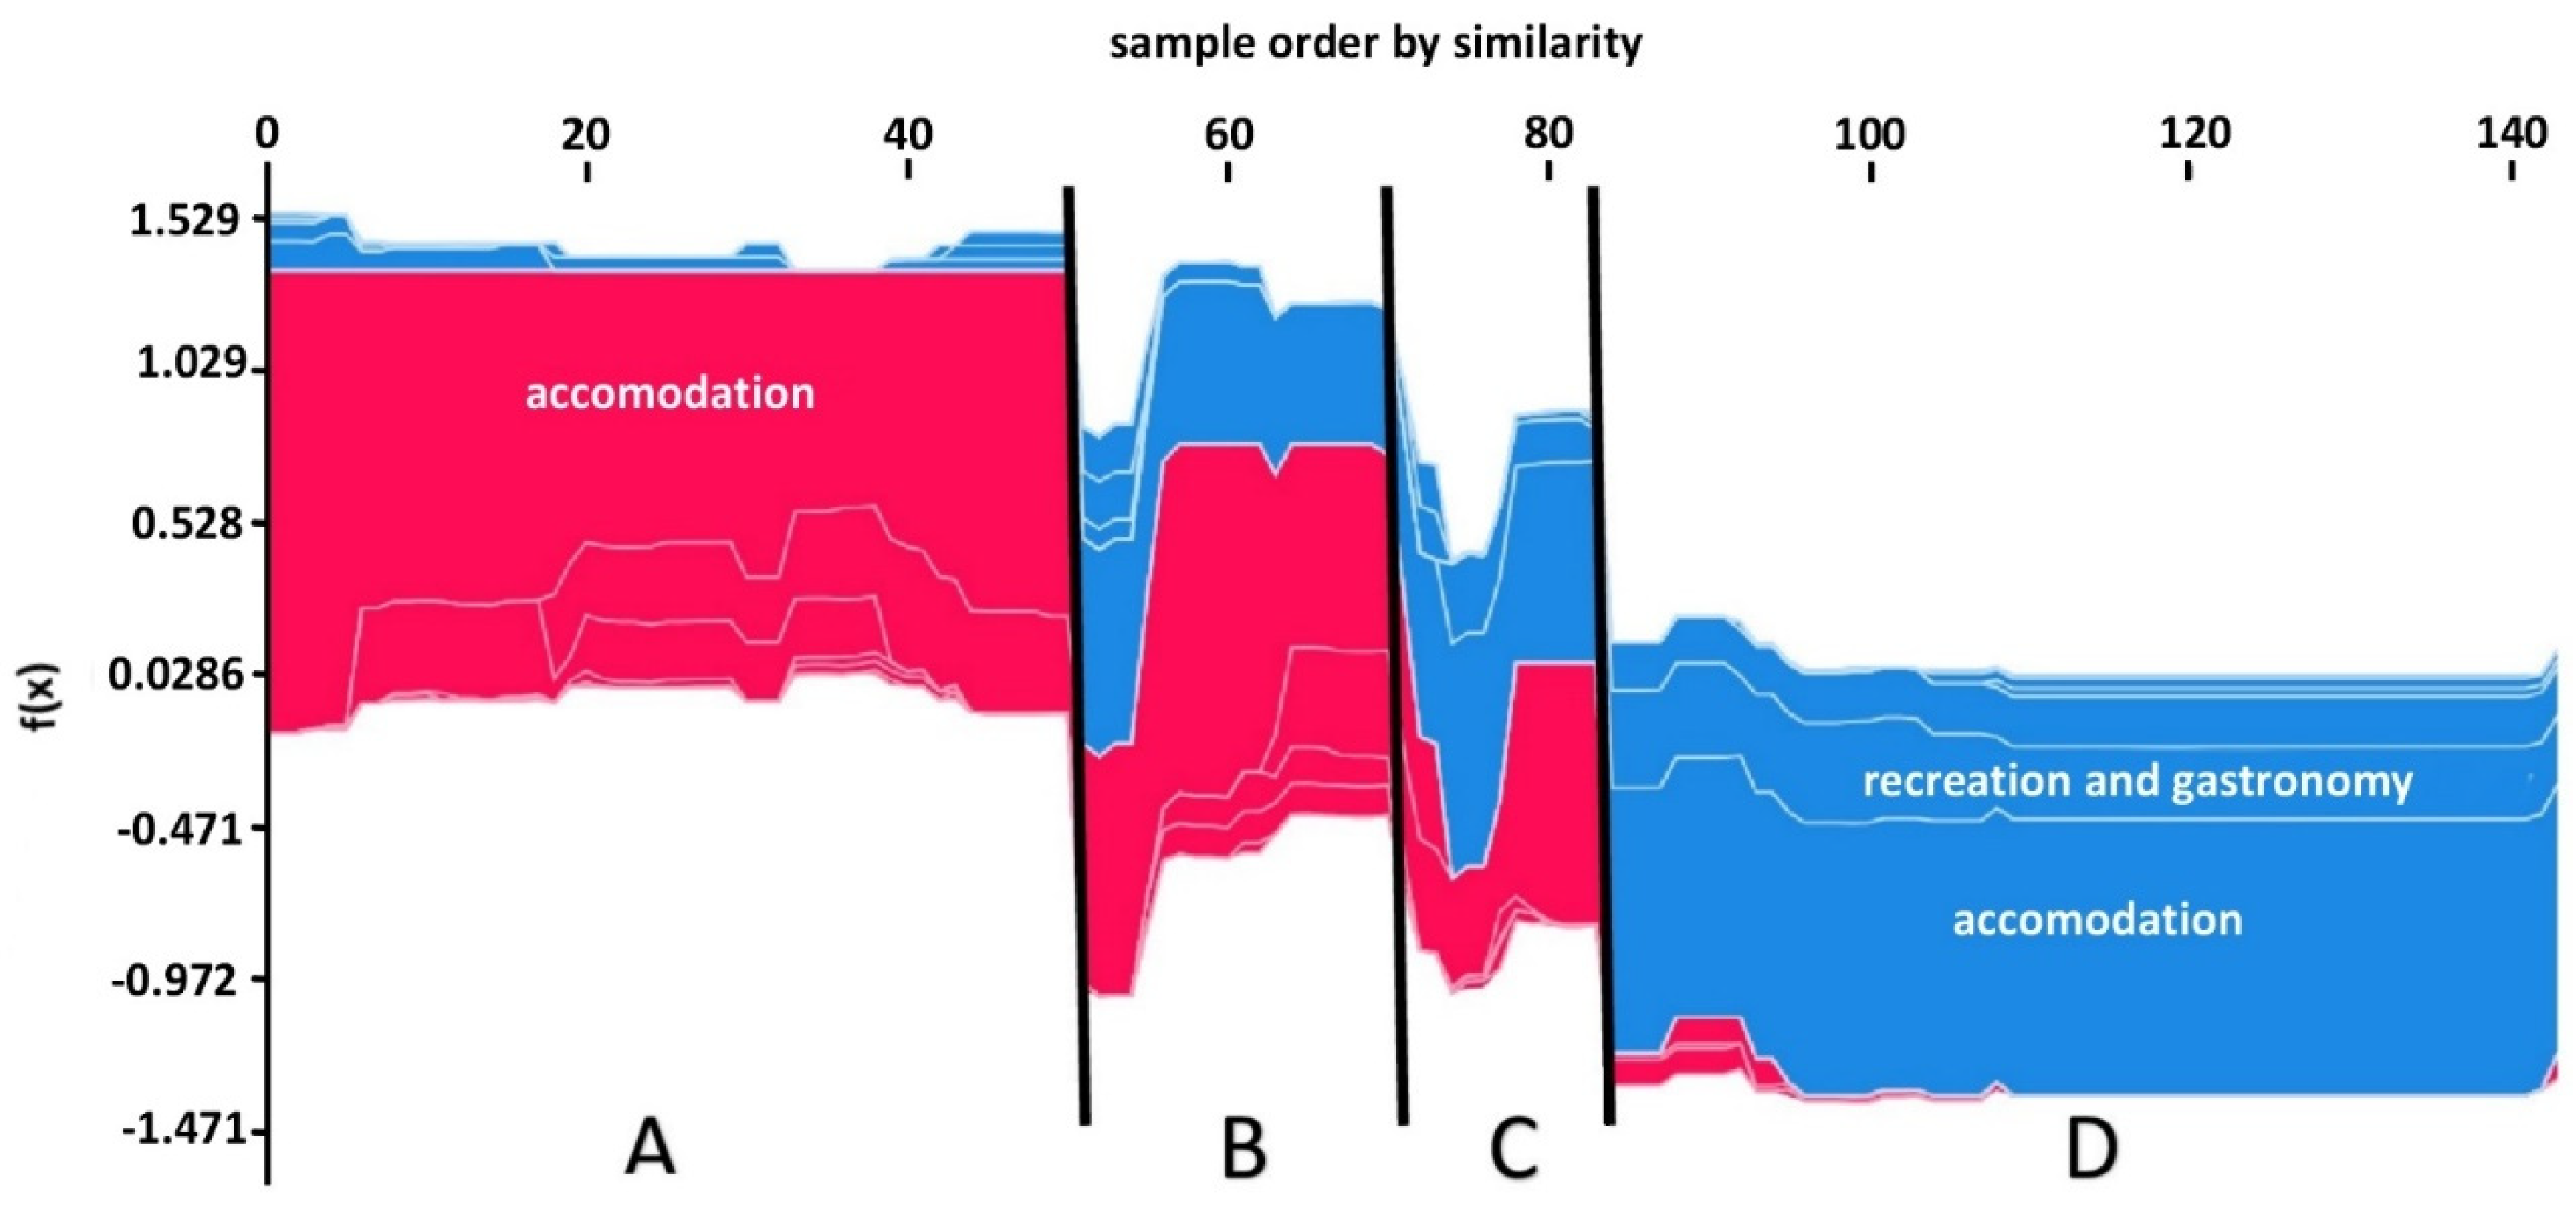
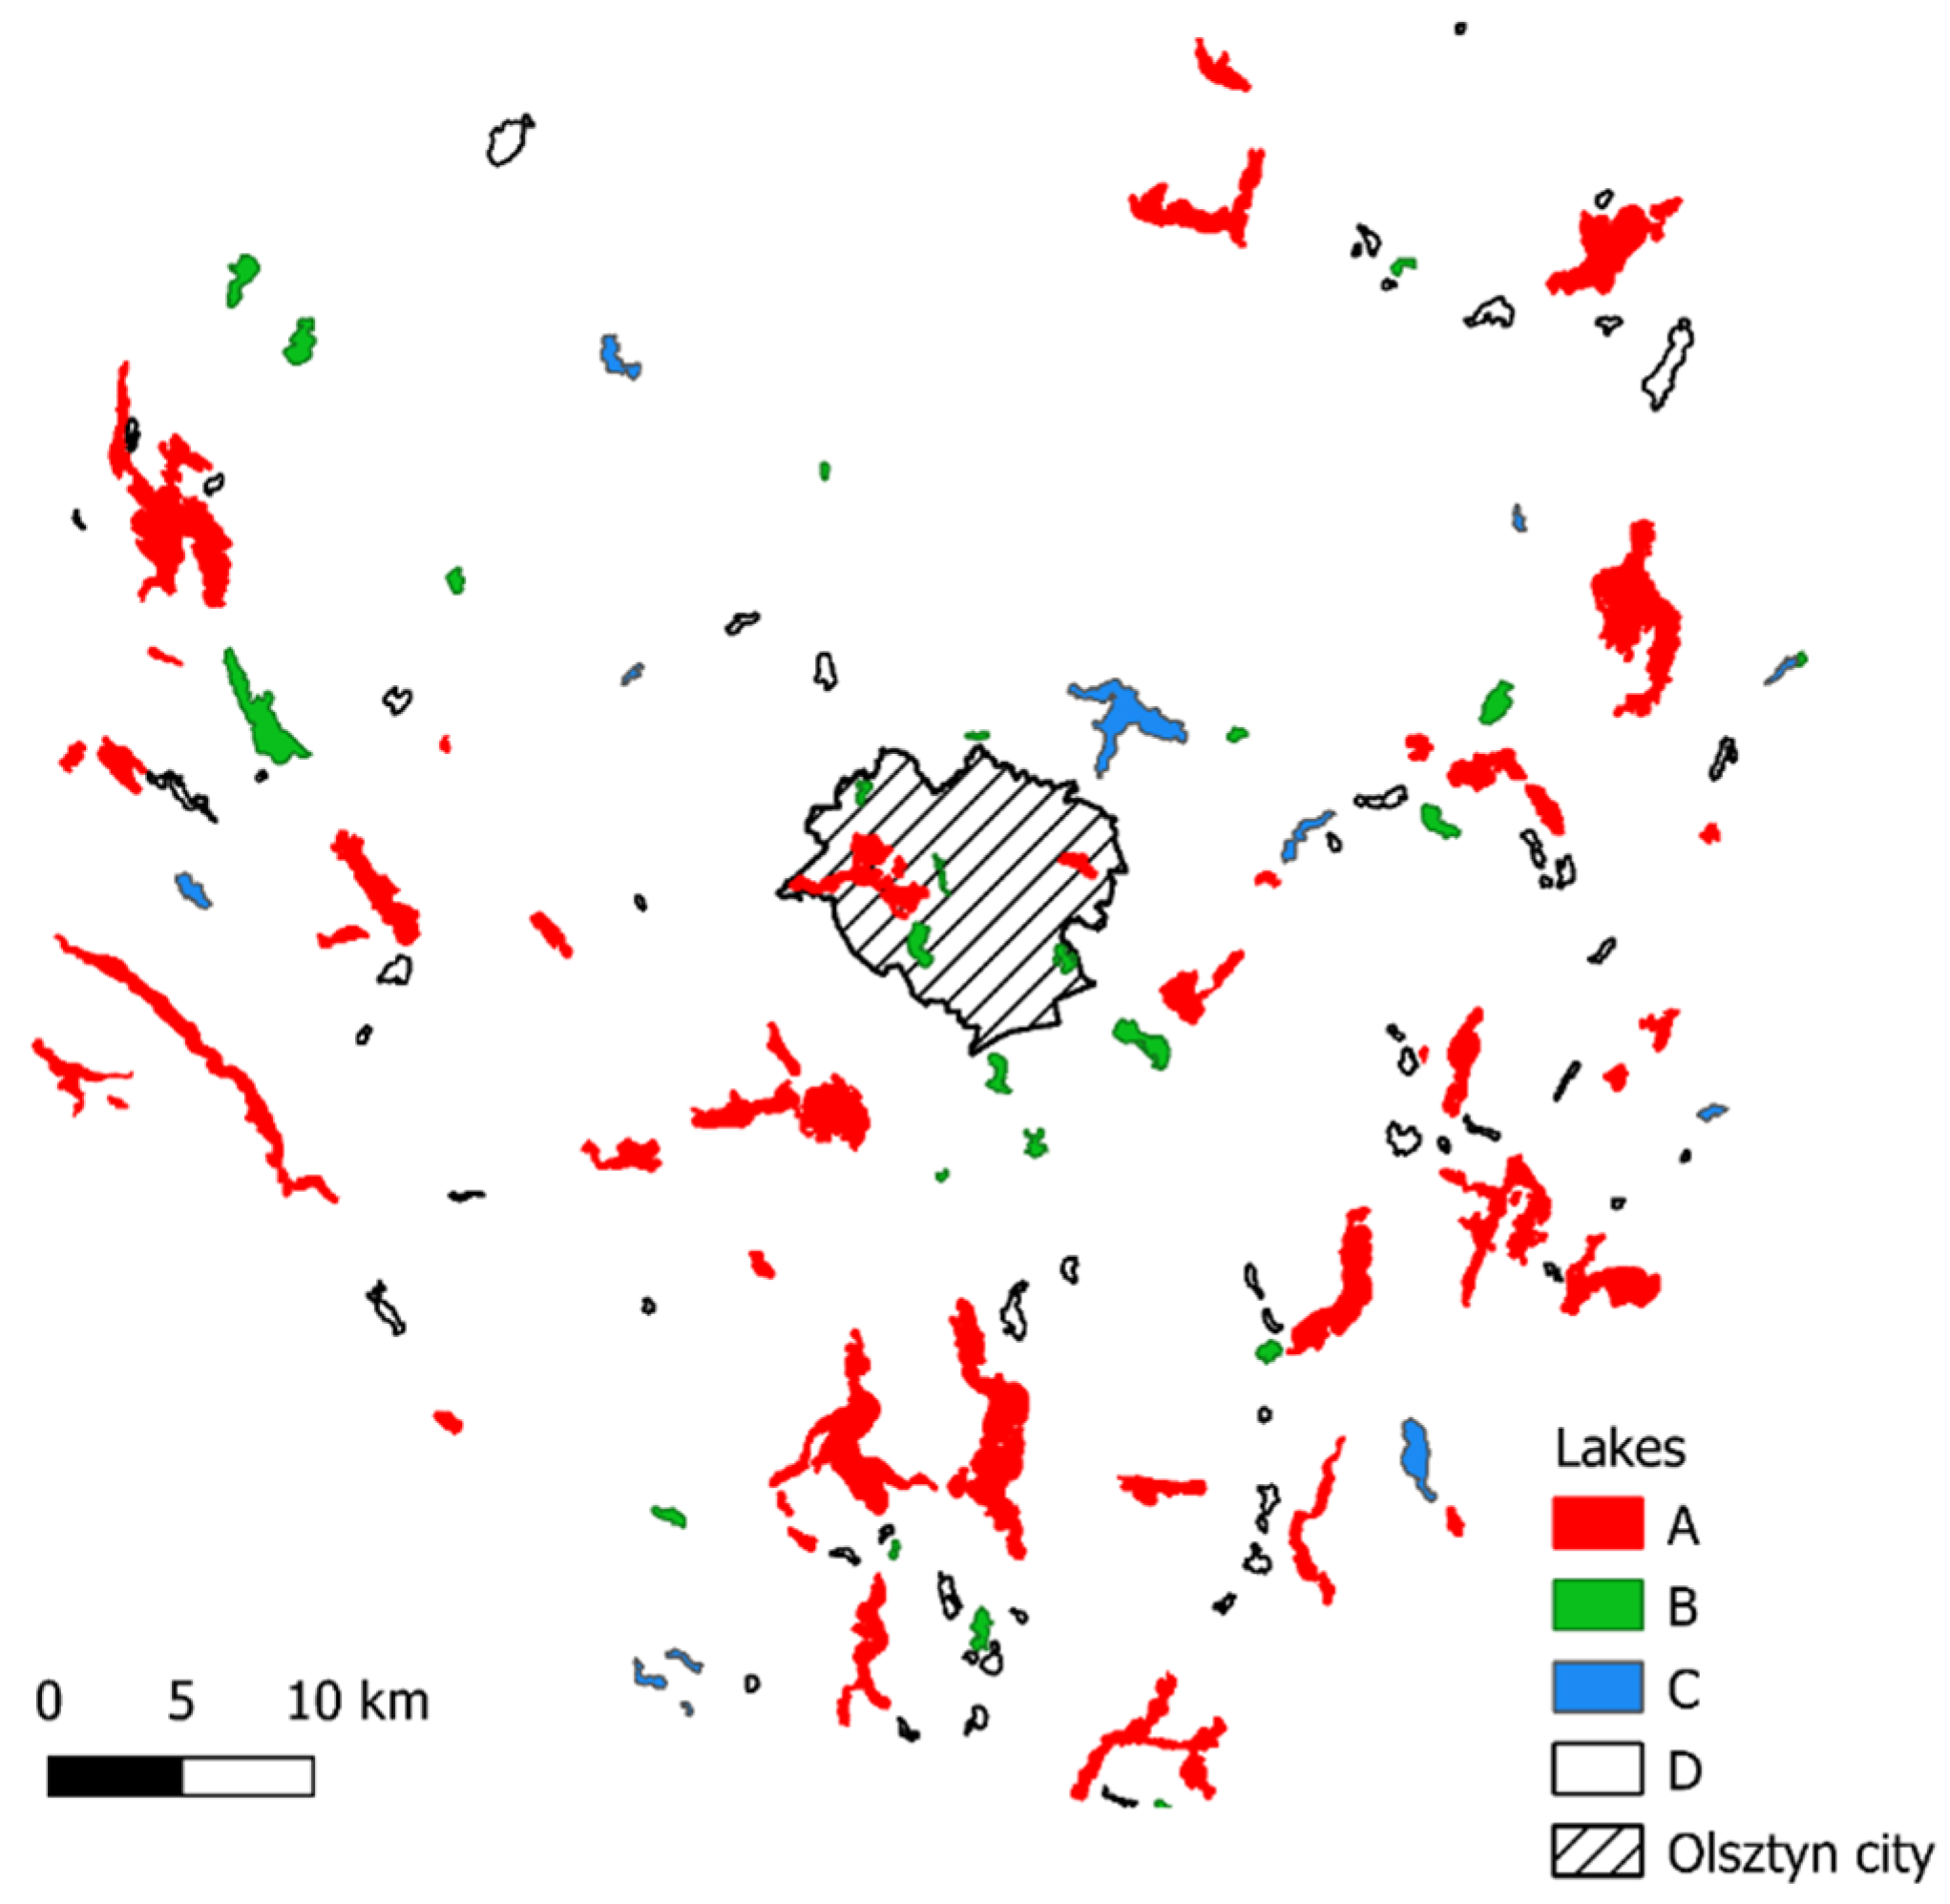
3.2. Types of Lakeshores with Tourism Functions Development
3.3. Tourism Impact Indices
4. Discussion
5. Conclusions
- Using the SHapley Additive exPlanations algorithm for land use and land cover in the lakeshore zone of the Olsztyn Lakeland, four basic lake types were distinguished.
- The development of tourism infrastructure in the lakeside area of the Olsztyn Lakeland was carried out in accordance with the principles of sustainable development.
- A worrisome phenomenon of the expansion of second homes in the shore zone of some lakes in the Olsztyn Lakeland has been noted.
Author Contributions
Funding
Institutional Review Board Statement
Informed Consent Statement
Acknowledgments
Conflicts of Interest
References
- Mitra, S.K. Is tourism-led growth hypothesis still valid? Int. J. Tour. Res. 2019, 21, 615–624. [Google Scholar] [CrossRef]
- UNWTO World Tourism Organisation. International Tourism Highlights; World Tourism Organization: Madrid, Spain, 2019. [Google Scholar] [CrossRef]
- Curtin, S.; Kragh, G. Wildlife tourism: Reconnecting people with nature. Hum. Dimens. Wildl. 2014, 19, 545–554. [Google Scholar] [CrossRef]
- Margaryan, L. Nature as a commercial setting: The case of nature-based tourism providers in Sweden. Curr. Issues Tour. 2016, 21, 1893–1911. [Google Scholar] [CrossRef]
- Fossgard, K.; Fredman, P. Dimensions in the nature-based tourism experience escape: An explorative analysis. J. Outdoor Recreat. Tour. 2019, 28, 100–219. [Google Scholar] [CrossRef]
- Kong, M.; Zhu, Y.; Han, T.; Zhang, S.; Li, J.; Xu, X.; Chao, J.; Zhang, Y.; Gao, Y. Interactions of heavy metal elements across sediment-water interface in Lake Jiaogang. Environ. Pollut. 2021, 286, 117578. [Google Scholar] [CrossRef]
- Asha, T.E. Impact of tourism on environment: Responding to global challenges. Pauline J. Res. Stud. 2013, 1, 169–182. [Google Scholar]
- Boavida-Portugal, I.; Rocha, J.; Ferreira, C.C. Exploring the impacts of future tourism development on land use/cover changes. Appl. Geogr. 2016, 77, 82–91. [Google Scholar] [CrossRef]
- Atzori, R.; Fyall, A.; Miller, G. Tourist responses to climate change: Potential impacts and adaptation in Florida’s coastal destinations. Tour. Manag. 2018, 69, 12–22. [Google Scholar] [CrossRef]
- Trancoso González, A. Venice: The problem of overtourism and the impact of cruises. Investig. Reg. J. Reg. Res. 2018, 42, 35–51. [Google Scholar]
- Lenzen, M.; Sun, Y.; Faturay, F.; Ting, Y.; Geschke, A.; Malik, A. The carbon footprint of global tourism. Nat. Clim. Chang. 2018, 8, 522–528. [Google Scholar] [CrossRef]
- Liu, R.; Dong, Y.; Quan, G.; Zhu, H.; Xu, Y.; Elwardany, R.M. Microplastic pollution in surface water and sediments of Qinghai-Tibet Plateau: Current status and causes. China Geol. 2021, 4, 178–184. [Google Scholar]
- Gössling, S. Global environmental consequences of tourism. Glob. Environ. Chang. 2002, 12, 283–302. [Google Scholar] [CrossRef]
- Gössling, S.; Hall, C.M.; Scott, D. Tourism and Water; Channel View Publications, Blue Ridge Summit: Bristol, UK, 2015. [Google Scholar] [CrossRef]
- Haines-Young, R.; Potschin, M. Common International Classification of Ecosystem Services (CICES) V5.1; Nottingham, UK, 2018. Available online: https://cices.eu/content/uploads/sites/8/2018/01/Guidance-V51-01012018.pdf (accessed on 28 June 2021).
- Dokulil, M.T. Environmental impacts of tourism on lakes. In Eutrophication: Causes, Consequences and Control; Ansari, A.A., Gill, S.S., Eds.; Springer: Dordrecht, The Netherlands, 2014. [Google Scholar] [CrossRef]
- Lorenz, S.; Pusch, M.T.; Miler, O.; Blaschke, U. How much ecological integrity does a lake need? Managing the shores of a peri-urban lake. Landsc. Urban Plan. 2017, 164, 91–98. [Google Scholar] [CrossRef]
- Ramazanova, M.; Bulai, M.; Ursu, A.; Tortella, B.; Kakabayev, A. Effects of tourism development on surface area of main lakes of Shchuchinsk-Burabay resort area, Kazakhstan. Eur. J. Tour. Res. 2019, 21, 69–86. [Google Scholar]
- Orams, M. Marine Tourism: Development, Impacts and Management; Routledge: London, UK, 1999. [Google Scholar]
- Jennings, G. Water-Based Tourism, Sport, Leisure, and Recreation Experiences; Routledge: London, UK, 2007. [Google Scholar] [CrossRef]
- Tuohino, A. The potential of lakes and lake landscape in the concept of nordic wellbeing. Pol. J. Nat. Sci. 2013, 28, 267–281. [Google Scholar]
- Burak, S.; Dogan, E.; Gazioglu, C. Impact of urbanization and tourism on coastal environment. Ocean Coast. Manag. 2004, 47, 515–527. [Google Scholar] [CrossRef]
- González-De Zayas, R.; Barredo Year, A.; Manduca Artiles, M.; Lestayo González, J.A.; Castillo Sandoval, F.S.; Merino-Ibarra, M. Trace metals in sediments of seven coastal lagoons of the Sabana—Camagüey Archipelago, Cuba. Soil Sediment Contam. Int. J. 2021, 30, 331–349. [Google Scholar] [CrossRef]
- Pomucz, A.B.; Csete, M. Sustainability assessment of Hungarian lakeside tourism development. Period. Polytech. Soc. Manag. Sci. 2015, 23, 121–132. [Google Scholar] [CrossRef] [Green Version]
- Tuohino, A. In Search of the Sense of Finnish Lakes. A Geographical Approach to Lake Tourism Marketing; Nordia Geographical Publications: Oulu, Finland, 2015. [Google Scholar]
- Schmieder, K. European lakeshores in danger—concepts for a sustainable development. Limnologica 2004, 34, 3–14. [Google Scholar] [CrossRef] [Green Version]
- Schneider, S.C.; Biberdžić, V.; Braho, V.; Budzakoska Gjoreska, B.; Cara, M.; Dana, Z.; Durašković, P.; Eriksen, T.E.; Hjermanna, D.; Imeri, A.; et al. Littoral eutrophication indicators are more closely related to nearshore land use than to water nutrient concentrations: A critical evaluation of stressor-response relationships. Sci. Total Environ. 2020, 748, 141193. [Google Scholar] [CrossRef] [PubMed]
- Sanchez, M.L.; Schiaffino, M.R.; Graziano, M.; Huber, P.; Lagomarsino, L.; Minotti, P.; Zagarese, H.; Izaguirre, I. Effect of land use on the phytoplankton community of Pampean shallow lakes of the Salado River basin (Buenos Aires Province, Argentina). Aquat. Ecol. 2021, 55, 417–435. [Google Scholar] [CrossRef]
- Ostendorp, W.; Schmieder, K.; Joehnk, K.D. Assessment of human pressures and their hydromorphological impacts on lakeshores in Europe. Ecohydrol. Hydrobiol. 2004, 4, 379–395. [Google Scholar]
- Furgała-Selezniow, G.; Sankiewicz, D.; Skrzypczak, A.; Mamcarz, A. The impacts of tourism and recreation on lake shores: A case study of Limajno and Stobajno Lakes in north-eastern Poland. In Lake Tourism Research. Towards Sustaining Communities and Lake Environments; McIntyre, N., Koster, R., Lemelin, H., Eds.; Lakehead University, Centre for Tourism and Community Development Research: Thunder Bay, ON, Canada, 2010; pp. 99–111. [Google Scholar]
- Mikhailenko, A.V.; Ruban, D.A.; Ermolaev, V.A.; van Loon, A.J. Cadmium Pollution in the Tourism Environment: A Literature Review. Geosciences 2020, 10, 242. [Google Scholar] [CrossRef]
- Hengstmann, E.; Fischer, E.K. Anthropogenic litter in freshwater environments—Study on lake beaches evaluating marine guidelines and aerial imaging. Environ. Res. 2020, 189, 109945. [Google Scholar] [CrossRef]
- Freire, S.; Santos, T.; Tenedorio, J.A. Recent urbanization and land use/land cover change in Portugal—the influence of coastline and coastal urban centers. J. Coast. Res. 2009, 56, 1499–1503. [Google Scholar]
- Williams, P.W.; Ponsford, I.F. Confronting tourism’s environmental paradox: Transitioning for sustainable tourism. Futures 2009, 41, 396–404. [Google Scholar] [CrossRef]
- Petrović, M.D.; Vujko, A.; Gajić, T.; Vuković, D.B.; Radovanović, M.; Jovanović, J.M.; Vuković, N. Tourism as an approach to sustainable rural development in post-socialist countries: A comparative study of Serbia and Slovenia. Sustainability 2017, 10, 54. [Google Scholar] [CrossRef] [Green Version]
- Streimikiene, D.; Svagzdiene, B.; Jasinskas, E.; Simanavicius, A. Sustainable tourism development and competitiveness: The systematic literature review. Sustain. Dev. 2021, 29, 259–271. [Google Scholar] [CrossRef]
- Butler, R.W. Sustainable tourism: A state-of-the-art review. Tour. Geogr. 1999, 1, 7–25. [Google Scholar] [CrossRef] [Green Version]
- New 7 Wonders News Room. New 7 Wonders of Nature Recognition Award for Poland’s Masurian Lake District. 2012. Available online: https://about.new7wonders.com/category/masurian-lake-district/ (accessed on 12 March 2020).
- Kondracki, J. Regional Geography of Poland; PWN: Warszawa, Poland, 2009. (In Polish) [Google Scholar]
- Embleton, C.; Duphorn, K.; Galon, R.; Gellert, J.F.; Cate, J.A.; Joly, F. West and Central European Lowlands. In Geomorphology of Europe; Embleton, C., Ed.; Palgrave: London, UK, 1984. [Google Scholar] [CrossRef]
- Choiński, A. Polish Lakes Catalogue; Wydawnictwo Naukowe UAM: Poznań, Poland, 2006. (In Polish) [Google Scholar]
- Skwierawski, A. The causes, extent and consequences of lake drainage in the Olsztyn Lakeland in the 19th and early 20th century. In Problems of Management and Environmental Protection; Koc, J., Ed.; Wydawnictwo UWM: Olsztyn, Poland, 2011; Volume 8, pp. 33–52. [Google Scholar]
- Statistical Office in Olsztyn. Statistical Yearbook of Warmińsko-Mazurskie Voivodeship. 2018. Available online: https://olsztyn.stat.gov.pl/en/publications/statistical-yearbook/statistical-yearbook-of-warminsko-mazurskie-voivodship-2018,1,11.html (accessed on 18 March 2021).
- Jańczak, J. (Ed.) Lakes Atlas of Poland. Volume II. Lakes of Przymorze Rivers’ Catchment Area and Lower Vistula Drainage System; Bogucki Wydawnictwo Naukowe: Poznań, Poland, 1997. (In Polish) [Google Scholar]
- Jańczak, J. (Ed.) Lakes Atlas of Poland. Volume III. Lakes of the Masurian Lakeland and Southern Poland; Bogucki Wydawnictwo Naukowe: Poznań, Poland, 1999. (In Polish) [Google Scholar]
- Shapley, L.S. A value for n-person games. In Contributions to the Theory of Games II; Kuhn, H.W., Tucker, A.W., Eds.; Princeton University Press: Princeton, NY, USA, 1953; pp. 307–317. [Google Scholar]
- Lundberg, S.M.; Erion, G.G.; Lee, S.-I. Consistent Individualized Feature Attribution for Tree Ensembles. arXiv 2018, arXiv:1802.03888v3. [Google Scholar]
- Szromek, A.R. Measuring the tourism function of areas by means of indicators of the tourism function of areas of European countries. Studia Ekon. 2013, 132, 91–103. (In Polish) [Google Scholar]
- Furgała-Selezniow, G.; Jankun-Woźnicka, M.; Hakuć-Błażowska, A. Analysis of a tourist function in towns and villages on the lakeshore of Lake Jeziorak. Pr. Studia Geogr. 2019, 64, 35–47. (In Polish) [Google Scholar]
- Hącia, E. Spatial diversification of tourist accommodation in Polish seaside regions. Bull. Marit. Inst. Gdańsk 2017, 32, 145–153. [Google Scholar] [CrossRef]
- Mika, M. Tourism and the Environmental Change in the Silesian Beskid Mountains; Instytut Geografii i Gospodarki Przestrzennej UJ: Cracow, Poland, 2004. (In Polish) [Google Scholar]
- Dustin, D.L.; Jacobson, P.C. Predicting the extent of lakeshore development using GIS datasets. Lake Reserv. Manag. 2015, 31, 169–179. [Google Scholar] [CrossRef]
- Beck, M.; Vondracek, B.; Hatch, L.K.; Vinje, J. Semi-automated analysis of high-resolution aerial images to quantify docks in glacial lakes. ISPRS J. Photogramm. Remote. Sens. 2013, 81, 60–69. [Google Scholar] [CrossRef]
- Host, G.E.; Schuldt, J.; Ciborowski, J.J.H.; Johnson, L.B.; Hollenhorst, T.; Richards, C. Use of GIS and remotely sensed data for a priori identification of reference areas for Great Lakes coastal ecosystems. Int. J. Remote. Sens. 2005, 26, 5325–5342. [Google Scholar] [CrossRef]
- Wacnik, A.; Kupryjanowicz, M.; Mueller-Bieniek, A.; Karczewski, M.; Cywa, K. The environmental and cultural contexts of the late Iron age and medieval settlement in the Mazurian Lake District, NE Poland: Combined palaeobotanical and archaeological data. Veg. Hist. Archaeobotany 2014, 23, 439–459. [Google Scholar] [CrossRef] [Green Version]
- Hall, C.M.; Härkönen, T. (Eds.) Lake tourism. An integrated approach to lacustrine tourism systems. In Aspects of Tourism; Channel View Publications: Clevedon, UK; Buffalo, NY, USA; Toronto, ON, Canada, 2006. [Google Scholar]
- McIntyre, N.; Koster, R.; Lemelin, H. (Eds.) Lake Tourism Research. Towards Sustaining Communities and Lake Environments; Lakehead University, Centre for Tourism and Community Development Research: Thunder Bay, ON, Canada, 2010. [Google Scholar]
- Anctil, A.; Blanc, D.L. An educational simulation tool for integrated coastal tourism development in developing countries. J. Sustain. Tour. 2016, 24, 783–798. [Google Scholar] [CrossRef]
- Liu, L.; Kong, L.; Feng, Y.X.; Qin, D.D.; Mao, N. Impacts of tourism development and tourist activities on environment in scenic ecotourism spots. Appl. Ecol. Environ. Res. 2019, 17, 9347–9355. [Google Scholar] [CrossRef]
- Štrumbelj, E.; Kononenko, I. An efficient explanation of individual classifications using game theory. J. Mach. Learn. Res. 2010, 11, 1–18. Available online: http://dl.acm.org/citation.cfm?id=1756006.1756007 (accessed on 27 May 2021).
- Gosiewska, A.; Biecek, P. iBreakDown: Uncertainty of Model Explanations for Non-additive Predictive Models. 2019. Available online: https://arxiv.org/abs/1903.11420v1 (accessed on 28 June 2021).
- Cohen, S.; Ruppin, E.; Dror, G. Feature Selection Based on the Shapley Value. IJCAI-05. In Proceedings of the Nineteenth International Joint Conference on Artificial Intelligence, Edinburgh, UK, 30 July–5 August 2005; pp. 665–670. [Google Scholar]
- Nandlall, S.D.; Millard, K. Quantifying the Relative Importance of Variables and Groups of Variables in Remote Sensing Classifiers Using Shapley Values and Game Theory. IEEE Geosci. Remote Sens. Lett. 2020, 17, 42–46. [Google Scholar] [CrossRef]
- Holzner, J. Tourism and nature conservation at lake Schwerin, Germany: A contradiction? In Lake Tourism Research. Towards Sustaining Communities and Lake Environments; McIntyre, N., Koster, R., Lemelin, H., Eds.; Lakehead University, Centre for Tourism and Community Development Research: Thunder Bay, ON, Canada, 2010; pp. 93–97. [Google Scholar]
- Czarnecki, A.; Lewandowska-Czarnecka, A. Socioeconomic versus natural system in a dynamic lake landscape: A case study of Jeziorak Lake in Poland. Int. J. Des. Nat. Ecodyn. 2012, 7, 261–273. [Google Scholar] [CrossRef]
- Parliament of Warmińsko-Mazurskie Voivodeship. Warmińsko-Mazurskie 2030. Social and Economic Development Strategy; Public Information Bulletin: Olsztyn, Poland, 2020; Available online: https://bip.warmia.mazury.pl/akty/14253/uchwala-w-sprawie-przyjecia-strategii-rozwoju-wojewodztwa-warminsko-mazurskie-2030.-strategia-rozwoju-spoleczno-gospodarczego.html (accessed on 28 May 2021). (In Polish)
- Ren, T.; Can, M.; Paramati, S.R.; Fang, J.; Wu, W. The impact of tourism quality on economic development and environment: Evidence from Mediterranean Countries. Sustainability 2019, 11, 2296. [Google Scholar] [CrossRef] [Green Version]
- Winter, P.L.; Selin, S.; Cerveny, L.; Bricker, K. Outdoor recreation. nature-based tourism, and sustainability. Sustainability 2020, 12, 81. [Google Scholar] [CrossRef] [Green Version]
- Wehrly, K.E.; Breck, J.E.; Wang, L.; Szabo-Kraft, L. Assessing local and landscape patterns of residential shoreline development in Michigan lakes. Lake Reserv. Manag. 2012, 28, 158–169. [Google Scholar] [CrossRef]
- McCullough, I.M.; King, K.B.S.; Stachelek, J.; Diaz, J.; Soranno, P.A.; Cheruvelil, K.S. Applying the patch-matrix model to lakes: A connectivity based conservation framework. Landsc. Ecol. 2019, 34, 2703–2718. [Google Scholar] [CrossRef]
- Kirillova, K.; Fu, X.; Lehto, X.; Cai, L. What makes a destination beautiful? Dimensions of tourist aesthetic judgment. Tour. Manag. 2014, 42, 282–293. [Google Scholar] [CrossRef]
- Statistical Yearbook of the Regions—Poland; Statistics Poland: Warsaw, Poland, 2019. Available online: https://stat.gov.pl/obszary-tematyczne/roczniki-statystyczne/roczniki-statystyczne/rocznik-statystyczny-wojewodztw-2019,4,14.html (accessed on 18 March 2021).
- Parliament of Warmińsko-Mazurskie Voivodeship. Tourism Development Strategy for Warmia and Mazury Until 2025; Olsztyn, Poland, 2016. Available online: https://bip.warmia.mazury.pl/409/strategia-rozwoju-turystyki-wojewodztwa-warminsko-mazurskiego-do-roku-2025.html (accessed on 28 June 2021). (In Polish).
- Dodds, R.; Butler, R. Common resource use: Policy definition and implementation. Tour. Int. Multidiscip. J. Tour. 2010, 5, 35–53. [Google Scholar]
- Lambooy, T.; Levashova, Y. Opportunities and challenges for private sector entrepreneurship and investment in biodiversity, ecosystem services and nature conservation. Int. J. Biodivers. Sci. Ecosyst. Serv. Manag. 2011, 7, 301–318. [Google Scholar] [CrossRef]
- Furgała-Selezniow, G.; Jankun-Woźnicka, M.; Mika, M. Lake regions under human pressure in the context of socio-economic transition in Central-Eastern Europe: The case study of Olsztyn Lakeland, Poland. Land Use Policy 2020, 90, 104350. [Google Scholar] [CrossRef]
- Jaszczak, A.; Łaguna, W.; Žukovski, J. The identity of regional projects in the rural areas: Methodological and management aspects. Manag. Theory Stud. Rural. Bus. Infrastruct. Dev. 2010, 23, 45–51. [Google Scholar]
- Kil, J. A rural revival: The benefits of European Union development schemes for rural areas in the region of Warmia and Mazury. In Shared Resources in a Rapidly Changing World, European Regional, Proceedings of the Conference of the International Association for the Study of the Commons, Plovdiv, Bulgaria, 14–17 September 2011; Agricultural University: Plovdiv, Bulgaria, 2011; Available online: https://dlc.dlib.indiana.edu/dlc/handle/10535/7694?show=full (accessed on 12 May 2021).


| Lake Size Class | Lake Area (km2) | Number of Lakes | Area Range (km2) | Maximum Depth Range (m) | Average Depth Range (m) | Shoreline Development Index |
|---|---|---|---|---|---|---|
| small | 0.1–0.4 | 66 | 0.10–0.39 | 1.1–30.2 | 0.6–11.9 | 1.04–2.56 |
| medium | 0.4–2.0 | 54 | 0.41–1.98 | 2.0–68.0 | 1.1–23.3 | 1.19–2.83 |
| large | >2.0 | 23 | 2.02–12.40 | 2.0–54.6 | 0.7–16.1 | 1.58–4.40 |
| total | 143 | 0.10–12.40 | 1.1–68.0 | 0.6–23.3 | 1.04–4.40 |
| Role of Tourist Function in the Functional Structure | Number of Accommodation Beds per 1 km2 (PA) |
|---|---|
| Primary or one of the main functions | >50 |
| Equivalent to other functions or additional | 25–50 |
| Additional | 6.25–25 |
| In the initial stage of development | 0.75–6.25 |
| No development of tourist function | <0.78 |
| Shapley Value | LU/LC Type | XGB Model Accuracy | |||||||
|---|---|---|---|---|---|---|---|---|---|
| Accommodation Facility Area | Recreation and Gastronomy Area | Settlement Area | Transportation Land | Semi-Natural Land | Agricultural Land | Forests | Training Subset | Test Subset | |
| Mean | 80.6 | 41.2 | 15.4 | 0.8 | 4.4 | 4.0 | 6.4 | 96.0 | 90.9 |
| SD | 13.5 | 13.9 | 7.3 | 1.3 | 3.2 | 2.7 | 2.5 | 1.0 | 1.6 |
| T Mean (±SD) Median | PA Mean (±SD) Median | PO Mean (±SD) Median | Dd Mean (±SD) Median | ||
|---|---|---|---|---|---|
| LU/LC type | A | 0.30 a | 190.4 a | 7.18 a | 6.03 a |
| (±3.03) | (±223.49) | (±9.44) | (±7.09) | ||
| 6.05 | 113.14 | 4.80 | 3.99 | ||
| B | 0.21 a | 0.8 b | 6.54 a | 2.68 b | |
| (±3.26) | (±3.86) | (±5.29) | (±3.34) | ||
| 2.58 | 0.00 | 5.30 | 1.18 | ||
| C | 0.18 a | 0.0 b | 1.35 ab | 4.07 ab | |
| (±1.13) | (±0.00) | (±1.55) | (±4.22) | ||
| 2.04 | 0.00 | 0.55 | 2.81 | ||
| D | 0.01 b | 0.0 b | 0.00 b | 0.88 c | |
| (±0.29) | (±0.00) | (±0.00) | (±1.61) | ||
| 0.00 | 0.00 | 0.00 | 0.00 | ||
| Lake size class | Small | 2.12 a | 27.06 a | 2.78 a | 2.82 a |
| (±3.17) | (±104.33) | (±6.02) | (±6.16) | ||
| 0.25 | 0.0 | 0.0 | 0.87 | ||
| Medium | 3.08 a | 64.74 a | 3.03 a | 2.01 a | |
| (±3.54) | (±187.44) | (±4.57) | (±3.18) | ||
| 1.31 | 0.0 | 1.19 | 0.56 | ||
| Large | 5.42 b | 152.06 b | 7.11 b | 5.51 b | |
| (±3.12) | (±153.76) | (±10.65) | (±4.40) | ||
| 4.81 | 120.9 | 4.98 | 3.83 |
Publisher’s Note: MDPI stays neutral with regard to jurisdictional claims in published maps and institutional affiliations. |
© 2021 by the authors. Licensee MDPI, Basel, Switzerland. This article is an open access article distributed under the terms and conditions of the Creative Commons Attribution (CC BY) license (https://creativecommons.org/licenses/by/4.0/).
Share and Cite
Furgała-Selezniow, G.; Jankun-Woźnicka, M.; Kruk, M.; Omelan, A.A. Land Use and Land Cover Pattern as a Measure of Tourism Impact on a Lakeshore Zone. Land 2021, 10, 787. https://doi.org/10.3390/land10080787
Furgała-Selezniow G, Jankun-Woźnicka M, Kruk M, Omelan AA. Land Use and Land Cover Pattern as a Measure of Tourism Impact on a Lakeshore Zone. Land. 2021; 10(8):787. https://doi.org/10.3390/land10080787
Chicago/Turabian StyleFurgała-Selezniow, Grażyna, Małgorzata Jankun-Woźnicka, Marek Kruk, and Aneta A. Omelan. 2021. "Land Use and Land Cover Pattern as a Measure of Tourism Impact on a Lakeshore Zone" Land 10, no. 8: 787. https://doi.org/10.3390/land10080787