
Coupling Relationship and Interactive Response between Intensive Land Use and Tourism Industry Development in China’s Major Tourist Cities

Abstract
:1. Introduction
2. Materials and Methods
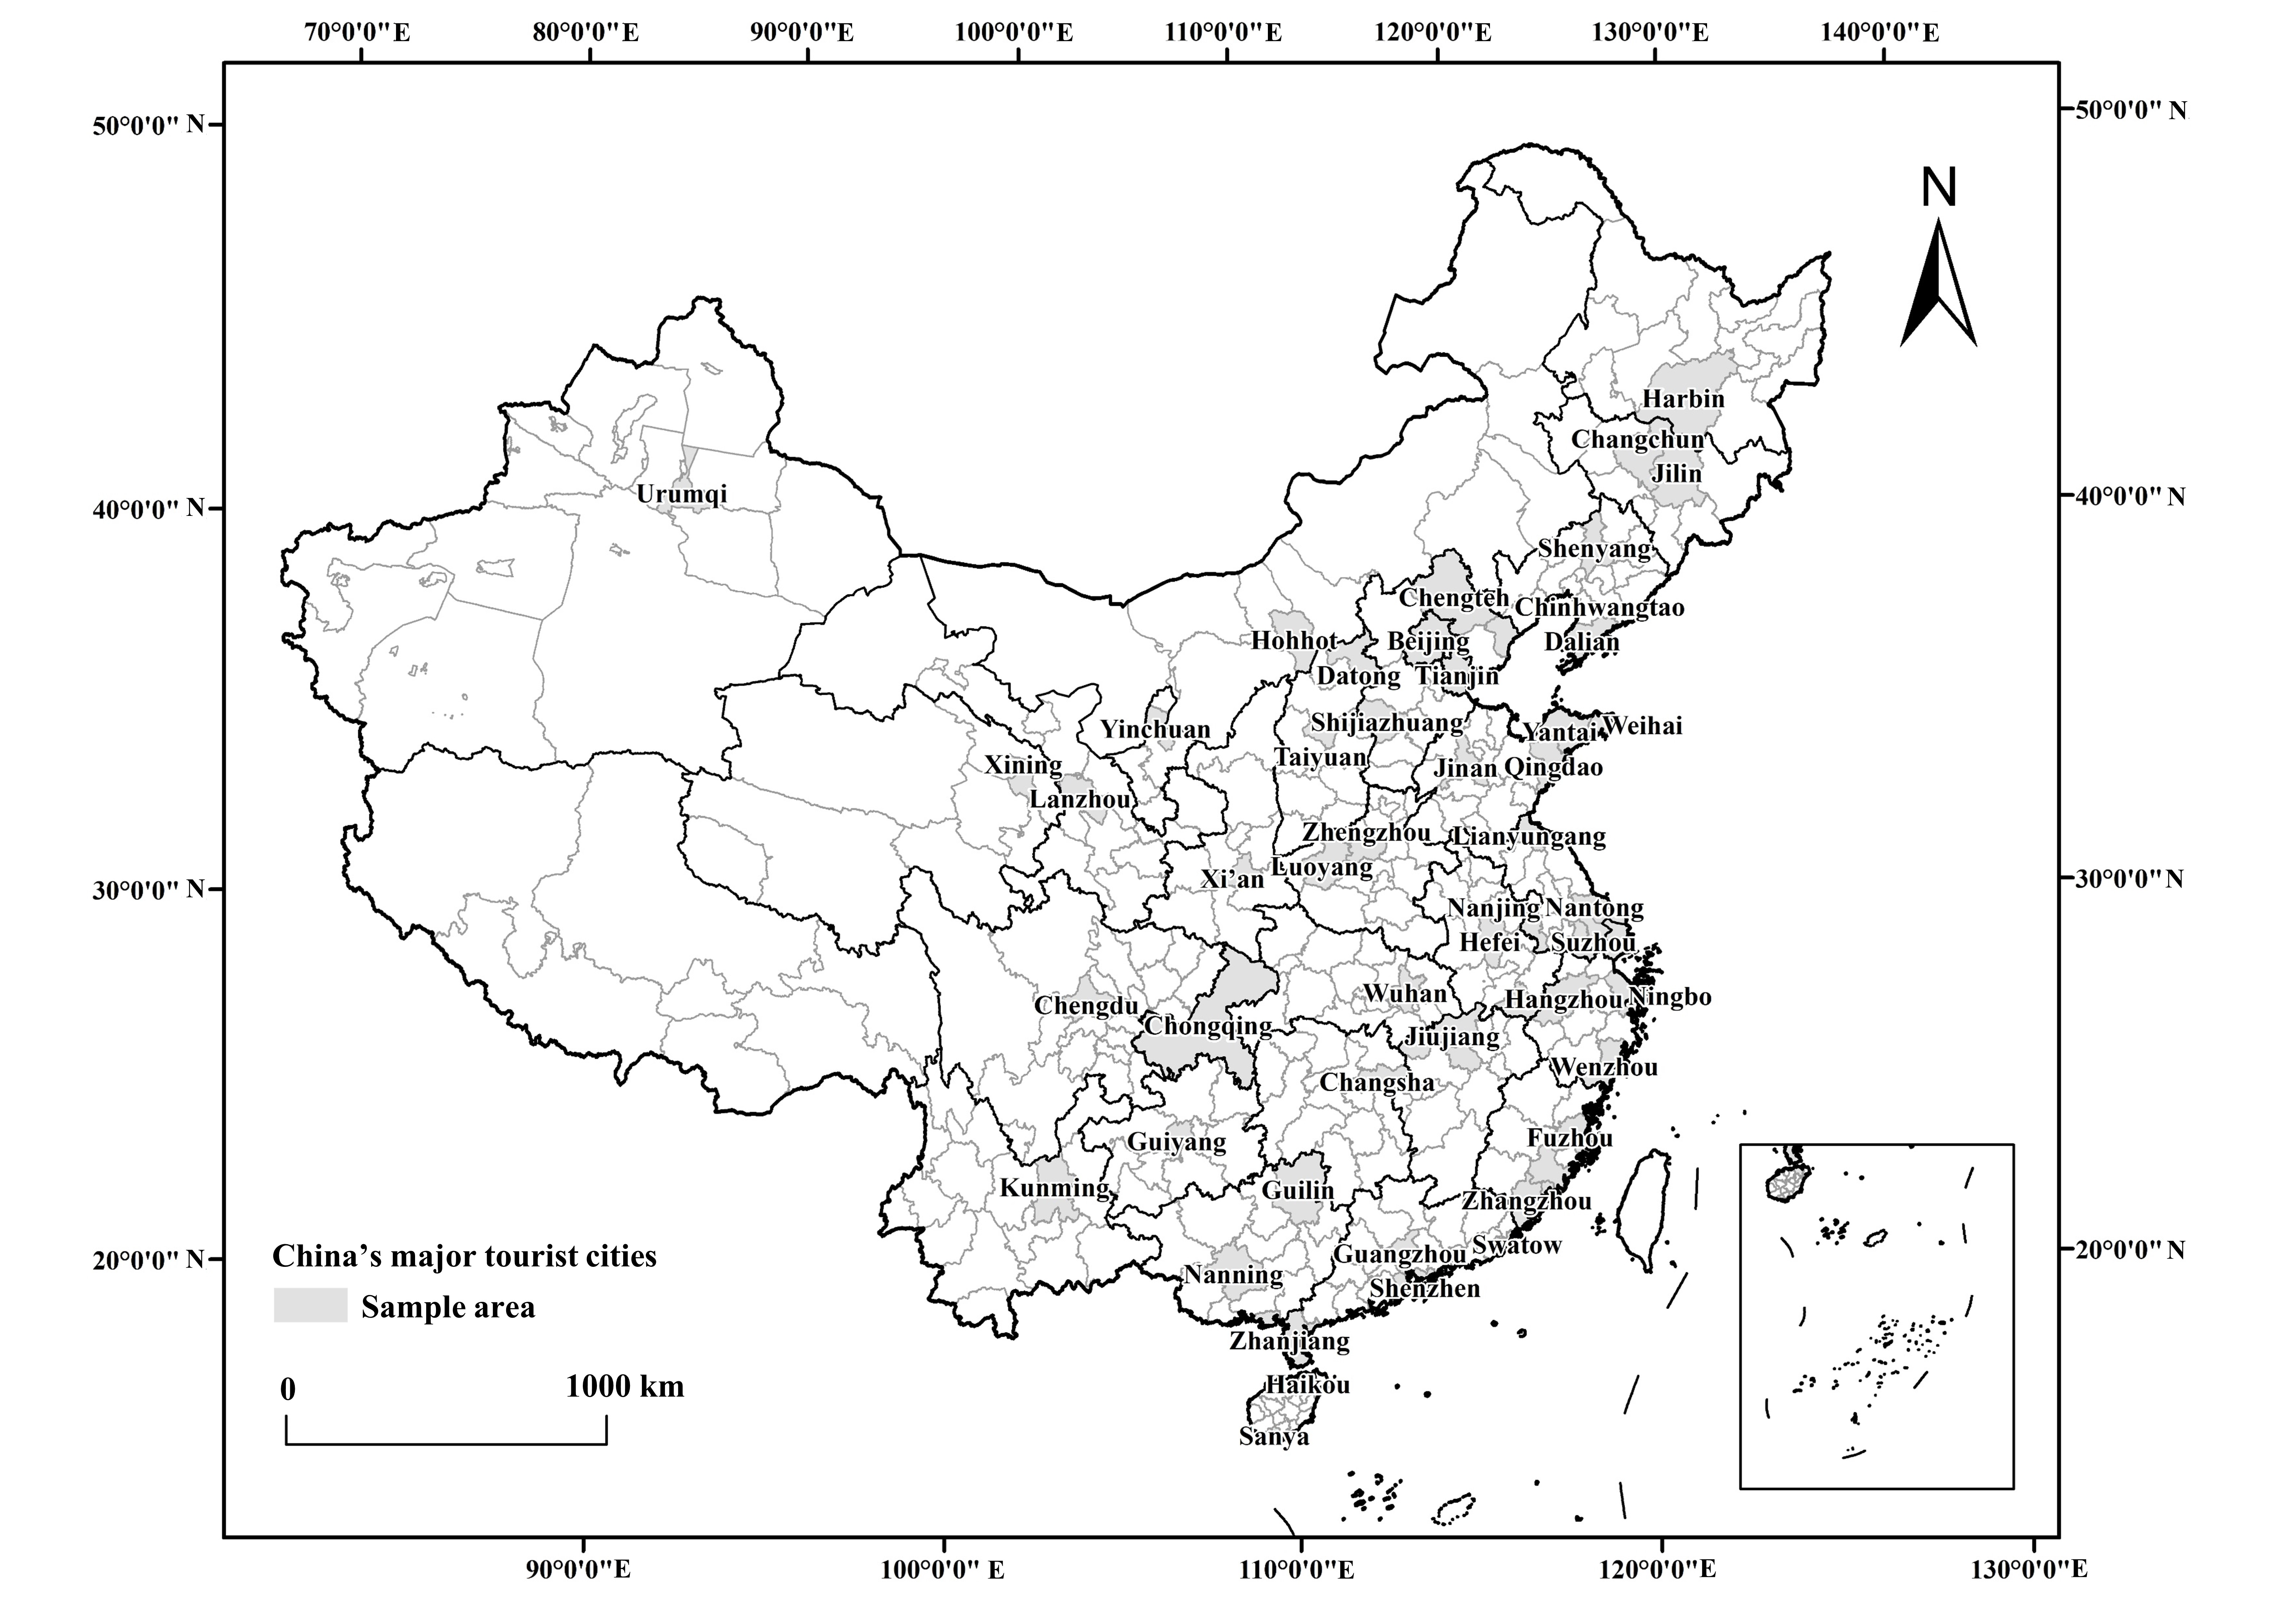
2.1. Study Area
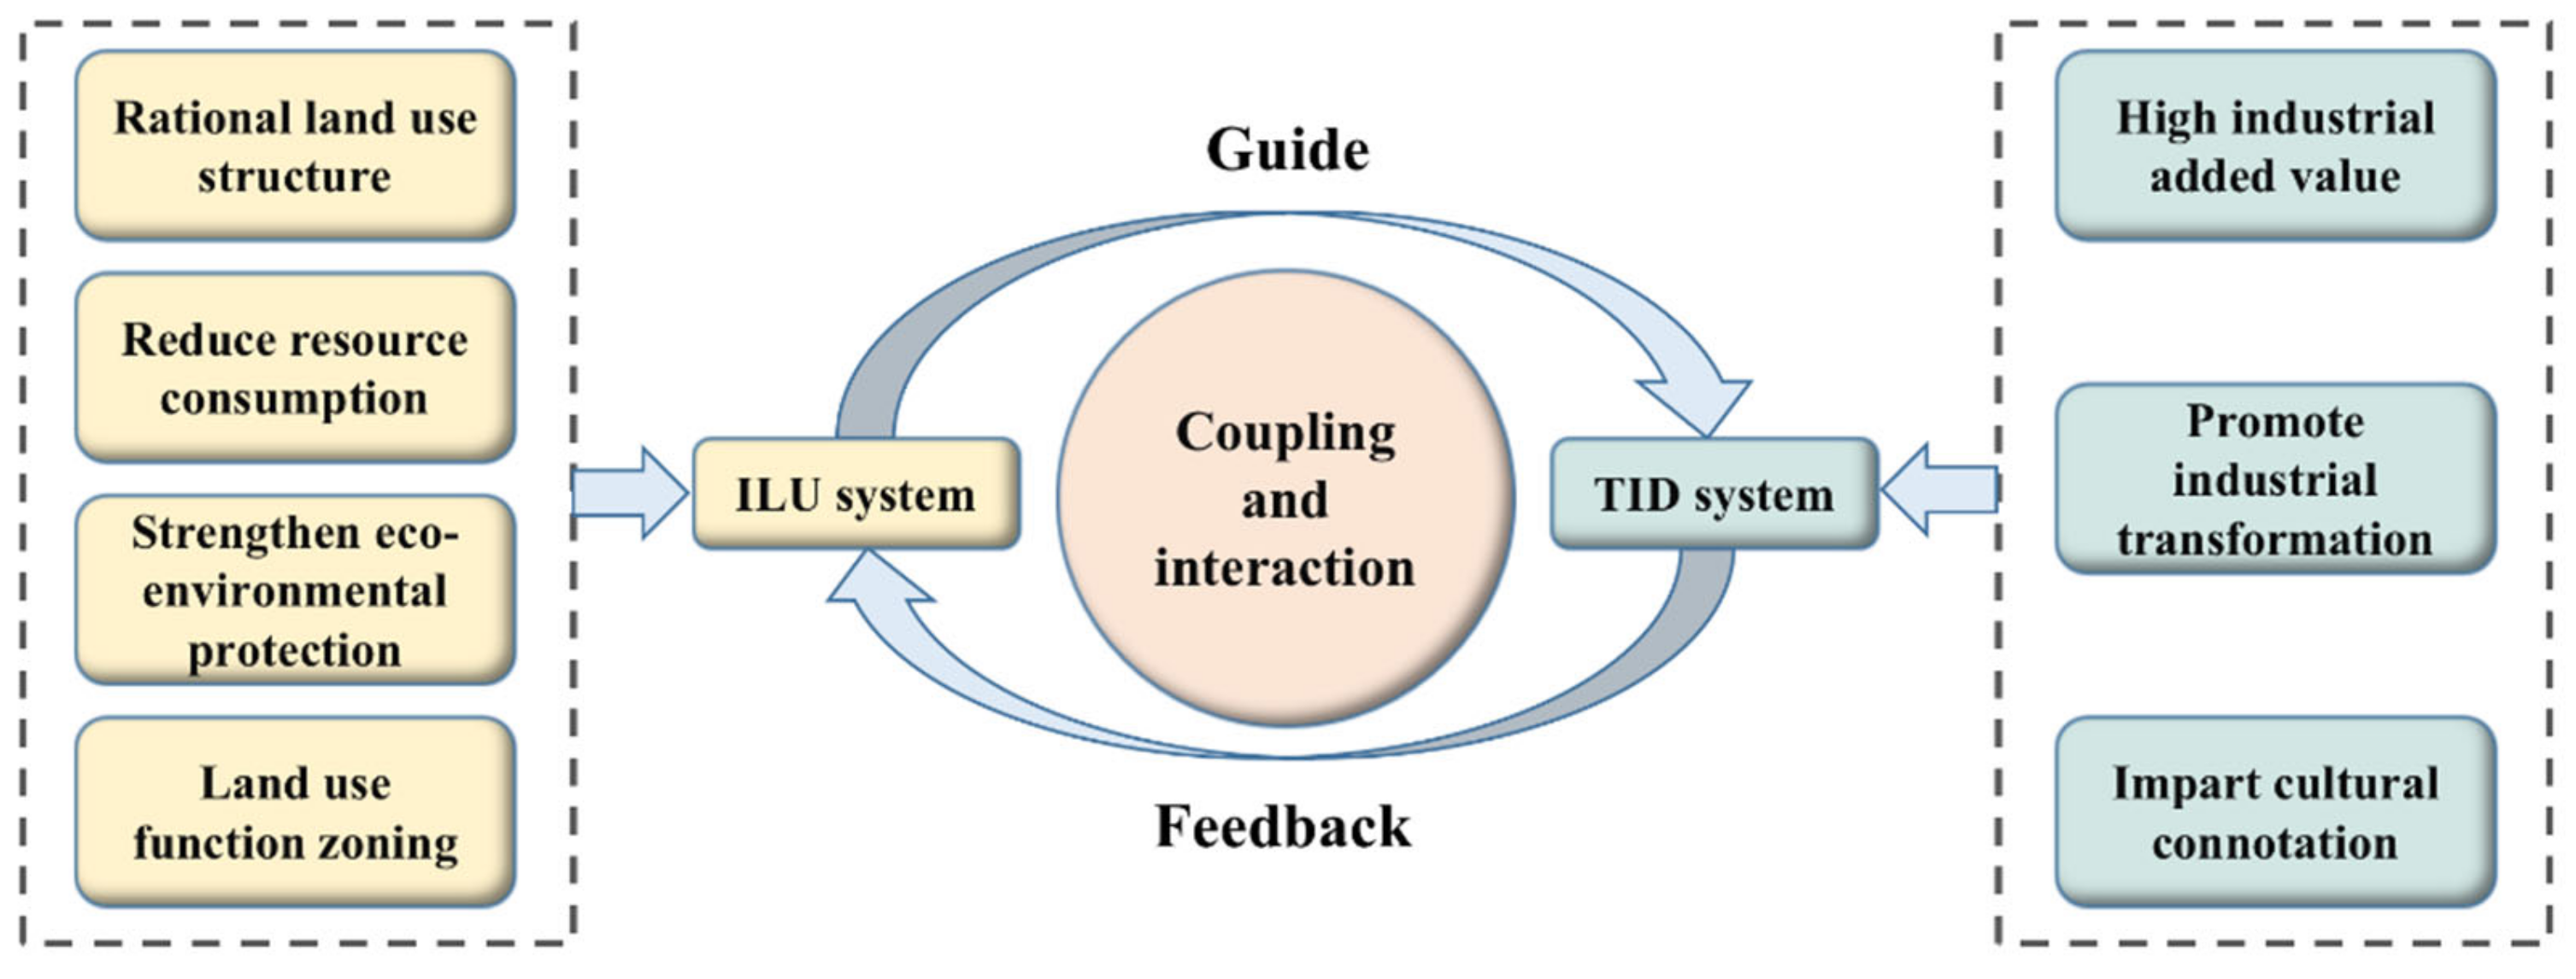
2.2. The Coupling and Coordination Mechanism of ILU and TID
2.3. Implementation of Methodology
2.3.1. Construction of Evaluation Index System
2.3.2. Evaluation Method of Development Level
2.3.3. Coupling Coordination Degree Model
2.3.4. Panel Vector Auto-Regression Model
2.4. Data Sources
3. Results
3.1. Spatial and Temporal Characteristics of Index of ILU and TID
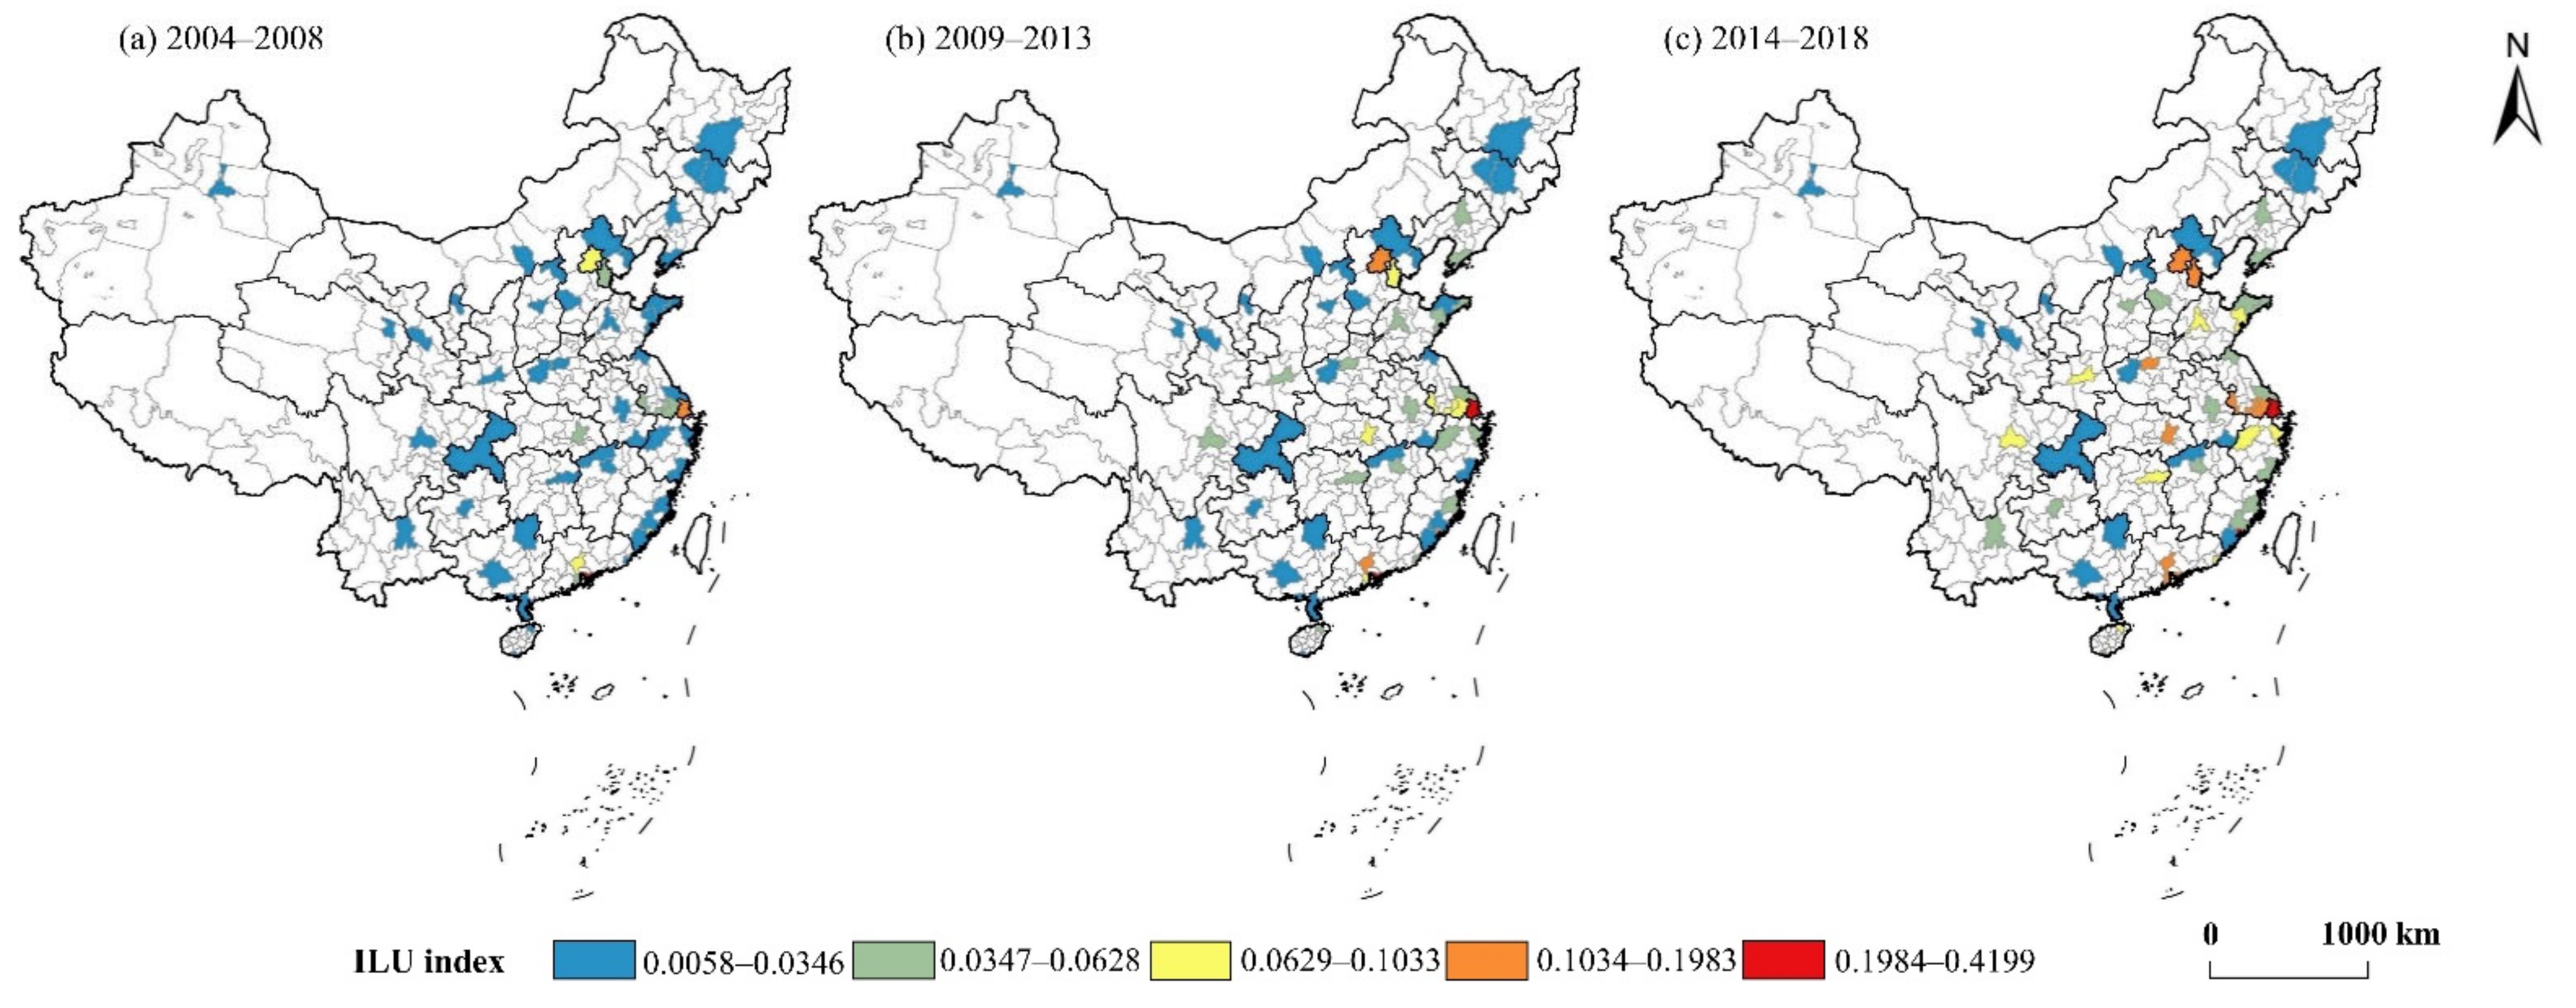
3.1.1. ILU Index
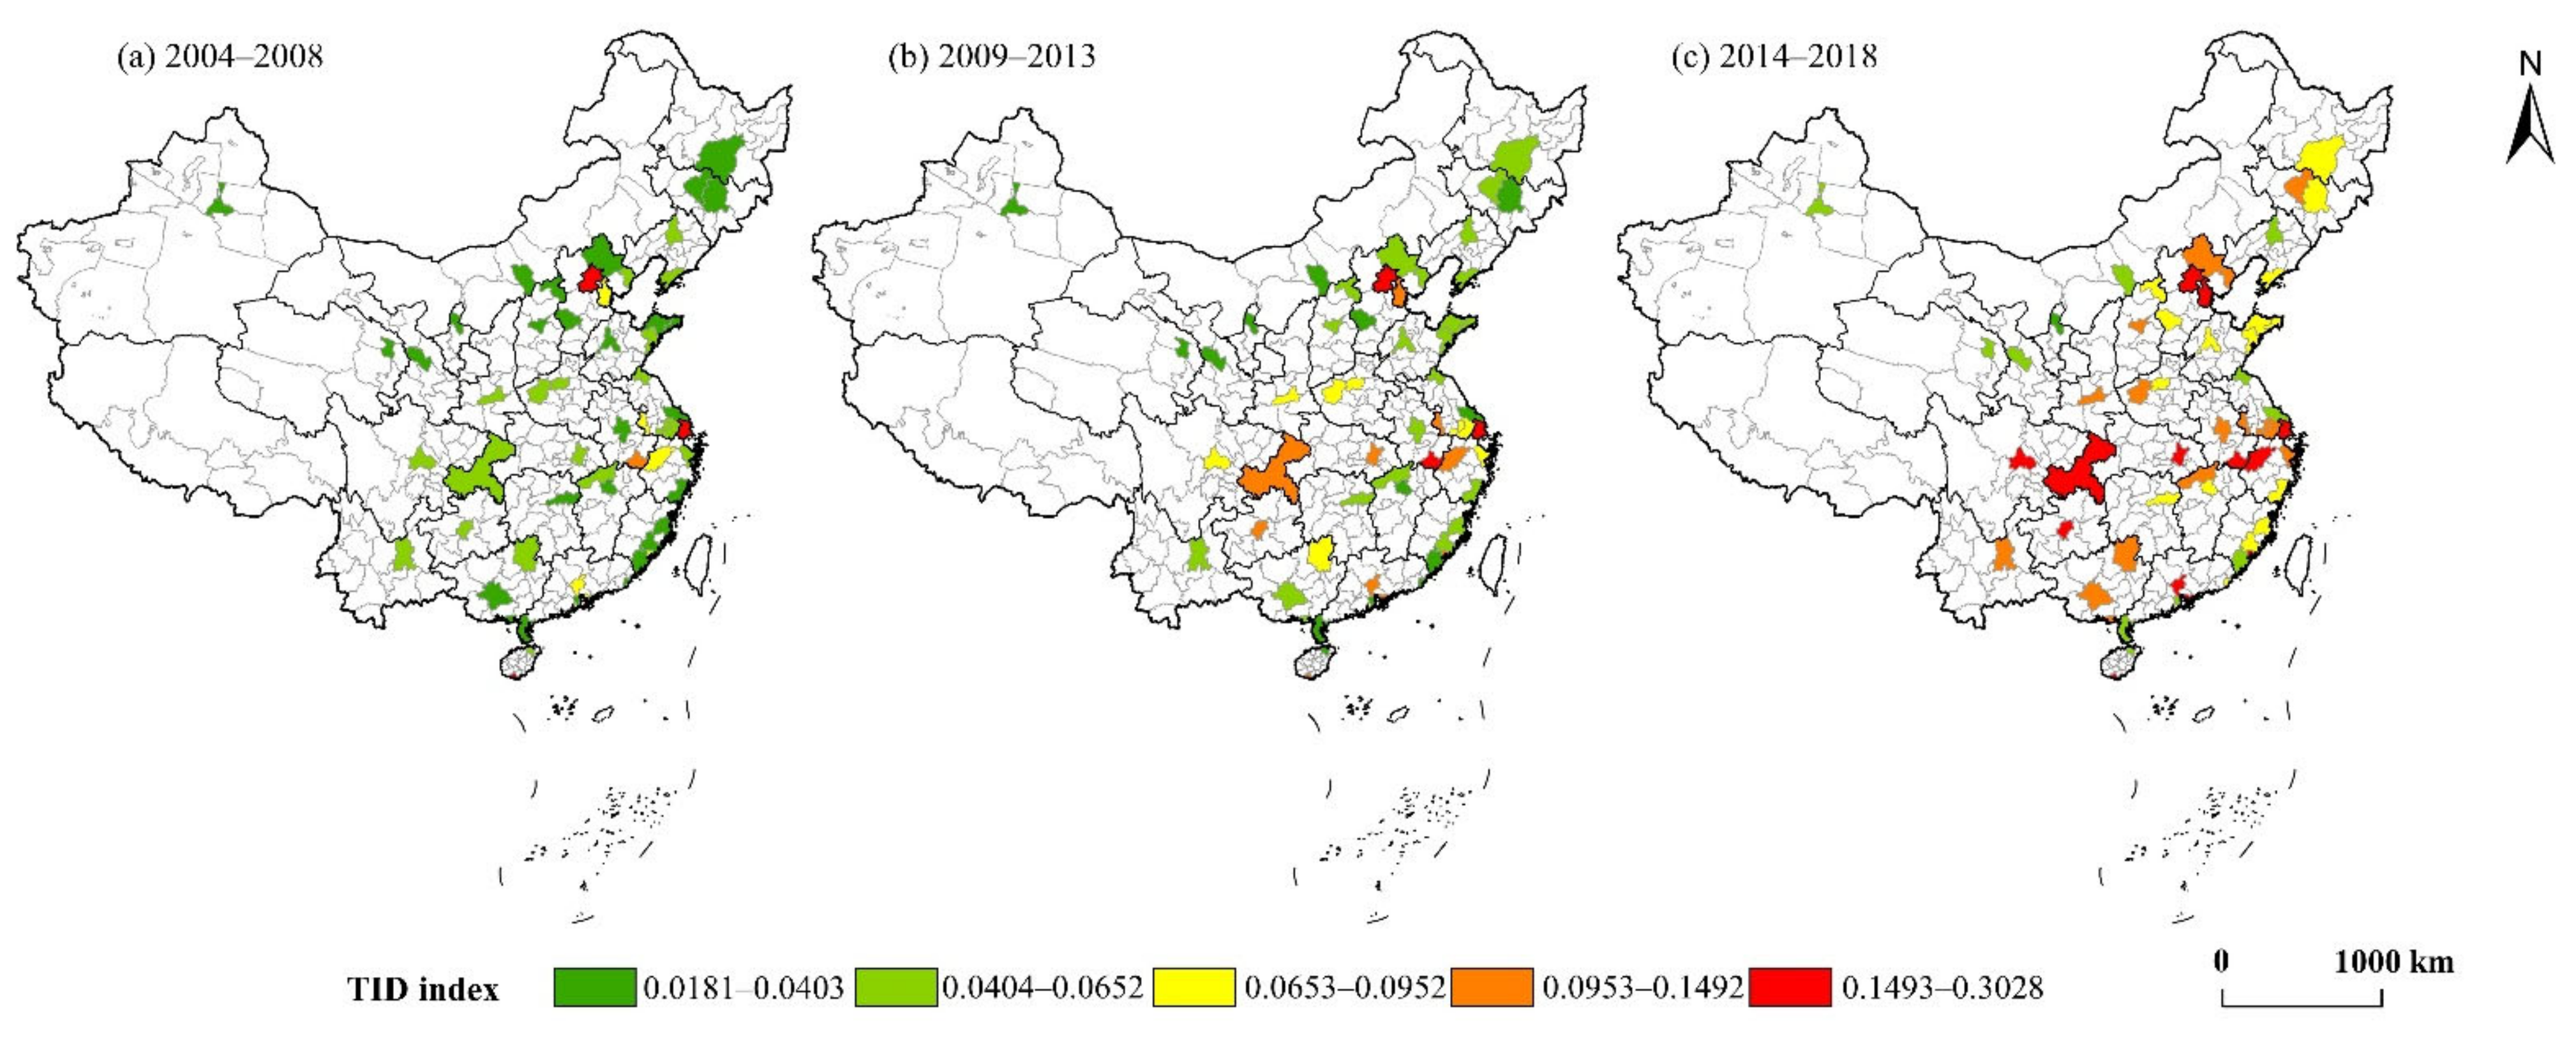
3.1.2. TID Index
3.2. Spatial and Temporal Characteristics of Coupling Coordination Degree
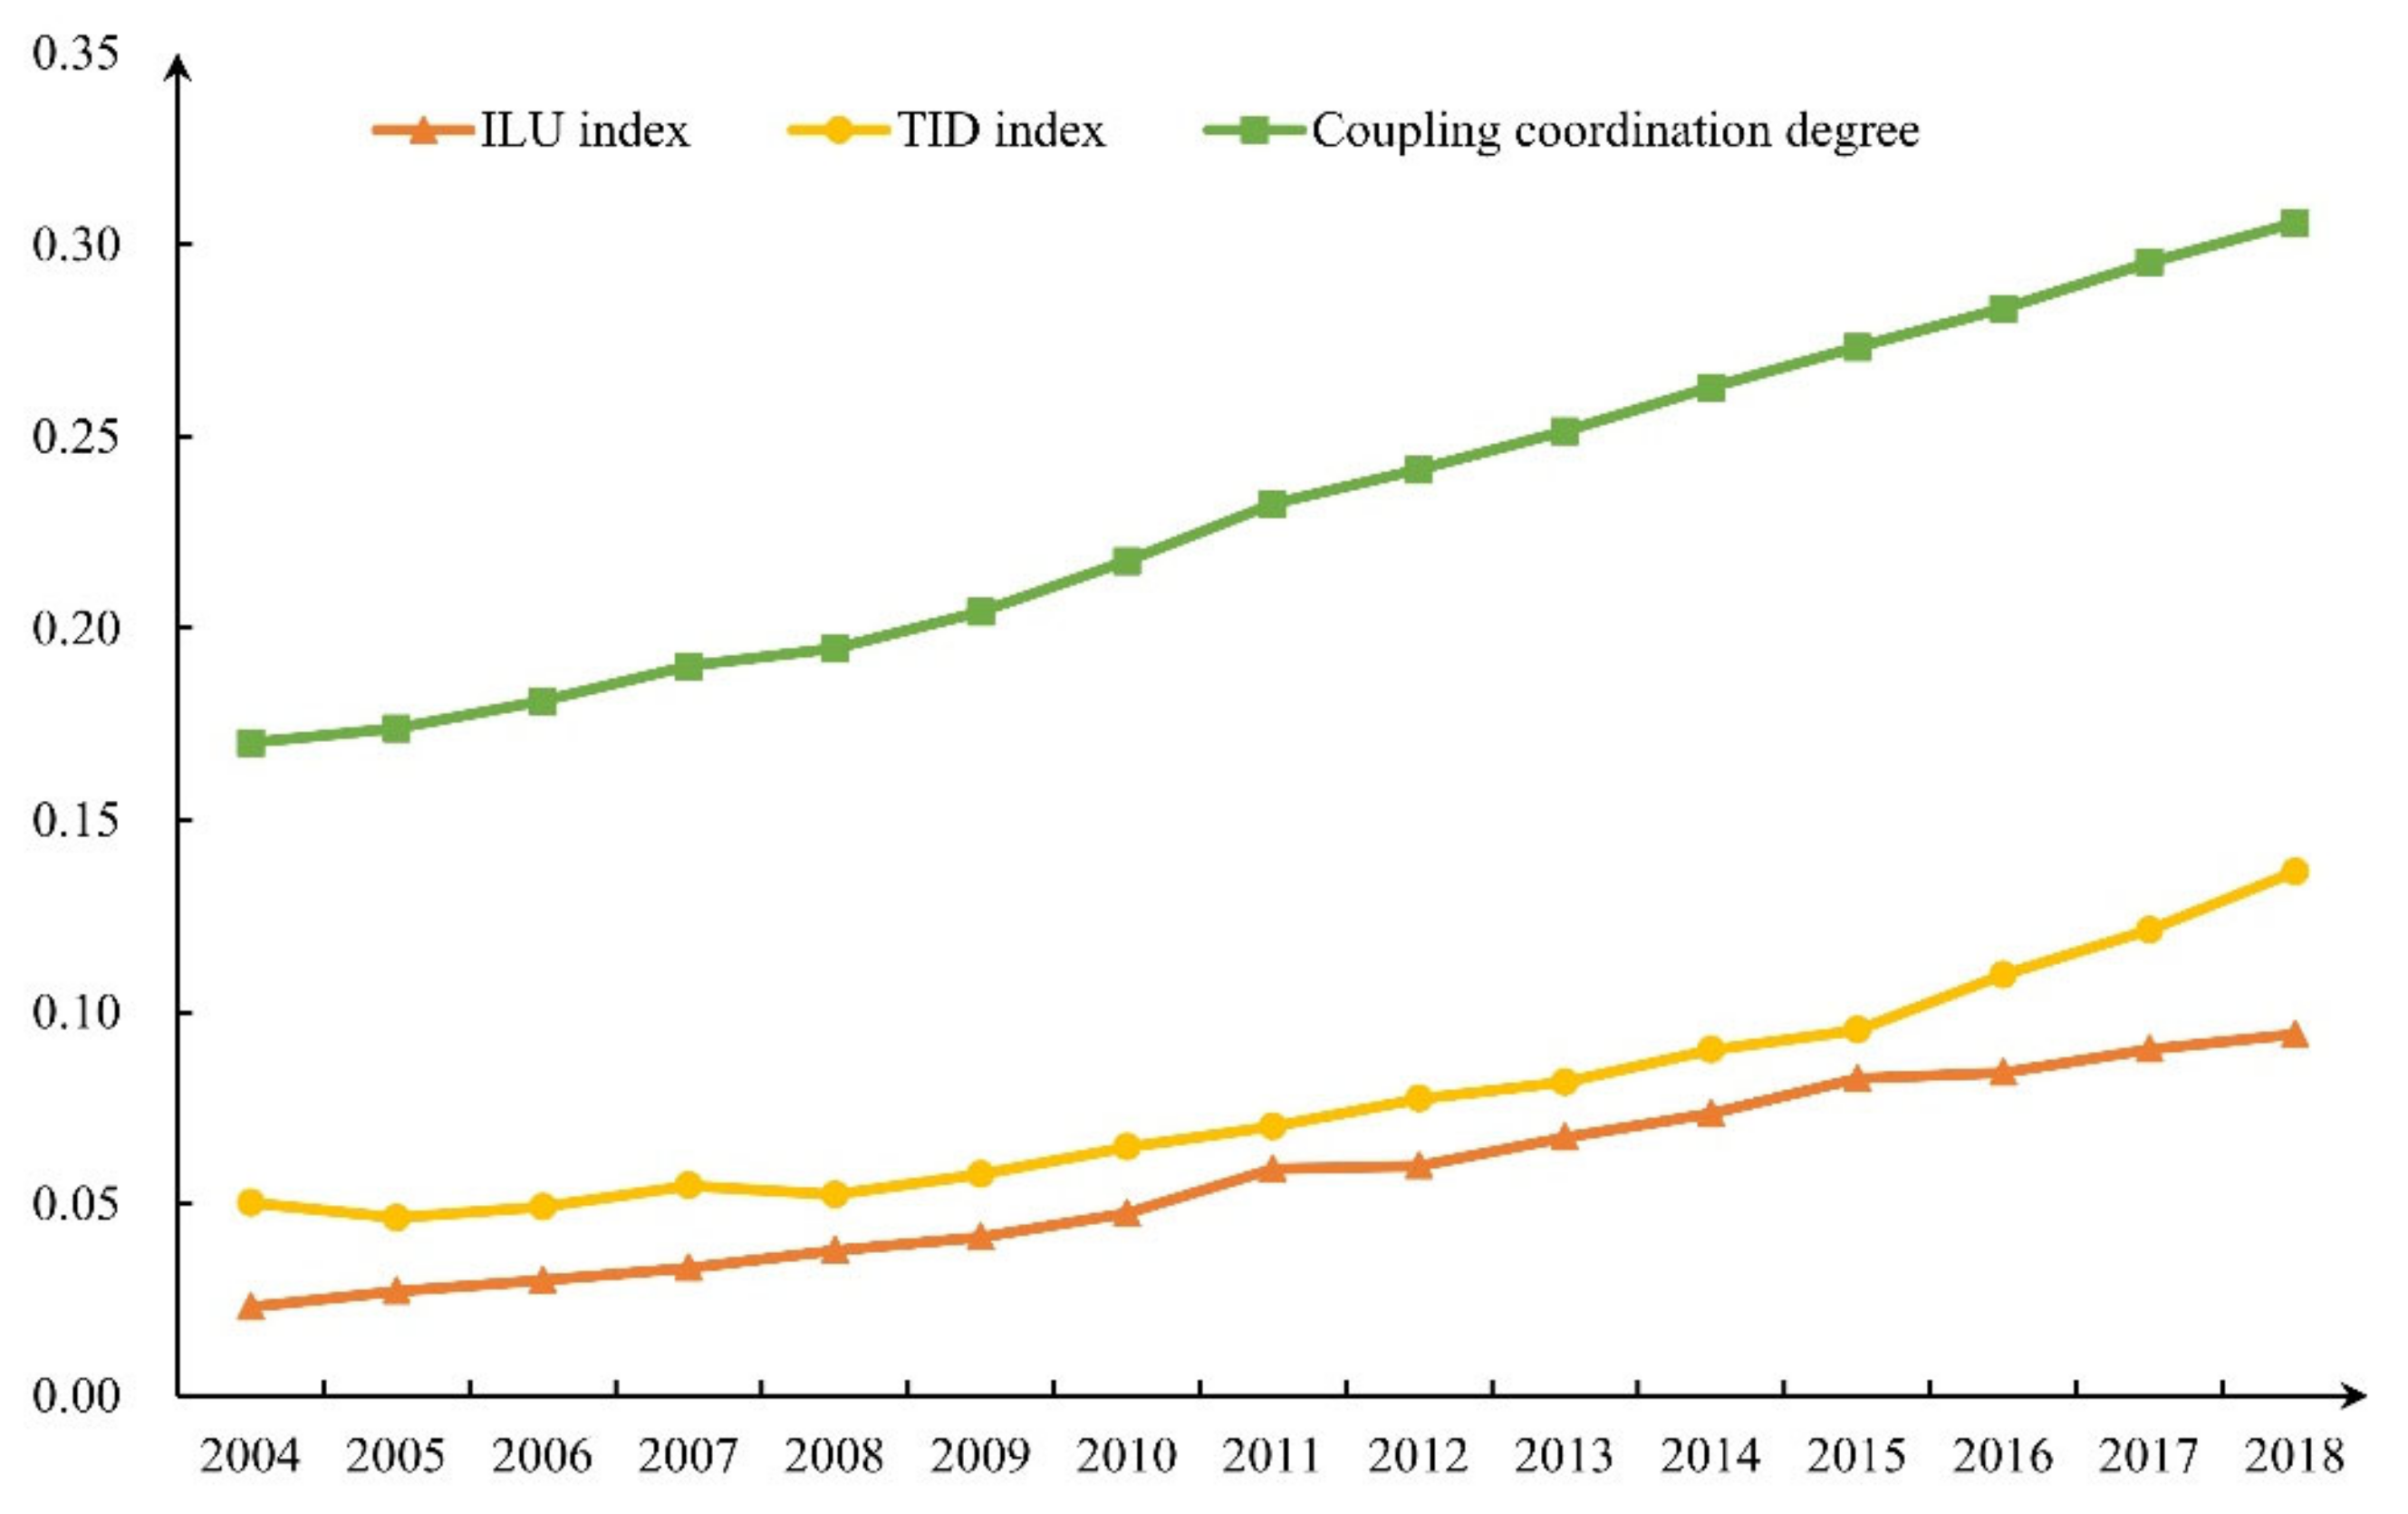
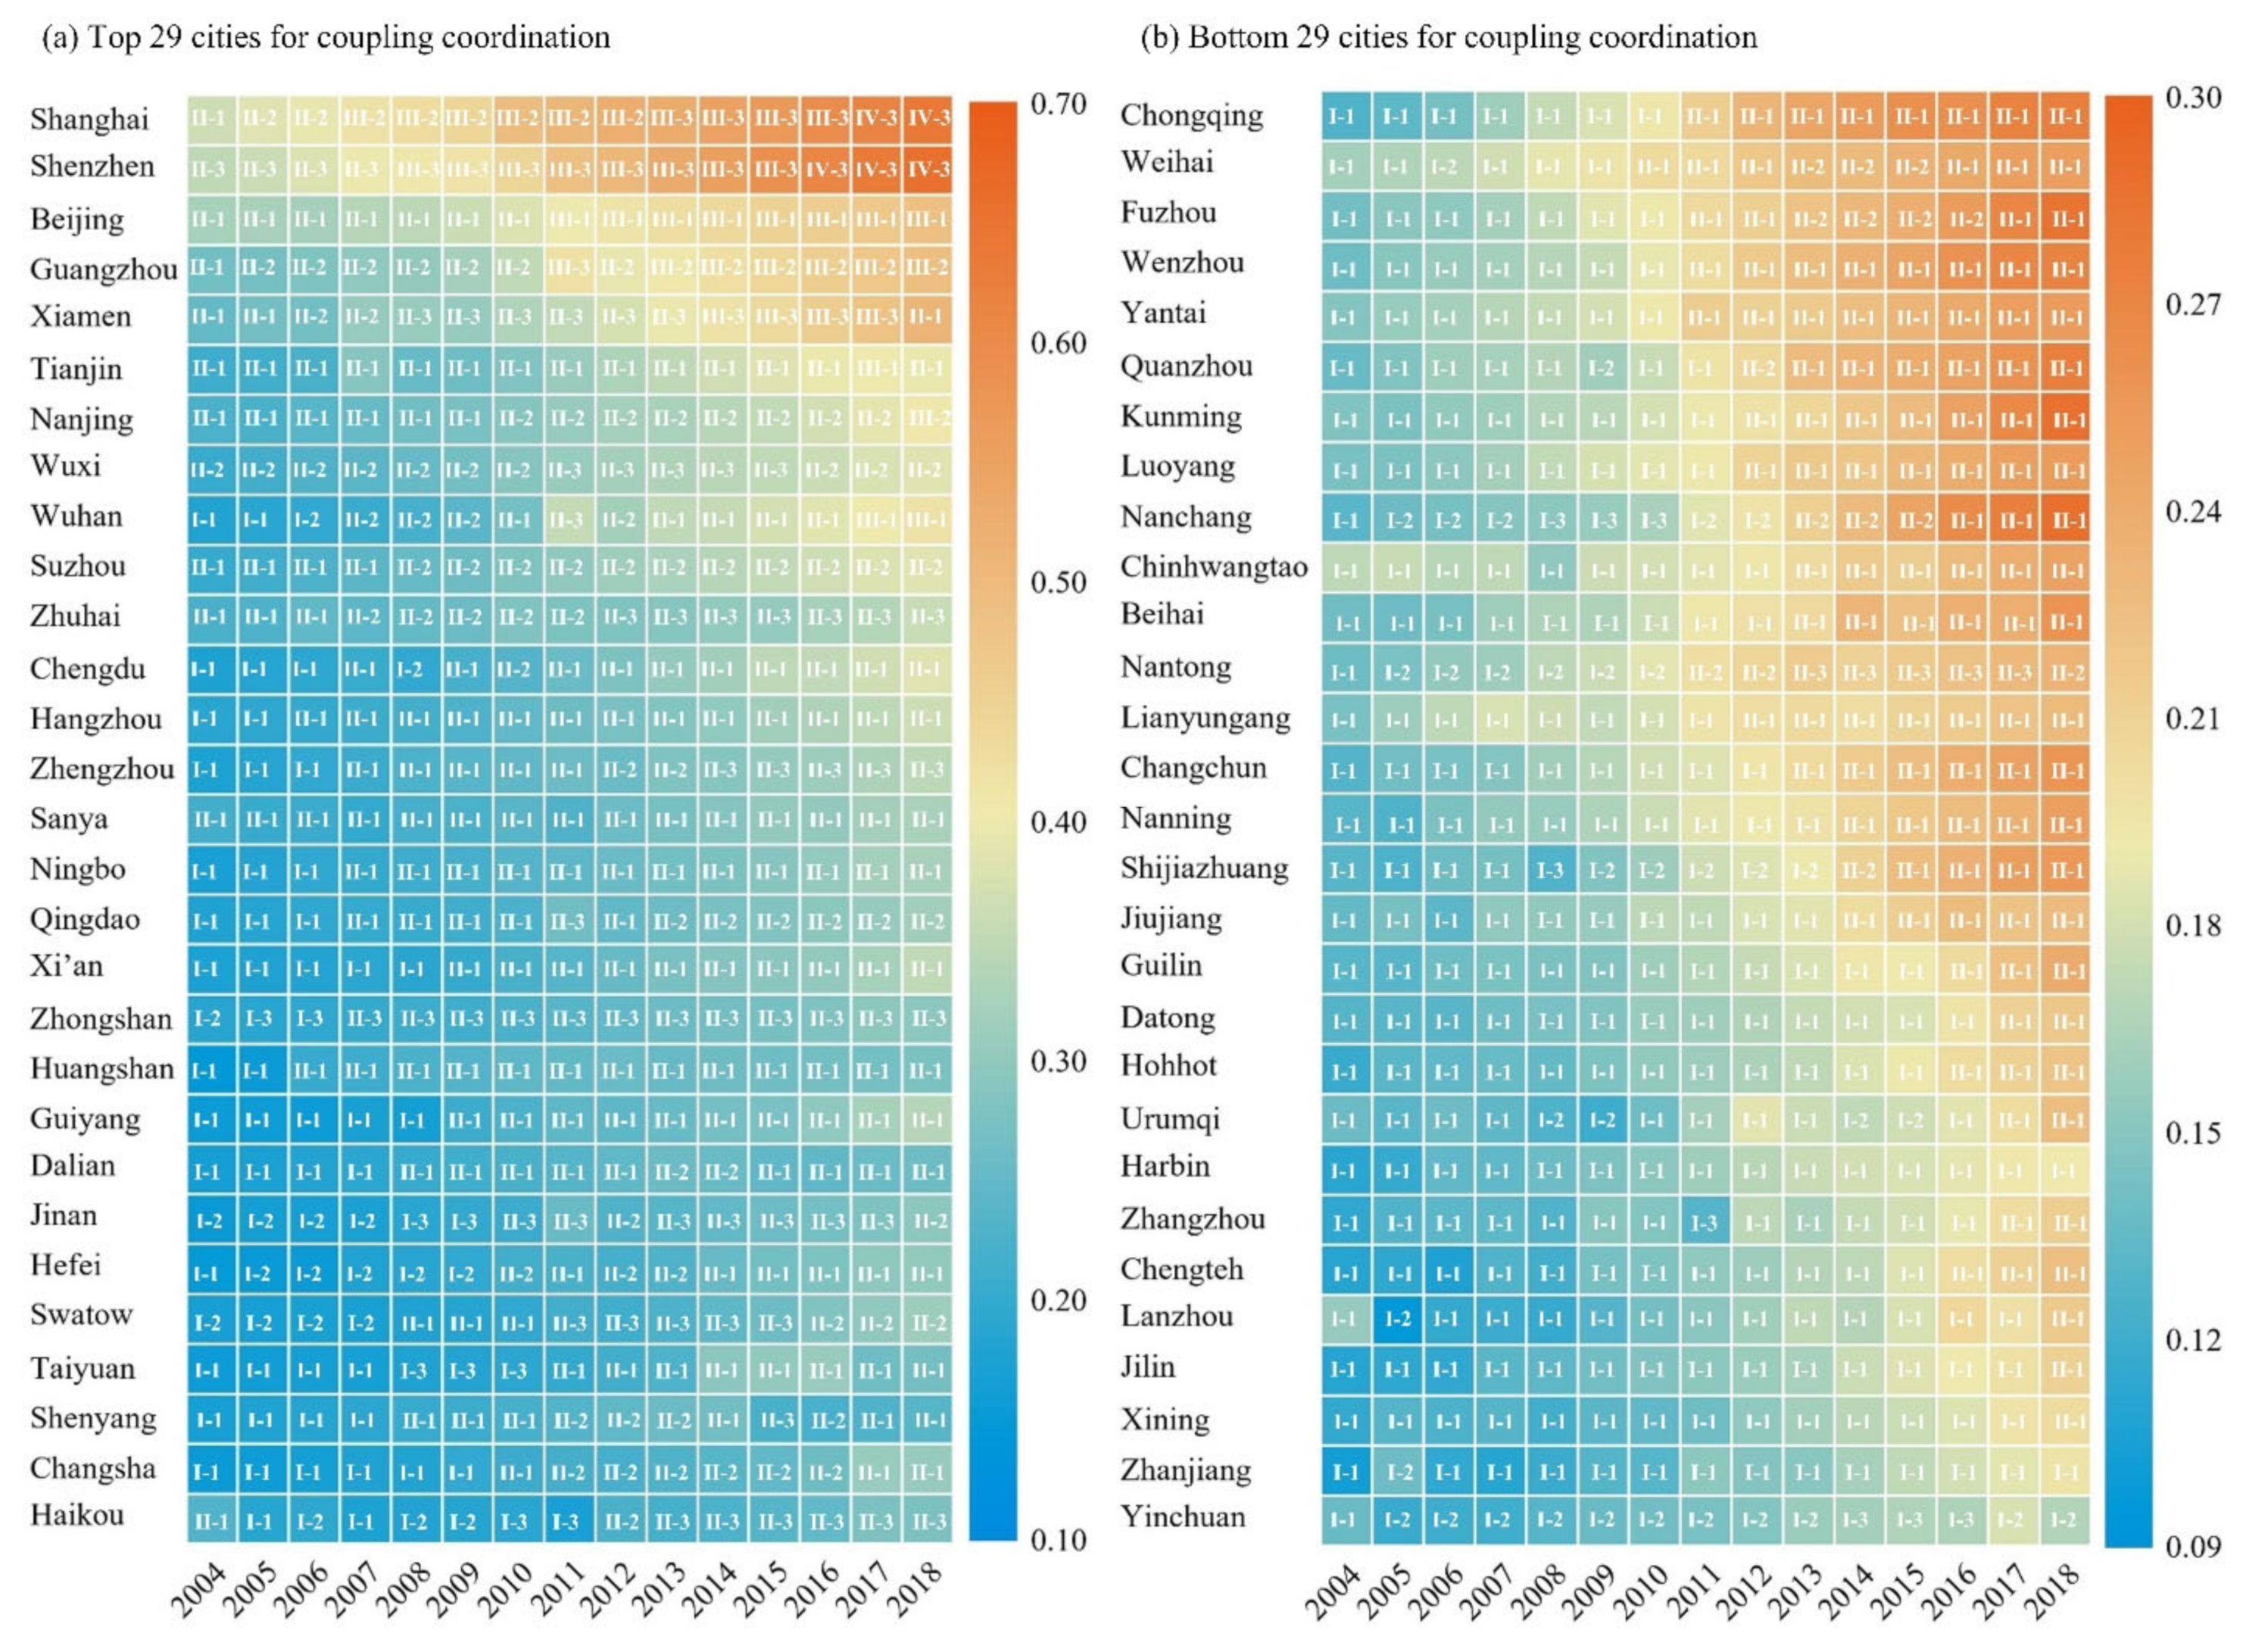
3.2.1. Characteristics of Time-Series Change
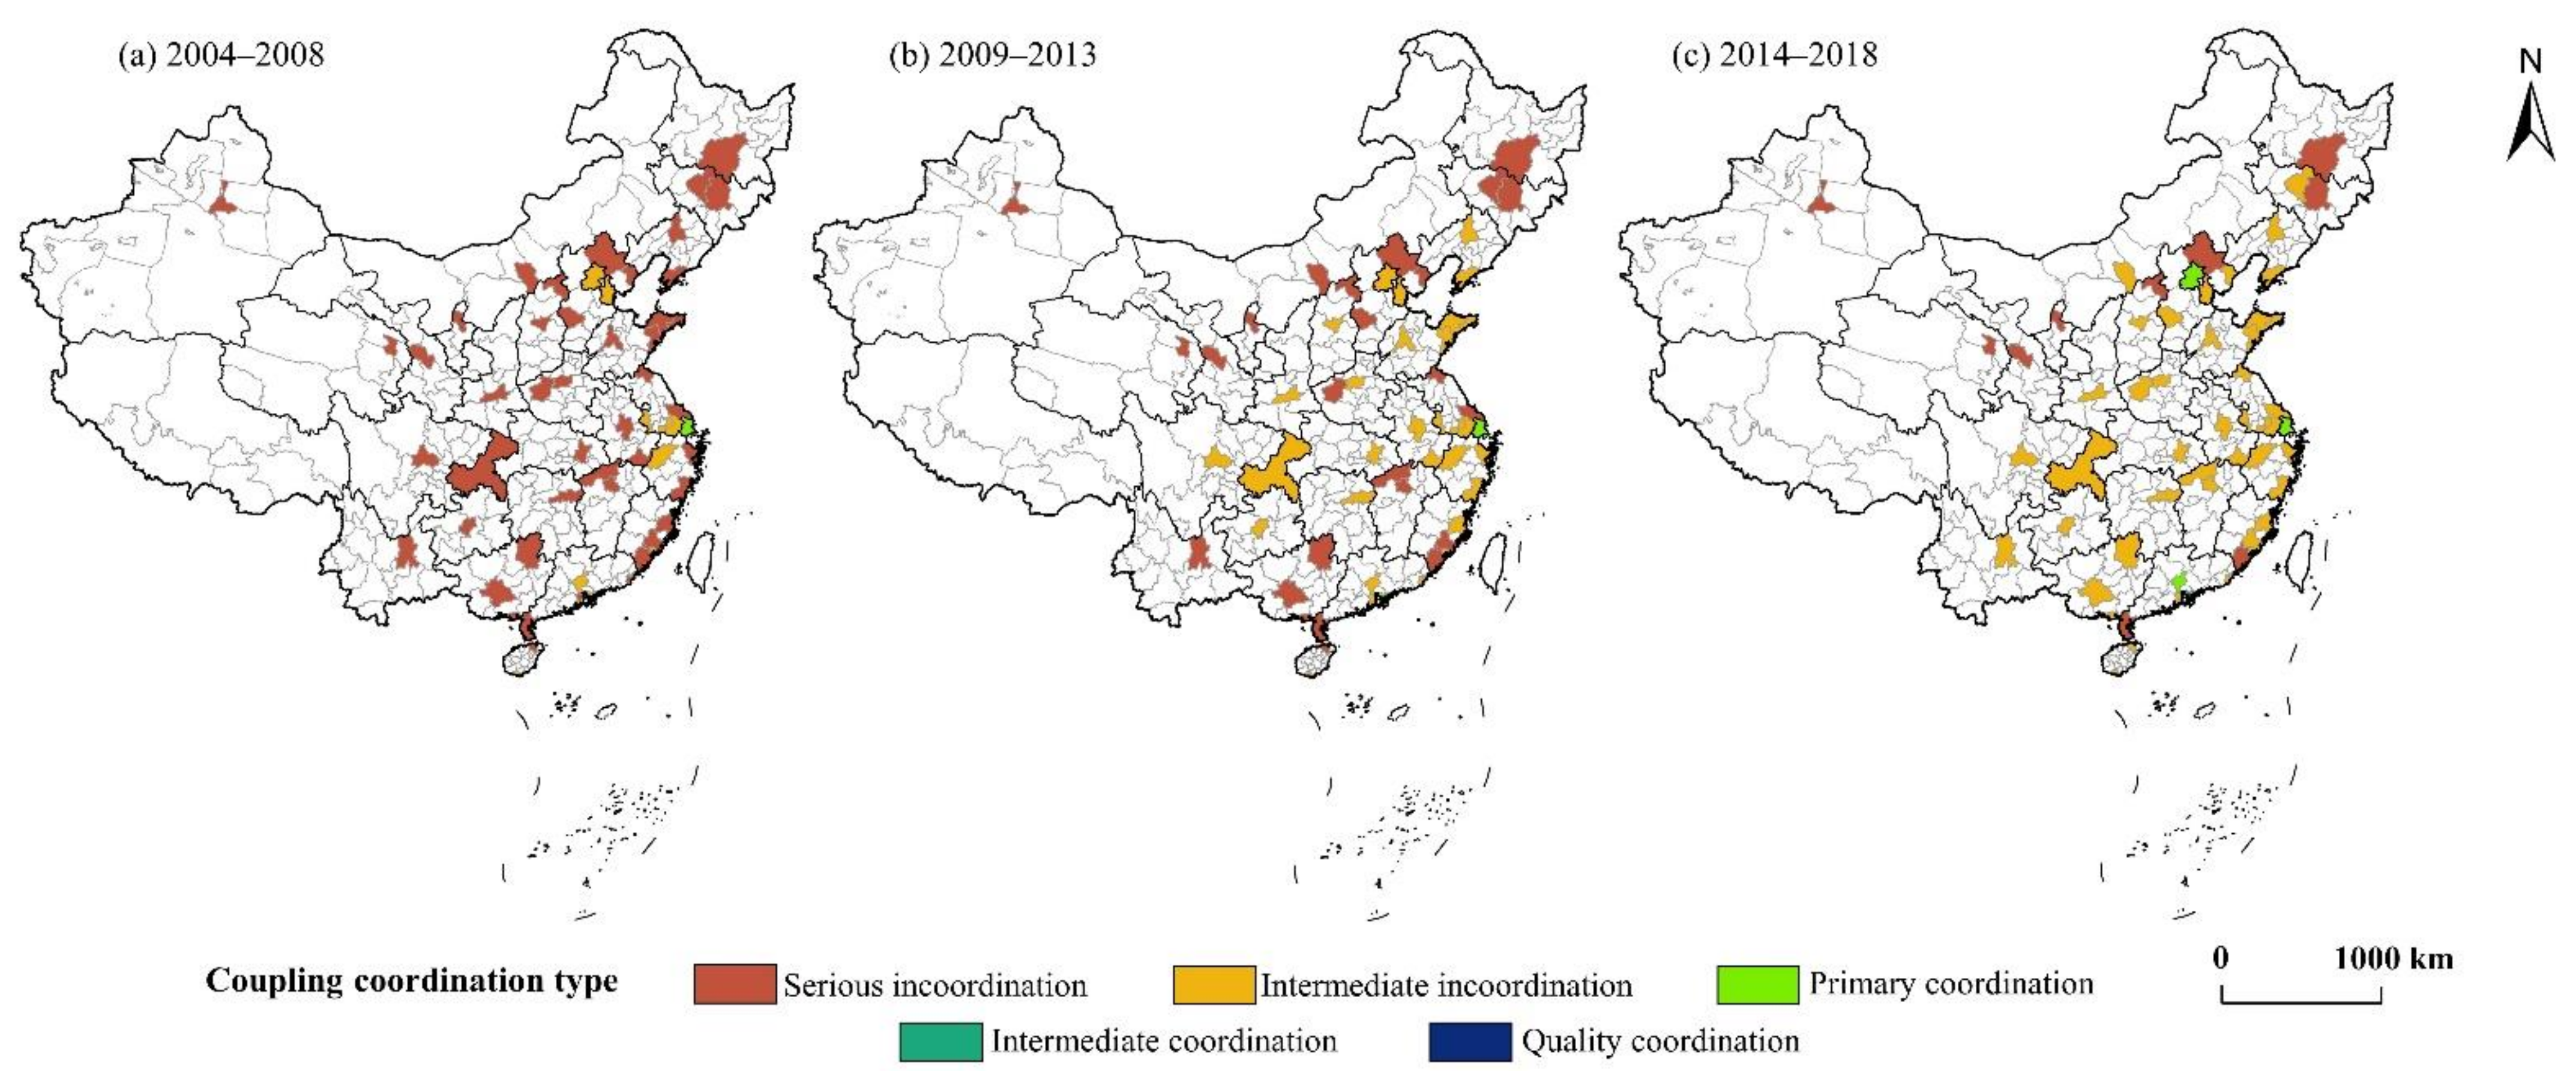
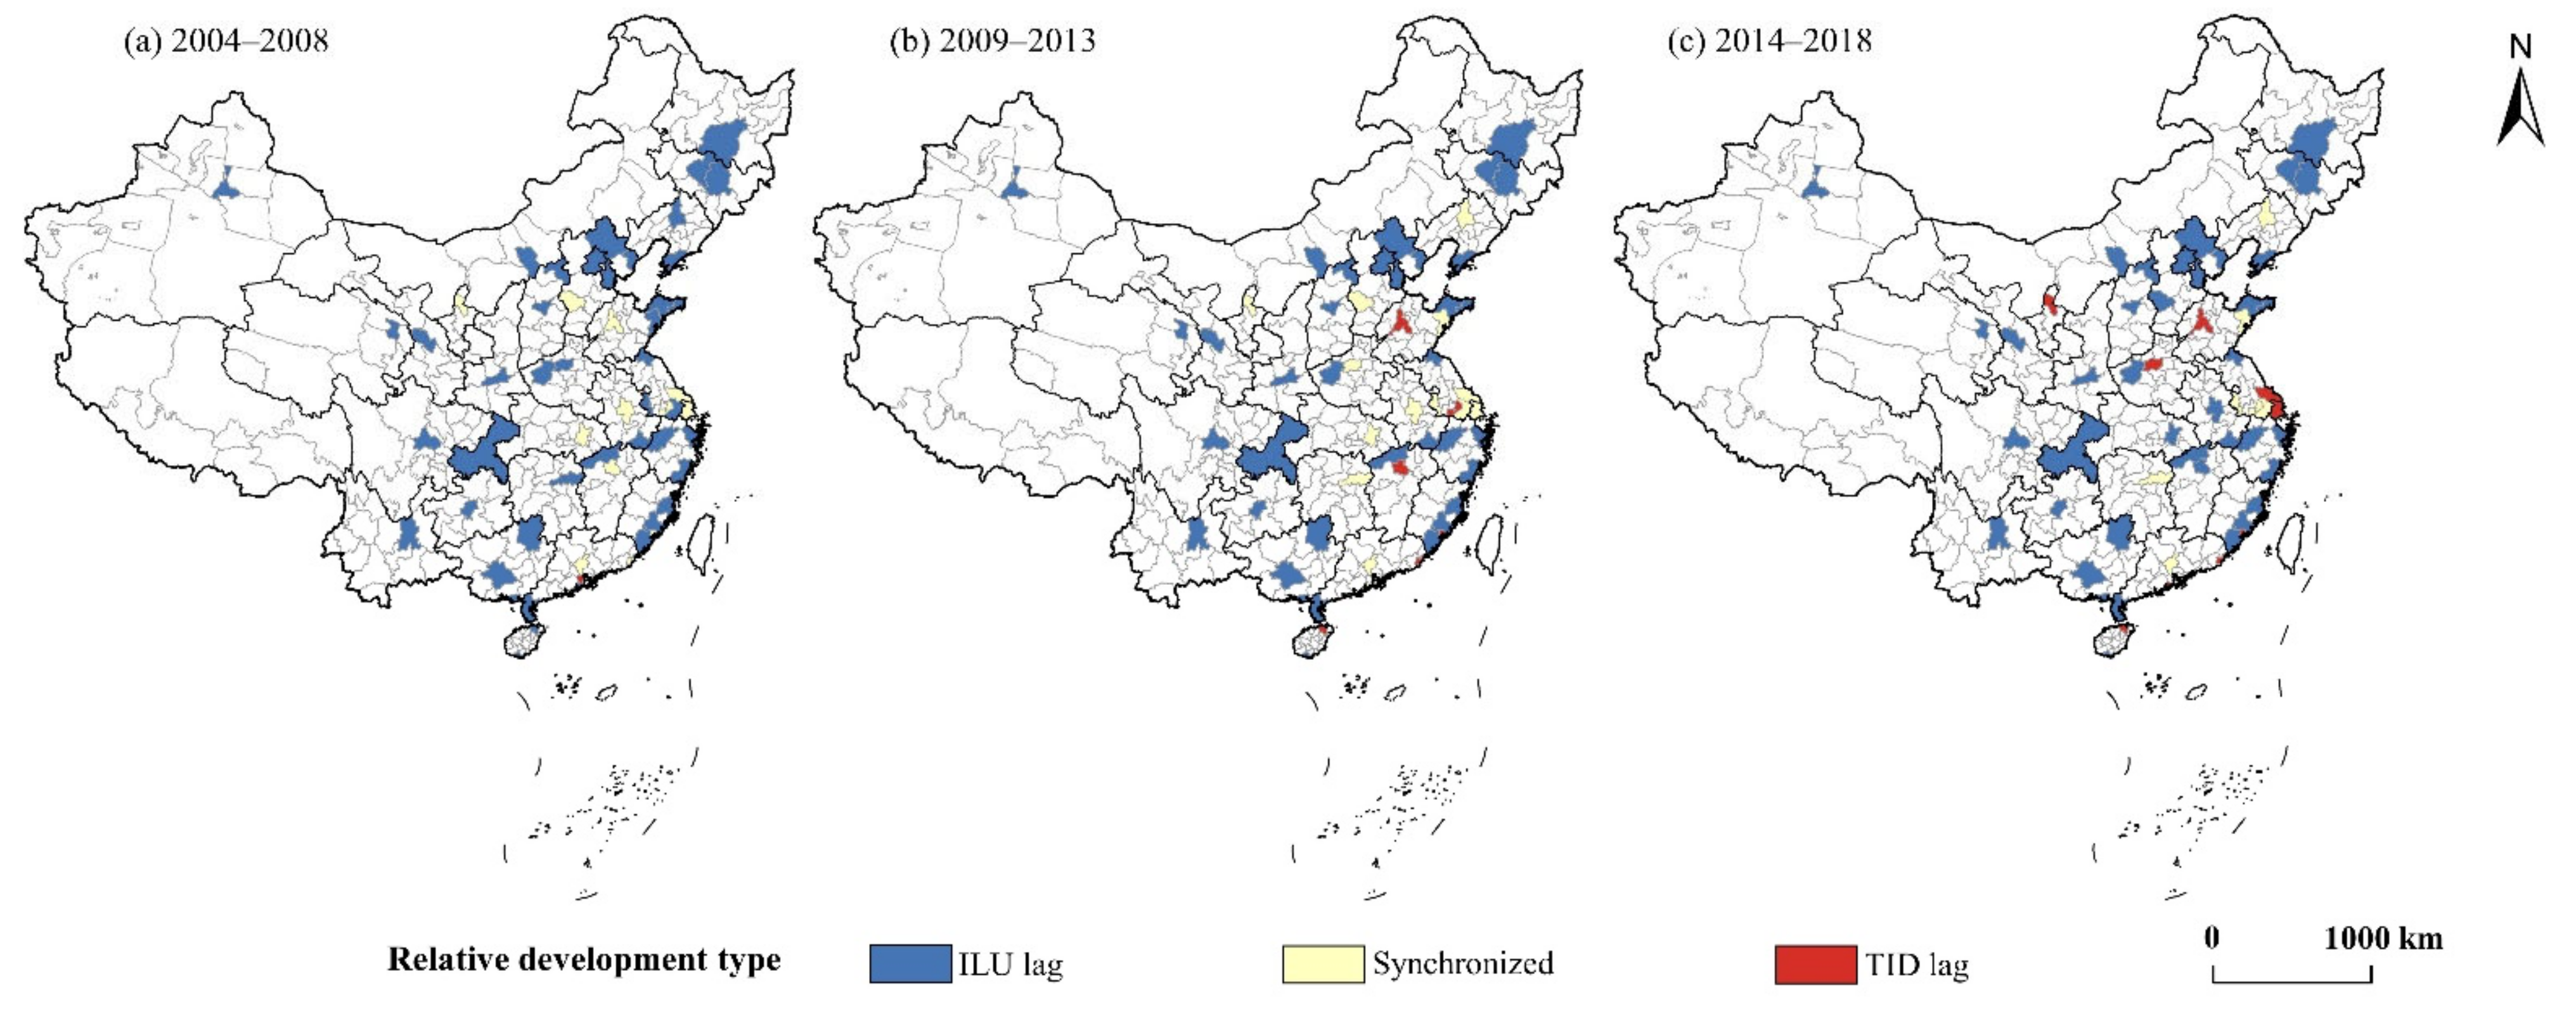
3.2.2. Spatial Characteristics
3.3. Analysis of Interaction Mechanism
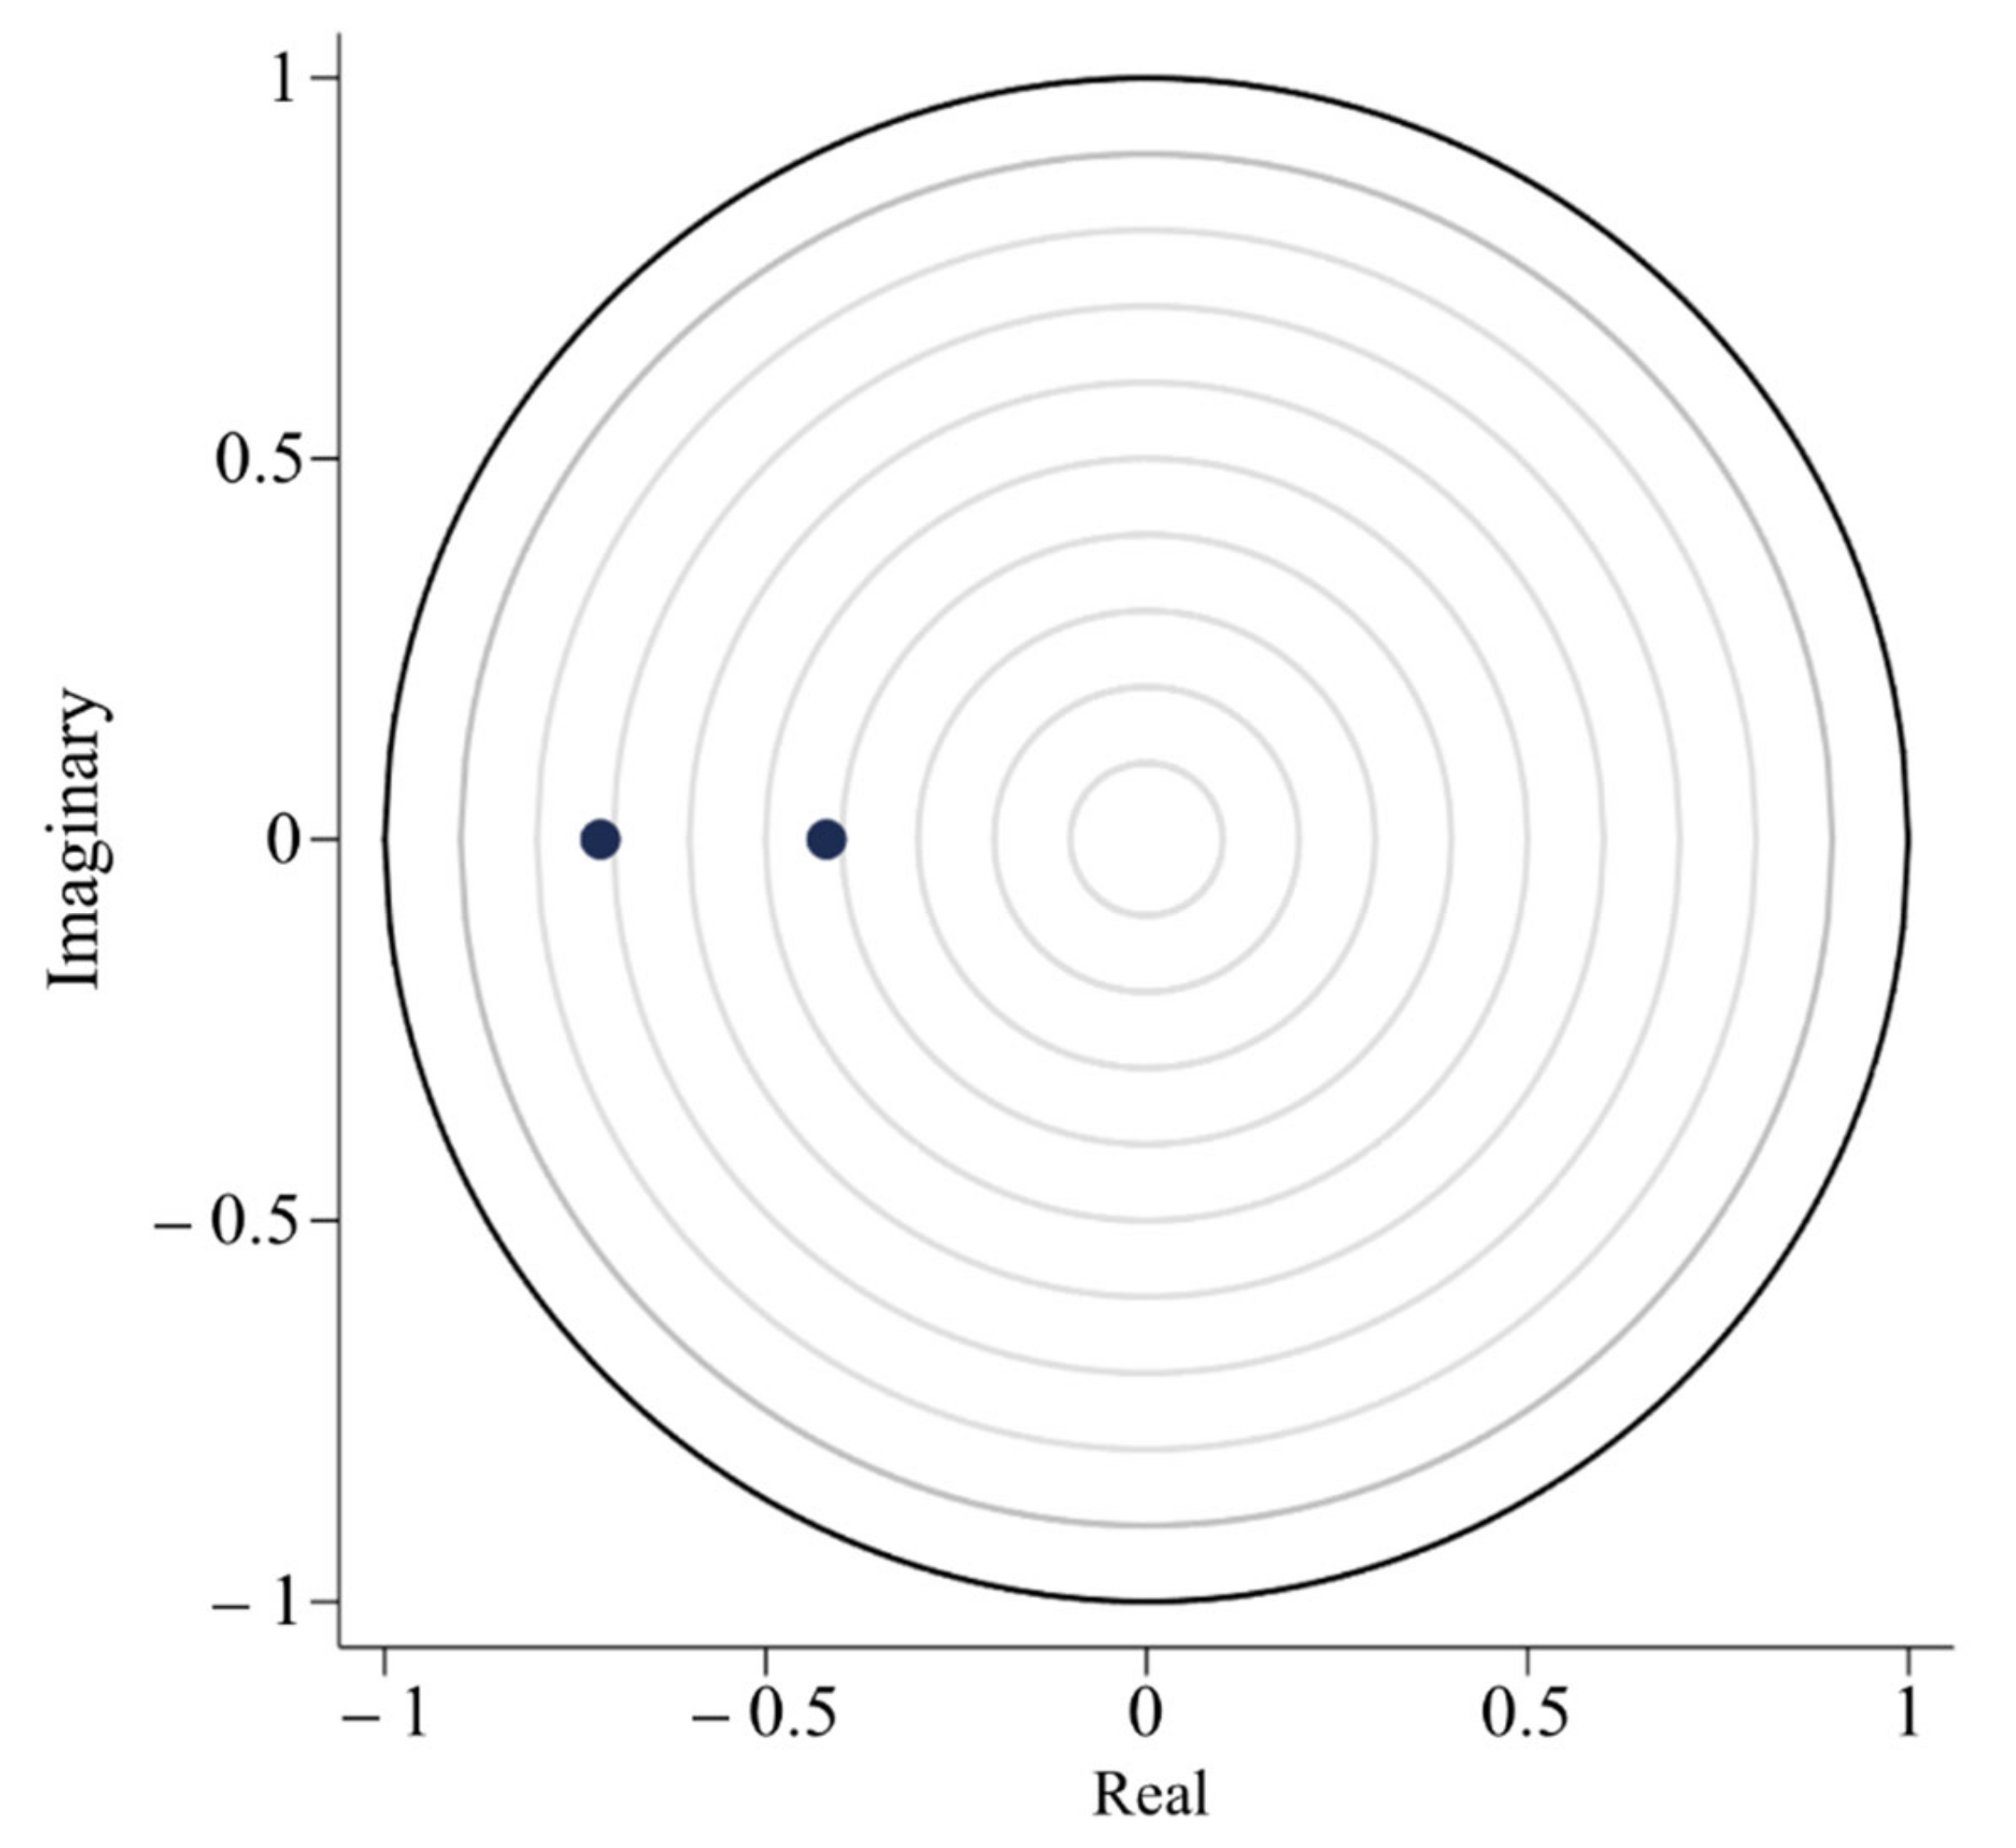
3.3.1. PVAR Model Test
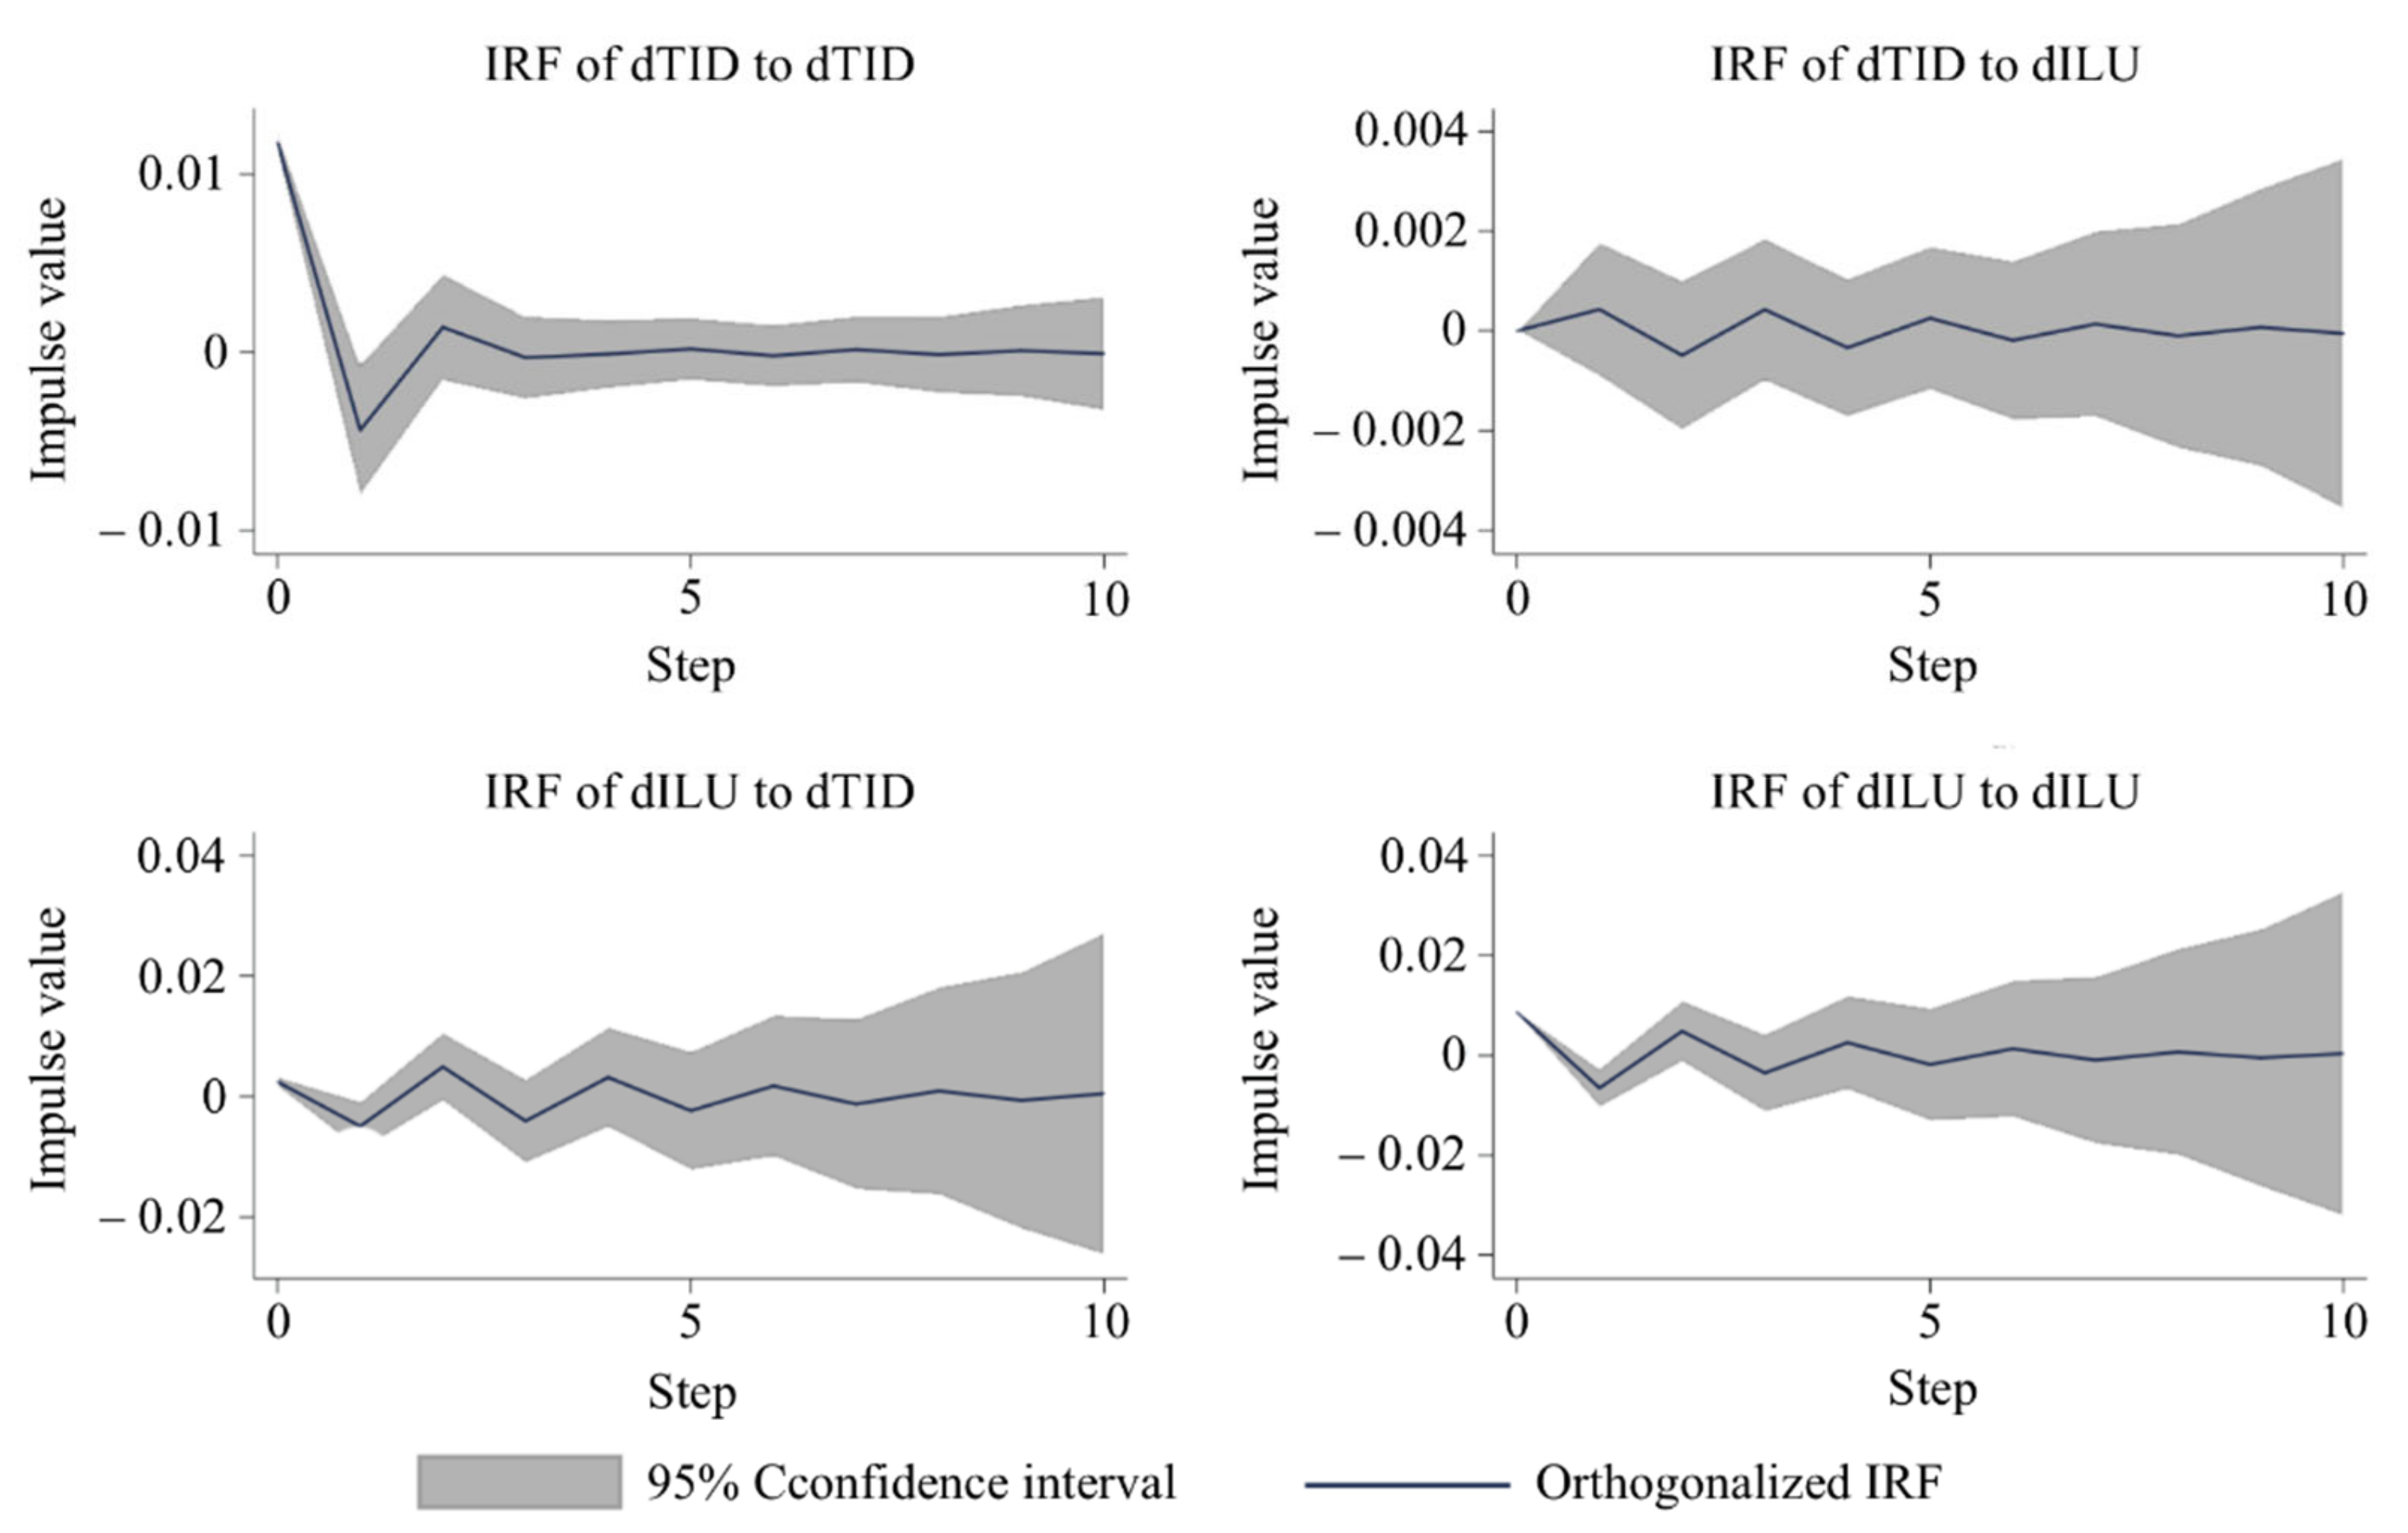
3.3.2. Impulse Response
3.3.3. Variance Decomposition
4. Discussion
4.1. Coupling Relationship between ILU and TID
4.2. Interaction between ILU and TID
4.3. Limitations and Future Research
5. Conclusions
- (1)
- The indices of ILU and TID in China’s major tourist cities show an increasing trend, and the development statuses of both are generally acceptable.
- (2)
- During the study period, the coupling and coordination degree of ILU and TID in major tourist cities in China was optimized year by year. The coupling coordination degree from 2004 to 2008 was less than 0.2, which belonged to the severe disorder recession stage. The coupling coordination degree from 2009 to 2018 was between 0.2 and 0.4, which belonged to the moderate maladjustment recession stage. In terms of spatial distribution, the coupling coordination degree of tourist cities in the Beijing–Tianjin–Hebei region, Yangtze River Delta region, and Pearl River Delta region was at a high level, whereas tourist cities in the western region were always in a serious imbalance state.
- (3)
- The interaction between ILU and TID is not the influence of a single trend but will constantly change with the change in the development level between them. The intensity of ILU on TID is significantly higher than that of TID on ILU.
Author Contributions
Funding
Institutional Review Board Statement
Informed Consent Statement
Data Availability Statement
Conflicts of Interest
References
- Lau, S.S.Y.; Giridharan, R.; Ganesan, S. Multiple and intensive land use: Case studies in Hong Kong. Habitat Int. 2005, 29, 527–546. [Google Scholar] [CrossRef]
- Peng, Q.; Chen, J.F. A comparative study on intensive land use in Shenzhen and Hong Kong. Geogr. Res. 2011, 30, 1129–1136. (In Chinese) [Google Scholar]
- Shen, W.; Zhang, J.; Zhou, X.; Li, S.; Geng, X. How to perceive the trade-off of economic and ecological intensity of land use in a city? A functional zones-based case study of Tangshan, China. Land 2021, 10, 551. [Google Scholar] [CrossRef]
- Yin, G.; Lin, Z.; Jiang, X.; Qiu, M.; Sun, J. How do the industrial land use intensity and dominant industries guide the urban land use? Evidences from 19 industrial land categories in ten cities of China. Sust. Cities Soc. 2020, 53, 101978. [Google Scholar] [CrossRef]
- Zhang, J.; Zhang, Y. Assessing the low-carbon tourism in the tourism-based urban destinations. J. Clean Prod. 2020, 276, 124303. [Google Scholar] [CrossRef]
- Jackson, J.; Murphy, P. Clusters in regional tourism An Australian case. Ann. Touris. Res. 2006, 33, 1018–1035. [Google Scholar] [CrossRef]
- Rashideh, W. Blockchain technology framework: Current and future perspectives for the tourism industry. Tour. Manag. 2020, 80, 104125. [Google Scholar] [CrossRef]
- McMurry, K. The use of land for recreation. Ann. Assoc. Am. Geogr. 1930, 20, 7–20. [Google Scholar] [CrossRef]
- Petrov, L.O.; Lavalle, C.; Kasanko, M. Urban land use scenarios for a tourist region in Europe: Applying the MOLAND model to Algarve, Portugal. Landsc. Urban Plan. 2009, 92, 10–23. [Google Scholar] [CrossRef]
- Ma, X.; Jin, Y. Study on counteractive mechanism between urban land use change and tourism development. Tour. Trib. 2014, 29, 87–96. (In Chinese) [Google Scholar]
- Wang, J.; Liu, Y. Tourism-led land-use changes and their environmental effects in the southern coastal region of Hainan Island, China. Coast. Res. 2013, 29, 1118–1125. [Google Scholar] [CrossRef]
- Petrişor, A.-I.; Hamma, W.; Nguyen, H.D.; Randazzo, G.; Muzirafuti, A.; Stan, M.-I.; Tran, V.T.; Aştefănoaiei, R.; Bui, Q.-T.; Vintilă, D.-F.; et al. Degradation of coastlines under the pressure of urbanization and tourism: Evidence on the change of land systems from Europe, Asia and Africa. Land 2020, 9, 275. [Google Scholar] [CrossRef]
- Chaplin, J.; Brabyn, L. Using remote sensing and GIS to investigate the impacts of tourism on forest cover in the Annapurna Conservation Area, Nepal. Appl. Geogr. 2013, 43, 159–168. [Google Scholar] [CrossRef]
- Žoncová, M.; Hronček, P.; Gregorová, B. Mapping of the land cover changes in high mountains of western carpathians between 1990–2018: Case study of the Low Tatras National Park (Slovakia). Land 2020, 9, 483. [Google Scholar] [CrossRef]
- Boavida-Portugal, I.; Rocha, J.; Ferreira, C.C. Exploring the impacts of future tourism development on land use/cover changes. Appl. Geogr. 2016, 77, 82–91. [Google Scholar] [CrossRef]
- Mihalic, T. Sustainable-responsible tourism discourse—Towards ‘responsustable’ tourism. J. Clean Prod. 2016, 111, 461–470. [Google Scholar] [CrossRef] [Green Version]
- Law, A.; De lacy, T.; Lipman, G.; Jiang, M. Transitioning to a green economy: The case of tourism in Bali, Indonesia. J. Clean Prod. 2016, 111, 295–305. [Google Scholar] [CrossRef]
- Leman, N.; Ramli, M.F.; Khirotdin, R.P.K. GIS-based integrated evaluation of environmentally sensitive areas (ESAs) for land use planning in Langkawi, Malaysia. Ecol. Indic. 2016, 61, 293–308. [Google Scholar] [CrossRef]
- Wolf, I.D.; Croft, D.B. Impacts of tourism hotspots on vegetation communities show a higher potential for self-propagation along roads than hiking trails. J. Environ. Manag. 2014, 143, 173–185. [Google Scholar] [CrossRef]
- Zeng, Y.; Zhong, L. Identifying conflicts tendency between nature-based tourism development and ecological protection in China. Ecol. Indic. 2020, 109, 105791. [Google Scholar] [CrossRef]
- Madan, S.; Rawat, L. The impacts of tourism on the environment of Mussoorie, Garhwal Himalaya, India. Environmentalist 2000, 20, 249–255. [Google Scholar] [CrossRef]
- Rankin, B.L.; Ballantyne, M.; Pickering, C.M. Tourism and recreation listed as a threat for a wide diversity of vascular plants: A continental scale review. J. Environ. Manag. 2015, 154, 293–298. [Google Scholar] [CrossRef] [PubMed]
- Pearce, D. Tourism and urban land use change: Assessing the impact of Christchurch’s tourist tramway. Tourism. Hospit. Res. 2001, 3, 132–148. [Google Scholar] [CrossRef]
- Smith, R.A. Beach resort evolution: Implications for planning. Ann. Touris. Res. 1992, 19, 304–322. [Google Scholar] [CrossRef]
- Hammes, D.L. Resort development impact on labor and land markets. Ann. Touris. Res. 1994, 21, 729–744. [Google Scholar] [CrossRef]
- Marks, R. Conservation and community: The contradictions and ambiguities of tourism in the Stone Town of Zanzibar. Habitat Int. 1996, 20, 265–278. [Google Scholar] [CrossRef]
- Hui, E.C.M.; Wu, Y.; Deng, L.; Zheng, B. Analysis on coupling relationship of urban scale and intensive use of land in China. Cities 2015, 42, 63–69. [Google Scholar] [CrossRef]
- Xie, X.; Sun, H.; Gao, J.; Chen, F.; Zhou, C. Spatiotemporal differentiation of coupling and coordination relationship of tourism–urbanization–ecological environment system in China’s major tourist cities. Sustainability 2021, 13, 5867. [Google Scholar] [CrossRef]
- Haken, H. Synergetics: The Mystery of Nature; Shanghai Translation Publishing House: Shanghai, China, 2005. [Google Scholar]
- Jiang, Z.Y.; Yan, H.U. Coupling and coordination between new urbanization and agricultural modernization in Central China. Nat. Resour. 2021, 36, 702–721. (In Chinese) [Google Scholar]
- Gong, Q.; Guo, G.; Li, S.; Liang, X. Examining the coupling coordinated relationship between urban industrial co-agglomeration and intensive land use. Land 2021, 10, 499. [Google Scholar] [CrossRef]
- Ji, X.; Wang, K.; Ji, T.; Zhang, Y. Coupling analysis of urban land use benefits: A case study of Xiamen City. Land 2020, 9, 155. [Google Scholar] [CrossRef]
- Lu, X.; Kuang, B.; Li, J. Regional difference decomposition and policy implications of China’s urban land use efficiency under the environmental restriction. Habitat Int. 2018, 77, 32–39. [Google Scholar] [CrossRef]
- Tang, Z. An integrated approach to evaluating the coupling coordination between tourism and the environment. Tour. Manag. 2015, 46, 11–19. [Google Scholar] [CrossRef]
- Sun, C.; Zhang, S.; Song, C.; Xu, J.; Fan, F. Investigation of dynamic coupling coordination between urbanization and the eco-environment—A case study in the Pearl River Delta Area. Land 2021, 10, 190. [Google Scholar] [CrossRef]
- Qiu, J.D. Environment. Measurement on the benefits of regional land use in china based on coupling relationship. Chin. J. Popul. Res. Environ. 2012, 22, 103–110. (In Chinese) [Google Scholar]
- Charfeddine, L.; Kahia, M. Impact of renewable energy consumption and financial development on CO2 emissions and economic growth in the MENA region: A panel vector autoregressive (PVAR) analysis. Renew. Energy 2019, 139, 198–213. [Google Scholar] [CrossRef]
- Li, W.; Chen, T.; Ma, X. Mechanisms and spatial pattern of land use changes of the urban tourism complex: A case study of Qujiang, Xi’an. Geogr. Res. 2019, 38, 1103–1118. (In Chinese) [Google Scholar]
- Gan, L.; Shi, H.; Hu, Y.; Benjamin, L.; Lan, H. Coupling coordination degree for urbanization city-industry integration level: Sichuan case. Sust. Cities Soc. 2020, 58, 102136. [Google Scholar] [CrossRef]
- Cui, F.; Ou, M. A study on land use change and tourism driving force in Jiangsu Province. Res. Sci. 2010, 32, 1971–1979. (In Chinese) [Google Scholar]
- Chan, V.K.Y. The impact of the global financial crisis on the entertainment tourism industry: A financial engineering case study of Macao from 2007 to 2010. Syst. Eng. Procedia 2011, 1, 323–329. [Google Scholar] [CrossRef] [Green Version]
- Airey, D.; Chong, K. National policy-makers for tourism in China. Ann. Touris. Res. 2010, 37, 295–314. [Google Scholar] [CrossRef] [Green Version]
- Kim, Y.R.; Williams, A.M.; Park, S.; Chen, J.L. Spatial spillovers of agglomeration economies and productivity in the tourism industry: The case of the UK. Tour. Manag. 2021, 82, 104201. [Google Scholar] [CrossRef]
- Liu, J.; Hou, X.; Wang, Z.; Shen, Y. Study the effect of industrial structure optimization on urban land-use efficiency in China. Land Use Pol. 2021, 105, 105390. [Google Scholar] [CrossRef]
- He, W.; Yang, J.; Li, X.; Sang, X.; Xie, X. Research on the interactive relationship and the optimal adaptation degree between land use benefit and industrial structure evolution: A practical analysis of Jiangsu province. J. Clean Prod. 2021, 303, 127016. [Google Scholar] [CrossRef]
- Mao, X.; Meng, J.; Wang, Q. Modeling the effects of tourism and land regulation on land-use change in tourist regions: A case study of the Lijiang River Basin in Guilin, China. Land Use Pol. 2014, 41, 368–377. [Google Scholar] [CrossRef]
- Li, J.; Bai, Y.; Alatalo, J.M. Impacts of rural tourism-driven land use change on ecosystems services provision in Erhai Lake Basin, China. Ecosyst. Serv. 2020, 42, 101081. [Google Scholar] [CrossRef]
- Williams, A.M.; Shaw, G. Future play: Tourism, recreation and land use. Land Use Pol. 2009, 26, S326–S335. [Google Scholar] [CrossRef] [Green Version]
- Zhu, D.; Xie, B.; Deng, C.; Xiong, P. Investigation on the interaction between land use change and leisure tourism in typical tourism cities: A case study of Zhangjiajie. J. Agric. Modern. 2017, 38, 527–535. (In Chinese) [Google Scholar]
- Sheng, L.; Li, T.; Wang, J. Tourism and externalities in an urban context: Theoretical model and empirical evidence. Cities 2017, 70, 40–45. [Google Scholar] [CrossRef]


| System | Primary Indicator | Secondary Indicator | Unit | Weight |
|---|---|---|---|---|
| ILU system | Input intensity | Fixed asset investment per unit area | RMB10,000/km2 | 0.0573 |
| Number of tertiary industry employees per unit area | Person/km2 | 0.0863 | ||
| Real estate development investment per unit area | RMB10,000/km2 | 0.0817 | ||
| Utilization degree | Urban development land per capita | km2/person | 0.0269 | |
| Employment density | Person/km2 | 0.0889 | ||
| Urban road area per capita | km2/person | 0.0361 | ||
| Economic benefit | GDP per unit area | RMB10,000/km2 | 0.0946 | |
| Financial revenue per unit area | RMB10,000/km2 | 0.1334 | ||
| Retail sales of consumer goods per unit area | RMB10,000/km2 | 0.0821 | ||
| Output value of the tertiary industry per unit area | RMB10,000/km2 | 0.1095 | ||
| Total postal and telecommunications services per unit area | RMB10,000/km2 | 0.1356 | ||
| Ecological benefit | Green coverage rate in built-up areas | % | 0.0024 | |
| Urban green space per capita | km2/person | 0.0564 | ||
| Centralized treatment rate of urban domestic sewage | % | 0.0052 | ||
| Safe household garbage disposal rate | % | 0.0036 | ||
| TID system | Industry benefit | Earning from domestic tourism | RMB100,000,000 | 0.1049 |
| Foreign exchange earnings from international tourism | USD 10,000 | 0.1657 | ||
| Annual growth rate of total tourism income | % | 0.0070 | ||
| Industry scale | Number of domestic tourists | 10,000 person | 0.0963 | |
| Number of international tourists | Person | 0.3633 | ||
| Annual growth rate of total tourist arrivals | % | 0.0388 | ||
| Industry status | Proportion of total earning from tourism in GDP | % | 0.0528 | |
| Percent of total earnings from tourism in tertiary industry | % | 0.0456 | ||
| Tourism output density | RMB10,000/km2 | 0.1256 |
| Coupling Coordination | Degree | Relative Development | Meaning and Feature |
|---|---|---|---|
| 0 < D ≤ 0.2 | Serious incoordination | R < 0.8 | I-1 ILU lag |
| 0.8 ≤ R < 2 | I-2 Synchronized | ||
| R ≥ 1.2 | I-3 TID lag | ||
| 0.2 < D ≤ 0.4 | Intermediate incoordination | R < 0.8 | II-1 ILU lag |
| 0.8 ≤ R < 2 | II-2 Synchronized | ||
| R ≥ 1.2 | II-3 TID lag | ||
| 0.4 < D ≤ 0.6 | Primary coordination | R < 0.8 | III-1 ILU lag |
| 0.8 ≤ R < 2 | III-2 Synchronized | ||
| R ≥ 1.2 | III-3 TID lag | ||
| 0.6< D ≤ 0.8 | Intermediate coordination | R < 0.8 | IV-1 ILU lag |
| 0.8 ≤ R < 2 | IV-2 Synchronized | ||
| R ≥ 1.2 | IV-3 TID lag | ||
| 0.8 < D ≤ 1 | Quality coordination | R < 0.8 | V-1 ILU lag |
| 0.8 ≤ R < 2 | V-2 Synchronized | ||
| R ≥ 1.2 | V-3 TID lag |
| Year | Coupling Coordination | Relative Development | Type | Year | Coupling Coordination | Relative Development | Type |
|---|---|---|---|---|---|---|---|
| 2004 | 0.1702 | 0.4764 | I-1 | 2012 | 0.2414 | 0.7595 | II-1 |
| 2005 | 0.1740 | 0.5959 | I-1 | 2013 | 0.2514 | 0.8090 | II-2 |
| 2006 | 0.1811 | 0.6110 | I-1 | 2014 | 0.2629 | 0.8099 | II-2 |
| 2007 | 0.1902 | 0.6192 | I-1 | 2015 | 0.2718 | 0.8031 | II-2 |
| 2008 | 0.1948 | 0.7307 | I-1 | 2016 | 0.2834 | 0.7676 | II-1 |
| 2009 | 0.2044 | 0.7254 | II-1 | 2017 | 0.2954 | 0.7344 | II-1 |
| 2010 | 0.2176 | 0.7455 | II-1 | 2018 | 0.3057 | 0.6968 | II-1 |
| 2011 | 0.2325 | 0.8487 | II-2 |
Publisher’s Note: MDPI stays neutral with regard to jurisdictional claims in published maps and institutional affiliations. |
© 2021 by the authors. Licensee MDPI, Basel, Switzerland. This article is an open access article distributed under the terms and conditions of the Creative Commons Attribution (CC BY) license (https://creativecommons.org/licenses/by/4.0/).
Share and Cite
Huang, C.; Lin, F.; Chu, D.; Wang, L.; Liao, J.; Wu, J. Coupling Relationship and Interactive Response between Intensive Land Use and Tourism Industry Development in China’s Major Tourist Cities. Land 2021, 10, 697. https://doi.org/10.3390/land10070697
Huang C, Lin F, Chu D, Wang L, Liao J, Wu J. Coupling Relationship and Interactive Response between Intensive Land Use and Tourism Industry Development in China’s Major Tourist Cities. Land. 2021; 10(7):697. https://doi.org/10.3390/land10070697
Chicago/Turabian StyleHuang, Chengkun, Feiyang Lin, Deping Chu, Lanlan Wang, Jiawei Liao, and Junqian Wu. 2021. "Coupling Relationship and Interactive Response between Intensive Land Use and Tourism Industry Development in China’s Major Tourist Cities" Land 10, no. 7: 697. https://doi.org/10.3390/land10070697