Article

Net Carbon Sequestration Performance of Cropland Use in China’s Principal Grain-Producing Area: An Evaluation and Spatiotemporal Divergence

1
College of Management, Sichuan Agricultural University, Chengdu 611130, China
2
Faculty of Agriculture and Forestry, University of Helsinki, 00014 Helsinki, Finland
3
College of Forestry, Northwest A&F University, Xianyang 712100, China
4
College of Business and Tourism, Sichuan Agricultural University, Dujiangyan 611830, China
*
Author to whom correspondence should be addressed.
Land 2021, 10(7), 714; https://doi.org/10.3390/land10070714
Submission received: 9 June 2021 / Revised: 1 July 2021 / Accepted: 3 July 2021 / Published: 6 July 2021
(This article belongs to the Special Issue Land Use and Climate Change)

Abstract

:
As cropland possess dual carbon effects of emitting and sequestering, giving full attention to its net carbon sequestration is an effective option for mitigating global warming. By analyzing the carbon cycle of a cropland use system, we develop an inventory for measuring the net carbon sequestration, covering four carbon sources, i.e., agricultural materials, rice fields, soils, straw burning, with the crop carbon sequestration considered. Different from conventional studies that have focused on quantity, in this study, we define net carbon sequestration performance of cropland use (NCSPC) as the ratio of actual net carbon sequestration to an optimal value per unit of cropland. We estimate the net carbon sequestration of cropland use, from 2000 to 2019, for the study area consisting of the 13 principal grain-producing provinces in China. Then, global-SBM is applied to measure the provincial NCSPC; furthermore, the Theil index and convergence test are employed to portray the spatiotemporal characteristics and regional divergence. The results show the following: (1) The net carbon sequestration was 3.837 t per hectare of cropland in the principal grain-producing area, of which the sequestration and the emission were 6.343 t and 2.506 t, respectively. The share of emissions, from largest to smallest, was methane from rice paddies, agricultural materials, straw burning, and soil nitrous oxide. Specifically, cropland use in Henan exhibited the strongest net carbon sequestration, whereas in Hunan it was the lowest. (2) The average NCSPC was 0.774 in the principal grain-producing area, indicating that 22.6% of the net carbon sequestration per unit of cropland remained to be explored under the corresponding production technology and input combinations. Temporally, the NCSPC had an annual change rate of −0.30%, displaying a slowly declining trend. Spatially, the NCSPC evolved from a scattered distribution to blocky agglomeration, eventually presenting a decreasing pattern from north to south. (3) First, the total Theil index increased, and then decreased, indicating that the regional disparity of the NCSPC expanded early but shrank later. From 2011 to 2019, inter-regional disparity took up more in the total. Over time, both the whole region and the subregions obeyed the σ convergence. Unlike the benign trends observed in Zones I and II, the NCSPC values of Zone III converged to a low level. This study aims to provide a theoretical base for emission mitigation and sequestration promotion for cropland use.

1. Introduction

With global warming becoming a critical environmental issue, countries around the world have reached a consensus on mitigating the carbon emissions from industry. Meanwhile, the recognition of agricultural carbon emissions has also gradually deepened. The development in China is characterized by high CO2 emissions, which totaled 3.073 billion t in 1994, in which carbon emissions from cropland use, including tillage, irrigation, fertilizer application, etc., accounted for about 17% [1]. In recent years, the total CO2 emissions of China have risen to 10 billion t [2]. Cropland-use emissions account for less than before, making it less significant by merely studying its emission mitigation. Nevertheless, cropland use has the dual attributes of emission and sequestration [3,4], where, in China, the standard carbon sequestered in crops’ life cycles is as high as 0.6~0.7 billion t (equivalent to 2.2~2.6 billion t CO2) per year [5]. Therefore, rational utilization of cropland could be a powerful weapon to combat climate change [6].
China’s principal grain-producing area contributes 75% of total crop outputs [7] and should play a significant role in carbon sequestration. However, due to deepening mechanization and chemicalization, including excessive application of high-carbon materials on cropland, such as fertilizers and pesticides, large quantities of carbon emissions resulted, which have offset crop carbon sequestration to some extent. Because of the above, the principal grain-producing area in China is a typical case for exhibiting both high emissions and sequestration in cropland use [8]. It could be beneficial to study the performance of net carbon sequestration in cropland use, which provides a theoretical reference for balancing low-carbon transition and food guarantee [9].
Studies have explored much about the carbon effect of cropland use in source and quantity. West et al. [10] concluded that emissions were mainly from agricultural inputs, including fertilizers, agricultural lime, pesticides, irrigation, and seed breeding. Li et al. [11] employed a geochemical bioprocess model to measure the carbon emissions from cropland and analyzed the effects of various factors, such as soil and crop varieties, on the carbon emissions. Paying attention to different farm operations, Lal [12] divided the emission into primary, secondary, and tertiary sources, and then analyzed the emissions of tillage and irrigation. Aiming to assess the carbon sequestration potential, Belay et al. [13] applied biogeochemical mechanistic ecosystem modeling to predict the amount of carbon that could be potentially sequestered in the highly deforested and degraded Amhara region of Ethiopia. Cheng et al. [14] constructed an inventory of six carbon factors, including fertilizer, pesticide, mulch, tillage, irrigation, and diesel fuel, which formed a basic system for calculating cropland-use carbon emissions. In addition, considering the above carbon factors, Li et al. [15], Ding et al. [16], and Li et al. [17] all accounted for the cropland-use carbon emissions of certain areas in China, and further described the influencing factors. Cheng et al. [18] assessed the topsoil carbon sequestration potential of cropland in China, where they found the soil organic carbon density was 36.44 t/ha on average. Proposing a silica-phytolith content transfer function, Song et al. [19] explored the phytolith carbon sink within Chinese croplands and discovered that the cropland phytolith sink represented approximately 18% of the world’s croplands. Cheng et al. [20] applied an ecosystem model, DAYCENT, and predicted the carbon mitigation potentials associated with soil management in Chinese cropland systems, with data from 350 cropland experiments, covering nitrous oxide emissions, methane emissions, and soil organic carbon stock changes. In addition, using the DAYCENT model, an analysis of the soil organic carbon sequestration and GHG emissions was carried out in a study by Begum et al. [21], involving a rice harvested area in Bangladesh for the period from 1996 to 2015. According to laboratory measurements, Sun et al. [22] estimated the carbon emissions from straw open burning, including rice, wheat, and corn. Some et al. [23] analyzed the non-carbon dioxide greenhouse gas emissions over time from India’s cropland-based agricultural activities, covering the methane from paddy cultivation and nitrogen dioxide from N-fertilizer consumption.
According to the study of source and quantity, some studies, furthermore, focused on the natural efficiency of carbon emissions or sequestration. Taking into consideration three indicators, i.e., afforestation and reforestation area, forest management area, and timber volume of forest harvesting as input, and forest carbon sequestration as output, for a data envelopment analysis (DEA), Long et al. [24] measured the carbon sequestration efficiency of forest land use in Hangzhou. Valade et al. [25] proposed an empirical model of sequestration efficiency, i.e., the fraction of net primary production stored in the biosphere and anthroposphere simulates European forest carbon pools and fluxes. Mizuta et al. [26] took soil carbon sequestration as output, with pedogenic, hydrologic, and environmental variables as inputs, to examine the soil carbon sequestration efficiency, which enabled land resource managers to refine approaches for optimizing soil carbon.
Carbon efficiency merely reflects the natural efficiency of carbon sequestering or emitting in production, ignoring the economic output. With the proposal of balancing economy and environment, studies have considered how to minimize carbon emissions or increase carbon sequestration without reducing economic output. Correspondingly, the conception of carbon performance has been proposed, which is an indicator linking inputs, economic outputs, and carbon outputs in production. The common approaches for evaluating carbon performance are DEA and stochastic frontier analysis (SFA). Existing studies have estimated the performance of carbon emissions extensively, including industry wide [27,28] and many subsectors, such as the metallurgical industry [29], electricity generation [30], thermal power industry [31], and transportation industry [32]. However, in terms of carbon sequestration performance, there are only a few studies available. On the basis of DEA-Malmquist, Xue et al. [33] selected three indicators, i.e., forestry fixed asset, forestry employees, and forest area as inputs, with forestry output value and carbon sequestration as outputs, and then analyzed the forestry carbon sequestration performance of four major forest regions in China from 1988 to 2013. In a study of Rao et al. [34], based on the SFA with Translog production function, carbon sequestration was incorporated as an endogenous variable to estimate the carbon sequestration total factor productivity of the Yangtze River Economic Belt of China. Li et al. [35] used DEA to measure the performance of net carbon sequestration of the provincial agriculture in China from 2005 to 2017, suggesting that an uneven regional development existed, with the performance in the eastern region being significantly better than in other regions. Applying the slack-based measurement (SBM), Zhang et al. [36] introduced carbon sequestration for evaluating the marine fishery green performance and found it displayed significant regional differences and temporal changes.
In general, the existing studies have provided both theoretical and empirical bases for evaluating the carbon performance of cropland use. Nevertheless, there were still some limitations: (1) When clarifying the carbon sources, most studies were confined to direct cropland use, such as fertilizer application, tillage, and irrigation, while cover and waste were in a state of neglect. Some activities were born with carbon effects, such as methane from rice fields [37], nitrogen dioxide from the soil [38], for which the neglect may have resulted in biased estimation for the carbon quantity of carbon use. (2) With respect to the assessment of cropland-use carbon effect, the main emphasis has been on quantity, and the study of efficiency has been gradually emerging, while the discussion of quality, i.e., carbon performance, has been limited. While observing the studies of carbon performance, most studies have concentrated on carbon emission performance and paid less attention to sequestration [8]. Within the analysis of carbon sequestration performance, forestry land has received more concern than cropland. It is worthwhile mentioning that although cropland cannot compete with forest land in carbon sequestering, it has the dual attributes of emitting and sequestering, and especially, it is more susceptible to human activities [39]. Thus, the carbon sequestration performance of cropland use reflects the change of quantity and also helps to judge the appropriateness of cropland use under the corresponding resource endowment and production technology.
In this study, to complement existing studies, carbon emissions and sequestration of cropland use are both taken into consideration, in which four carbon sources, i.e., agricultural materials, rice fields, soil, and straw burning, are involved, in order to judge the carbon effect of cropland use more comprehensively and precisely. Then, we attempt to define the net carbon sequestration performance of cropland use (NCSPC) and construct a corresponding theoretical framework. On this basis, the net carbon sequestration per unit of cropland is estimated for 13 principal grain-producing provinces in China from 2000 to 2019. Furthermore, a model combining SBM and global benchmark technology, global-SBM, is employed to measure the provincial NCSPC, whose spatiotemporal divergence is analyzed based on the Theil index and convergence test. This article is structured as follows: In Section 2, we introduce the study area, the theoretical analysis, the approaches, and data processing; in Section 3, we present the results and analysis; in Section 4, we provide the discussion; and in the last section, we state conclusions and implications.

2. Materials and Methods
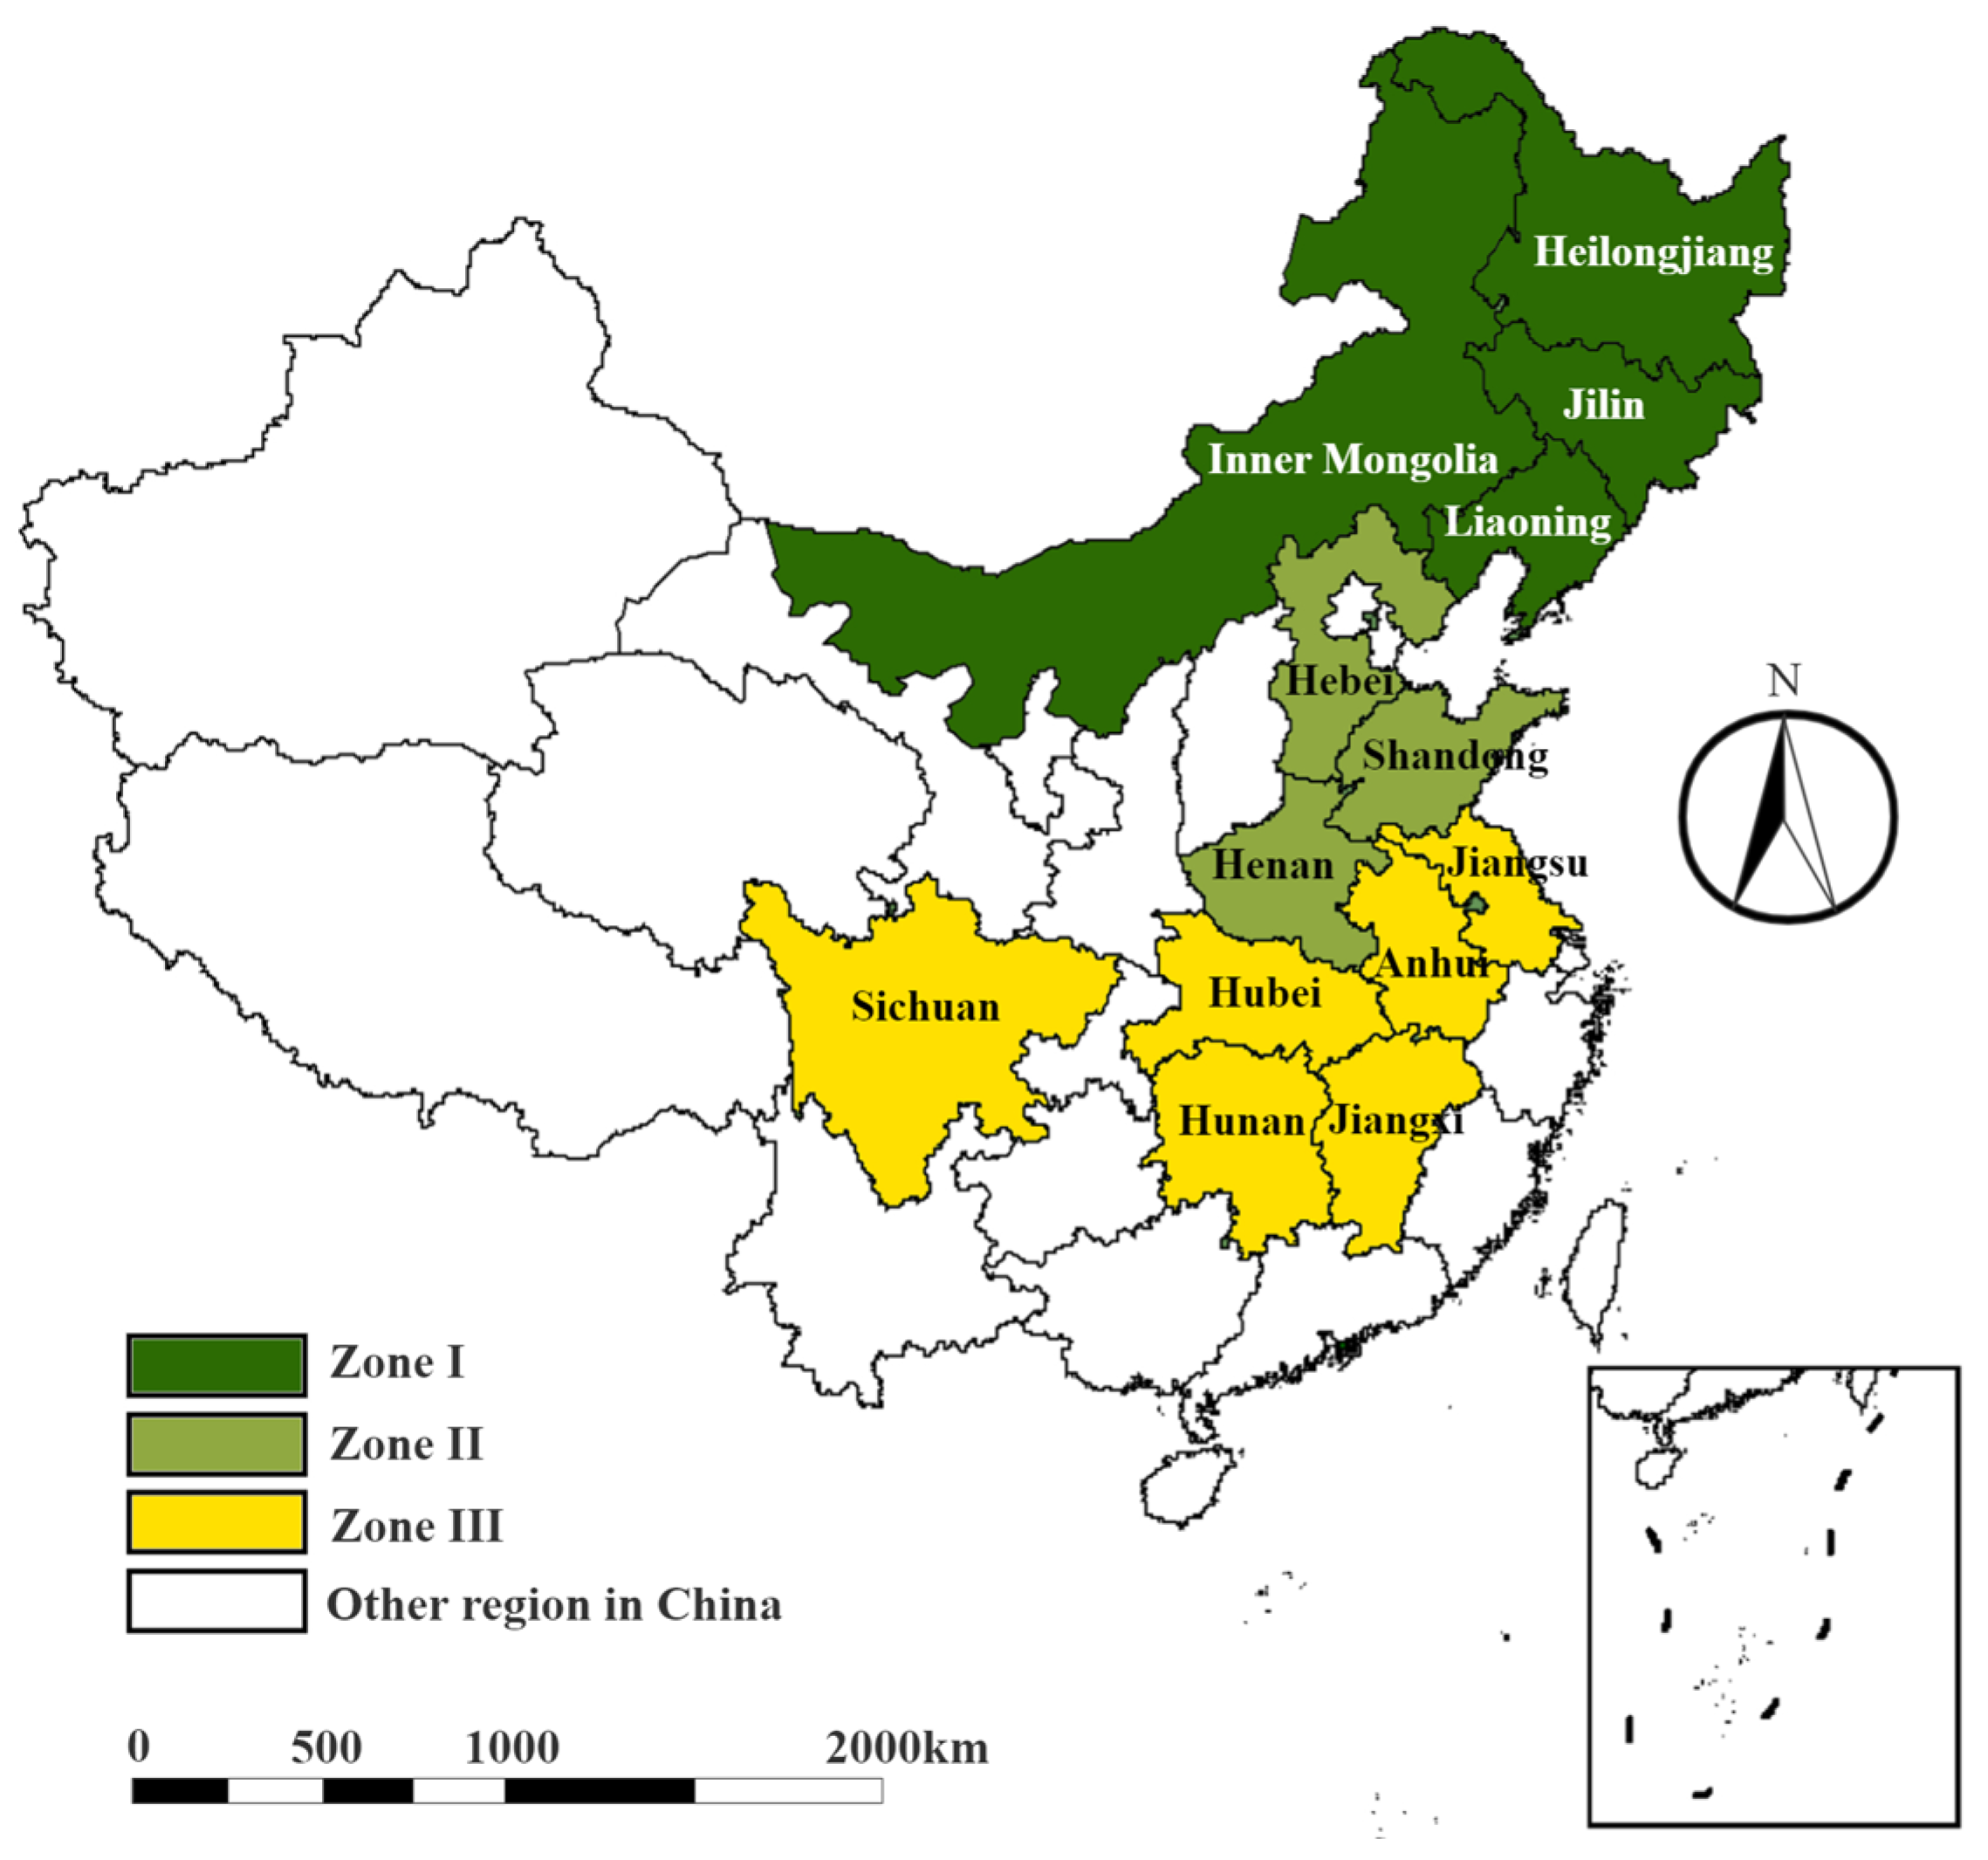
2.1. Study Area

China’s principal grain-producing area is comprised of 13 provinces, which contribute more than 75% of the agricultural products of the whole country. According to the geographical locations, the provinces are divided into three zones. Zone I is mainly located in the northeast, including four provinces, Heilongjiang, Jilin, Liaoning, and Inner Mongolia. Zone II belongs to the Huang-Huai-Hai regions, including three provinces, Hebei, Shandong, and Henan. Zone III is situated in the middle and lower reaches of the Yangtze River, including six provinces, Jiangxi, Jiangsu, Anhui, Hunan, Hubei, and Sichuan. A map of the study area is shown in Figure 1.

2.2. Theoretical Analysis of the NCSPC

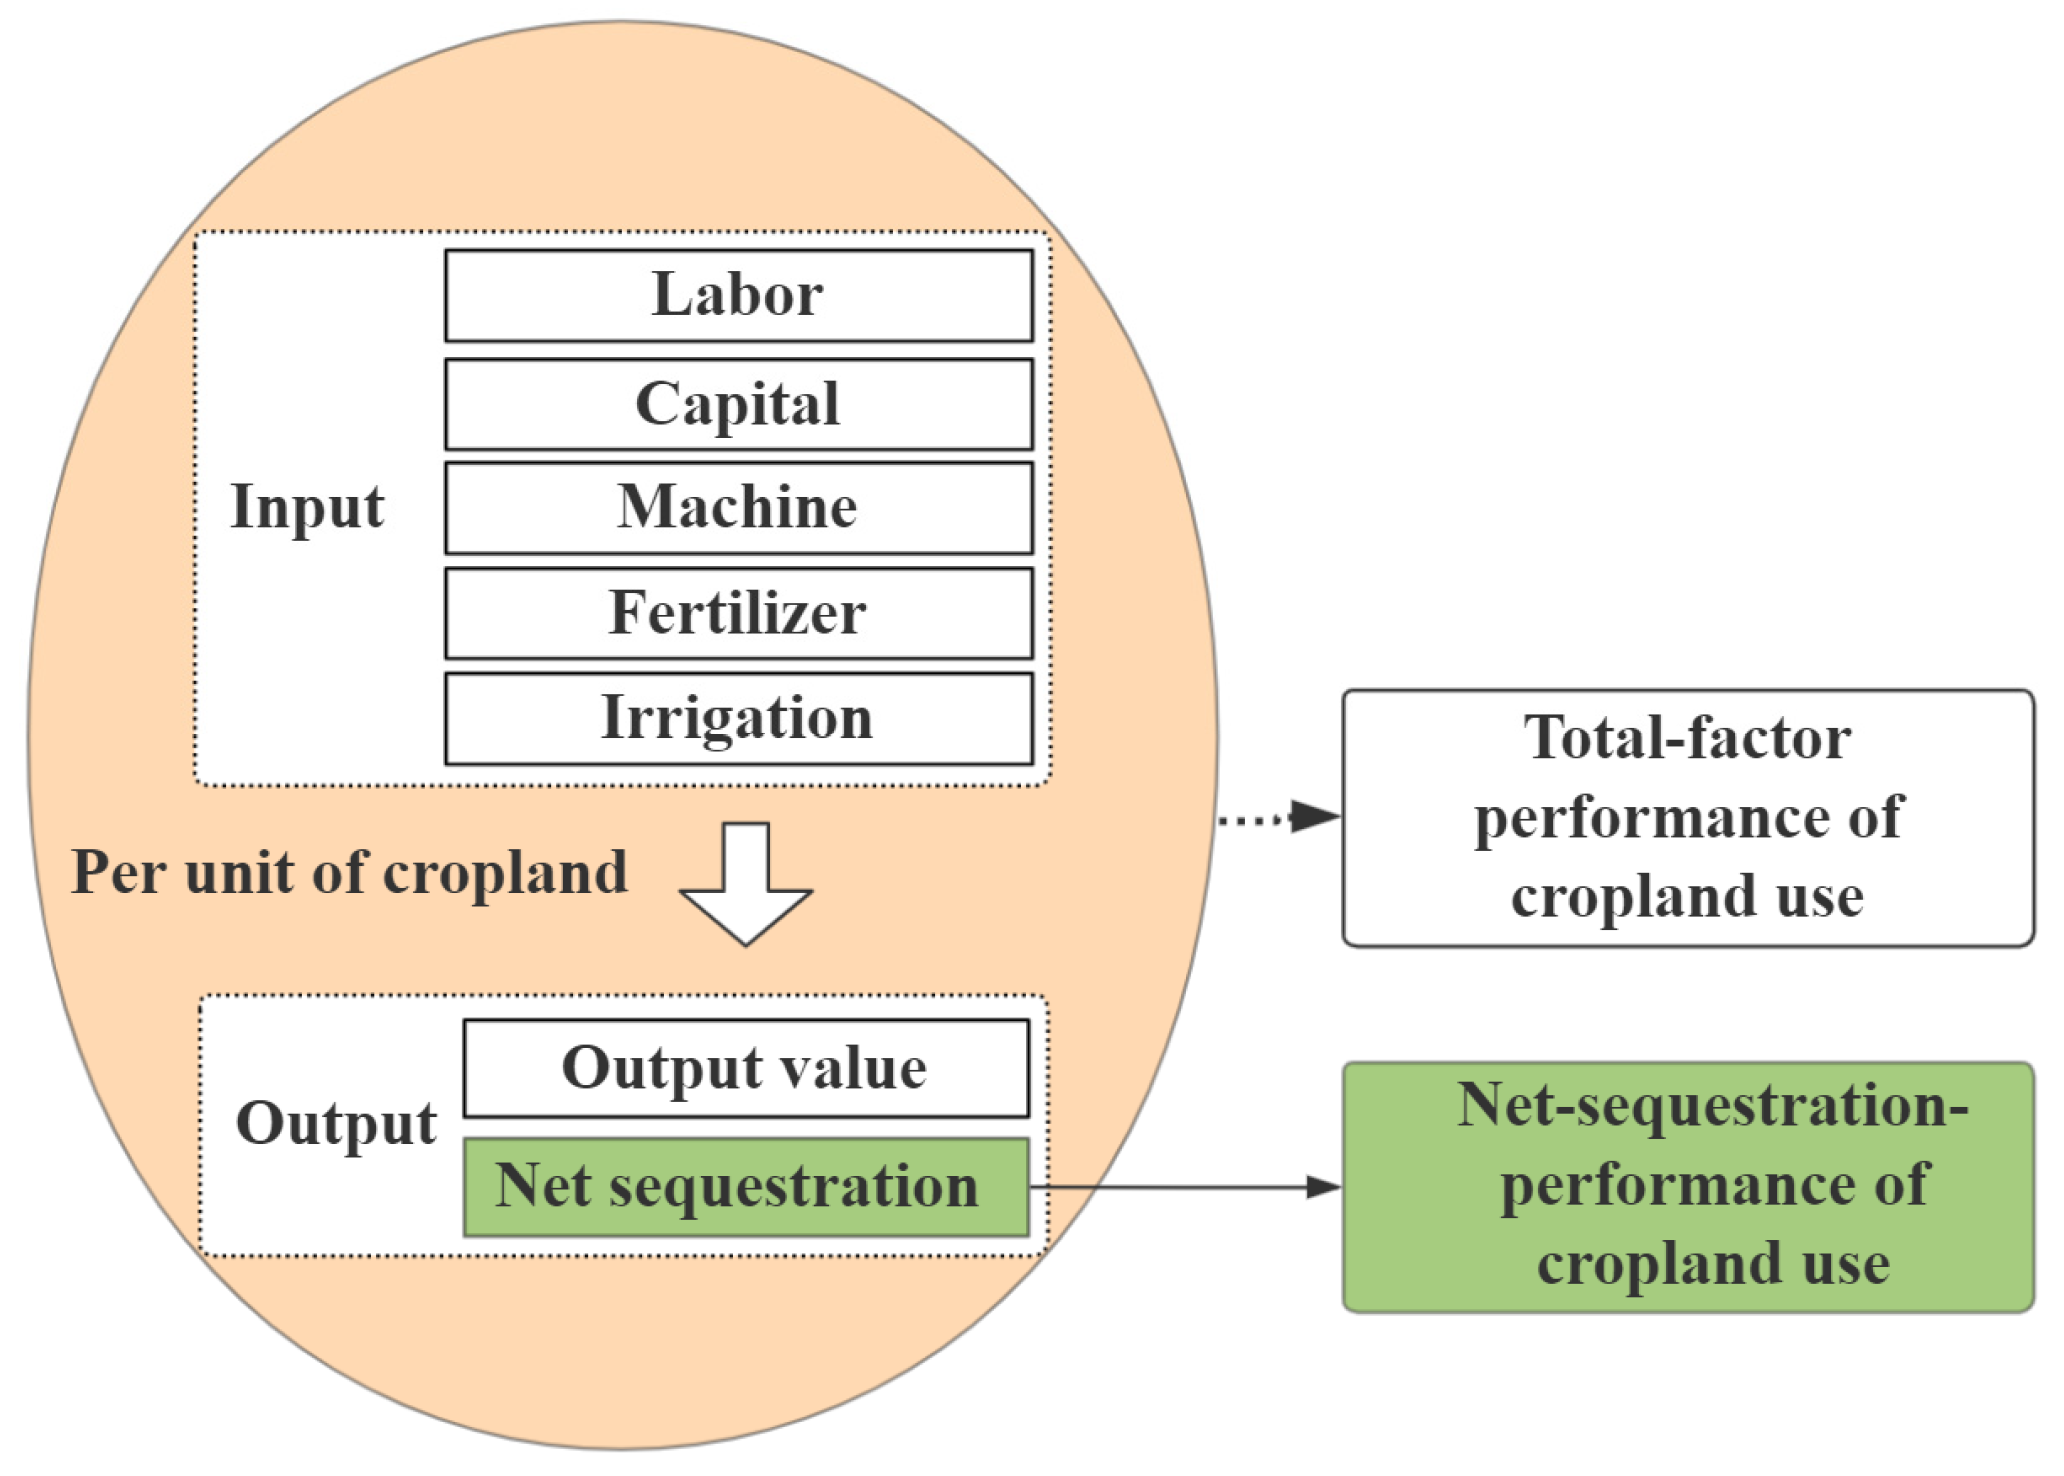
2.2.1. Net Carbon Sequestration in a Cropland Use System

Referring to the study of Yin et al. [40], we further illustrate the carbon cycle of a cropland use system, as shown in Figure 2.
Cropland use is a process whereby humans invest labor and capital in cropland to obtain products that satisfy their livelihoods during agricultural production. It is an ecosystem built artificially on cropland centered on crops, involving producers, crops, soil, and non-living matter. Carbon is stored mainly as organic matter in the soil, crops, and dead residues, forming the crop carbon pool and soil carbon pool.
The carbon cycle involves both natural production and human activity as follows: Crops absorb carbon dioxide in the atmosphere through photosynthesis, turning it into organic matter and storing it in the plant. When the leaves and debris fall to the ground, some of them decay and release carbon into the atmosphere immediately, while the rest enter the soil to make up for the carbon pool, with part of them decomposing under the action of microorganisms and entering the atmosphere later. In particular, methanogenic bacteria in rice fields transform the organic matter of rice roots into large quantities of methane. The soil carbon pool also releases carbon to the atmospheric carbon pool through respiration, creating a flow of carbon between the soil and the atmosphere. In addition, human activities also cause carbon emissions. Straw handling, including returning and open burning, both bring about carbon emissions. The consumption of fossil energy, such as the burning of diesel fuel and coal indirectly used for irrigation electricity, usually acts as a carbon source. The application of agricultural materials, such as pesticides, fertilizers, and mulch, has also been recognized as a substantial carbon emitter.
A cropland use system has dual carbon effects, sequestration and emission, where the net carbon sequestration is the difference between the two. The quantity of net carbon sequestration only reflects the scale, failing to take into account the production characteristics and factor endowment, and therefore it is difficult for cross-sectional comparisons. According to the quantity of net carbon sequestration, an indicator that denotes the performance is left to develop.

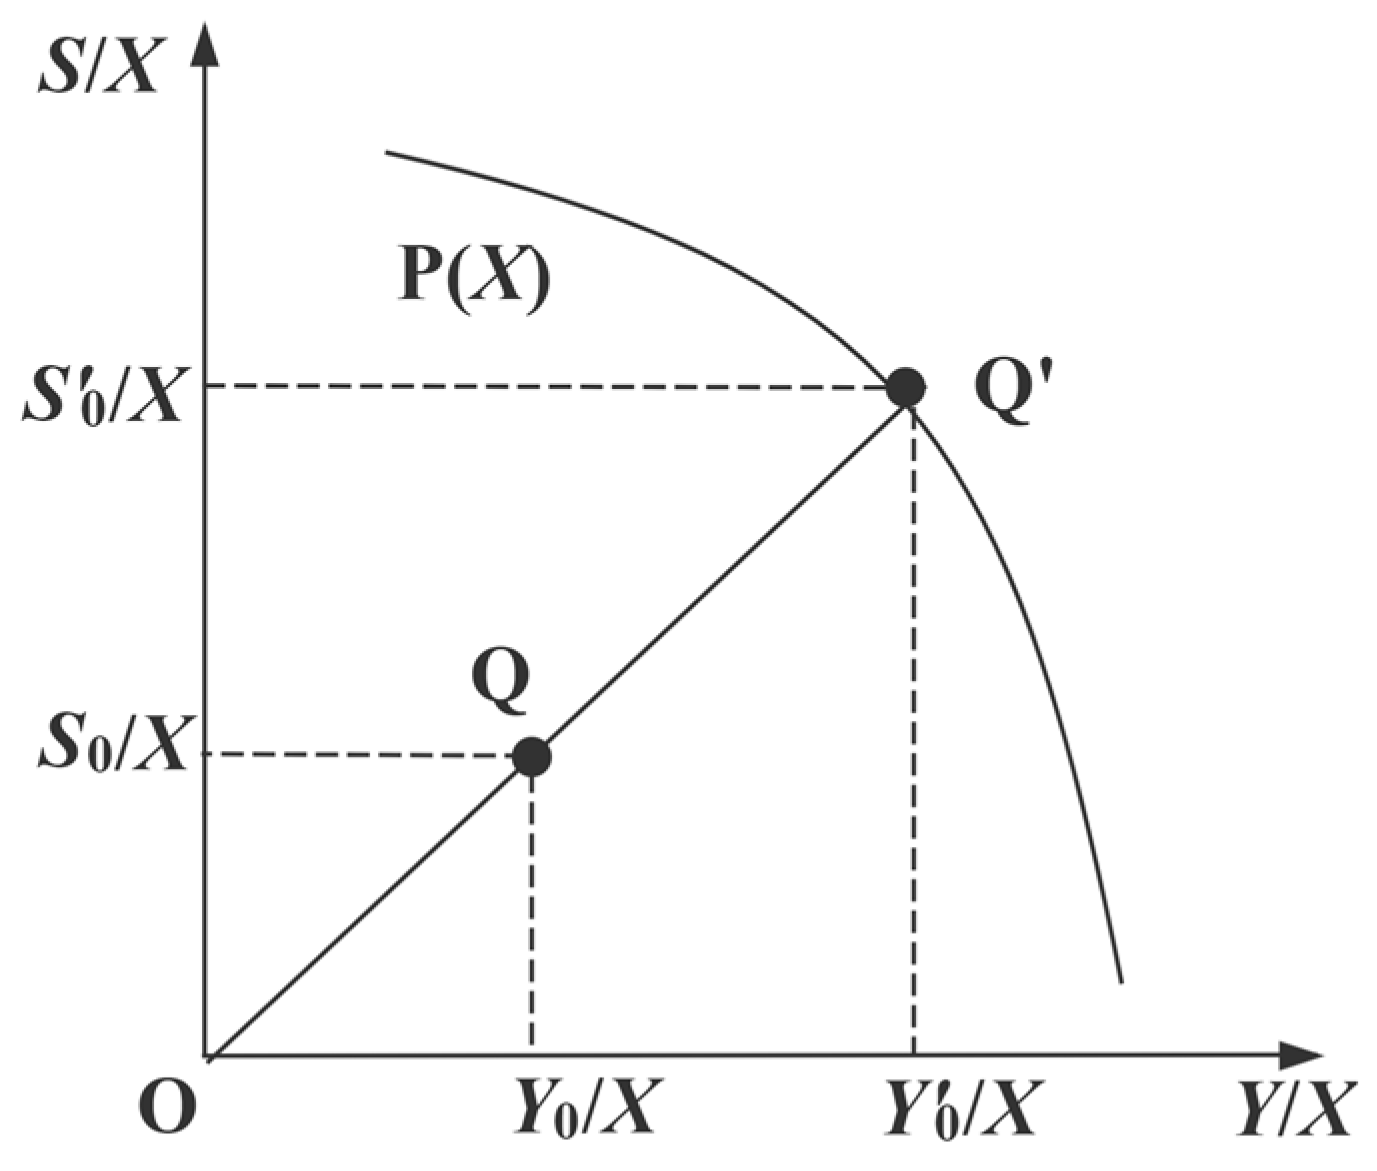
2.2.2. Theoretical Framework of the NCSPC

Contrary to carbon sequestration efficiency, which merely considers the natural attributes of sequestering, carbon sequestration performance takes both carbon sequestration and economic output into account. In this study, NCSPC is defined as the ratio of actual net carbon sequestration to the theoretical optimum in cropland use, under the prerequisite of no reduction in economic output, given the factor allocation and production technology; the core of which is to maximize the sequestration, mitigating the emissions, while ensuring the economic output of cropland. With reference to the analytical mechanism of carbon emission performance [27,29] and considering the principal inputs and outputs, we constructed a framework for analyzing the NCSPC, as shown in Figure 3.
Cropland use can be regarded as an input–output process. Labor and capital are the most basic production factors, and the other three inputs, i.e., machinery, fertilizer, and irrigation, are also critical. Agricultural output value acts as economic output, reflecting both the production revenue and the food-guarantee ability of cropland. Additionally, the net carbon sequestration reflects the contribution for mitigating climate change during cropland use and should be regarded as an ecological output. Net carbon sequestration of cropland use is affected by many factors, such as cropping structure, reliance on agricultural materials, and agricultural waste disposal. Thus, substantial variation in resource endowment and production conditions in different provinces inevitably leads to diverse NCSPCs. How provincial cropland-use systems perform in net carbon sequestration should be evaluated.
In the input–output framework, cropland, as the host of production factors, provides space for various inputs to combine and produce, ultimately obtaining economic output and net carbon sequestration. The overall input–output efficiency is essentially the total-factor performance of cropland use, which covers all inputs and outputs instead of concentrating on the net carbon sequestration. Therefore, the net carbon sequestration performance needs to be further separated from the total-factor performance, as shown in Figure 4.
For a unit of cropland, assume that the total inputs are X. In Figure 4, P(X) is the production possibility set, the curve reflects the production frontier. The horizontal axis mirrors the agricultural output value, denoted as Y/X, and the vertical axis is the net carbon sequestration, denoted as S/X. The desired output direction is g = (Y/X, S/X), i.e., maximizing both the agricultural output value and net carbon sequestration. Q (Y0/X, S0/X) is the actual decision point, deviating from the production frontier, which is inefficient. Correspondingly, Q’ (Y’0/X, S’0/X) is the projection of Q on the production frontier, which is efficient. Accordingly, the total-factor performance of cropland use is expressed as TP = OQ/OQ’. Focusing on the net carbon sequestration, S0/X is the maximum value per unit of cropland under the given production factors and technology, and the distance from S0/X to S0/X is usually called slack. If Q is to reach Q’, the potential net carbon sequestration should be δS/X = S0/XS0/X, and the NCSPC is P = S0/S0. Hence, the key point of measuring the NCSPC is to quantify the production frontier, and further calculate the slacks.

2.3. Process of Evaluating the NCSPC

According to the theoretical framework, the NCSPC is measured as follows: First, the actual net carbon sequestration of cropland in every province is estimated. Then, the production possibility set based on inputs and outputs per unit of cropland is constructed. Later, an appropriate approach is selected for calculating the distance between the actual value and production frontier of net carbon sequestration, i.e., the slack. Finally, the NCSPC is evaluated for each decision-making unit (DMU) based on the slacks.

2.3.1. Estimation for the Net Carbon Sequestration from Cropland Use

The net carbon sequestration is the difference between carbon sequestration and emissions. According to the theoretical analysis, we mainly consider four carbon sources, i.e., agricultural materials, rice fields, soil, and straw burning, where the total carbon emissions of cropland use are the sum of the emissions from the four categories. Meanwhile, carbon sequestration involves 15 species of crops. Crops have different abilities of carbon sequestering, which are reflected by the carbon coefficient. The carbon emissions and sequestration are estimated on the basis of activity data, specific equations, and coefficients. Constrained by space, the specific equations and coefficients are not presented here, but the reference is provided in Table 1.
In addition, the GWP of CH4 and N2O are 6.8182 and 81.2727, respectively. The subsequent comparison and analysis are based on the quantity of standard carbon converted according to this ratio.

2.3.2. Approach for Evaluating the NSCPC: Global-SBM

In terms of selecting the approach, the slack-based measure (SBM), proposed by Tone [42], is a non-radial and non-angular model of DEA that allows slacks of input and output to vary in different proportions, which could also decompose the slacks of any inputs or outputs. However, the SBM measures relative efficiency with the production frontier derived from the sample set. In inter-temporal data, the conventional benchmark is determined by cross-sectional data of each time point, where the production frontiers change with time, harming the comparability of the measured efficiency. To solve the problem, Pastor and Lovell [43] created global benchmark technology, which formed the production frontier based on the inputs and outputs of all DMU over the entire study period. Then, each DMU was compared to the global production frontier, making the evaluated performance comparable across time. In this study, the slacks of net carbon sequestration are estimated by SBM combined with the global benchmark technology, i.e., global-SBM.
Setting provincial cropland-use system as DMU, assume that there are T (t = 1, …, T) periods and N DMUs, each DMU produces n outputs using m inputs. For DMUk, the input and output vectors are denoted as x k T and y k T , respectively. Under the prerequisite of constant returns to scale (CRS), the production possibility set is constructed as Equation (1), and the global-SBM is expressed as Equations (2)–(5).
P P S = { ( x ¯ , y ¯ ) x ¯ T τ = 1 T j = 1 N λ j τ x j τ ; y ¯ T τ = 1 T j = 1 N λ j τ y j τ }
ρ k t G * = min 1 + 1 m i = 1 m s i k , t x i k t 1 1 n r = 1 s s r k + , t x r k t
s . t . x k t j = 1 N τ = 1 T λ j τ x j τ + s k , t = 0
j = 1 N τ = 1 T λ j τ y j τ y k t + s k + , t = 0
λ j τ 0 , s k , t 0 , s k + , t 0
where ρ k t G * is the total-factor performance of cropland use; λ j τ represents the weight vector of the DMUj in period τ; s i and s r + are the slack variables of input and output, respectively, reflecting the distances between actual values to the production frontier. Following the theoretical analysis, the NCSPC under the framework of global-SBM is expressed as:
P s , k t = Y s , k t Y s , k t + s s , k + , t
In Equation (6), for DMUk in period t, P s , k t , Y s , k t , and s s , k + , t denote the performance, the actual amount, and the slacks, of net carbon sequestration per unit of cropland, respectively. The value of P s , k t distributes from 0 to 1, the higher it is, the better the cropland-use system performs in net carbon sequestration. When P s , k t equals 0, the NCSPC is 1.

2.3.3. Input–Output Indicators Selection

On the basis of the theoretical framework, the input and output indicators are selected as shown in Table 2.
In Table 2, two indicators were not available directly from the statistical data and needed to be estimated as follows:
(1) Agricultural capital stocks are calculated by perpetual inventory method, referring to Wang et al. [44], whose equation is:
K i t = ( 1 δ ) K i t 1 + I i t
In Equation (7), Kit is the agricultural capital stock of province i in period t, Kit−1 is the counterpart in period t − 1, Iit is the agricultural investment in period t, and δ is the rate of depreciation.
(2) According to Lin et al. [45], we estimate the agricultural employees by weighting the primary industry employees with the proportion of agricultural output value to the output value of the primary industry.

2.4. Method for Clarifying Regional Divergence

2.4.1. Theil Index

The Theil index helps to decompose regional disparity into inter-regional and intra-regional disparity, to further clarify their contribution. In this study, the Theil index is employed to analyze the spatial disparity in the NCSPC, which is expressed as:
T = T W + T B
T p = i = 1 n p 1 n p ( e i e ¯ p ) ln ( e i e p ¯ )
T W = p = 1 m ( n p n e p ¯ e ¯ ) T p
T B = P = 1 m n p n ( e p ¯ e ¯ ) ln ( e p ¯ e ¯ )
where TW, TB, and T, denote the intra-regional, inter-regional, and the total Theil index of the NCSPC, respectively; Tp denotes the Theil index of region p; m is the number of regional clusters; np is the number of provinces belonging to zone p; n is the number of provinces in the principal grain-producing area; ei, ep, and e are the NCSPC in province i, zone p, and the principal grain-producing area, respectively. The value of T is between 0 to 1, and the larger the T is, the greater the spatial disparity would be.

2.4.2. σ-Convergence Test

The σ convergence indicates that regional divergence tends to decrease over time. The value of σ synthesizes the deviation of provincial performance from the overall level, with the expression in Equation (12).
σ = [ i I ( ln P i t ln P t ¯ ) 2 ] I
In Equation (12), lnPit represents the logarithm of the NCSPC in province i in period t, ln P t ¯ is the mean of the logarithm of provincial NCSPC in period t, and I is the number of provinces. The value of σ could be calculated based on data of each year, and if the value decreases over time, then σ convergence is considered to exist, otherwise, there is a divergence.

2.5. Data Sources and Processing

The study required the activity data for estimating the net carbon sequestration and the input–output data of cropland use in 13 provinces from 2000 to 2019, which were obtained from the China Statistical Yearbook, China Rural Statistical Yearbook, China Water Statistical Yearbook, and provincial statistical yearbooks. To avoid the interference of price, two indicators, agricultural output value and capital stock, were discounted at constant prices in 2000.

3. Results and Analysis

3.1. Carbon Structure of Cropland Use in the Chinese Principal Grain-Producing Provinces

According to the constructed inventory, the carbon emissions and sequestration of cropland use in the Chinese principal grain-producing provinces were estimated from 2000 to 2019. Dividing the outcome by the area of cropland, we obtained the carbon structure per hectare of cropland, as shown in Figure 5.
As for the whole principal grain-producing area, the carbon emission average was 2.506 t per hectare of cropland, while the carbon sequestration was 6.343 t. The difference between the two, net carbon sequestration, was 3.837 t, implying that the cropland-use system was a carbon sink. In terms of the carbon-emitting structure, the rice paddies had the highest carbon emissions (0.769 t), followed by agricultural materials (0.726 t), with straw burning in third place (0.725 t), and soil accounting for the lowest proportion, at 0.285 t.
From the provincial perspective, Henan (6.191 t) was the province with the highest net carbon sequestration per hectare of cropland, while Hunan had the lowest with 2.080 t. In terms of carbon sequestration, Henan led with 8.676 t, and Inner Mongolia was at the bottom (3.131 t). As for carbon emissions, Hunan was the province with the highest emissions at 5.128 t, while Inner Mongolia ranked last (0.552 t). Due to differences in production technology and crop structure, carbon emissions varied considerably across the provinces both in quantity and structure. The province with the highest emissions from agricultural materials per hectare of cropland was Shandong (1.063 t), Jiangxi led with 2.635 t of emissions in rice paddies, Hubei was the province with the highest carbon emissions from the soil at 0.500 t, and Hunan ranked first in straw burning with 1.515 t. In contrast, Heilongjiang was the lowest carbon emitter in the agricultural materials with 0.250 t, while Inner Mongolia had the least emissions in the remaining three carbon sources, which could be attributed to the specificity of its cropping structure.

3.2. Basic Characteristics of the NCSPC in the Chinese Principal Grain-Producing Provinces

3.2.1. Measurement of the NCSPC

Using Maxdea Ultra 8 software, the global-SBM was constructed to measure the slacks of net carbon sequestration per unit area of cropland, with NCSPC calculated according to Equation (3). Table 3 shows the outcome in major years.
From 2000 to 2019, the average NCSPC was 0.774 in the Chinese principal grain-producing provinces, indicating that 22.6% of net carbon sequestration per unit of cropland had not been discovered under the corresponding production technology and input combinations. No DMU had maintained an NCSPC of 1.000, while the average NCSPCs of Inner Mongolia, Jilin, Heilongjiang, Jiangsu, Henan, and Shandong, were within the range 0.9–1.0. The above provinces had developed well in recent years and arrived at 1.000, especially Shandong, Heilongjiang, and Jilin, which were at the leading edge in most years. In the remaining seven provinces, the performances ranged from 0.2 to 0.9. Among them, the performances of Liaoning, Hebei, Anhui, and Sichuan were higher than 0.7, indicating that there was still some room for improvement. The performances of Hubei, Hunan, Jiangxi, and Anhui were below 0.7, especially in Hunan, with an average NCSPC as low as 0.266. In these provinces, the relationship between economy and ecology remained to be reconciled in the process of cropland use, for which further adjustment of crop structure and production modes were necessary.
The annual change rate of the NCSPC was 0.30% in the principal grain-producing area, showing a slow downward trend. As for provinces, the NCSPC values of Inner Mongolia, Heilongjiang, Jiangsu, Henan, and Shandong remained unchanged for 20 years, while the NCSPC values of Hebei, Liaoning, and Jilin had substantial growth with annual change rates of 2.48%, 4.19%, and 0.55%, respectively. The remaining five provinces presented a declining trend in the NCSPC with varying degrees. Hunan and Sichuan showed a relatively slight decline, while the development of Hubei, Jiangxi, and Anhui was not promising. Their NCSPC values were 1.000 in 2000, but they had fallen to the bottom level among the 13 provinces after 20 years, with annual decline rates of −4.10%, −3.52%, and −2.97%, respectively, which required particular attention.

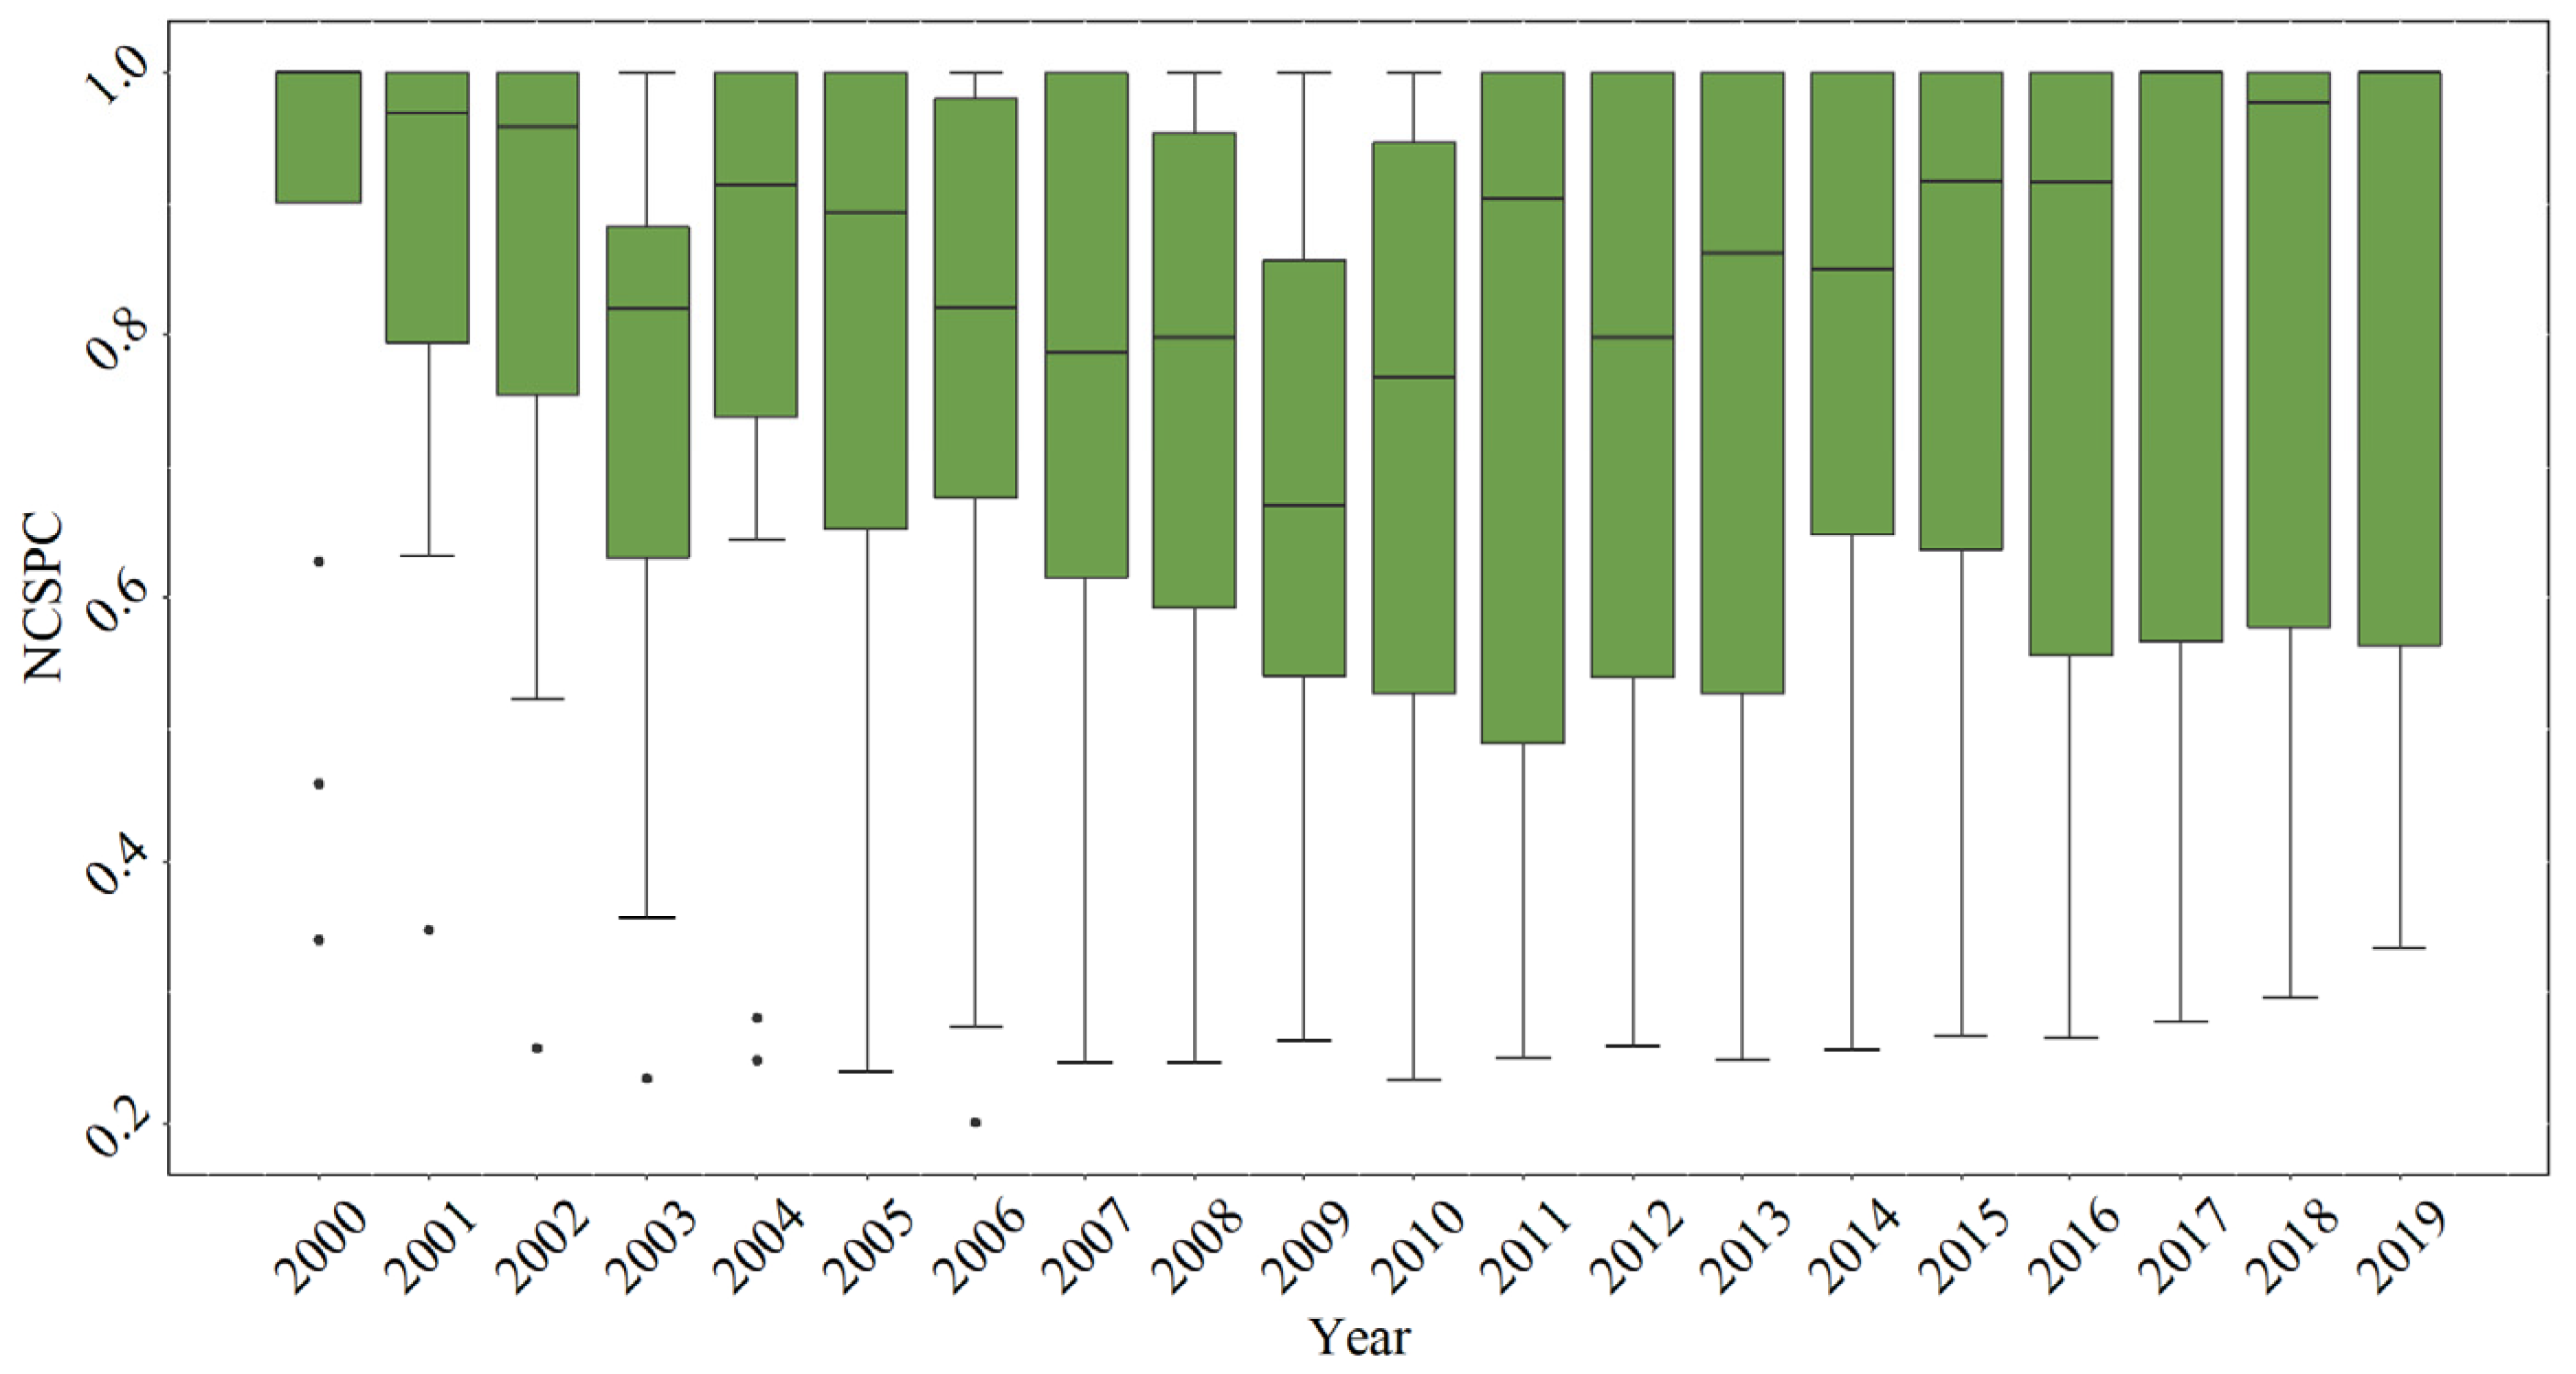
3.2.2. Temporal Characteristic of the NCSPC

To visualize the temporal evolution, we drew a box plot for the NCSPC in the principal grain-producing area from 2000 to 2019, shown in Figure 6.
The median of NCSPC was around 1.000 in 2000, and then began to decline with fluctuates, falling to 0.670 in 2009, after which it rebounded, returning to 1.000 in 2019. During the study period, it displayed an overall U-shaped evolution. The quartiles manifested that the range of most provinces evolved from 0.9~1.0 to 0.6~1.0, indicating that the provincial gap tended to expand. Looking at the maximum and minimum of NCSPC, the maximum remained stable at 1.000 over the 20 years, while the minimum fluctuated in the early years and exhibited a steady upward trend later, finally rising to 0.333 in 2019.

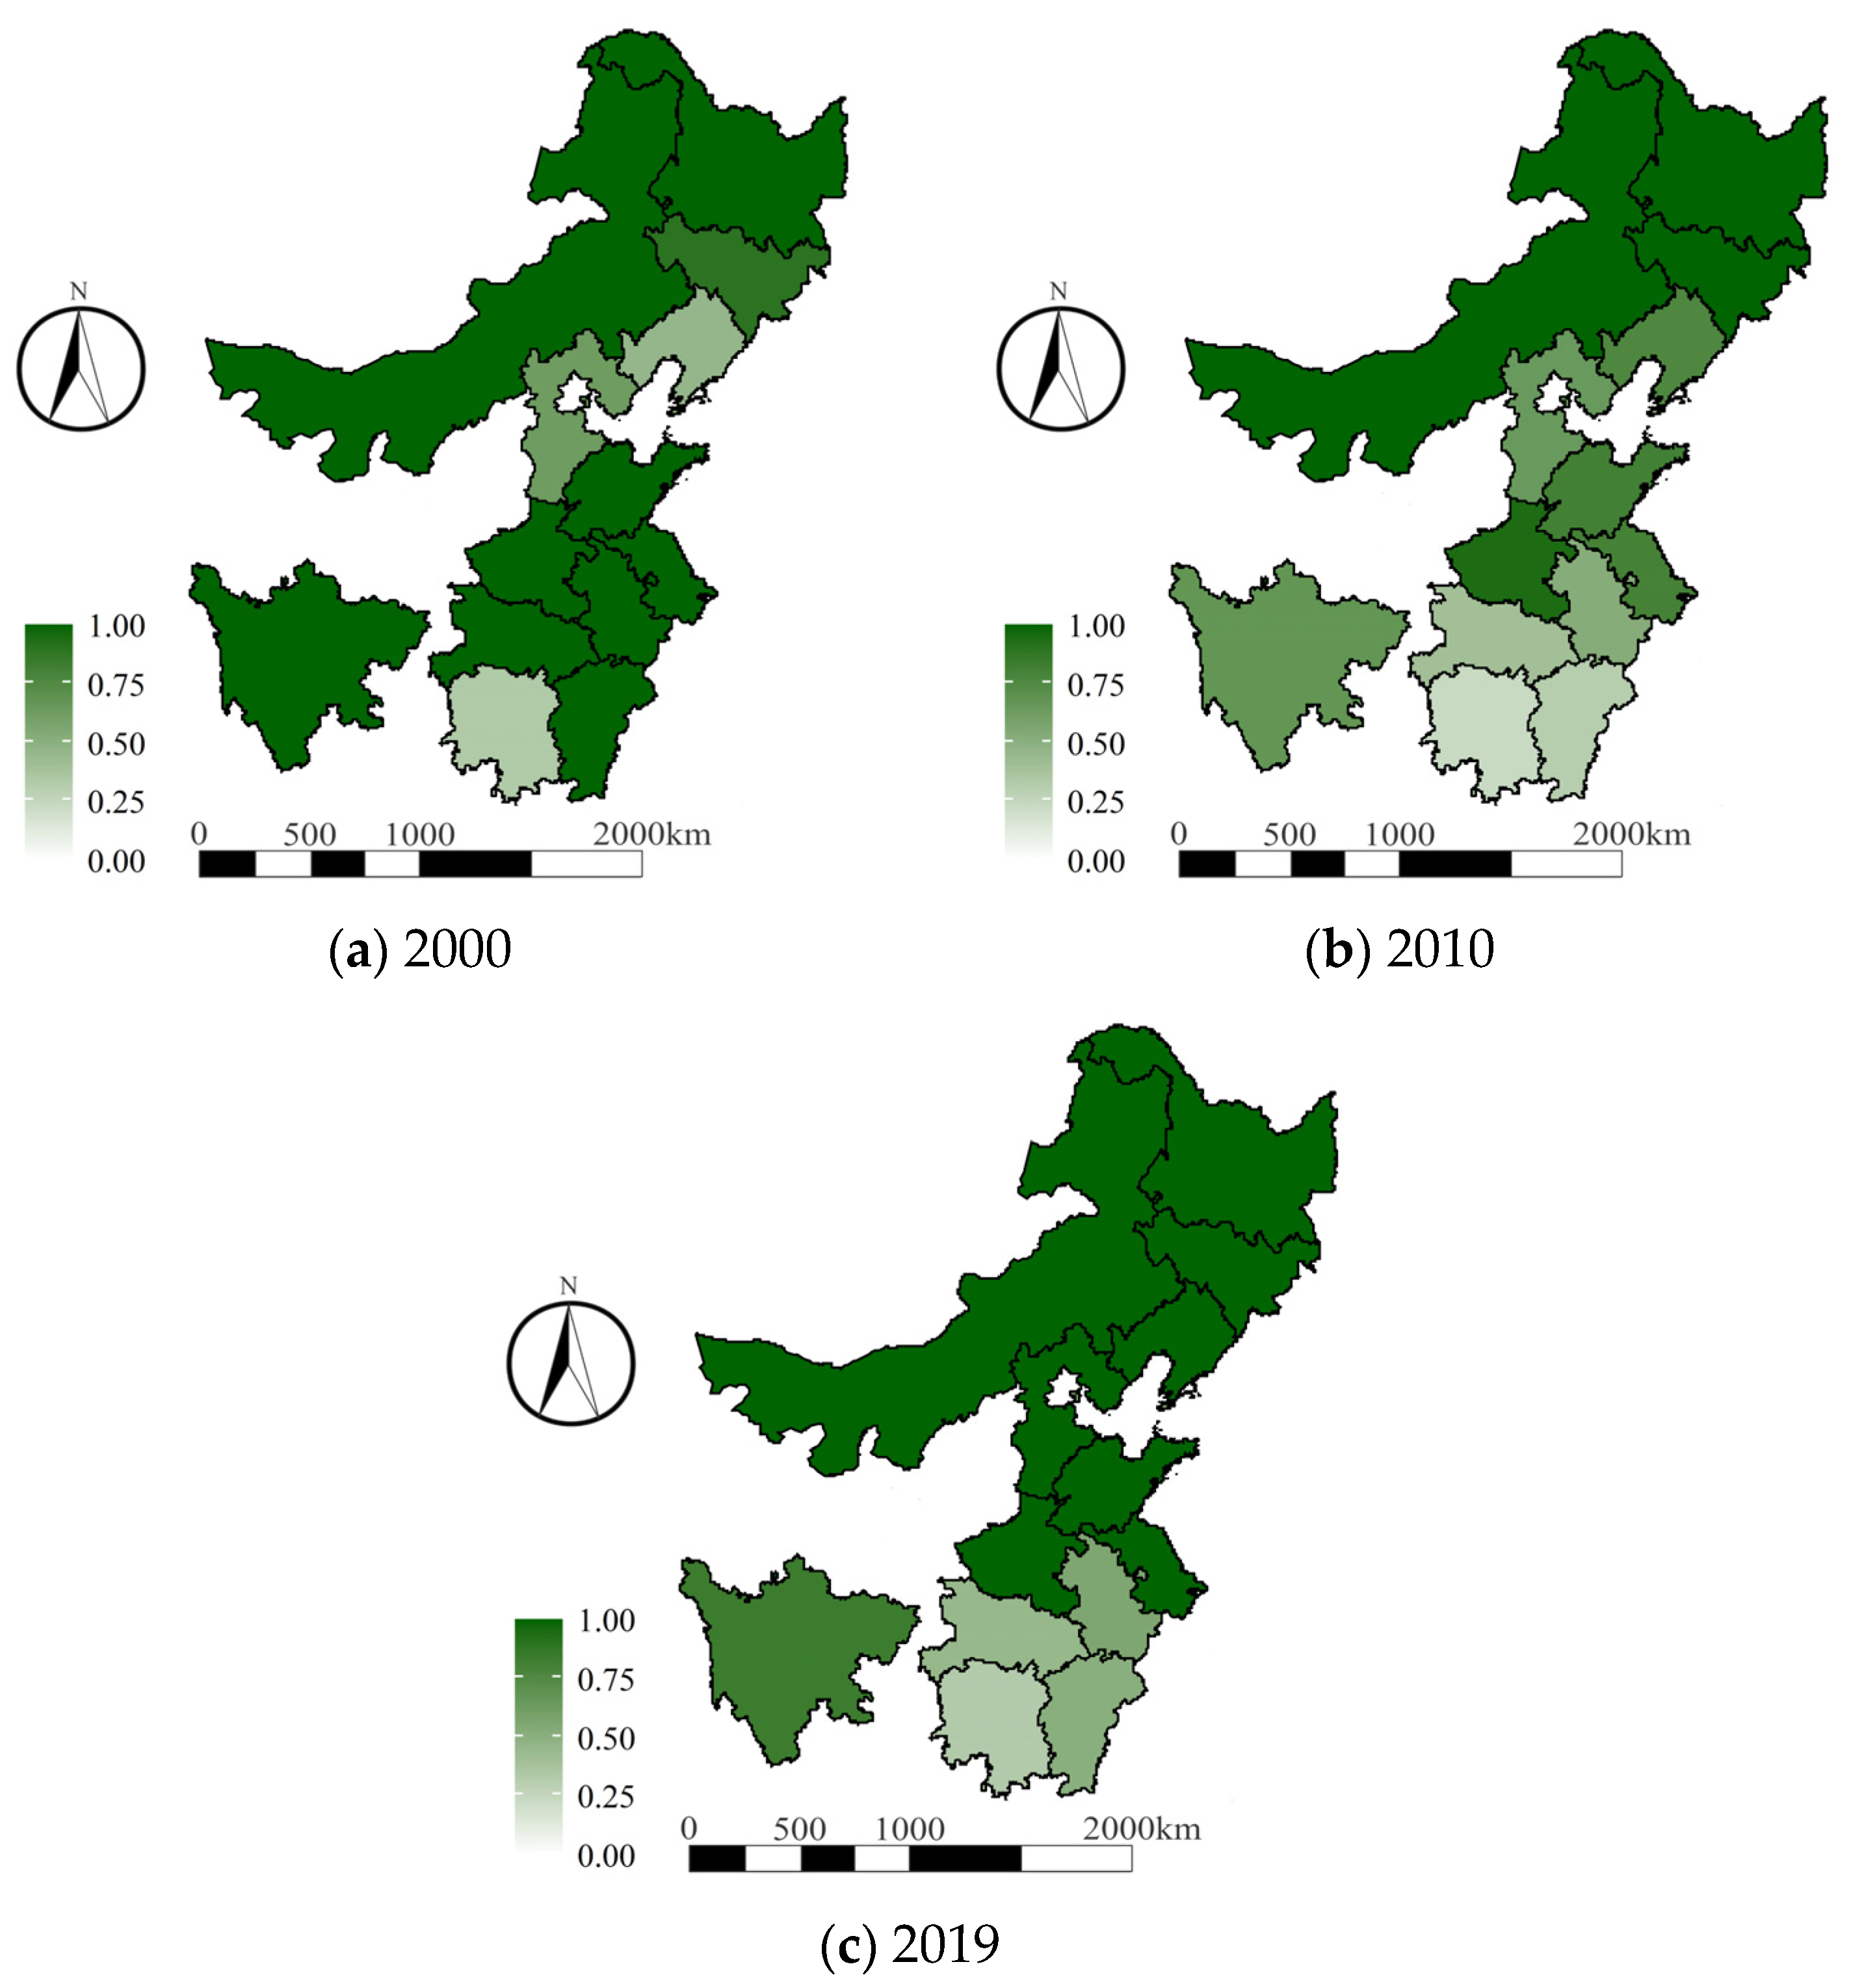
3.2.3. Spatial Characteristic of the NCSPC

To portray the spatial pattern, we further drew a map for the NCSPC in 2001, 2010, and 2019, reflecting the beginning, middle, and end of the study period, shown in Figure 7.
Figure 7 shows that the NCSPC evolved from a scattered distribution to a blocky agglomeration, finally displaying a decreasing pattern from north to south in a stepwise manner. In 2000, high-performance provinces scattered in the south and north, with only a few provinces performing below 0.9. In 2010, the northern part of the principal grain-producing area, including Inner Mongolia, Heilongjiang, and Jilin, was still able to maintain high performance, with the NCSPC of Liaoning increasing. In the south, only one province, Henan, performed well, while the NCSPC of all other DMU had decreased to varying degrees. Compared to 2000, the high-performance area shrank to the northeast, and the low-performance area spread. In 2019, the northern part of the principal grain-producing area reached 1.000 in NCSPC, clustering in patches. In contrast, low-performance provinces agglomerated in the south. Provinces with high and low NCSPC presented a pattern of delineation.
In general, the NCSPCs of Hunan, Hubei, Jiangxi, and Anhui were unsatisfactory in most years. As the principal rice-producing area in China, the cropping system of the above provinces played well in carbon sequestration but, meanwhile, was accompanied by a large number of methane emissions from rice fields. In Hunan and Anhui, the proportion of open burning in straw exceeded 40%, resulting in carbon emissions from cropland being much more intense than in other provinces, which affected the NCSPC inversely. However, Henan, Heilongjiang, and Jilin had maintained high performances. The NCSPC of Liaoning had moved from low to high, presumably because its ideal crop structure brought about high carbon sequestration. In addition, the proportion of open burning of straw was about 10~20% in Liaoning, lower than that of other principal grain-producing provinces, demonstrating that its production mode had shifted from a crude one relying on factor inputs to an intensive one based on technological progress. It can be seen that both high sequestration and low emissions were the reasons why the above provinces maintained promising net carbon sequestration performance during cropland use.

3.3. Regional Disparity and Convergence of the NCSPC in the Chinese Principal Grain-Producing Area

3.3.1. Regional Disparity of the NCSPC

The NCSPC showed spatial and temporal diversity, so where did the diversity originate? Measuring the Theil index may help to answer this question. Thus, the total, inter-regional, and intra-regional Theil index values of the NCSPC were measured, as shown in Table 4.
During the study period, the disparity pattern of the NCSPC in the principal grain-producing area had changed slightly. The Theil index fluctuated upward at an early stage, reaching a peak value of 0.073 in 2006, and remaining in the interval from 0.6 to 0.7, starting to decline steadily from 2016. Overall, the Theil index demonstrated that regional disparity had undergone an evolution from expansion to shrinkage. In detail, the intra-regional disparity contributed 99.2% and 99.4% in 2000 and 2001, respectively, while the inter-regional disparity was close to 0. From 2002 onwards, the contribution of intra-regional disparity began to decline, but was higher than that within the region, and was still the main component. In 2010, the intra-regional disparity contributed 43.9% of the total, while the inter-regional disparity contributed as high as 56.1%, indicating the status of the two had reversed. From then on, the contribution of inter-regional disparity stabilized between 50~60%, while that of intra-regional disparity remained at 40~50%, accordingly. The disparities among and within the region both played critical roles, but the latter explained the overall more strongly.
Observing the intra-regional disparity, the contribution of Zone III reached 50%, followed by Zone II (6.8%) and Zone I (5.1%). Specifically, from 2000 to 2004, the contribution of Zone III increased from 43.5% to 69.8%, and then fluctuated and decreased to 46.2% in 2019. In comparison, although occasional ups and downs appeared, the contribution of the remaining two zones showed a steady downward trend overall. In 2019, the proportion of Zones II and III dropped to zero, indicating their disparities had apparently narrowed. Overall, the disparity within Zone III was gradually becoming an essential component of the total. Thus, to mitigate the regional divergence, it was urgent to accelerate the low-carbon transition of cropland use and optimize the cropping structures of the provinces in Zone III.

3.3.2. Convergence Test for the NCSPC

The disparity originated from within regions in the early stages and between regions in the later stages. Then, will the pattern continue or change over time? Does the disparity tend to widen or narrow? To answer these questions, we conducted a σ-convergence test on the NCSPC in the whole principal grain-producing area and Zones I, II, and III, which is presented in Figure 8.
In 2000, the σ coefficients of Zones I and II were 0.329 and 0.221, respectively. Although there were fluctuations occasionally, the overall trend was down and eventually fell to zero in 2019, implying that the NCSPC values in the two zones obey σ convergence strictly. With respect to Zones I and II, despite the disparities at the beginning, their NCSPC values gradually converged to 1.000 by 2019. By contrast, the σ coefficient of Zone III was 0.408 in 2000 and had been on an upward trend since then, arriving at a peak of 0.590 in 2004. In this period, the provincial disparity within Zone III was diverging, then declining to 0.377 in 2019. Although the NCSPC of Zone III presented a σ convergence at a later stage, its σ coefficient was always higher than Zones I and II. Unlike the benign trends of the other two zones, the convergence of Zone III was characterized by a low level.
The convergence of the principal grain-producing area was in line with Zone III. In 2000, the σ coefficient was 0.338, reaching a peak of 0.491 in 2006, then dropping steadily to 0.409 in 2009, and fluctuating within 0.4~0.5 since then. During this period, the gap among provinces maintained a dynamic balance, and there was no apparent convergence or divergence. From 2016 onwards, the σ coefficient showed a slight decline again, suggesting the re-emergence of σ convergence in the principal grain-producing area. Nevertheless, the converging speed was relatively slow, which stemmed from the fact that, although all three subregions presented σ convergence, the converging trends were different, with high levels in Zones I and II but a low level in Zone III. The intra-regional disparity tended to narrow, but the inter-regional disparity continued to expand. As the overall convergence depended on the contrast between the two forces, it finally performed a weak convergence. The result was also collaborated by the Theil index. To realize the overall convergence, the NCSPC of Zone III needed to be improved as a breakthrough.

4. Discussion

In the existing studies on the carbon effect of cropland use, most studies have merely involved the direct carbon effect from cropland use activity or soil [15,16], without considering crops and straw [38]. Since the carbon sequestered by crops will subsequently return to the atmosphere through some activities, such as straw burning and human consumption, some researchers believe that it makes little sense to measure crop carbon sequestration [17]. However, other researchers have pointed out that carbon sequestration of crops exists objectively, and sequestered carbon should not be ignored due to future activities which may cause carbon emissions [40]. Therefore, based on a systematic analysis of the carbon cycle of cropland use systems, we extend the cropland-use carbon inventory to four sources, i.e., agricultural materials, rice fields, soils, and straw burning, and also cover the carbon sequestration by crop. The results show that cropland use in the Chinese principal grain-production area was a carbon sink, where the net carbon sequestration per unit area of cropland was 3.837 t. The accuracy of measurement is determined by clarifying the carbon sources and coefficients. To guarantee the reliability of the result, it is necessary to refine the inventory continuously and explore more precise coefficients.
On the basis of the estimation of carbon quantity, studies have made great efforts to portray its spatial-temporal characteristics [17,19] and influencing factors [11,15]. The results help to understand the overall scale, but it is difficult to exhibit the relative level. Because the natural conditions and resource endowment vary from space to space, the intrinsic production structure shows a significant difference in provinces, and therefore quantity cannot reflect a reasonable level of carbon sequestration under their production characteristics. Thus, studies have attempted to find out an indicator for measuring the distance between the actual carbon quantity to the ideal value under a diverse input combination, where the carbon efficiency is proposed. In the studies by Long et al. [24] and Mizuta et al. [26], they estimated the carbon sequestration efficiency of forest and soil, respectively, which helped to explore the optimal level of carbon sequestration under the given land use structure. Nevertheless, carbon efficiency still leaves a problem unsolved, i.e., the economic output is not considered. To make up for this deficiency, we refer to the mature idea of carbon emission performance and propose the concept of NCSPC. It can reflect the relative change of the quantity of net carbon sequestration, more importantly, it helps to judge the appropriateness of cropland use with a given input combination under the prerequisite of no economic output reduced.
Comprehensively, there are still some limitations in this study. Firstly, when evaluating performance, provincial cropland quality is not involved, and a subsequent study is encouraged to incorporate initial differences in cropland quality into the indicator system. Second, the study was carried out based on provincial data, whose scale is rather macro. A follow-up evaluation could be narrowed to the municipal or county levels, in which the policy implication would be more targeted.

5. Conclusions and Implications

Considering the dual carbon attributes of emitting and sequestering of cropland use, we attempted to propose an indicator, net carbon sequestration performance of cropland use, to reflect the gap between the actual and optimal value of net carbon sequestration during cropland use. On the basis of a theoretical analysis, we estimated the net carbon sequestration per unit of cropland in 13 Chinese principal grain-producing provinces from 2000 to 2019, where four carbon sources and carbon sinks of 15 species of crops were covered. Then, we employed the global-SBM to measure the NCSPC, with spatiotemporal characteristics and regional divergence analyzed. The conclusions are as follows:
(1)
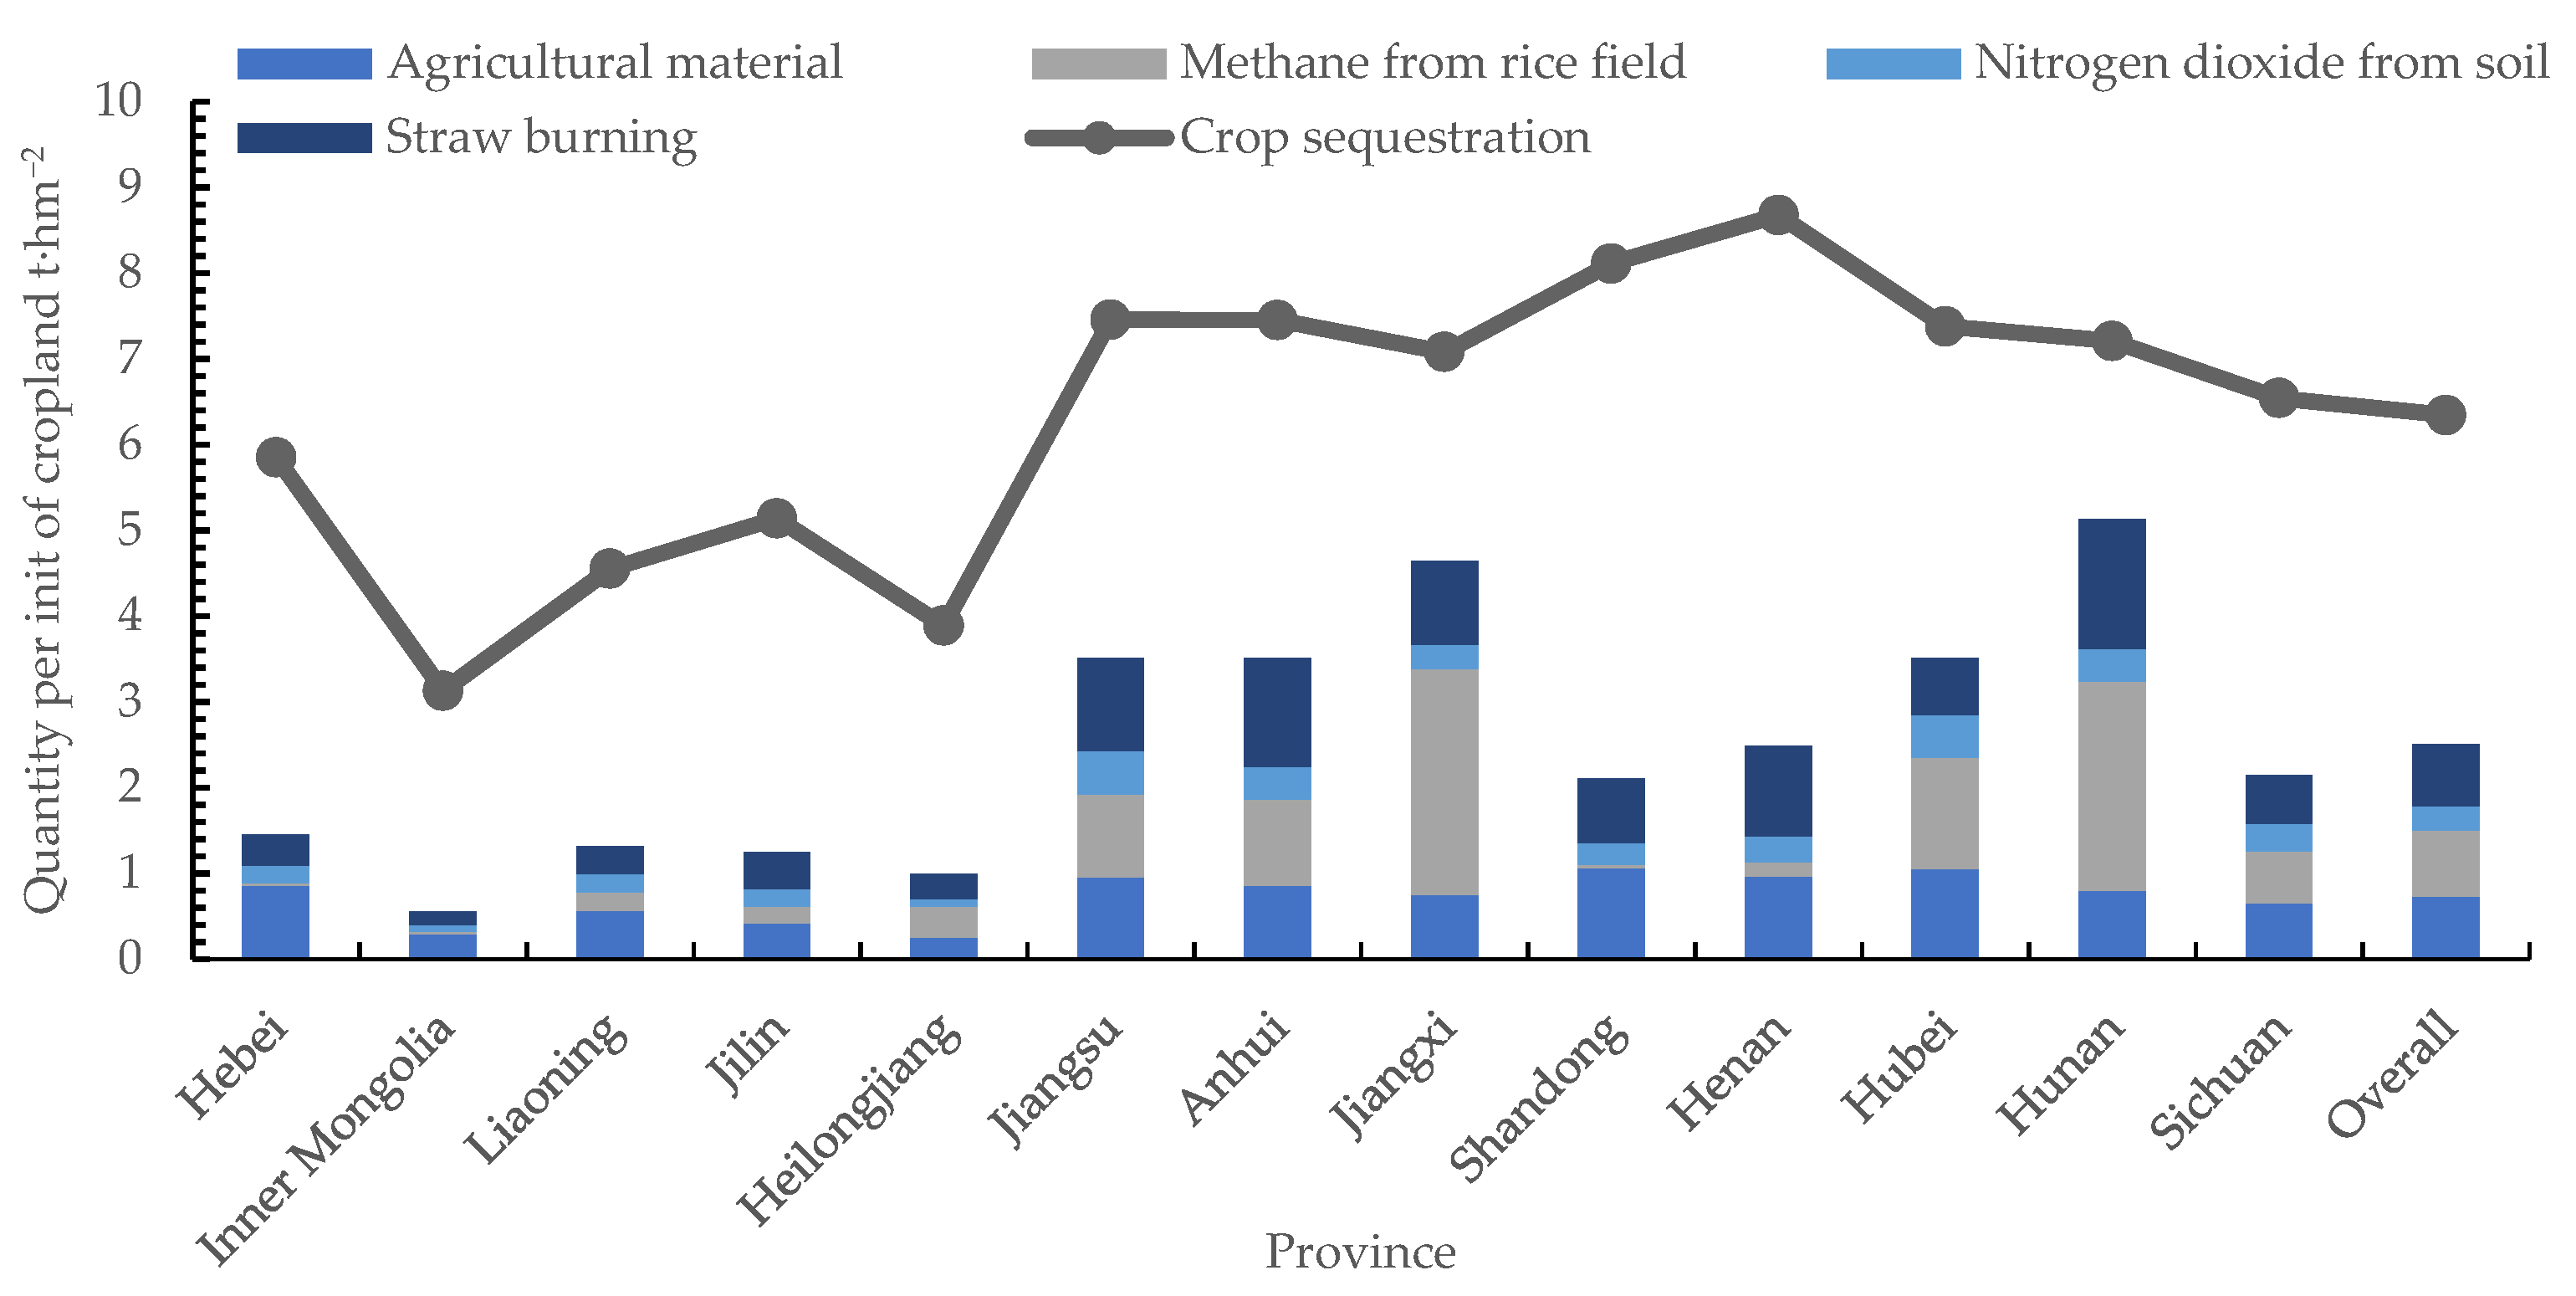
The average net carbon sequestration per hectare of cropland was 3.837 t in the principal grain-producing area. For a unit of cropland, the carbon sequestration was 6.343 t, and the carbon emissions were 2.506 t, with the largest to smallest share being paddy methane (0.769 t), agricultural materials (0.726 t), straw burning (0.725 t), and soil nitrous oxide (0.285 t). The net carbon sequestration per unit of cropland varied among provinces, with Henan (6.191 t) in first place and Hunan (2.080 t) in last place.
(2)
The average NCSPC was 0.774 in the principal grain-producing area, indicating 22.6% of net carbon sequestration per unit of cropland stayed unexplored under the corresponding production technology and input combinations. In terms of temporal evolution, the annual change rate of the NCSPC was −0.30%, showing a slow decline. As for the spatial characteristics, the NCSPC evolved from a scattered distribution to blocky agglomeration, and finally displayed a pattern of decreasing from north to south.
(3)
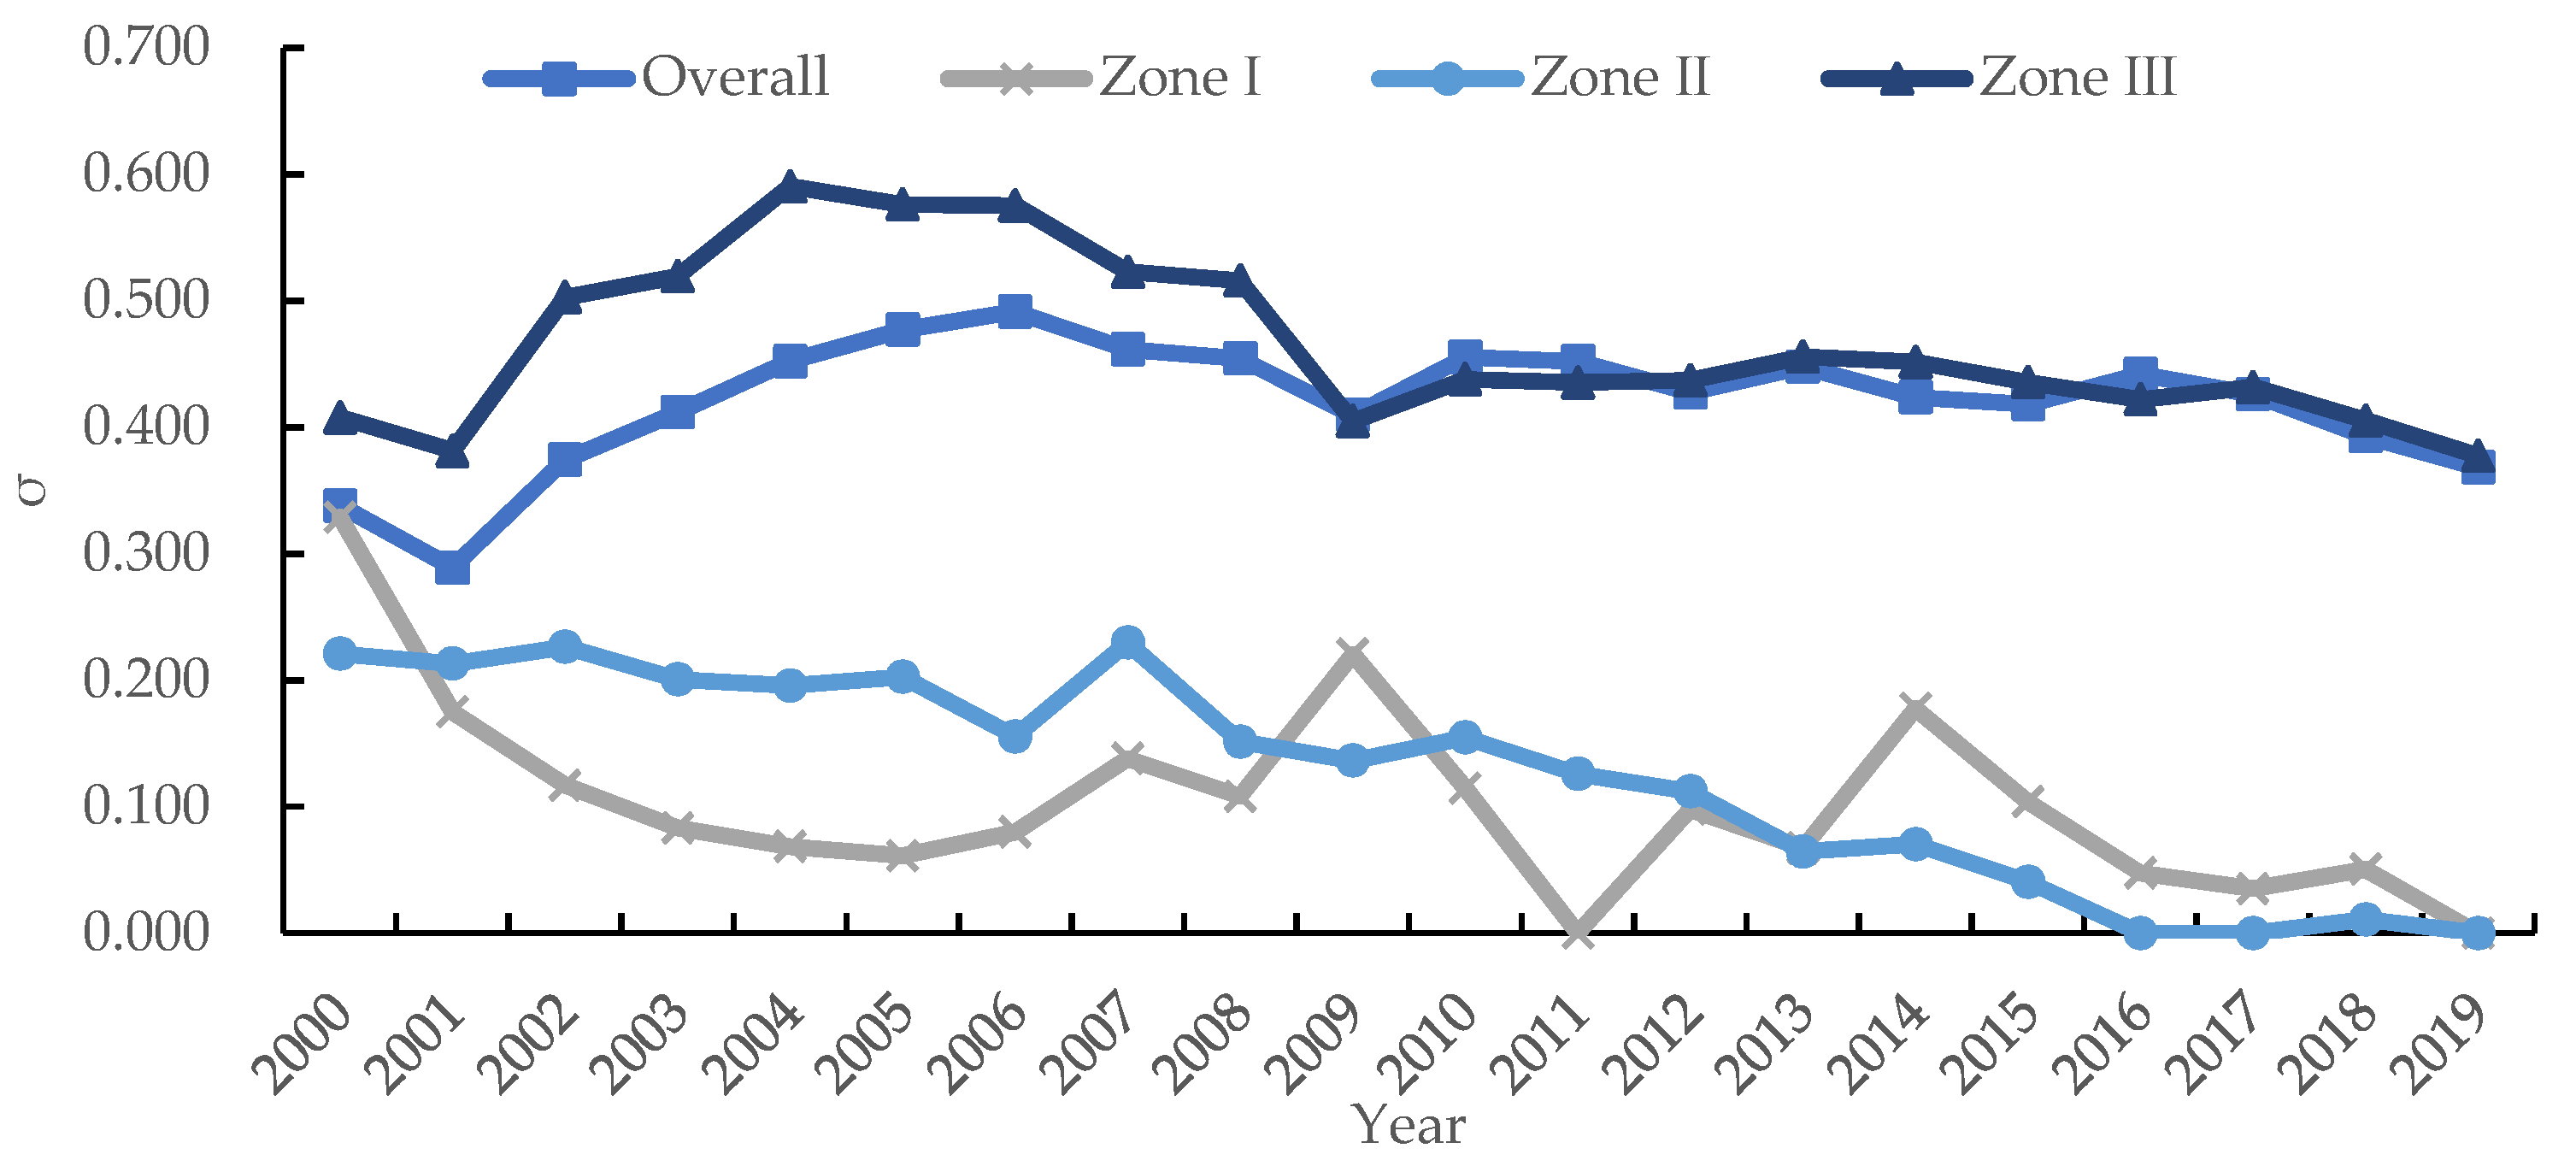
During the study period, the total Theil index of the NCSPC presented a trend of, first, upward, and then downward, manifesting that the regional disparity evolved from expanding to shrinking. From 2011 to 2019, inter-regional disparity took up more of the overall. Specifically, Zone III contributed 50% of the total, being the main component. Over time, the NCSPC showed σ convergence both in the principal grain-producing area and three subregions. As compared with the promising developments in Zones I and II, in Zone III, the NCSPC converged to a low level.
In a comprehensive view, the provincial cropland use showed diverse performance in net carbon sequestration, with a spatial pattern of high in the north and low in the south. Three σ convergence clubs emerged, where the low level of convergence in Region III would maintain without policy intervention. Therefore, the NCSPC should be developed by phase and region according to local conditions. Specifically, in Jiangxi, Hubei, and Hunan, where methane in rice fields occupies an absolute share, it is necessary to develop and introduce rice species with low methane emissions and high yield. In addition, it may make sense to promote the application of low-carbon paddy management suitable for local conditions. Open burning of straw should still be strictly prohibited, meanwhile, straw crushing and returning to the fields, biogas production, and other resourceful disposals, are supposed to be encouraged. Shandong, Henan, and the three provinces in Northeast China have already reached a balance between agricultural economy and low carbon in cropland use, which serve as samples for the other principal grain-producing provinces. By sharing advanced technologies that save land, energy, and fertilizer with emission mitigation and to close provinces, the NCSPC could be improved in a regional concerted manner.

Author Contributions

Conceptualization, H.W.; data curation, J.T. and H.H.; funding acquisition, Y.M.; software, J.T.; writing—original draft, H.W.; writing—review and editing, H.W., W.C. and Y.M. All authors have read and agreed to the published version of the manuscript.

Funding

This research was funded by the Young Scientists Fund of the National Natural Science Foundation of China (71704127), the Sichuan Provincial Social Science Research “13th Five-Year Plan” Project (SC18TJ018).

Data Availability Statement

Not applicable.

Acknowledgments

All the authors are very grateful to the anonymous reviewers and editors for their careful review and critical comments. Additionally, Wu gratefully acknowledges the support from the China Scholarship Council.

Conflicts of Interest

The authors declare no conflict of interest.

References

  1. Li, B.; Zhang, J.B.; Li, H.P. Research on spatial-temporal characteristics and affecting factors decomposition of agricultural carbon emission in China. China Popul. Resour. Environ. 2011, 21, 80–86. [Google Scholar] [CrossRef] [Green Version]
  2. European Commission. Emission Database for Global Atmospheric Research (ED GAR). 2019. Available online: https://edgar.jrc.ec.europa.eu/country_profile/CHN (accessed on 1 July 2021).
  3. Smith, P.; Martino, D.; Cai, Z.; Gwary, D.; Janzen, H.; Kumar, P.; McCarl, B.; Ogle, S.; O’Mara, F.; Rice, C.; et al. Greenhouse gas mitigation in agriculture. Philos. Trans. R. Soc. B Biol. Sci. 2008, 363, 789–813. [Google Scholar] [CrossRef] [Green Version]
  4. Vleeshouwers, L.M.; Verhagen, A. Carbon emission and sequestration by agricultural land use: A model study for Europe. Glob. Chang. Biol. 2010, 8, 519–530. [Google Scholar] [CrossRef]
  5. Wu, H.Y.; Huang, H.J.; Tang, J.; Chen, W.K.; He, Y.Q. Net greenhouse gas emissions from agriculture in China: Estimation, spatial correlation and convergence. Sustainability 2019, 11, 4817. [Google Scholar] [CrossRef] [Green Version]
  6. Smith, P. Carbon sequestration in croplands: The potential in Europe and the global context. Eur. J. Agron. 2004, 20, 229–236. [Google Scholar] [CrossRef]
  7. Zhang, L.G. Evolution of grain production in major grain-producing regions since the founding of New China. Issues Agric. Econ. 2013, 20–26. [Google Scholar] [CrossRef]
  8. Tian, Y.; Zhang, J.B. Regional differentiation research on net carbon effect of agricultural production in China. J. Nat. Resour. 2013, 28, 1298–1309. [Google Scholar] [CrossRef]
  9. Xie, H.; Zhang, Y.; Choi, Y. Measuring the cultivated land use efficiency of the main grain-producing areas in China under the constraints of carbon emissions and agricultural nonpoint source pollution. Sustainability 2018, 10, 1932. [Google Scholar] [CrossRef] [Green Version]
  10. West, T.O.; Marland, G. A synthesis of carbon sequestration, carbon emissions, and net carbon flux in agriculture: Comparing tillage practices in the United States. Agric. Ecosyst. Environ. 2002, 91, 217–232. [Google Scholar] [CrossRef]
  11. Li, C.S.; Xiao, X.M.; Frolking, S. Greenhouse gas emissions from croplands of China. Quat. Sci. 2003, 1, 493–503. [Google Scholar]
  12. Lal, R. Carbon emission from farm operations. Environ. Int. 2004, 30, 981–990. [Google Scholar] [CrossRef] [PubMed]
  13. Belay, B.; Pötzelsberger, E.; Hasenauer, H. The carbon sequestration potential of degraded agricultural land in the Amhara region of Ethiopia. Forests 2018, 9, 470. [Google Scholar] [CrossRef] [Green Version]
  14. Cheng, K.; Pan, G.; Smith, P.; Luo, T.; Li, L.; Zheng, J.; Zhang, X.; Han, X.; Yan, M. Carbon footprint of China’s planting industry-an estimation using agro-statistics data over 1993–2007. Agric. Ecosyst. Environ. 2011, 142, 231–237. [Google Scholar] [CrossRef]
  15. Li, J.J. Research on characteristics and driving factors of agricultural land carbon emission in provinces of minorities in China. China Popul. Resour. Environ. 2012, 22, 42–47. [Google Scholar] [CrossRef]
  16. Ding, B.G.; Yang, S.W.; Zhao, Y. Study on spatio-temporal characteristics and decoupling effect of carbon emission from cultivated land resource utilization in China. China Land Sci. 2019, 22, 45–54. [Google Scholar] [CrossRef]
  17. Li, B.; Liu, X.Q.; Mei, Q.; Wang, K. Study on carbon effects and spatial differences based on changes of agricultural land use in Hubei Province. China Popul. Resour. Environ. 2018, 28, 62–70. [Google Scholar] [CrossRef]
  18. Cheng, K.; Ogle, S.M.; Parton, W.J.; Pan, G. Simulating greenhouse gas mitigation potentials for Chinese Croplands using the DAYCENT ecosystem model. Glob. Chang. Biol. 2013, 20, 948–962. [Google Scholar] [CrossRef]
  19. Song, Z.; Wang, H.; Strong, P.J.; Guo, F. Phytolith carbon sequestration in China’s croplands. Eur. J. Agron. 2014, 53, 10–15. [Google Scholar] [CrossRef]
  20. Cheng, K.; Zheng, J.; Nayak, D.; Smith, P.; Pan, G. Re-evaluating the biophysical and technologically attainable potential of topsoil carbon sequestration in China’s cropland. Soil Use Manag. 2013, 29, 501–509. [Google Scholar] [CrossRef]
  21. Begum, K.; Kuhnert, M.; Yeluripati, J.; Ogle, S.; Parton, W.; Kader, M.A.; Smith, P. Model based regional estimates of soil organic carbon sequestration and greenhouse gas mitigation potentials from rice croplands in Bangladesh. Land 2018, 7, 82. [Google Scholar] [CrossRef] [Green Version]
  22. Sun, J.; Peng, H.; Chen, J.; Wang, X.; Wei, M.; Li, W.; Yang, L.; Zhang, Q.; Wang, W.; Mellouki, A. An estimation of CO2 emission via agricultural crop residue open field burning in China from 1996 to 2013. J. Clean. Prod. 2016, 112, 2625–2631. [Google Scholar] [CrossRef]
  23. Some, S.; Roy, J.; Ghose, A. Non-CO2 emission from cropland based agricultural activities in India: A decomposition analysis and policy link. J. Clean. Prod. 2019, 225, 637–646. [Google Scholar] [CrossRef]
  24. Long, F.; Shen, Y.Q.; Wu, W.G.; Qi, H.B.; Zhu, Z.; Zhang, Z. Measurement and optimum design of carbon sequestration efficiency of regional forestland use process. Trans. Chin. Soc. Agric. Eng. 2013, 29, 251–261. [Google Scholar]
  25. Valade, A.; Bellassen, V.; Magand, C.; Luyssaert, S. Sustaining the sequestration efficiency of the European forest sector. For. Ecol. Manag. 2017, 405, 44–55. [Google Scholar] [CrossRef]
  26. Mizuta, K.; Grunwald, S.; Phillips, M.A.; Moss, C.B.; Cropper, W.P. Sensitivity assessment of metafrontier data envelopment analysis for soil carbon sequestration efficiency. Ecol. Indic. 2021, 125, 107602. [Google Scholar] [CrossRef]
  27. Zhou, P.; Ang, B.W.; Han, J.Y. Total factor carbon emission performance: A Malmquist index analysis. Energy Econ. 2010, 32, 194–201. [Google Scholar] [CrossRef]
  28. Yao, X.; Zhou, H.; Zhang, A.; Li, A. Regional energy efficiency, carbon emission performance and technology gaps in China: A meta-frontier non-radial directional distance function analysis. Energy Policy 2015, 84, 142–154. [Google Scholar] [CrossRef]
  29. Lin, B.; Xu, M. Regional differences on CO2 emission efficiency in metallurgical industry of China. Energy Policy 2018, 120, 302–311. [Google Scholar] [CrossRef]
  30. Zhou, P.; Ang, B.W.; Wang, H. Energy and CO2 emission performance in electricity generation: A non-radial directional distance function approach. Eur. J. Oper. Res. 2012, 221, 625–635. [Google Scholar] [CrossRef]
  31. Yan, D.; Lei, Y.; Li, L.; Song, W. Carbon emission efficiency and spatial clustering analyses in China’s thermal power industry: Evidence from the provincial level. J. Clean. Prod. 2017, 156, 518–527. [Google Scholar] [CrossRef]
  32. Zhang, N.; Wei, X. Dynamic total factor carbon emissions performance changes in the Chinese transportation industry. Appl. Energy 2015, 146, 409–420. [Google Scholar] [CrossRef]
  33. Xue, L.F.; Luo, S.F.; Wu, X.Y. Carbon sequestration efficiency of four forest regions in China: Measurement, driving factors and convergence. J. Nat. Resour. 2016, 31, 1351–1363. [Google Scholar] [CrossRef]
  34. Rao, G.; Su, B.; Li, J.; Wang, Y.; Zhou, Y.; Wang, Z. Carbon sequestration total factor productivity growth and decomposition: A case of the Yangtze River Economic Belt of China. Sustainability 2019, 11, 6809. [Google Scholar] [CrossRef] [Green Version]
  35. Li, B.; Wang, C.Y.; Zhang, J.B. Dynamic evolution and spatial spillover of China’s agricultural net carbon sink. China Popul. Resour. Environ. 2019, 29, 68–76. [Google Scholar] [CrossRef]
  36. Zhang, X.X.; Zheng, S.; Yu, L.H. Green efficiency measurement and spatial spillover effect of China’s marine carbon sequestration fishery. Chin. Rural Econ. 2020, 10, 91–110. [Google Scholar]
  37. Min, J.S.; Hu, H. Calculation of greenhouse gases emission from agricultural production in China. Chin. Popul. Resour. Environ. 2012, 22, 21–27. [Google Scholar] [CrossRef]
  38. Cheng, L.L. Spatial and Temporal Differentiation of China’s Agricultural Carbon Productivity: Mechanism and Demonstration; Huazhong Agricultural University: Wuhan, China, 2018. [Google Scholar]
  39. Xiong, C.; Yang, D.; Huo, J.; Wang, G. Agricultural net carbon effect and agricultural carbon sink compensation mechanism in Hotan Prefecture, China. Pol. J. Environ. Stud. 2017, 26, 365–373. [Google Scholar] [CrossRef]
  40. Yin, Y.Y.; Hao, J.M.; Niu, L.A.; Chen, L. Carbon cycle and carbon efficiency of farmland ecosystems in Quzhou, Hebei Province. Resour. Sci. 2016, 38, 918–928. [Google Scholar] [CrossRef]
  41. PRC National Development and Reform Commission. Guidelines for the Preparation of Provincial Greenhouse Gas Inventories (Trial); PRC National Development and Reform Commission: Beijing, China, 2011. [Google Scholar]
  42. Tone, K. A slacks-based measure of efficiency in data envelopment analysis. Eur. J. Oper. Res. 2001, 130, 498–509. [Google Scholar] [CrossRef] [Green Version]
  43. Pastor, J.T.; Lovell, C.A.K. A global Malmquist Productivity Index. Econ. Lett. 2005, 266–271. [Google Scholar] [CrossRef]
  44. Wang, J.T.; Wang, X.Z.; Gao, F. An estimation on capital assets K in agriculture in all provinces, autonomous regions and four municipalities. J. Agrotech. Econ. 2007, 4, 64–70. [Google Scholar] [CrossRef]
  45. Lin, J.Y. Rural reforms and agricultural growth in China. Am. Econ. Rev. 1992, 82, 34–51. [Google Scholar] [CrossRef]
Figure 1. Study area and regional divisions.
Land 10 00714 g001
Figure 2. Carbon cycle of a cropland use system.
Land 10 00714 g002
Figure 3. Theoretical framework for analyzing the NCSPC.
Land 10 00714 g003
Figure 4. Graphical illustration of NCSPC.
Land 10 00714 g004
Figure 5. Carbon emissions and sequestration of cropland use in the Chinese principal grain-producing provinces from 2000 to 2019.
Land 10 00714 g005
Figure 6. Box plot of the NCSPC in the principal grain-producing area of China from 2000 to 2019.
Land 10 00714 g006
Figure 7. Spatial distribution of the NCSPC in the principal grain-producing area of China in major years.
Land 10 00714 g007
Figure 8. The σ-convergence test for the NCSPC in the principal grain-producing area of China from 2000 to 2019.
Land 10 00714 g008
Table 1. Inventory for measuring the net carbon sequestration of cropland use.
Carbon EffectCategoryCauseFactorData RequiredReference of Equation and Carbon Coefficients
EmissionAgricultural materias① Production, application, and decomposition of agricultural materials bring about carbon emissionsFertilizerConsumption of fertilizerReferences [1,10,14]
PesticideConsumption of pesticide
MulchConsumption of mulch
② Consumption of diesel by machinery leads to carbon emissionsDieselConsumption of diesel fuel in agriculture
③ Fossil fuels consumed for generating electricity in irrigation result in carbon emissions indirectlyIrrigationEffectively irrigated area
Rice fieldsMethanogens in rice fields utilize organic matter from the roots of rice plants to form methaneRice fieldThe planting area of early rice, medium rice, late riceReferences [37,41]
SoilDirect and indirect emissions of nitrous oxide from soil due to fertilizer nitrogen, straw return, atmospheric nitrogen deposition, runoff leaching nitrogen, etc.SoilThe amount of applied nitrogen fertilizer and the yield of various crops, such as rice, wheat, corn, beansReference [41]
Straw burningBurning straw emits carbon dioxide, methane, etc.StrawThe yield of various crops, such as rice, wheat, maize, pulses, vegetablesReference [38]
SequestrationCrop sequestrationCrops absorb carbon dioxide through photosynthesisCropReference [8]
Table 2. Statistical description of the input and output indicators of cropland use systems in Chinese principal grain-producing provinces from 2000 to 2019.
DimensionSpecific IndicatorUnitMeanStd. Dev.MinMax
InputLaborAgricultural employees per unit of croplandCapita∙hm−21.4260.8250.2933.380
CapitalAgricultural capital stocks per unit of cropland104 CNY∙hm−21.3081.1700.0386.660
FertilizerQuantity of applied fertilizer per unit of croplandt∙hm−20.5070.2240.1021.056
MachineAgricultural machinery power per unit of croplandkW∙hm−28.2384.2461.67817.544
IrrigationWater use for irrigation per unit of cropland104 m3∙hm−20.2970.1540.1080.705
OutputOutput valueAgricultural output value per unit of cropland104 CNY∙hm−21.9480.8590.4214.358
Net carbon sequestrationNet carbon sequestration per unit of croplandt∙hm−23.8461.3501.4517.283
Table 3. NCSPC in the 13 Chinese principal grain-producing provinces in major years.
Year20002005201020152019MeanAnnual Change Rate
Hebei0.6280.6520.6500.9171.0000.7592.48%
Inner Mongolia1.0000.8681.0001.0001.0000.9110.00%
Liaoning0.4581.0000.7680.7871.0000.8234.19%
Jilin0.9011.0001.0001.0001.0000.9940.55%
Heilongjiang1.0001.0001.0001.0001.0000.9940.00%
Jiangsu1.0000.8930.8051.0001.0000.9540.00%
Henan1.0001.0000.9461.0001.0000.9640.00%
Shandong1.0001.0000.8141.0001.0000.9720.00%
Hubei1.0000.6260.4030.4580.4510.563−4.10%
Hunan0.3390.2390.2340.2670.3330.266−0.10%
Jiangxi1.0000.2560.3120.3840.5060.420−3.52%
Anhui1.0000.6840.5270.6380.5640.655−2.97%
Sichuan1.0000.9580.6760.6790.8430.784−0.89%
Overall0.8710.7830.7030.7790.8230.774−0.30%
Table 4. Theil index values of NCSPC in the principal grain-producing area of China from 2000 to 2019.
YearTotal Theil IndexInter-RegionalIntra-Regional
Theil indexContributionTheil IndexContributionRegion IRegion IIRegion III
20000.0400.0000.8%0.03999.2%36.4%19.3%43.5%
20010.0300.0000.6%0.03099.4%17.0%25.0%57.4%
20020.0440.0048.9%0.04091.1%5.3%19.0%66.8%
20030.0550.01221.2%0.04378.8%2.3%12.7%63.8%
20040.0620.01218.6%0.05081.4%1.4%10.2%69.8%
20050.0690.02231.9%0.04768.1%0.9%9.1%58.2%
20060.0730.02737.4%0.04662.6%1.4%5.2%56.0%
20070.0730.02533.7%0.04866.3%4.0%10.7%51.6%
20080.0710.02535.9%0.04564.1%2.8%5.2%56.0%
20090.0640.02742.4%0.03757.6%12.4%4.7%40.5%
20100.0740.04156.1%0.03243.9%2.6%5.0%36.3%
20110.0730.04358.8%0.03041.2%0.0%3.2%38.0%
20120.0670.03248.1%0.03551.9%2.3%3.0%46.5%
20130.0710.03752.4%0.03447.6%1.0%1.0%45.6%
20140.0650.02842.5%0.03757.5%7.6%1.3%48.7%
20150.0620.03150.4%0.03149.6%2.7%0.4%46.5%
20160.0690.04361.6%0.02738.4%0.5%0.0%37.9%
20170.0650.03655.1%0.02944.9%0.3%0.0%44.6%
20180.0560.03052.9%0.02747.1%0.7%0.0%46.3%
20190.0510.02853.8%0.02446.2%0.0%0.0%46.2%
Mean0.0620.02538.1%0.03761.9%5.1%6.8%50.0%
Publisher’s Note: MDPI stays neutral with regard to jurisdictional claims in published maps and institutional affiliations.

