Article

Assessment and Spatial-Temporal Evolution Analysis of Urban Land Use Efficiency under Green Development Orientation: Case of the Yangtze River Delta Urban Agglomerations

1
Department of Accounting and Corporate Finance, Business School, Sichuan University, Chengdu 610064, China
2
Department of Investment, School of Finance and Economics, Jimei University, Xiamen 361021, China
3
Department of Investment, School of Management Science and Engineering, Central University of Finance and Economics, Beijing 102206, China
4
Department of Finance, School of Finance and Economics, Jimei University, Xiamen 361021, China
*
Author to whom correspondence should be addressed.
Land 2021, 10(7), 715; https://doi.org/10.3390/land10070715
Submission received: 21 June 2021 / Revised: 4 July 2021 / Accepted: 5 July 2021 / Published: 6 July 2021

Abstract

:
Rapid urbanization has provided a strong impetus for the economic growth of China, but it has also caused many problems such as inefficient urban land use and environmental pollution. With the popularization of the concept of green and sustainable development, the Environmental-Social-Governance (ESG) assessment concept is widely accepted. The government and residents are paying more and more attention to environmental issues in urban development, and environmental protection has formed an important part of urban development. In this context, this study takes 26 cities in the Yangtze River Delta as examples to build an evaluation system for urban land-use efficiency under green development orientation. The evaluation system takes into account the inputs of land, capital, labor, and energy factors in the process of urban development. Based on emphasizing economic output, the social benefits and undesired outputs brought about by urban development are taken into account. This paper measures urban land use efficiency by the super-efficiency SBM model, and on this basis, analyses the spatial-temporal evolution characteristics of urban land-use efficiency. Further, this paper measures urban land use efficiency without considering undesired outputs and compares the two evaluation methods. Again, the comparison illustrates the rationality of urban land use efficiency evaluation system under green development orientation.

1. Introduction

In recent years, the whole world has been in a rapid wave of urbanization [1]. In the long term, this wave of urbanization still has strong growth potential. According to United Nations data [2], by 2050, about 70% of the world’s population will live in urban. Compared with population urbanization, urban land expansion is more rapid, about twice as fast as population growth [3]. Moreover, in the coming decades, urban expansion will be mainly concentrated in developing countries [4].
As the largest developing country in the world, China has made remarkable achievements in the process of urbanization in the past decades. In 1987, the urbanization rate was only 17.90%, but reached 58.52% in 2017, with an average annual growth rate of 1.04% far exceeding the average level of the world in the same period [5]. With the continuous advancement of urbanization, urban construction land, which is a basic element of urban development, is also growing rapidly [6]. By 2017, it had reached 55,155.5 square kilometers [7]. At the same time, energy consumption and industrial pollutant emission also increased sharply [8,9]. Such high input, high consumption, and high emission economic development mode also lead to low urban land-use efficiency, serious energy waste, and great pressure on the ecological environment, which is not conducive to the sustainable development of China’s social economy [10,11]. Moreover, industrial pollution also frequently causes many malignant events, causing huge economic losses and adversely affecting social stability [12]. Therefore, to achieve sustainable development of the national social economy and land management, it is very important to improve urban land-use efficiency [13].
A key to improving urban land-use efficiency is to adopt effective evaluation methods [14]. According to different research purposes and methods, there are great differences in current evaluation methods of urban land-use efficiency. The easiest way is to uses the gross regional product generated by each unit of land used [15]. This single input-output orientation ignores the fact that land use is a complex social economic-natural environment system [16], and its application scope is narrow. Many studies measure urban land-use efficiency through index evaluation systems [17], but the selection of indexes is difficult to be widely recognized due to strong subjectivity. Nowadays, more and more studies regard urban land as one of the input factors and believe that urban land-use efficiency is the ratio of various input combinations including urban land to economic output [18,19]. In addition, as the concept of environmental protection gets more and more attention, the negative effects of pollutant emissions are taken into consideration while the economic benefits have been paid attention [1,9]. Regrettably, there are few kinds of literature that include energy input and social output, and there is no concept of coordinated development that takes into account economy, society, and ecology, which does not meet the requirements of China’s current green development strategy.
Essentially, green development means reducing resource input and pollution emissions without reducing output, increase the effective supply of public goods. At the same time, the effective supply of public goods should be increased, environmental governance and protection should be strengthened, and residents’ demands for environmental quality and quality of life should be met to the best of their ability, to increase the well-being of urban residents and realize the comprehensive, coordinated and sustainable development of economy, society and ecological environment [20]. It can be seen that under the concept of green development, the ecological environment is the basis of development, social output (benefit) is the goal of development, and economic output (benefit) is the premise of development. Based on the concept of green development, we based on the related research that urban land use efficiency is to point to in certain natural and social conditions, considering expected output, such as economic benefit, social benefit, and damage to the ecological environment of the unexpected output combination with land inputs as the core of a variety of elements into the combined ratio.
The Yangtze River Delta urban agglomeration is an important intersection of “The Belt and Road” and the Yangtze River Economic Belt. It has a pivotal strategic position in the overall situation of the national modernization construction and all-around opening-up pattern. It has superior natural endowment and geographical advantages, and the urbanization degree ranks among the top in China [21]. At the same time, the Yangtze River Delta city group also faces many problems. Relative to the population, public service provision is seriously inadequate, urban functions are weak, the overall quality of urban development is not high, urban sprawl is serious, land-use efficiency is low, ecological space is gradually eroded, and environmental quality tends to deteriorate [21]. This situation seriously restricts the sustainable development of the Yangtze River Delta urban agglomeration and will also affect the smooth implementation of the national strategy. However, at present, there is still no perfect evaluation system of urban land-use efficiency to comprehensively reflect the urban land-use efficiency of the Yangtze River Delta urban agglomeration, which provides an obstacle to further study on the influencing factors of urban land-use efficiency. The imperfect evaluation system may also draw wrong conclusions, lead to misjudgment for policymaking, and have a negative impact on urban development.
Accordingly, this paper uses panel data of 26 cities in the Yangtze River Delta urban agglomeration from 2003–2017 to construct a land-use efficiency (LUE) evaluation system from the perspective of urban development with land, capital, labor, energy, and social output as input factors, and environmental pollutants as product factors. This paper uses the global super slacks-based measure (SBM) model to measure the LUE scores and analyzes the spatio-temporal evolution characteristics of LUE on this basis. Then, the global reference Malmquist index and decomposition index are calculated, and the reasons for the variation of LUE are analyzed. Finally, the convergence model is used to analyze the convergence of the urban land-use efficiency of the cities in the Yangtze River Delta urban agglomeration. Possible contributions of this paper are as follows: (1) Based on the theory of green development, this paper constructs a more comprehensive evaluation system of urban land-use efficiency, which can more accurately measure urban land-use efficiency and provide a reference for the study of urban land-use efficiency and the design of statistical index system; (2) the SBM model with overall reference is used to make up for the problem that the urban land-use efficiency calculated in previous studies is not compared vertically by other institutes, so that the urban land-use efficiency calculated in this paper has a broader application space; (3) by analyzing the development status and spatial characteristics of the urban use efficiency in the Yangtze River Delta urban agglomeration, it can help identify the bottlenecks and obstacles of urban land use and promote the healthy and sustainable development of urban land use.
The structure of the rest of this study is as follows: the second part gives a detailed description of the data and methods used in this study; the third part gives the results of the empirical analysis; the fourth part discusses the results and future research; the fifth part concludes and puts forward policy suggestions.

2. Data and Methodology

2.1. Research Area and Data

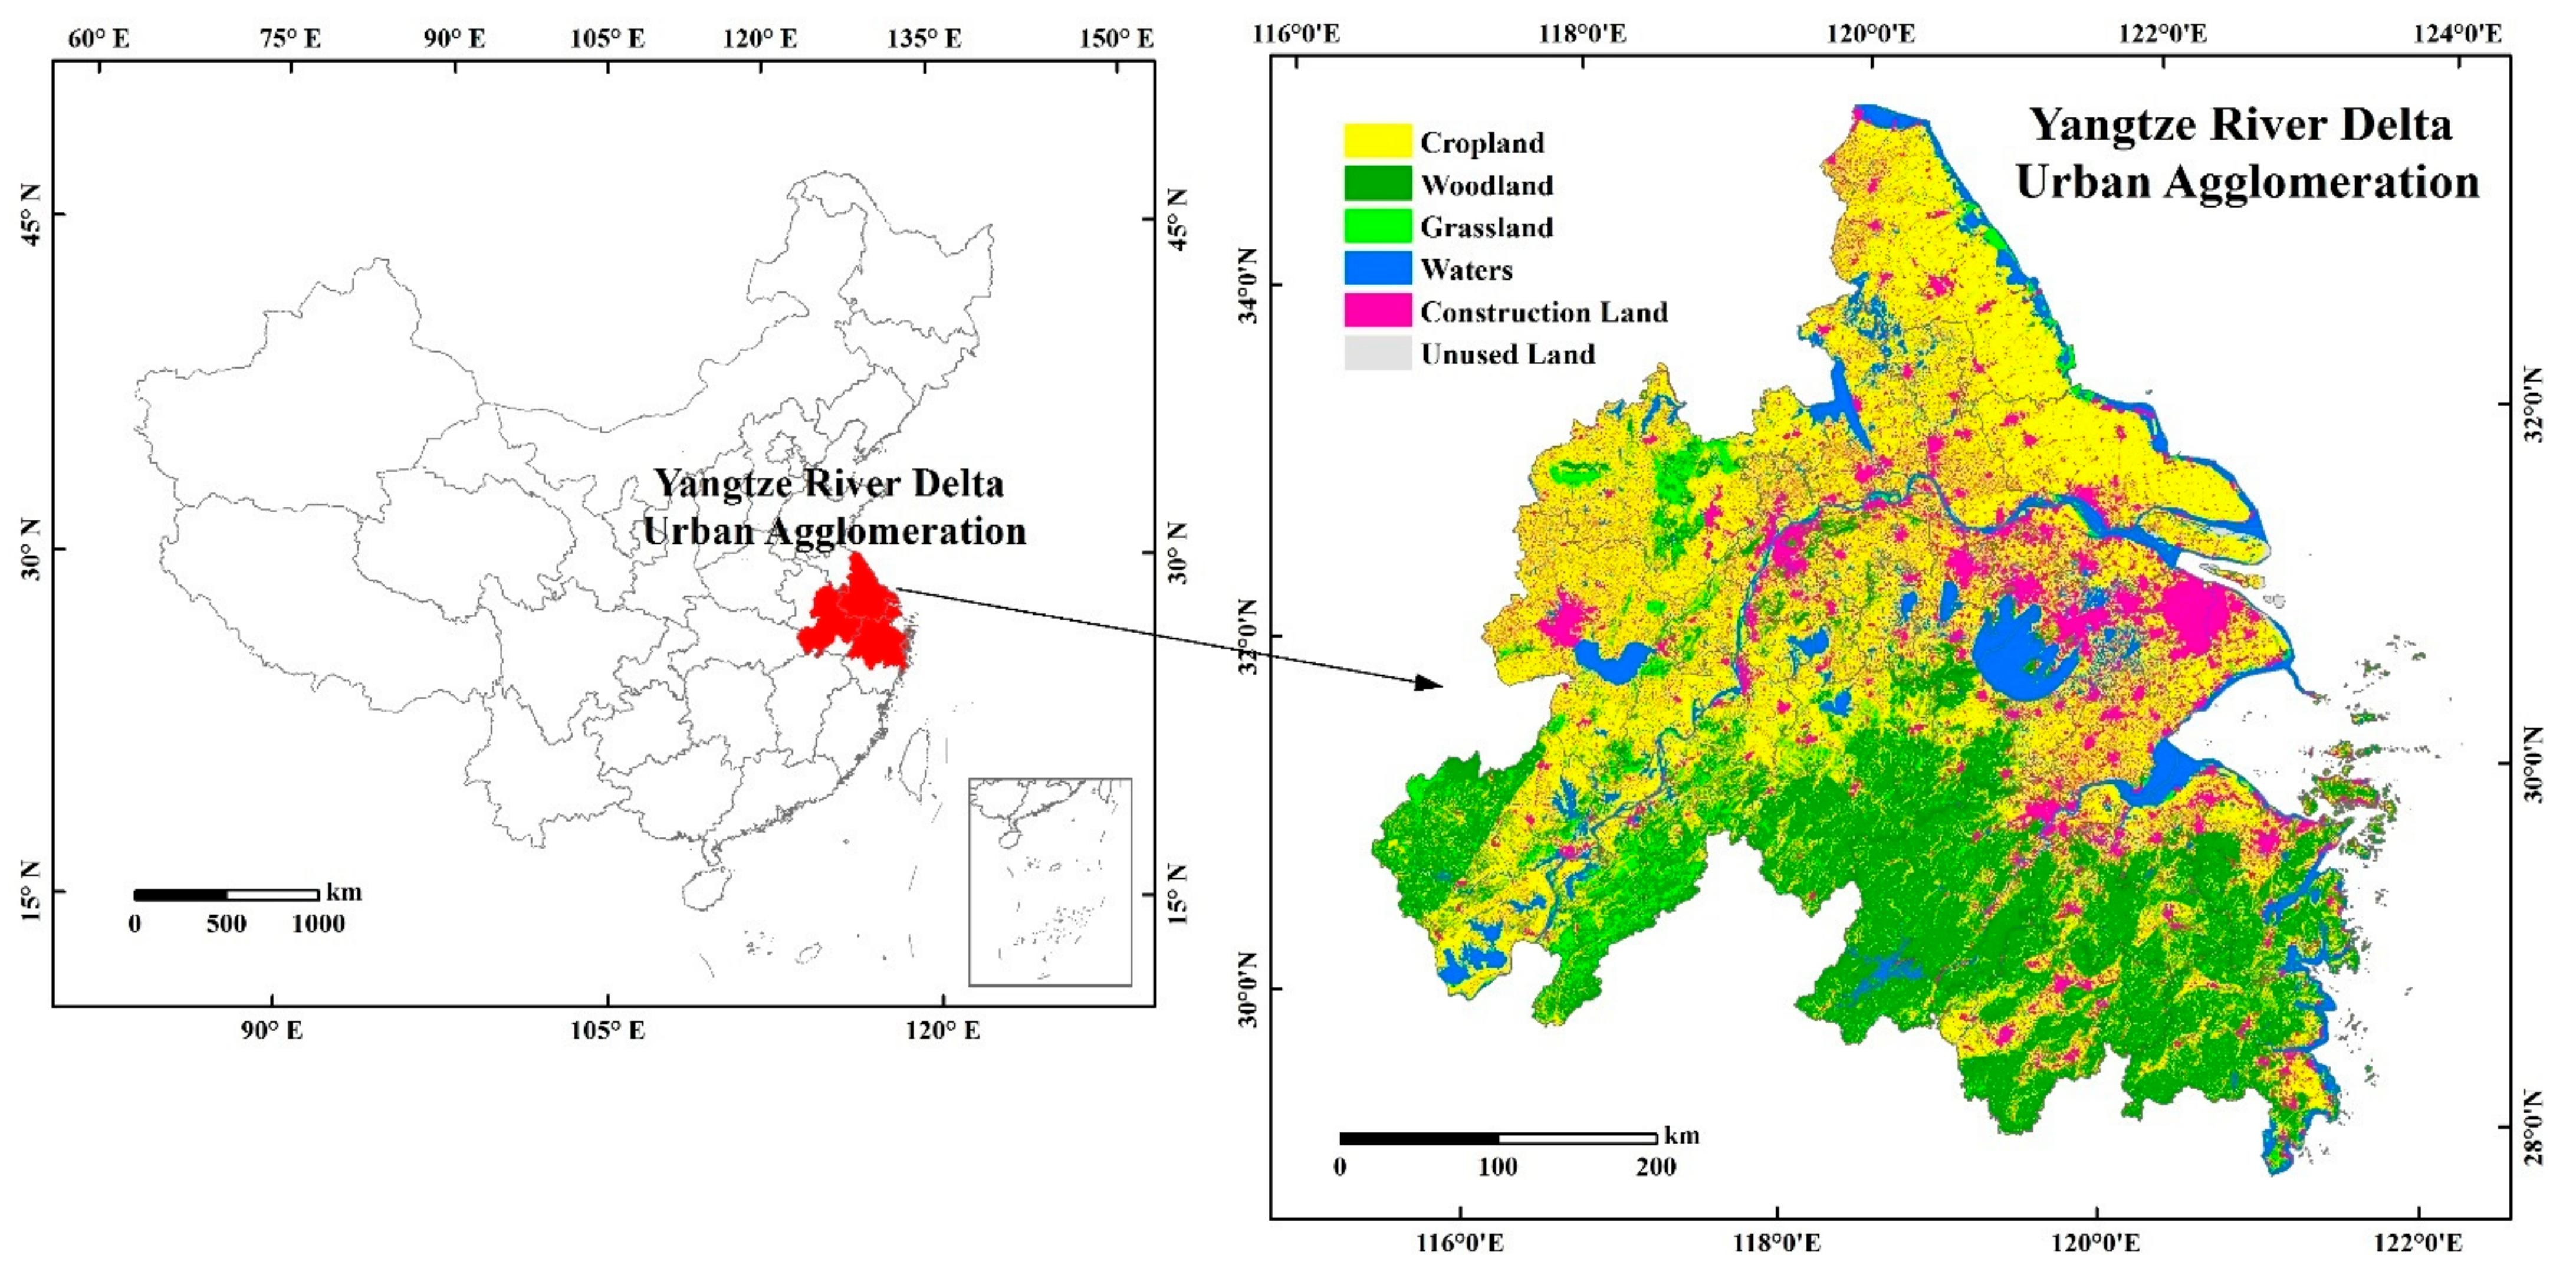
2.1.1. Research Area

The Yangtze River Delta Urban Agglomeration is located in the east coast of China, between 115°46′–123°25′ E, 29°20′–32°34′ N, bordering the Yellow Sea and the East China Sea (see Figure 1). It is an alluvial plain formed before the Yangtze River enters the sea. The region has a mild climate, abundant rainfall, mainly subtropical monsoon climate. With superior geographical conditions and a sound economic foundation, the Yangtze River Delta urban agglomeration has developed into one of the six major urban agglomerations in the world, with the highest degree and system of urbanization in China, and plays an extremely important role in the process of China’s economic and social development [22,23]. With Shanghai as the center, the Yangtze River Delta Urban Agglomeration covers parts of Jiangsu, Zhejiang, and Anhui provinces, covering a total of 26 cities (see Table 1), with a land area of 211,700 square kilometers, accounting for 2.2% of the national land area. In 2014, the regional GDP reached 12.67 trillion yuan and the total population was 150 million. They account for 18.5% and 11.0% respectively in China [21]. However, rapid economic development has brought great pressure to the local ecological environment, and the emission of pollutants in the process of economic development has caused damage to the environment. At the same time, the continuous expansion of cities poses a threat to the ecological land and agricultural land around cities, and the inefficient use of land further increases the contradiction of land use and gradually restricts the development of cities. Therefore, it is of great significance to study the urban land-use efficiency of each city in the Yangtze River Delta urban agglomeration to improve the urban land-use efficiency of the Yangtze River Delta urban agglomeration and promote the healthy development of each city.

2.1.2. Indicator Selection and Data Source

As mentioned above, we believe that urban land use efficiency refers to the ratio of the combination of expected outputs such as economic benefits and social benefits and non-expected outputs for ecological environmental damage and the combination of multiple input factors with land factor input as the core under certain natural and social conditions. From the definition, the measurement of urban land use efficiency involves the input and output of various factors. In the traditional production function, labor and capital are usually used as input factors, but the input of land resources is ignored. Land is the carrier of human social and economic activities, so it is a common practice to include land into input factors to measure urban land use efficiency. This ignores the importance of energy in production. Jorgenson et al. [24] for the first time included energy as a factor of production into the production function and proposed the famous KLEM model. Learn from his model, we believe that input consists of four elements: labor, capital, land, and energy. According to the definition, the output mix consists of three parts: economic output, social output, and undesired output. To accurately measure urban land-use efficiency, all output and input variables are considered in the data available in this study. The specific indicators are as follows:
Economic output: We use the real GDP of secondary and tertiary industries in municipal districts to measure economic output (based on the prices in 2003). In this article, we assume that the municipal districts are actually not the first industry, while there is no secondary and tertiary industry in non-built areas. However, since the secondary and tertiary industries are mainly concentrated in urban areas, even if there is measurement error and the error is acceptable [19].
Social output: social output is a multi-dimensional index and should also be a concept of aggregate. To comprehensively and accurately measure social output, we select indicators from five aspects of urban wages, education, medical care, transportation, and environment, and then use these five indicators to build a comprehensive index to measure social output. The specific calculation method is included in the Appendix. The five indicators are the total wages of employees on the job, the number of full-time teachers in municipal districts, the number of doctors in municipal districts, the actual urban road area and green area in municipal districts at the end of the year, and the green area covered in built-up areas.
Undesired outputs: We select pollutant emissions as the undesired outputs. Considering the lack of pollutant emission data at the city level, according to the research of Yun et al. and Xie et al. [1,9]. As social output, we synthesize three indicators into a comprehensive index, which are: industrial wastewater discharge, industrial smoke discharge, and industrial sulfur dioxide discharge.
Land input: we use the area of urban construction land to measure land input.
Capital input: capital is a stock concept, so we use the perpetual inventory method to calculate the annual capital stock. The calculation formula is shown in Equation (1) [25].
R D K t = ( 1 δ ) R D K t 1 + E t
where RDKt is the capital stock in the year t, E is the investment in fixed assets of the whole society, and δ is the depreciation rate. The capital stock in 2003 is the sum of the total social capital investment in 2003 divided by the depreciation rate and the average growth rate of the total social fixed asset investment from 2003 to 2008, and the depreciation rate is 9.6% [25]. All social fixed asset investment is converted to the value calculated at 2003 prices, by using the fixed asset price index.
Labor input: Considering that urban areas are dominated by the secondary and tertiary industries, we use the number of employees in the secondary and tertiary industries to measure the labor input.
Energy input: According to the research of Wang and Pang [26], and considering the availability of data, we use the power supply of the whole society in the municipal district to measure the energy input.
All the data are from China City Statistical Yearbook 2004–2018, and some missing data are supplemented by local statistical yearbook, government bulletin, or interpolation method. Details of all variables are shown in Table 2.

2.2. Methodology

2.2.1. Global Super-SBM Model

Since Charnes et al. [27] proposed the DEA model for the first time in 1978, DEA has been widely used in efficiency evaluation in various fields because it does not require prior knowledge of production function but only needs to use real data and can combine multiple inputs with multiple outputs [28]. However, the traditional DEA also has some shortcomings. First, the slack variables are not taken into account, resulting in a large efficiency value. Second, when there are multiple effective decision-making units, efficiency cannot be further distinguished. Third, undesired outputs are not taken into account; Fourth, the measured efficiencies cannot be compared across time. Tone [29] introduced slacks into the objective function and combined them with the super-efficiency model to put forward the super efficiency SBM model considering the undesired output, which perfectly solved the first three shortcomings, but the fourth problem still exists. Later, Huang et al. [30] proposed an SBM model considering global reference, super efficiency, and undesired output simultaneously, which combined the advantages of the original model and solved the problem that the efficiency value could not be compared across time. Therefore, this paper uses this model to measure urban land-use efficiency, and the specific construction method is as follows [30]:
Suppose there are N decision units (DAUs) with three elements: input, expected output, and non-expected output, and the observation period is t = 1…Where the o (o = 1…, N). The input-output variables of DMUO are respectively represented by three vectors: xitRm, y j t g R S 1 , and y i t b R S 2 , where m, S1, and S2 represent the quantities of three types of elements respectively. Therefore, in the SBM model with non-expected output, the super efficiency of DMUO in period t can be obtained by solving the following program, as shown in Equation (2) [30].
ρ o t * = m i n 1 + 1 m k = 1 m s k o t x b o t 1 1 S 1 + S 2 ( r = 1 S 1 S r o l g y r a l g + r = 1 S 2 S r o t b y r a t b ) x o t j = 1 ( j 0 i f t = 1 ) N t = 1 T λ j z x j z + S o t 0 j = ( j 0 i f t = 1 ) N t = 1 T λ j t y j t g y o t g + s o t g 0 y o t b j = 1 ( j 0 i f t = 1 ) N τ = 1 T λ j t y j z b + S o t b 0 1 1 S 1 + S 2 ( r = 1 S 1 S r o t g y r o t g + r = 1 S 2 S r o t b y r o t b ) ε λ o t , S o t , S o t g , S o t b 0
where S o t , S o t g , and S o t b respectively represent the relaxation variables corresponding to input, expected output, and non-expected output; ε is a non-Archimedean infinitesimal. Equation (2) can be transformed into linear programming by using the Charnes–Cooper transformation, and then the super efficiency score ρ* it of each period can be obtained, namely the urban land-use efficiency of each city in each year [31]. Based on the classification of Yao and Zhang, this paper divides efficiency values into four categories as shown in Table 3 [19].

2.2.2. Global Malmquist Index

Malmquist index, combined with the DEA model, can measure the efficiency change of DUM, and giving the reason of efficiency change can be found by decomposition. However, the traditional Malmquist index has the potential problem of unsolved linear programming, and it is not cyclic and transitive. Pastor and Lovell [32] proposed a Malmquist index based on a global production technology set, which can effectively avoid the defect of linear programming without solution and the phenomenon of “technology regression” and which also has transitivity. The calculation method is as follows.
First, we construct the common reference set of each period, as shown in Equation (3).
S g = S 1 X 1 , Y 1 S 2 X 2 , Y 2 S p X p , Y p
where S is the reference set, S g is the common reference set, X is the input variable, Y is the output variable, and p is the number of sets of the reference set at different times. Since each period refers to the same front, a single Malmquist index can be calculated, as shown in the Equation (4).
M x k + 1 , y k + 1 , x k , y k = E g x k + 1 , y k + 1 E g x k , y k
E is the distance function, k is the time variable, and M is the Malmquist index under the common reference set. When the Malmquist index is greater than 1, it means that the urban land use efficiency increases from t year to t + 1 year. When the Malmquist index is less than 1, it means that the urban land use efficiency decreases from t year to t + 1 year. Based on Equation (4), the Malmquist index can be decomposed into efficiency change (EC) and technical change (TC); further, efficiency change can be decomposed into pure efficiency change (PEC) and scale efficiency improvement (SEC) [33]. We only write a simple expression of their decomposition as shown in Equation (5).
M = E C × T C = P E C × S E C × T C
where, PEC represents the change of pure technical efficiency; greater than 1 means the improvement of technology application level and resource allocation efficiency; less than 1 means the regression of technology application; SEC represents the change of scale efficiency, greater than 1 means the improvement of reasonable allocation of input and output factors, and scale optimization; less than 1 means the unreasonable allocation of resources. TC represents technological change, greater than 1 represents technological progress, and less than 1 represents technological retreat.

2.2.3. Convergence Model

To reveal whether the gap of urban land use efficiency in the Yangtze River Delta urban agglomeration will narrow with time, we use the convergence model to analyze. There are three common convergence models: σ convergence, absolute β convergence, and conditional β convergence [34].

σ Convergence

The convergence of σ reflects the difference in urban land-use efficiency deviating from the overall average level in different regions. According to the change of its time series, the dynamic process of this gap can be known. When this difference becomes smaller and smaller, we believe that there is a convergence of regional urban land use efficiency. The calculation formula is shown in Equation (6).
σ t = 1 n i = 1 n ( ln e f f i t 1 n i = 1 n ln e f f i t ) 2 ,
where σ t represents the convergence index σ of the year t; ln e f f i , t represents the natural logarithm value of the urban land i use efficiency of the year t; n represents the total number of cities. When σ t + 1 < σ t , it is believed that the urban land-use efficiency in year t + 1 is more convergent than that in year t; otherwise, it is believed that the urban land-use efficiency in year t + 1 is more divergent than that in year t.

Absolute β Convergence

Absolute β convergence means that no matter what the initial value of the urban land-use efficiency of each city is, eventually, the urban land-use efficiency of each city will reach the exact same steady growth rate and growth level. That is, when the urban land-use efficiency of a city is low, its urban land use efficiency will have a higher growth rate than that of a city with a higher urban land use efficiency. Both absolute β convergence and σ convergence belong to absolute convergence, and absolute β convergence is a necessary and not sufficient condition for σ convergence [34,35]. To verify the existence of absolute β convergence, we perform regression on Equation (7) [34].
g i , t = ln e f f i , t + T / e f f i , t / T = α + β ln e f f i , t + ε i , t ,
where g i , t is the annual average growth rate of urban land-use efficiency of the city i from year t to year t + T ; ln e f f i , t is the natural logarithm value of urban land-use efficiency of the city i in the initial year t; ln e f f i , t + T is the natural logarithm value of urban land-use efficiency of the city i in the final year t + T ; T is the time span; α is the constant term; β is the regression coefficient; ε is the random error term. We use the least-squares estimator (OLS), and absolute β convergence is indicated when the regression coefficient β is significantly negative.

Conditional β Convergence

Different from the absolute β convergence, the conditional β convergence takes into account that different cities have their own characteristics and conditions, so the urban land-use efficiency of each city will approach its own steady-state level, which is related to its own characteristics and conditions. In other words, absolute β convergence means that the urban land-use efficiency of each city will tend to the same steady level, that is, the urban land-use efficiency of each city will eventually be the same. The convergence of condition β means that the urban land-use efficiency of each city will tend to its own steady-state level, that is, the urban land-use efficiency of each city will eventually be stable, but the gap between them will persist. To verify the existence of conditional β convergence, we perform regression on Equation (8) [36].
d ( ln e f f i , t ) = ln e f f i , t ln e f f i , t 1 = α + β ln e f f i , t 1 + ε i , t
where ln e f f i , t is the natural logarithm value of urban land use efficiency in the i-city t year; α is a constant term; β is a regression coefficient; ε is a random error term. We use the fixed-effect model of panel data for estimation. By setting the fixed effect of section and time, we take into account the different steady-state levels in different regions and the change of the steady-state value in each region with time, so there is no need to add additional control variables [36]. Absolute β convergence is indicated when the regression coefficient β is significantly negative.

3. Results

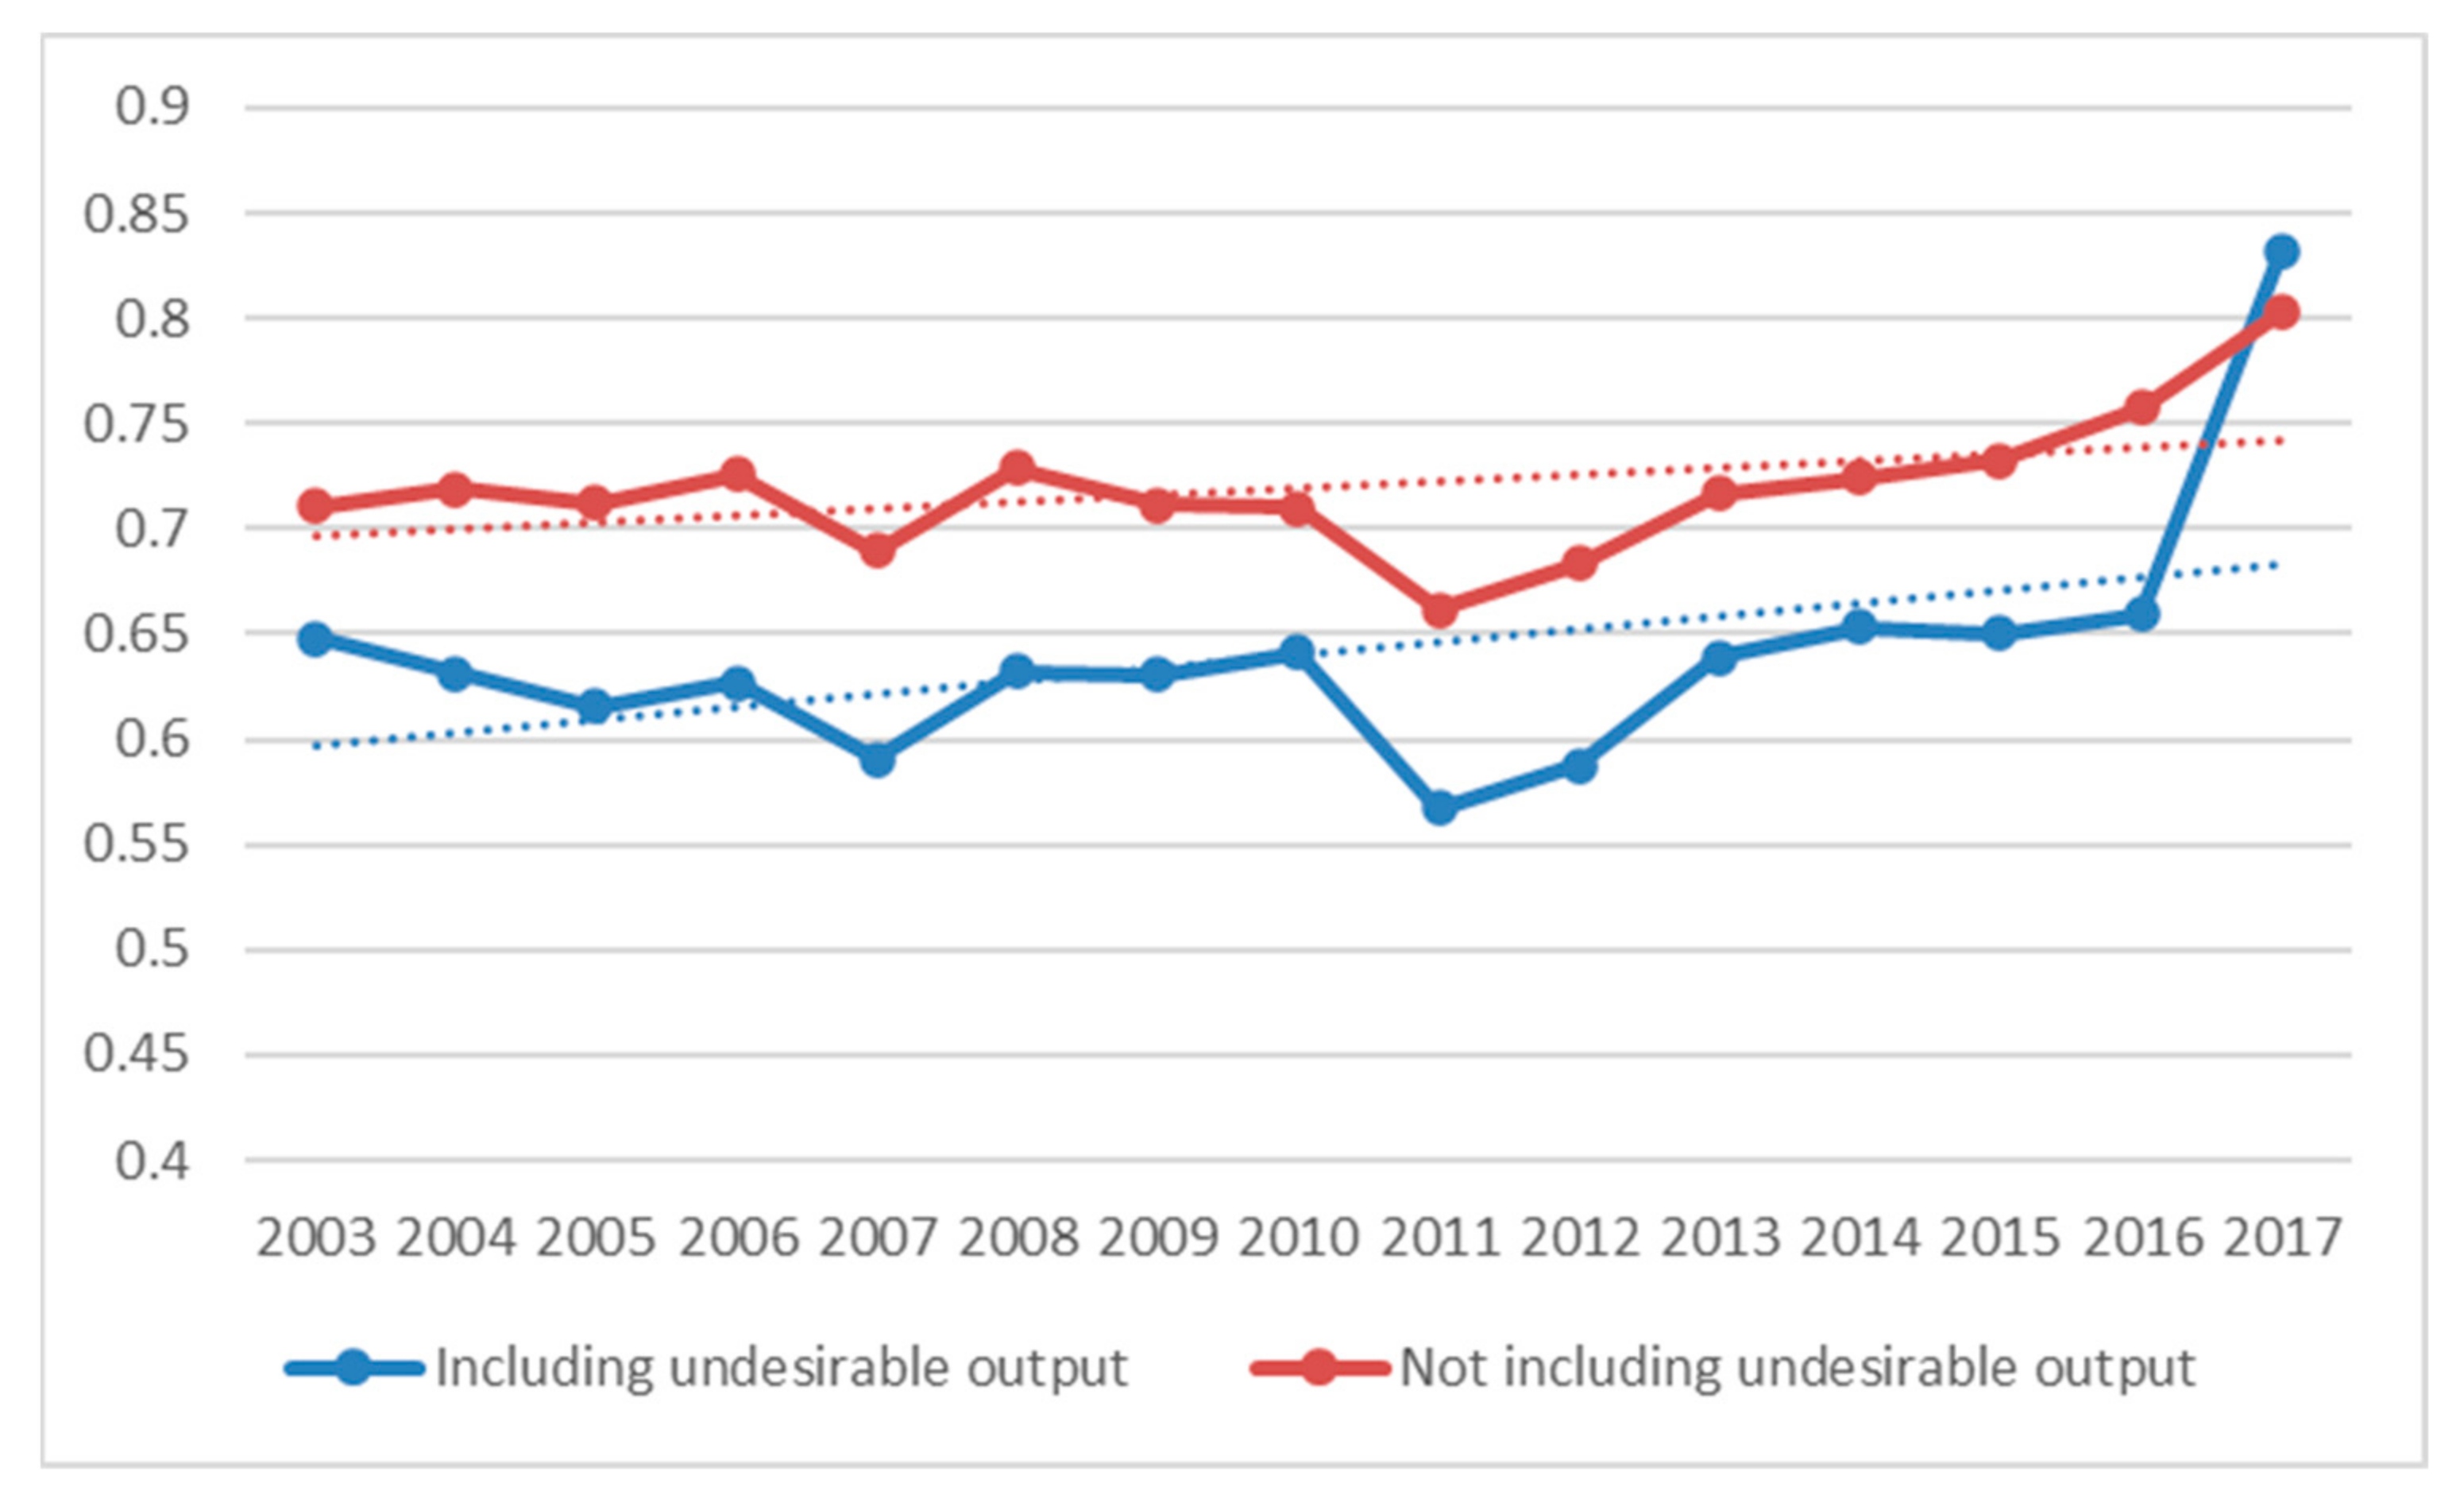
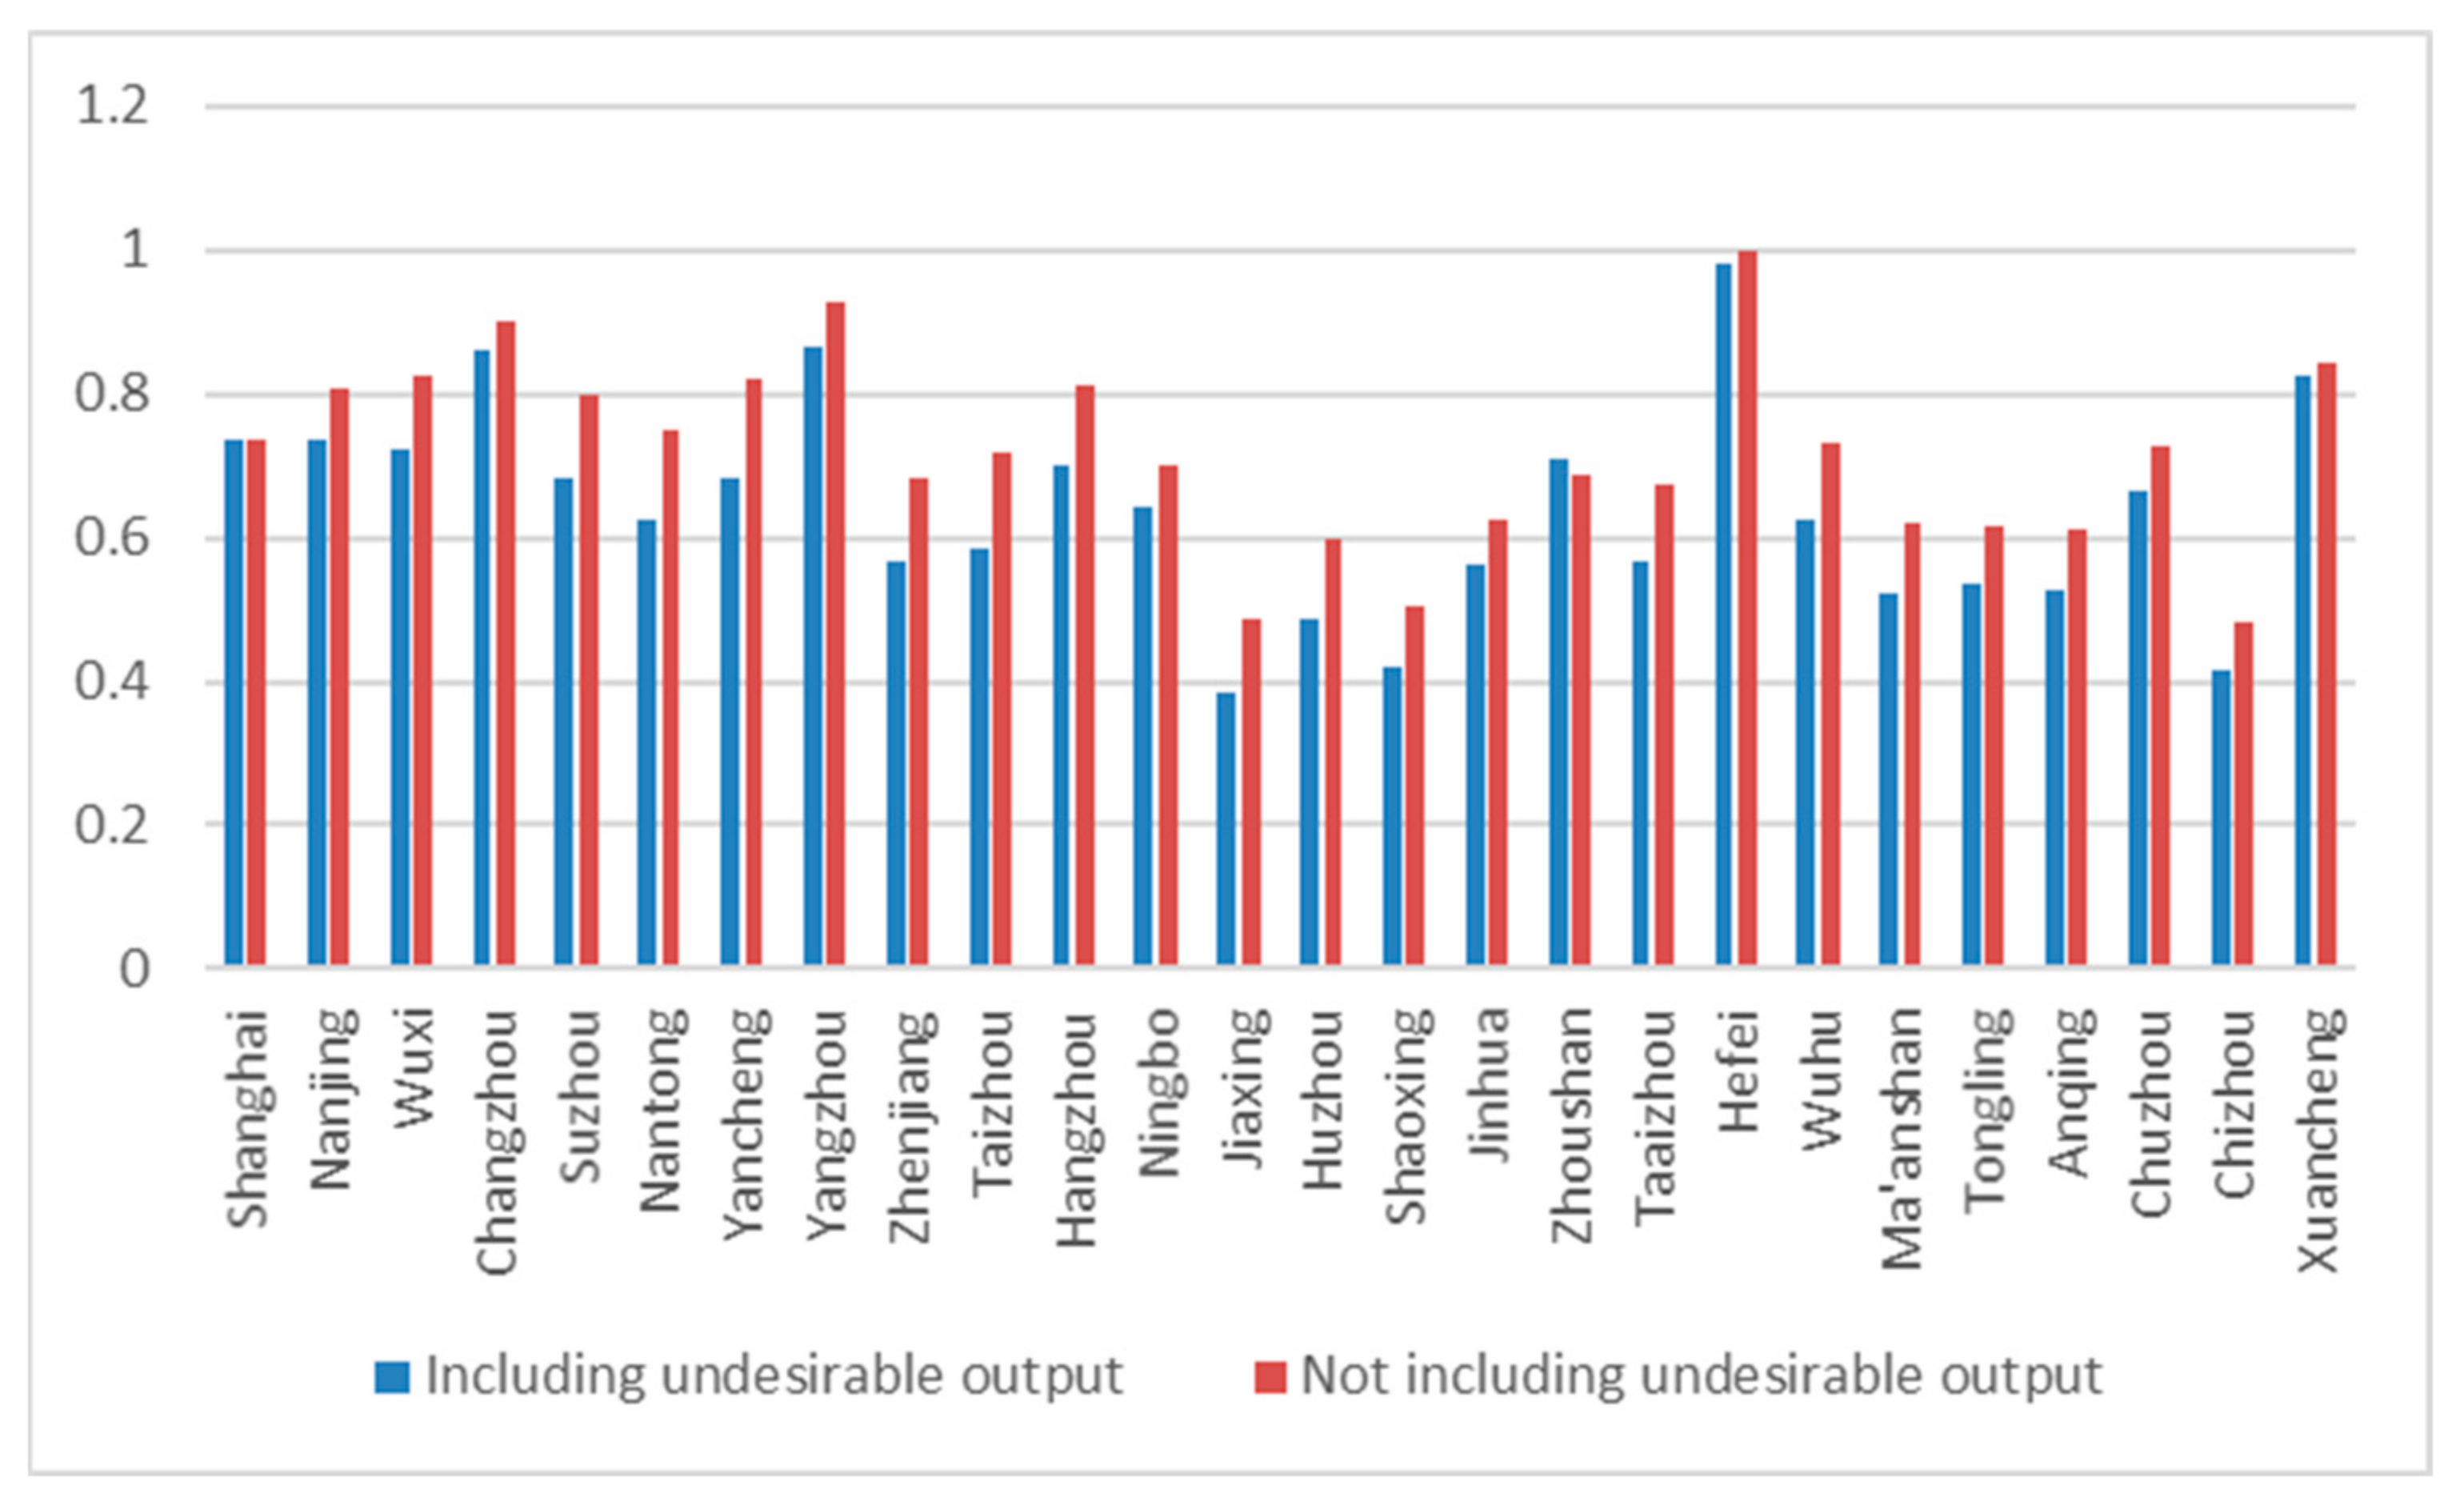
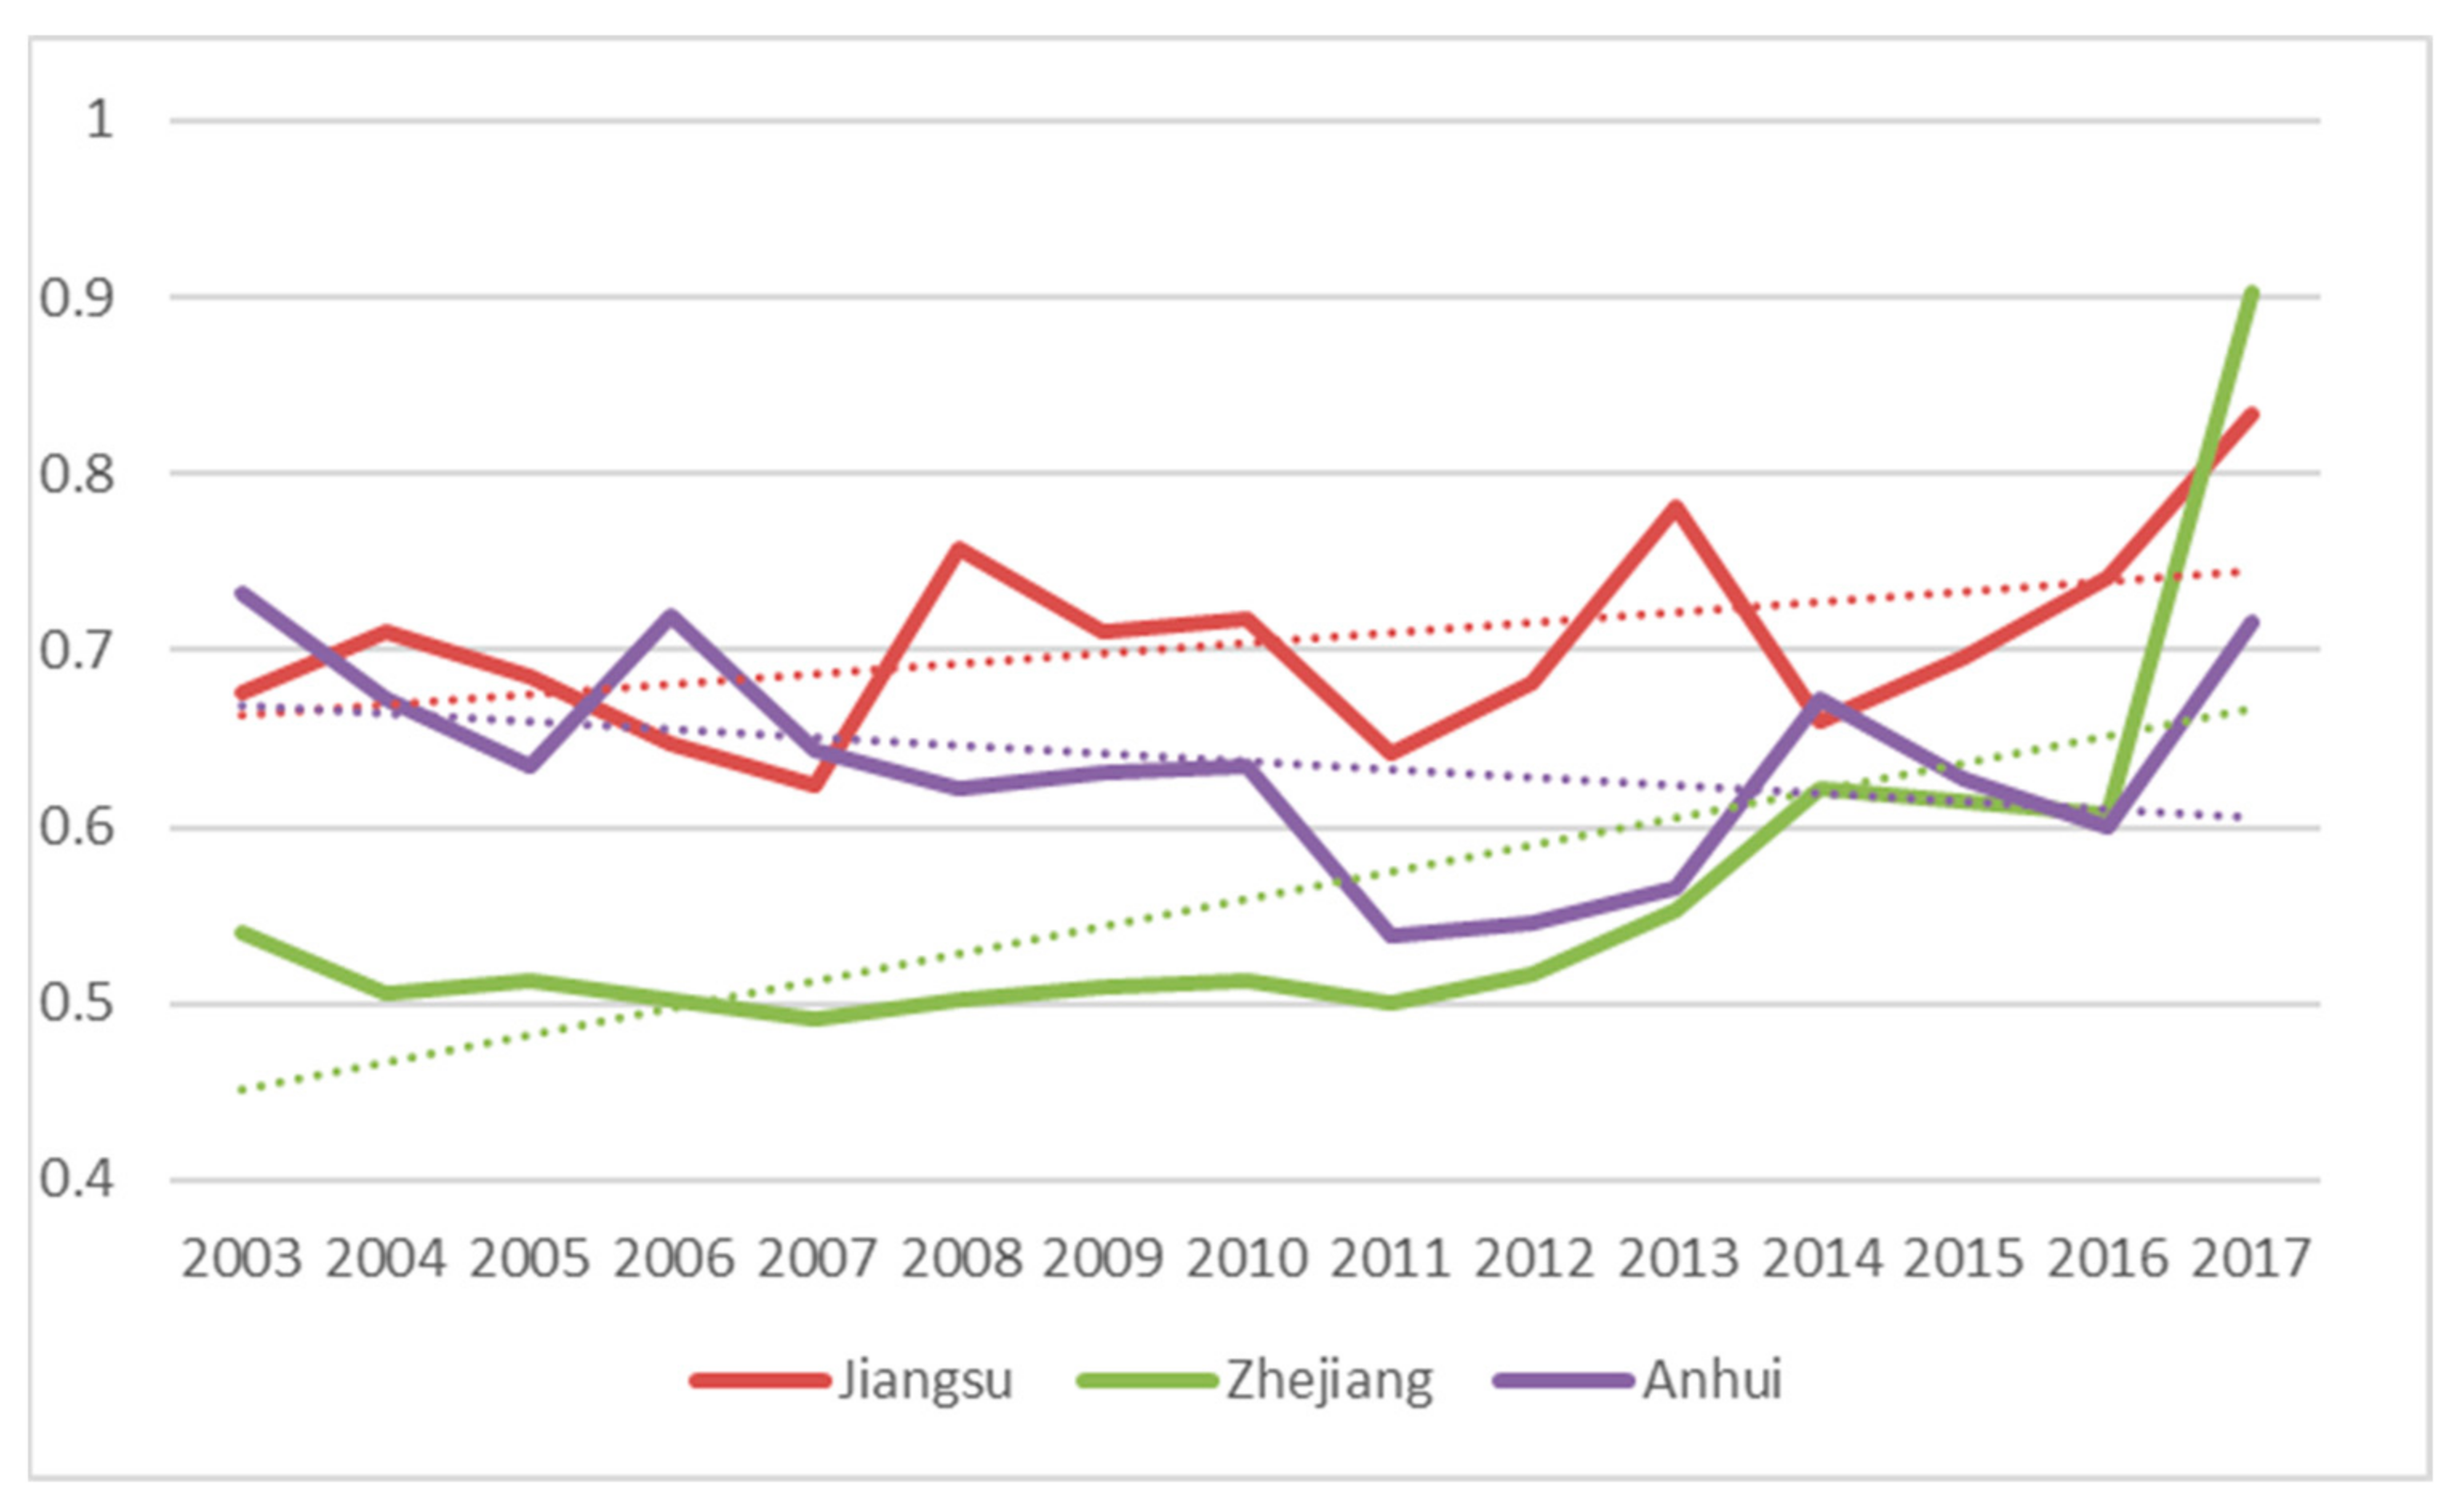
3.1. Results of Urban Land Use Efficiency

We used Max-DEA software to calculate the urban land-use efficiency of each city. For convenience of comparison, we also calculated the urban land use efficiency without considering the non-expected output. Figure 2 shows the average value of urban land use efficiency over the years.
As can be seen from Figure 2, the urban land use- efficiency has been in a state of fluctuation from 2003 to 2011. From 2011 to 2017, urban land use- efficiency increased rapidly and showed a trend of continuous growth. Among them, the urban land use- efficiency without considering the undesired outputs and the urban land use- efficiency considering the expected outputs have extremely similar development trajectories, and the urban land-use efficiency considering the undesired outputs is generally lower than the urban land use efficiency without considering the undesired outputs.
As shown in Figure 3, most cities are still at a low level from the perspective of each city, in which Hefei, Yangzhou, Changzhou, and Xuancheng have the best performance in urban land-use efficiency. Even without considering the non-expected output, these four cities still have the best performance. Moreover, the urban land use- efficiency without considering the undesirable outputs is always higher than the urban land use- efficiency without considering the undesirable outputs, which is consistent with the above results. In addition, undesired outputs also have an impact on the city ranking of urban land-use efficiency, which indicates that undesired outputs will affect the accuracy of the evaluation results of urban land-use efficiency.
Figure 4 shows the average value of urban land use- efficiency in different regions. It can be seen that the level of urban land use- efficiency in Jiangsu Province is higher, followed by Anhui Province and Zhejiang Province. From the perspective of time trend, the urban land use-efficiency of Jiangsu Province shows a zigzag rising trend, and the growth rate is low. The urban land use-efficiency of Anhui Province showed a downward trend from 2003 to 2011, and began to rise again from 2011 to 2017, but it still decreased overall. The urban land use- efficiency of Zhejiang Province had a low starting point and remained stable during 2003–2011, but increased rapidly during 2011–2017, with the latter ranking the top and surpassing the other two provinces in 2017. It also shows that the growth of urban land use- efficiency in the Yangtze River Delta urban agglomeration mainly comes from the growth of urban land use- efficiency in Zhejiang Province.

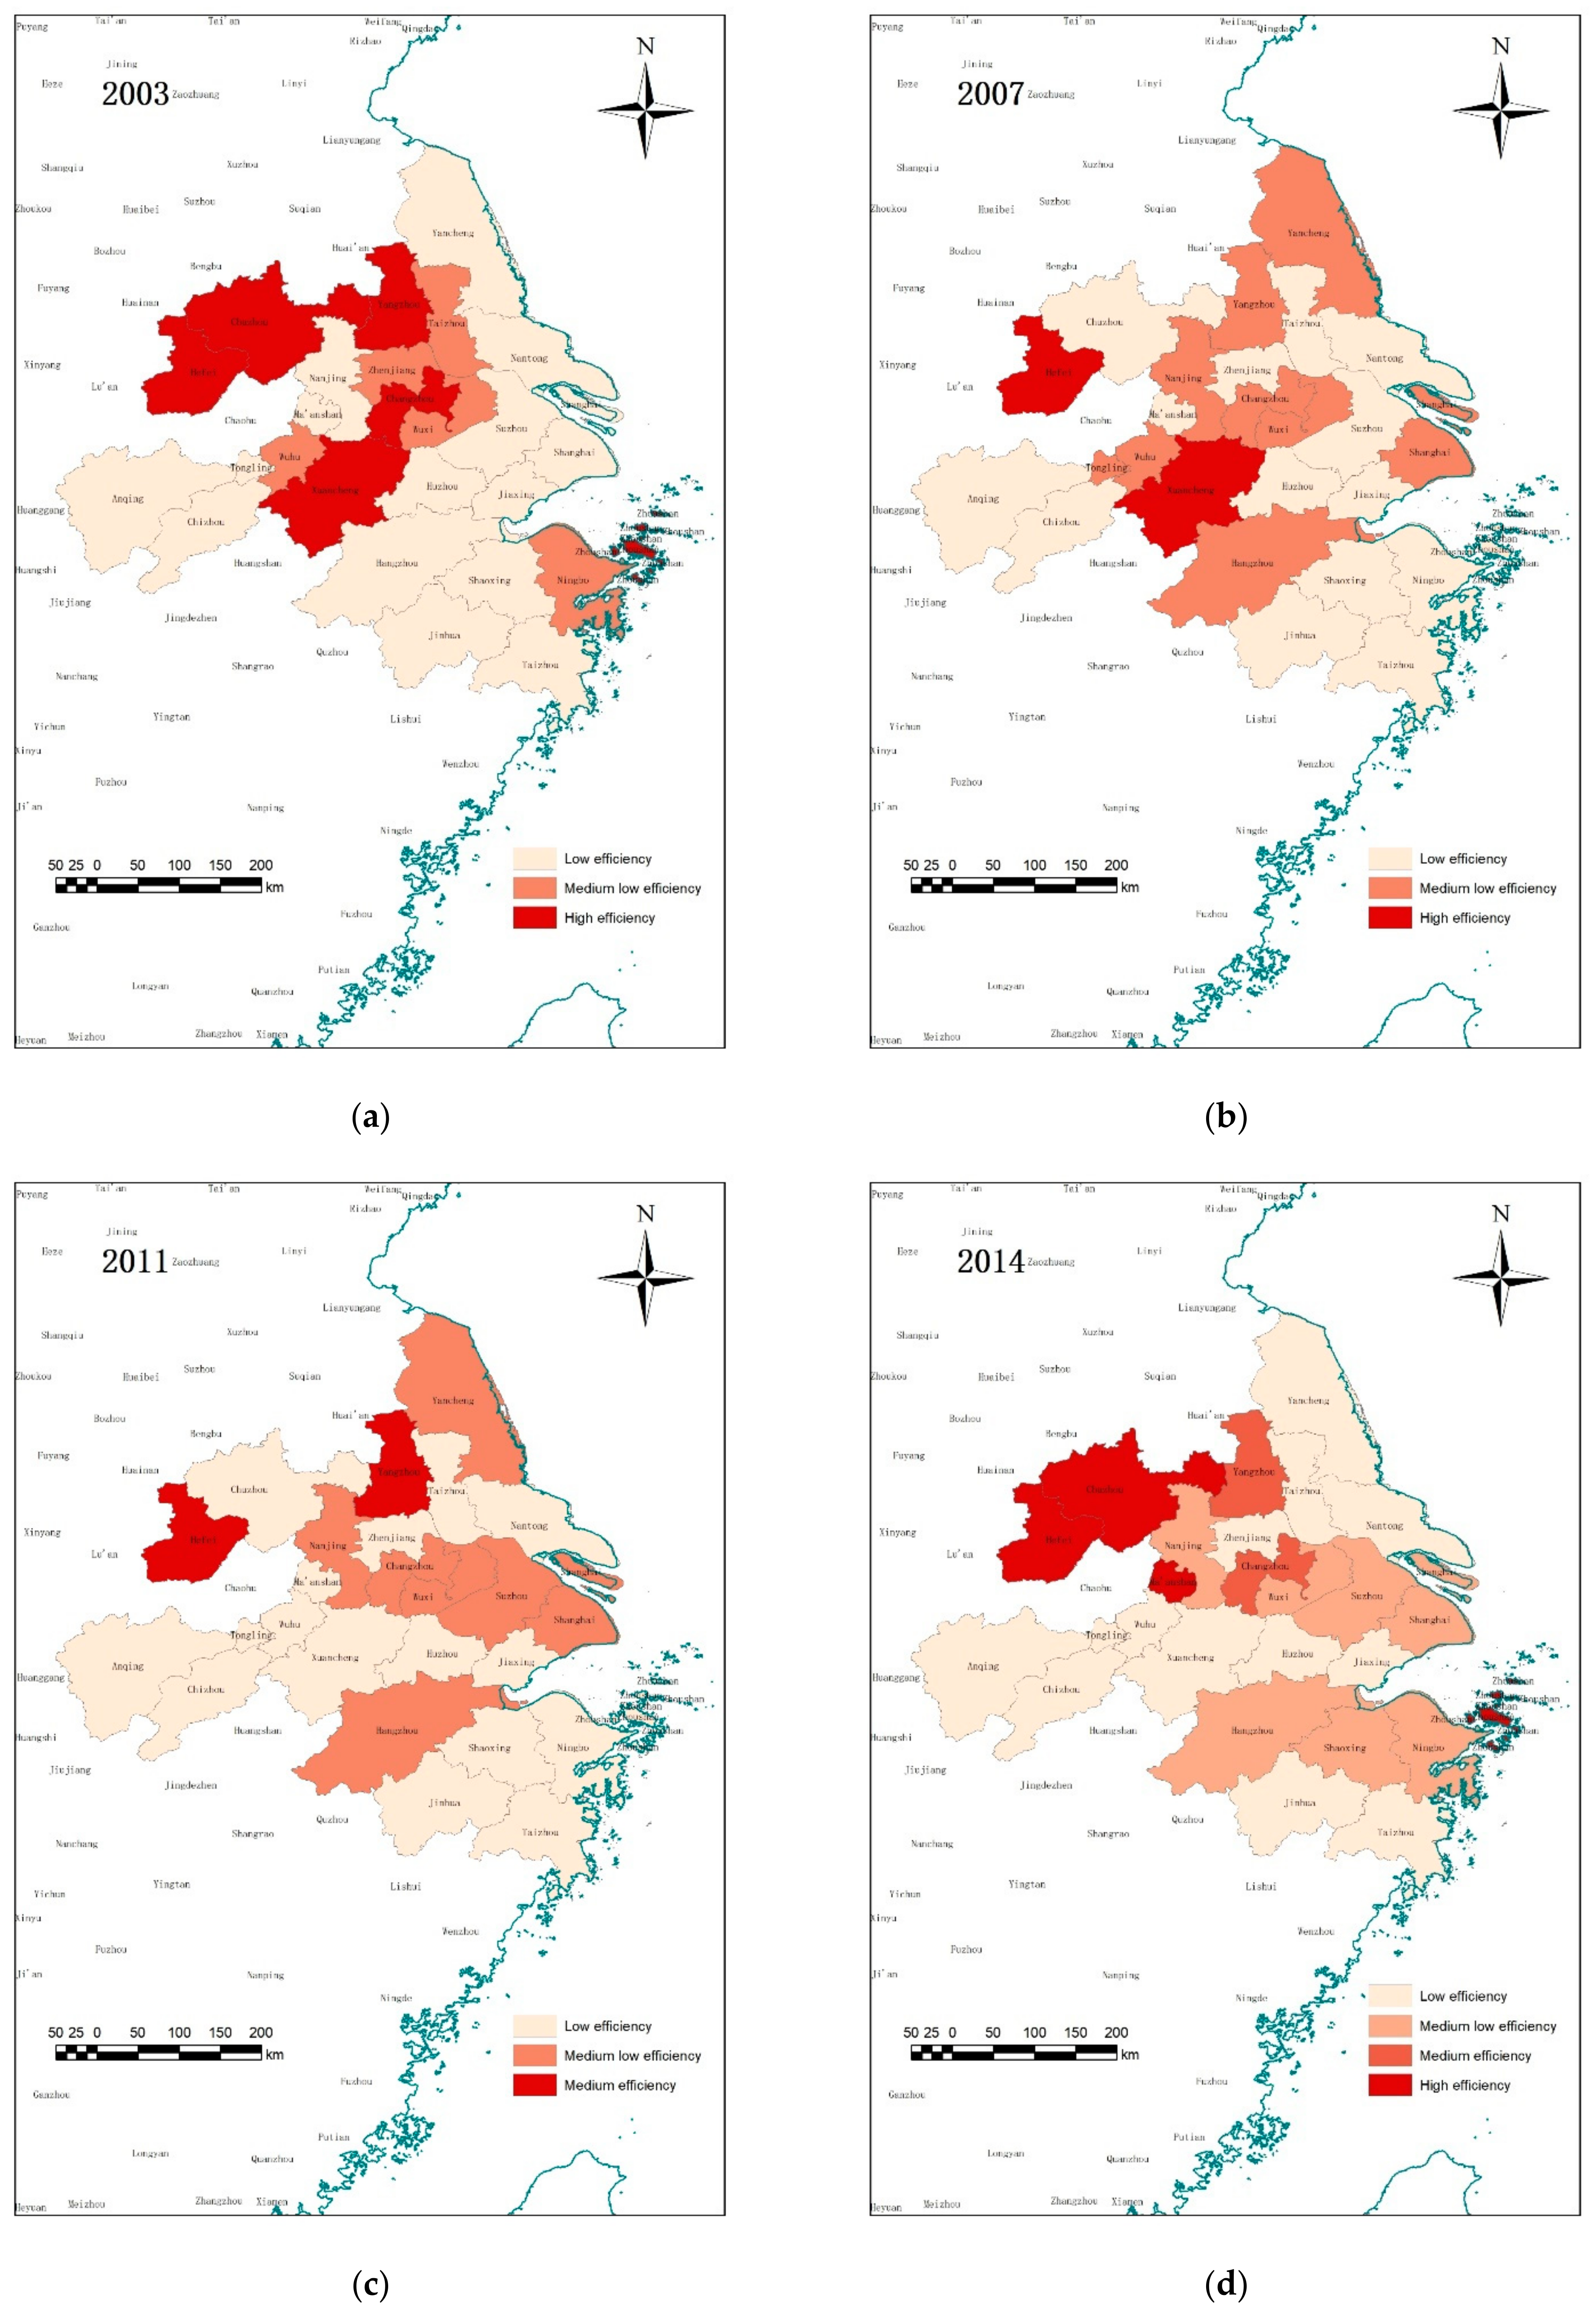
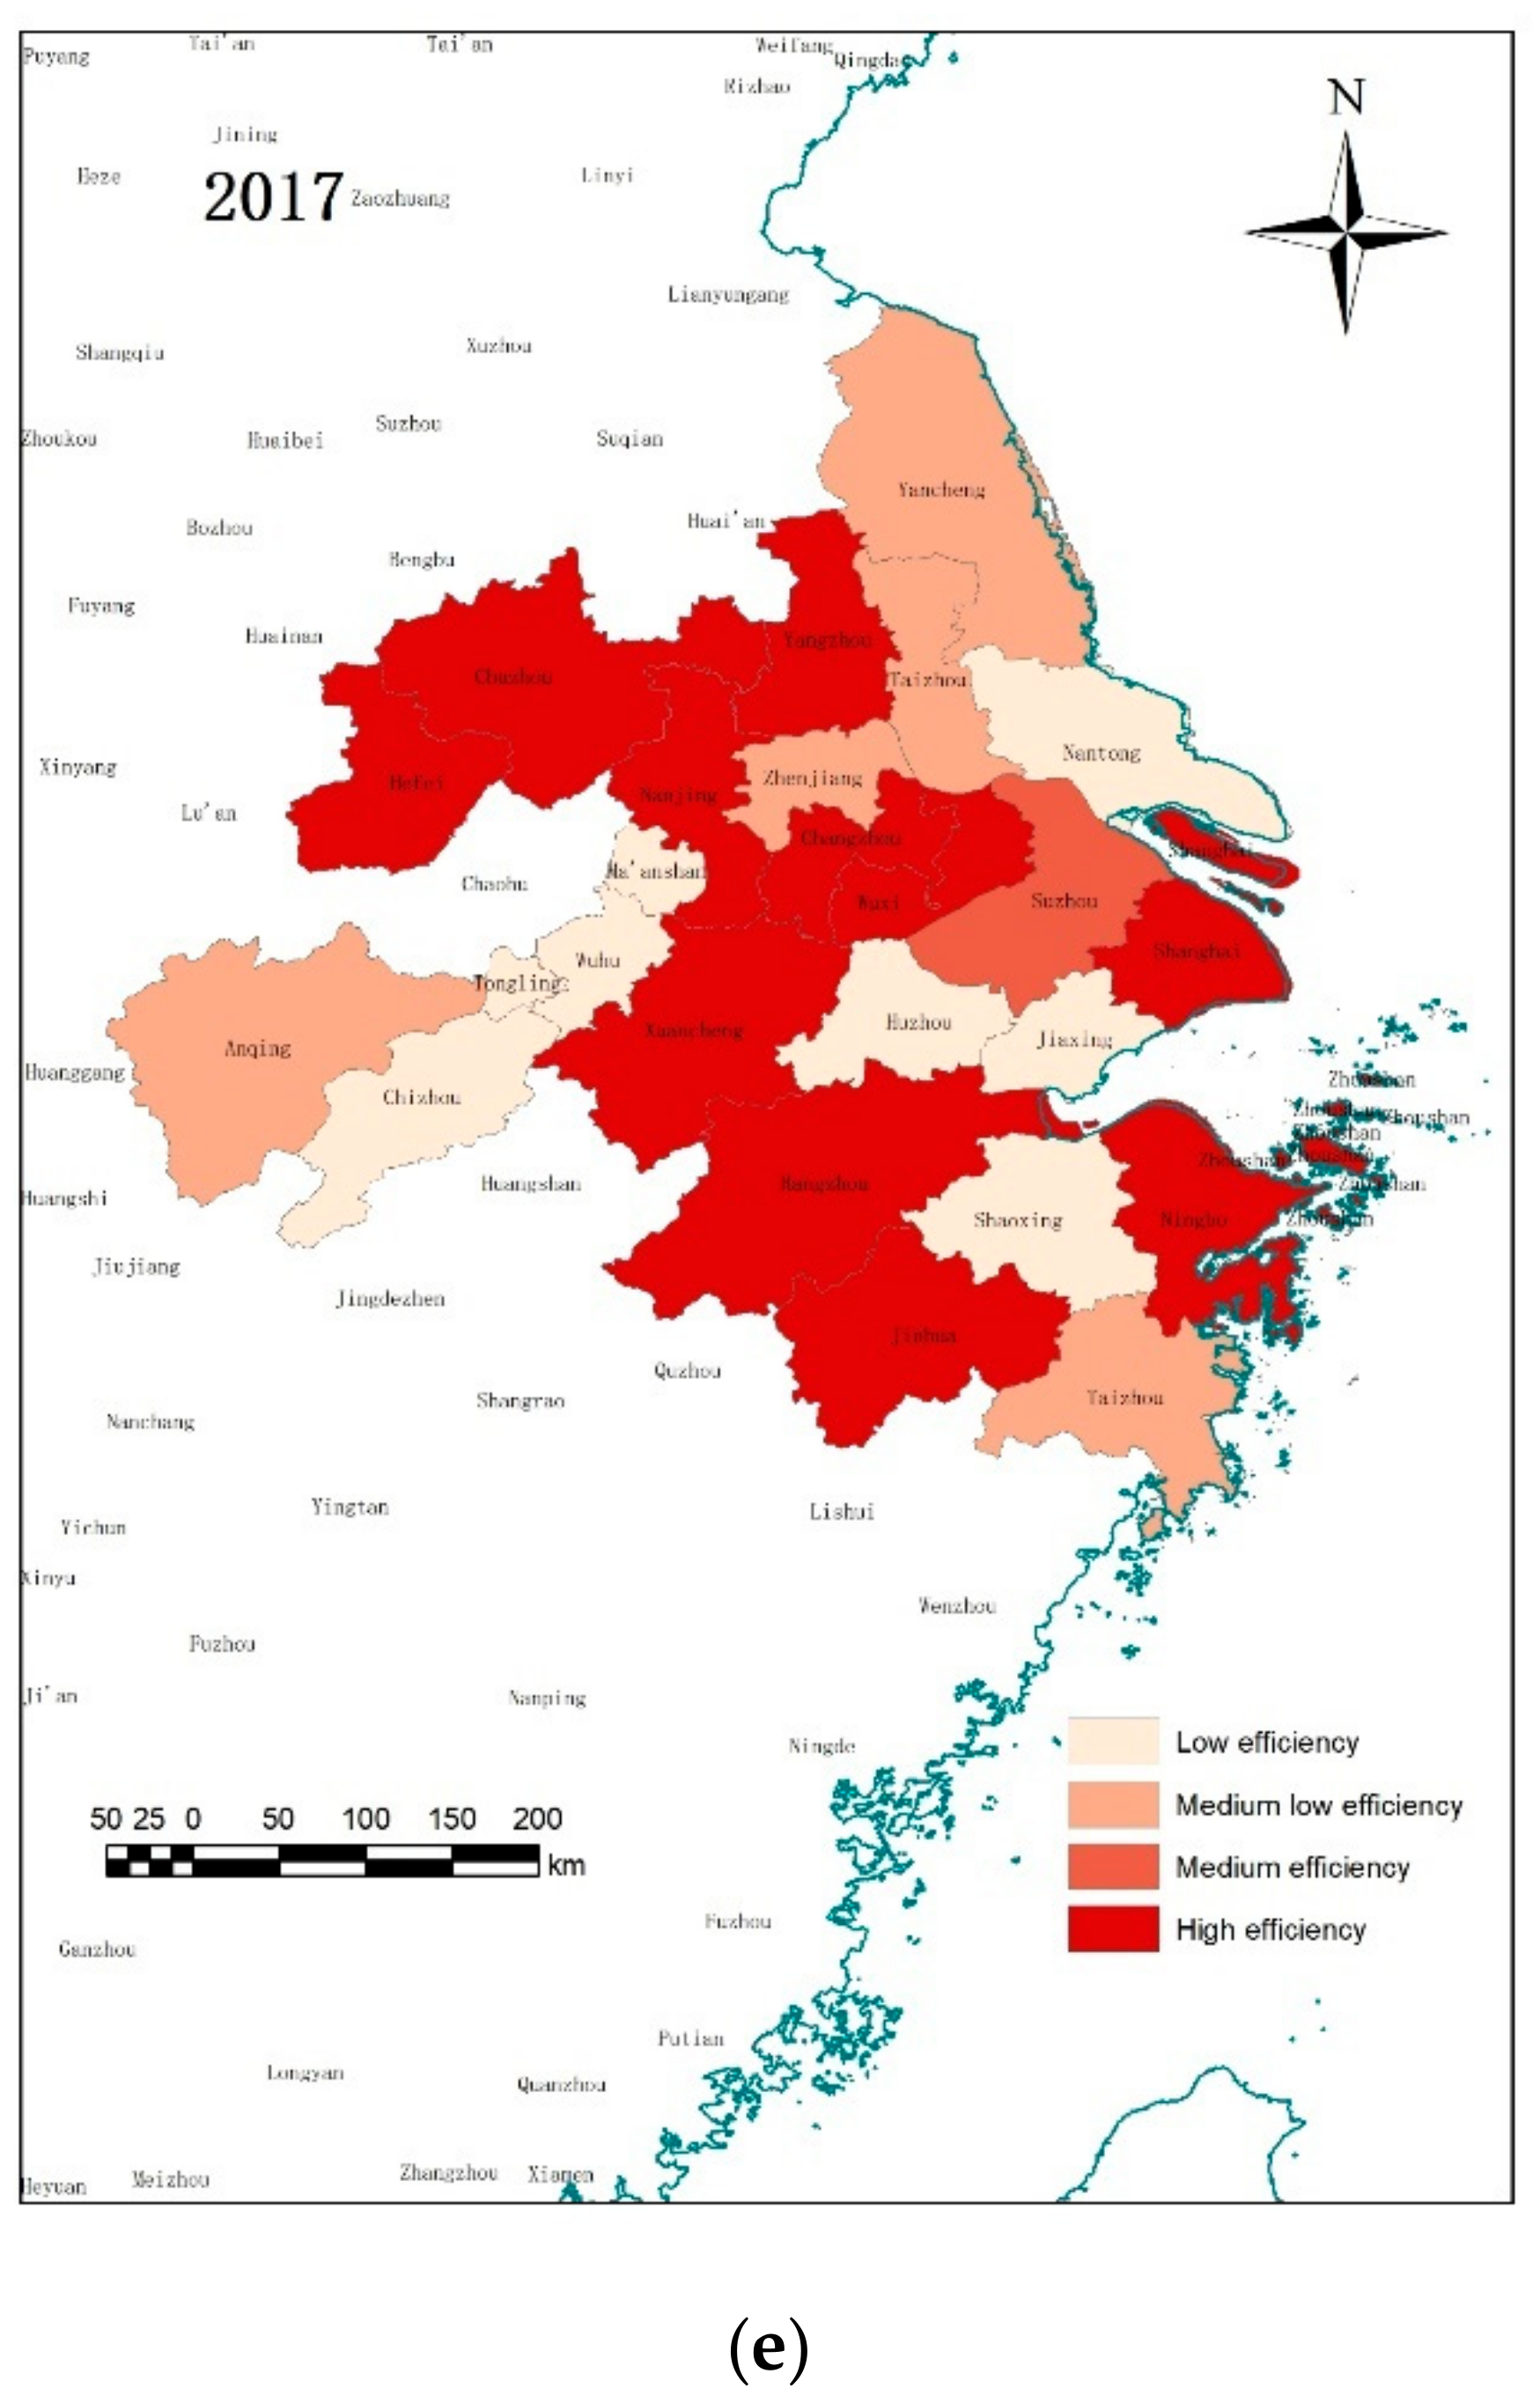
3.2. Spatial Distribution of Urban Land Use Efficiency

Figure 5 shows the spatial distribution of urban land use efficiency in the Yangtze River Delta urban agglomeration. It can be seen that from 2003 to 2017, the types of cities are mainly low-efficiency cities and high-efficiency cities, among which the number of cities with low-efficiency is the largest, which are 15, 15, 17, 13, 8, respectively, accounting for 58%, 58%, 65%, 50%, and 31% of the proportion of the years respectively, showing a general trend of decrease. The number of cities with high efficiency was 6, 2, 0, 4, 12, accounting for 23%, 8%, 0%, 15%, and 46% of the total in previous years, respectively. This indicates that the urban land-use efficiency of the Yangtze River Delta urban agglomeration has gradually evolved from low-efficiency as the leading role into a polarization characterized by more at both ends and less at the middle.
In the early stage, the efficient cities were mainly located in the inland areas, concentrated in the vicinity of Hefei, Yangzhou, Xuancheng, and Zhoushan, while the Coastal cities are generally inefficient. As time goes by, there is a trend of spatial dispersion, and the overall gap is decreasing. The cities with high efficiency are mainly concentrated in the inland areas, the middle and low-efficiency cities in Zhejiang Province are gradually increasing, while the efficiency of coastal cities has been improved. Subsequently, the number of high-efficiency gradually decreased and they were mainly concentrated in Jiangsu province, while the coastal cities were inefficiency. Then the high-efficiency cities are concentrated in inland areas, and mainly in Anhui province, while the efficiency of coastal cities is still at a low level. Finally, high-efficiency cities did not form a state of spatial agglomeration, but a spatial uniform state. The efficiency growth of Shanghai, Ningbo, and other coastal cities are very significant. In general, the efficiency of coastal cities is increasing, and the high-efficiency cities are no longer concentrated in the inland areas, and the spatial concentration state is transformed into a spatial dispersion state.

3.3. Results of Global Malmquist Index

Table 4 shows The Annual Malmquist Index and Its Decomposition of each city. In general, from 2003 to 2017, the urban land-use efficiency of the Yangtze River Delta urban agglomeration increased, with an average annual growth rate of 1.9%. From the perspective of index decomposition, the average annual growth rate of PEC and SEC is close to 0, while the annual growth rate of technological change is 1.7%. This shows that the level of technology application in the Yangtze River Delta urban agglomeration has not increased significantly, the distribution of factor input is slightly unreasonable, the growth of urban land use efficiency mainly depends on technological progress, and there is still upside potential of urban land-use efficiency.
From the perspective of cities, the urban land-use efficiency of Jinhua, Shanghai, Hangzhou, Shaoxing, Zhoushan, and Nanjing has the fastest growth, and the average annual growth rate is higher than 4%, far exceeding the average growth level, among which Jinhua has the highest average annual growth rate of 6%. Technological progress is the main driving force for growth. In addition, there were still 7 cities with negative growth of urban land-use efficiency. The reason for the negative growth was mainly the decline of technology application level, which required the local authorities to strengthen institutional management and promote the improvement of institutional management level.

3.4. Convergence Analysis of Urban Land Use Efficiency

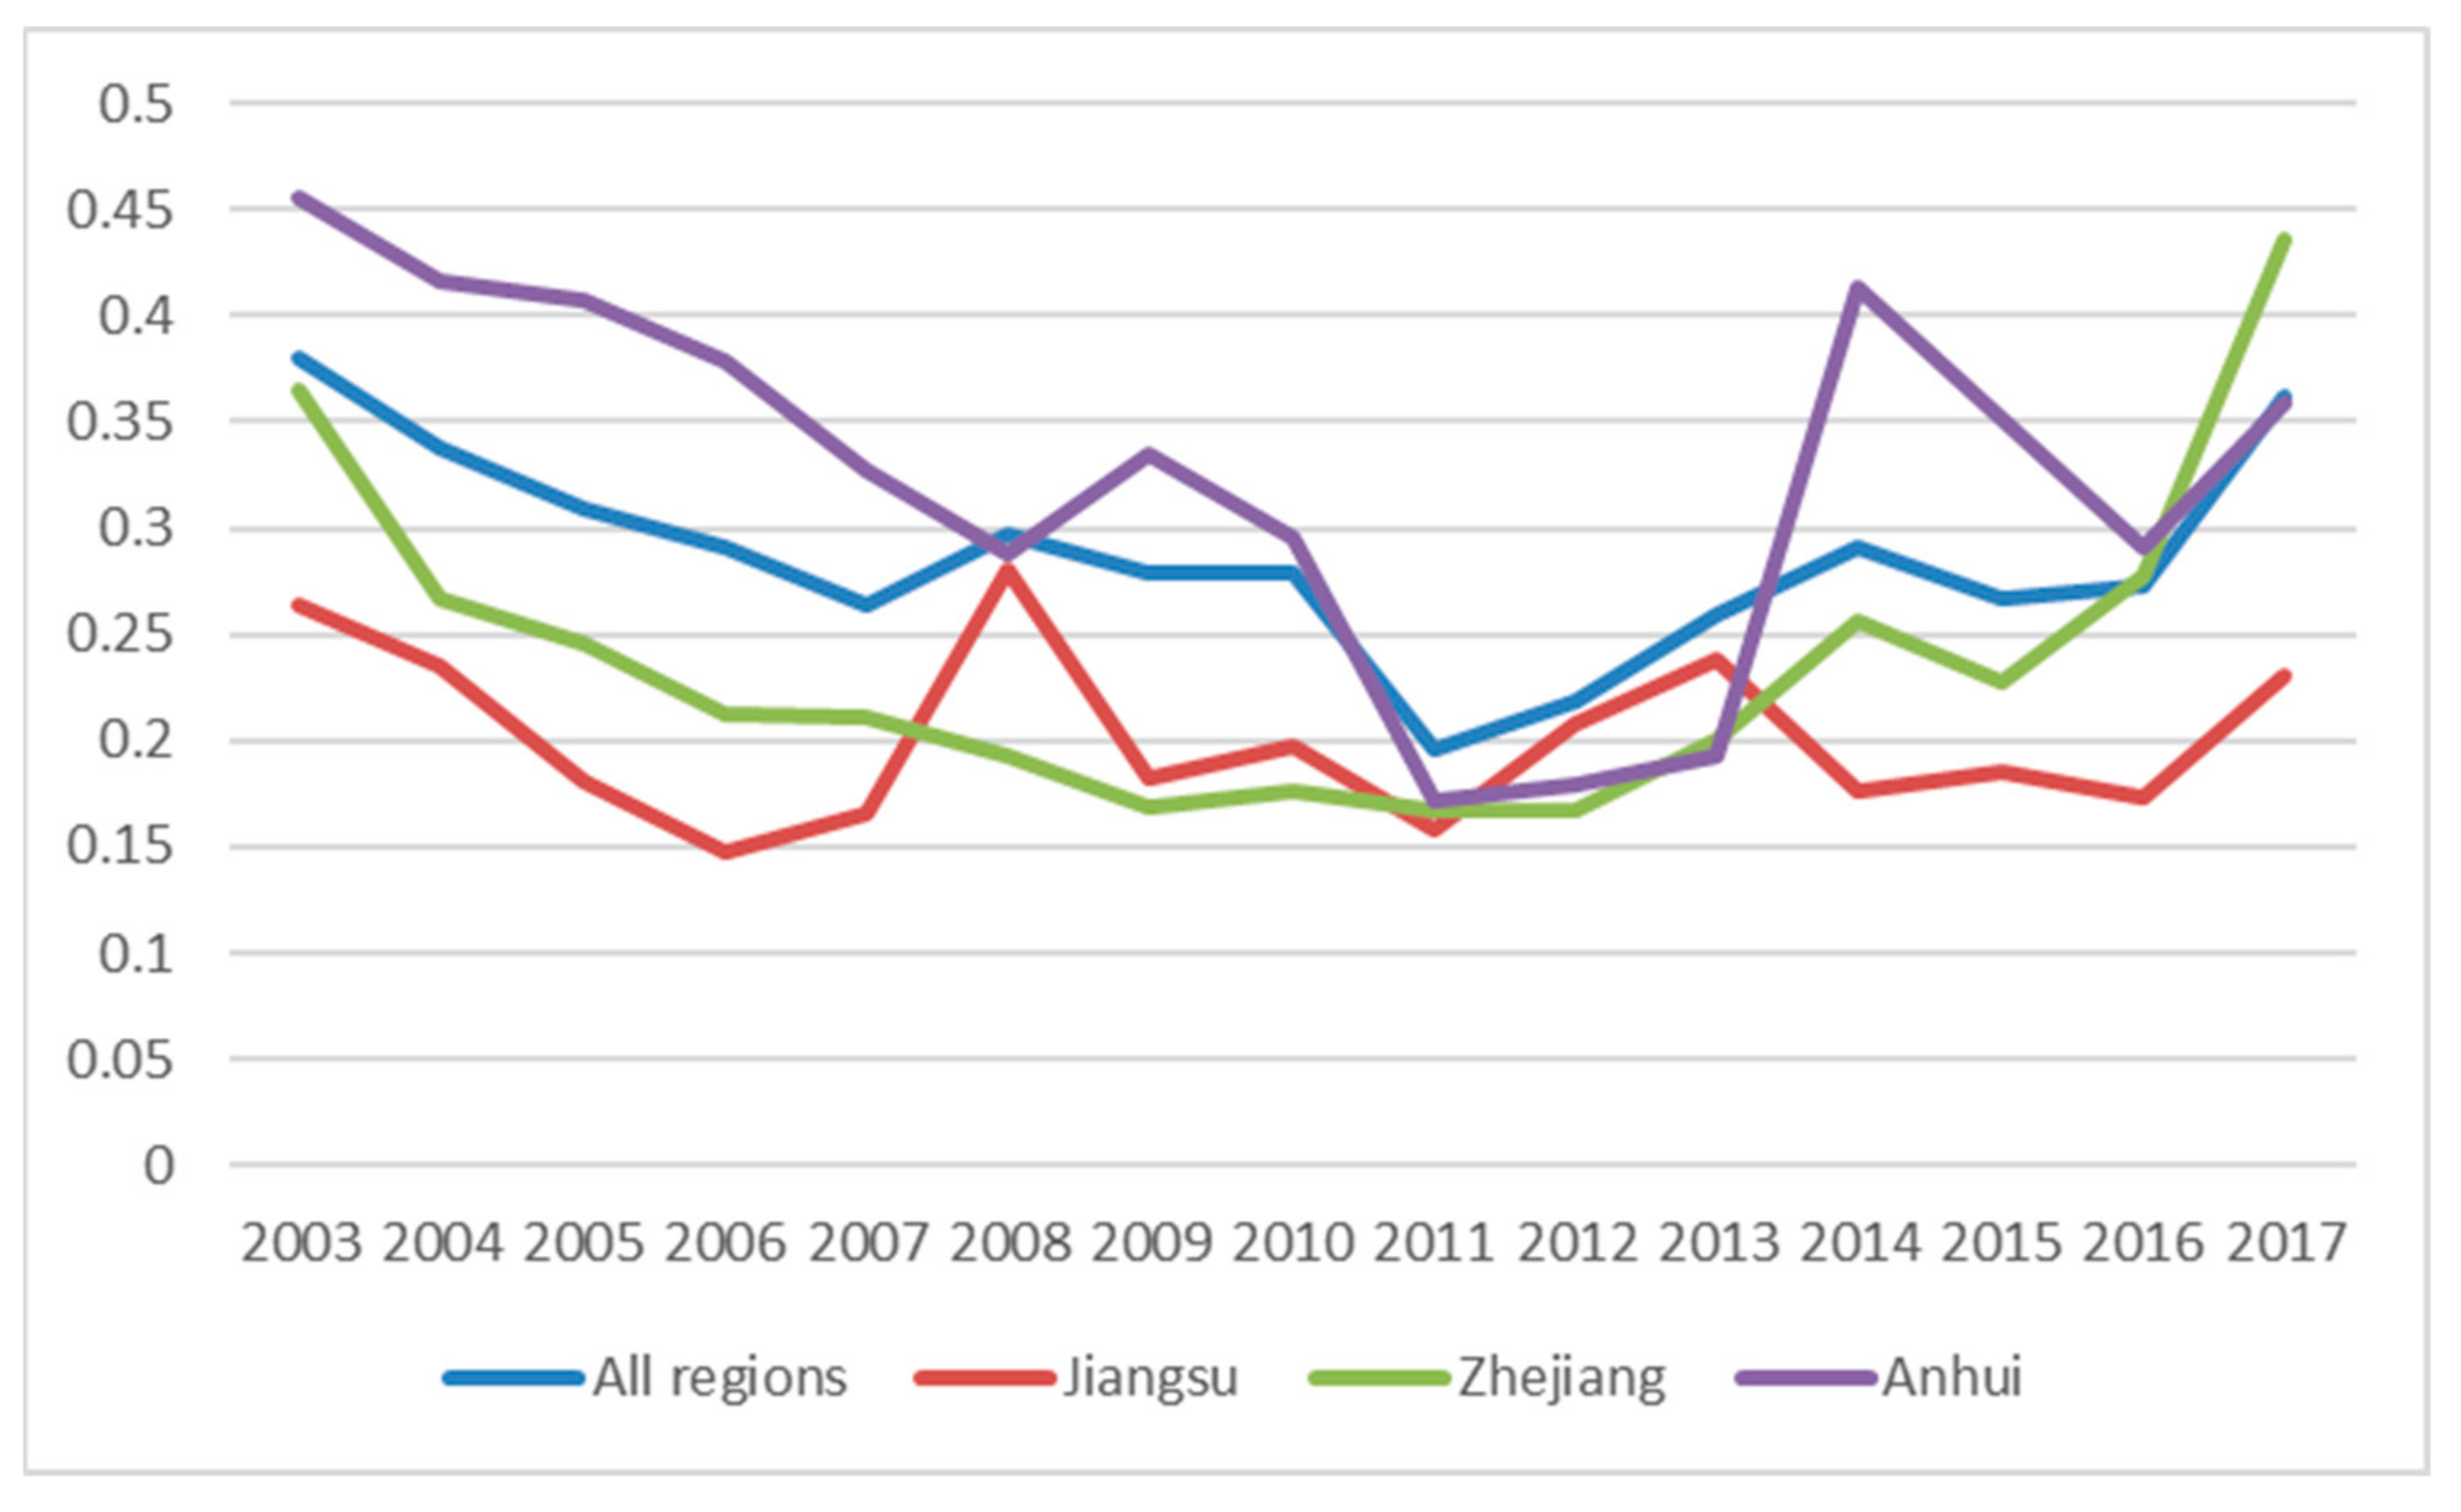
3.4.1. Results of σ Convergence

To further analyze the convergence of the urban land-use efficiency of the cities in the Yangtze River Delta urban agglomeration over time, we first calculate the σ convergence index of the Yangtze River Delta urban agglomeration and the three provinces, and the results are shown in Figure 6. It can be seen that the urban land-use efficiency of the Yangtze River Delta urban agglomeration is bounded by 2011, showing a trend of first convergence and then divergence. Similarly, Zhejiang Province also showed a convergent change from 2003 to 2011, while a divergent change from 2011 to 2017. The σ convergence index of urban land use efficiency in Jiangsu Province fluctuates frequently and does not show obvious characteristics of convergence or divergence. The urban land-use efficiency of Anhui Province showed a convergence trend from 2003 to 2011 but had no obvious change trend from 2011 to 2017. A horizontal comparison of the three provinces shows that the σ convergence index of Anhui Province is generally higher than that of the other two provinces, which indicates that the gap of urban land use efficiency within Anhui Province is larger.

3.4.2. Results of Absolute β Convergence

Next, we used the OLS method to carry out regression on Equation (8), and the results are shown in Table 5. As you can see, the regression coefficient of the Yangtze River Delta urban agglomeration is negative at the significance level of 1%, indicating that the urban land-use efficiency of the urban agglomeration has absolute β convergence. Similarly, the regression coefficients of Jiangsu Province and Anhui Province are negative at the significance level of 5% and 10% respectively, indicating that there is absolute β convergence of urban land use efficiency in Jiangsu Province and Anhui Province. The regression coefficient of Zhejiang province is not significant, indicating that there is no absolute β convergence in Zhejiang province. In addition, the regression coefficient of Zhejiang Province is divergent, which means that the internal gap has a widening trend, which is consistent with the analysis of the σ convergence index.

3.4.3. Results of Condition β Convergence

Finally, we use the panel data fixed effect model to estimate Equation (9), and the results are shown in Table 6. From the results, when we control the cross-section after effect and time effect, all of the regression coefficients is more than 5% of the significant level is negative, it shows that in the Yangtze River Delta urban agglomeration and the three provinces, within the scope of the urban land use efficiency is conditional β convergence, also that said, Yangtze River Delta urban agglomeration and the three provinces of urban land-use efficiency.

4. Discussion

Green development is an inevitable choice to achieve sustainable urban development under the constraints of resources and the environment. It is also an important guiding ideology and main realization path for China’s comprehensive social and economic transformation at present [37]. In the early stage, limited by China’s low economic level, economic development was the focus. Economic development was an important assessment indicator for local officials, and it was also a core element of the academic community to measure the efficiency of urban land use. Under the pressure of assessment, local governments often have excessive investment and regional redundant construction, which has caused serious industrial structure isomorphism and waste of resources, resulting in low urban land-use efficiency and serious ecological environmental pollution [18]. As the introduction and implementation of the concept of green development, a single economic output in land use can no longer meet the current strategic development goals and academic research needs. and we need a multi-dimensional output of land use system to reflect the land use in various output, thus the accurate measure of urban land use efficiency, to provide help for policy and academic research. This is also the problem that this research is trying to solve. It can be seen that urban land use efficiency without considering the non-expected output underestimates the real level of urban land use efficiency, which may lead to misleading conclusions for policy formulation and academic research.
In terms of research methods, there are mainly two most popular methods for the calculation of urban land use efficiency, namely stochastic frontier analysis (SFA) and DEA model. Among them, SFA is based on the production function, adding the random error term into the production equation, and estimating the efficiency value through the regression [38,39]. The advantage of this method is that the actual efficiency value is obtained, and the influence of random factors is considered. However, the specific distribution form of the random error term is difficult to determine, which affects the accuracy of the estimation. At the same time, only a single output is considered, so it is not suitable for the evaluation of multi-output efficiency. The DEA model is more suitable for this kind of efficiency evaluation of multiple inputs and outputs, and with the continuous improvement of the DEA model, the currently developed global reference super-efficiency DEA method inherits the advantages of the traditional DEA model, it can be combined with the Malmquist index, while overcoming the comparative disadvantages such as traditional DEA cannot across the interface and the author analyzes the reasons of efficiency change, it is more suitable for the calculation of urban land-use efficiency [30]. The only drawback is that it calculates relative efficiency and does not consider the influence of random factors. However, relative to its advantages and disadvantages are not significant, which is also the reason why it is widely used in efficiency evaluation.
In addition, this study also has some shortcomings, which can be solved in future research. (1) Due to the limitation of data availability, we did not consider the input of oil and natural gas in the energy input. The undesired output is not limited to the three mentioned in this paper, and the establishment of a more comprehensive evaluation index system can make the evaluation results more accurate. (2) Due to the limitation of space in this paper, although the temporal and spatial evolution law of urban land-use efficiency in the Yangtze River Delta urban agglomeration is discussed, the influencing factors and mechanism are not deeply analyzed, which will be the focus of our research in the next stage.

5. Conclusions

It is of great significance to strengthen the land management of the Yangtze River Delta urban agglomeration, improve the urban land-use efficiency and promote the sustainable development of the Yangtze River Delta urban agglomeration by studying the evaluation system of the urban land use efficiency and its spatio-temporal evolution law. Therefore, we use the relevant data of 26 cities in the Yangtze River Delta urban agglomeration from 2003 to 2017 to construct the urban land use efficiency evaluation system, which includes the input mix of land, labor, capital, and energy and the output mix of economic output, social output and undesired output. Then, the value of urban land-use efficiency is calculated by using the super efficiency SBM model of global reference, and based on this, the temporal development trend and spatial distribution characteristics of urban land use efficiency are analyzed. Then the global reference Malmquist index is used to analyze the reasons for its change. Finally, the convergence with time is tested by using the convergence model. The conclusions are as follows:
(1) Considering the urban land use efficiency with non-expected outputs is generally lower than that without considering non-expected outputs. Since the latter does not consider the pollution caused by urban development, it usually overestimates the urban land-use efficiency and has an impact on the ranking of urban land-use efficiency. This indicates that the evaluation system of considering urban land use efficiency with non-expected output is more reasonable.
(2) The urban land use efficiency fluctuated weakly from 2003 to 2011 and showed a trend of rapid growth from 2011 to 2017. The development of Jiangsu Province is the best, followed by Anhui Province, and Zhejiang Province is the worst. However, Zhejiang Province developed rapidly in the late period and realizes the reverse. At the urban level, Hefei is the most efficient, followed by Yangzhou and Changzhou, and Jiaxing has the worst efficiency.
(3) The high-efficiency cities were mainly concentrated in the inland areas in the early stage, and finally showed a state of spatial dispersion. And urban land use efficiency from low-efficiency as the leading role into two more than the middle of the fewer polarization characteristics.
(4) In general, the distribution of factor input in the Yangtze River Delta urban agglomeration is not balanced, which slows down the growth rate of urban land-use efficiency. Technological progress is the main reason to promote the growth of urban land-use efficiency. From the perspective of individual cities, the reason for the regression of cities with partial negative growth is the retrogression of technology application level.
(5) From the perspective of convergence, there is both absolute convergence and conditional convergence between the Yangtze River Delta urban agglomeration and Jiangsu Province. But only conditional convergence exists in Zhejiang and Anhui provinces. It shows that the urban land-use efficiency of each city is approaching its own steady-state level.
Based on the above research results, we propose the following policy recommendations. First, the government should establish a more complete evaluation index system to prevent local officials from blindly pursuing economic benefits while ignoring social benefits and the ecological environment; secondly, the government should pay attention to pollution emissions in production, strengthen environmental protection and promote the coordinated development of society, economy, and ecological environment. Then, the government should accelerate the reform of industrial structure, eliminate industries with high pollution and high energy consumption, release the space for urban development, and increase the investment in science and technology to promote technological progress. Finally, the government should reduce the intervention in the land factor market, adopt a more scientific urban land use evaluation system to carry out land planning, strictly manage the new construction land, and avoid the waste and inefficient use of land resources.

Author Contributions

Conceptualization, Y.T.; data curation, H.X. and Y.X.; funding acquisition, Y.T.; investigation, X.J.; methodology, K.W. and X.J.; software, H.X.; Supervision, Y.X.; visualization, X.J.; writing—original draft, Y.T. and K.W.; writing—review and editing, Y.T., K.W., H.X. and Y.X. All authors have read and agreed to the published version of the manuscript.

Funding

This research was funded by the Department of Science and Technology of Sichuan Province [No. 2018JY0594]; National Natural Science Foundation of China [No. 71072066]; Sichuan University [No. 2019HHF-14]; Fundamental Research Funds for the Central Universities [Grant No. 2021ZY-SX17].

Data Availability Statement

All data can be obtained by email from the corresponding author.

Acknowledgments

We would like to thank Naifu Yu, Jichen Zhang, Qiang Zheng, and Lanyi Shen for their support of our early work.

Conflicts of Interest

The authors declare no conflict of interest.

Appendix A

To obtain the social output index and the undesired output index, we use the following methods to obtain the comprehensive index.

Appendix A.1. The Dimensionless of the Indicator

Since the dimensions of different indicators are different, we first conduct dimensionless treatment for each indicator, as shown in Equation (A1) [40].
Y i j t = ( X i j t m j ) / M j m j
where the X is the actual value of the index, Y is the value after dimensionless, M is the upper limit of the index, m is the lower limit of the index, j is the number of indexes, i is the number of regions, and t is the year. As for the upper and lower limits of each indicator, if they are set according to the annual indicator situation, the comparison baseline of the indicators in different regions will change in different years, thus leading to the longitudinal incomparability of indicators. Therefore, we take the maximum value of the actual index data in 2003 as the upper limit and the minimum value of the actual value as the lower limit. After our dimensionless treatment, the dimensionless value of the index in the base year (2003) is between 0 and 100. The higher the value, the higher the development level of the corresponding index. The dimensionless value of other year indexes will be less than 0 or more than 100.

Appendix A.2. Determination of Weight

After the index has been dimensionless, the next step is to determine the weight of each index when synthesizing the comprehensive index. We commonly used weighting methods mainly including the subjective weighting method and the objective weighting methods. To truly reflect the information contained in the index data, we selected the coefficient of variation method in the objective weighting method to determine the weight of the index. The specific methods are as follows:
(1)
Calculate the mean x ¯ j and standard deviation S j of the j index. As shown in Equation (A2).
{ x ¯ j = 1 n i = 1 n x i j S j = i = 1 n ( x i j x ¯ j ) 2 n 1
(2)
Calculate the coefficient of variation v j of the j index. As shown in Equation (A3).
v j = s j x ¯ j , j = 1 , 2 , , p
(3)
Normalize the coefficient of variation, to get the weight w j of each index. As shown in Equation (A4).
w j = v j j = 1 p v j
To make the indexes of each year vertically comparable and ensure that future studies can be compared with the present, as the data is updated, so we use the data of the base year (2003) to calculate the weight of the index.

Appendix A.3. Calculation of the Composite Index

After doing the above steps, we finally synthesize the composite index. The calculation method is shown in Equation (A5).
Z i = j = 1 n w j   y i j
where Z is the value of the composite index; y represents the dimensionless value of the index; w represents the weight of the corresponding index value; j is the number of indices; i is the number of cities.

References

  1. Yu, J.; Zhou, K.; Yang, S. Land use efficiency and influencing factors of urban agglomerations in China. Land Use Policy 2019, 88, 104143. [Google Scholar] [CrossRef]
  2. The United Nations. China’s Urban. Population Will Increase by 255 Million in 2050; The United Nations: New York, NY, USA, 2018. [Google Scholar]
  3. Elmqvist, T.; Fragkias, M.; Goodness, J.; Guneralp, R.I.; Parnell, S.; Schewenius, M.; Sendstad, M.; Seto, K.C.; Wilkinson, C. Urbanization, Biodiversity and Ecosystem Services: Challenges and Opportunities: A Global Assessment; Springer Nature: Basingstoke, UK, 2013. [Google Scholar]
  4. Hak, T.; Janoušková, S.; Moldan, B. Sustainable Development Goals: A need for relevant indicators. Ecol. Indic. 2016, 60, 565–573. [Google Scholar] [CrossRef]
  5. Wang, Z.; Liang, L.; Sun, Z.; Wang, X. Spatiotemporal differentiation and the factors influencing urbanization and ecological environment synergistic effects within the Beijing-Tianjin-Hebei urban agglomeration. J. Environ. Manag. 2019, 243, 227–239. [Google Scholar] [CrossRef] [PubMed]
  6. Wang, J.; Lin, Y.; Glendinning, A.; Xu, Y. Land-use changes and land policies evolution in China’s urbanization processes. Land Use Policy 2018, 75, 375–387. [Google Scholar] [CrossRef]
  7. NBS (National Bureau of Statistics). China Statistical Yearbook 2018; China Statistics Press: Beijing, China, 2018. [Google Scholar]
  8. Yu, Y.; Zhang, N.; Kim, J.D. Impact of urbanization on energy demand: An empirical study of the Yangtze River Economic Belt in China. Energy Policy 2020, 139, 111354. [Google Scholar] [CrossRef]
  9. Xie, H.; Chen, Q.; Lu, F.; Wang, W.; Yao, G.; Yu, J. Spatial-temporal disparities and influencing factors of total-factor green use efficiency of industrial land in China. J. Clean. Prod. 2019, 207, 1047–1058. [Google Scholar] [CrossRef]
  10. Zhou, C.; Shi, C.; Wang, S.; Zhang, G. Estimation of eco-efficiency and its influencing factors in Guangdong province based on Super-SBM and panel regression models. Ecol. Indic. 2018, 86, 67–80. [Google Scholar] [CrossRef]
  11. An, Q.; Wu, Q.; Li, J.; Xiong, B.; Chen, X. Environmental efficiency evaluation for Xiangjiang River basin cities based on an improved SBM model and Global Malmquist index. Energy Econ. 2019, 81, 95–103. [Google Scholar] [CrossRef]
  12. Xie, H.; Wang, W. Spatiotemporal differences and convergence of urban industrial land use efficiency for China’s major economic zones. J. Geogr. Sci. 2015, 25, 1183–1198. [Google Scholar] [CrossRef]
  13. Choy, L.; Lai, Y.; Lok, W. Economic performance of industrial development on collective land in the urbanization process in China: Empirical evidence from Shenzhen. Habitat Int. 2013, 40, 184–193. [Google Scholar] [CrossRef]
  14. Chen, Y.; Chen, Z.; Xu, G.; Tian, Z. Built-up land efficiency in urban China: Insights from the General Land Use Plan (2006–2020). Habitat Int. 2016, 51, 31–38. [Google Scholar] [CrossRef]
  15. Huang, Z.; He, C.; Wei, Y.D. A comparative study of land efficiency of electronics firms located within and outside development zones in Shanghai. Habitat Int. 2016, 56, 63–73. [Google Scholar] [CrossRef]
  16. Yu, H.; Song, G.; Li, T.; Liu, Y. Spatial Pattern Characteristics and Influencing Factors of Green Use Efficiency of Urban Construction Land in Jilin Province. Complexity 2020, 2020, 5637530. [Google Scholar] [CrossRef]
  17. Zhang, L.; Zhang, L.; Xu, Y.; Zhou, P.; Yeh, C.-H. Evaluating urban land use efficiency with interacting criteria: An empirical study of cities in Jiangsu China. Land Use Policy 2020, 90, 104292. [Google Scholar] [CrossRef]
  18. Gao, X.; Zhang, A.; Sun, Z. How regional economic integration influence on urban land use efficiency? A case study of Wuhan metropolitan area, China. Land Use Policy 2020, 90, 104329. [Google Scholar] [CrossRef]
  19. Yao, M.; Zhang, Y. Evaluation and Optimization of Urban Land-Use Efficiency: A Case Study in Sichuan Province of China. Sustainability 2021, 13, 1771. [Google Scholar] [CrossRef]
  20. Liang, L.; Yong, Y.; Yuan, C. Measurement of Urban Land Green Use Efficiency and Its Spatial Differentiation Characteristics: An Empirical Study based on 284 Cities. China Land Sci. 2019, 33, 80–87. [Google Scholar] [CrossRef]
  21. National Development and Reform Commission. Plan. for the Development of Urban. Agglomeration in the Yangtze River Delta; National Development and Reform Commission: Beijng, China, 2016. [Google Scholar]
  22. Du, H.; Wang, D.; Wang, Y.; Zhao, X.; Qin, F.; Jiang, H.; Cai, Y. Influences of land cover types, meteorological conditions, anthropogenic heat and urban area on surface urban heat island in the Yangtze River Delta Urban Agglomeration. Sci. Total Environ. 2016, 571, 461–470. [Google Scholar] [CrossRef]
  23. Xue, Q.; Yang, X.; Wu, F. A three-stage hybrid model for the regional assessment, spatial pattern analysis and source apportionment of the land resources comprehensive supporting capacity in the Yangtze River Delta urban agglomeration. Sci. Total Environ. 2020, 711, 134428. [Google Scholar] [CrossRef]
  24. Jorgenson, D.; Gollop, F.; Fraumeni, B. Productivity and US Economic Growth; Elsevier: Amsterdam, The Netherlands, 2016. [Google Scholar]
  25. Young, A. Gold into Base Metals: Productivity Growth in the People’s Republic of China during the Reform Period. J. Political Econ. 2003, 111, 1220–1261. [Google Scholar] [CrossRef] [Green Version]
  26. Wang, D.; Pang, X. Research on green land use efficiency of Beijing Tianjin Hebei Urban Agglomeration. China Popul. Resour. Environ. 2019, 29, 68–76. Available online: https://kns.cnki.net/kcms/detail/detail.aspx?dbcode=CJFD&dbname=CJFDLAST2019&filename=ZGRZ201904008&v=Kov4cv3qGJYq8SLlcP%25mmd2FHYh0aqS7TLGmTrTJRecdOV6c1zvwbYUcuWdsPBxE460o1 (accessed on 5 July 2021).
  27. Charnes, A.; Cooper, W.W.; Rhodes, E. Measuring the efficiency of decision making units. Eur. J. Oper. Res. 1978, 2, 429–444. [Google Scholar] [CrossRef]
  28. Klumpp, M. Do Forwarders Improve Sustainability Efficiency? Evidence from a European DEA Malmquist Index Calculation. Sustainability 2017, 9, 842. [Google Scholar] [CrossRef] [Green Version]
  29. Tone, K. Dealing with undesirable outputs in DEA: A Slacks-Based Measure (SBM) approach. Nippon Opereshonzu Risachi Gakkai Shunki Kenkyu Happyokai Abus 2004, 2004, 44–45. Available online: https://www.researchgate.net/publication/284047010_Dealing_with_undesirable_outputs_in_DEA_a_Slacks-Based_Measure_SBM_approach (accessed on 5 July 2021).
  30. Huang, J.; Yang, X.; Cheng, G.; Wang, S. A comprehensive eco-efficiency model and dynamics of regional eco-efficiency in China. J. Clean. Prod. 2014, 67, 228–238. [Google Scholar] [CrossRef]
  31. Charnes, A.; Cooper, W. Programming with linear fractional functionals. Nav. Res. Logist. Q. 1962, 9, 181–186. [Google Scholar] [CrossRef]
  32. Oh, D. A global Malmquist-Luenberger productivity index. J. Product. Anal. 2010, 34, 183–197. [Google Scholar] [CrossRef]
  33. Färe, R.; Grosskopf, S.; Norris, M.; Zhang, Z.Z. Productivity Growth, Technical Progress, and Efficiency Change in Industri-alized Countries. Am. Econ. Rev. 1994, 84, 66–83. Available online: https://www.jstor.org/stable/2117971 (accessed on 6 July 2021).
  34. Sala-i-Martin, X. The Classical Approach to Convergence Analysis. Econ. J. 1996, 106, 1019–1036. [Google Scholar] [CrossRef]
  35. Quah, D.T. Twin Peaks: Growth and Convergence in Models of Distribution Dynamics. Econ. J. 1996, 106, 1045–1055. [Google Scholar] [CrossRef] [Green Version]
  36. Miller, S.M.; Upadhyay, M.P. Total factor productivity and the convergence hypothesis. J. Macroecon. 2002, 24, 267–286. [Google Scholar] [CrossRef]
  37. Hu, B.; Li, J.; Kuang, B. Evolution Characteristics and Influencing Factors of Urban Land Use Efficiency Difference Under the Concept of Green Development. Econ. Geogr. 2018, 38, 183–189. [Google Scholar] [CrossRef]
  38. Deng, X.; Gibson, J. Sustainable land use management for improving land eco-efficiency: A case study of Hebei, China. Ann. Oper. Res. 2020, 290, 265–277. [Google Scholar] [CrossRef]
  39. Liu, S.C.; Ye, Y.; Xiao, W. Spatial-Temporal Differentiation of Urban Land-Use Efficiency in China Based on Stochastic Frontier Analysis. China Land Sci. 2020, 34, 61–69. [Google Scholar] [CrossRef]
  40. Ji, X.; Wang, K.; Ji, T.; Zhang, Y.; Wang, K. Coupling Analysis of Urban Land Use Benefits: A Case Study of Xiamen City. Land 2020, 9, 155. [Google Scholar] [CrossRef]
Figure 1. The location of the study area.
Land 10 00715 g001
Figure 2. The Average Value of Urban Land Use Efficiency Over the Years.
Land 10 00715 g002
Figure 3. Urban Land Use Efficiency of Each City.
Land 10 00715 g003
Figure 4. Average Value of Urban Land Use- Efficiency in Each Region.
Land 10 00715 g004
Figure 5. The Spatial Diagram of The Urban Land Use Efficiency. (a) The urban land use efficiency in 2003. (b) The urban land use efficiency in 2007. (c) The urban land use efficiency in 2011. (d) The urban land use efficiency in 2014. (e) The urban land use efficiency in 2017.
Land 10 00715 g005aLand 10 00715 g005b
Figure 6. The σ Convergence Index of Each Region.
Land 10 00715 g006
Table 1. Land area and a permanent population of cities in the Yangtze River Delta urban agglomeration.
CityPopulation (10,000 People)Land Area (km2)CityPopulation (10,000 People)Land Area (km2)
Shanghai24256340Huzhou2935824
Nanjing8216587Shaoxing4958279
Wuxi6504627Jinhua54310,942
Changzhou4694372Zhoushan1141455
Suzhou10608488Taizhou6019411
Nantong7298001Hefei77011,445
Yancheng72216,972Wuhu3625988
Yangzhou4476591Ma’anshan2234049
Zhenjiang3173847Tongling741201
Taizhou4635787Anqing53815,318
Hangzhou88916,596Chuzhou39913,516
Ningbo7819816Chizhou1438272
Jiaxing4573915Xuancheng25712,453
Table 2. Input-output index table.
Variable TypeIndex
InputLandThe area of urban construction land
CapitalThe Capital stock
LaborThe number of employees in the secondary and tertiary industries
EnergyThe power supply of the whole society in the municipal district
OutputEconomicreal GDP of secondary and tertiary industries in municipal districts
Socialthe total wages of employees on the job
the number of full-time teachers in municipal districts
the number of doctors in municipal districts
the actual urban road area and green area in municipal districts at the end of the year
the green area covered in built-up areas
Undesiredindustrial smoke discharge
industrial sulfur dioxide discharge
industrial wastewater discharge
Table 3. Classification of urban land-use efficiency.
Urban Land Use EfficiencyCategory
0 < δ *   <   0.6 Low efficiency
0.6 δ *   <   0.8 Medium-low efficiency
0.8 δ *   <   1 Medium efficiency
1     δ * High efficiency
Table 4. The Annual Malmquist Index and Its Decomposition.
CityMLPECSECTCCityMLPECSECTC
Shanghai1.0510.9951.0081.047Shaoxing1.0481.0290.9931.026
Nanjing1.0420.9961.0061.040Jinhua1.0600.9991.0011.061
Wuxi1.0330.9971.0011.035Zhoushan1.0461.0010.9860.983
Changzhou0.9990.9961.0001.004Taizhou1.0160.9980.9721.047
Suzhou1.0341.0011.0191.014Hefei0.9990.9901.0021.008
Nantong1.0111.0070.9931.011Wuhu0.9790.9680.9911.020
Yancheng1.0131.0250.9881.000Ma’anshan0.9911.0010.9871.003
Yangzhou1.0021.0001.0001.001Tongling1.0141.0350.9781.003
Zhenjiang1.0161.0301.0000.986Anqing1.0041.0370.9680.999
Taizhou0.9940.9761.0081.010Chuzhou0.9971.0020.9961.000
Hangzhou1.0481.0031.0151.030Chizhou1.0301.0021.0271.002
Ningbo1.0300.9961.0001.035Xuancheng0.9930.9341.0640.999
Jiaxing1.0281.0210.9821.025Mean1.0191.0000.9991.017
Huzhou1.0050.9680.9821.057
Table 5. Absolute β Convergent Regression Results of Each Region.
VariableAll RegionsJiangsuZhejiangAnhui
ln e f f i , t −0.025 ***
(−3.05)
−0.033 **
(−2.73)
−0.000
(−0.01)
−0.021 *
(−2.22)
Constant0.005
(0.91)
0.001
(0.29)
0.034 **
(3.51)
−0.008
(−1.56)
Observations26988
R-squared0.2040.3160.0000.422
Note. T statistics Robust t-statistics in parentheses. *** p < 0.01, ** p < 0.05, * p < 0.1.
Table 6. Condition β Convergent Regression Results of Each Region.
VariableAll RegionsJiangsuZhejiangAnhui
d ( ln e f f i , t ) −0.6425 ***
(−6.9485)
−0.7338 ***
(−7.3074)
−0.9094 **
(−2.9831)
−0.5623 ***
(−6.1966)
Constant−0.3350 ***
(−5.1470)
−0.2575 **
(−2.7820)
−0.6550 **
(−2.8635)
−0.2973 ***
(−5.6882)
Observations364126112112
Regulation R20.3820.5070.5390.373
Note. Robust t-statistics in parentheses. *** p < 0.01, ** p < 0.05, * p < 0.1.
Publisher’s Note: MDPI stays neutral with regard to jurisdictional claims in published maps and institutional affiliations.

