Article

Climate Change and Adaptive Management: Case Study in Agriculture, Forestry and Pastoral Areas

1
College of Geodesy and Geomatics, Shandong University of Science and Technology, Qingdao 266590, China
2
Key Laboratory of Land Surface Pattern and Simulation, Institute of Geographic Sciences and Natural Resources Research, Chinese Academy of Sciences, Beijing 100101, China
*
Author to whom correspondence should be addressed.
Land 2021, 10(8), 832; https://doi.org/10.3390/land10080832
Submission received: 16 June 2021 / Revised: 18 July 2021 / Accepted: 2 August 2021 / Published: 9 August 2021
(This article belongs to the Special Issue Land Use and Climate Change)

Abstract

:
Adaptive management has very important practical significance for climate change adaptation and will play a great role in climate change risk mitigation in agricultural, forestry, and pastoral areas of China. Based on the theory of adaptive management, this paper selects Yuanping City from Shanxi Province, Qingyuan County from Liaoning Province, and Kulun Banner from Inner Mongolia as representative cases in agricultural, forestry, and pastoral areas, respectively, to carry out field research, and it uses 1970–2017 meteorological station data to apply vulnerability assessment and climate element change trend analysis, combined with the meteorological hazards data, and explore the adaptive management measures for agricultural, forestry, and pastoral areas in China. The conclusions are as follows: (1) the vulnerability of precipitation in Yuanping is high, the increase in temperature and drought and floods are the most important factors affecting crop yields in agricultural areas, and the key to climate change adaptive management lies in the awareness of farmers of climate change risks and the institutional guarantee of the government; (2) Qingyuan has high temperature vulnerability, and the forest areas have relatively strong adaptive capacity to climate change, but climate change will significantly affect the forest’s carbon sequestration function, and the focus of climate change adaptive management in the forestry sector is on engineering and technology field practices; (3) Kulun has the highest vulnerability to climate change, the frequent meteorological disasters seriously impact livestock development, and climate change adaptive management in pastoral areas relies on the participation of pastoralists’ local knowledge and also needs the support of the government and society.

1. Introduction

At present, climate change caused by large amounts of carbon dioxide emissions has brought very serious challenges to the development of China’s agriculture, forestry, and pasture. The primary industry accounts for about 7% of the gross national product, and the population engaged in the primary industry is 194.45 million, accounting for 58.5% of rural employment, 13.47% of the total population in China [1]. China’s rural adaptation to climate change is weak. Climate change will directly threaten the production of agriculture, forestry, and pasture, and even cause damage to food security and sustainable economic development [2,3,4]. In agriculture, climate change may lead to a 20% reduction in the production of wheat, rice, and corn in China and affect the international food trade [5,6,7]. In forestry, the excessive increase in carbon dioxide concentration will inhibit the carbon sequestration of forests and aggravate global climate change [8,9]; in pastoralism, climate change will lead to an increase in land desertification and a decrease in vegetation cover, which will seriously threaten the environment of grassland ecosystems [10,11]. Facing the uncertain risk of climate change [12,13], it is particularly important to accurately assess the vulnerability of climate change and to formulate and adopt effective measures for agriculture, forestry, and pastoralism to cope with climate change. However, natural resource conditions and economic and social development conditions vary greatly among regions in China, and the differences in climate change impacts in agriculture, forestry, and pastoralism are particularly significant [14]. Therefore, the formulation of reasonable and effective measures of coping with climate change requires not only the support of scientific data [15] but also full consideration of local economic and cultural backgrounds, incorporating local residents’ awareness and attitudes toward climate change and incorporating local traditional practices for coping with climate change [16,17,18]. However, most of the traditional climate change adaptation countermeasures are aimed at the large-scale level, with less consideration of the specificity of the natural conditions and economic base of each region, which makes it difficult to achieve the goal of improving the adaptive capacity of climate change at the grassroots level [19,20]. Adaptive management, however, can coordinate the interrelationship between regional environment, economy, and society by fully considering the regional economic and social background and local knowledge [21]. It is good for agriculture, forestry, and pastoralism, and it is also good for the adaptation of climate change uncertainty. It has a good ability to accept the uncertainty of climate change and realizes the organic combination of objective data scientific and residents’ perception practicality.
Adaptive management has a multidisciplinary theoretical background and is effective in coping with climate change. Adaptive management is a flexible, collaborative, and learning-oriented management approach to improving resilience at different scales, leading to a problem-solving cycle of government–science–resident interaction [22,23]. Adaptive management is supported by scientific data and traditional “top-down” management approaches, but it can also feed the local knowledge and uncertainties of residents in coping with climate change to decision makers as a source of information. Adaptive management is more effective in small-scale systems, as it feeds back to decision makers’ local knowledge and uncertainties in management [24]. Some scholars have conducted climate change research that combines local perceptions with scientific data [14,25,26], but no specific adaptive management recommendations have been made. The adaptive management case study based on semi-structured interview and qualitative evaluation methods by Olsson et al. in Kristianstad, Sweden, was the first adaptive management case in the world [27]. Based on surveys, interviews, and participatory observation, Bronen and Chapin proposed adaptive governance and institutional strategies for climate-induced community relocations in Alaska [28]. With the aid of the fuzzy cognitive maps, Singh and Chudasama evaluated the effectiveness of various adaptative management pathways in arid and semi-arid India [29]. Furthermore, some scholars have studied the adaptive management measures of Brazil’s Pantanal Westland [30] and the coffee-based farming system of southwest Ethiopia [31] based on literature research and field research methods. However, these studies are only qualitative research, and there is a lack of quantitative analysis. Scholars have also applied adaptive management theory to water resources management, arguing that adaptive management is an important tool for securing the secure supply and access to regional and world water resources in the context of climate change [32,33]. In addition, adaptive management has been applied in the fields of fisheries management [34] and tourism management [35]. It is easy to see that adaptive management for climate change is mostly carried out in economically underdeveloped or climatically vulnerable areas, which is of great practical importance for the improvement of climate change coping capacity in agricultural, forestry, and pastoral areas in China.
Research on climate change and adaptive management in China is still lacking. In recent years, domestic scholars have conducted studies on climate change response in China’s agricultural, forestry, and pastoral areas [36,37,38], but these studies often ignore the local knowledge of residents in coping with climate change and their subjective views on policies, and the existing studies on adaptive management are mostly conducted for a specific region [39], lacking a comprehensive study of China’s agricultural, forestry, and pastoral areas. It is difficult to adapt to the complex climate characteristics of different regions. The main innovations and contributions that distinguish this research from previous studies are as follows: (i) surveys are conducted in case areas to focus on the role of adaptive management in China’s rural climate change and its responses; (ii) the trend and vulnerability of climate change in different types of agricultural areas in China are evaluated and compared; (iii) the adaptive management frameworks suitable for agricultural, forestry, and pastoral areas are put forward. In doing so, we aim to provide an important reference for climate change adaption in China’s agricultural, forestry, and pastoral areas and put forward directional suggestions for farmers and the government to effectively improve the ability to fight climate change.

2. Material and Methods
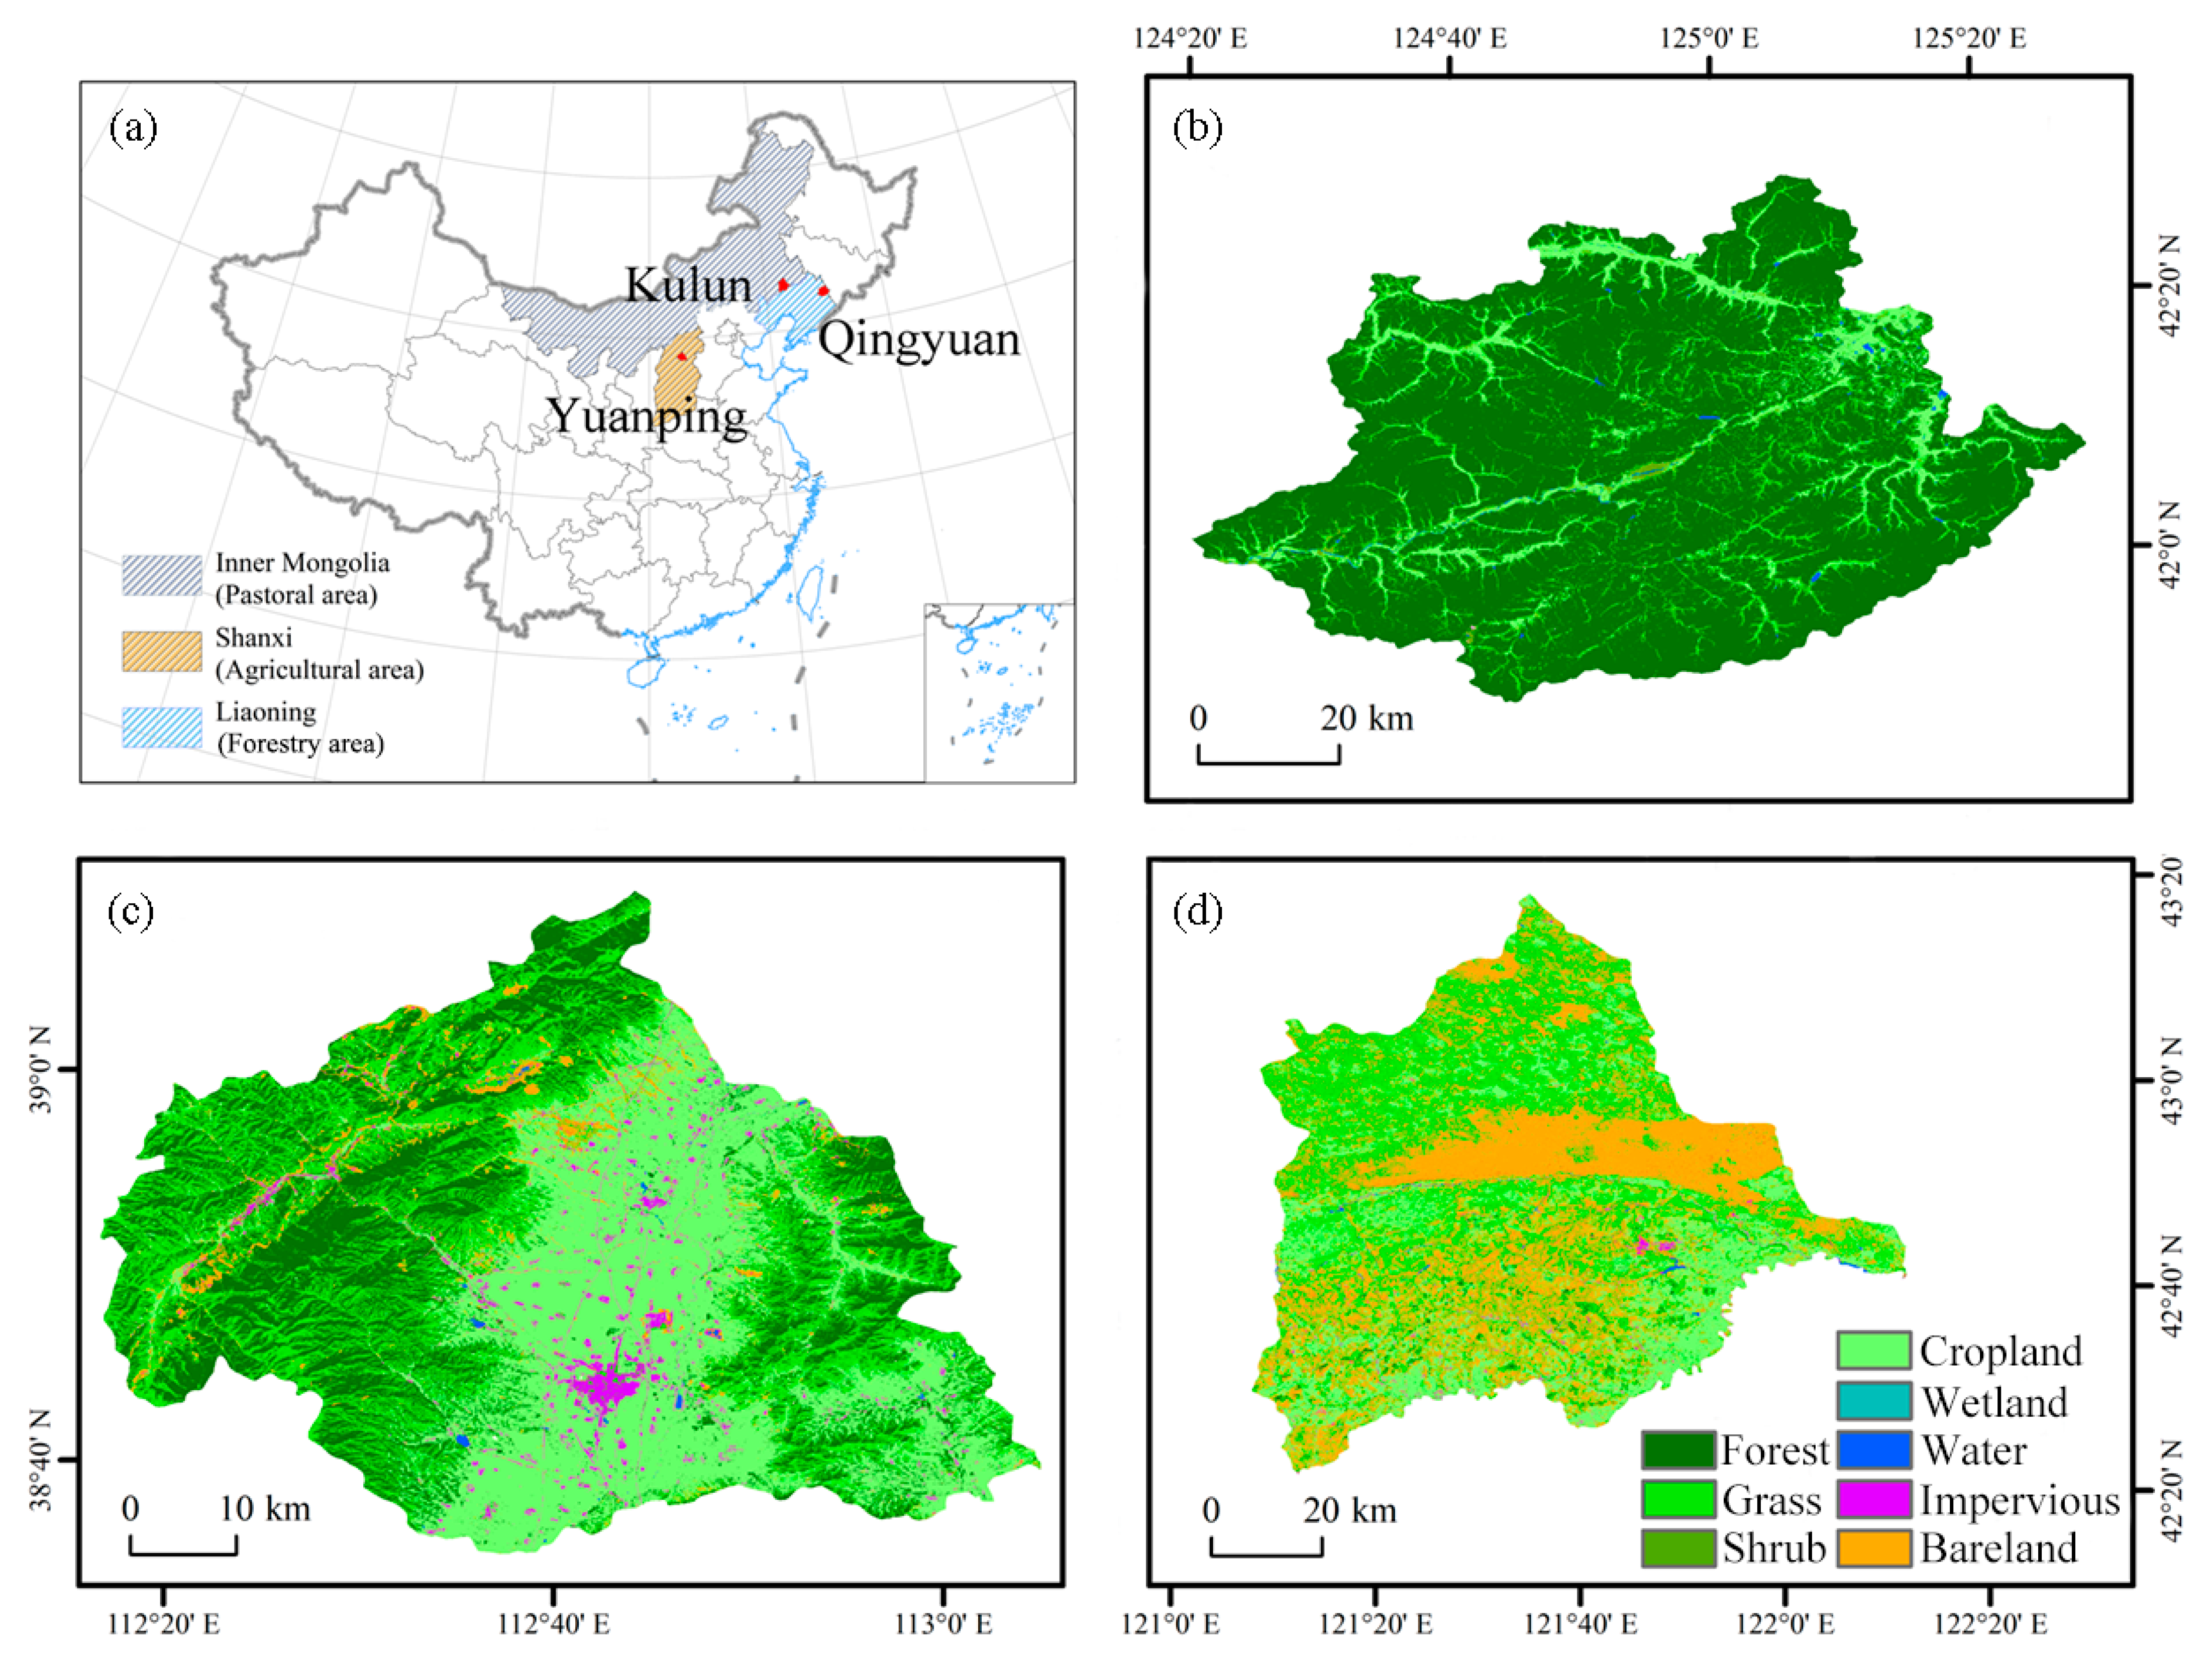
2.1. Study Areas

China’s agricultural, forestry, and pastoral areas have very different climatic and ecological characteristics and face different climate change problems, which require corresponding adaptive management measures according to regional characteristics. Shanxi, Liaoning, and Inner Mongolia, where Yuanping, Qingyuan, and Kulun are located, are connected, but the main types of agriculture are completely different. In the north of China, a C-shaped region is formed, which mainly consists of agriculture, forestry, and animal husbandry (Figure 1a). The dry farming in Yuanping is well-developed, and the total output of grain crops ranks sixth in Shanxi, which is a national high-quality grain production base, but it is located in the Loess Plateau, where water resources are scarce and vulnerable to high temperature and drought; Qingyuan has 10 state-owned woodlands, and nearly 70% of the area is covered by forests, which is a key commercial forest base in Liaoning Province, while climate change will have a great impact on the forest ecosystem and further aggravate climate change. The grass pasture area of Kulun accounts for about 42% of the total land area and the total number of livestock exceeds 500,000, which is one of the commercial cattle bases in China, but the ecosystem is fragile and greatly affected by climate change. Therefore, in this paper, three county-level administrative regions, Yuanping, Qingyuan, and Kulun, were selected as representative cases of agricultural, forestry, and pasture areas in China (Figure 1), whose natural conditions and climate profiles are shown in Table 1.
Yuanping is located in the north-central part of Shanxi Province, with a total area of 2560 km2 and an altitude between 800–2400 m, and it is a commercial grain production base mainly for corn cultivation (Figure 1c). Yuanping has a temperate monsoon climate of medium latitudes with four distinct seasons, annual precipitation of 450–500 mm, annual average temperature of 8.4 °C, annual average ≥ 10 °C effective temperature of 2887 °C, and a frost-free period of about 150 days. Yuanping has developed dry farming and it is the key agricultural location in Shanxi Province. In 2018, the total sown area of Yuanping was 590 km2, including 503 km2 of corn and grains other than wheat and rice, with a total grain output of 735 million kg and an agricultural product processing income of more than 1.4 billion yuan. The climatic characteristics and planting structure of Yuanping are very representative of agricultural areas in China, so it was selected as the case site of agricultural areas in this paper.
Qingyuan is located in the eastern mountainous region of Liaoning Province, with a total area of 3933 km2, of which 82.7% is mountainous and densely forested, rich in natural resources (Figure 1b). Qingyuan is a temperate continental monsoon climate, cold in winter and hot in summer, with an annual average temperature of 5.3 °C; annual precipitation of 788 mm; a frost-free period of about 130 days; total sunshine hours of 2419 h; precipitation concentrated in July, August, and September; and annual evaporation of 1275 mm. As of 2015, Qingyuan has an area of 3,933 km2 of forest land, 25.95 million m3 of forest accumulation, 70.62% forest coverage, and the Qingyuan Forest CERN, Chinese Academy of Sciences, is a key commercial forest base and water-conserving forest base in Liaoning Province and is also the “National Ecological Construction Demonstration Zone” in Liaoning Province. The climatic characteristics of Qingyuan are typical of forest areas in China, so it is chosen as the case site of forest areas in this paper.
Kulun is located in the eastern part of Inner Mongolia, which is situated in the agro-pastoral ecotone of Inner Mongolia and Liaoning border, with a total area of 4716 km2, belonging to the agriculture and pastoral combined economic type area (Figure 1d). Kulun has a temperate continental climate, with an average annual temperature of 6.6 °C, annual precipitation of 402.3 mm, and a frost-free period of 140–150 days. Kulun invested 56 million yuan in pastoralism and developed 10 demonstration villages for cattle breeding, built 9 large-scale breeding communities, with a total meat output of 18,000 tons, a milk output of 28.96 million tons, and a cattle inventory of 200,000 in 2019. Kulun has formed an agricultural structure with animal husbandry as the main body, with a combination of farming and forestry, and has an industrial base based on livestock, forestry, and grass. The study of climate change and adaptive management in Kulun can provide an effective reference for China’s pastoral areas, so it is chosen as the case site of this paper in pastoral areas.

2.2. Data

The meteorological data from 1970 to 2017 used in this paper were obtained from three meteorological stations located in Yuanping, Qingyuan, and Kulun provided by the “National Meteorological Science Data Center” (http://data.cma.cn/, accessed on 1 July 2021). They include monthly temperature and precipitation data; days with temperature above 35 °C; days with precipitation more than 10 mm; drought, flood, and other meteorological disaster data, etc. Since the case sites are all at the county scale, the use of station data can represent the temperature and precipitation changes in the study areas well.
The survey data used in this paper were obtained from farmer surveys and interviews in Yuanping, Qingyuan, and Kulun. The research was conducted by random household sampling, and 300 questionnaires (253 valid questionnaires) were completed in Yuanping (87 valid questionnaires), Qingyuan (90 valid questionnaires), and Kulun (76 valid questionnaires), respectively. Based on literature research and pre-survey, the questionnaires mainly included information on basic household conditions, plot information, production, perception of climate change, and initiatives to cope with climate change, which can better reflect the differences in household conditions and perception of climate change among farmers (Table S1).

2.3. Trend Analysis Method

There are parametric and nonparametric methods for time series trend testing. Parametric methods require independent and normally distributed data and are susceptible to outliers, while nonparametric methods require only independent data [40] and have been widely used in temperature and precipitation time series analysis [41]. In this paper, the Mann–Kendall trend analysis recommended [42,43,44] by WMO and Sen’s slope [45] are used to analyze the trends of temperature and precipitation in the case sites from 1970 to 2017.

2.3.1. Mann–Kendall Trend Test

The following assumptions are made for the time series x i = ( x 1 , x 2 , , x n ) :
Hypothesis 1 (H1).
It is assumed that the data in the series are independent identically distributed random samples, i.e., there is no significant trend.
Hypothesis 2 (H2).
It is assumed that there is an upward or monotonic trend in the series.
Under the H1, the test statistic S is defined as
S = i = 1 n 1 j = i + 1 n sgn ( x j x i )
where n is the number of data in the series, xi, xj represent the values of i and j in the time series (I < j), respectively, and sgn ( x j x i ) is the symbolic function:
sgn ( x j x i ) = { 1 ,   if   x j x i > 0 0 ,   if   x j x i > 0 1 ,   if   x j x i > 0
In Equation (2), when n ≥ 10, the statistic S approximately matches the normal distribution. S is normalized to obtain Zs, and the significance test is performed using the statistical test value Zs with the following formula:
Z s = { S 1 V a r ( S ) ,   i f   S > 0 0 ,   i f   S = 0 S + 1 V a r ( S ) ,   i f   S < 0
The variances are:
V a r ( S ) = n ( n 1 ) ( 2 n + 5 ) i = 1 m t i ( t i 1 ) ( 2 t i + 5 ) 18
where m is the number of ties (recurring data groups) in the sequence, and ti is the width of the ties (the number of repeated data in the Ith set of repeated data groups).
A positive Zs indicates an upward trend and a negative Zs indicates a downward trend. The trend test is performed at a specific level of significance α; when | Z s | > Z 1 α / 2 , the H1 is rejected and there is a significant trend in the time series; otherwise, the H2 is rejected and there is no significant trend in the time series. The bilateral trend test is used. In this paper, the significance level α = 0.01 with α = 0.05 was chosen.
The Mann–Kendall analysis does not require the samples to follow a certain distribution and can achieve the significance judgment of the series trend, but the slope of the series cannot be obtained, so this paper uses the Sen’s slope to estimate the trend of temperature and precipitation changes in the case sites.

2.3.2. Sen’s Slope Estimator

The Sen’s slope estimator was used to calculate the slope of the time series of temperature and precipitation Qmed at the case sites from 1970–2017.
Q i = x j x k j k , i = 1 , , N
where xj, xk denote the values at j and k on the time series (k < j), respectively. Qmed is the median value of Qi, determined by the parity of the total number N of Qi determined by the length n of the series (Equation (7)).
N = n ( n 1 )
Q m e d = { Q ( N + 1 ) / 2 , if   N   is   odd Q N / 2 + Q ( N + 2 ) / 2 2 , if   N   is   even
Qmed reflects the trend of the time series, and its value indicates the rate of change of the trend. To determine the relationship between Qmed and 0, confidence intervals are calculated for the selected significance level. The confidence interval can be expressed as [46,47]:
C α = Z 1 α / 2 V a r ( S )
where V a r ( S ) is calculated by the same Equation (4); Z 1 α / 2 is obtained from the standard normal distribution table. In this paper, the significance level α = 0.01 with α = 0.05 was chosen to obtain confidence intervals.
M 1 = N C α 2
The lower and upper bounds of the confidence interval Qmin and Qmax are the M1th largest number and the M2+1th largest number of the slope estimate N, respectively. The resulting slopes are significant if Qmin and Qmax have the same positive and negative values.

2.4. Vulnerability Assessment Method

According to the definition given by Intergovernmental Panel on Climate Change (IPCC), vulnerability is the degree to which natural or social systems are vulnerable or unable to cope with the adverse effects caused by climate change (climate variability and extreme climate). It is a function of the characteristics, speed, and intensity of climate change, as well as its sensitivity and adaptability within the system [48]. Therefore, we use the following formula to express vulnerability [49].
V = S A
where V is the vulnerability of climatic elements in the case area, S is sensitivity, and A is adaptability. Standardize sensitivity and vulnerability to eliminate dimensional inconsistency. The vulnerability of the study area is divided into five levels (lightly, gently moderately, seriously, and extremely vulnerable) by using the natural breakpoint method.
Sensitivity is defined as the response of the agricultural system to temperature, precipitation, or other climate disturbances. The higher the response, the stronger the sensitivity and the higher the vulnerability [50]. In this study, the interannual fluctuations of temperature and precipitation were used to characterize the sensitivity.
S = i = 1 n | F i F m | F m
where S is the rate of variation, i.e., sensitivity, Fi is the value of temperature or precipitation in the ith year, n is the length of time series (n = 48), and Fm is the average of temperature or precipitation in 1970–2017.
Adaptability is the ability of the agricultural system to deal with and adapt to climate change, and to maintain its steady state. If the adaptability is high, the agricultural system is relatively stable and not vulnerable to climate change. On the contrary, it shows that the ability to adapt to climate change is low and the vulnerability is high. We use the trend of temperature or precipitation variability to express adaptability.
y = A x + B
where y is the interannual variability of temperature or precipitation, and A is the trend of variability, i.e., adaptability.
The interannual variability of temperature or precipitation can be expressed as
y = | F i F m F m |
By linear fitting the relationship between interannual variability and annual variables, the slope A represents the regression slope of y and x in each group of data, which represents the change trend of climate element variability.
A = n x y ( x ) ( y ) n x 2 ( x ) 2
where x is the annual variable; y is the interannual variability of climate elements in year x.

3. Results

3.1. Results of Questionnaire Survey

The majority of the respondents (64.8%) were males. Among those who participated in the survey, 36–45-year-olds accounted for the highest proportion, followed by 46–55-year-olds, and most of them had no undergraduate education. Their disposable income was more than 10,000 yuan. More than half of the respondents are aware of climate change (68%), but fewer than half of them have formulated measures to deal with it (48.6%). Respondents’ perception of climate change mainly comes from the rising maximum temperature (47.1% agreed), frequent floods (38.3% agreed), and enhanced heat waves (47.1% agreed). The complete survey results are shown in Table S1.

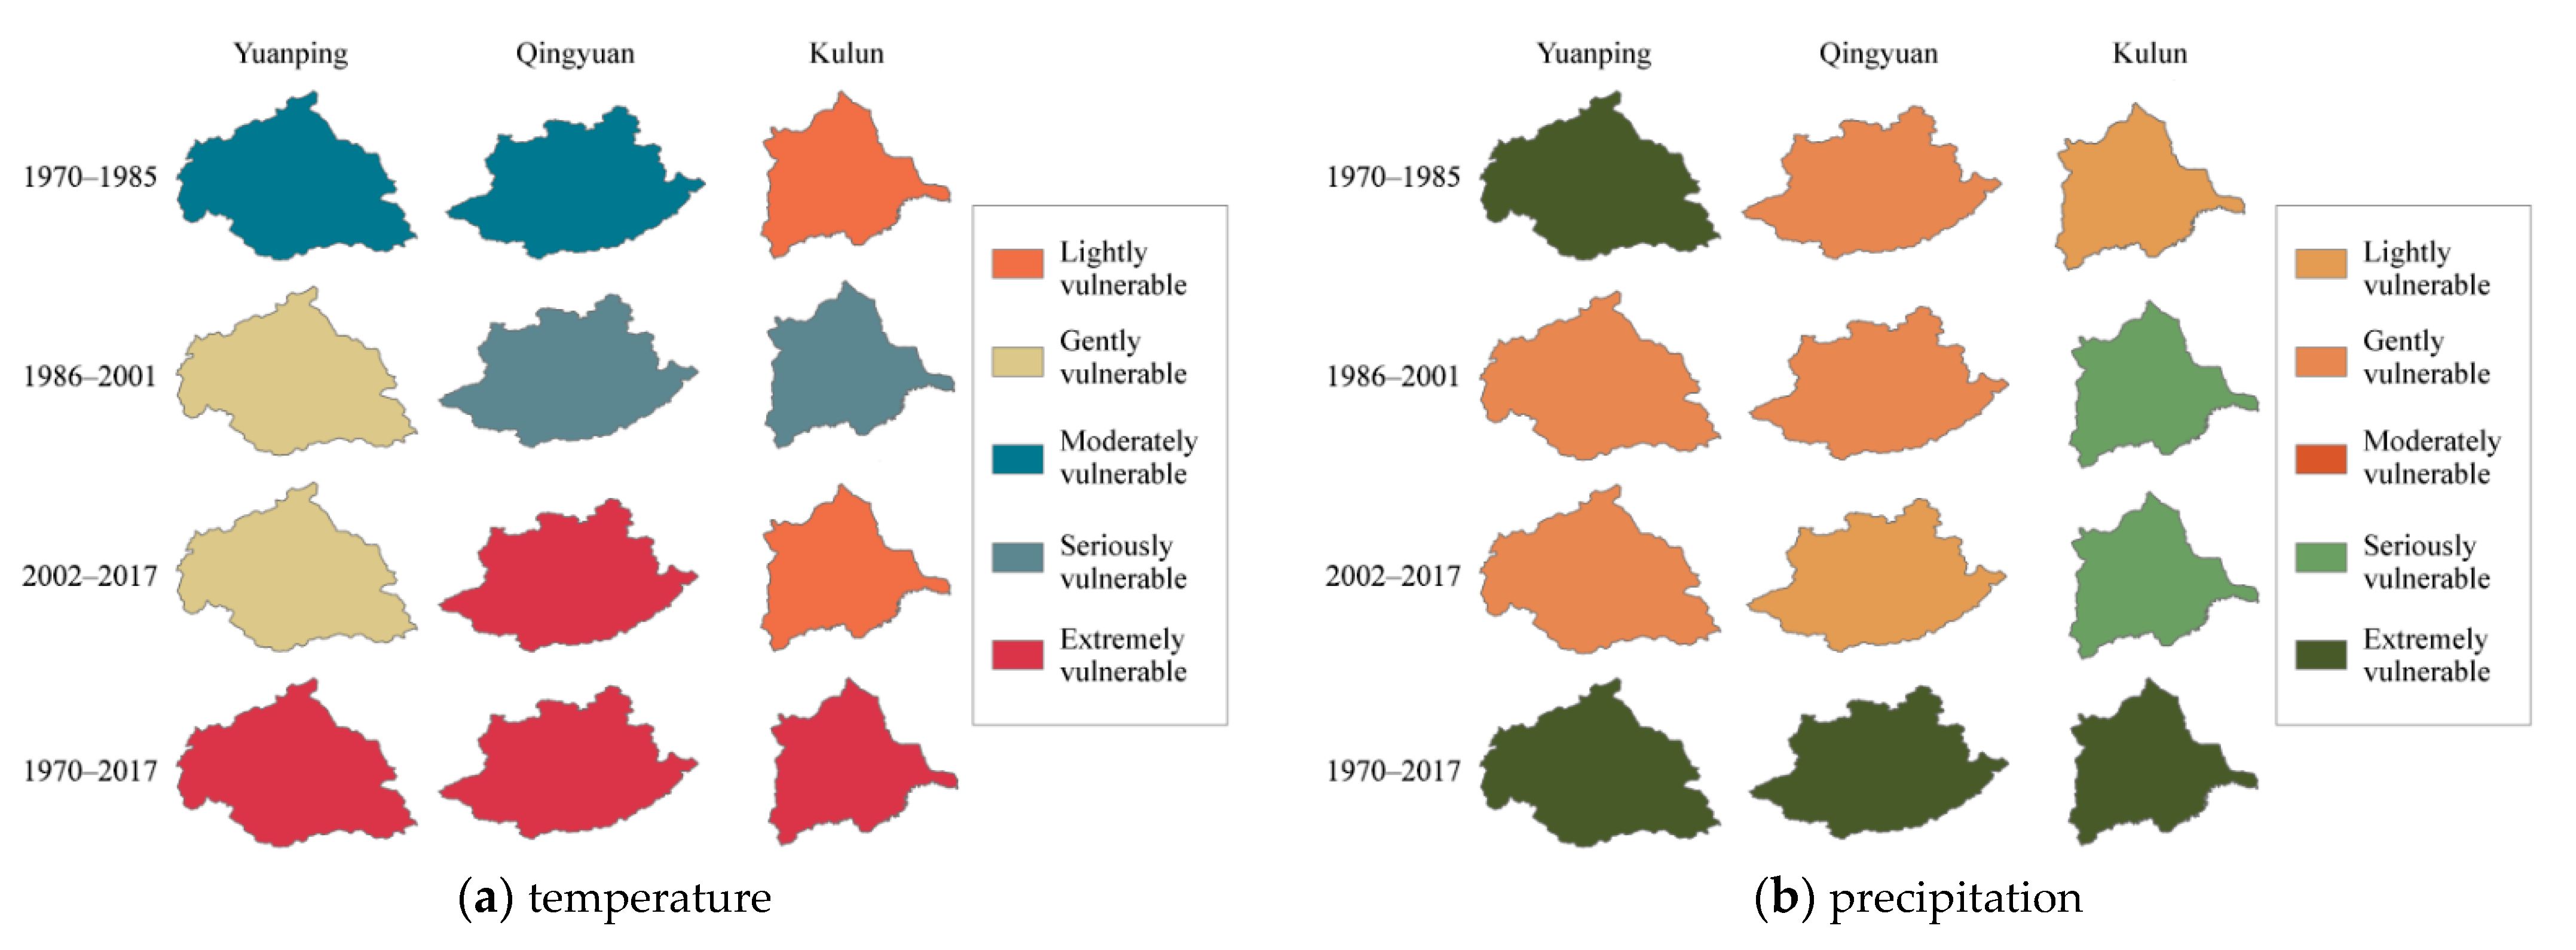
3.2. Vulnerability Assessment

After 1994, the annual average temperature of Yuanping exceeded 10 °C several times in a row and showed an increasing trend, even reaching a historical extreme of 11.0 °C in 1999 (Figure 2a). The days with temperature above 35 °C increased (Figure 2b). In terms of precipitation, precipitation in Yuanping from 1970–2017 was extremely unevenly distributed in time and varied widely, with a minimum value of 152.4 mm in 1972 and a maximum value of 658.9 mm in 1995. From 1997 to 2006, precipitation in Yuanping was maintained at a low level (Figure 2c).
The number of extreme heat days in Yuanping increased significantly after the 1980s, and the number of warm day days and warm night days in recent years is almost 1.5 times that of the 1960s to 1980s; as for the number of heavy rainfall days, an increasing trend started from the mid-1980s and became more obvious after entering the 21st century [3]. Drought (16 to 30 days of continuous rainfall-free days in spring, 16 to 25 days in summer, and 31 to 50 days in autumn and winter) has always been one of the major synoptic disasters in Yuanping. From 1970 to 2017, the number of consecutive drought days (the number of consecutive days without rainfall: more than 30 days in spring, more than 25 days in summer, and more than 50 days in autumn and winter) increased slightly, the continuous wetness index decreased, and the risk of drought increased significantly in 1970–2017. In addition, due to its special geographical location, dry farming in Shanxi Province has a weak adaptive capacity to climate change, and the proportion of affected area to planted area is much higher than the national average.
Since 1987, the yearly average temperature in Qingyuan has been higher than the local multi-year average temperature. The highest temperature in Qingyuan during the study period occurred in 1998, reaching 7.54 °C (Figure 3a). The days with temperatures above 35 °C increased significantly in the 1990s (Figure 3b). From 2014 to 2017, the annual precipitation in Qingyuan was maintained at a low level, lower than the average annual precipitation of 788 mm over the years, but the days with precipitation increased by more than 10 mm (Figure 3c).
According to residents, forestry production in Qingyuan is “fearful of drought and not afraid of flooding” due to high perennial precipitation and high forest coverage rate. The number of extreme low-temperature days in Qingyuan decreases at a rate of 1 d/10 a, and the number of frost days (days that the air near the ground cools to the frost point) and ice days (temperature is below 0 °C all day) both decrease; the number of extreme high-temperature days continues to increase and has accelerated in recent years; in terms of extreme precipitation (daily precipitation greater than the precipitation of the 95% quantile in the climate base period), droughts and floods occur alternately in Qingyuan, with a frequency of 29.4% for floods and 35.3% for droughts, and the duration of droughts is extended and the degree of droughts is increased.
As shown in Figure 4a, the highest annual mean temperature in Kulun occurred in 2007, at 8.79 °C. Kulun is deeply inland and has a temperate continental climate with dryness, little rainfall, and extreme changes in climate elements. In general, the burden on water resources in Kulun has increased, and the climate has become “warm and dry”, which has seriously affected local pasture growth and livestock breeding. The annual precipitation in Kulun varies greatly, with a maximum value of 652.5 mm in 1986 and a minimum value of 204.2 mm in 1982, which means that the local area may often suffer from floods or droughts, and there is a great risk of pasture development.
Due to its special geographical location, Kulun is exposed to greater risk of extreme weather and disasters. Frequent disasters such as high winds and dust storms in Kulun lead to accelerated evaporation of surface moisture from pastures and increased soil desertification and may also scrape down yurts and livestock sheds, affecting the development of pastoralism. Kulun also faces the risk of hailstorms, with a major hailfall period of 6 months and an annual average hail day of 1 d, causing serious economic losses to the local area. Drought and frost are also the main meteorological hazards in Kulun. The frequency of spring drought in Kulun is 43%, summer drought is 60%, and autumn drought is 13%; frost disasters often occur along with low-temperature freezing disasters, leading to a reduction in grassland and a decrease in crop productivity or even yield reduction.
The results of the change trend tests in agricultural, forestry, and pastoral areas are shown in Table 2. The temperature of Yuanping showed a significant upward trend, with an average annual warming of about 0.053 °C; precipitation showed an increasing trend, but not significantly. Yuanping has the lowest sensitivity to temperature, but the worst adaptability to precipitation. The average annual temperature increase in Qingyuan from 1970 to 2017 was 0.025 °C (99% significance). The adaptation of forests to climate change is relatively slow. Qingyuan is most sensitive to temperature change, but it can adapt to precipitation variation. The average temperature in Kulun increases by more than 0.03 °C per year (99% significance), which is higher than the average rate of temperature change per decade in China published in the China Blue Book on Climate Change (2019) [51]. Kulun has a certain ability to adapt to temperature changes but is very sensitive to precipitation changes, and the ability to deal with them is weak.
As shown in Figure 5, the vulnerability of temperature and precipitation in agricultural, forest, and pastoral areas increased from 1970 to 2017. The temperature and precipitation of the three places are extremely vulnerable. During 1986–2001 and 2002–2017, the vulnerability of temperature and precipitation in Yuanping decreased, but the overall vulnerability was still very high. Precipitation vulnerability in Qingyuan decreased from 2002 to 2017. The temperature vulnerability of Kulun was very low from 2002 to 2017.

3.3. Adaptive Management Measures

According to the field research, respondents generally indicated that they perceive climate change, but only 41% of them have adaptive measures for future climate change in Yuanping. Education level and agricultural training play an important role in the adaptation behavior of farmers in developing countries [52,53,54]. Therefore, institutional adaptation is the focus of climate change adaptive management in the agricultural sector. The government level, as the maker of climate change adaptation measures, should first expand the channels of information dissemination and conduct training on climate change awareness and information access to enhance farmers’ awareness of climate change risks. In addition, the establishment of an ecological compensation system is an important institutional measure [55]. Engineering-based management is the main way for village collectives and farmers to participate in climate management. Measures such as building irrigation facilities, developing water-saving agriculture, choosing resistant food varieties, and building greenhouses can effectively improve the agricultural sector’s ability to resist the risks of high temperatures and droughts; the rational application of chemical fertilizers and pesticides can effectively reduce the risks of pests and diseases caused by climate change. In addition, improving the replanting index, developing renewable energy, and influencing weather through artificial intervention can also significantly improve the ability of agricultural areas to cope with the risk of drought and meteorological disasters. Adaptive management measures for climate change in agricultural areas are shown in Table 3.
Forest residents generally have a low level of awareness of climate change and do not have corresponding adaptation measures. Therefore, first, we should improve public investment policies in forestry, explore incentive policies for increasing forestry carbon sinks on par with industrial emission reduction, establish a standard index system for forestry carbon sink assessment and a unified national forestry fiscal policy, and develop institutional measures such as forest fire prevention and early warning mechanisms for pests and diseases. Planting trees and increasing forest cover is one of the most effective strategies to address climate change globally [8]. Therefore, the key to climate change adaptive management in the forestry sector lies in the technical and engineering aspects. Greening and reforestation, developing ecological reforestation and restoration techniques, promoting agroforestry complex management, and promoting sustainable forest development can significantly increase the rate and amount of carbon sequestration in forests and promote carbon sinks in forestry. Improving logging operation measures, reducing deforestation and felling, and improving the forest utilization rate can effectively protect the forest carbon sequestration function. In terms of carbon substitution, the development of fast-growing forests and energy plantations, and the development of new low-carbon industries to replace traditional high-carbon forestry industries are very effective measures. Adaptive management measures for climate change in forestry areas are show in Table 4.
Compared with agricultural and forestry areas, pastoral production environments are the harshest and most vulnerable, requiring the joint participation of government, society, and pastoralists. Pastoralists in arid and semi-arid areas usually live a “nomadic” life, living year-round by water, and they have accumulated local knowledge with strong adaptive capacity. Therefore, engineering measures play a very important role in the adaptive management of pastoral areas. According to the residents who participated in the study, saving winter pasture, developing “rotational grazing”, and joint-family operation are very effective means of adapting to climate change, which not only protect pastures but also achieve the purpose of livestock fertilization. In addition, returning farmland to grass and forests can also promote the optimal use of land resources in pastoral areas, improve the environment and slow down climate change. However, when facing the risk of climate change, the lack of capital, water shortage, poor infrastructure, lack of knowledge, and poor information exchange often become major obstacles that prevent pastoralists from adapting to climate change. Therefore, on this basis, the government should formulate relevant grass–livestock balance policies, take the lead in establishing cooperative organizations, and provide sufficient financial support for livestock infrastructure construction and disaster resistance and mitigation, and social and scientific research institutions should take the lead in conducting pasture assessments, establishing a platform for climate change information sharing and disaster early warning, and improving breeds in order to coordinate all parties and establish an adaptive management system for climate change in pastoral areas. Adaptive management measures for climate change in pastoral areas are show in Table 5.

4. Discussion

Climate change poses a serious threat to China’s food security, forestry development, and pastoral production and affects the sustainable development of China’s economy and society. At present, China’s climate disaster risk level is at a high level globally, and the adverse effects of climate change show a significant trend of deepening into the economic and social systems [56]. However, the poor adaptive capacity and deep impact of agriculture, forestry, and pastoralism from climate change have always been the weaknesses in the field of climate change adaptation in China.
The main participants of institutional adaptive management measures, technical adaptive management measures, and engineering adaptive management measures are the government, scientific research institutions, and residents. The development of institutional measures can drive the chain of participation from top to bottom and arouse residents’ awareness of climate change management, which is an important prerequisite in the development of adaptive management. Technical measures are the bridge between policy formulation and implementation, and the participation of social sectors in climate change management is also mainly realized through technical measures. After the policy or technology is developed, only through the farmers’ personal participation can they perceive the goodness of the adaptive management measures and give feedback on the uncertainties to the decision makers and research institutions. Engineering measures are the most critical part of climate change adaptive management. Feedback from residents’ practice can promote the formation of social learning and ultimately achieve the purpose of adaptive management.
The agricultural areas are mostly rainfed agriculture. The increase in temperature can accelerate the evaporation of water and aggravate the impact of the decrease of precipitation, which is not conducive to the growth of crops. Technical and engineering measures can only bring short-term results. In the long run, we must first improve the residents’ awareness of climate change, encourage them to develop low-carbon agriculture, water-saving agriculture, etc., and change the traditional mode of production so as to significantly improve the adaptive management ability of climate change in agricultural areas.
The reduction of forest area, as a net carbon pool, is very detrimental to both reducing greenhouse gas concentrations and mitigating climate change. The key to improving the adaptive management ability of forest climate change lies in the research and development of new technologies and large-scale afforestation. The improvement of forestry adaptability to climate change can improve the ability of forest carbon reduction, and it is also very beneficial for other regions to reduce the impact of climate change.
Extreme weather and harsh production environments in pastoral areas have brought difficulties to forage planting and livestock breeding. Residents have accumulated local knowledge to deal with climate change. The improvement of climate change response capacity in pastoral areas needs to invest a lot of capital, technology, and manpower, and it is the most difficult in the three types of areas.

5. Conclusions

Based on the meteorological data and field research in Yuanping, Qingyuan, and Kulun, this paper analyzes the changes in climate elements and meteorological disasters in the case sites from 1970 to 2017 to clarify the vulnerability to climate change in the case sites. Based on the results, we proposed adaptive management measures for agriculture, forestry, and pastoral areas and constructed a multi-level adaptive management framework with the participation of government, research institutions, and farmers. The suggestions of adaptive management put forward in this paper have important practical value for improving the ability of China’s rural areas to cope with climate change and comprehensively promoting rural revitalization.
(1)
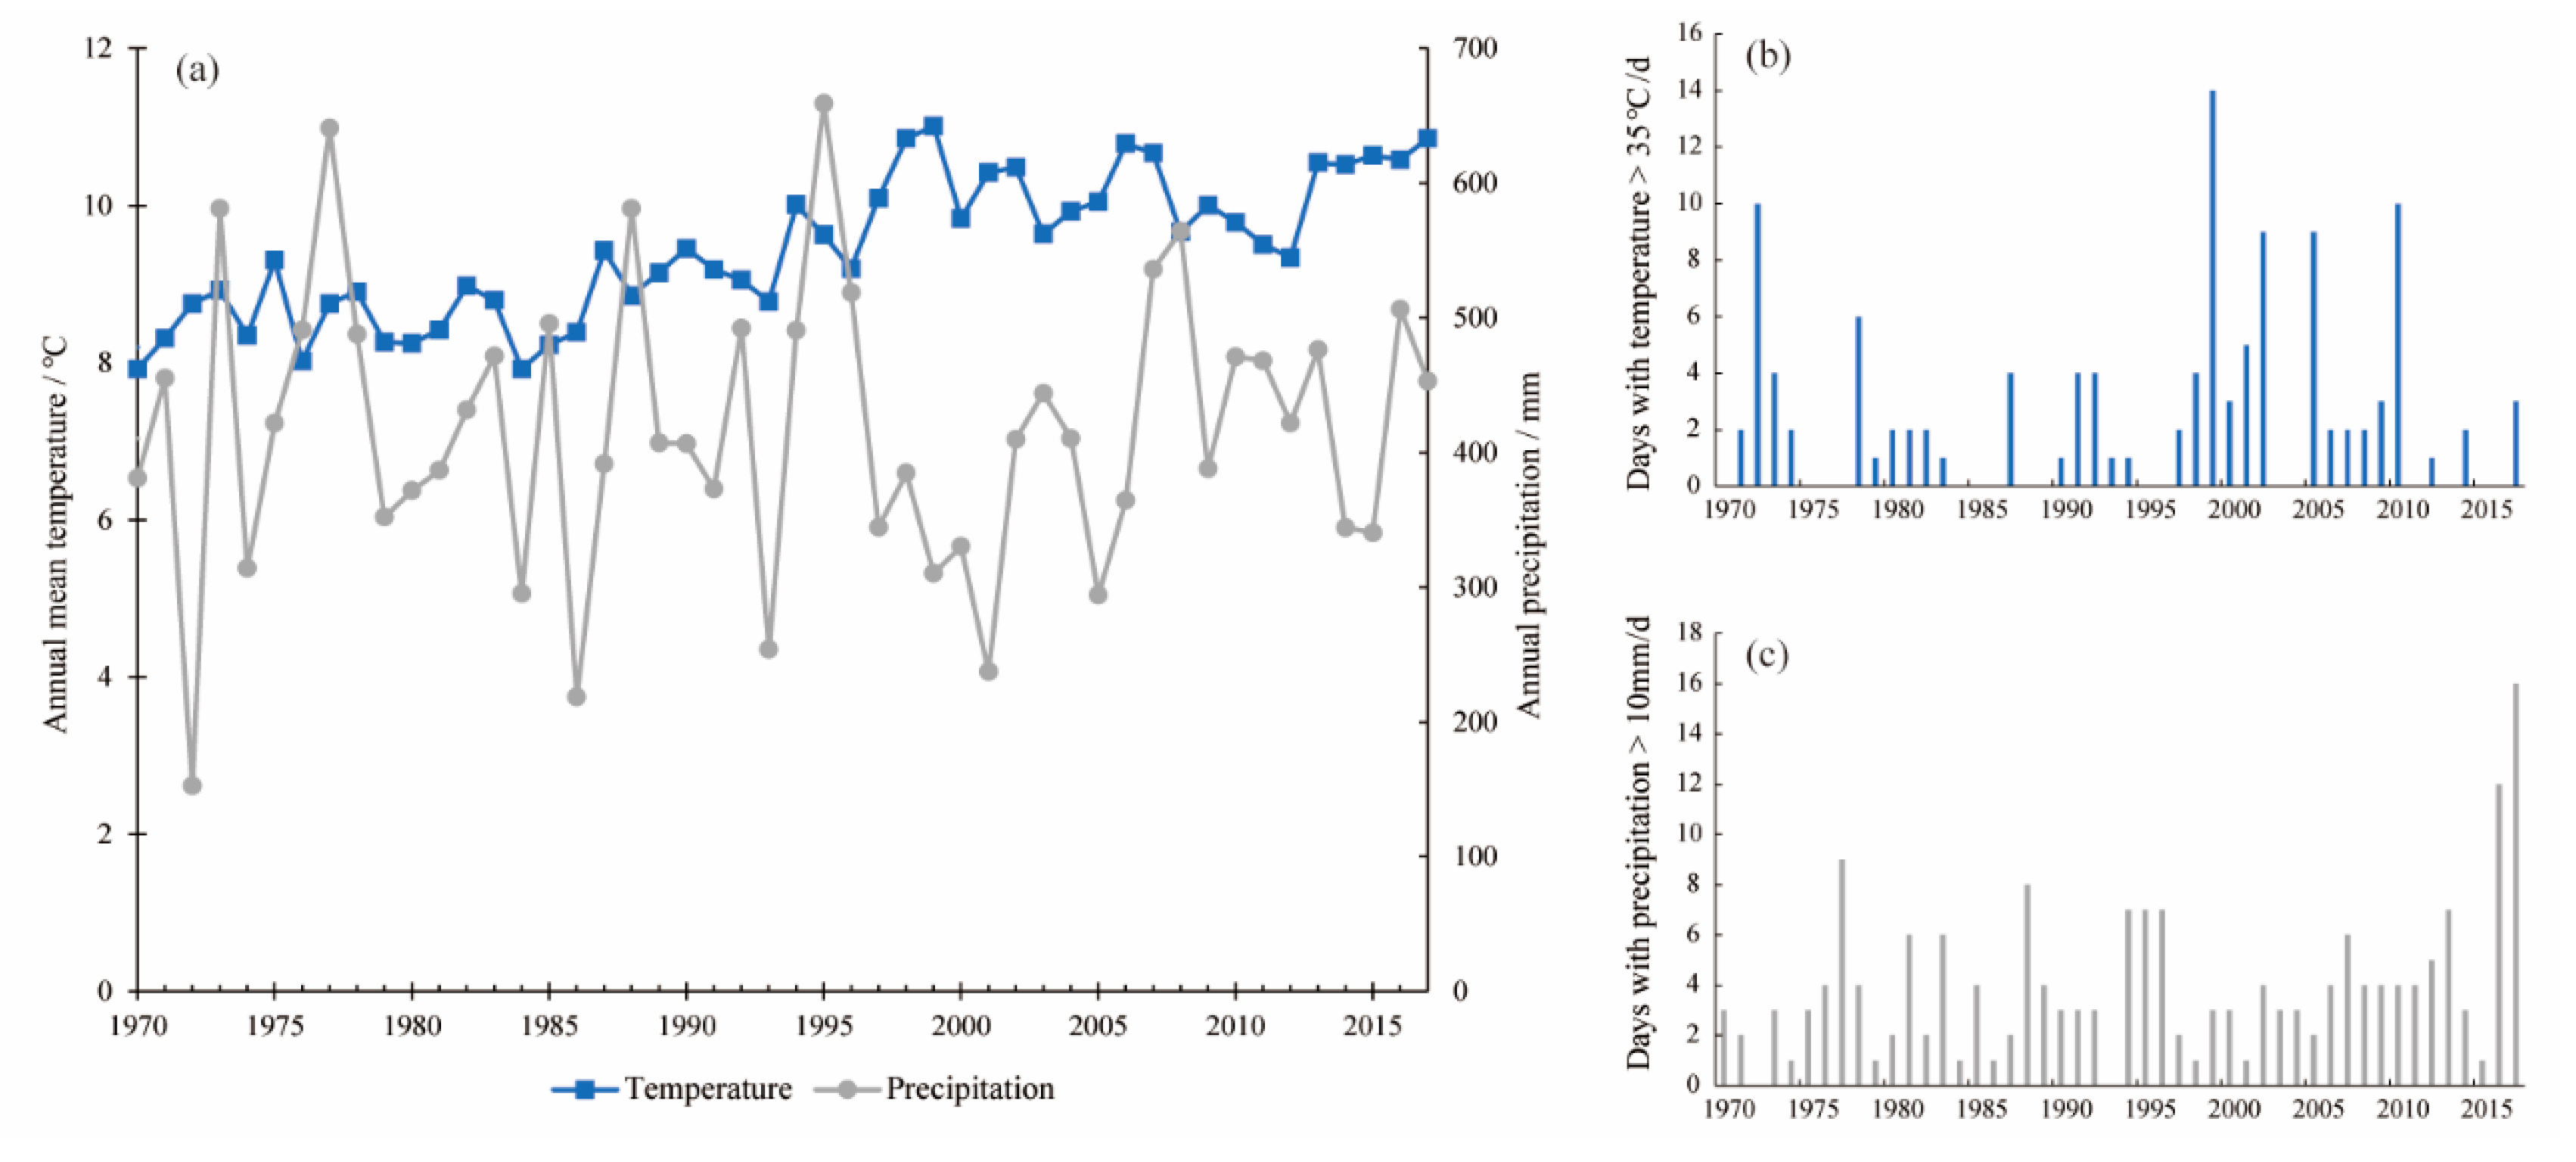
The agricultural area represented by Yuanping has higher vulnerability to precipitation. The key to climate change adaptive management measures in agricultural areas lies in the improvement of farmers’ awareness of climate change and the establishment of adaptation consciousness.
(2)
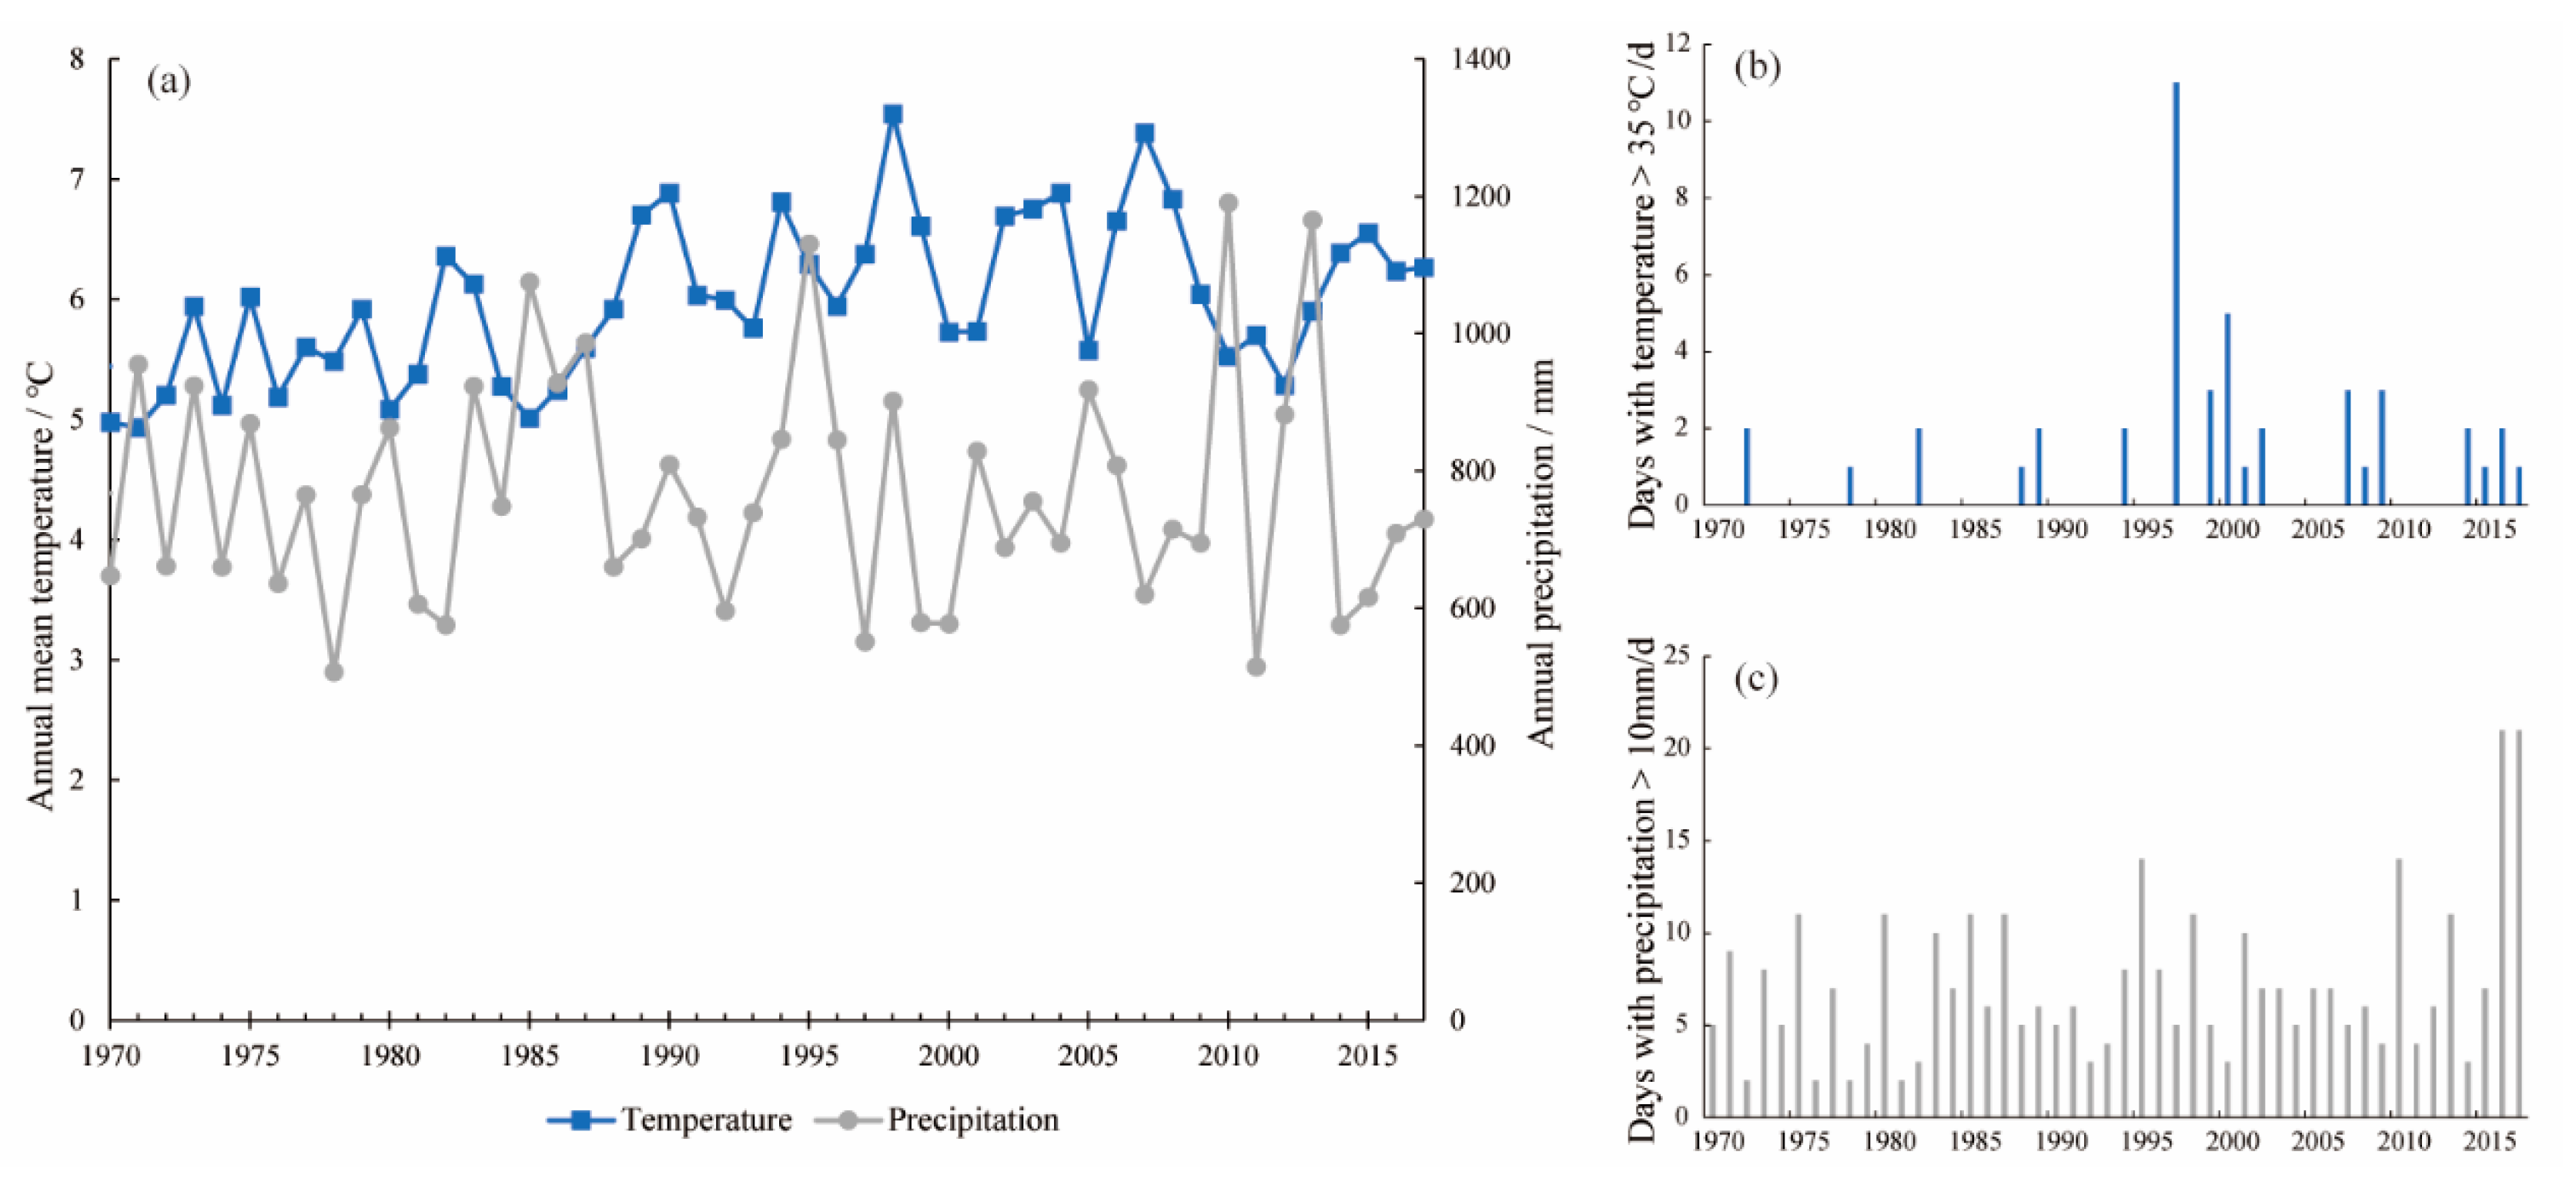
The forest area represented by Qingyuan has a relatively strong ability to adapt to climate change. Adaptive management of climate change in forest areas is usually large-scale and high-cost, which is difficult to achieve without full participation of technology and engineering adaptive management measures.
(3)
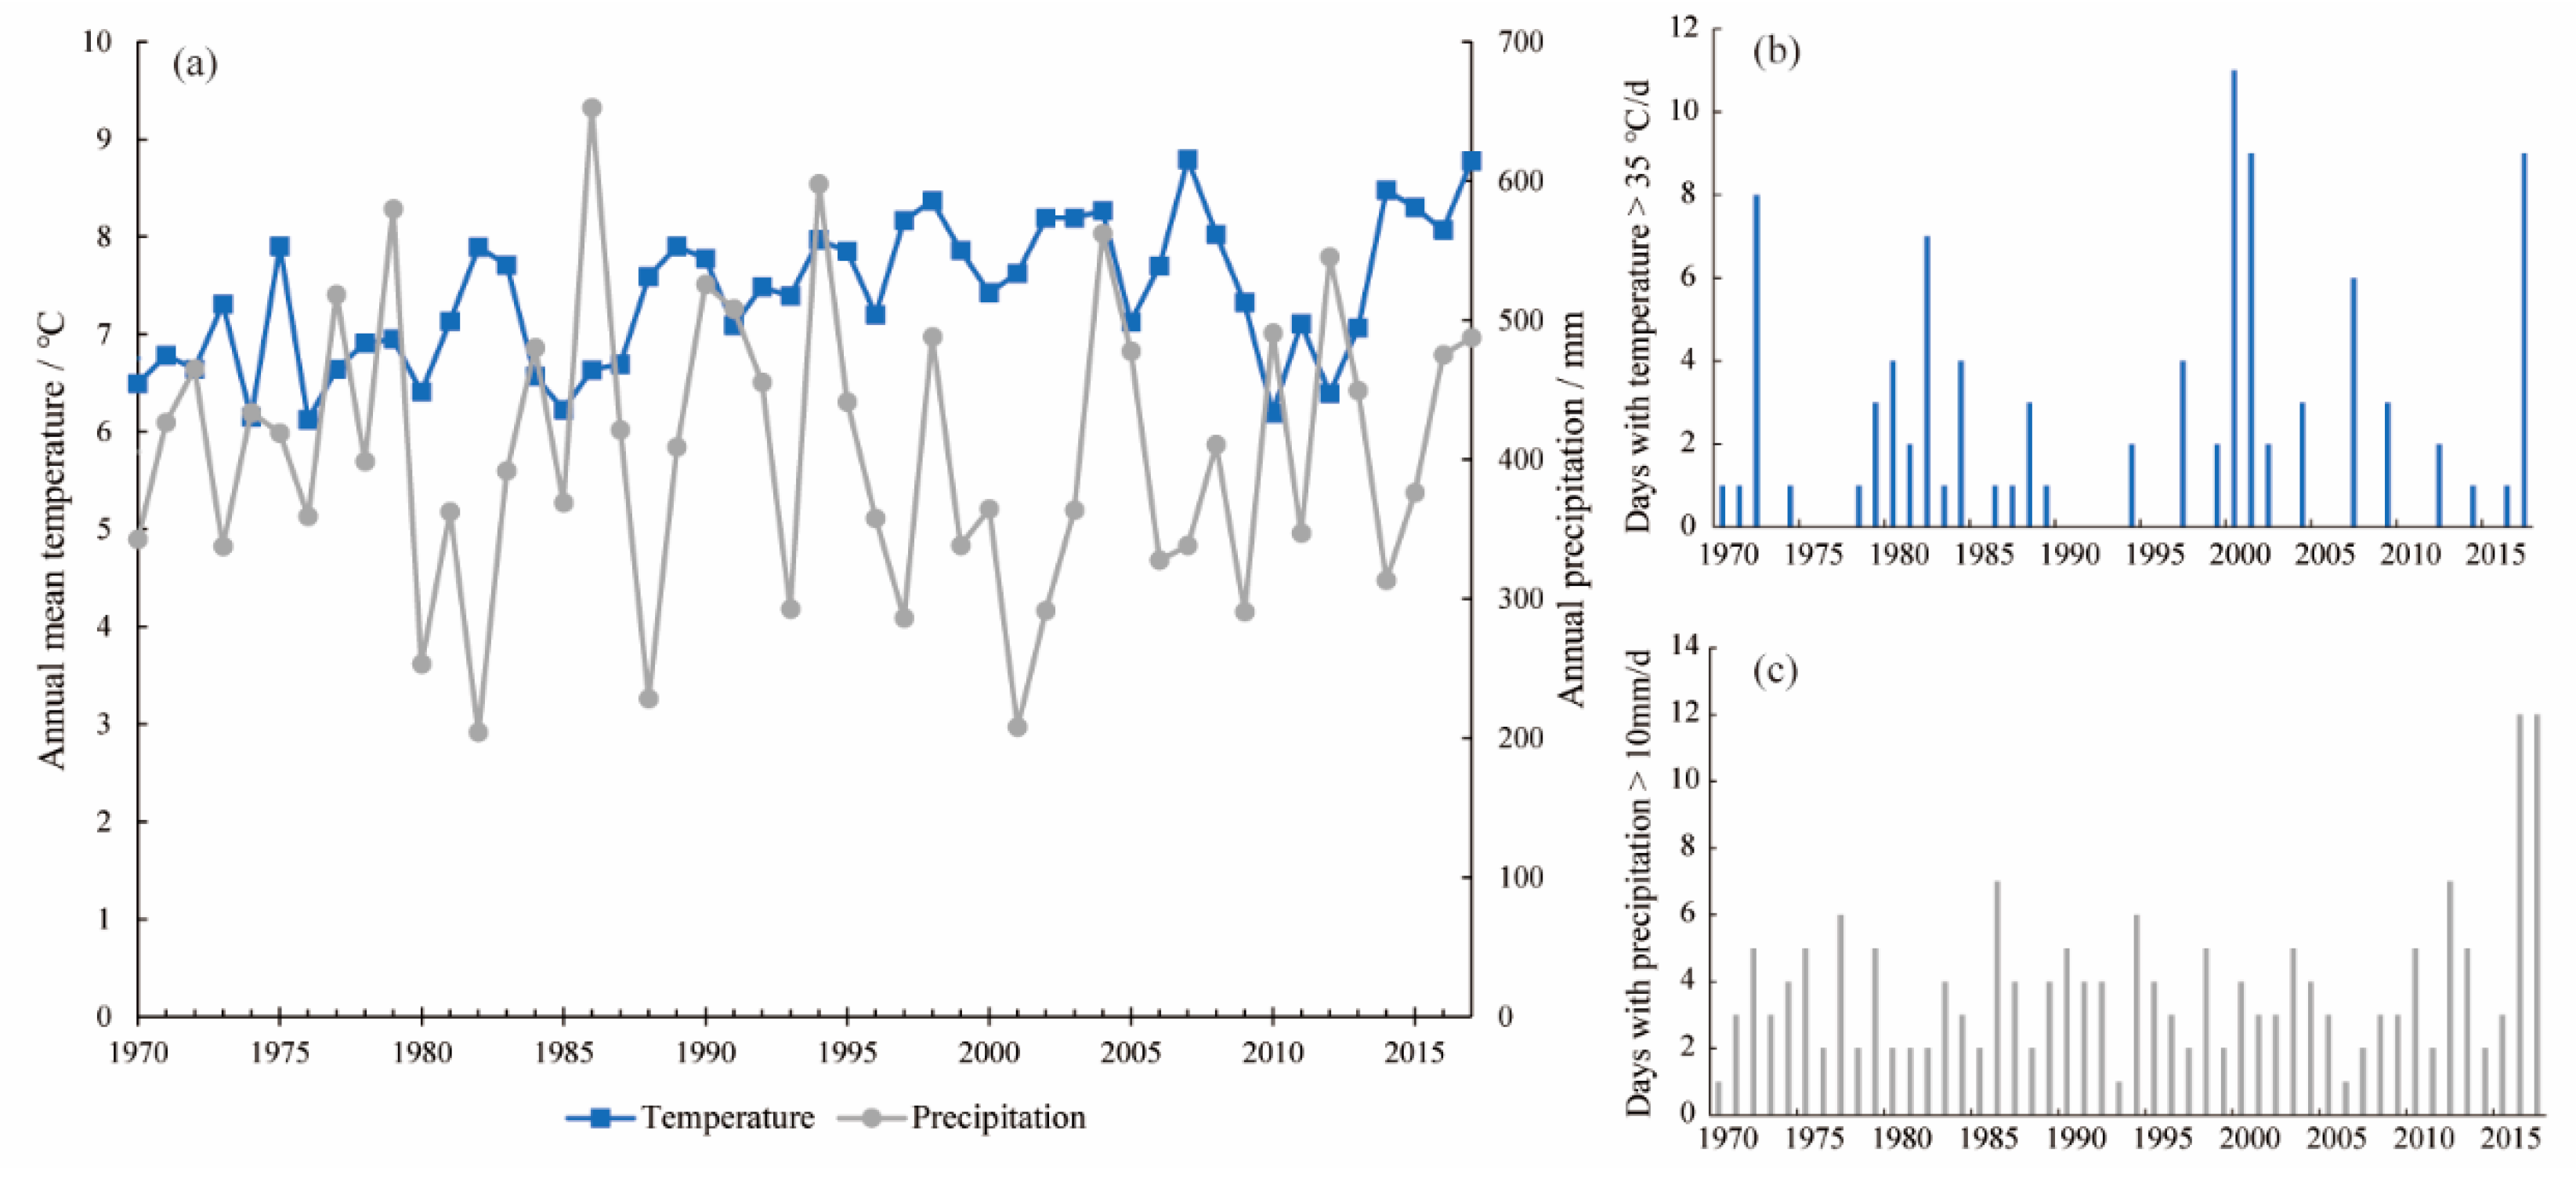
The climate of pastoral areas represented by Kulun is the most vulnerable. As a result of long-term disasters, pastoralists have usually developed unique engineering methods but still face problems such as lack of funds and water shortage, which require the cooperation of the government and research institutions to provide both institutional and technical protection.
Based on the analysis of meteorological data and survey data, this paper puts forward targeted adaptive management measures for agriculture, forestry, and pastoral areas in China but was not able to analyze the effectiveness of these measures through empirical research, which could be the direction of future research.

Supplementary Materials

The following are available online at https://www.mdpi.com/article/10.3390/land10080832/s1, Table S1: Results of survey in Yuanping, Qingyuan and Kulun.

Author Contributions

Conceptualization, F.Z. and B.L.; methodology, X.X.; software, X.X.; validation, B.L.; formal analysis, X.X.; investigation, F.Z.; resources, F.Z.; data curation, X.X.; writing—original draft preparation, X.X. and F.Z.; writing—review and editing, B.L.; visualization, X.X.; supervision, B.L.; project administration, B.L.; funding acquisition, F.Z. All authors have read and agreed to the published version of the manuscript.

Funding

This research was funded by the Strategic Priority Research Program of Chinese Academy of Sciences, grant number XDA23070402.

Data Availability Statement

Not applicable.

Conflicts of Interest

The authors declare no conflict of interest.

References

  1. National Bureau of Statistics. China Statistical Yearbook 2020; China Statistics Press: Beijing, China, 2021; pp. 32–57. [Google Scholar]
  2. IPCC. AR5 Synthesis Report: Climate Change 2014—IPCC; IPCC: Geneva, Switzerland, 2014; p. 151. [Google Scholar]
  3. Li, R.; Geng, S. Impacts of climate change on agriculture and adaptive Strategies in China. J. Integr. Agric. 2013, 12, 1402–1408. [Google Scholar] [CrossRef]
  4. Xie, W.; Huang, J.; Wang, J.; Cui, Q.; Robertson, R.; Chen, K. Climate change impacts on China’s agriculture: The responses from market and trade. China Econ. Rev. 2020, 62, 101256. [Google Scholar] [CrossRef]
  5. Wu, F.; Wang, Y.; Liu, Y.; Liu, Y.; Zhang, Y. Simulated responses of global rice trade to variations in yield under climate change: Evidence from main rice-producing countries. J. Clean. Prod. 2021, 281, 124690. [Google Scholar] [CrossRef]
  6. Bai, Y.; Deng, X.; Jiang, S.; Zhao, Z.; Miao, Y. Relationship between climate change and low-carbon agricultural production: A case study in Hebei Province, China. Ecol. Indic. 2019, 105, 438–447. [Google Scholar] [CrossRef]
  7. Wang, P.; Deng, X.; Jiang, S. Global warming, grain production and its efficiency: Case study of major grain production region. Ecol. Indic. 2019, 105, 563–570. [Google Scholar] [CrossRef]
  8. Bastin, J.-F.; Finegold, Y.; Garcia, C.; Mollicone, D.; Rezende, M.; Routh, D.; Zohner, C.M.; Crowther, T.W. The global tree restoration potential. Science 2019, 365, 76–79. [Google Scholar] [CrossRef]
  9. Bonan, G.B. Forests and climate change: Forcings, feedbacks, and the climate benefits of forests. Science 2008, 320, 1444–1449. [Google Scholar] [CrossRef] [Green Version]
  10. Deng, X.; Gibson, J.; Wang, P. Quantitative measurements of the interaction between net primary productivity and livestock production in Qinghai Province based on data fusion technique. J. Clean. Prod. 2017, 142, 758–766. [Google Scholar] [CrossRef]
  11. Zhao, Z.; Bai, Y.; Deng, X.; Chen, J.; Hou, J.; Li, Z. Changes in livestock grazing efficiency incorporating grassland productivity: The case of Hulun Buir, China. Land 2020, 9, 447. [Google Scholar] [CrossRef]
  12. Aven, T.; Renn, O. An evaluation of the treatment of risk and uncertainties in the IPCC reports on climate change. Risk Anal. 2015, 35, 701–712. [Google Scholar] [CrossRef]
  13. Reggiani, P.; Todini, E.; Boyko, O.; Buizza, R. Assessing uncertainty for decision-making in climate adaptation and risk mitigation. Int. J. Climatol. 2021, 41, 2891–2912. [Google Scholar] [CrossRef]
  14. Guodaar, L.; Bardsley, D.K.; Suh, J. Integrating local perceptions with scientific evidence to understand climate change variability in Northern Ghana: A mixed-methods approach. Appl. Geogr. 2021, 130, 102440. [Google Scholar] [CrossRef]
  15. Kc, K.B.; Elliott, V.; Seng, R.; Pomeroy, R.S.; Schenkels, J.; Fraser, E.D.G. Evaluating community fishery management using fishers’ perceptions in the Tonle Sap Lake of Cambodia. Environ. Dev. 2020, 33, 100503. [Google Scholar] [CrossRef]
  16. Ado, A.M.; Leshan, J.; Savadogo, P.; Bo, L.; Shah, A.A. Farmers’ awareness and perception of climate change impacts: Case study of Aguie district in Niger. Environ. Dev. Sustain. 2019, 21, 2963–2977. [Google Scholar] [CrossRef]
  17. Alexander, C.; Bynum, N.; Johnson, E.; King, U.; Mustonen, T.; Neofotis, P.; Oettle, N.; Rosenzweig, C.; Sakakibara, C.; Shadrin, V.; et al. Linking indigenous and scientific knowledge of climate change. Bioscience 2011, 61, 477–484. [Google Scholar] [CrossRef] [Green Version]
  18. van Bavel, B.; Ford, L.B.; Harper, S.L.; Ford, J.; Elsey, H.; Lwasa, S.; King, R. Contributions of scale: What we stand to gain from indigenous and local inclusion in climate and health monitoring and surveillance systems. Environ. Res. Lett. 2020, 15, 083008. [Google Scholar] [CrossRef]
  19. Hurlbert, M.; Gupta, J. Adaptive governance, uncertainty, and risk: Policy framing and responses to climate change, drought, and flood. Risk Anal. 2016, 36, 339–356. [Google Scholar] [CrossRef]
  20. Adger, W.N.; Arnell, N.W.; Tompkins, E.L. Successful adaptation to climate change across scales. Glob. Environ. Change 2005, 15, 77–86. [Google Scholar] [CrossRef]
  21. Chaffin, B.; Gosnell, H.; Cosens, B. A decade of adaptive governance scholarship: Synthesis and future directions. Ecol. Soc. 2014, 19, 56. [Google Scholar] [CrossRef]
  22. Berkes, F.; Folke, C.; Colding, J. Linking Social and Ecological Systems: Management Practices and Social Mechanisms for Building Resilience; Cambridge University Press: Cambridge, UK, 2000. [Google Scholar]
  23. Plummer, R.; Armitage, D. A resilience-based framework for evaluating adaptive co-management: Linking ecology, economics and society in a complex world. Ecol. Econ. 2007, 61, 62–74. [Google Scholar] [CrossRef]
  24. Fischer, H.W. Decentralization and the governance of climate adaptation: Situating community-based planning within broader trajectories of political transformation. World Dev. 2021, 140, 105335. [Google Scholar] [CrossRef]
  25. Dickinson, K.L.; Monaghan, A.J.; Rivera, I.J.; Hu, L.; Kanyomse, E.; Alirigia, R.; Adoctor, J.; Kaspar, R.E.; Oduro, A.R.; Wiedinmyer, C. Changing weather and climate in Northern Ghana: Comparison of local perceptions with meteorological and land cover data. Reg. Environ. Chang. 2017, 17, 915–928. [Google Scholar] [CrossRef]
  26. Shrestha, U.B.; Shrestha, A.M.; Aryal, S.; Shrestha, S.; Gautam, M.S.; Ojha, H. Climate change in Nepal: A comprehensive analysis of instrumental data and people’s perceptions. Clim. Chang. 2019, 154, 315–334. [Google Scholar] [CrossRef]
  27. Olsson, P.; Folke, C.; Hahn, T. Social-ecological transformation for ecosystem management: The development of adaptive co-management of a wetland landscape in Southern Sweden. Ecol. Soc. 2004, 9, 2. [Google Scholar] [CrossRef]
  28. Bronen, R.; Chapin, F.S. Adaptive governance and institutional strategies for climate-induced community relocations in Alaska. Proc. Natl. Acad. Sci. USA 2013, 110, 9320–9325. [Google Scholar] [CrossRef] [Green Version]
  29. Singh, P.K.; Chudasama, H. Pathways for climate change adaptations in arid and semi-arid regions. J. Clean. Prod. 2021, 284, 124744. [Google Scholar] [CrossRef]
  30. Schulz, C.; Whitney, B.S.; Rossetto, O.C.; Neves, D.M.; Crabb, L.; de Oliveira, E.C.; Terra Lima, P.L.; Afzal, M.; Laing, A.F.; de Souza Fernandes, L.C.; et al. Physical, ecological and human dimensions of environmental change in Brazil’s pantanal wetland: Synthesis and research agenda. Sci. Total Environ. 2019, 687, 1011–1027. [Google Scholar] [CrossRef] [PubMed]
  31. Eshetu, G.; Johansson, T.; Garedew, W.; Yisahak, T. Determinants of smallholder farmers’ adaptation options to climate change in a coffee-based farming system of Southwest Ethiopia. Clim. Dev. 2020, 13, 1–8. [Google Scholar] [CrossRef]
  32. Nazemi, N.; Foley, R.W.; Louis, G.; Keeler, L.W. Divergent agricultural water governance scenarios: The case of Zayanderud basin, Iran. Agric. Water Manag. 2020, 229, 105921. [Google Scholar] [CrossRef]
  33. Urquiza, A.; Billi, M. Water markets and social-ecological resilience to water stress in the context of climate change: An analysis of the Limari Basin, Chile. Environ. Dev. Sustain. 2020, 22, 1929–1951. [Google Scholar] [CrossRef]
  34. Mourao, J.S.; Baracho, R.L.; Martel, G.; Duarte Barboza, R.R.; de Faria Lopes, S. Local ecological knowledge of shellfish collectors in an extractivist reserve, Northeast Brazil: Implications for co-management. Hydrobiologia 2020, 847, 1977–1997. [Google Scholar] [CrossRef]
  35. Mancini, F.; Leyshon, B.; Manson, F.; Coghill, G.M.; Lusseau, D. Monitoring tourists’ specialisation and implementing adaptive governance is necessary to avoid failure of the wildlife tourism commons. Tour. Manag. 2020, 81, 104160. [Google Scholar] [CrossRef]
  36. Chen, S.; Gong, B. Response and adaptation of agriculture to climate change: Evidence from China. J. Dev. Econ. 2021, 148, 102557. [Google Scholar] [CrossRef]
  37. Huang, K.; Wang, J.; Huang, J.; Findlay, C. The potential benefits of agricultural adaptation to warming in China in the long run. Environ. Dev. Econ. 2018, 23, 139–160. [Google Scholar] [CrossRef] [Green Version]
  38. Jin, J.; Wang, W.; Wang, X. Adapting agriculture to the drought hazard in rural China: Household strategies and determinants. Nat. Hazards 2016, 82, 1609–1619. [Google Scholar] [CrossRef]
  39. Yang, Z.; Jiu, C.; Mace, R.H.; Du, J.; Bai, P.; Du, G. Adaptive strategies adopted by herders against the decollectivization of rangeland in the Qinghai-Tibetan Plateau in China. Mt. Res. Dev. 2019, 39, D11–D20. [Google Scholar]
  40. Gocic, M.; Trajkovic, S. Analysis of changes in meteorological variables using Mann-Kendall and Sen’s slope estimator statistical tests in Serbia. Glob. Planet. Chang. 2013, 100, 172–182. [Google Scholar] [CrossRef]
  41. Tabari, H.; Hosseinzadehtalaei, P. Analysis of trends in temperature data in arid and semi-arid regions of Iran. Glob. Planet. Chang. 2011, 79, 1–10. [Google Scholar] [CrossRef]
  42. Hamed, K.H.; Ramachandra Rao, A. A modified Mann-Kendall trend test for autocorrelated data. J. Hydrol. 1998, 204, 182–196. [Google Scholar] [CrossRef]
  43. Kendall, M.G. Rank Correlation Methods; Griffin: Oxford, UK, 1948. [Google Scholar]
  44. Mann, H.B. Nonparametric tests against trend. Econometrica 1945, 13, 245–259. [Google Scholar] [CrossRef]
  45. Sen, P.K. Estimates of the regression coefficient based on Kendall’s Tau. J. Am. Stat. Assoc. 1968, 63, 1379–1389. [Google Scholar] [CrossRef]
  46. Gilbert, R.O. Statistical Methods for Environmental Pollution Monitoring; John Wiley & Sons: Hoboken, NJ, USA, 1987. [Google Scholar]
  47. Hollander, M.; Wolfe, D.A.; Chicken, E. Nonparametric Statistical Methods, 3rd ed.; John Wiley & Sons: Hoboken, NJ, USA, 2013. [Google Scholar]
  48. IPCC. Climate Change 2007: Impacts, Adaptation and Vulnerability; Cambridge University Press: Cambridge, UK, 2007. [Google Scholar]
  49. Xu, X.; Li, J.; Shen, Z. Vulnerability of farmland ecosystems in countries along the “Belt and Road” and responses to climate change. J. Geogr. Inf. Sci. 2020, 22, 877–886. [Google Scholar]
  50. Zhang, S.; Zhang, F.; Wang, C.; Wang, Z. Assessing the resilience of the belt and road countries and its spatial heterogeneity: A comprehensive approach. PLoS ONE 2020, 15, e0238475. [Google Scholar]
  51. China Meteorological Administration, Climate Change Center. China Blue Book on Climate Change; China Meteorological Administration: Beijing, China, 2019. [Google Scholar]
  52. Alvar-Beltrán, J.; Dao, A.; Dalla Marta, A.; Heureux, A.; Sanou, J.; Orlandini, S. Farmers’ perceptions of climate change and agricultural adaptation in Burkina Faso. Atmosphere 2020, 11, 827. [Google Scholar] [CrossRef]
  53. Funk, C.; Raghavan Sathyan, A.; Winker, P.; Breuer, L. Changing climate—Changing livelihood: Smallholder’s perceptions and adaption strategies. J. Environ. Manag. 2020, 259, 109702. [Google Scholar] [CrossRef] [PubMed]
  54. Guo, R.; Li, Y.; Shang, L.; Feng, C.; Wang, X. Local farmer’s perception and adaptive behavior toward climate change. J. Clean. Prod. 2021, 287, 125332. [Google Scholar] [CrossRef]
  55. Fu, Y.; Xiong, K.; Zhang, Z. Ecosystem services and ecological compensation of world heritage: A literature review. J. Nat. Conserv. 2021, 60, 125968. [Google Scholar] [CrossRef]
  56. Committee for the Preparation of the Third National Climate Change Assessment Report. Third National Climate Change Assessment Report; Science Press: Beijing, China, 2015. [Google Scholar]
Figure 1. Location of the study area (a), land use of Qingyuan (b), Yuanping (c), and Kulun (d).
Land 10 00832 g001
Figure 2. Variation of annual average temperature and annual precipitation (a), days with temperature above 35 °C (b), days with precipitation above 10 mm (c) in Yuanping from 1970 to 2017.
Land 10 00832 g002
Figure 3. Variation of annual average temperature and annual precipitation (a), days with temperature above 35 °C (b), days with precipitation above 10 mm (c) in Qingyuan from 1970 to 2017.
Land 10 00832 g003
Figure 4. Variation of annual average temperature and annual precipitation (a), days with temperature above 35 °C (b), days with precipitation above 10 mm (c) in Kulun from 1970 to 2017.
Land 10 00832 g004
Figure 5. Vulnerability assessment results of Yuanping, Qingyuan, and Kulun.
Land 10 00832 g005
Table 1. Natural conditions and climate profiles of study areas.
CasesLong. (E)Lat. (N)TypesClimate TypesAnnual Precipitation (mm)Annual Average Temperature (℃)Areas in Total (km2)Main Land Types and Areas (km2)
Yuanping112°42′38°43′AgricultureTemperate monsoon climate4328.42560Cropland/740
Qingyuan124°55′42°06′ForestryContinental monsoon climate in mid temperate zone7885.33933Forest/2107
Kulun121°46′42°44′Animal husbandryTemperate continental climate402.36.64716Grass/2653
Table 2. Change trend tests and vulnerability assessment in climate elements.
Climatic ElementsCasesMK (Zs)Sen’s (Qmed)SensibilityAdaptability
TemperatureYuanping6.1239 **0.0531 **1.5718−0.0651
Qingyuan3.4843 **0.0250 **1.8587−0.0226
Kulun3.7863 **0.0315 **1.69490.1229
PrecipitationYuanping0.23110.31981.7697−0.5851
Qingyuan−0.4444−0.81291.41950.0257
Kulun0.00890.01551.9111−0.0489
** means significant at 0.01 level.
Table 3. Adaptive management measures for climate change in agricultural areas.
Institutional MeasuresTechnical MeasuresEngineering Measures
Training on climate change awareness and information accessImproving the replanting index and adjust crop planting seasonConstruction of irrigation facilities, development of drought-resistant water-saving agriculture
Establishing an agricultural ecological compensation mechanism to improve the efficiency of the use of compensation fundsDeveloping the biological seed industry and intelligent agriculture to promote the key areas of agricultural technology for self-improvementSelection of grain varieties with high resistance to adversity
Establishing a weather disaster warning system (or emergency plan)Strengthening renewable energy developmentMulching and construction of greenhouses
Improving agricultural disaster insurance mechanismArtificial weather intervention (artificial rainfall, etc.)Reasonable application of fertilizers and pesticides to reduce the impact of pests and diseases
Table 4. Adaptive management measures for climate change in forestry areas.
Institutional MeasuresTechnical MeasuresEngineering Measures
Improving forestry public investment policy and establish a unified national forestry financial mechanismImproving harvesting operation measures to improve the efficiency of comprehensive wood utilizationThe implementation of the natural forest resources protection project, the project of returning farmland to forest, the Beijing–Tianjin wind and sand source management project, three norths and the middle, and other key protection forestry projects key projects
Establishing a standard indicator system for forestry carbon sink assessmentForest zoning (protected areas, intensive managed areas, extensive operated areas)Development of ecological conservation and restoration technologies for desert forests
Exploring the implementation of the same incentive policy for forestry carbon sink increase and industrial emission reductionVigorously developing the development of forestry biomass energyEstablishing agroforestry complex systems and enhancing sustainable forest development
Developing forest fire warning and pest and disease warning mechanismThinning, partial harvesting, optimizing tree species composition, reducing deforestation, and clearcuttingVigorously developing fast-growing and productive forests and strengthening the intensive management of planted forests
Table 5. Adaptive management measures for climate change in pastoral areas.
Institutional MeasuresTechnical MeasuresEngineering Measures
Promoting grass–livestock balance and protecting grassland ecosystem multifunctionalityImplementing pasture assessment and reasonable grazingDeveloping “rotational grazing” to alleviate pasture degradation
Establishing a disaster resilience and mitigation fund to enhance the human, social, and financial capital of pastoralistsEstablishing a climate change information sharing and disaster information warning platformReturning pasture to grass and cultivation to forest to achieve optimal use of land resources
Accelerating the construction of rural community cooperative organizations to broaden the channels for farmers to increase their incomeArtificial rainfallJoint operation and establishment of public pasture
Increasing investment to strengthen the construction of pastoral infrastructureImproving grass and livestock breeds to improve resistance to adversity and diseaseSavings grazing
Publisher’s Note: MDPI stays neutral with regard to jurisdictional claims in published maps and institutional affiliations.

