Article

Flood Risk Assessment under Land Use and Climate Change in Wuhan City of the Yangtze River Basin, China

1
Key Laboratory of Land Surface Pattern and Simulation, Institute of Geographic Sciences and Natural Resources Research, Chinese Academy of Sciences, Beijing 100101, China
2
University of Chinese Academy of Sciences, Beijing 100049, China
*
Author to whom correspondence should be addressed.
Land 2021, 10(8), 878; https://doi.org/10.3390/land10080878
Submission received: 30 June 2021 / Revised: 7 August 2021 / Accepted: 20 August 2021 / Published: 21 August 2021
(This article belongs to the Special Issue Land Use and Climate Change)

Abstract

:
Frequently occurring flood disasters caused by extreme climate and urbanization processes have become the most common natural hazard and pose a great threat to human society. Therefore, urban flood risk assessment is of great significance for disaster mitigation and prevention. In this paper, the analytic hierarchy process (AHP) was applied to quantify the spatiotemporal variations in flood risk in Wuhan during 2000–2018. A comprehensive flood risk assessment index system was constructed from the hazard, sensitivity, and vulnerability components with seven indices. The results showed that the central urban area, especially the area in the west bank of the Yangtze river, had high risk due to its high flood sensitivity that was determined by land use type and high vulnerability with dense population and per unit GDP. Specifically, the Jianghan, Qiaokou, Jiangan, and Wuchang districts had the highest flood risk, more than 60% of whose area was in medium or above-medium risk regions. During 2000–2018, the flood risk overall showed an increasing trend, with Hongshan district increasing the most, and the year of 2010 was identified as a turning point for rapid risk increase. In addition, the comparison between the risk maps and actual historical inundation point records showed good agreement, indicating that the assessment framework and method proposed in this study can be useful to assist flood mitigation and management, and relevant policy recommendations were proposed based on the assessment results.

1. Introduction

Flooding is one of the most common natural disasters globally, which has had great impacts on human society, causing widespread losses of life and property [1,2]. It was recorded that flooding events caused USD 656 billion worth of economic losses and affected 2 billion globally during 1988–2017 [3]. China is a country that has suffered the most from flooding, ranking first in economic loss and affected population [4]. In recent years, due to climate warming and rapid urbanization process, the frequency of flooding induced by extreme weather has gradually increased in many regions of the world, leading to more life and economic losses in city areas with more population and economy exposed to natural disasters [1,5,6]. The frequency and severity of flooding events are expected to increase with intense rainfall under climate change [7]. Land use transitions from other land types into impervious surfaces during the urbanization process affect the hydrological and hydrometeorological environments, preventing rainwater from percolating into the ground and further leading to increased flooding risks [8,9]. Cites are at the forefront of climate change and rapid urbanization processes and are more vulnerable to flooding [2,10]. Many cities in China, such as Wuhan, Guangzhou, and Beijing, are facing frequent flooding [4,11]. Moreover, flood risk is expected to be aggravated under future climate change and urban expansion [8,12,13]. Therefore, it is necessary to quantitatively assess the flood risk under land use and climate change to support flood management strategies to minimize potential damages.
During recent decades, the middle and lower reaches of Yangtze river have experienced increasing frequencies of severe floods due to abnormal rainfall and land use changes. Wuhan, as the core of the city cluster in the middle reach of Yangtze river, mostly experiences frequent flood disasters due to the frequent extreme weather events and the changes in landscape caused by hardened urban roads [14]. Moreover, the developed economy and high level of urbanization also let the quota of post-disaster economic loss greatly increase [13]. In the latest year of 2016, Wuhan once again set a new weekly continuous precipitation record, which affected more than 700,000 people, damaged nearly 100,000 hectares of crops, and caused a direct economic loss of CNY 2.2 billion [15]. It can be seen that Wuhan has experienced serious flood disasters. Therefore, it is of great significance to explore an urban flood risk assessment model suitable for Wuhan to improve the response speed, ensure regional economic and social stability, give targeted early warnings, and enhance disaster reduction and prevention.
The concept of flood risk is not unique but mostly defined as a product of hazard, exposure (or vulnerability), and sensitivity [16,17,18,19]. Hazard is related to the probability and extent of flood impacts; exposure (vulnerability) represents the values or humans that are involved in the area affected by floods; sensitivity is the perception to flood, which is determined by the characteristics of the affected areas [8,17,20]. In the past few decades, urban flood risk assessment has become a focus in the field of disaster control and management globally [5,18]. Flood risk assessment and mapping is a crucial part of flood risk management, aiming to identify the location, magnitude, and distribution of risk areas under intense rainfall to provide key information for future urban planning and disaster mitigation [21,22]. At present, there are many kinds of methods for flood risk assessment, including hydrologic and hydraulic models [23,24], historical disaster mathematical statistics analysis [15,25], geographic information system (GIS) and remote sensing (RS) coupling analysis [26], scenario simulation analysis [27,28], machine learning models (MLMs) [29,30], and multi-criteria decision analysis (MCDA) [26,31,32]. Among these methods, historical disaster analysis is easy to implement based on the statistics of historical disasters, and its assessment results are generally consistent with reality. However, it is generally used for post-disaster loss assessment based on sufficient historical data and cannot reflect the spatial variability in urban flood risk [33]. GIS and RS-based assessments have a great advantage in terms of assessment scope and timeliness with remotely sensed data during the flood period. However, it is subject to image resolution and the flood scope is inaccurate, which cannot reflect key information such as submerged water depth and surface velocity [34]. Scenario simulation analysis often relies on hydraulics/hydrodynamic models, such as Mike, Storm Water Management Model (SWMM), and Urban Flood Cell Model (MODCEL), which require high-accuracy and high-resolution data that are difficult to obtain in practical application. Moreover, the hydraulics/hydrodynamic models are generally suitable for small watersheds due to the complexity of information [35]. MLM has been widely applied in recent years, as it is relatively flexible and objective through automatically learning flood risk characteristics based on an intelligent model [36]. Meanwhile, as MLMs are newly applied in flood risk assessment, whether the models are powerful and suitable require further exploration [37]. MCDA is the method that is widely applied in flood risk assessment, which provides a flexible scheme for flood risk assessment [38]. However, the index weight assignment in MCDA is relatively subjective and the index system may be not adequate enough to reflect the risk [39]. Nevertheless, MCDA is widely applied in flood risk assessment at the macro scale to reflect the regional risk situation in China.
Based on the above analysis, the MCDA combining GIS can be a suitable approach for flood risk assessment at the city level in Wuhan. The construction of an index system for MCDA should use comprehensive indicators that cover the aspects of hazard, exposure, and sensitivity. Generally, the morphological, hydrometeorological, and demographic factors, such as rainfall patterns, slope, elevation, drainage density, distance from the river network, land use types, and population density, are commonly considered [21,31]. Specifically, the urban surface condition is key factor in flood risk assessment. However, the existing index system mostly uses vegetation coverage, river network density, and other indicators to represent the surface infiltration, and fails to integrate them into a single physical concept for comprehensive analysis, resulting in a certain degree of index duplication. Thus, the curve number (CN) index, which can represent the maximum possible retention of the soil conservation service (SCS) hydrological model, was innovatively introduced into the index system as one of the sensitivity indexes to further quantify the influence of urban surface infiltration capacity on flood disasters [40].
The formation of an urban flood is the result of the mutual influence among the disaster-causing factors, disaster formative environment, and the disaster bears [18,41], in which disaster-causing factors such as extreme rainfall reflect the probability of hazard, disaster-formative environments influence the redistribution of rainfall and determine the perception to flood (sensitivity), and disaster bears exposed to flood, such as the number of impacted people and infrastructure, and the vulnerability and resiliency of the affected area, reflect the consequences caused by disaster-causing factors. Then, the flood risk is defined as the product of hazard, exposure, and sensitivity [18]. Based on the above framework, the objective of this study was to clarify the spatiotemporal variations in flood risk in Wuhan city during 2000–2018. First, a complete risk assessment system for Wuhan urban flood disasters was formed; then, the analytic hierarchy process (AHP) as one of the MCDA techniques within a GIS mapping environment was applied to assess the flood risks; finally, the spatiotemporal variations in the resulting flood risk were presented and analyzed, which provide efficient guidance for flood risk management.

2. Materials and Methods

2.1. Study Area

Wuhan is the capital city of Hubei Province in Central China, located in the middle of the Yangtze River Economic belt, spanning 113°41′–115°05′ E and 29°58′–31°22′ N, covering an area of 8467 km2 (Figure 1). Wuhan covers 13 districts, including 7 central districts (Jiang’an, Jianghan, Qiaokou, Hanyang, Wuchang, Hongshan, and Qingshan) and 6 new districts (Dongxihu, Caidian, Jiangxia, Huangpi, Xinzhou, and Hannan). As the largest metropolis in central China and the core city of urban agglomeration in the middle of the Yangtze River Economic belt, Wuhan is characterized with rapid economic development and high economic growth. In 2019, Wuhan had a population of 11.212 million and GDP of CNY 1622.321 billion, ranking 7th in the China’s city GDP [42,43]. The developed economy and large amount of population have caused higher exposure and vulnerability. The Yangtze River and its largest tributary, Hanshui, flow through the city. Wuhan is called the “City of Hundreds of Lakes,” where rivers and lakes interweave hundreds of mountains and 166 lakes located in the city, and the water area accounts for about a quarter of the city’s area. Meanwhile, due to rapid economic growth, many lakes have been converted to built-up land, which has led to ecosystem services loss and has increased flood risks [42]. Wuhan is located in a subtropical monsoon humid climate zone, where precipitation is relatively concentrated in summer. The average annual precipitation varies from 1150 mm to 1500 mm, and the precipitation in summer is about three quarters of the annual precipitation [44], which has created a prerequisite for the occurrence of floods. The floods have caused direct economic losses of CNY 213.71 billion from 2006 to 2017, accounting for 6.19% of the total economy in China (Bulletin of Flood and Drought Disasters in China, 2006–2017). The combination of river systems, land use changes, and climate conditions constitute a very characteristic ecological environment of lakeside waters, thus creating a unique pattern of urban flood disasters in Wuhan. Thus, the assessment of flood risk under land use and climate change has an important significance for flood risk management and reduction.

2.2. Data Sources and Processing

2.2.1. Index System for Flood Risk Assessment

The construction of an index system for flood risk assessment should be comprehensive. Based on a previous literature review, there are many indices used for disaster risk assessment. Most studies have identified that the risk is caused by the interaction of different factors, including disaster-causing factors (hazard), the disaster formative environment (sensitivity), and disaster bearers (vulnerability) [18,29,41]. Thus, the framework of the index system was established from the three aspects, hazard, sensitivity, and vulnerability (Figure 2). Disaster-causing factors (R1) determine the magnitude and possibility of occurrence and impact extent of hazards. As extreme rainfall is the main disaster-causing factor of urban floods, the maximum 3-day precipitation (M3DP) (P1) was selected to represent the risk of disaster-causing factors (R1). In addition, it is believed that places close to rivers and lakes are more likely to be invaded by floods [17]; thus, the distance to the river network (P2) was also selected as one index of the disaster-causing factors (R1). The disaster-formative environment (R2) plays a vital role in the redistribution of rainfall. Under the same rainfall condition, different underlying surface conditions can lead to different runoff and infiltration conditions. Therefore, the indices of the disaster-formative environment (R2) include the standard deviation of elevation (P3) and maximum possible retention (S value) (P4). The S value is derived based on the Soil Conservation Service Curve Number (SCS-CN) model, which is determined by soil texture and land use type. The introduction of the S value integrates several infiltration evaluation indices that were originally forced to be separated, making the evaluation of environmental sensitivity of infiltration more scientific and more reasonable. In addition, the consequence caused by disaster-causing factors depends on the situation of disaster bearers (R3), such as the affected population and infrastructure, and the vulnerability and resiliency of the affected area. As the number of population and GDP can describe the social and economic development to a large extent, and road network density can represent the distribution of infrastructure construction, population density (P5), per unit GDP (P6), and road network density (P7) were selected to represent the vulnerability of the disaster bearers (R3).

2.2.2. Data Sources

In this paper, seven indices of years 2000, 2005, 2010, 2015, and 2018 were selected according to three aspects (Table 1). The M3DP was calculated based on the daily precipitation data, which were obtained from the National Meteorological Information Center. Distance to the river network was represented by sequential buffers along the rivers, the standard deviation of elevation was processed based on DEM data, and S values were determined by soil characteristics and land use types. River network, DEM, soil data, land use, population density, and per unit GDP were obtained from the Data Center for Resources and Environmental Sciences, Chinese Academy of Sciences. Road density was calculated based on the road network (including national road, provincial road, and railway road) provided by the Gaode map.
Specifically, to represent the distance to the river network, sequential buffers were created along the rivers (buffers at 500 m, 1000 m, 1500 m, and 2000 m) and ranks were specified accordingly (ranks were assigned values of 5, 4, 3, 2, and 1 according to the distance from the river). The S value is related to the dimensionless parameter CN, which is a comprehensive parameter reflecting the characteristics of the region and is related to soil moisture, slope, soil type, land use type, and vegetation. Theoretically, CN is an integer value within 100 and is inversely proportional to S, that is, the larger the value of CN is, the easier the region is to produce runoff. The relationship between CN value and S is different in different regions. According to the studies of scholars on rainfall and runoff in Wuhan, the generally accepted relationship between CN value and S in Wuhan is as follows [45]:
S = 25,400 C N 254
Musgrave (1955) classified all soils into four hydrologic soil groups A, B, C, and D with different infiltration capacities by measuring the minimum infiltration capacity (Table 2) [46]. Based on the soil data of Wuhan, it is found that there are three suitable hydrologic soil groups—B, C, and D in Wuhan, among which B and D are the main types. Further, combined with the land use types, the CN values can be obtained as shown in Table 3 [47,48], and the S value can be calculated further.

2.3. Methodology

Based on the comprehensive index system, flood risk is defined as the product of the hazard, sensitivity, and vulnerability. The calculation formula for flood risk is as follows:
F R I = f ( H , S , V ) =   Hazard   ( R 1 ) Sensitivity   ( R 2 ) Vulnerability   ( R 3 )
where F R I is the flood risk index, H is the hazard index that is determined by the disaster-causing factors (R1), S is the sensitivity index that is measured by factors of the disaster-formative environment (R2), and V is the vulnerability index that is represented by the vulnerability of the disaster bearers (R3). The flood risk index (FRI) is the product of Hazard (H), Sensitivity (S), and Vulnerability (V), which are, respectively, represented by R1, R2, and R3, which are the sum of the product of the standardized value of relevant factors, as shown in Figure 2, and the determined weights of each factor (Table 4). It can be defined by Equation (3).
F R I = α H ( i = 1 n H i h i ) H a z a r d α E ( j = 1 n S j s j ) Sensitivity α V ( k = 1 n V k v k ) V u l e r a b i l i t y    
where α H , α S , and α V are, respectively, the weights of the hazard index, sensitivity index, and vulnerability index;   H i , S j , and V k are the metrics of three indexes; h i , s j , and v k are the weights of the metrics.
To determine the weights of the metrics, the AHP was applied, as one of the multi-criteria analysis methods that allows experts, using their experience and knowledge, to organize the elements into a hierarchical structure and calculate their weights with the help of a preference matrix [31]. Currently, AHP is one of the methods that is most widely applied in the flood risk assessment, especially for research at the city scale. It can cover well the city’s social economy and ecological environment. Considering Wuhan city’s socioeconomic and natural environmental condition for the possibility of flood risk, AHP is introduced to the assessment of flood risk in Wuhan. In AHP analysis, the first step is to develop a pairwise comparisons matrix for indices of hazard, sensitivity, and vulnerability using scores based on their relative importance (Table 4A–C). In this pairwise comparison matrix, each index was rated against every other one by assigning relative importance values [32]. Then, based on the comparison matrix, the normalized eigenvector was calculated by dividing each column by corresponding sums. Last, average values of each row of the normalized eigenvector were calculated and used as weights.
After the weights were determined, the standardization of each index was then carried out. Among the seven indices, except that the maximum possible retention and road density are inversely related to flood risk, the other five indices are all positive. The standardization of each index was then carried out. The standardized formulas are as follows.
For positive index:
Y i j = ( X i j X j m i n ) / ( X j m a x X j m i n )
For negative index:
Y i j = ( X j m a x X i j ) / ( X j m a x X j m i n )
where Y i j represents the standardized value of the j th index of the i th object, X i j is the actual value, and X j m i n and X j m a x represent the minimum and maximum values of the j th index, respectively.

3. Results

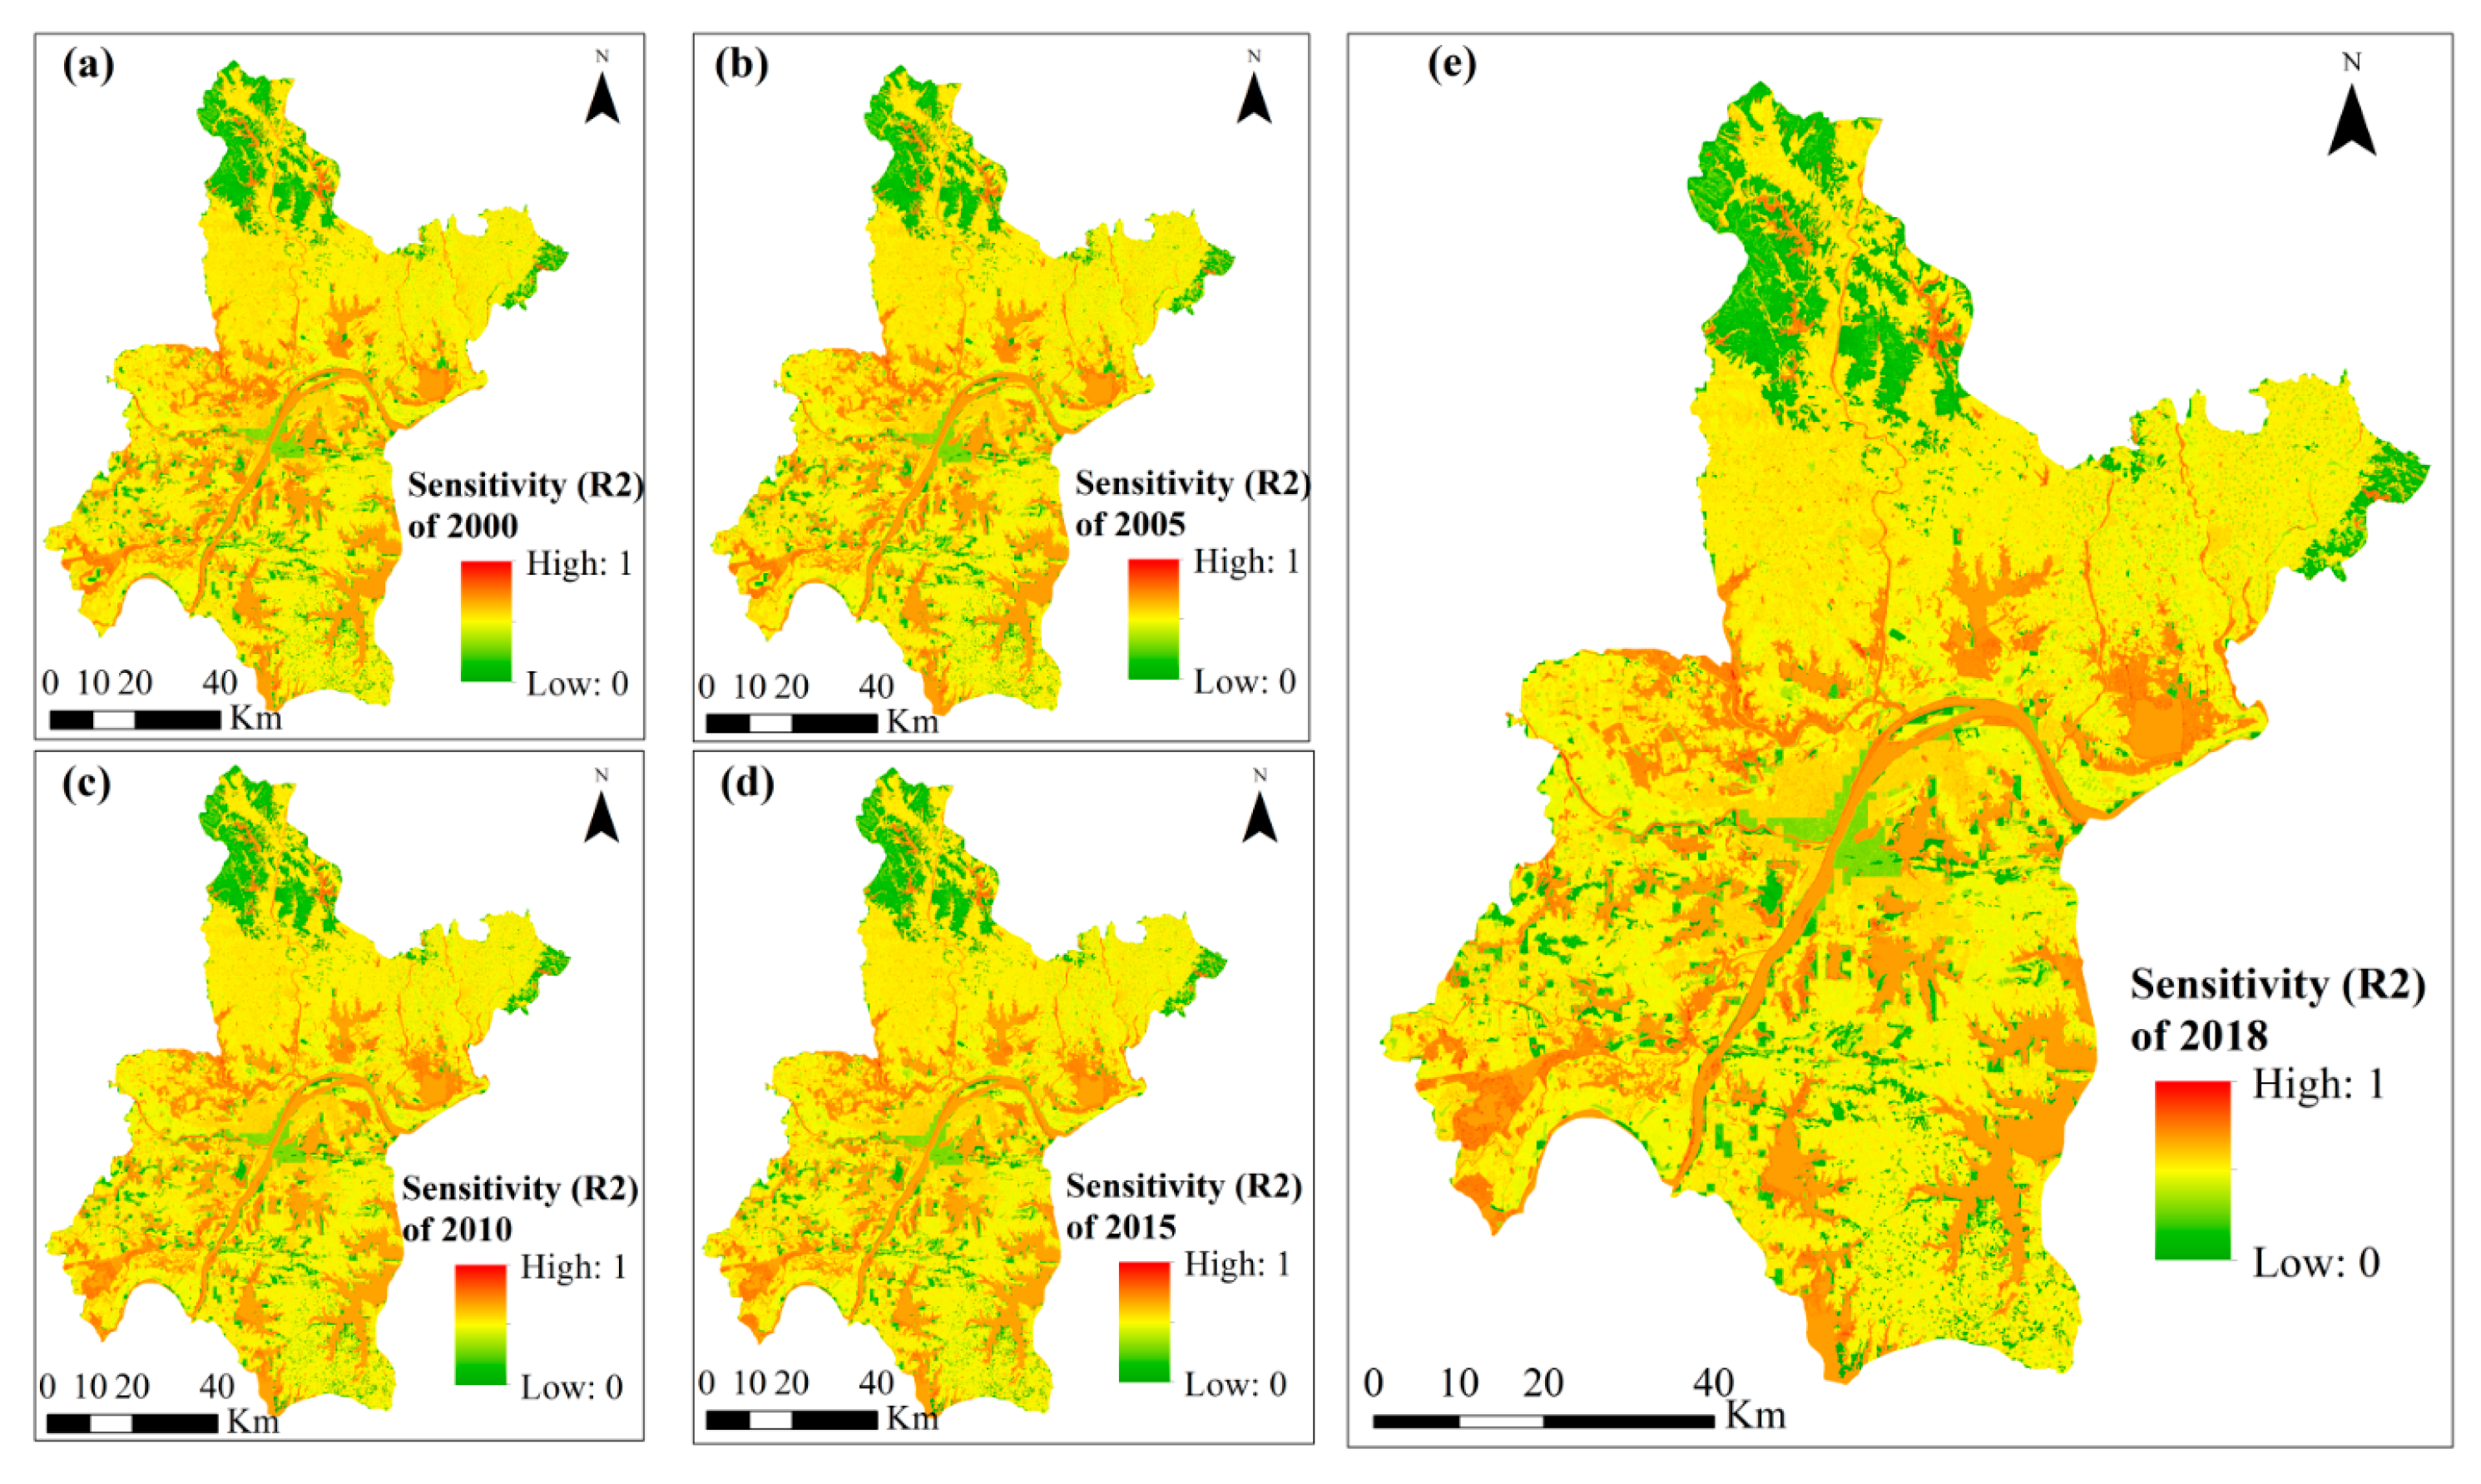
3.1. Spatiotemporal Variations in Flood Hazard, Sensitvity, and Vulnerabiltiy

In this study, flood hazard magnitude was investigated based on the M3DP and distance to the river network. The M3DP distribution of years 2000, 2005, 2010, 2015, and 2018 were similar. As precipitation is a probabilistic event that cannot completely be predictable, in order to minimize the impact of abnormal precipitation in some regions in a single year, the average M3DP of the five years was used in this study. It showed that central and east regions of Wuhan had high M3DP, indicating the area with high flood possibility (Figure 3a). Accordingly, the flood hazard was calculated for each pixel of Wuhan based on standardized values of M3DP, distance to the river network (Figure 3b), and their weights. The result showed that the intensity of flood hazards is very high in the eastern part of Wuhan, close to the river network (Figure 3c).
Urban flood sensitivity incorporates the standard deviation of elevation and the potential maximum retention (S). For the S value index, land use types are the key determinant factors. It can be more intuitively seen that from 2000 to 2018, the area of paddy and dry farming land continued to decline, while the area of urban land and other construction land increased significantly (Figure 4). As a result of the pattern and change in land use and soil property, the S value showed a pattern of increasing from the central region to the surrounding area (Figure 5). This is because the land use type of the central region is mostly hardened pavement with a low infiltration rate. In the central area of the city center along the river, there is also an area with a high S value, mainly because the soil type in this area is mainly loam with good water permeability. In addition, from a single year, Figure 5b–f show that the S value is higher in the northern mountainous area, where there are more forest land with high soil infiltration rate and low possibility of runoff. Because there is no soil in the river system, low-S-value areas are generated in the river network, and the river is the runoff area, which is also consistent with common sense. The loam soil associated with the river has a high infiltration rate and a high S value, which is reflected in the red dotted high infiltration area distributed along the river. A longitudinal comparison of the difference in S value in different years shows that the distribution pattern of high and low infiltration rate has not changed much. In detail, in the central urban area with nonloam soil, the area with low S value showed an expansion trend from 2000 to 2018, which is caused by the continuous expansion of urban land from the city center.
Based on the elevation standard deviation and S value data, the urban flood sensitivity was obtained. The spatiotemporal patterns of flood sensitivity in Wuhan during 2000–2018 are shown in Figure 6. As the elevation standard deviation data of each year were the same, the differences in flood sensitivity in the five years were mainly determined by the differences in S value. In general, the results showed that the central urban area of Wuhan was of high sensitivity value. Due to the expansion of urban land, the scope of highly sensitive areas was also expanding. The northern mountainous area was mostly covered by forest and, thus, was of high ground infiltration capacity and low flood sensitivity, while areas covered by water bodies were mostly of high flood sensitivity.
Urban flood vulnerability includes susceptible indexes such as population density, per unit GDP, and road density, among which population and GDP collectively indicate the magnitude of vulnerability, and road density represents the resilience component that reduces the magnitude of vulnerability. The results of the urban flood vulnerability showed that the central part of the city has the highest vulnerability, and it decreased radially to the periphery (Figure 7). Based on the comparison of vulnerability patterns of the five years, it showed that areas with high vulnerability expanded during 2000–2018, especially the area in the west bank of the Yangtze River, where the urban area developed most rapidly. Especially, the population and economic development increased even more after 2010. The prosperous population and economy will make this region face high post-disaster losses, which requires better forecasting, monitoring, and disaster reduction measures.

3.2. Spatiotemporal Variations in Comprehensive Flood Risk

The spatiotemporal variations in comprehensive flood risk disasters are shown in Figure 8, where the flood risks were classified into five levels (least, mild, medium, high, and highest) based on the Jenks natural breaks classification method. As to the spatial patterns of flood risk, it showed that the high-flood-risk areas in the five years were mainly concentrated in the central urban area, extending in the southeast and northwest directions; the area in the west bank of the Yangtze river was especially the highest, which was mainly determined by the land use type and flood vulnerability of the disaster bearer. In addition, the flood risk of the areas close to the river network was higher than that of other flat lands. The points of Figure 8e,f are the recorded inundation points in Wuhan released in 2020. By comparing the data of inundation points in the Wuhan urban area officially released in 2020 with the spatial distribution map of risk degree in the latest year of 2018, it was found that 52 of the 59 waterlogging points fall in relatively high-risk areas and high-risk areas, with a screening rate of 88%. Moreover, in the west side of Hanjiang River, the density of inundation points in the high-risk area was higher than that in the relatively high-risk area, which suggested our risk assessment results were basically consistent with the actual data. Furthermore, the flood risk of the 13 districts in Wuhan was statistically analyzed. As can be seen from Figure 9, Jianghan, Qiaokou, Jiang’an, and Wuchang districts in the central area had the highest flood risk, and the area with above-medium risk accounted for more than 60%. More than 80% of Jianghan district is a high-risk region. The developed political and economic conditions and the risk of disasters of Jianghan district caused higher requests for urban flood risk prevention work to be put forward. On the one hand, soft ground, green coverage, and drainage pipeline construction need to be increased to reduce the risk; on the other hand, the risk early warning and disaster response need to be strengthened, so that the safety of life and property can receive the maximum protection. Jiangxia, Xinzhou, Hannan, Caidian, and Huangpi districts had the lowest risk, with the proportion of high-risk area less than 5%. It was mainly due to the fact that they were far away from the central urban area, with more forest and grassland area that has a high infiltration rate. In addition, although Qingshan district has a small proportion of high-risk areas and highest-risk areas, it has the largest proportion of medium-risk areas. In a large-scale precipitation disaster, compared with other regions and cities, it is more necessary to do a good job of disaster prevention and evacuation of masses and property.
As to the temporal variations in flood risk, it showed that the overall flood risk had increased and expanded. As can be seen from Figure 10, the areas of high and highest flood risk of most districts presented an increasing trend. The increases in high- and highest-flood-risk area in Hongshan district were most obvious. Specifically, the year 2010 was an obvious turning point, as flood risk increased rapidly since 2010, which was also the turning point when Wuhan’s urbanization development began to develop rapidly. Moreover, the distribution and risk levels of recorded inundation points of the year 2020 in Wuhan were collected and overlayed on the flood risk map of 2018. It was found that 52 of the 59 inundation points (88%) fall in high- and highest-risk areas. Moreover, the density of inundation points in the highest-risk area was higher than that in the high-risk area. Overall, the flood risk results were basically consistent with the actual inundation risk data. Wuhan, as a core city in the middle reaches of the Yangtze River, has broad prospects for future development. It is one of the key issues to reduce flood risk while ensuring Wuhan’s urbanization development and sustained economic prosperity.

4. Discussion

In this study, a multiple index system was constructed to assess the flood risk in Wuhan during 2000–2018. Many previous studies evaluated the flood risk and estimated socio-economic losses based on social media data, with a combination of mobility patterns and multi-source data [49,50,51]. In contrast, this study assessed flood risk on the basis of climatic data, natural physical data, land use data, and socio-economic data. Land use change is the main driving factor of flood risk and has a negative impact on the flood exposure [52]. Compared with other studies, this study innovatively introduced an indicator of maximum possible retention (S value), which can integrate several infiltration evaluation indices to make more reasonable the quantification of the influence of urban surface infiltration capacity on flood disasters. In addition, the data of distribution and risk levels of recorded inundation points of the year 2020 in Wuhan were collected to help verify the accuracy of flood risk assessment results.
The results showed that Jianghan, Qiaokou, Jiang’an, and Wuchang districts had the highest risk of flood disaster in Wuhan, which is consistent with findings of other research. For example, Liu et al. (2021) showed that central Wuhan and southeast sub-districts were typically affected by floods [50]. Wuhan plays an important role in the development of the Yangtze River Economic Belt. Flood risk management and reduction are significant for sustainable development in Wuhan. Hazard, sensitivity, and vulnerability are three key components for flood risk. Thus, risk management and reduction can be achieved through considering these factors. For instance, during the urbanization process, the water bodies and green spaces should be protected to reduce the impacts of short-term rainstorms. The newly developed urban area should be at higher elevations and not too close to rivers, to reduce the possibility of inundation. In the urbanized area, low-impact development is suggested to help reduce run-off, and road networks and underground drainage systems should be strengthened. In addition, contingency land-use plans can be developed to reduce urban flood exposure.
In addition, flood risk is a complex issue and affected by various factors. In this study, seven indices were selected from three aspects. However, these cannot fully reflect the driving factors of flood risk. As for hazard, it is related to the probability and extent of flood impacts. Maximum 3-day precipitation and drainage density were selected to evaluate flood hazard, while we ignored other factors. For example, climate change would increase the frequency and seriousness of the occurrence of floods. Extreme precipitation, temperature, and events were important indicators of climate change. In addition, resilience is the capacity of adapting to natural hazards. This study mainly considered the consequences of flood risk and ignored the coping capacities or resilience of social and economic dimensions. Secondly, there is a quantitative relationship between flood risk and socioeconomic losses. This study assessed flood risk and verified the accuracy of the results, while there was a lack of analysis of socio-economic losses. Therefore, in a further study, a more scientific and comprehensive indicator system and estimated economic losses analysis caused by floods should be conducted.

5. Conclusions

Wuhan city has been severely affected by flood hazards for a long time, which highlighted the need for flood risk assessment to better understand the elements causing floods and to put forward effective measures to reduce the risk. Based on the comprehensive flood risk assessment index system that takes natural, social, and economic factors into consideration, the flood risk and its major components and factors behind flood hazards, sensitivity, and vulnerability in Wuhan from 2000 to 2018 were explored using the AHP method. The values of flood hazard, sensitivity, vulnerability, and comprehensive flood risk were visualized and their corresponding spatial risk assessment maps were developed, based on which the characteristics of their spatiotemporal variations were analyzed. The results indicated that the central urban area, especially the area in the west bank of the Yangtze river, were mostly risk-prone due to its high flood sensitivity (S value) that was determined by land use type and high vulnerability that was determined with the population concentration and economic development. Specifically, Jianghan, Qiaokou, Jiangan, and Wuchang districts had the highest flood risk, with the area with above-medium risk accounting for more than 60%. The temporal variations in flood risk showed that the risk of most districts presented an increasing trend, with Hongshan district increasing the most, and the year of 2010 was an obvious turning point for rapid risk increase. In addition, the distribution and risk level of the recorded inundation points of the year 2020 was highly consistent with flood risk map of 2018 in Wuhan. As such, this study demonstrates that the AHP method can be an effective approach in flood risk studies. It also tries to develop a comprehensive index that logically integrates geomorphic, hydrological, demographic, socioeconomic, and infrastructural attributes for risk assessment. The characteristics of the spatiotemporal variations in flood risk in Wuhan from this study would be helpful for identifying factors and hotspot regions for risk reduction and provide support for future planning decisions for flood hazard management.

Author Contributions

Conceptualization, Z.L.; methodology, K.S.; formal analysis, Z.L. and K.S.; data curation, L.P.; writing—original draft preparation, K.S.; writing—review and editing, Z.L.; visualization, L.P.; supervision, Z.L. All authors have read and agreed to the published version of the manuscript.

Funding

This research was funded by the National Nature Science Foundation of China (Grant No. 41890824 and 71804175).

Institutional Review Board Statement

Not applicable.

Informed Consent Statement

Not applicable.

Data Availability Statement

All data and materials are available upon request.

Acknowledgments

We would like to thank the reviewers for their thoughtful comments that helped improve the quality of this work.

Conflicts of Interest

The authors declare no conflict of interest.

References

  1. Liu, Y.; You, M.; Zhu, J.; Wang, F.; Ran, R. Integrated risk assessment for agricultural drought and flood disasters based on entropy information diffusion theory in the middle and lower reaches of the Yangtze River, China. Int. J. Disaster Risk Reduct. 2019, 38, 101194. [Google Scholar] [CrossRef]
  2. Avashia, V.; Garg, A. Implications of land use transitions and climate change on local flooding in urban areas: An assessment of 42 Indian cities. Land Use Policy 2020, 95, 104571. [Google Scholar] [CrossRef]
  3. Wallemacq, P. Economic Losses, Poverty & Disasters: 1998–2017; Centre for Research on the Epidemiology of Disasters (CRED): Brussels, Belgium, 2018. [Google Scholar]
  4. Xiao, Y.; Yi, S.; Tang, Z. Integrated flood hazard assessment based on spatial ordered weighted averaging method considering spatial heterogeneity of risk preference. Sci. Total. Environ. 2017, 599–600, 1034–1046. [Google Scholar] [CrossRef] [PubMed]
  5. Chen, X.; Zhang, H.; Chen, W.; Huang, G. Urbanization and climate change impacts on future flood risk in the Pearl River Delta under shared socioeconomic pathways. Sci. Total. Environ. 2021, 762, 143144. [Google Scholar] [CrossRef] [PubMed]
  6. Güneralp, B.; Güneralp, I.; Liu, Y. Changing global patterns of urban exposure to flood and drought hazards. Glob. Environ. Chang. 2015, 31, 217–225. [Google Scholar] [CrossRef]
  7. Aerts, J.C.J.H. A review of cost estimates for flood adaptation. Water 2018, 10, 1646. [Google Scholar] [CrossRef] [Green Version]
  8. Tang, J.; Li, Y.; Cui, S.; Xu, L.; Hu, Y.; Ding, S.; Nitivattananon, V. Analyzing the spatiotemporal dynamics of flood risk and its driving factors in a coastal watershed of southeastern China. Ecol. Indic. 2021, 121, 107134. [Google Scholar] [CrossRef]
  9. Huong, H.T.L.; Pathirana, A. Urbanization and climate change impacts on future urban flooding in Can Tho city, Vietnam. Hydrol. Earth Syst. Sci. 2013, 17, 379–394. [Google Scholar] [CrossRef] [Green Version]
  10. Yuan, Z.; Liang, C.; Li, D. Urban stormwater management based on an analysis of climate change: A case study of the Hebei and Guangdong provinces. Landsc. Urban Plan. 2018, 177, 217–226. [Google Scholar] [CrossRef]
  11. Zhang, L.; Yang, Z.; Voinov, A.; Gao, S. Nature-inspired stormwater management practice: The ecological wisdom underlying the Tuanchen drainage system in Beijing, China and its contemporary relevance. Landsc. Urban Plan. 2016, 155, 11–20. [Google Scholar] [CrossRef]
  12. Muis, S.; Güneralp, B.; Jongman, B.; Aerts, J.C.; Ward, P.J. Flood risk and adaptation strategies under climate change and urban expansion: A probabilistic analysis using global data. Sci. Total. Environ. 2015, 538, 445–457. [Google Scholar] [CrossRef]
  13. Rahmati, O.; Darabi, H.; Panahi, M.; Kalantari, Z.; Naghibi, S.A.; Ferreira, C.S.S.; Kornejady, A.; Karimidastenaei, Z.; Mohammadi, F.; Stefanidis, S.; et al. Development of novel hybridized models for urban flood susceptibility mapping. Sci. Rep. 2020, 10, 1–19. [Google Scholar] [CrossRef]
  14. Nakayama, T.; Shankman, D. Impact of the Three-Gorges Dam and water transfer project on Changjiang floods. Glob. Planet. Chang. 2013, 100, 38–50. [Google Scholar] [CrossRef]
  15. Grežo, H.; Močko, M.; Izsóff, M.; Vrbičanová, G.; Petrovič, F.; Straňák, J.; Muchová, Z.; Slámová, M.; Olah, B.; Machar, I. Flood risk assessment for the long-term strategic planning considering the placement of industrial parks in Slovakia. Sustainability 2020, 12, 4144. [Google Scholar] [CrossRef]
  16. Mishra, K.; Sinha, R. Flood risk assessment in the Kosi megafan using multi-criteria decision analysis: A hydro-geomorphic approach. Geomorphology 2020, 350, 106861. [Google Scholar] [CrossRef]
  17. Pham, B.T.; Luu, C.; van Dao, D.; van Phong, T.; Nguyen, H.D.; van Le, H.; von Meding, J.; Prakash, I. Flood risk assessment using deep learning integrated with multi-criteria decision analysis. Knowl. Based Syst. 2021, 219, 106899. [Google Scholar] [CrossRef]
  18. Wu, Z.; Shen, Y.; Wang, H.; Wu, M. Urban flood disaster risk evaluation based on ontology and Bayesian Network. J. Hydrol. 2020, 583, 124596. [Google Scholar] [CrossRef]
  19. Winsemius, H.C.; van Beek, L.P.H.; Jongman, B.; Ward, P.J.; Bouwman, A. A framework for global river flood risk assessments. Hydrol. Earth Syst. Sci. 2013, 17, 1871–1892. [Google Scholar] [CrossRef] [Green Version]
  20. Tsakiris, G. Flood risk assessment: Concepts, modelling, applications. Nat. Hazards Earth Syst. Sci. 2014, 14, 1361–1369. [Google Scholar] [CrossRef] [Green Version]
  21. Kittipongvises, S.; Phetrak, A.; Rattanapun, P.; Brundiers, K.; Buizer, J.L.; Melnick, R. AHP-GIS analysis for flood hazard assessment of the communities nearby the world heritage site on Ayutthaya Island, Thailand. Int. J. Disaster Risk Reduct. 2020, 48, 101612. [Google Scholar] [CrossRef]
  22. Elshorbagy, A.; Bharath, R.; Lakhanpal, A.; Ceola, S.; Montanari, A.; Lindenschmidt, K.-E. Topography—And nightlight-based national flood risk assessment in Canada. Hydrol. Earth Syst. Sci. 2017, 21, 2219–2232. [Google Scholar] [CrossRef] [Green Version]
  23. Mazzoleni, M.; Bacchi, B.; Barontini, S.; Di Baldassarre, G.; Pilotti, M.; Ranzi, R. Flooding hazard mapping in floodplain areas affected by piping breaches in the Po River, Italy. J. Hydrol. Eng. 2014, 19, 717–731. [Google Scholar] [CrossRef]
  24. Gharbi, M.; Soualmia, A.; Dartus, D.; Masbernat, L. Comparison of 1D and 2D hydraulic models for floods simulation on the medjerda riverin tunisia. J. Mater. Environ. Sci. 2016, 7, 3017–3026. [Google Scholar]
  25. Naz, S.; Ahsanuddin, M.; Inayatullah, S.; Siddiqi, T.; Imtiaz, M. Copula-based bivariate flood risk assessment on Tarbela Dam, Pakistan. Hydrol. 2019, 6, 79. [Google Scholar] [CrossRef] [Green Version]
  26. Waghwala, R.K.; Agnihotri, P. Flood risk assessment and resilience strategies for flood risk management: A case study of Surat City. Int. J. Disaster Risk Reduct. 2019, 40, 101155. [Google Scholar] [CrossRef]
  27. Lin, W.; Sun, Y.; Nijhuis, S.; Wang, Z. Scenario-based flood risk assessment for urbanizing deltas using future land-use simulation (FLUS): Guangzhou Metropolitan Area as a case study. Sci. Total. Environ. 2020, 739, 139899. [Google Scholar] [CrossRef] [PubMed]
  28. Al Baky, A.; Islam, M.; Paul, S. Flood hazard, vulnerability and risk assessment for different land use classes using a flow model. Earth Syst. Environ. 2019, 4, 225–244. [Google Scholar] [CrossRef] [Green Version]
  29. Chen, J.; Huang, G.; Chen, W. Towards better flood risk management: Assessing flood risk and investigating the potential mechanism based on machine learning models. J. Environ. Manag. 2021, 293, 112810. [Google Scholar] [CrossRef]
  30. Khan, T.A.; Shahid, Z.; Alam, M.; Su’Ud, M.M.; Kadir, K. Early flood risk assessment using machine learning: A comparative study of SVM, Q.-SVM, K-NN and LDA. In Proceedings of the 13th International Conference on Mathematics, Actuarial Science, Computer Science and Statistics (MACS 2019), Karachi, Pakistan, 14–15 December 2019; pp. 1–7. [Google Scholar]
  31. Rubio, C.J.; Yu, I.S.; Kim, H.Y.; Jeong, S.M. Index-based flood risk assessment for Metro Manila. Water Supply 2020, 20, 851–859. [Google Scholar] [CrossRef]
  32. Ghosh, A.; Kar, S.K. Application of analytical hierarchy process (AHP) for flood risk assessment: A case study in Malda district of West Bengal, India. Nat. Hazards 2018, 94, 349–368. [Google Scholar] [CrossRef]
  33. Xu, H.; Ma, C.; Lian, J.; Xu, K.; Chaima, E. Urban flooding risk assessment based on an integrated k-means cluster algorithm and improved entropy weight method in the region of Haikou, China. J. Hydrol. 2018, 563, 975–986. [Google Scholar] [CrossRef]
  34. Wang, X.; Xie, H. A review on applications of remote sensing and geographic information systems (GIS) in water resources and flood risk management. Water 2018, 10, 608. [Google Scholar] [CrossRef] [Green Version]
  35. Lyu, H.-M.; Sun, W.; Shen, S.-L.; Arulrajah, A. Flood risk assessment in metro systems of mega-cities using a GIS-based modeling approach. Sci. Total. Environ. 2018, 626, 1012–1025. [Google Scholar] [CrossRef] [PubMed]
  36. Ghosh, S.; Das, A. Wetland conversion risk assessment of East Kolkata Wetland: A Ramsar site using random forest and support vector machine model. J. Clean. Prod. 2020, 275, 123475. [Google Scholar] [CrossRef]
  37. Wagenaar, D.; Curran, A.; Balbi, M.; Bhardwaj, A.; Soden, R.; Hartato, E.; Sarica, G.M.; Ruangpan, L.; Molinario, G.; Lallemant, D. Invited perspectives: How machine learning will change flood risk and impact assessment. Nat. Hazards Earth Syst. Sci. 2020, 20, 1149–1161. [Google Scholar] [CrossRef]
  38. Mahmoud, S.H.; Gan, T.Y. Multi-criteria approach to develop flood susceptibility maps in arid regions of Middle East. J. Clean. Prod. 2018, 196, 216–229. [Google Scholar] [CrossRef]
  39. Danumah, J.H.; Odai, S.N.; Saley, B.M.; Szarzynski, J.; Thiel, M.; Kwaku, A.; Kouame, F.K.; Akpa, L.Y. Flood risk assessment and mapping in Abidjan district using multi-criteria analysis (AHP) model and geoinformation techniques, (cote d’ivoire). Geoenvironmental Disasters 2016, 3, 1. [Google Scholar] [CrossRef] [Green Version]
  40. Chen, N.; Yao, S.; Wang, C.; Du, W. A method for urban flood risk assessment and zoning considering road environments and terrain. Sustainability 2019, 11, 2734. [Google Scholar] [CrossRef] [Green Version]
  41. Wu, Z.; Shen, Y.; Wang, H.; Wu, M. Assessing urban flood disaster risk using Bayesian network model and GIS applications. Geomat. Nat. Hazards Risk 2019, 10, 2163–2184. [Google Scholar] [CrossRef] [Green Version]
  42. Zheng, W.; Ke, X.; Xiao, B.; Zhou, T. Optimising land use allocation to balance ecosystem services and economic benefits—A case study in Wuhan, China. J. Environ. Manag. 2019, 248, 109306. [Google Scholar] [CrossRef]
  43. Luo, Q.; Zhang, X.; Li, Z.; Yang, M.; Lin, Y. The effects of China’s Ecological Control Line policy on ecosystem services: The case of Wuhan City. Ecol. Indic. 2018, 93, 292–301. [Google Scholar] [CrossRef]
  44. Lyu, H.-M.; Xu, Y.-S.; Cheng, W.-C.; Arulrajah, A. Flooding hazards across Southern China and prospective sustainability measures. Sustainability 2018, 10, 1682. [Google Scholar] [CrossRef] [Green Version]
  45. Liu, M.; Quan, R.; Xu, S. Urban Waterlogging Hazard Risk Assessment: Theory, Method and Practice; Science Press: Beijing, China, 2012. (In Chinese) [Google Scholar]
  46. Musgrave, G.W. How much of the rain enters the soil? In Water: Yearbook of Agriculture; The United States Department of Agriculture (USDA): Washington, DC, USA, 1955; pp. 151–160. [Google Scholar]
  47. Ozdemir, H.; Elbaşı, E. Benchmarking land use change impacts on direct runoff in ungauged urban watersheds. Phys. Chem. Earth 2015, 79, 100–107. [Google Scholar] [CrossRef]
  48. Dong, W.; Cheng, X.; Zhang, Q.; Zhao, Y.; Han, P. Application of SCS-CN model estimating surface runoff to Chaohu Lake Basin. Bull. Soil Water Conserv. 2012, 32, 174–177. (In Chinese) [Google Scholar]
  49. Fang, J.; Hu, J.; Shi, X.; Zhao, L. Assessing disaster impacts and response using social media data in China: A case study of 2016 Wuhan rainstorm. Int. J. Disaster Risk Reduct. 2019, 34, 275–282. [Google Scholar] [CrossRef]
  50. Liu, X.; Yang, S.; Ye, T.; An, R.; Chen, C. A new approach to estimating flood-affected populations by combining mobility patterns with multi-source data: A case study of Wuhan, China. Int. J. Disaster Risk Reduct. 2021, 55, 102106. [Google Scholar] [CrossRef]
  51. Xie, Y.; Yi, S.; Tang, Z.; Ye, D. Uncertainty multi-source information fusion for intelligent flood risk analysis based on random set theory. Int. J. Comput. Intell. Syst. 2012, 5, 975–984. [Google Scholar] [CrossRef] [Green Version]
  52. Liu, J.; Wang, S.-Y.; Li, D.-M. The analysis of the impact of land-use changes on flood exposure of Wuhan in Yangtze River Basin, China. Water Resour. Manag. 2014, 28, 2507–2522. [Google Scholar] [CrossRef]
Figure 1. Geographical location of Wuhan city.
Land 10 00878 g001
Figure 2. Wuhan flood disaster risk assessment index system.
Land 10 00878 g002
Figure 3. Spatial pattern of average M3DP (a), river network (b), buffer, and Hazard (c) in Wuhan during 2000–2018.
Land 10 00878 g003
Figure 4. Change in the land use in Wuhan during 2000–2018.
Land 10 00878 g004
Figure 5. Spatiotemporal patterns of land use of 2018 (a) and standard derivation of elevation and maximum possible retention (S) in Wuhan ((b) 2000, (c) 2005, (d) 2010, (e) 2015, (f) 2018).
Land 10 00878 g005
Figure 6. Spatiotemporal patterns of flood sensitivity in Wuhan ((a) 2000, (b) 2005, (c) 2010, (d) 2015, (e) 2018).
Land 10 00878 g006
Figure 7. Spatiotemporal patterns of flood vulnerability in Wuhan ((a) 2000, (b) 2005, (c) 2010, (d) 2015, (e) 2018).
Land 10 00878 g007
Figure 8. Spatial distributions of flood risk ((a) 2000, (b) 2005, (c) 2010, (d) 2015, (e) 2018) and recorded inundation points in 2020 (f) of Wuhan.
Land 10 00878 g008
Figure 9. Area proportion of various flood risk levels of 13 districts in Wuhan in 2018.
Land 10 00878 g009
Figure 10. Changes in area of high risk and highest risk in the 13 districts from 2000 to 2018.
Land 10 00878 g010
Table 1. The data sources for the seven indices.
ComponentsIndex NameData TypeSpatial ResolutionData Source and Description
R1: disaster-causing factors (hazard), P1: M3DPDaily precipitation30 m × 30 mThe National Meteorological Information Center (http://data.cma.cn/ accessed on 19 September 2020).
P2: Distance to river network River network-The Data Center for Resources and Environmental Sciences, Chinese Academy of Sciences (http://www.resdc.cn/ accessed on 15 May 2020)
R2: disaster formative environment (sensitivity), P3: Standard deviation of elevationDigital Elevation Model (DEM)30 m × 30 m
P4: Maximum possible retention (S value)Land use30 m × 30 m
Soil types and properties1 km × 1 km
R3: disaster bearers (vulnerability)P5: Population densityPopulation density1 km × 1 km
P6: Per unit GDPPer unit GDP1 km × 1 km
P7: Road densityRoad network-Road network provided by Gaode map
Table 2. Soil permeability classification.
Soil TypeMinimum Infiltration Rate (mm/h)Soil Texture
A>7.26Sandy soil, loamy sandy soil, sandy loam
B3.81–7.26Loam, silty loam
C1.27–3.81Clay and loam
D0.00–1.27Clay loam, silt clay loam, sand clay, silt clay, clay
Table 3. CN values under different hydrologic soil groups and land use types.
Land Use TypeHydrologic Soil Group
ABCD
Paddy74808591
Dry farming68778389
Forest38587077
Bush41566877
Grassland46677984
Water body100100100100
Urban land 72839092
Rural settlements64758185
Other built-up land68798689
Unused land72808591
Table 4. Comparison matrix for flood risk assessment.
A. Comparison Matrix for Hazard Indicators
R1: HazardP1P2Relative Weight
P1: M3DP11.50.6
P2: Distance to river network0.6710.4
B. Comparison Matrix for Sensitivity Indicators
R2: SensitivityP3P4Relative Weight
P3: Standard deviation of elevation10.40.29
P4: Maximum possible retention2.510.71
C. Comparison Matrix for Vulnerability Indicators
R3: VulnerabilityP4P5P6Relative Weight
P5: Population density10.330.50.16
P6: Per unit GDP 3130.59
P7: Road density20.3310.25
λ = 3.07, CR = 0.06 < 0.1, pass the consistency verification.
Publisher’s Note: MDPI stays neutral with regard to jurisdictional claims in published maps and institutional affiliations.

