Article

Characterizing the Synoptic-Scale Precursors of Extreme Precipitation Events in the Southeastern Edge of the Tibetan Plateau: Anomalous Evolution of Atmospheric Dynamic-Thermal Structure

State Key Laboratory of Severe Weather, Chinese Academy of Meteorological Sciences, Beijing 100081, China
*
Authors to whom correspondence should be addressed.
Water 2023, 15(7), 1407; https://doi.org/10.3390/w15071407
Submission received: 8 February 2023 / Revised: 9 March 2023 / Accepted: 1 April 2023 / Published: 4 April 2023

Abstract

:
Extreme precipitation events frequently occur at the southeastern edge of the Tibetan Plateau (SETP), causing severe disasters. In this study, we selected the top 100 regional extreme precipitation events over the SETP region during the period of 2001–2020, and analyzed their evolutionary characteristics of large-scale thermodynamic anomalies prior to the extreme precipitation events occurring, with the aim of exploring their precursor signals. The results show that, accompanying the wave train propagating across the Eurasian continent and reaching East Asia, the extreme events over SETP during the summer season are dominated by the background large-scale atmospheric circulations characterized by the strengthened Southern Asia high (SAH), the westward-extended Western Pacific subtropical high (WPSH), and an intensified eastern Asia trough. Additionally, an analogue of low-level vortex embedded in the background large-scale circulations is developed at least 4 days prior to the occurrence of extreme events. Under the combined effects of these anomalies, the warm and cold air converge in the SETP area. Further analysis also suggests that the upper-troposphere divergence aloft combined with lower pressures at surface level lead to the upward vertical motion of circulations, along with the enhanced water-vapor transport conveyed both by the East Asian summer monsoon and the Indian summer monsoon. All anomalies mentioned above provide the favorable environment for the occurrence of precipitation extremes in the SETP region.

1. Introduction

The southeastern edge of the Tibetan Plateau (SETP) is the transition zone from the plateau to the Sichuan Basin, with a highly complex topography and large altitude differences; its maximum altitude difference can reach about half of the troposphere height within a few hundred kilometers. Affected by weather systems at different scales, the spatial distribution of regional precipitation characteristics varies in the SETP. As the population in this area is dense for the whole plateau, the occurrence, development, and formation mechanisms of extreme precipitation in this region deserve more attention. In particular, under the context of global warming, the storms causing extreme precipitation in mid-latitude regions will be stronger, and their impact range will be more extensive [1]. Previous studies revealed that the rainfall of extreme precipitation in the central and eastern Tibetan Plateau (TP) shows an increasing trend [2]. The TP, as a sensitive area in response to climate change, has a maximum center of rainfall located on the SETP [3]. Therefore, the extreme precipitation on the SETP is more obviously affected by climate change.
The rainy season in the Hengduan Mountains on the SETP and the adjacent areas of the Sichuan Basin is from May to September, with 80% of the annual average precipitation [4,5]. Previous studies indicated that the large-scale weather systems affecting extreme precipitation in the SETP are complex, mainly including the South Asian high in upper layers, the western Pacific subtropical high (WPSH) and short-wave troughs near the TP in middle layers, and the southwest vortex in lower layers [6]. For mesoscale weather systems, the plateau vortex and the southwest vortex have a direct impact on the extreme precipitation in the SETP, and these mesoscale vortices also interact with the large-scale circulation background field, thereby affecting extreme precipitation in different regions [7,8,9]. On the convective scale, the convection characteristics of precipitation over the TP and SETP are different from those in the other areas of China; there are also great spatial differences in the convective precipitation characteristics within the TP and the summer convective precipitation on the plateau is affected by various factors such as topography [10,11,12]. Under the joint influence of weather systems at different scales, there are complex energy transfers in the mesoscale systems in the TP region and the Sichuan Basin [13,14,15]. In addition to complex weather systems, water vapor transport is a key factor in extreme precipitation. For the precipitation in the southeastern TP, the water vapor transport is affected by a combination of the Indian summer monsoon and the East Asian summer monsoon, displaying remarkable multi-scale temporal variability [16].
In view of the complexity of weather systems and terrain, limited observation conditions, and the lack of meteorological observations in the SETP, the mechanisms of extreme precipitation generation and development in this area still need to be determined. In addition, most of the previous studies focused on the extreme precipitation in the Sichuan Basin [17], and few investigated the extreme precipitation in the SETP. Here, we examine the extreme precipitation in the SETP by analyzing large-scale circulation characteristics during extreme precipitation. Moreover, we particularly focus on the variations of atmospheric circulations and thermodynamic anomalies before extreme precipitation. This study aims to reveal the precursor signals of extreme precipitation in terms of large-scale circulations to provide references for understanding the physical mechanisms underpinning extreme precipitation.
The remainder of this paper is organized as follows. Section 2 introduces the data and methods used in this research. Section 3 shows the results, including the precipitation characteristics in the SETP and the characteristics of atmospheric circulation pattern, temperature, and humidity during and before the regional extreme precipitation. The main conclusions and discussion are presented in Section 4.

2. Data and Methods

2.1. Data

The precipitation data used in this study are from two datasets, one of which is the Daily Dataset of Basic Meteorological Elements for China National Surface Weather Stations (version 3.0). This dataset spans from 1981 to 2020 and is released by the National Meteorological Information Center of the China Meteorological Administration, which has been processed by quality control. The other dataset that provided the daily precipitation data is a set of satellite data, i.e., the Integrated Multi-Satellite Retrievals for the Global Precipitation Measurement (GPM) with Gauge Calibration (IMERG-Cal), with a resolution of 0.1° × 0.1°. Research has demonstrated that the IMERG-Cal data perform better in evaluating extreme precipitation in Southwest China compared with the ground-based station observations and various satellite datasets [5]. The IMERG-Cal dataset can compensate for the lack in observations caused by the uneven and sparse distribution of weather stations in the SETP (Figure 1a). Because the IMERG data are relatively new, this study focuses on the period of 2001–2020 for which the IMERG data are complete.
Moreover, the fifth-generation European Center for Medium-Range Weather Forecasts reanalysis (ERA5) dataset is used for the diagnosis of physical quantities, such as atmospheric circulations, wind and water vapor flux, with spatio-temporal resolutions of 0.25° × 0.25° and one hour.

2.2. Methods

2.2.1. Selection of Regional Extreme Precipitation Events

Previous studies have applied different classification criteria for regional extreme precipitation according to the climate characteristics of precipitation in the study area. In this research, the regional extreme precipitation events were identified by combining the climatic characteristics of regional precipitation and the precipitation indicators of rainstorms, and the detailed steps were as follows. Firstly, although previous studies have indicated that the SETP is the precipitation center of the entire plateau, the actual precipitation maximum center appears in the Sichuan Basin due to the terrain of the eastern slope of the plateau. Therefore, in order to better investigate the extreme precipitation characteristics on the SETP, this study focused on the extreme precipitation in the Sichuan Basin adjacent to the southeastern boundary of the TP, i.e., the irregular area surrounded by 99° E–105° E, 26° N–34° N, and the southeastern boundary of the TP (Figure 1), rather than the precipitation within the Sichuan Basin. Then, the events with the top 100 events on the SETP adjacent to the Sichuan Basin were selected in terms of the largest average rainfall. That is, the IMERG-Cal precipitation grid data from 2001 to 2020 were used to calculate the daily average rainfall in the area, and 100 events with the largest daily rainfall amount were selected as study objects. Table 1 shows the information on these extreme precipitation events, such as the occurrence time and regional total rainfall amount.

2.2.2. Composite Analysis of Regional Extreme Precipitation Events

After the extreme events were identified, a composite analysis was carried out to obtain the main characteristics of regional extreme precipitation. Although some unique information of single extreme events could be filtered out by composite analysis, the most prominent features of circulations for precipitation were retained in the results. In addition, the composite circulation anomalies were analyzed to investigate the characteristics of regional extreme precipitation different from the climate state. In several previous studies, the study period of the climate state on the SETP was the rainy season, namely May–September [9]. However, to characterize the characteristics of atmospheric conditions on the days of extreme precipitation events and on 8 days before them in summer (June to August), the average from June to August was used to analyze the climate state in this study.

2.2.3. Analysis Method for Wave Action Flux

Wave action flux can represent the horizontal momentum transport in wave train activity. Takaya and Nakamura [18] obtained a tool to better diagnose the small-amplitude disturbance superimposed on basic flow based on Eliassen–Palm flux, and the expression is as follows:
W = p cos ϕ 2 U U a 2 cos 2 ϕ ψ λ 2 ψ 2 ψ λ 2 + V a 2 cos ϕ ψ λ ψ ϕ ψ 2 ψ λ ϕ U a 2 cos ϕ ψ λ ψ ϕ ψ 2 ψ λ ϕ + V a 2 ψ ϕ 2 ψ 2 ψ ϕ 2 f 0 2 N 2 U a cos ϕ ψ λ ψ z ψ 2 ψ λ z + V a ψ ϕ ψ z ψ 2 ψ ϕ z
where ψ represents the stream function; λ the longitudes; Φ the latitudes; U the basic flow; and p the normalized atmospheric pressure. In this research, Takaya–Nakamura flux was used to analyze the extreme precipitation events after the classification and composite process and diagnosed the formation process of their circulations.

2.2.4. Water Vapor Flux and Its Divergence

The zonal water vapor flux (Qu), meridional water vapor flux (Qv), and water vapor flux divergence (Qdiv) from the surface (ps) to 300 hPa can be expressed as follows:
Q u x , y , t = 1 g 300 p s q x , y , p , t u x , y , p , t d p
Q v x , y , t = 1 g 300 p s q x , y , p , t v x , y , p , t d p
Q div = 1 g 300 p s · V   q d p
where q denotes the specific humidity; p the pressure; u the zonal wind speed; and v the meridional wind speed.

3. Results

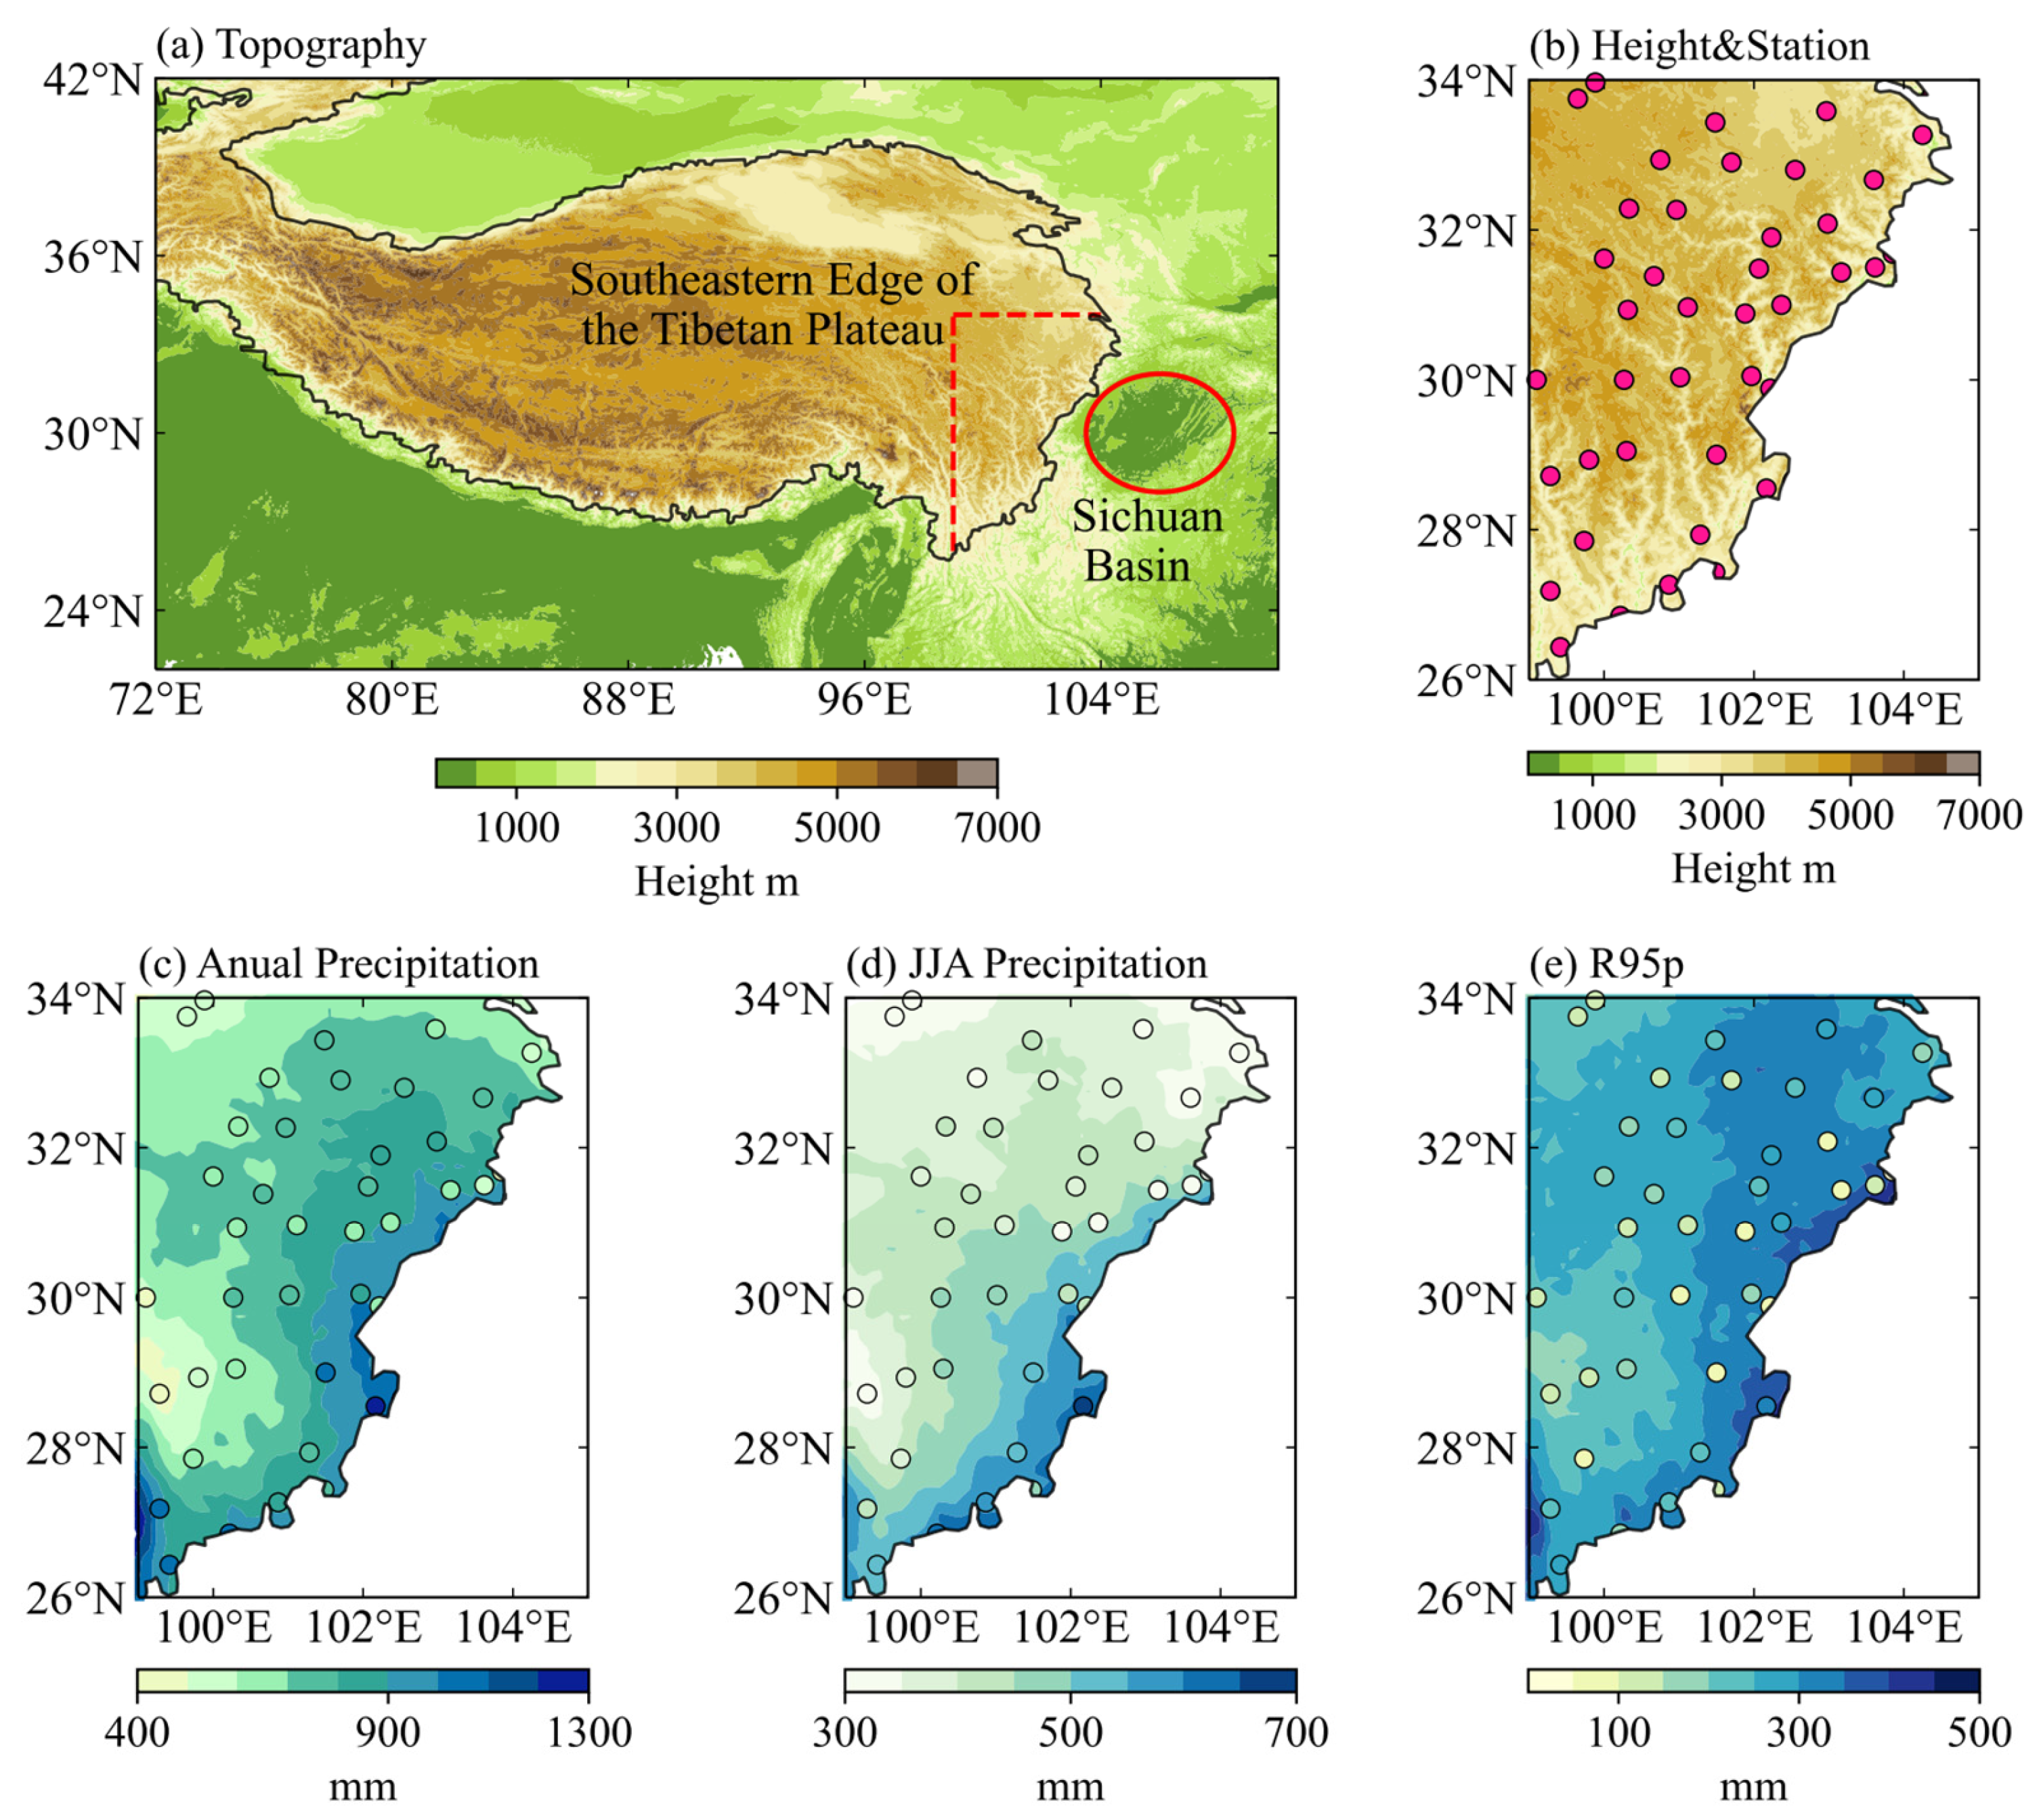
3.1. Precipitation Characteristics on the Southeastern Edge of the Tibetan Plateau

The overall precipitation characteristics are investigated by statistics for rainfall amount at the junction between the SETP and the Sichuan Basin during 2001–2020. Figure 1 shows spatial distributions of the topography, observation stations, annual average precipitation, and summer average precipitation in the SETP. In addition, the distributions of the annual average rainfall amount of extreme precipitation events (the total rainfall amount above the 95th percentile) and precipitation days with rainfall amount ≥ 50 mm day−1 are presented. The results indicate that the IMERG data show relative agreement with the station observations in terms of spatial distribution (Figure not shown). However, compared with the observations, the total rainfall amount and extreme value of the GPM precipitation are lower, while the rainfall amount at the 95th percentile and the heavy precipitation days (≥50 mm day−1) for the IMERG data are larger, indicating noticeable spatial differences in precipitation in the SETP. The spatial distributions of the annual rainfall, rainy season precipitation, extreme rainfall, and days with rainfall amount ≥ 50 mm day−1 (Figure 1b–e) suggest that the common large-value area of these four variables is located at the junction between the SETP and the Sichuan Basin, with the maximum center around the point of 102° E, 28° N at the southeastern edge of the TP (Figure 1b–e). For the 100 extreme precipitation events in the study area, the regional average rainfall amount is greater than 12 mm day−1, with a maximum of 20.45 mm day−1, and the rainfall intensity variability is relatively uniform. However, it should be noted that there are large differences in the spatial distribution of rainfall amounts in the study area.

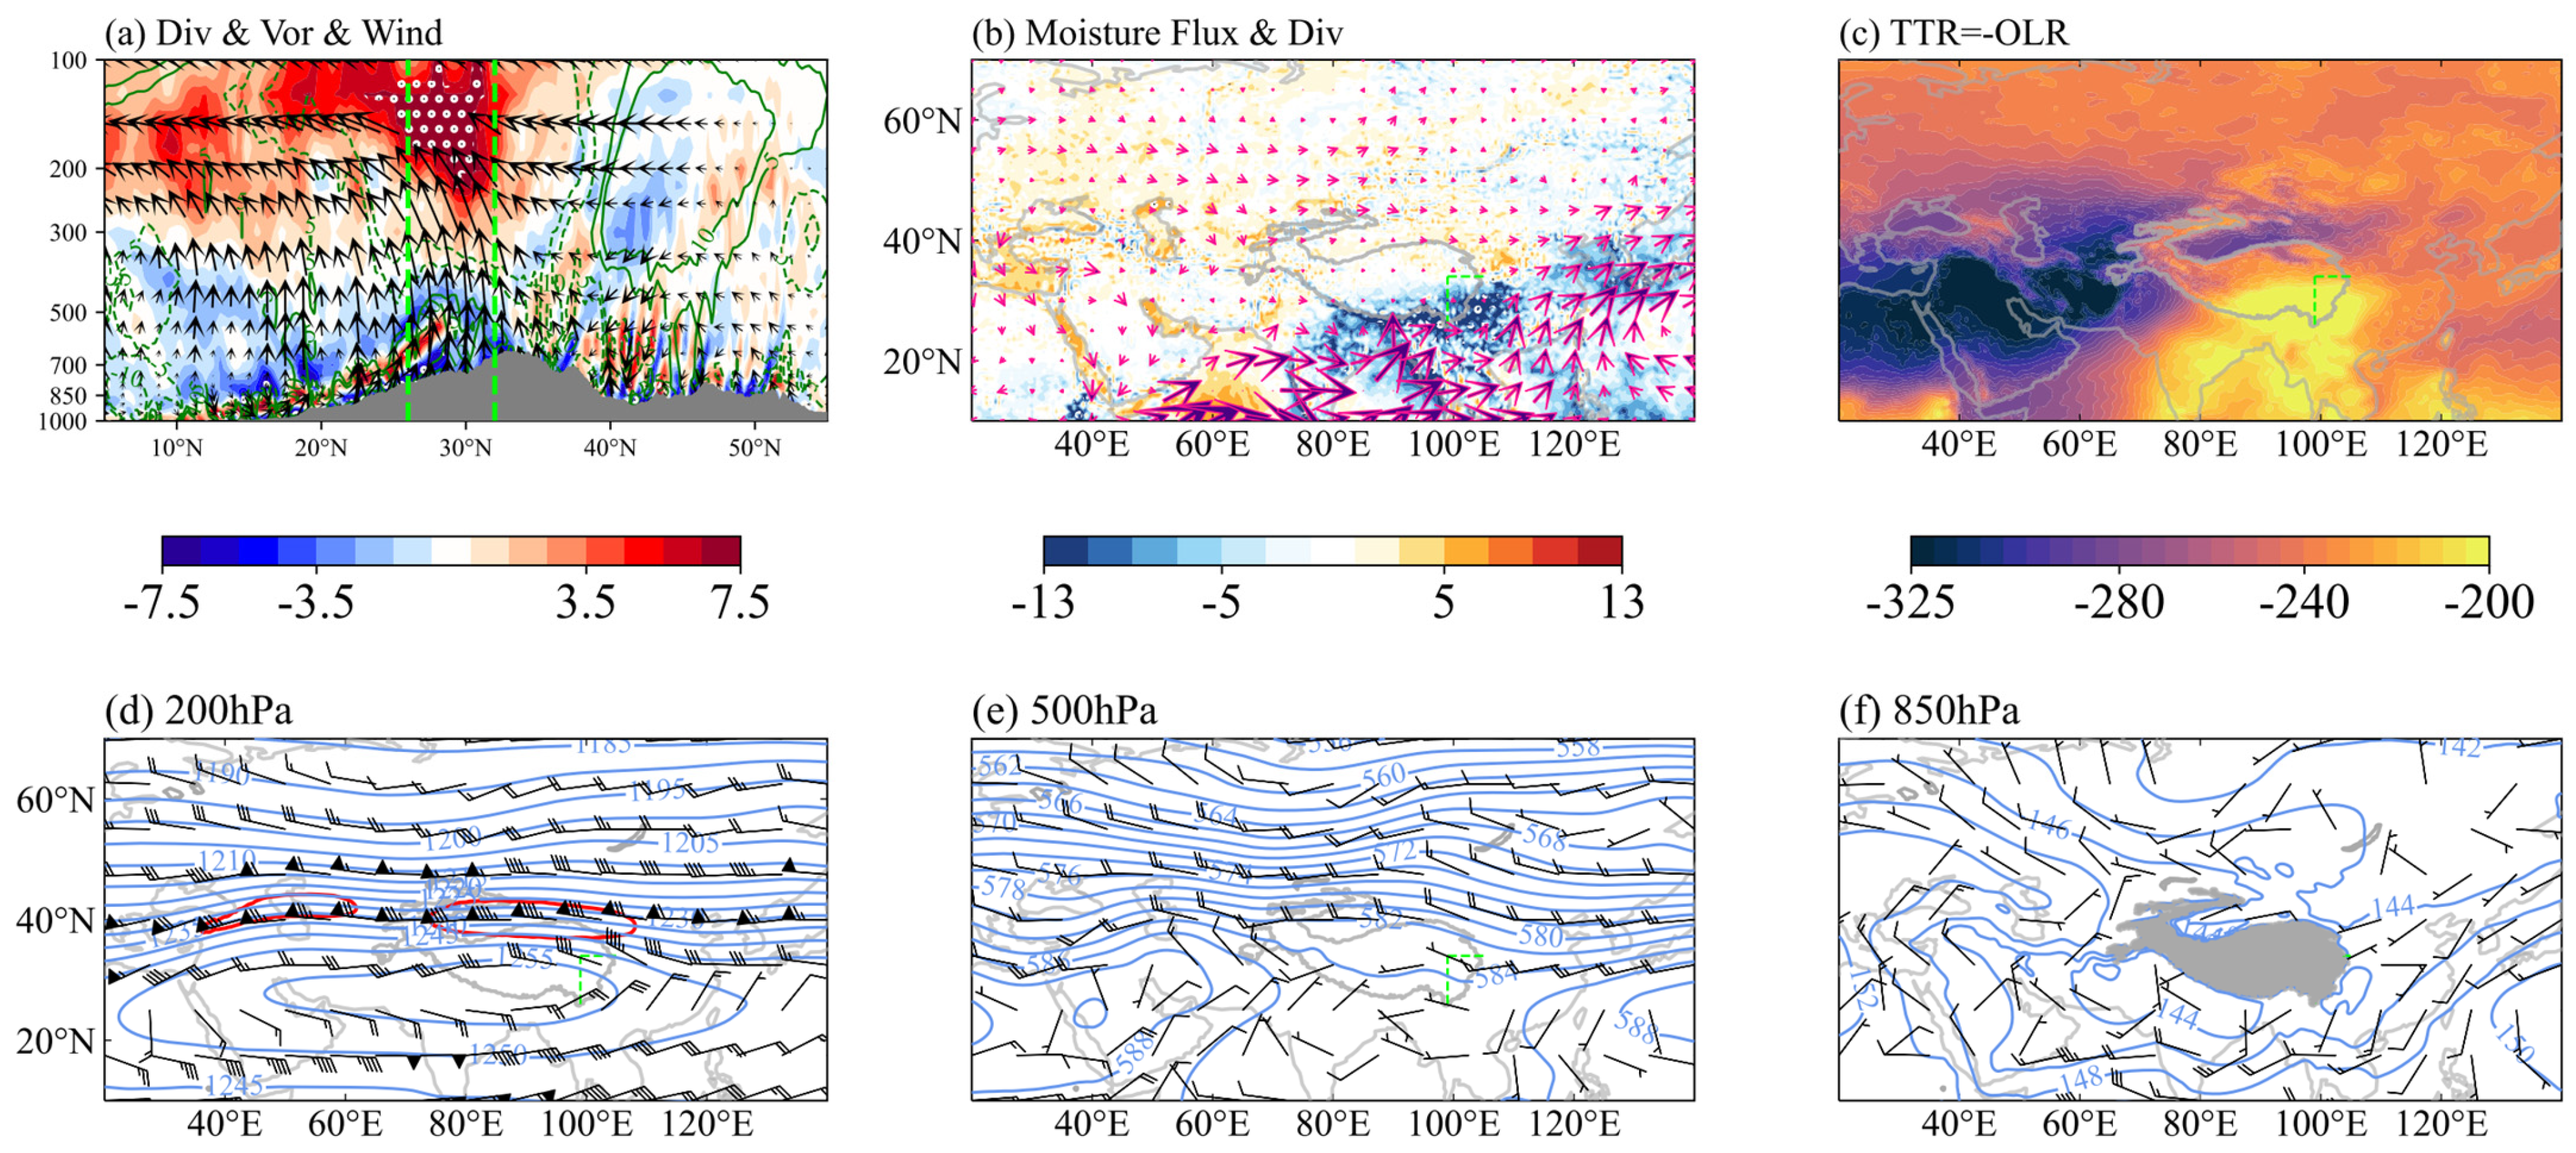
3.2. Atmospheric Circulation Pattern and Temperature and Humidity Characteristics during Regional Extreme Precipitation

The circulation associated with regional extreme precipitation is featured by a synergistic configuration of the South Asian high, upper-level jets, WPSH, and the southwest vortex, as shown in Figure 2. At the upper level (200 hPa), the southern TP and the precipitation area are controlled by the center of the South Asian high (Figure 2d). Thus, there is strong divergence at the upper level, and the southerly airflow prevails at the upper level over the precipitation area and its adjacent areas (Figure 2a). Additionally, upper-level jets appear in the northern TP. At the middle level (500 hPa), the wind field on the western side of the WPSH in the Sichuan Basin and its adjacent areas shows the cyclonic characteristic (Figure 2e). Combined with the vertical profile, positive vorticity can be found at the middle level, corresponding to the location of the vortex center. At the low level (850 hPa), the closed contour lines and the cyclonic wind field are more clearly visible in the Sichuan Basin and its adjacent areas on the eastern side of the SETP (Figure 2f), indicating the presence of the southwest vortex at the low level.
The analysis of water vapor flux indicates that the whole-layer water vapor convergence is strong over the southern TP and the area south of it. The region with the strongest water vapor convergence is located in the area from the SETP to the Sichuan Basin. The distribution of the water vapor flux from the tropical ocean to the vicinity of 30° N shows a southwest–northeast pattern. In particular, intense water-vapor transport flux appears in the area from the Bay of Bengal to the SETP. This result is explained by the fact that the wind field in this region is dominated by the southwesterly flow, which provides favorable conditions for the water vapor transport responsible for extreme precipitation.
In terms of vertical velocity, the strong ascending flow appears in the extreme precipitation area (Figure 2a). There is noticeable wind convergence at the low level on the north and south sides of the precipitation area, while an apparent large-value area of top net thermal radiation appears on the southern side of the upper-level strong divergence area. The top net thermal radiation can represent the absorption of atmospheric long-wave radiation by clouds in the area, especially the development of convective clouds near low-latitude areas. Under the background of the above circulation configuration and water vapor transport conditions, the large-value area of the top net thermal radiation is located in the southern TP, the area south of it, and the surrounding areas of the Sichuan Basin, suggesting that the absorption capacity of clouds for atmospheric long-wave radiation in these areas is considerably stronger than in other areas. With the development of the strong convection mentioned above, it can be seen that the development of convective clouds in this area is vigorous, and the convective activities are strong.

3.3. Evolution Characteristics of Synoptic-Scale Circulations and Temperature and Humidity Anomalies before Regional Extreme Precipitation

The composite analysis of 100 extreme precipitation events is conducted in this section. Since the time scale of the evolution of synoptic-scale circulations is 8–10 days, the evolutions of the circulation pattern and thermodynamic anomalies for 8 days before regional extreme precipitation is analyzed to preliminarily reveal the obvious signals that characterize the occurrence and development of precipitation processes.

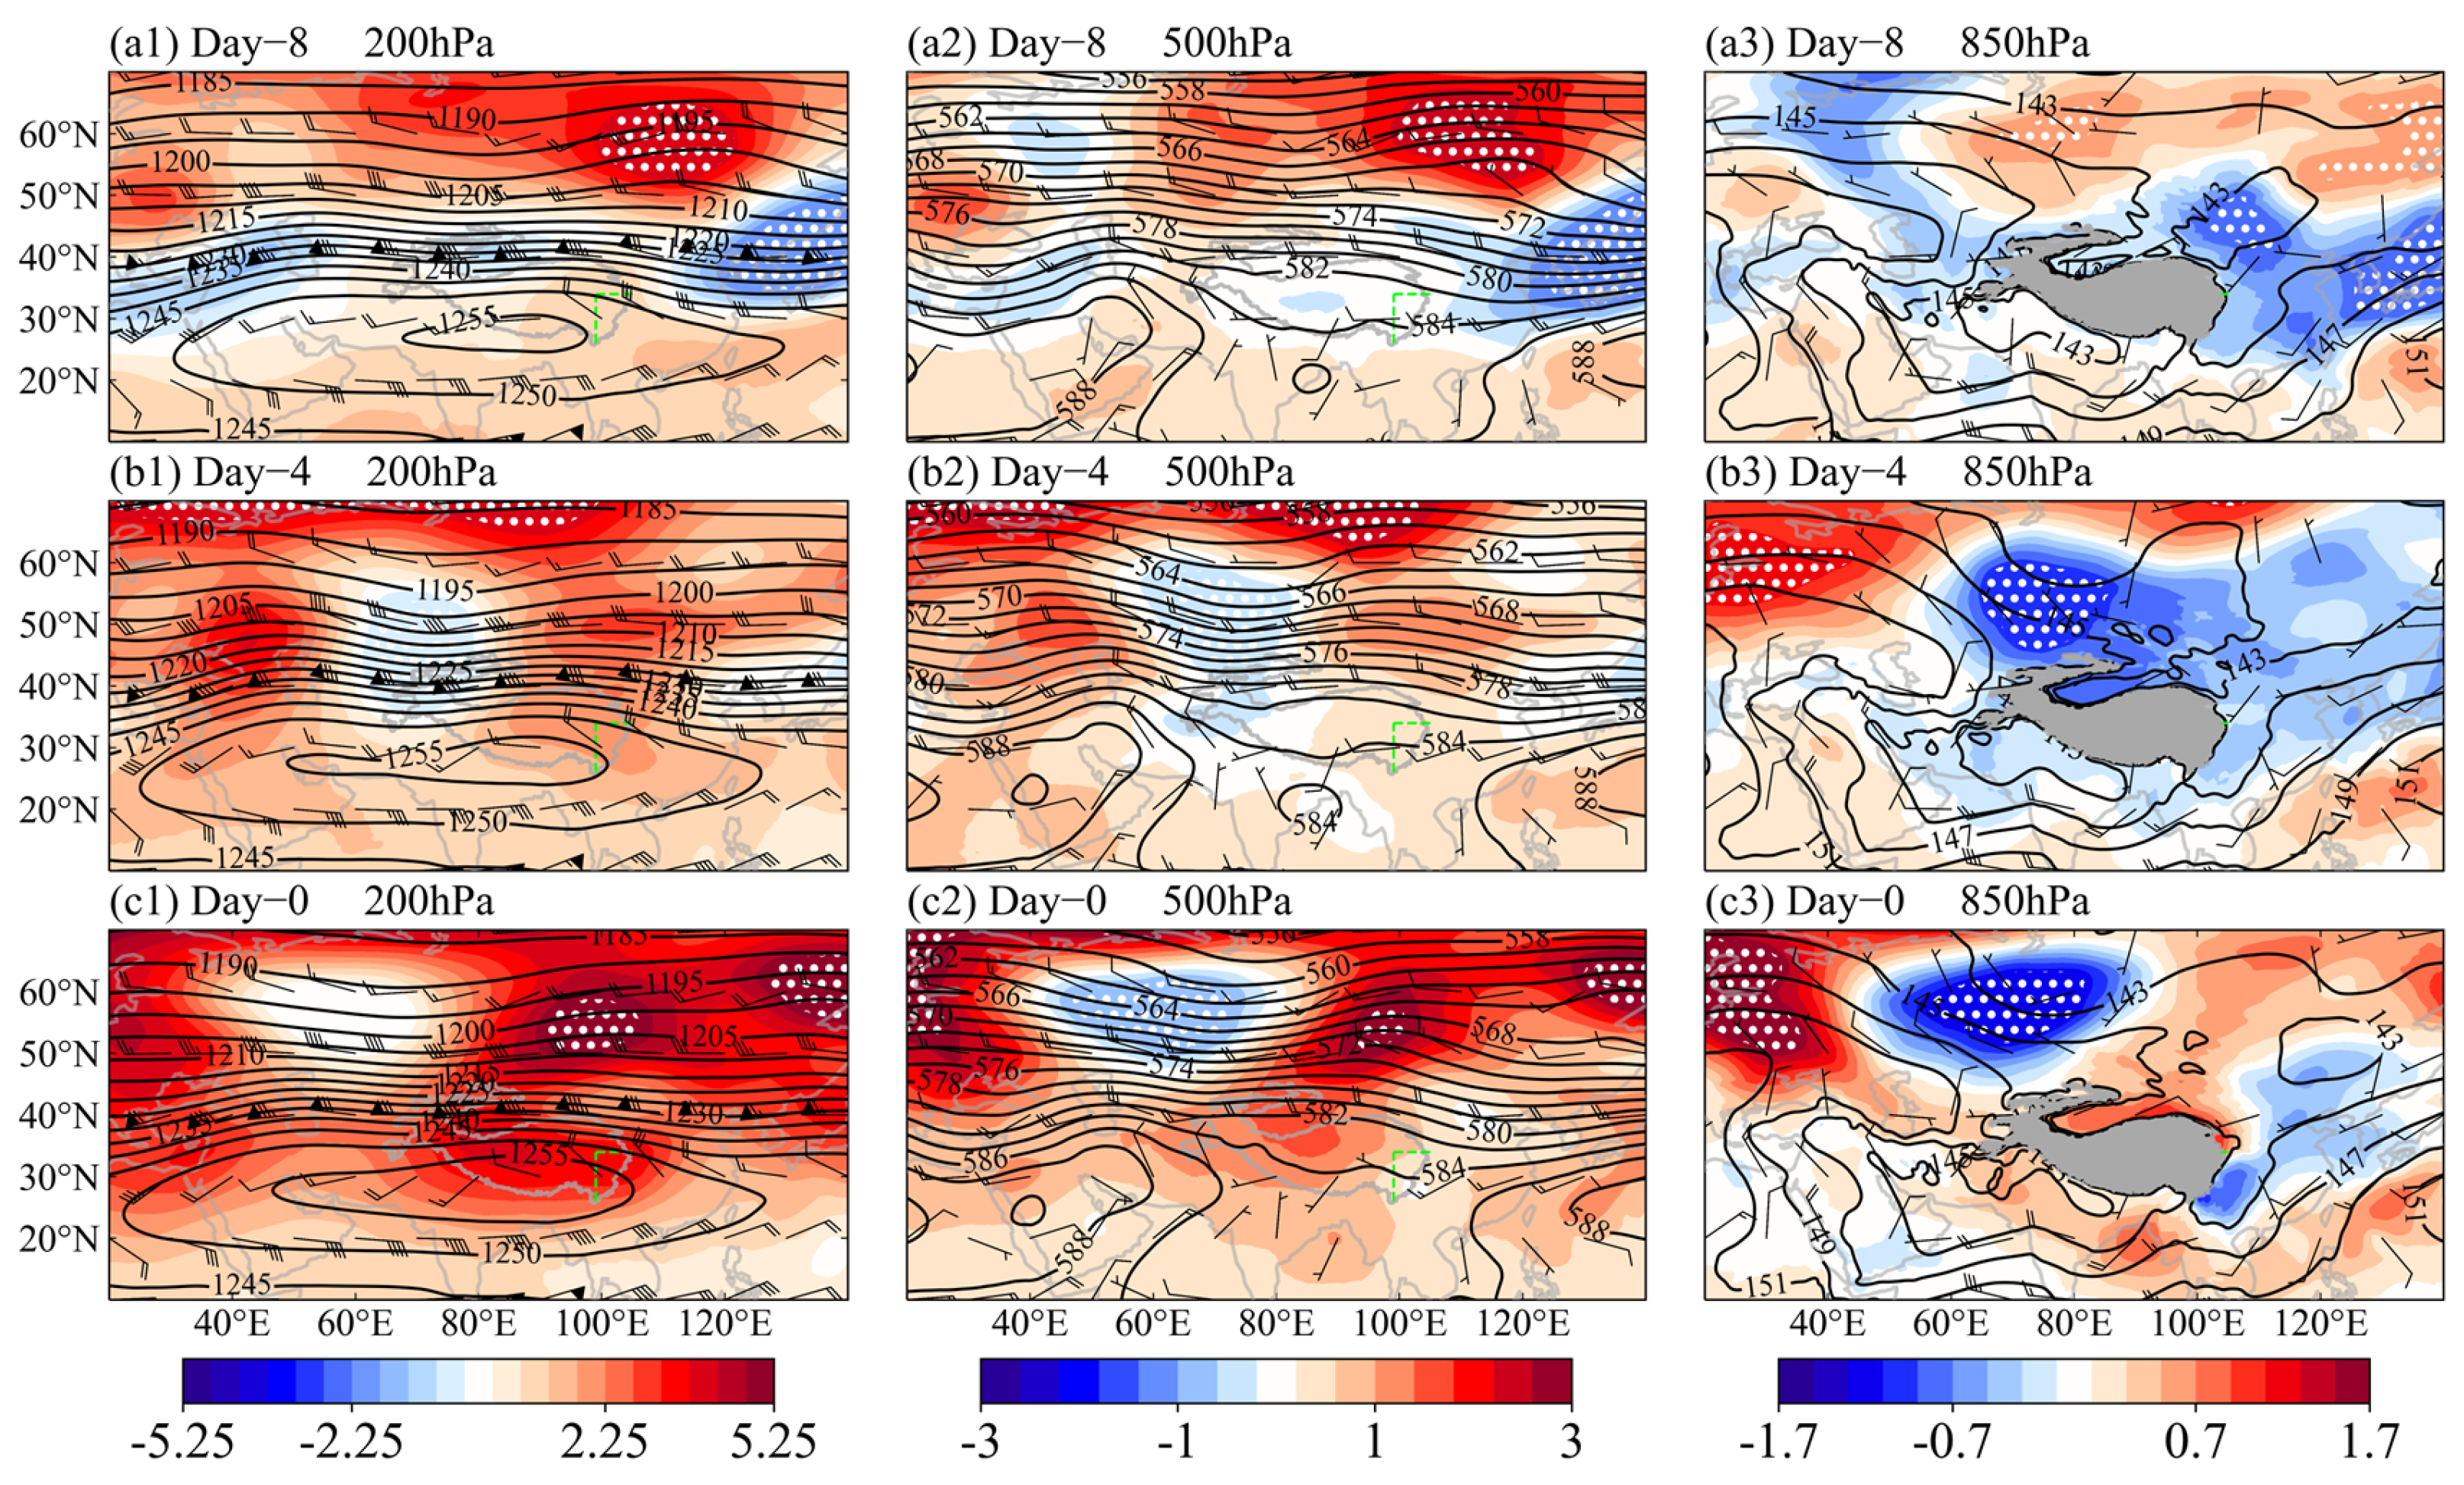
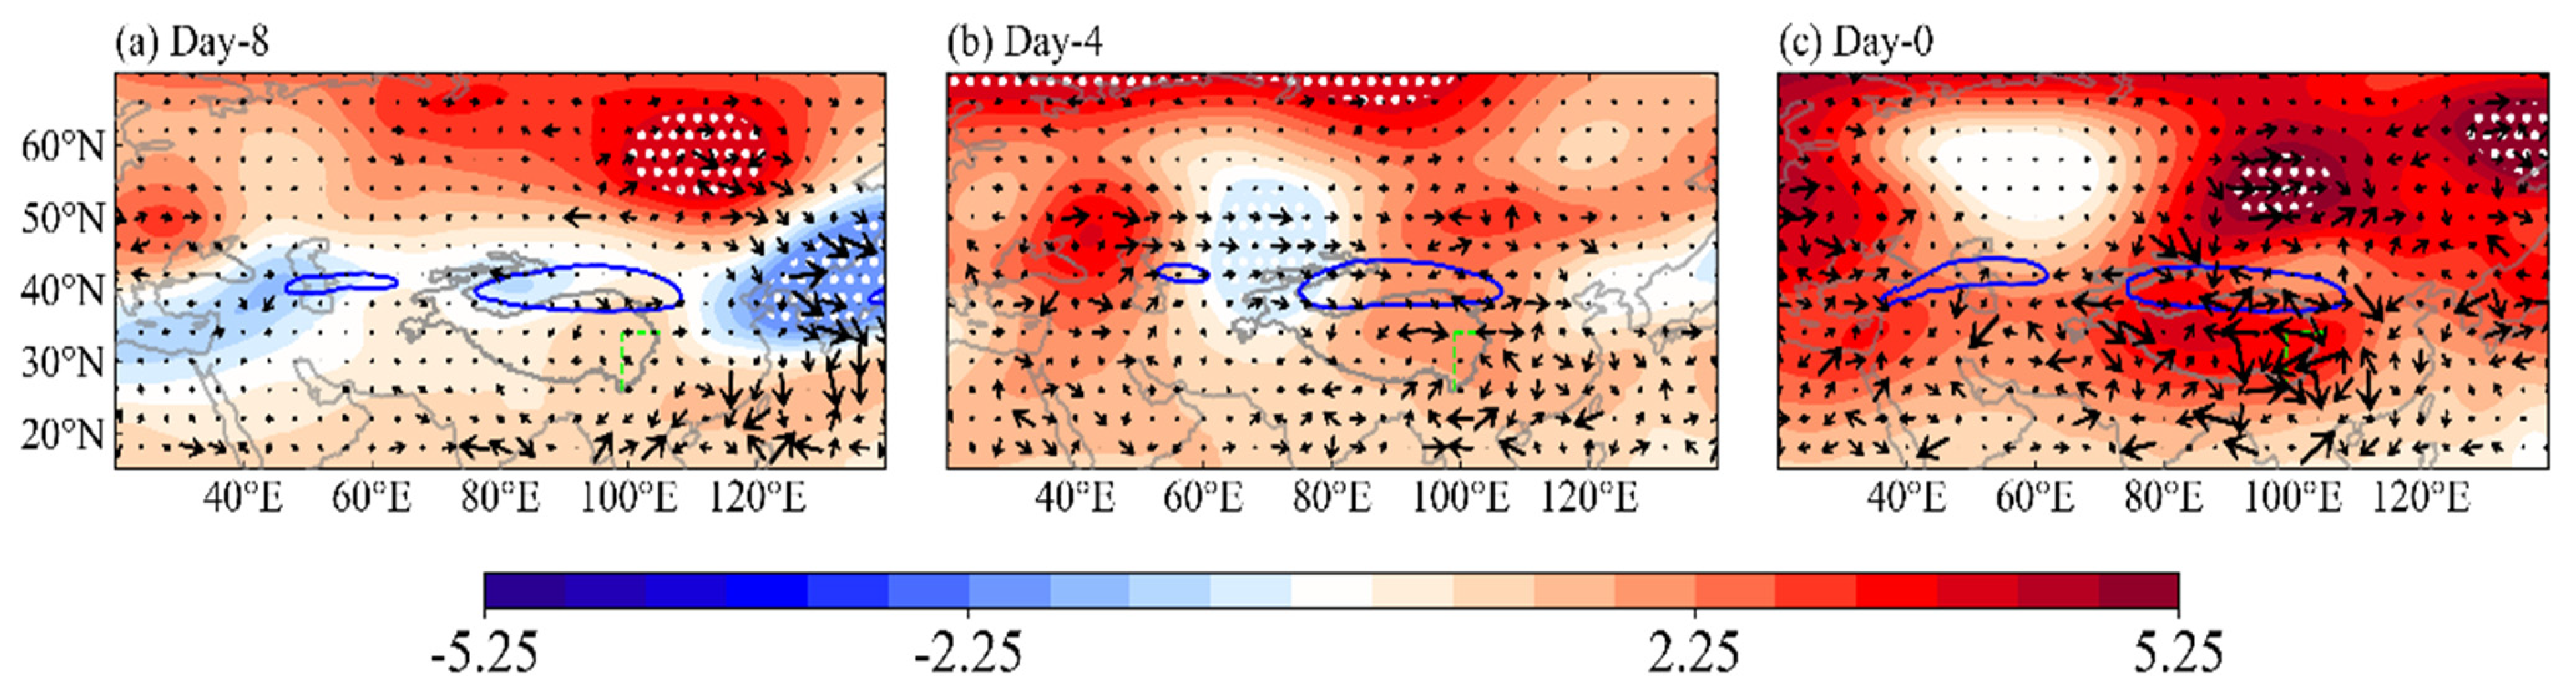
3.3.1. Anomalies of Synoptic-Scale Atmospheric Circulations and Geopotential Height

Figure 3 presents the distribution of these variables on the 8th day and 4th day before extreme precipitation and on the day of extreme precipitation. The results suggest that there are obvious circulation variations near the center of South Asian high at the upper level (200 hPa). A zone of negative geopotential height anomaly across the Eurasian continent appears in the jet area near 40° N on the northern side of the South Asian high. With the imminent occurrence of extreme precipitation, the geopotential height anomaly gradually turns from negative to positive, and the main range of the northern Eurasian continent is controlled by the positive geopotential height anomaly. In addition, the positive anomaly center appears in the Siberian region, and the South Asian high center gradually strengthens. The eastern part of the South Asian high center directly controls the precipitation area, and the upper-level divergence intensifies in the precipitation area, conducive to the development of strong convection. At the middle level (500 hPa), the variation in the geopotential height anomaly on the TP and its adjacent areas is noticeable. Specifically, on the 8th day before extreme precipitation, there are obvious negative geopotential height anomalies on the central TP, which are not significant on the whole plateau. The northern, western, and southern TP regions are controlled by a positive geopotential height anomaly, while the eastern TP is controlled by a negative anomaly. On the 4th day before extreme precipitation, the eastern TP is controlled by a weak positive geopotential height anomaly, while a negative geopotential height anomaly appears on the northwestern side of the TP. On the day of extreme precipitation, the TP and its adjacent areas are controlled by a positive geopotential height anomaly. There is an area with an obvious positive geopotential height anomaly on the northwestern side of the TP, whose center is located north of the TP. With the strengthening of the positive anomaly, the troughs in the southwestern and southeastern TP strengthen, and the mesocyclone in the precipitation area enhances, which favors the development of strong convection. Meanwhile, the positive geopotential height anomaly near the WPSH center continues to strengthen, and the stable southwesterly airflow on the western side of the WPSH is conducive to the maintenance of water vapor transport at the middle and lower levels. At the low level (850 hPa), the variation in the geopotential height anomaly on the TP and its adjacent areas is also noticeable. This area is first controlled by a negative geopotential height anomaly. As the negative anomaly gradually strengthens, the negative anomaly area is divided into the northwestern and southeastern parts. The negative anomaly in the southeastern part strengthens near the Sichuan Basin, and the cyclonic circulation is considerably enhanced, characterizing to a certain extent the development of the low-level southwest vortex associated with extreme precipitation. Overall, the geopotential height anomaly during extreme precipitation is mainly characterized by strengthening in the upper level and weakening in the lower level, which are favorable for the enhancement in convection activities.
With the atmospheric circulation anomalies mentioned above, the variation in whole-layer water vapor transport is also significant (Figure 4). In terms of the direction and source of water vapor transport, on the 8th day before the precipitation, the water vapor transport in the precipitation area shows a zonal pattern, mainly from the Indian Ocean in the southwest. The water vapor from the South China Sea can be ignored. However, the zonal water vapor transport to the east weakens with time, while the meridional water vapor transport to the north strengthens. Especially during the precipitation period, the zonal water vapor transport is the strongest, the water vapor from the tropical western Pacific increases, and there is water vapor transported meridionally from the back of the TP to the south. Moreover, before the precipitation, it is evident that the negative values of water-vapor flux divergence increase significantly in the precipitation area and on the southern side of the TP, indicating the strong water vapor convergence in these regions, especially on the southern side of the TP towards the extreme precipitation day. The water vapor from the Indian Ocean, the tropical western Pacific, and the northern side of the TP strengthens and converges at the SETP, forming cyclonic convergence, which is conducive to the development of extreme precipitation.

3.3.2. Wave Action Flux Anomaly before Regional Extreme Precipitation

Before the extreme precipitation, the wave action flux (Figure 5) obviously develops along the direction of alternating positive and negative geopotential height anomalies. In addition to the geopotential height anomaly center, strong wave action-flux also appears near the upper-level jet zones, which is related to the momentum transport near jet zones. However, as the geopotential height anomaly at the upper level over the Eurasian continent is gradually dominated by the positive anomaly, the entire TP becomes a region of wave action-flux convergence, especially the SETP. This result demonstrates that energy transport in the SETP is relatively intense, which may be related to the kinetic energy transport for extreme precipitation. Eight days before the extreme precipitation, the upper-level jet zone is relatively stable in the northern TP, which is conducive to the continuous kinetic-energy transport to the plateau and thus supports the development of strong convection.

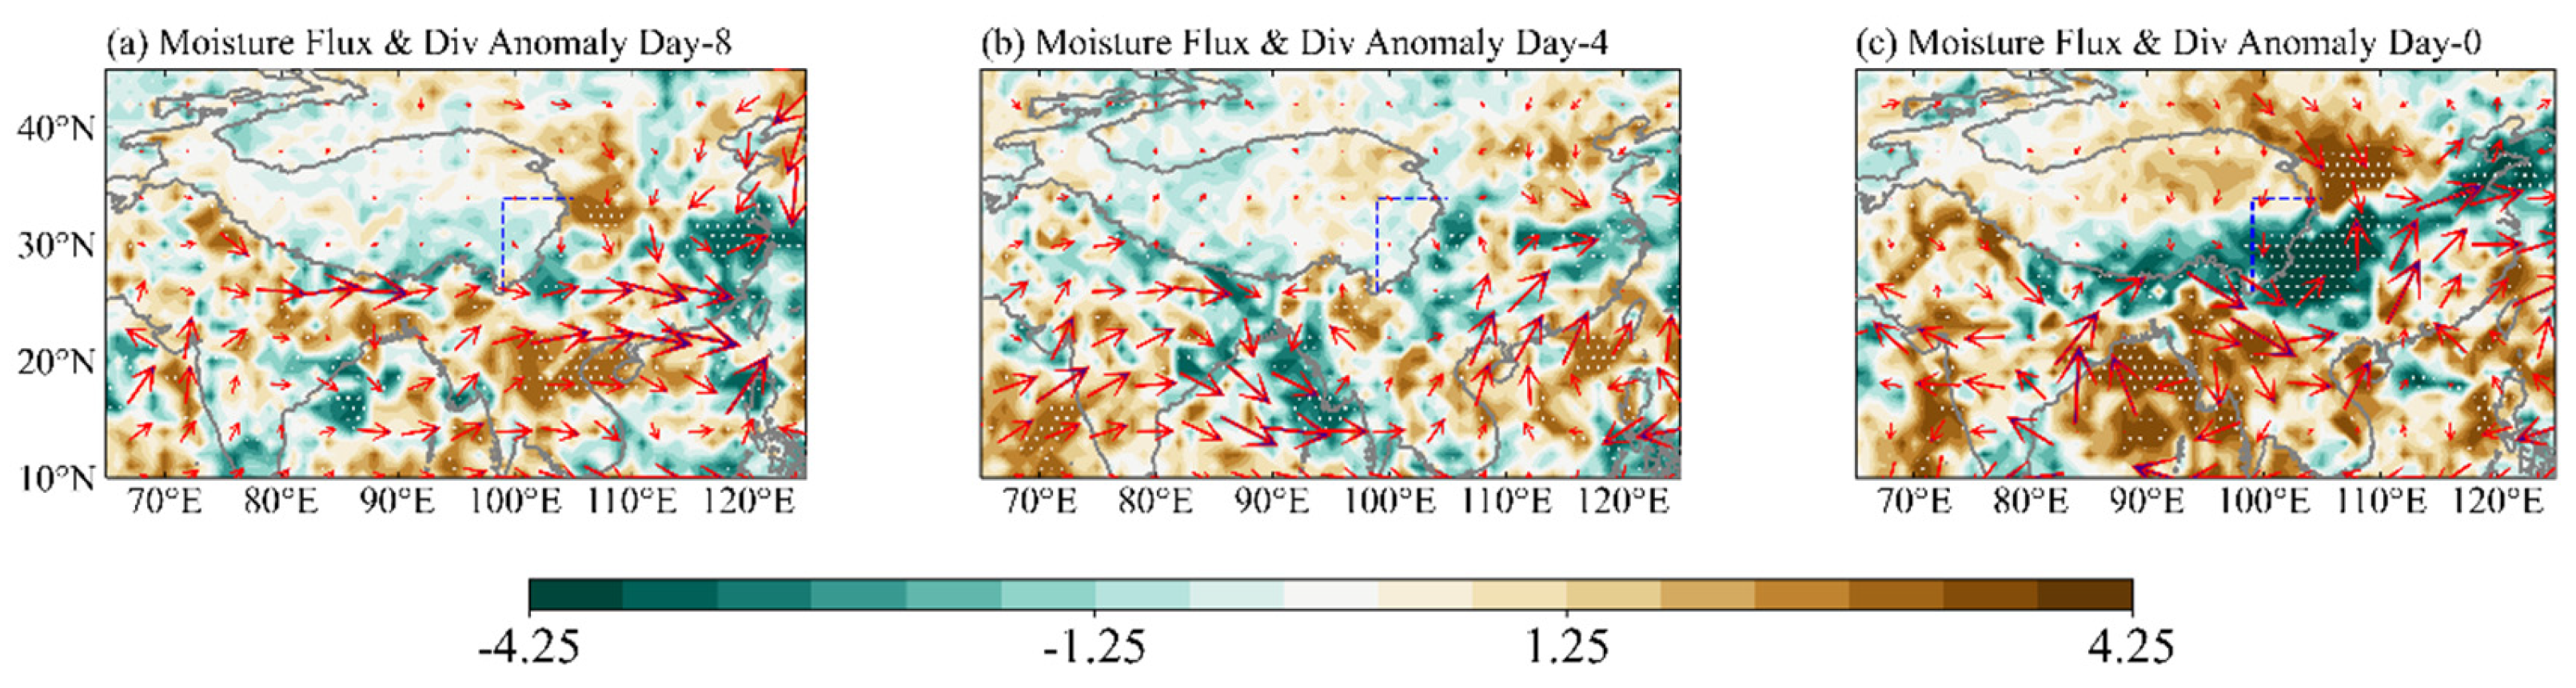
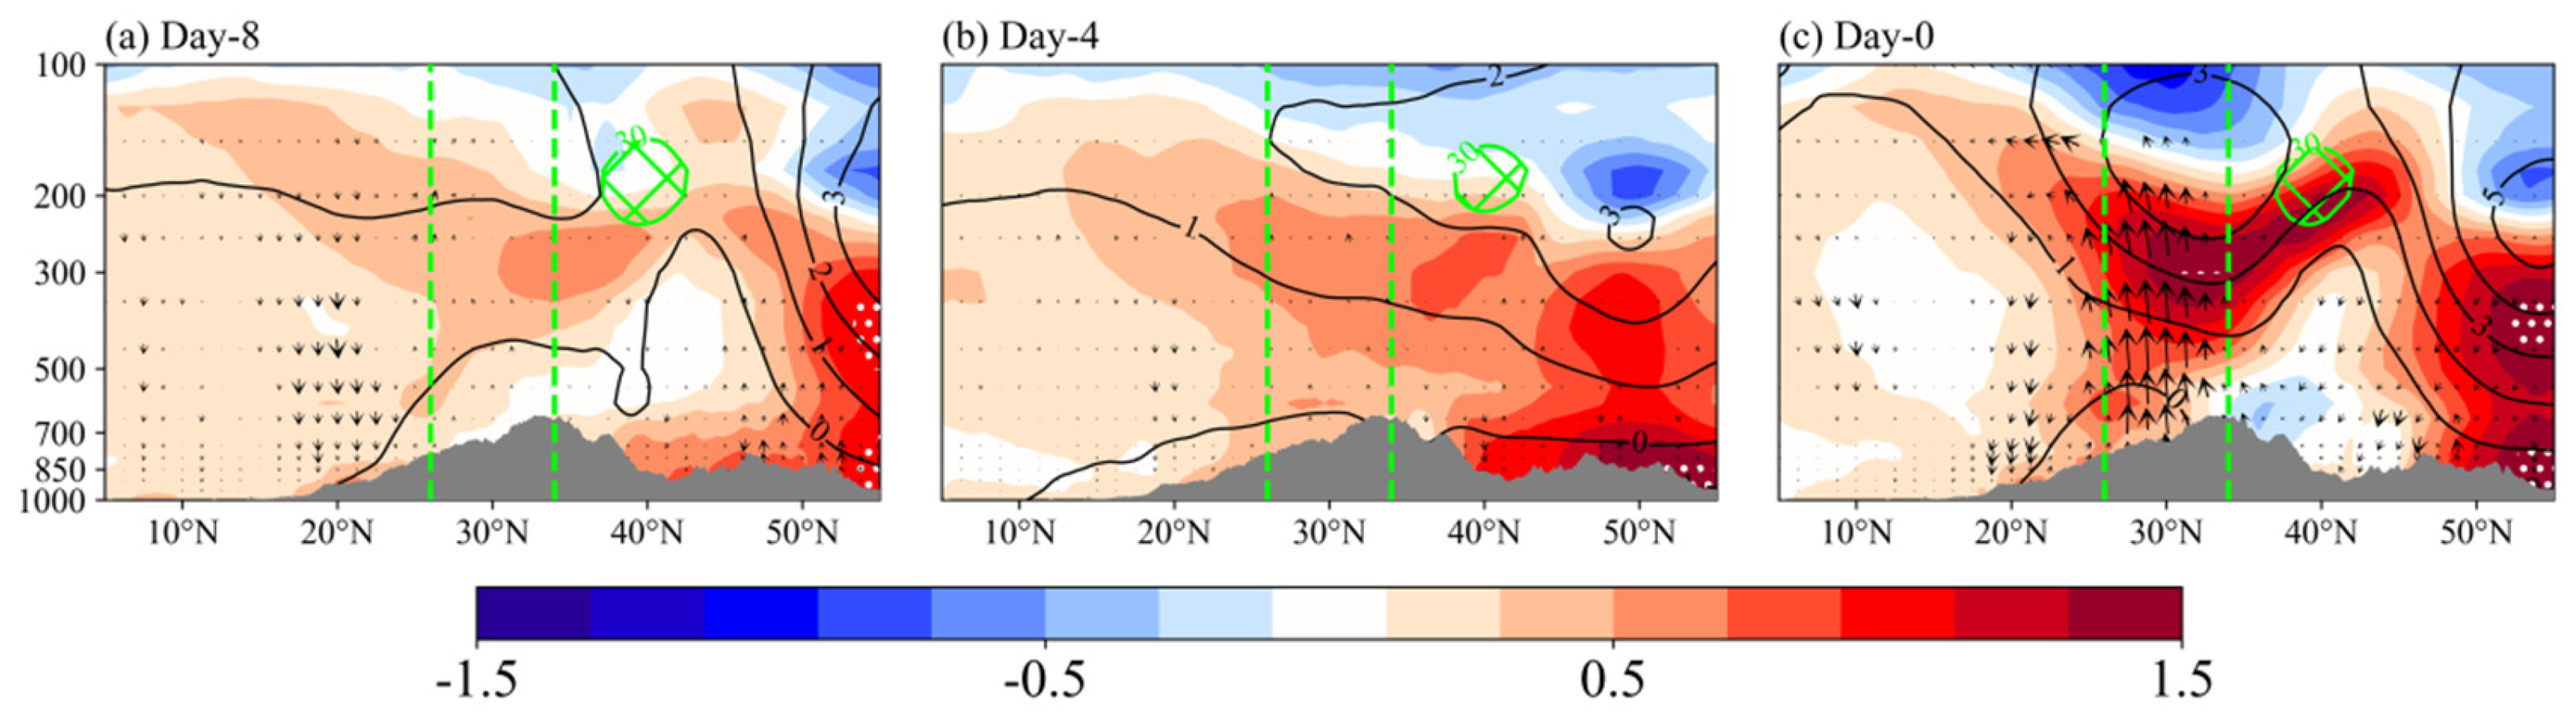
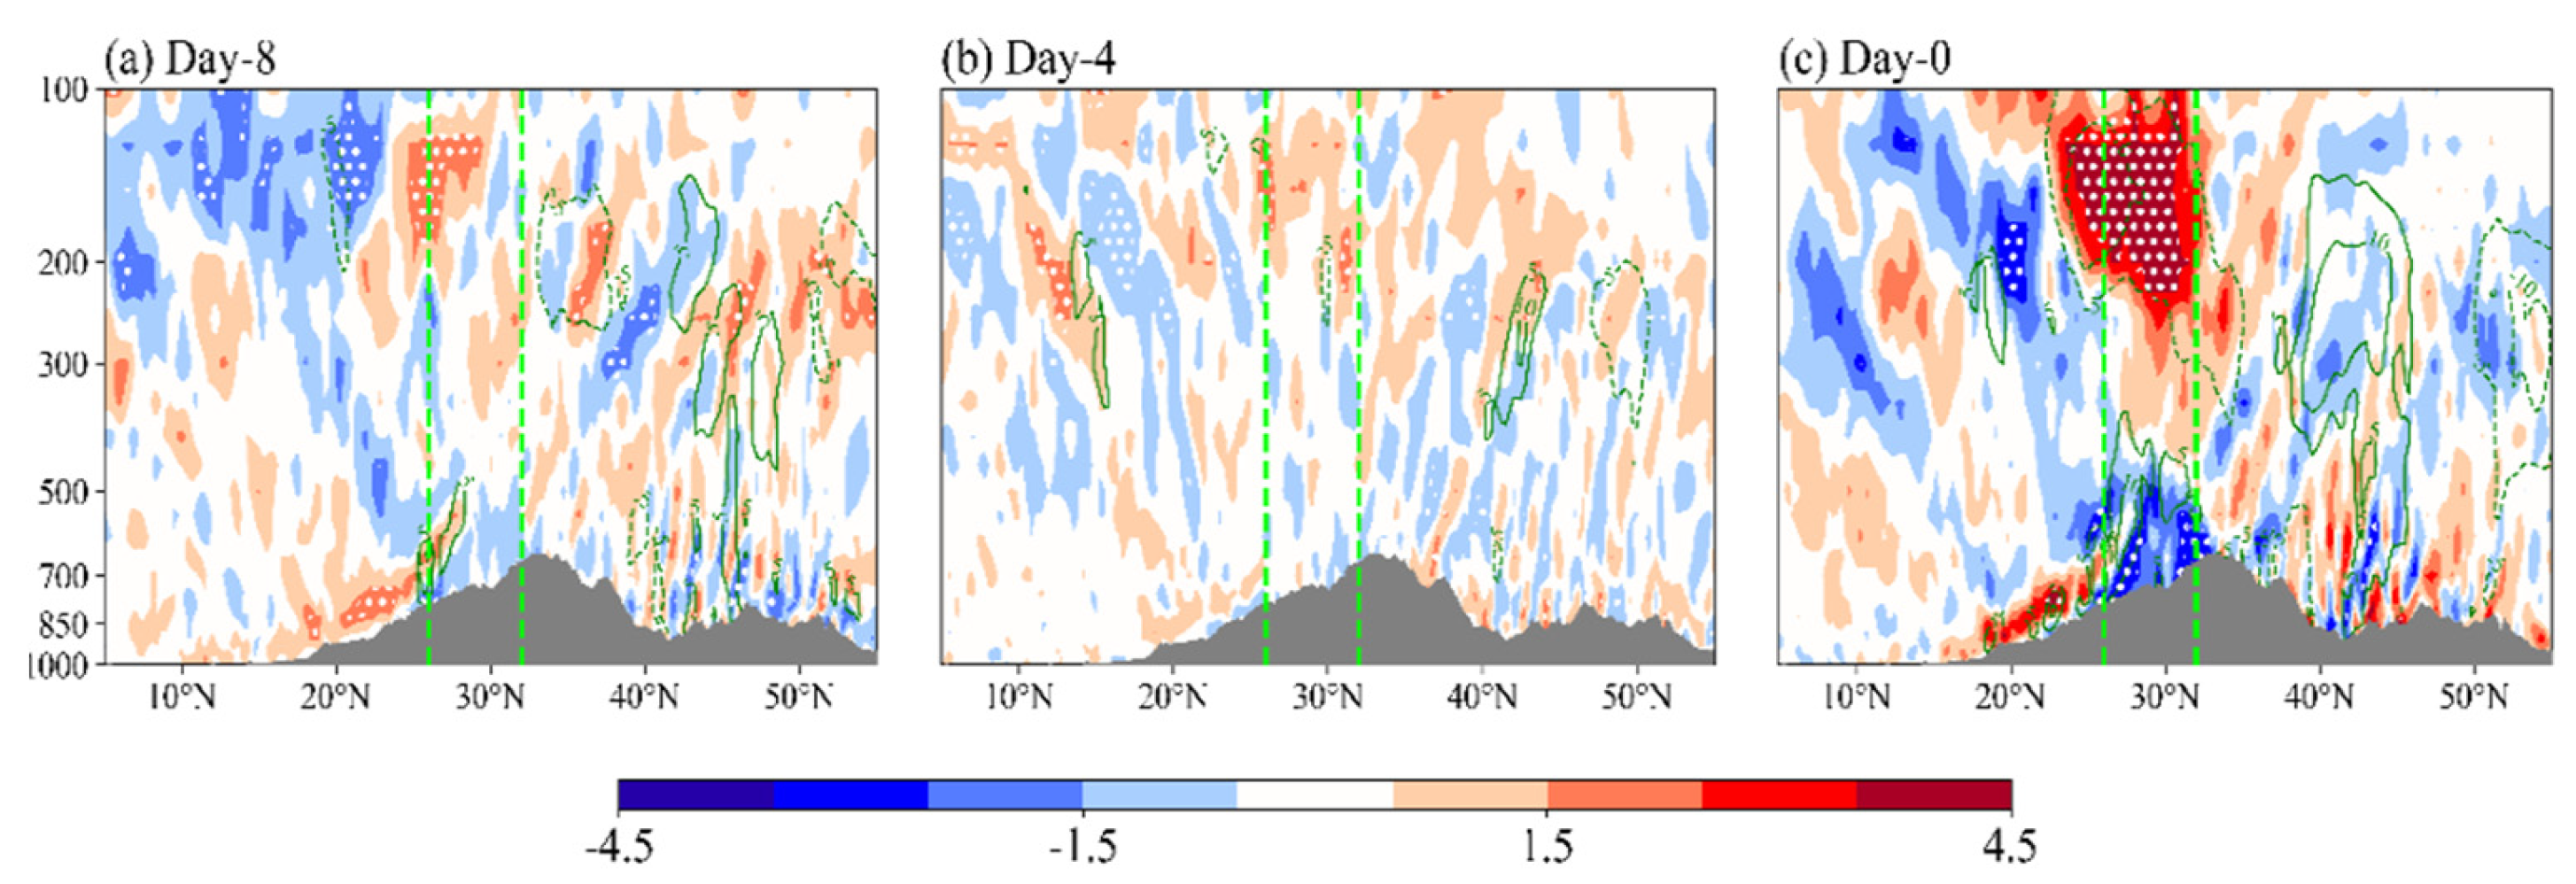
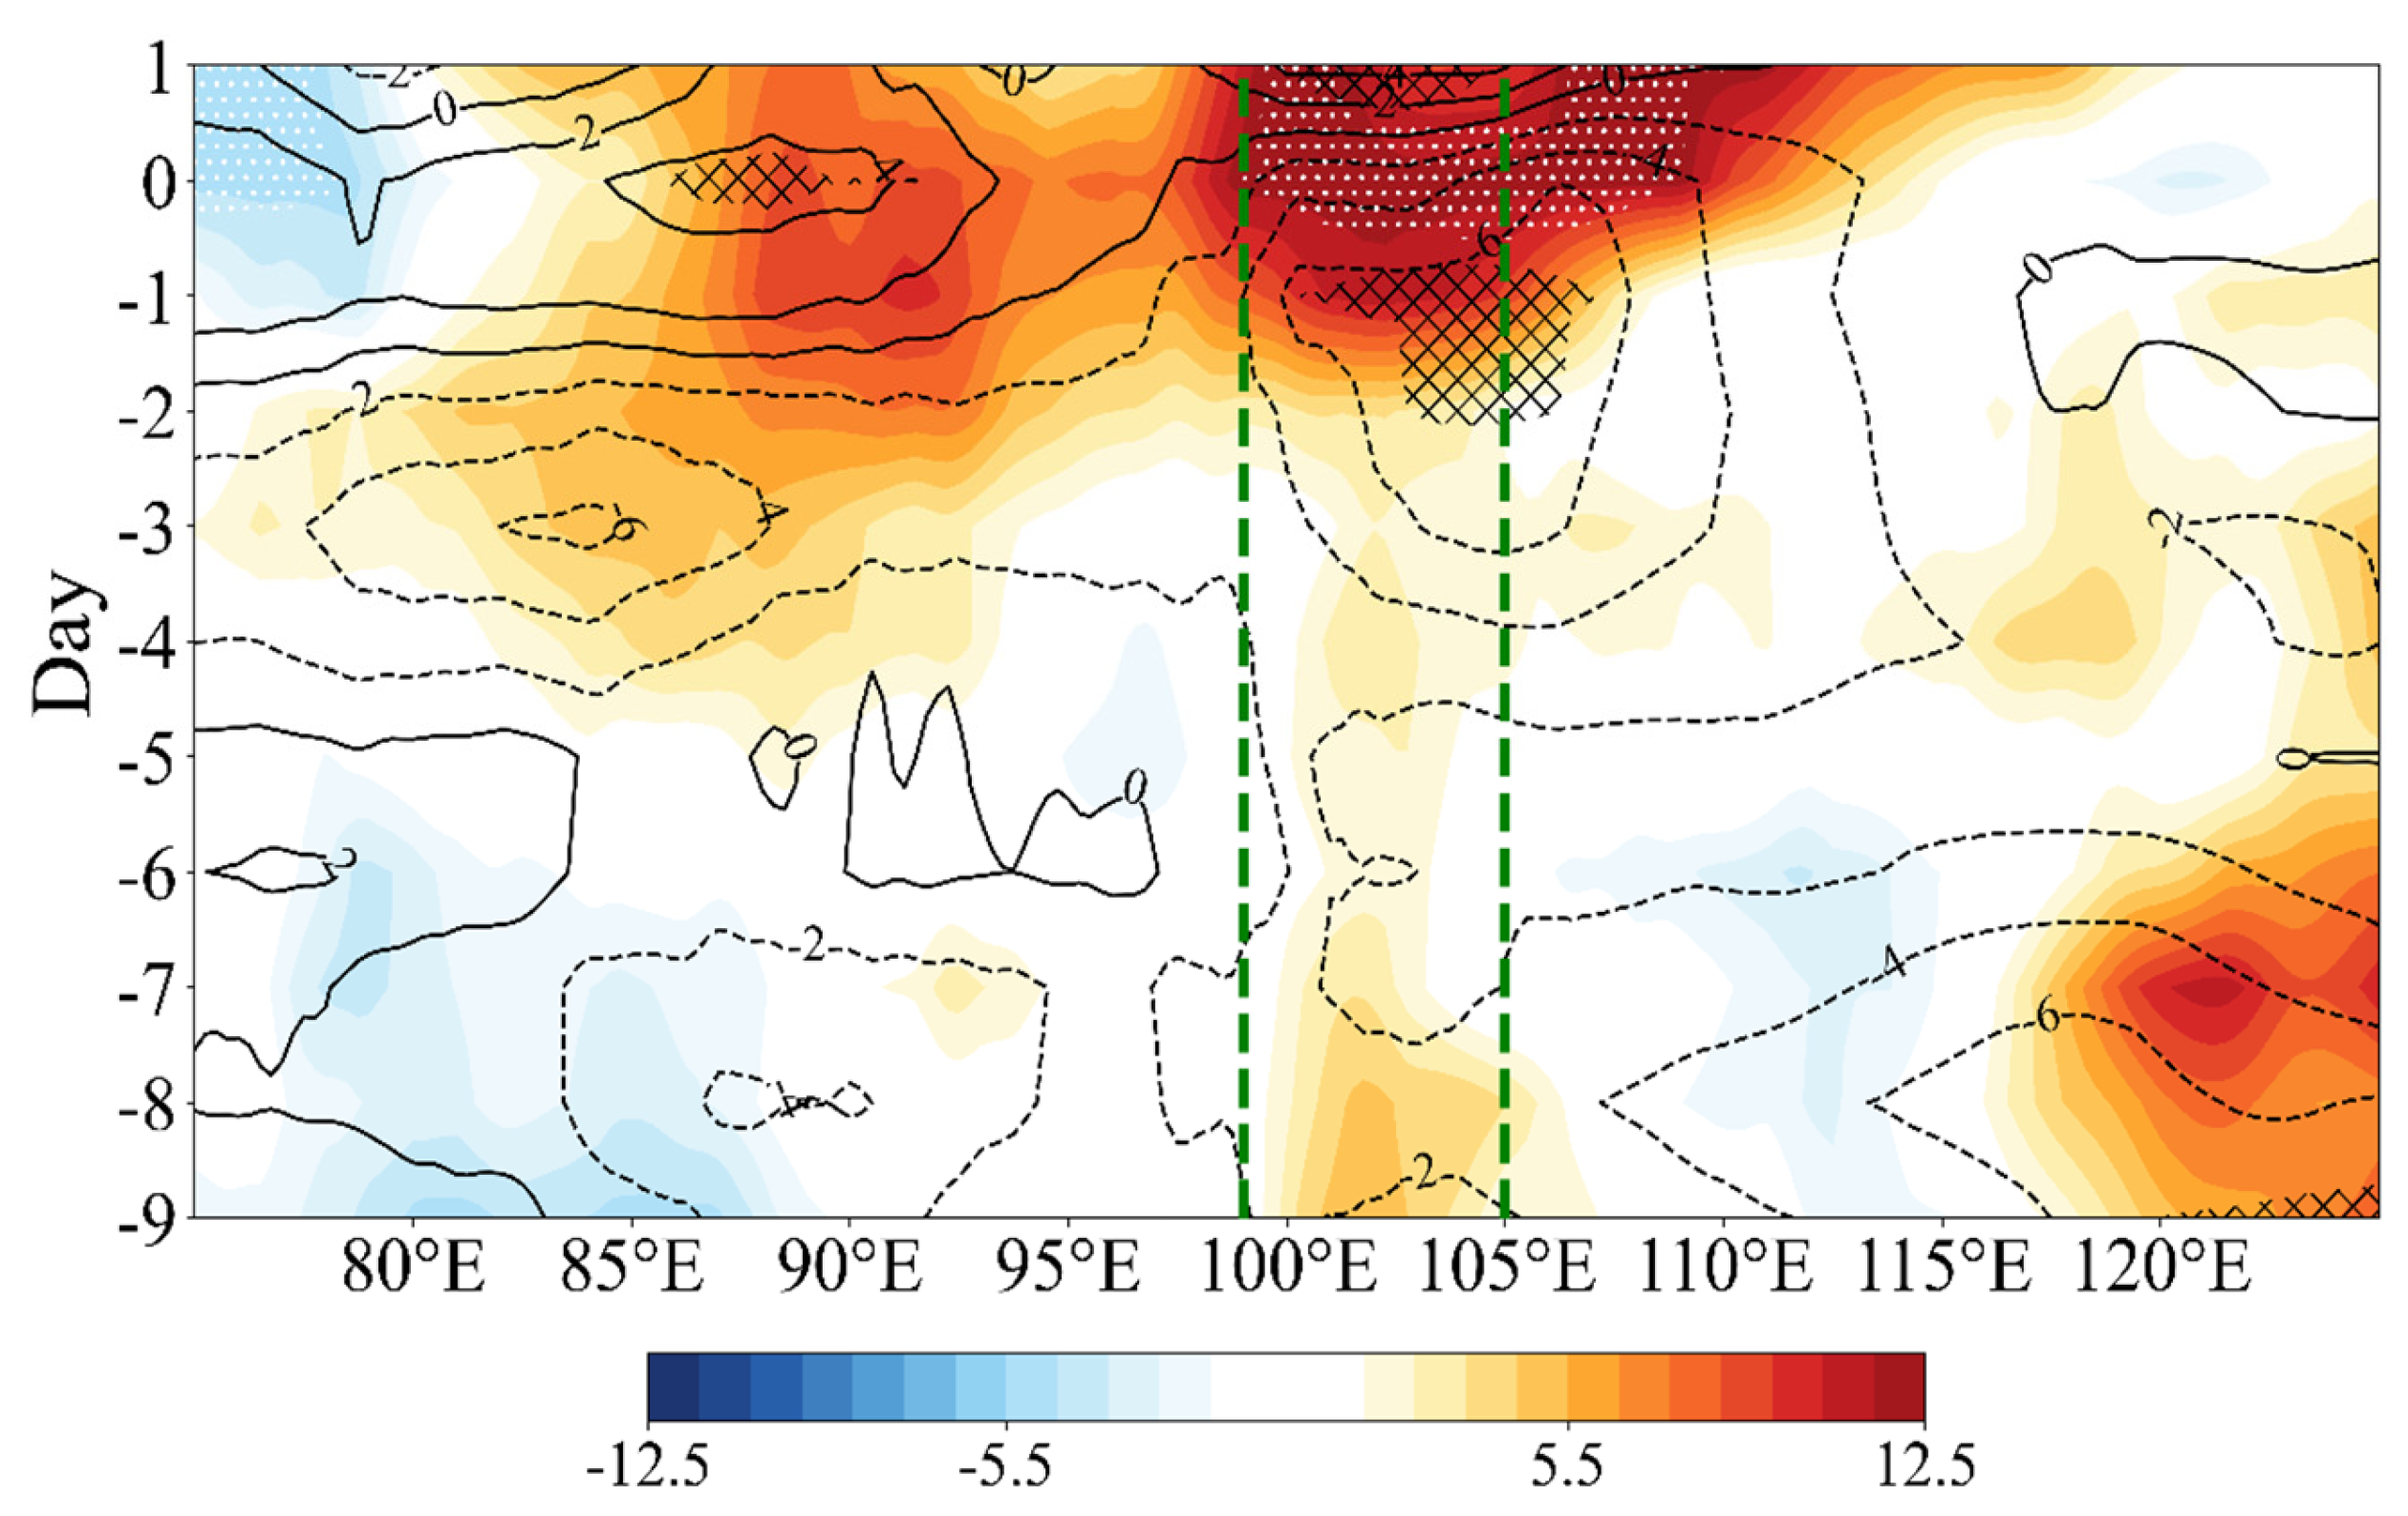
3.3.3. Atmospheric Temperature and Humidity Structure and Convective Activity Anomaly

Figure 6 shows the vertical profiles of the anomalies of atmospheric temperature, vertical velocity, and geopotential height averaged in 99° E–105° E on the 8th day and 4th day before the extreme precipitation and on the day of the extreme precipitation. It can be seen that the temperature anomaly presents a dipole pattern of “colder in upper layers and warmer in lower layers”, and the positive temperature anomaly controls in the middle and lower levels below 200 hPa. With 150–200 hPa as the boundary, there is a large temperature gradient between the upper level and middle-lower levels. This dipole pattern of temperature anomaly does not initially appear in the extreme precipitation area but is located north of the precipitation area near 50° N. With the formation of extreme precipitation, the temperature anomaly center and geopotential height anomaly center gradually strengthen and move southward to the precipitation area from the area north of it, and the atmospheric baroclinity near the anomaly center strengthens. This transfer process of temperature anomaly from high latitudes to low latitudes also suggests that the extreme precipitation in the SETP is particularly affected by the anomaly of atmospheric thermodynamic structure in high latitudes. On the day of extreme precipitation, the dipole pattern of temperature anomaly, namely “colder in upper layers and warmer in lower layers”, peaks near 30° N. This atmospheric instability structure eventually results in a vertical circulation situation that favors the formation of extreme precipitation, i.e., descending motion controls the north and south sides and ascending motion controls the precipitation area. This dipole pattern of the temperature anomaly is particularly significant near 50° N, where the intensity of the temperature anomaly is significantly stronger. Eventually, anomalous cold airflow invades from the lower level to the northern side of the precipitation area, resulting in the strengthening of low-level convergence over the precipitation area and thereby facilitating the development of convection. It is worth noting that such temperature and geopotential anomalies occur together in the vicinity of the upper-level jet zones. Whether the occurrence and development of extreme precipitation is associated with energy transport of jets requires further attention in future studies.
To further reveal the atmospheric circulation characteristics corresponding to the above temperature anomaly structure, we analyzed the vorticity and divergence associated with extreme precipitation. Figure 7 presents the vertical profiles of the anomalies of atmospheric divergence and vorticity fields. The results suggest that the whole-layer divergence anomaly weakens first and then strengthens, and it enhances significantly when extreme precipitation occurs. In the precipitation area, the positive divergence anomaly persists in the middle and upper levels above 200 hPa on the 8th day before the precipitation, corresponding to the development of the South Asian high. However, at 500 hPa, the negative divergence anomaly persists in the precipitation area, i.e., there is continuous convergence at the low level and thus the ascending motion gradually develops. With the development of the divergence anomaly, the vorticity anomaly is further enhanced. Such a temperature and humidity structure is especially favorable for convective development. As shown in Figure 7c, there is strong divergence at the upper level and convergence at the lower level on the day of precipitation, which coincides with the results in Figure 6c.
To investigate the convective activity intensity in the precipitation area, we analyzed the variation characteristics of the top net thermal radiation anomaly for 8 days before the extreme precipitation, as shown in Figure 8. It can be found that the top net thermal radiation in the precipitation area and the surrounding area of the TP generally shows positive anomalies within 8 days before the extreme precipitation. However, the positive anomalies are not significant for a few days before the precipitation, and the top net thermal radiation increases significantly only for 1–2 days before the precipitation and peaks on the day of the precipitation. This result implies that 2 days before the extreme precipitation, clouds over the precipitation area and its adjacent areas thicken significantly, the development of convective clouds is more vigorous, cloud-top height increases, and the absorption for long-wave radiation obviously increases. In terms of temporal evolution, the variation in convection intensity on the SETP lags behind that in the Sichuan Basin of the eastern part, indicating that there is a certain relationship in the connection between these two regions. The specific mechanism may need further analysis.

4. Conclusions and Discussion

4.1. Conclusions

Extreme precipitation events occur frequently in the SETP and cause serious disasters, but few studies have examined their precursors. Based on the station observations, the top net thermal radiation from satellite data, and the ERA5 data, we select 100 extreme precipitation events with the largest average rainfall in the SETP from 2001 to 2020 in this study. Moreover, the evolution characteristics of large-scale thermodynamic structure within 8 days before extreme precipitation are analyzed using synthetic analysis and atmospheric thermodynamic calculation methods. Based on this, an attempt is made to identify the significant precursor signals for the occurrence of extreme precipitation in the SETP. The main conclusions are summarized as follows:
In terms of dynamic characteristics, the upper-level jet on the northern side of the South Asian high continues to be maintained on the northern side of the TP within 8 days before the precipitation, which is favorable for the continuous momentum transport from the upstream to the center of the South Asian high. This situation is not only conducive to the strengthening of the South Asian high, but also beneficial to the enhancement in upper-level divergence over the precipitation area in the eastern South Asian high center, thereby favoring the development of strong convection. At the middle level, the WPSH center is stable from eastern China to the ocean, which is favorable for the water vapor transport by southwesterly airflow on the western side of the WPSH and the middle-level convergence over the precipitation area. At the lower level, the circulations on the northern and southern sides of the TP show relatively pronounced fluctuations. This circulation pattern facilitates the water vapor transport from the Bay of Bengal to the southern side of the TP, forming a superimposed structure of an anticyclonic enhancement and a cyclonic enhancement on the southern and southeastern sides of the TP. This superimposed structure results in the development of the southwest vortex in the precipitation area, significantly enhancing the convergence of water vapor from the Indian Ocean and western Pacific in the extreme precipitation area. Overall, accompanying the wave train that propagates across the Eurasian continent and reaches East Asia, the extreme events over SETP during the summer season are dominated by the background large-scale atmospheric circulations characterized by the strengthened Southern Asia high (SAH), the westward extended Western Pacific subtropical high (WPSH), and a deepened eastern Asia trough.
For the thermal characteristics, the vertical distribution of temperature anomalies near 50° N in the area north of the precipitation area shows a pattern of “colder in upper layers and warmer in lower layers” for 8 days before the extreme precipitation, and the geopotential height anomaly center is located at the junction of positive and negative temperature anomalies. This temperature anomaly pattern leads to regional atmospheric instability, which is conducive to the development of convection. Further analysis also suggests that the upper-troposphere divergence aloft combined with lower pressures at surface lead to upward vertical motion of circulations, along with the enhanced water vapor transport conveyed both by the East Asian summer monsoon and the Indian summer monsoon, ultimately leading to extreme precipitation. This conclusion related to the convections’ development is further confirmed by cloud radiation from satellite observations.

4.2. Discussion

Although a great deal of research has been devoted to exploring the factors influencing the occurrence of the heavy rainfall over Southern China, including the SETP region of this study [11,14,15,19,20,21,22,23,24,25,26], few studies have been carried out with a focus on the SETP of this study. However, parts of our results could be compared with those studies. For examples, Xu et al. [24] showed that the large-scale circulations responsible for the summer heavy rainfall events over the Sichuan Basin are featured by the configuration of eastward-extended SAH, the westward-extended Western North Pacific Subtropical High, and an obvious low-level vortex, which agree with our results in this study. Zhang et al. [22] also pointed out that the westward extension of Western North Pacific Subtropical High could drive tropical cyclones southward and then increase the occurrence of extreme precipitation in South China. Nie and Sun [9] and Qian et al. [27] stated that the atmospheric wave train propagates almost a week before heavy precipitation over the southwest of China could give rise to an anomalous low over the eastern Tibetan Plateau, which has been reconfirmed by this study. Other studies also emphasized the Tibetan Plateau vortices and southwest vortices [14,15,28,29], and interactions between the Indian–Myanmar trough and the East Asia colder trough, which also been verified by the results of this study.
Previous studies have explored the impacts of tropical cyclones on the formation of extreme rainfall in the southwest of China [22,30]. In this sense, one limitation of our study presented here is that we did not exclude extreme precipitation events that were influenced by tropical cyclones. However, considering the lower amount of tropical cyclones arriving at the SETP region, the main conclusion would possibly not change after removing the impacts of tropical cyclones, which can be explored in a further study. Furthermore, the role of surface SST over the Pacific ocean or North Atlantic in modulating the extreme precipitation has been explored in previous studies [22,23]; however, we did not take account of this factor due to the scope of this study, however, it merits a deeper study.
Overall, the results of this study reveal the main thermodynamic characteristics of extreme precipitation and its evolution in the SETP before its formation. Some precursor signals of extreme precipitation in this area are identified. Some of the precursor signals are strong and can last for 8 days, which are significant features and easily identified. These synoptic-scale thermodynamic anomaly features can provide references for the understanding and prediction of extreme precipitation in the SETP. Meanwhile, the detailed physical mechanisms of these signals, such as the diagnosis and formation mechanisms of water vapor transport related to thermodynamic processes, and the role of other factors including but not limited to low-level jets, SST, and tropical cyclones, points to the need for future studies.

Author Contributions

Methodology, L.C., B.C. and X.X.; validation, L.C., B.C. and R.Z.; data curation, L.C., B.C. and R.Z.; writing, L.C.; funding acquisition, B.C. and X.X. All authors have read and agreed to the published version of the manuscript.

Funding

This research was funded by the Second Tibetan Plateau Comprehensive Scientific Expedition and Research Program (2019QZKK0105), the S&T Development Fund of CAMS (2021KJ021), and the National Natural Science Foundation of China (Grant No. 91937301).

Data Availability Statement

Not applicable.

Acknowledgments

We thank ECMWF for the ERA-interim data; and thank NASA for the GPM-IMERG precipitation data. The ERA-5 dataset can be obtained from https://www.ecmwf.int/en/forecasts/datasets/reanalysis-datasets/era5, accessed on 1 September 2021 and the GPM-IMERG dataset can be obtained from https://disc.gsfc.nasa.gov/datasets/GPM_3IMERGDF_06/summary?keywords=GPM, accessed on 1 May 2022.

Conflicts of Interest

The authors declare no conflict of interest.

References

  1. Dai, P.; Nie, J. Robust expansion of extreme midlatitude storms under global warming. Geophys. Res. Lett. 2022, 49, e2022GL099007. [Google Scholar] [CrossRef]
  2. You, Q.; Kang, S.; Aguilar, E.; Yan, Y. Changes in daily climate extremes in the eastern and central Tibetan Plateau during 1961–2005. J. Geophys. Res. Atmos 2008, 113, 1639–1647. [Google Scholar] [CrossRef] [Green Version]
  3. Cao, Y.; You, Q.; Ma, Q.; Meng, X. Probability distribution for the summer extreme precipitation in the Qinghai-Tibetan Plateau. Plateau Meteorol. 2017, 36, 1176–1187. (In Chinese) [Google Scholar]
  4. Dong, D.H.; Huang, G.; Tao, W.C.; Wu, R.G.; Hu, K.M.; Li, C.F. Interannual variation of precipitation over the Hengduan Mountains during rainy season. Int. J. Climatol. 2018, 38, 2112–2125. [Google Scholar] [CrossRef]
  5. Nie, Y.; Sun, J. Evaluation of high-resolution precipitation products over southwest China. J. Hydrometeorol. 2020, 21, 2691–2712. [Google Scholar] [CrossRef]
  6. Fu, Y.; Ma, Y.; Zhong, L.; Yang, Y.; Guo, X.; Wang, C.; Xu, X.; Yang, K.; Xu, X.; Liu, L.; et al. Land surface processes and summer cloud-precipitation characteristics in the Tibetan Plateau and their effects on downstream weather: A review and perspective. Natl. Sci. Rev. 2020, 7, 500–515. [Google Scholar] [CrossRef] [Green Version]
  7. Chen, Y.R.; Li, Y.Q. Convective characteristics and formation conditions in an extreme rainstorm on the eastern edge of the Tibetan Plateau. Atmosphere 2021, 12, 381. [Google Scholar] [CrossRef]
  8. Cai, S.; Huang, A.; Zhu, K.; Yang, B.; Yang, X.; Wu, Y.; Mu, X. Diurnal cycle of summer precipitation over the Eastern Tibetan Plateau and surrounding regions simulated in a convection-permitting model. Clim. Dyn. 2021, 57, 611–632. [Google Scholar] [CrossRef]
  9. Nie, Y.; Sun, J. Synoptic-scale circulation precursors of extreme precipitation events over southwest China during the rainy season. J. Geophys. Res. Atmos. 2021, 126, e2021JD035134. [Google Scholar] [CrossRef]
  10. Fu, S.; Li, W.; Sun, J.; Zhang, J.; Zhang, Y. Universal evolution mechanisms and energy conversion characteristics of long-lived mesoscale vortices over the Sichuan Basin. Atmos. Sci. Let. 2015, 16, 127–134. [Google Scholar] [CrossRef]
  11. Fu, S.M.; Mai, Z.; Sun, J.H.; Li, W.L.; Ding, Y.; Wang, Y.Q. Impacts of convective activity over the Tibetan Plateau on plateau vortex, southwest vortex, and downstream precipitation. J. Atmos. Sci. 2019, 76, 3803–3830. [Google Scholar] [CrossRef]
  12. Meng, Y.; Sun, J.; Zhang, Y.; Fu, S. A 10-year climatology of mesoscale convective systems and their synoptic circulations in the Southwest Mountain area of China. J. Hydrometeorol. 2021, 22, 23–41. [Google Scholar] [CrossRef]
  13. Li, Y.D.; Wang, Y.; Song, Y.; Hu, L.; Gao, S.T.; Fu, R. Characteristics of summer convective systems initiated over the Tibetan Plateau. Part I: Origin, track, development, and precipitation. J. Appl. Meteorol. Climatol. 2008, 47, 2679–2695. [Google Scholar] [CrossRef] [Green Version]
  14. Fu, S.-M.; Sun, J.-H.; Zhao, S.-X.; Li, W.-L. An analysis of the eddy kinetic energy budget of a southwest vortex during heavy rainfall over South China. Atmos. Ocean. Sci. Lett. 2009, 2, 135–141. [Google Scholar] [CrossRef]
  15. Fu, S.M.; Sun, J.H.; Zhao, S.X.; Li, W.L. The energy budget of a southwest vortex with heavy rainfall over South China. Adv. Atmos. Sci. 2011, 28, 709–724. [Google Scholar] [CrossRef]
  16. Chen, B.; Zhang, W.; Yang, S.; Xu, X.D. Identifying and contrasting the sources of the water vapor reaching the subregions of the Tibetan Plateau during the wet season. Clim. Dyn. 2019, 53, 6891–6907. [Google Scholar] [CrossRef]
  17. Qian, C.; Ye, Y.; Zhang, W.; Zhou, T. Heavy rainfall event in mid-august 2020 in Southwestern China: Contribution of anthropogenic forcing and atmospheric circulation. Bull. Am. Meteorol. Soc. 2022, 103, S111–S117. [Google Scholar] [CrossRef]
  18. Takaya, K.; Nakamura, H. A formulation of a phase-independent wave-activity flux for stationary and Migratory Quasigeostrophic Eddies on a Zonally varying basic flow. J. Atmos. Sci. 2001, 58, 608–627. [Google Scholar] [CrossRef]
  19. Chen, Y.; Shi, Y.; Li, Y.; Wang, C. The study of a kind of circulations characters on sustaining heavy rain in Sichuan Basin. Plateau Mt. Meteorol. Res. 2010, 30, 29–34. (In Chinese) [Google Scholar] [CrossRef]
  20. Zhao, Y.; Wang, H. A case study on plateau vortex inducing southwest vortex and producing extremely heavy rain. Plateau Meteorol. 2010, 029, 819–831. (In Chinese) [Google Scholar]
  21. Wei, W.; Zhang, R.; Wen, M.; Rong, X.; Li, T. Impact of Indian summer monsoon on the South Asian High and its influence on summer rainfall over China. Clim. Dyn. 2014, 43, 1257–1269. [Google Scholar] [CrossRef]
  22. Zhang, Q.; Zheng, Y.; Singh, V.; Luo, M.; Xie, Z. Summer extreme precipitation in eastern China: Mechanisms and impacts. J. Geophys. Res. Atmos. 2017, 122, 2766–2778. [Google Scholar] [CrossRef]
  23. Li, G.; Chen, J.; Wang, X.; Luo, X.; Yang, D.; Zhou, W.; Tan, Y.; Yan, H. Remote impact of North Atlantic sea surface temperature on rainfall in southwestern China during boreal spring. Clim. Dyn. 2018, 50, 541–553. [Google Scholar] [CrossRef]
  24. Xu, X.; Huang, A.; Huang, D.; Zhang, Y.; Gu, C.; Cai, S.; Tang, Y.; Zhao, Z.; Zeng, J. What are the dominant synoptic patterns leading to the summer regional hourly extreme precipitation events over central-eastern Tibetan Plateau and Sichuan Basin? Geophys. Res. Lett. 2023, 50, e2022GL102342. [Google Scholar] [CrossRef]
  25. Yi, S.J.; Zheng, F.; Xiao, T. Comparative analysis of environmental fields of two typical rainstorm cases in southwest China. Clim. Environ. Res. 2019, 24, 73–115. (In Chinese) [Google Scholar]
  26. Qian, Q.; Wu, R.; Jia, X. Persistence and nonpersistence of East and Southeast Asian rainfall anomaly pattern from spring to summer. J. Geophys. Res. Atmos. 2020, 125, e2020JD033404. [Google Scholar] [CrossRef]
  27. Li, L.; Zhang, R.; Wu, P.; Wen, M.; Duan, J. Roles of Tibetan Plateau vortices in the heavy rainfall over southwestern China in early July 2018. Atmos. Res. 2020, 245, 105059. [Google Scholar] [CrossRef]
  28. Ni, C.; Li, G.; Xiong, X. Analysis of a vortex precipitation event over Southwest China using AIRS and in situ measurements. Adv. Atmos. Sci. 2017, 34, 559–570. [Google Scholar] [CrossRef]
  29. Yuan, J.; Zhao, D.; Yang, R.; Yang, H. Predecessor rain events over China’s low-latitude highlands associated with Bay of Bengal tropical cyclones. Clim. Dyn. 2018, 50, 825–843. [Google Scholar] [CrossRef]
  30. Zhou, Y.; Guo, Y.; Yu, F. Analysis of a Rainstorm Process under the Joint Action of Westerly Trough and Typhoon in Sichuan Basin. Plateau Mt. Meteorol. Res. 2020, 40, 11–17. (In Chinese) [Google Scholar]
Figure 1. The spatial distributions of the (a) topography, (b) topography of target region with the distribution of the observation stations, (c) annual average precipitation, (d) June–August average precipitation, and (e) annual average extreme precipitation (the total rainfall amount above the 95th percentile on the southeastern edge of the Tibetan Plateau. Unit is in mm day−1 in (ce). The circle in red in (a) roughly indicates the area of the Sichuan Basin.
Water 15 01407 g001
Figure 2. (a) Vertical motion ω (arrows), divergence (colored areas), and vorticity (grey areas) averaged in 26° N–34° N, (b) water vapor flux (pink arrows) and water vapor flux divergence (colored areas; 10−5 kg m−2 s−1), (c) top net thermal radiation (W m−2), and (df) horizontal wind (barbs) and geopotential height fields (black lines) at (d) 200 hPa, (e) 500 hPa, and (f) 850 hPa. The area within green dashed lines denotes target region of this study. The red lines in (d) represent the upper-level jet zones with the wind speed ≥ 30 m s−1 on the extreme precipitation day. The terrain is masked as the gray shading in figure (a) (corresponding to right coordinate).
Water 15 01407 g002
Figure 3. Composite wind field (black barbs), geopotential height field (black contours; dapgm), and geopotential height anomalies (colored areas; dapgm) on the (a1a3) 8th day and (b1b3) 4th day before the extreme precipitation and (c1c3) on the day of the extreme precipitation at 200 hPa (left column), 500 hPa (middle column), and 850 hPa (right column). The dotted areas indicate that the anomalies are statistically significant at the 95% confidence level.
Water 15 01407 g003
Figure 4. Anomalies (10−5 kg m−2 s−1) of the water vapor flux (black arrows) and divergence (colored areas) on the (a) 8th day and (b) 4th day before the extreme precipitation and (c) on the day of the extreme precipitation. The dotted areas indicate the anomalies passing the significance test at the 95% confidence level.
Water 15 01407 g004
Figure 5. Wave action flux (black arrows) and geopotential height anomaly (colored areas; dagpm) at 200 hPa on the (a) 8th day and (b) 4th day before the extreme precipitation and (c) on the day of the extreme precipitation. The blue line represents the upper−level jet zone with the wind speed up to 30 m s−1, and the dotted area denotes the values passing the significance test at the 95% confidence level.
Water 15 01407 g005
Figure 6. Latitude–altitude cross−section of the anomalies of atmospheric temperature (colored areas; K), vertical velocity (black arrows) and geopotential height (black lines) in 99° E–105° E on the (a) 8th day and (b) 4th day before the extreme precipitation and (c) on the day of the extreme precipitation. The dotted areas indicate the anomalies exceeding the significance test at the 95% confidence level. The terrain is masked as the gray shading (corresponding to right coordinate).
Water 15 01407 g006
Figure 7. Latitude–altitude vertical cross section of the anomalies of vorticity (green solid lines; 10−6 s−1) and divergence (colored areas) in 99° E–105° E on the (a) 8th day and (b) 4th day before the extreme precipitation and (c) on the day of the extreme precipitation. The dotted areas mean the anomalies passing the significance test at the 95% confidence level, and the unit on the y−axis is hPa.
Water 15 01407 g007
Figure 8. Latitude–altitude cross section of the composite anomalies of vorticity (green solid lines; 10−6 s−1) and divergence (colored areas) in 99° E–105° E. The dotted areas denote the anomalies significance at 95% confidence level.
Water 15 01407 g008
Table 1. Top 100 precipitation events with the largest regional average rainfall in the southeastern edge of the Tibetan Plateau from 2001 to 2020.
DateArea-Ave-Pre (mm)DateArea-Ave-Pre (mm)DateArea-Ave-Pre (mm)
2 August 201820.458 July 200514.4522 June 200313.33
19 July 200320.3824 June 201914.4519 June 201413.26
22 June 201119.7916 August 200214.4417 July 202013.24
28 June 201419.5421 August 201014.439 July 200513.22
16 August 201518.839 July 202014.3925 July 202013.19
16 August 202018.1419 June 200914.353 August 200913.11
29 June 201517.7625 June 200914.347 July 200413.11
6 July 201717.7418 July 201314.3327 July 201213.08
22 July 201917.730 August 200214.292 July 201712.96
29 June 201817.6819 July 200714.2128 July 201812.96
10 August 200217.5620 June 201314.1913 June 202012.85
17 August 202017.4921 June 200914.1117 August 201512.83
29 June 202017.4730 June 200414.0818 August 202012.76
11 June 200217.3921 July 201614.0529 June 200212.73
21 June 200317.276 June 200213.988 August 201512.65
30 August 202017.1929 June 201213.9830 June 202012.62
14 July 201416.9911 August 200113.988 July 201912.58
18 July 201916.9317 July 201013.9729 June 201612.52
14 July 201516.344 July 201613.938 August 201712.52
6 July 200616.2720 August 200213.8421 June 201812.5
8 August 200316.277 June 200613.814 July 200212.41
21 July 201215.8815 July 201213.88 July 200412.38
9 June 200215.829 August 200113.7728 June 201012.36
30 June 200815.6410 August 200713.7310 June 200812.32
18 August 201515.5124 August 201513.7328 July 201912.29
10 August 201815.385 July 201613.7217 July 200712.28
7 August 201715.3623 June 201713.659 August 201412.27
17 August 201415.1429 June 200913.6517 July 201612.25
28 June 200915.144 July 201313.6522 July 201212.25
3 August 201515.1128 August 201313.433 July 201212.14
30 July 200914.917 August 201313.4331 July 200912.13
3 July 200814.7611 August 201413.417 June 202012.1
4 July 200414.5829 June 201713.4
6 July 201414.479 July 201013.34
Disclaimer/Publisher’s Note: The statements, opinions and data contained in all publications are solely those of the individual author(s) and contributor(s) and not of MDPI and/or the editor(s). MDPI and/or the editor(s) disclaim responsibility for any injury to people or property resulting from any ideas, methods, instructions or products referred to in the content.

