Article

Numerical Study on the Influence of Rivers on the Urban Microclimate: A Case Study in Chengdu, China

1
School of Architecture and Civil Engineering, Xihua University, Chengdu 610039, China
2
Institute of Mountain Hazards and Environment, Chinese Academy of Sciences, Chengdu 610299, China
3
University of Chinese Academy of Sciences, Beijing 100049, China
*
Authors to whom correspondence should be addressed.
Water 2023, 15(7), 1408; https://doi.org/10.3390/w15071408
Submission received: 21 February 2023 / Revised: 1 April 2023 / Accepted: 3 April 2023 / Published: 4 April 2023
(This article belongs to the Section Water and Climate Change)

Abstract

:
The urban heat island phenomenon in large cities is becoming increasingly serious as urbanization continues to develop, seriously affecting the lives of urban residents. Rivers can effectively alleviate urban heat islands and improve the thermal comfort of riverfront space in summer. Thus, the effect of rivers on the urban microclimate environment is studied in this work. A section of the Fu River in the inland city of Chengdu was selected as the research object, and a combination of experimental and numerical simulation methods was employed. ENVI-met software was used to study the river’s influence on the air temperature, relative air humidity, and the thermal comfort of the riverfront space. The measured experimental parameters are first used to verify the accuracy of the ENVI-met software simulation results, which are then employed to carry out simulation research. The simulation results suggest that the different types of underlying surfaces have varying impacts on the air temperature and relative air humidity. Rivers have a significant cooling effect on the regional thermal environment, and roads have a warming effect on the air temperature. The order of influence of different underlying surfaces on air temperature is as follows: rivers > roads > trees. Rivers have an obvious humidifying effect on the air, and roads have little effect on relative air humidity. The order of influence of different underlying surfaces on relative air humidity is as follows: rivers > trees > roads. The results of the outdoor predicted mean vote (PMV) reveal that rivers, trees, and green plants can effectively improve the comfort of individuals downwind.

1. Introduction

With the rapid development of the economy, urban construction and expansion are exerting a significant influence on the climate and environment of urban areas [1,2]. This causes environmental pollution, the greenhouse effect, extreme weather, and other problems [3,4,5]. The contradiction between urban environmental problems and residents’ need for healthy and comfortable living spaces is becoming increasingly prominent. Therefore, improving the comfort of the outdoor urban thermal environment through urban planning is necessary to effectively guarantee the normal operation of cities and the health of residents [6].
The urban microclimate has attracted the attention of many scholars and urban planners in recent years [7,8,9,10,11]. Yang et al. investigated the influence of urban heat islands (UHIs) on the energy performance of buildings. The results showed that the average daily peak cooling load of residential buildings increased by 6–14% [12]. Anjos et al. studied the influences of a UHI under different synoptic patterns in a Brazilian city. The results indicated that the central areas were substantially warmer than suburban and rural areas and the UHI was stronger during the night and early morning and less intense during the rest of the day [13]. Zheng et al. investigated the impact of land use/land cover on the urban thermal environment in Fuzhou, China. The results demonstrated that the urban thermal environment was influenced by both land use/land cover classes and urban growth types [14]. Moyer et al. studied the urban heat island of a small urban area in central Pennsylvania. They found that the urban heat island decreased between 0.3 to 0.6 °C every 1 km increase in distance from the river [15]. Li et al. studied the urban environment of a tropical city in Singapore. The results showed that the mean urban heat island intensity peaked in the early morning at 2.2 °C [16].
Morakinyo et al. found that taller trees with dense canopies had a greater potential for moderating thermal comfort [17]. Teshnehdel et al. investigated the influence of tree cover and tree species on microclimate and pedestrian comfort in a residential district in Tabriz. The results showed that the average daily air temperature decreased to 20.04 °C in summer and the physiological equivalent temperature (PET) reduced from 34.92 to 26.16 °C [18]. Park et al. suggested that trees along the sidewalk could decrease the temperature due to the reduction in radiation flux from the shade they cast [19]. Zhang et al. investigated the cooling effect of urban green spaces in Beijing, finding that green space could absorb 3.33 × 10¹² kJ of heat through evapotranspiration across the entire summer [20]. Cao et al. reported that urban parks were able to mitigate urban heat island effects in summer [21].
Riverside space is an important activity location for urban residents, and the microclimate has a direct influence on the thermal comfort of those engaged in outdoor activities [22,23]. Cai et al. used ENVI-met software to study the potential influence of the cooling effect of water bodies on the urban land surface temperatures in Chongqing, suggesting that the cooling effect was able to reach 1 km [24]. Deng et al. observed that the cooling effect of the Yangtze River modulated the surrounding urban environment substantially at night, especially in areas closer to the riverbank [25]. Piccolroaz et al. found the thermal response of rivers strongly depended on the river’s hydrological regime and that low-land rivers were sensitive to heatwaves [26]. Additionally, Du et al. found that the cooling island effects of lakes were stronger than rivers [27].
Chengdu is a typical inland city located in the Sichuan Basin, with a unique climate from other inland cities. Its main climate characteristics comprise hot summers and wet and less sunny winters. Chengdu’s climate has changed significantly in recent years, and its highest temperature in Chengdu reached 40 °C in the summer of 2022. As few studies have focused on the effect of inland rivers on the urban microclimate, their influence on the urban riverfront space microclimate remains unclear. Therefore, the influence of the Fu River on the urban microclimate of Chengdu in the summer using ENVI-met software is studied in this work. Compared with prior research, the novelty of this paper is as follows:
  • This study mainly focuses on the influence of inland rivers on the microclimate of Chengdu.
  • The influence mechanism of rivers, trees, and roads on the urban riverfront space of an inland city is analyzed.
  • Outdoor predicted mean vote (PMV) is used to evaluate the influence of rivers, trees, and green plants on the outdoor thermal comfort of urban riverfront spaces.

2. Data and Methodology
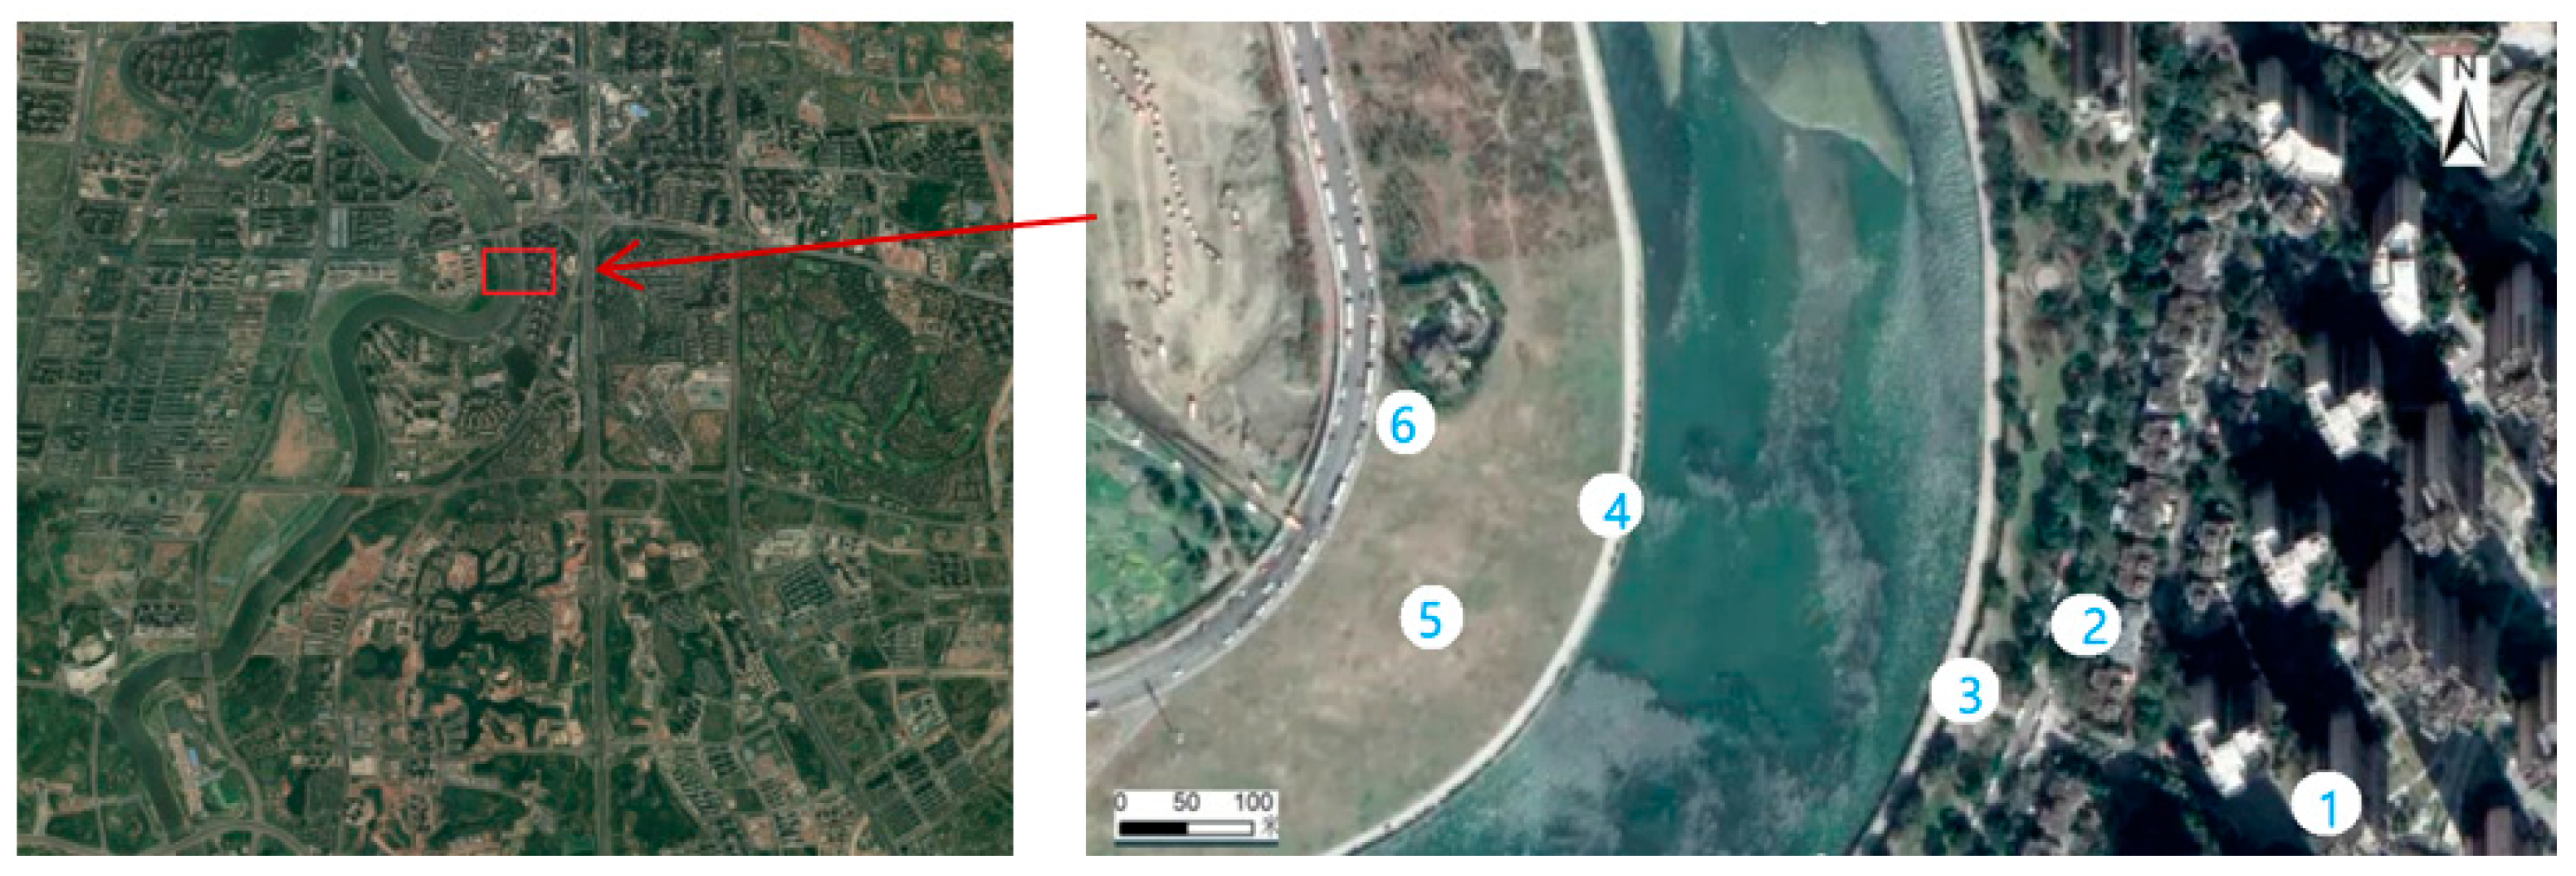
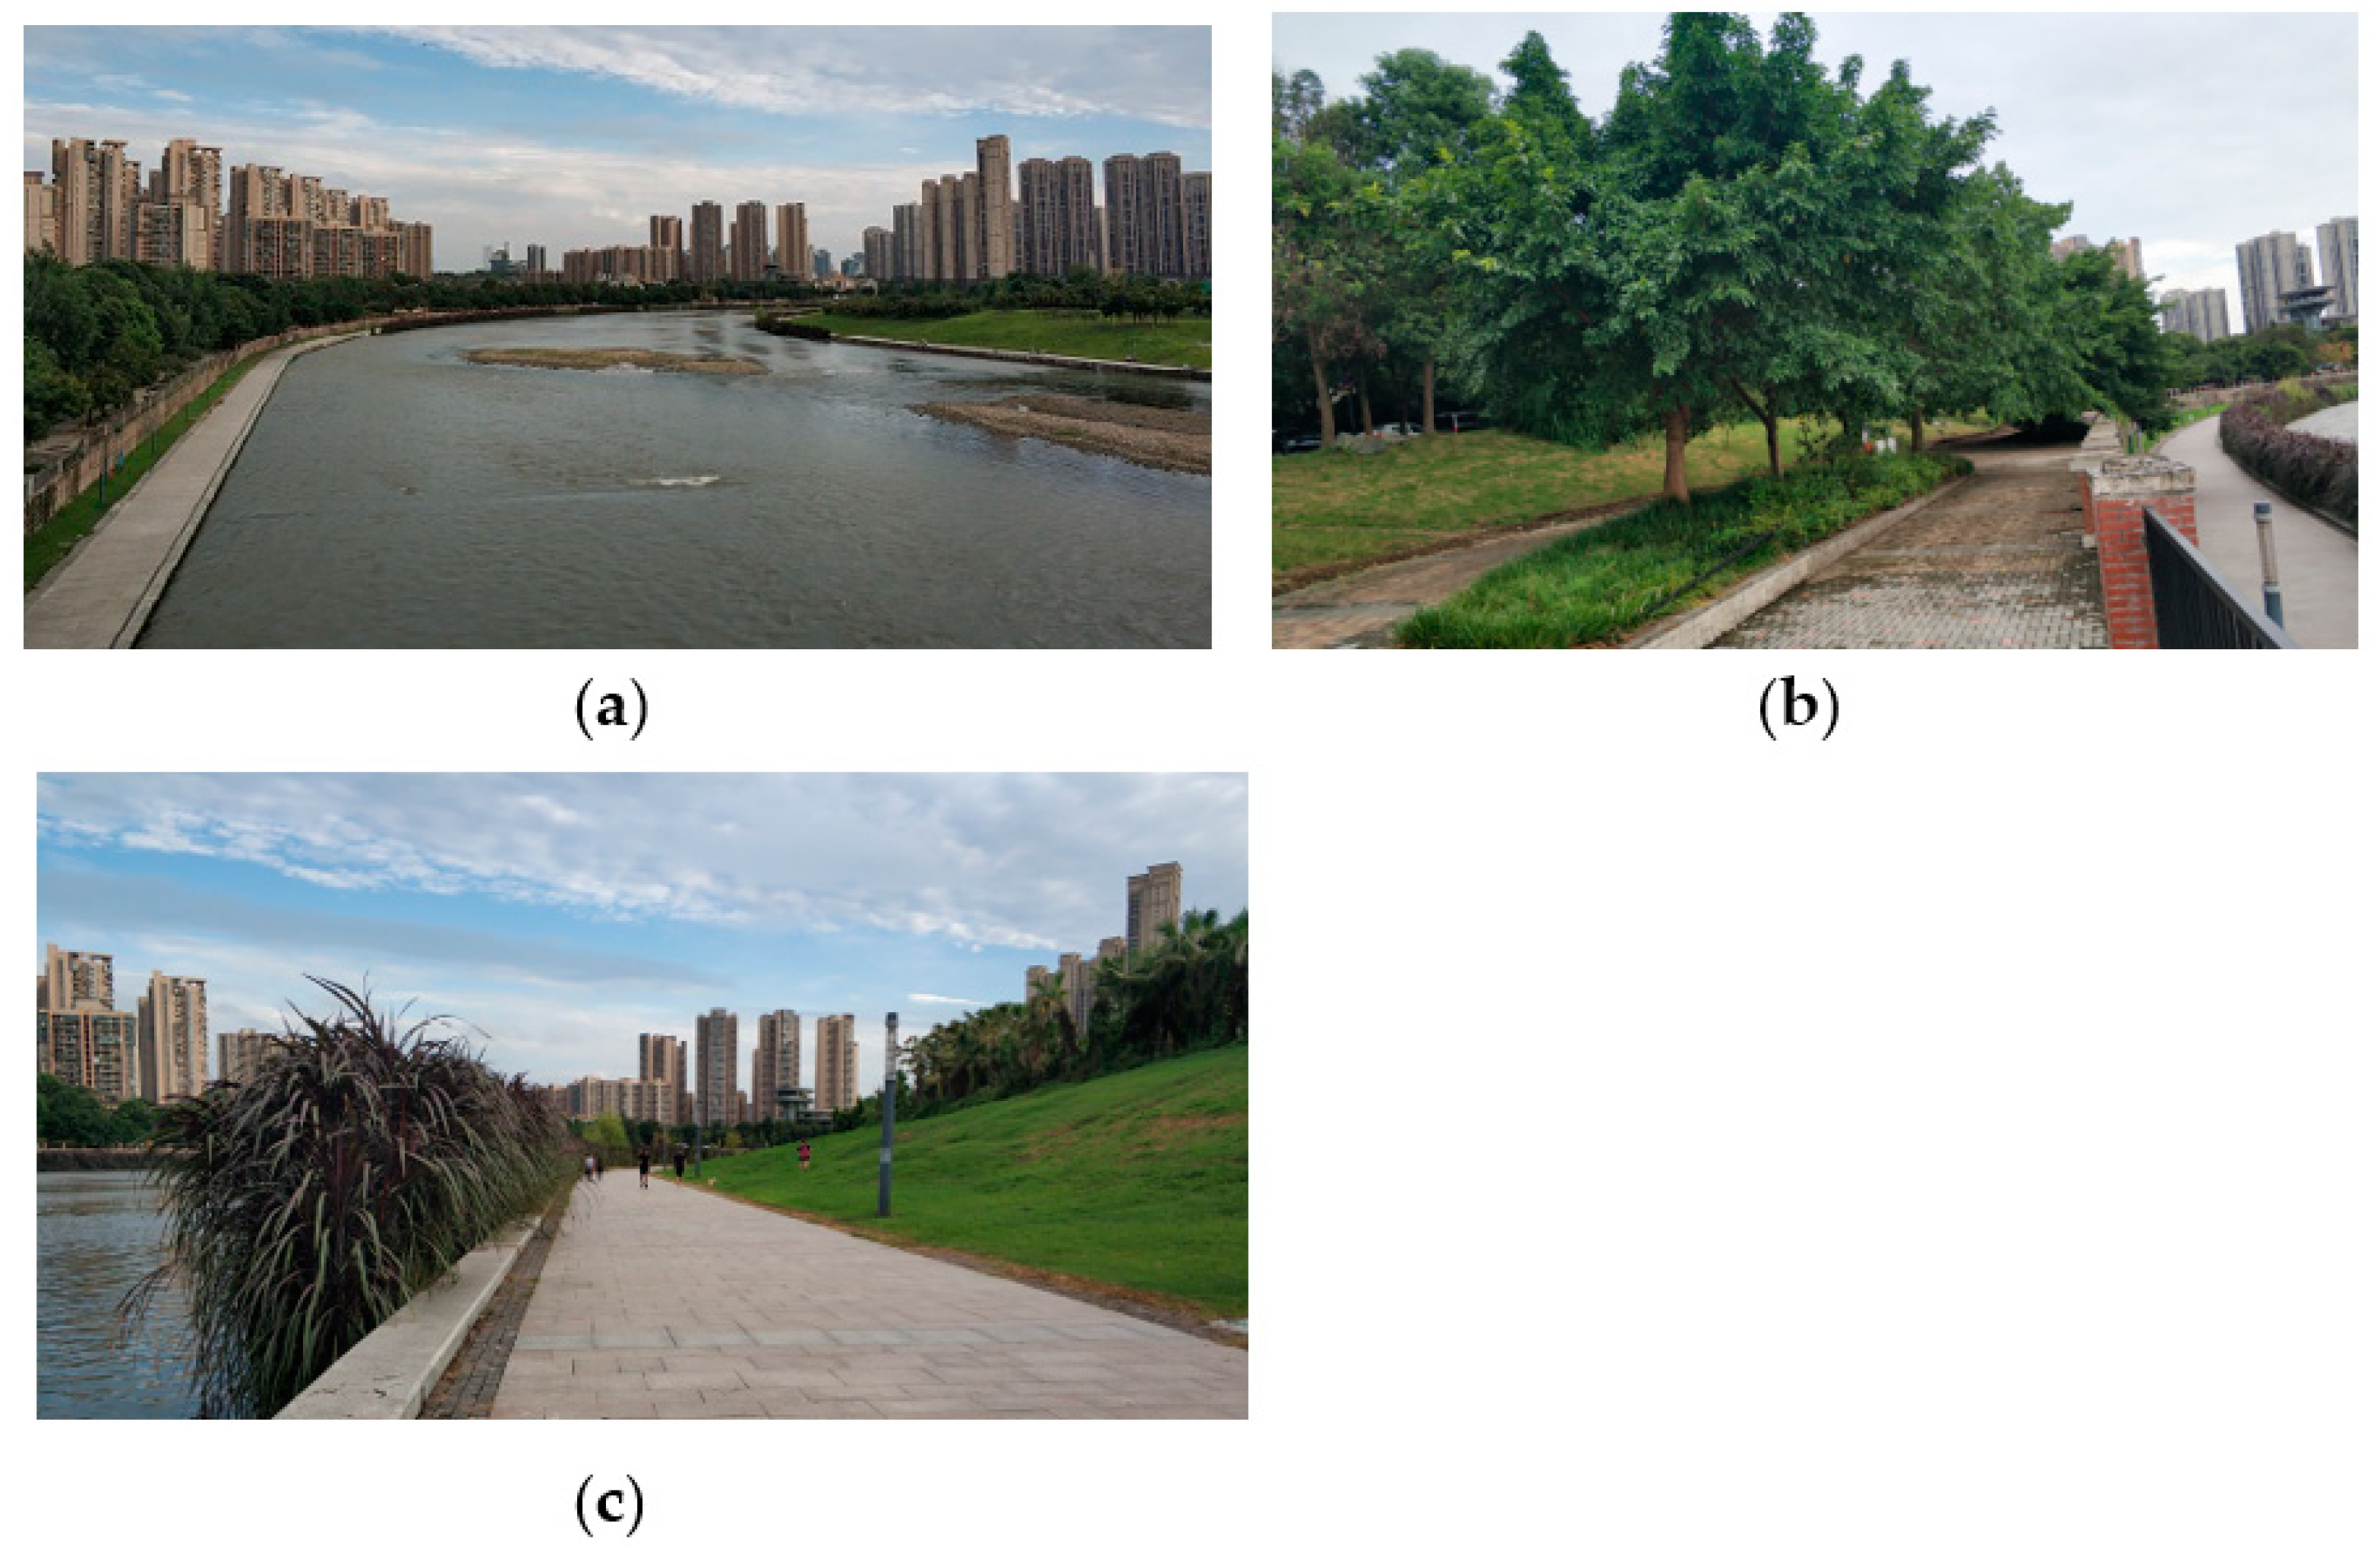
2.1. Study Area

Chengdu is located in a subtropical monsoon humid climate zone. A section of the Fu River was chosen as the research object in this work as it is one of the most important rivers in Chengdu. The study area is shown in Figure 1. The length and width of the study area are 600 and 300 m, respectively, and the river’s average width is 154 m. The river flows through the urban area from north to south. Six sites are used to verify the accuracy of the ENVI-met model, as shown in Figure 1.
Real-world pictures of the study area are shown in Figure 2. Figure 2a shows the overall overview of the study area. Figure 2b is a locally enlarged picture of the right bank, which is divided into three parts: the bottom part is a granite road, the middle part is cement brick pavement and lawns, and the top part is asphalt road and trees. Figure 2c is a real picture of the left bank, which is divided into two parts: the bottom part is a granite road near the river and the top part is made up of lawns and trees.

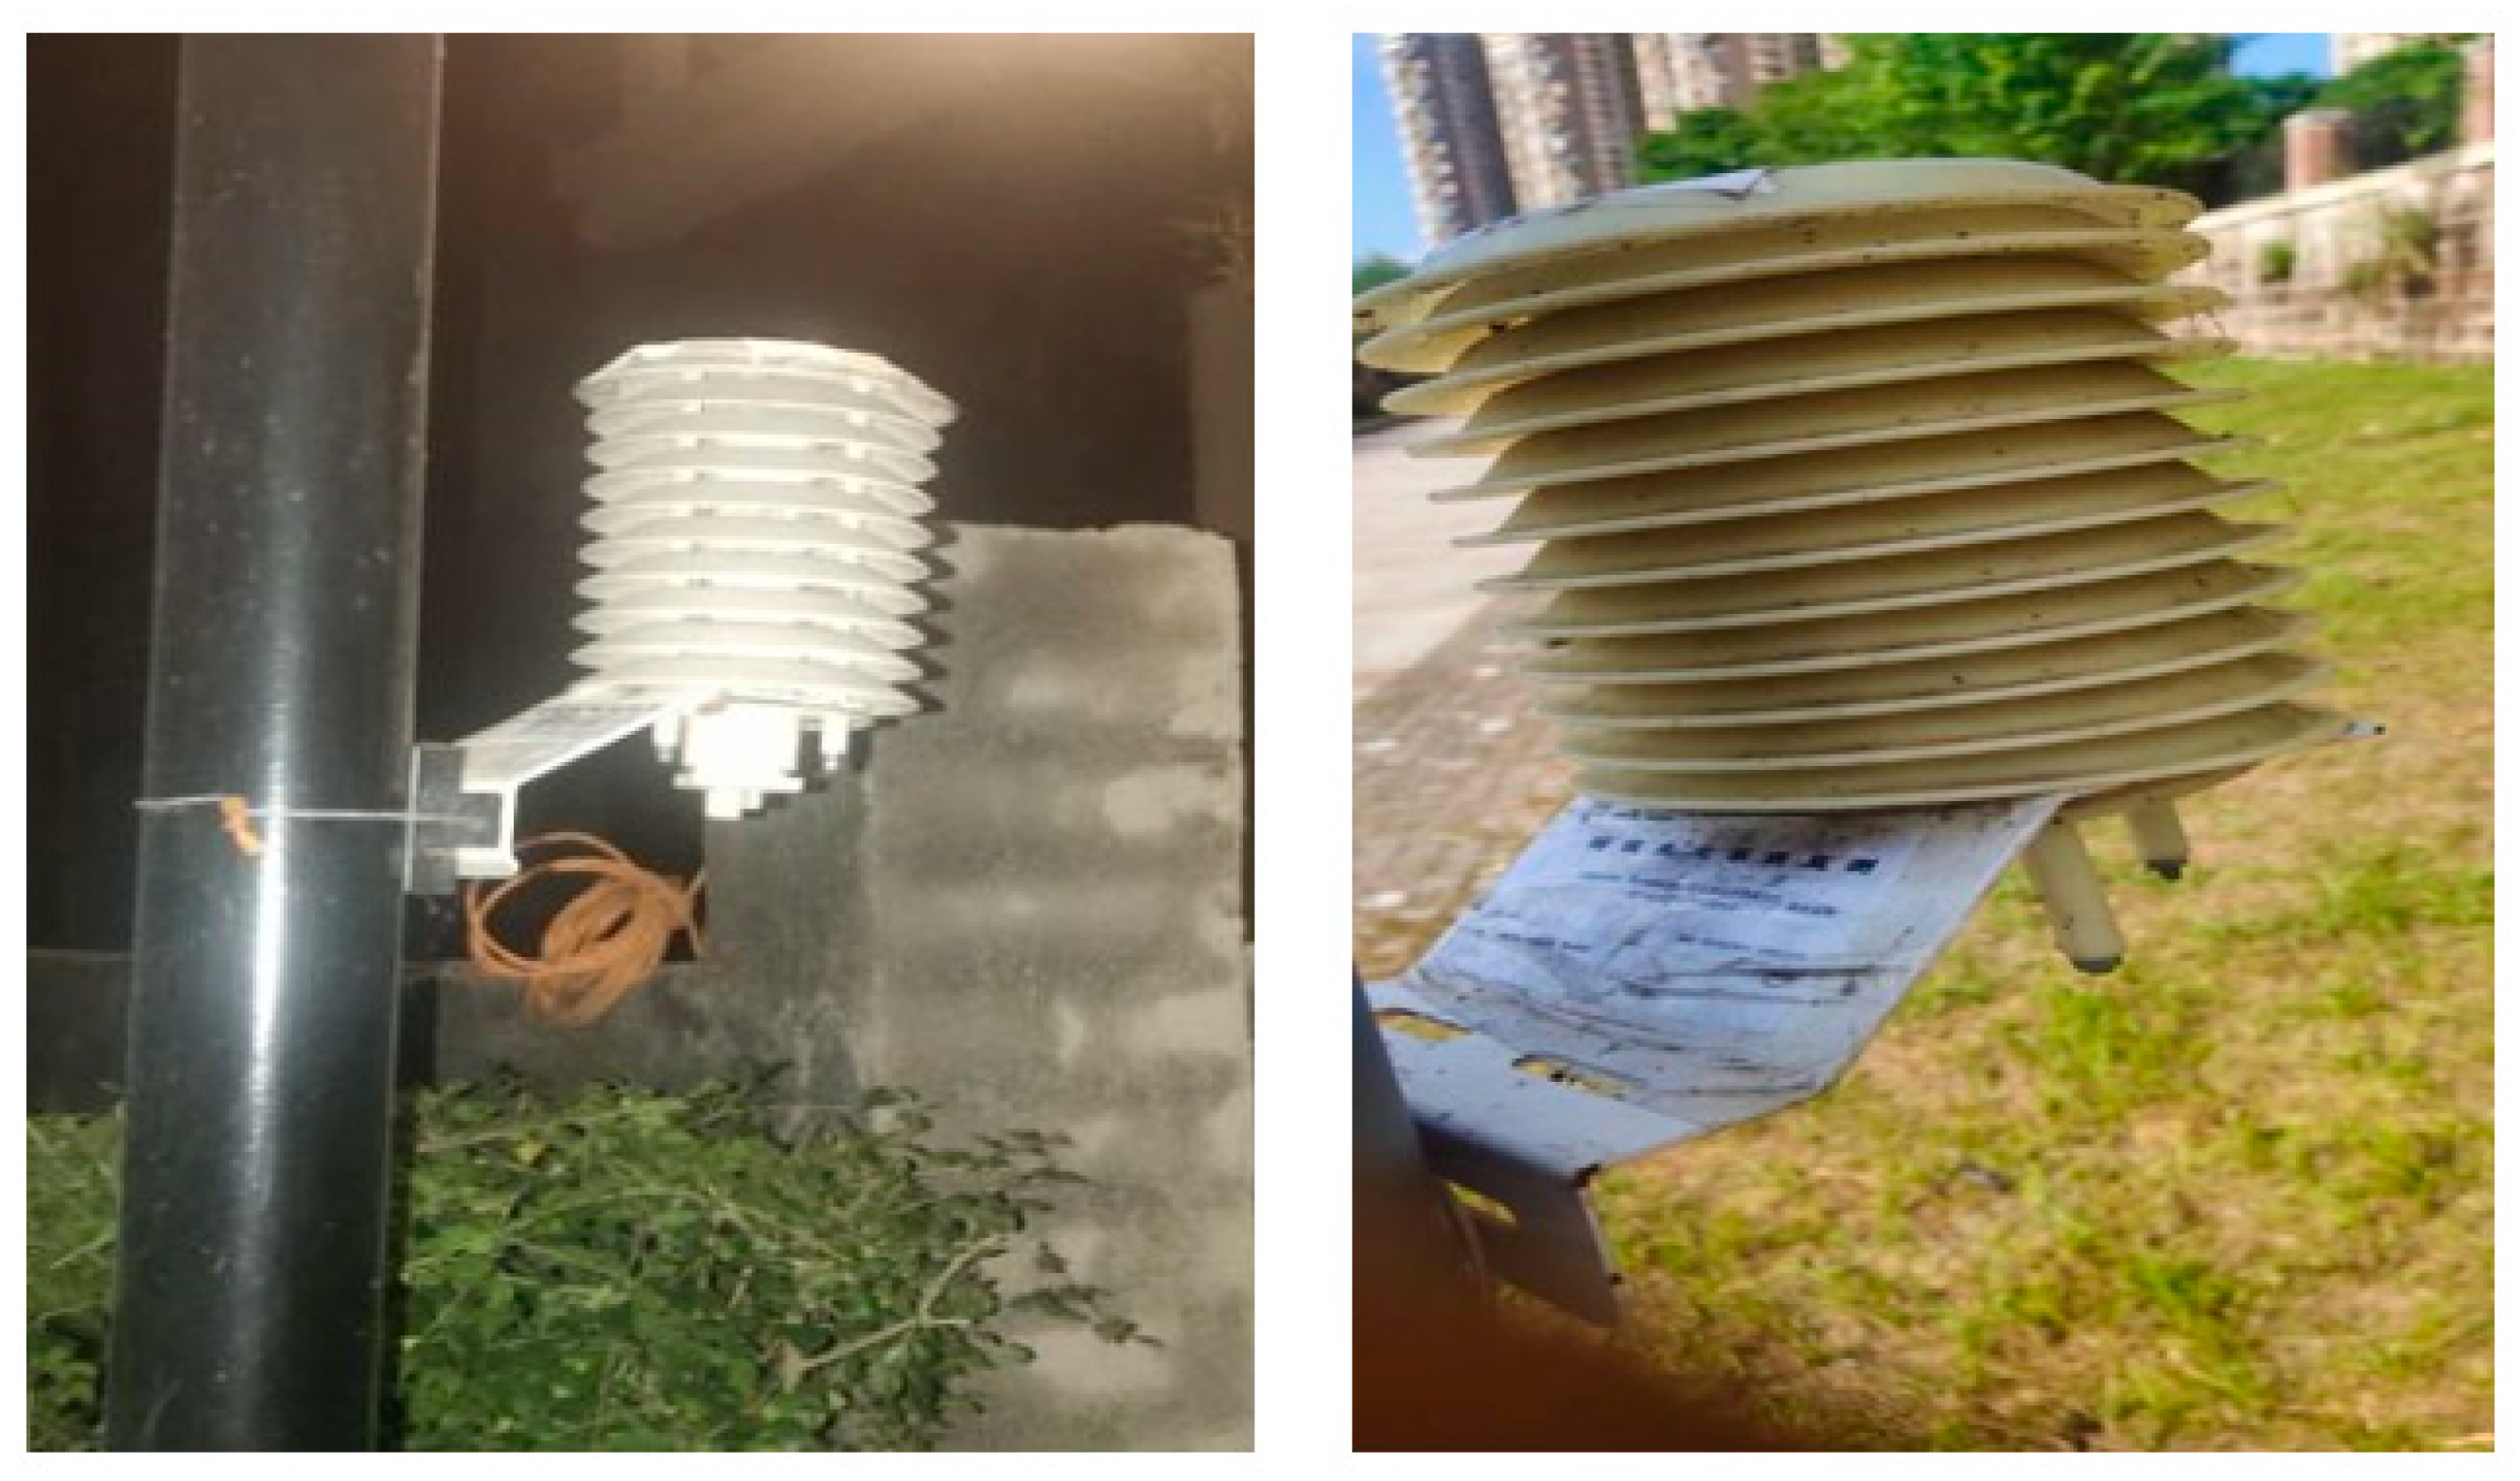
2.2. Meteorological Data Acquisition

Small HOBO weather stations were installed at a height of 1.5 m above the ground. The installation of the weather station is shown in Figure 3. The solar radiation intensity was measured by an SR15-A1 solar radiation sensor, and the meteorological parameters were measured every hour in June 2021. The hourly meteorological parameters are shown in Table 1.

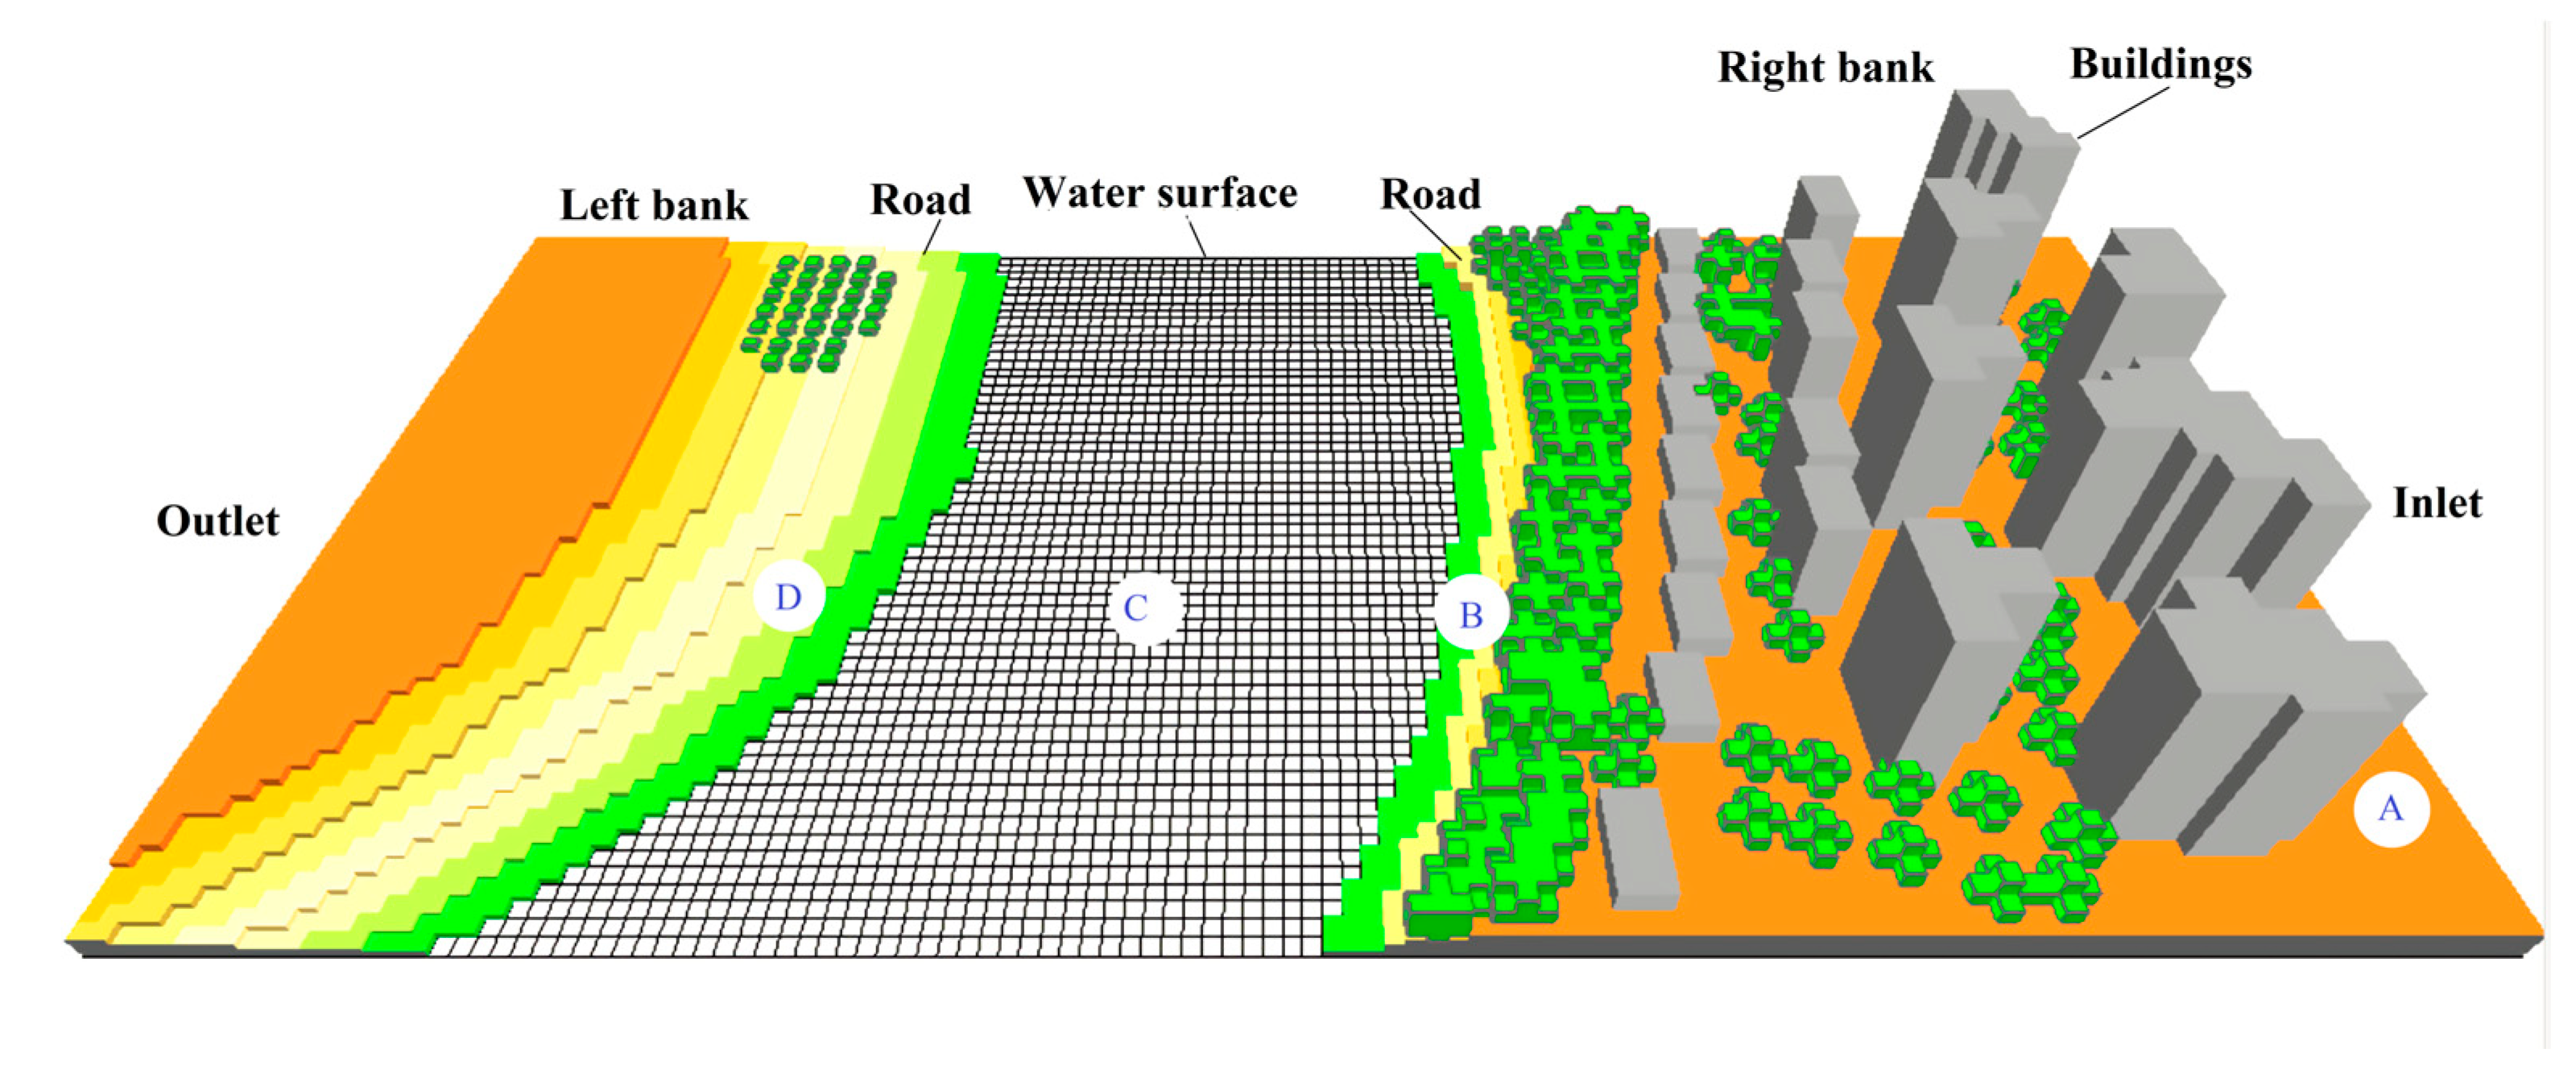
2.3. ENVI-Met Modeling and Parameter Settings

ENVI-met is three-dimensional software that can be used to simulate small-scale interactions between different urban elements and the atmosphere. As many researchers use ENVI-met to study the microclimate [18,21,28,29], in this work, we use ENVI-met V4.4.6 to study the influence of the rivers on the urban microclimate. The parameters of the ENVI-met model are presented in Table 2.
The initial grid of the ground was divided into five equal parts in the vertical direction, with a height of 456 m. The water surface of the Fu River was taken as the base datum, and its height was denoted as Z = 0 m. The ENVI-met model of the study area is shown in Figure 4. Four points (A, B, C, and D) were selected to measure the variation of air temperature and relative air humidity in the region. The initial boundary parameters setting of the ENVI-met software is shown in Table 3. The dominant wind direction is from the right bank to the left bank in the study area.

2.4. Validation of ENVI-Met Simulation Results

The hourly temperature, humidity, and solar radiation of the air inlet were selected as the initial simulation conditions. A comparison of air temperature and relative air humidity between the measured values and the simulation values is shown in Table 4 and Table 5. The relative error (RE) between the simulation values and measured values is calculated as follows:
R E = X m e a X s i m X m e a × 100 %
where Xmea is the measured value and Xsim is the simulation value.
The results show that the maximum relative error of air temperature and relative air humidity is less than 5%. This means that the simulation results of ENVI-met software agree with the measured data. Hence, the ENVI-met model is credible and can be used in the present study.

3. Results and Discussions

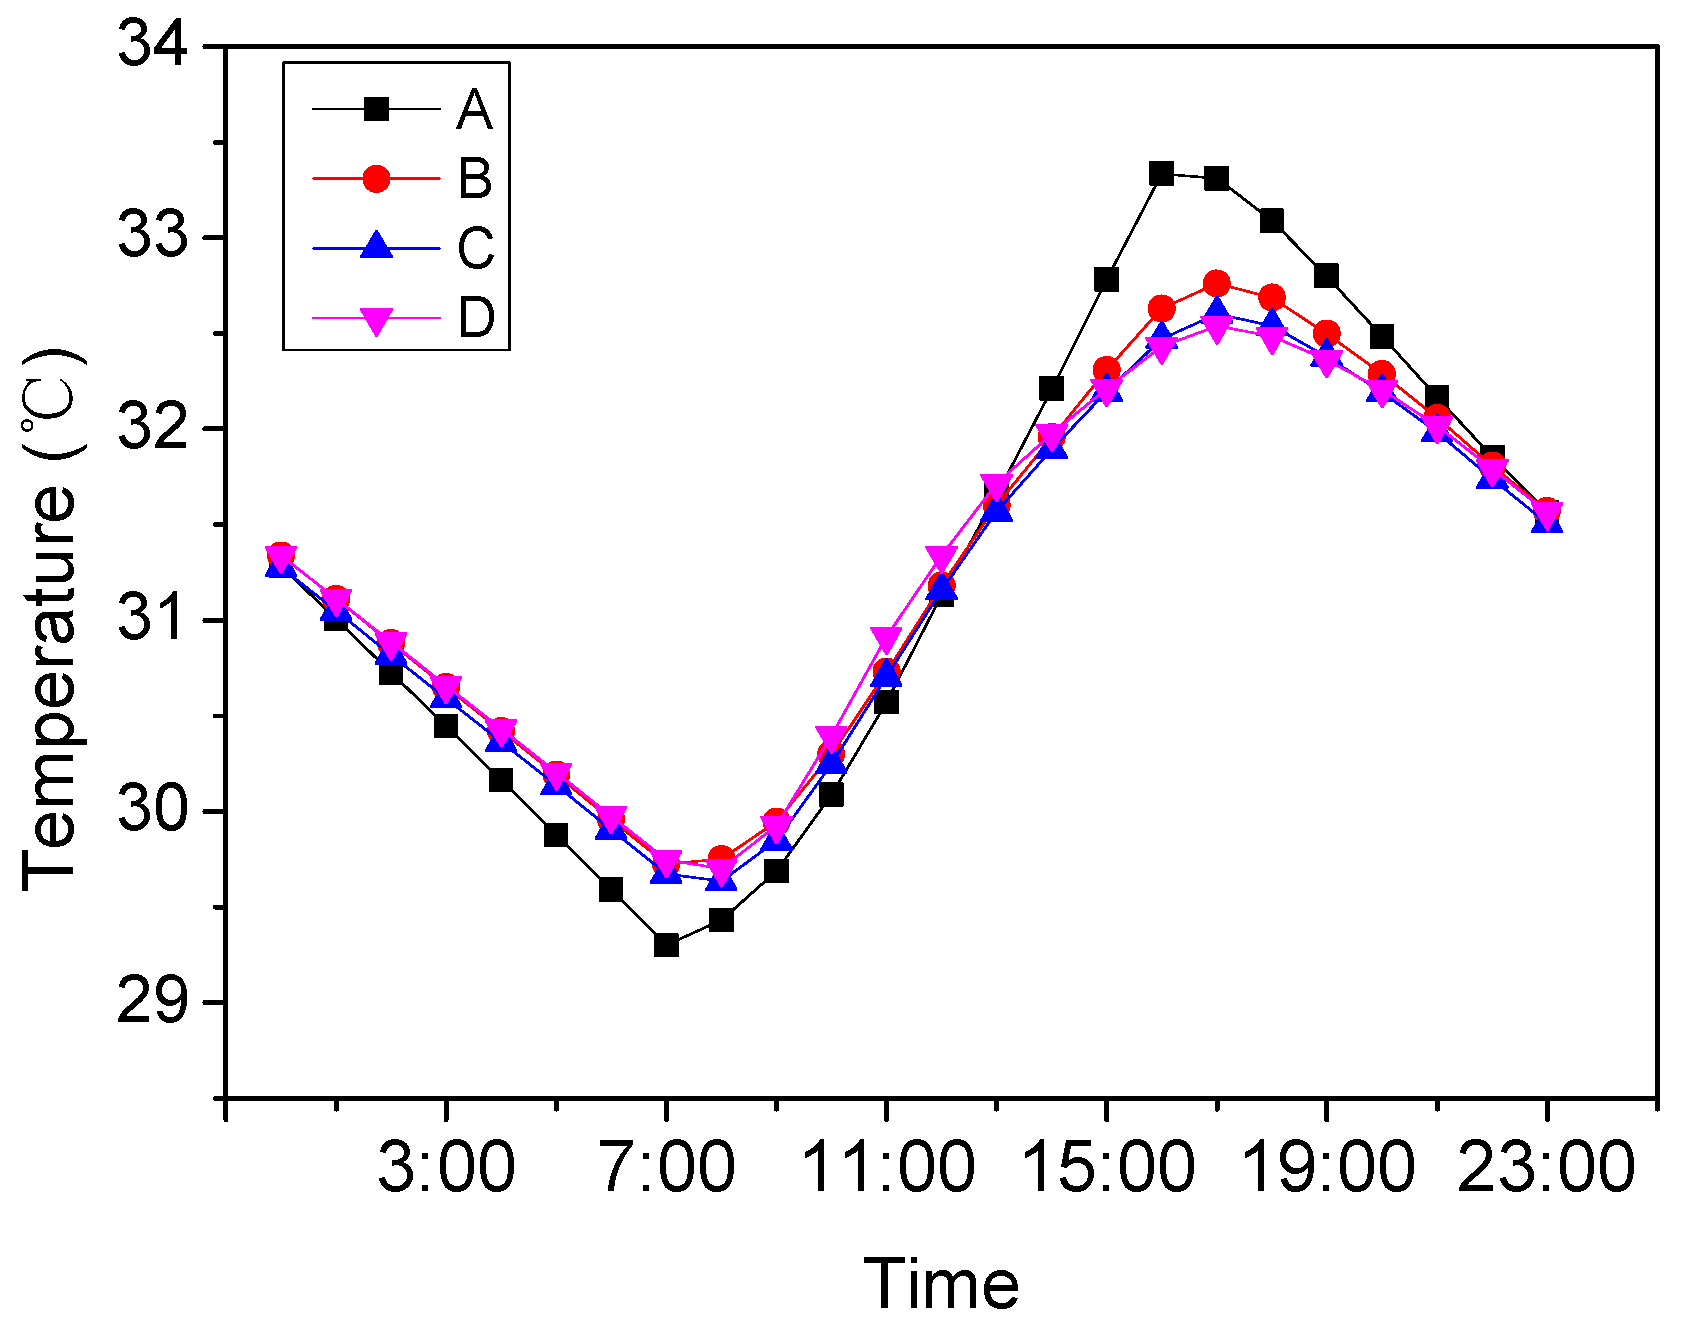
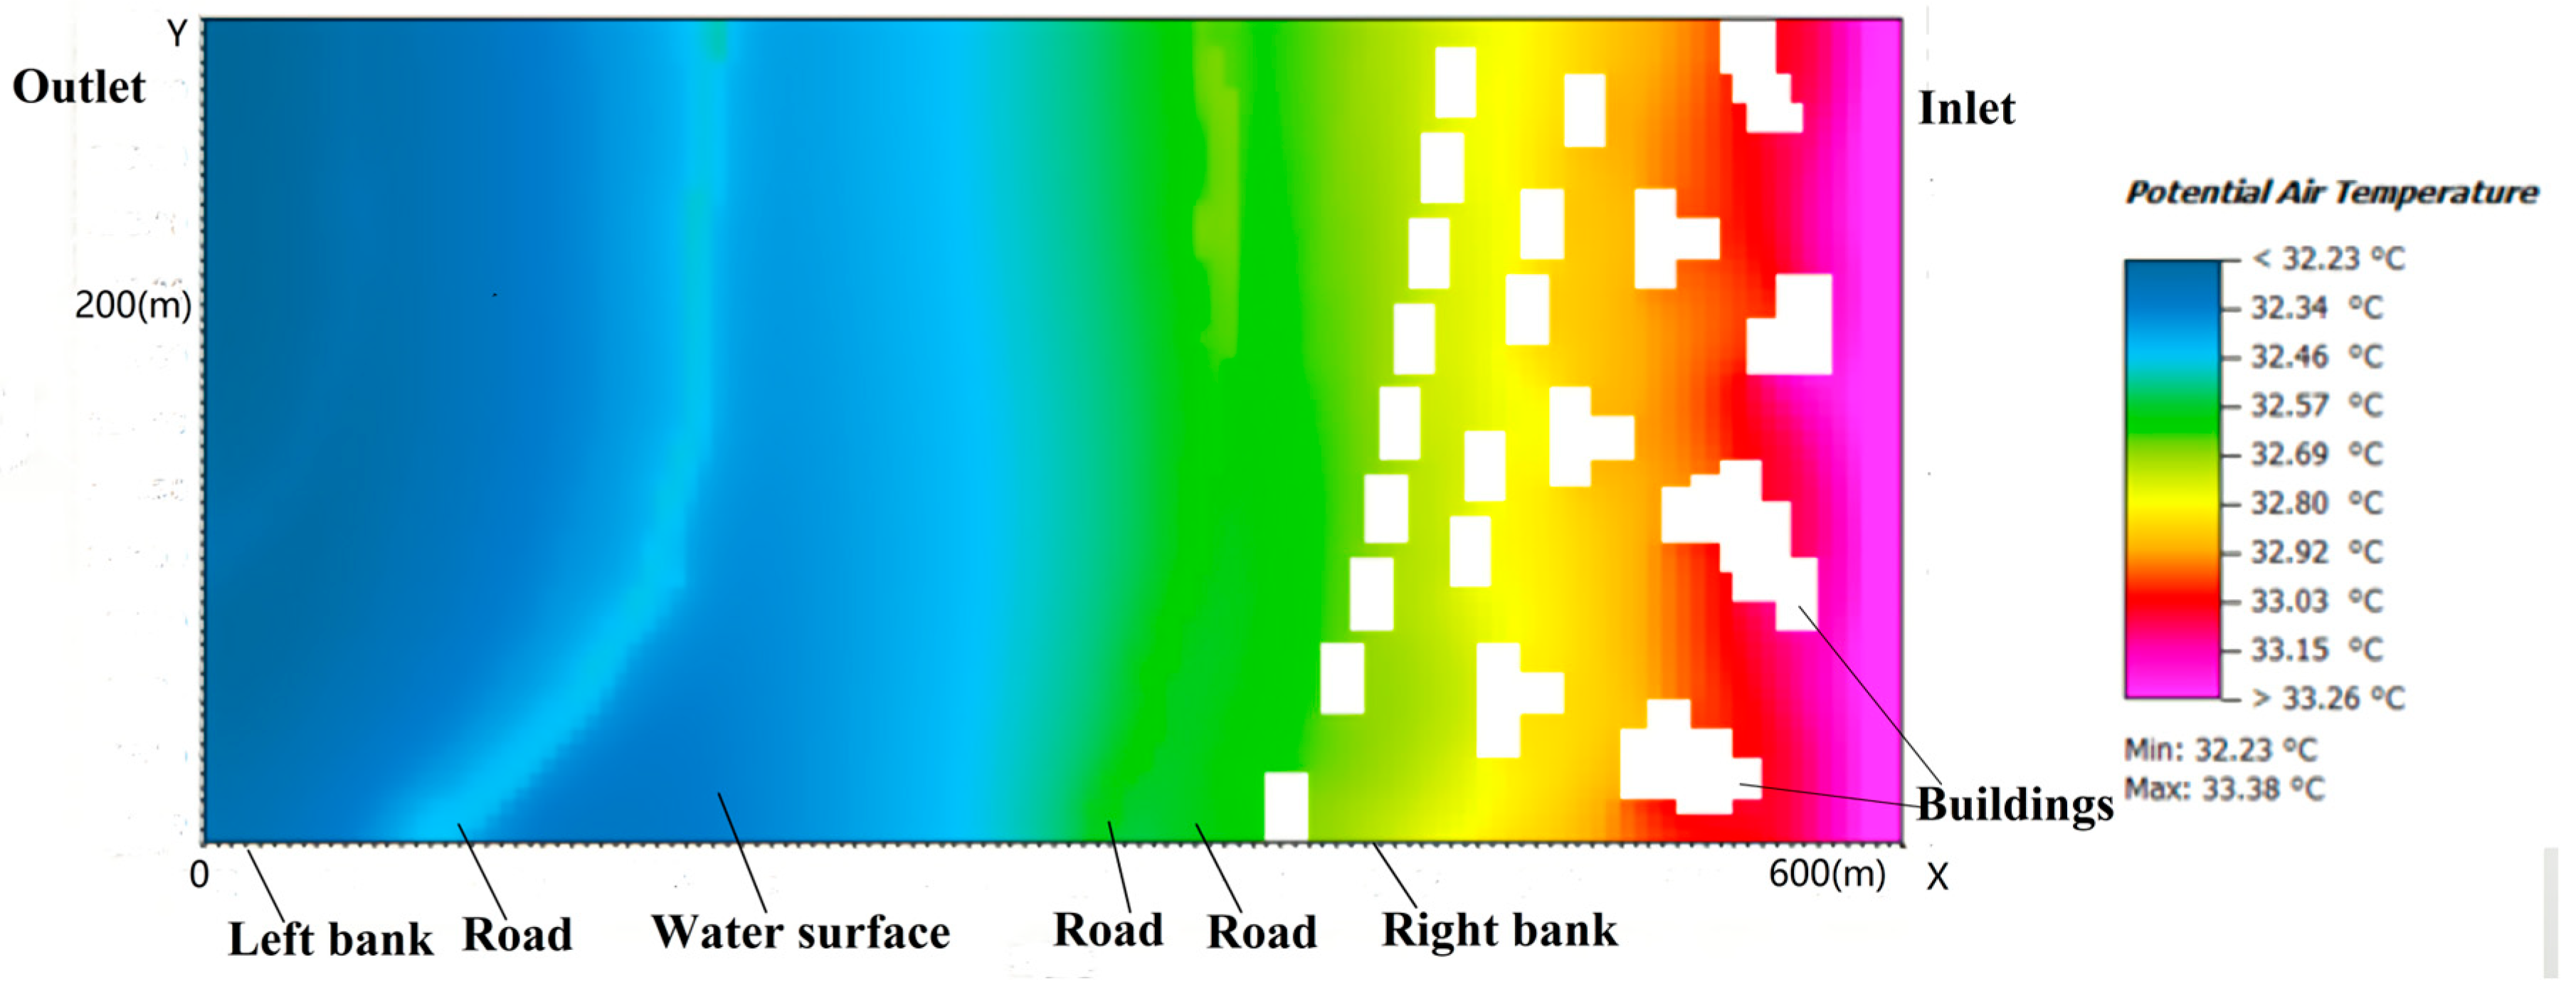
3.1. The Simulation Results of Air Temperature

The variation of air temperature with time is shown in Figure 5, where the four curves show the same trend of variation. The temperature of the inlet fluctuates greatly, which is mainly affected by the input hourly temperature. The temperature of the right bank, water surface, and left bank are relatively gentle with small fluctuations, and the highest temperature of the four points appears at 16:00.
Figure 6 shows the air temperature distribution of the study area at 16:00. It can be seen that within 10 m from the riverbank, the average air temperature is 32.72 °C on the right bank and 32.43 °C on the left bank. Within 10–30 m of the riverbank, the average air temperature is 32.63 °C on the right bank and 32.38 °C on the left bank. Within 30–50 m of the riverbank, the average air temperature is 32.59 °C on the right bank and 32.27 °C on the left bank. The air temperature above the road is 0.11 °C higher than the surrounding air temperature on the right bank and 0.21 °C higher than the surrounding air temperature on the left bank. At the same time, the air temperature over the asphalt road of the right bank is the same as the surrounding air temperature. The reason for this is that trees are not present on both sides of the granite road. Trees on both sides of an asphalt road have a shading effect, which means sunshine cannot directly illuminate the road’s surface, and the air temperature over the road does not rise. This finding indicates that green vegetation can effectively reduce the air temperature in local areas, which supports conclusions by previous research that urban green infrastructure can lower the air temperature in urban areas [30,31,32].
Figure 6 illustrates that the air temperature decreases successively from the right bank to the left bank. On the right bank, the average air temperature is 32.64 °C in the villa area, which then decreases from 32.64 to 32.58 °C after passing through the woods. This is due to the air-cooling effect of the woods [33]. Finally, the air temperature increases from 32.58 to 32.69 °C after flowing across the granite road, which indicates that the granite road has a heating effect on the air. The temperature drops from 32.69 to 32.22 °C after passing across the river, which is ascribed to the evaporative cooling effect of the river water that causes a decrease in the air temperature. The simulation results are in accordance with the findings of previous studies [34,35]. The air temperature does not change much on the other area of the left bank. According to the variation of air temperature, the temperature decreases by 0.06 °C after the air flows through the woods; the temperature difference is 0.11 °C after the air passes across the road and 0.47 °C after the air passes across the river. The order of influence of different underlying surfaces on the air temperature is obtained as follows: rivers > roads > trees. Thus, it can be concluded that rivers and trees have a cooling effect on the air.

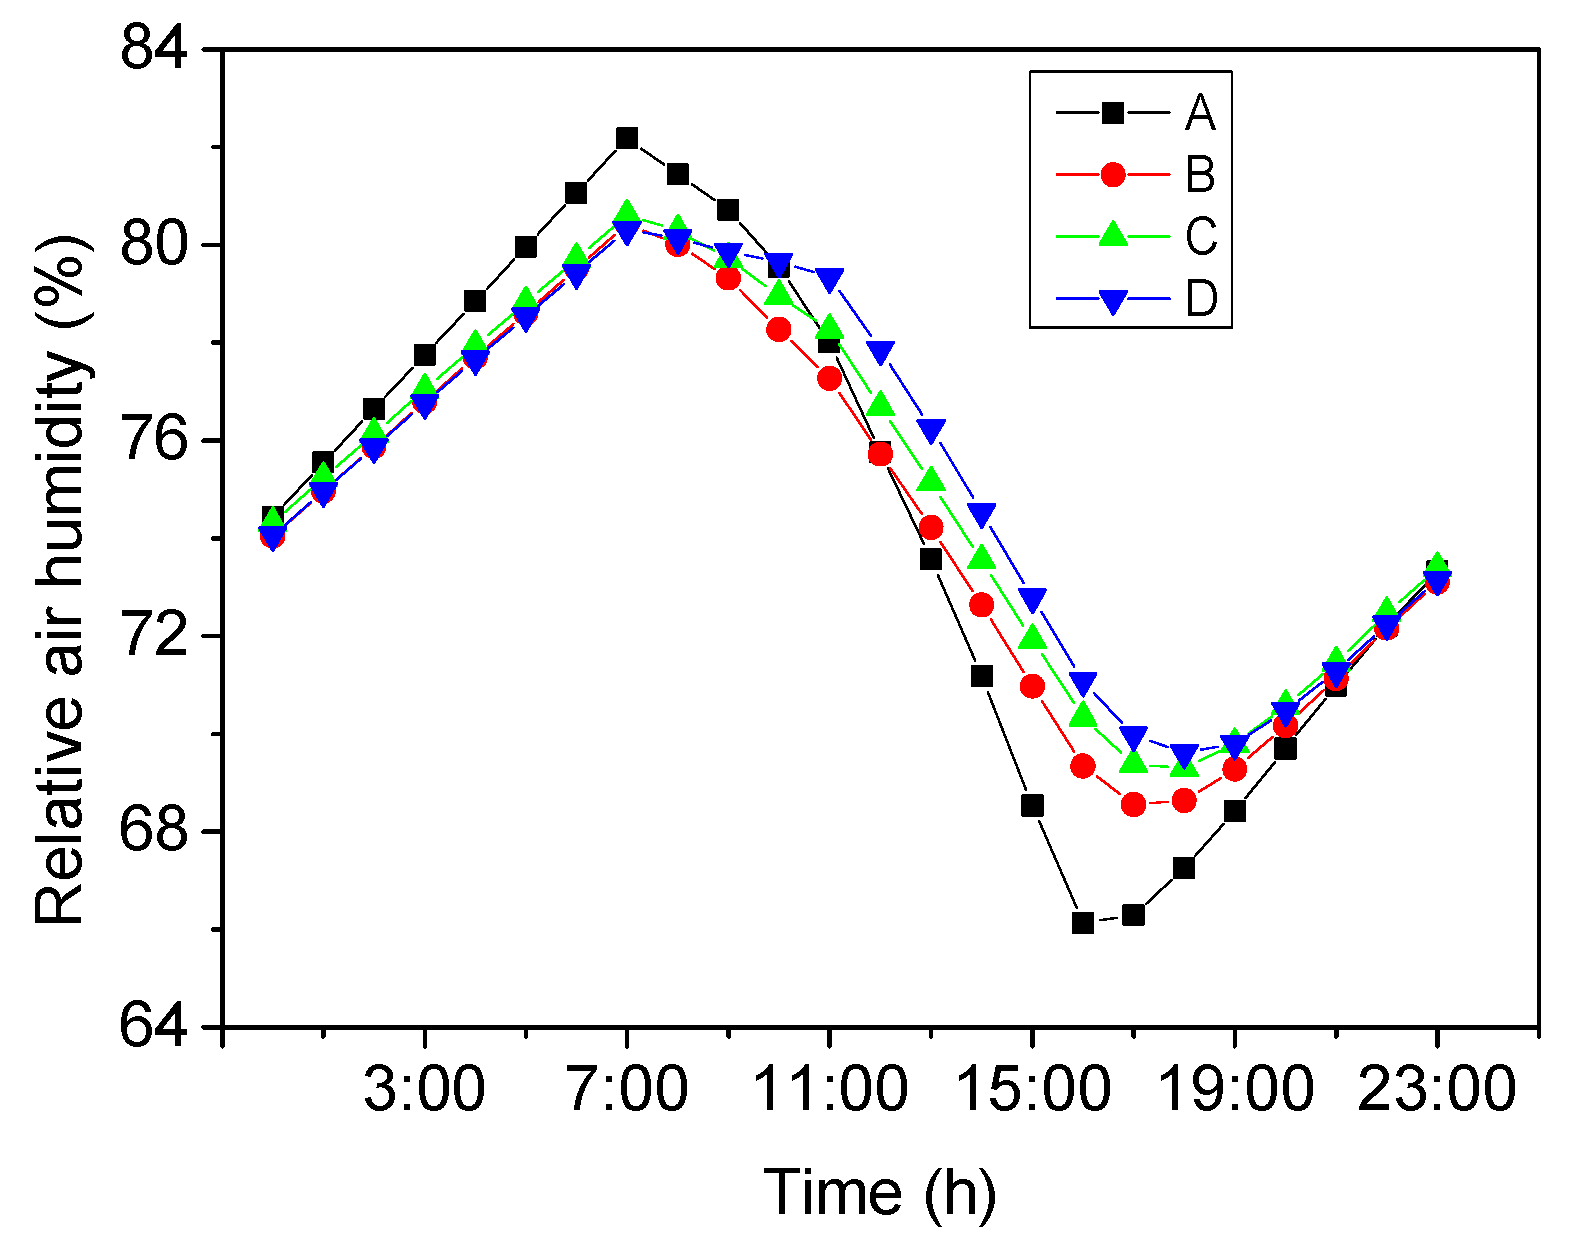
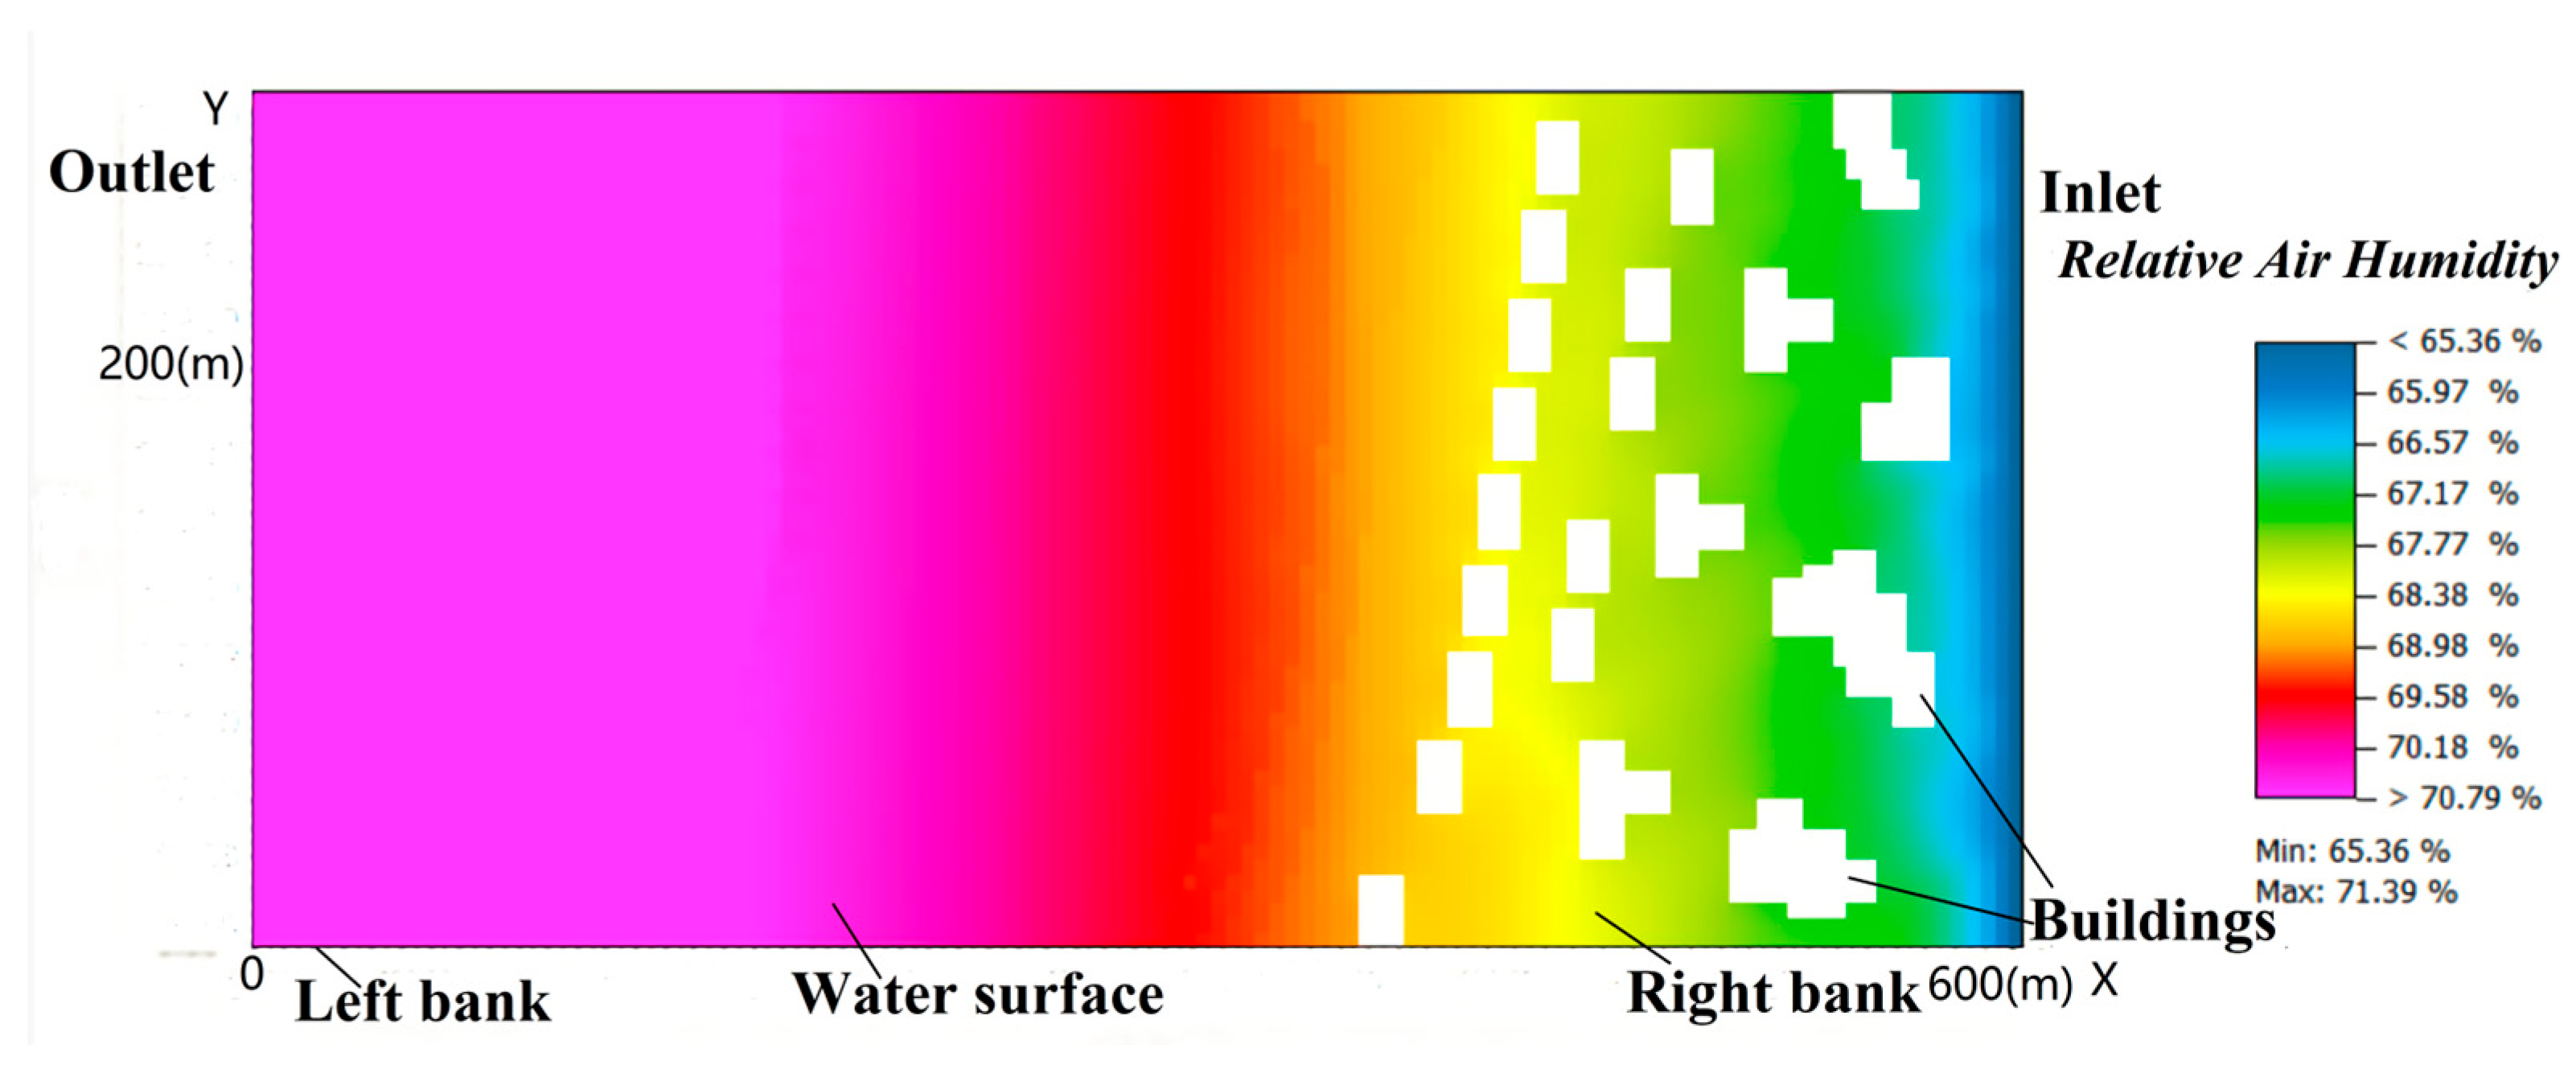
3.2. The Simulation Results of Relative Air Humidity

Relative air humidity is an important factor affecting local microclimate environments. Previous studies have indicated that the variation of relative air humidity has a close relationship with thermal comfort [36,37]. So, we also studied the variation of relative air humidity. The variation of relative air humidity with time is shown in Figure 7. It can be seen that the variation of the four curves has a similar trend. The average relative air humidity of the inlet fluctuates most, which is mainly affected by the input hourly relative air humidity parameter, while the variation of the other three curves is minimal. The highest relative air humidity at the inlet is 82.18% at 7:00, and the lowest relative air humidity is 66.13% at 16:00. The lowest relative air humidity of the remaining three points occurs between 17:00 and 18:00.
The distribution of relative air humidity at 16:00 is shown in Figure 8. It can be seen that within 0–10 m of the riverbank, the relative air humidity is 69.68% on the right bank and 70.23% on the left bank. Within 10–30 m of the riverbank, the relative air humidity on the right bank is 69.32% and that on the left bank is 70.16%. Within 30–50 m of the riverbank, the relative air humidity on the right bank is 68.54% and that on the left bank is 69.95%. It can be concluded that the relative air humidity is lower further away from the riverbank. Note that the relative air humidity of the left bank is higher than that of the right bank. The main reason for this phenomenon is attributed to the air on the left bank absorbing water vapor from the surface of the river when passing across the river. The water in the river is continuously transported downwind, leading to an increase in relative air humidity. The data in Figure 8 indicate that the relative air humidity increases by 0.38% after the air flows through the woods, decreases by 0.1% after the air flows across the road, and increases by 1.7% after the air flows across the river. Therefore, the order of influence of different underlying surfaces on relative air humidity is obtained as follows: rivers > trees > roads.

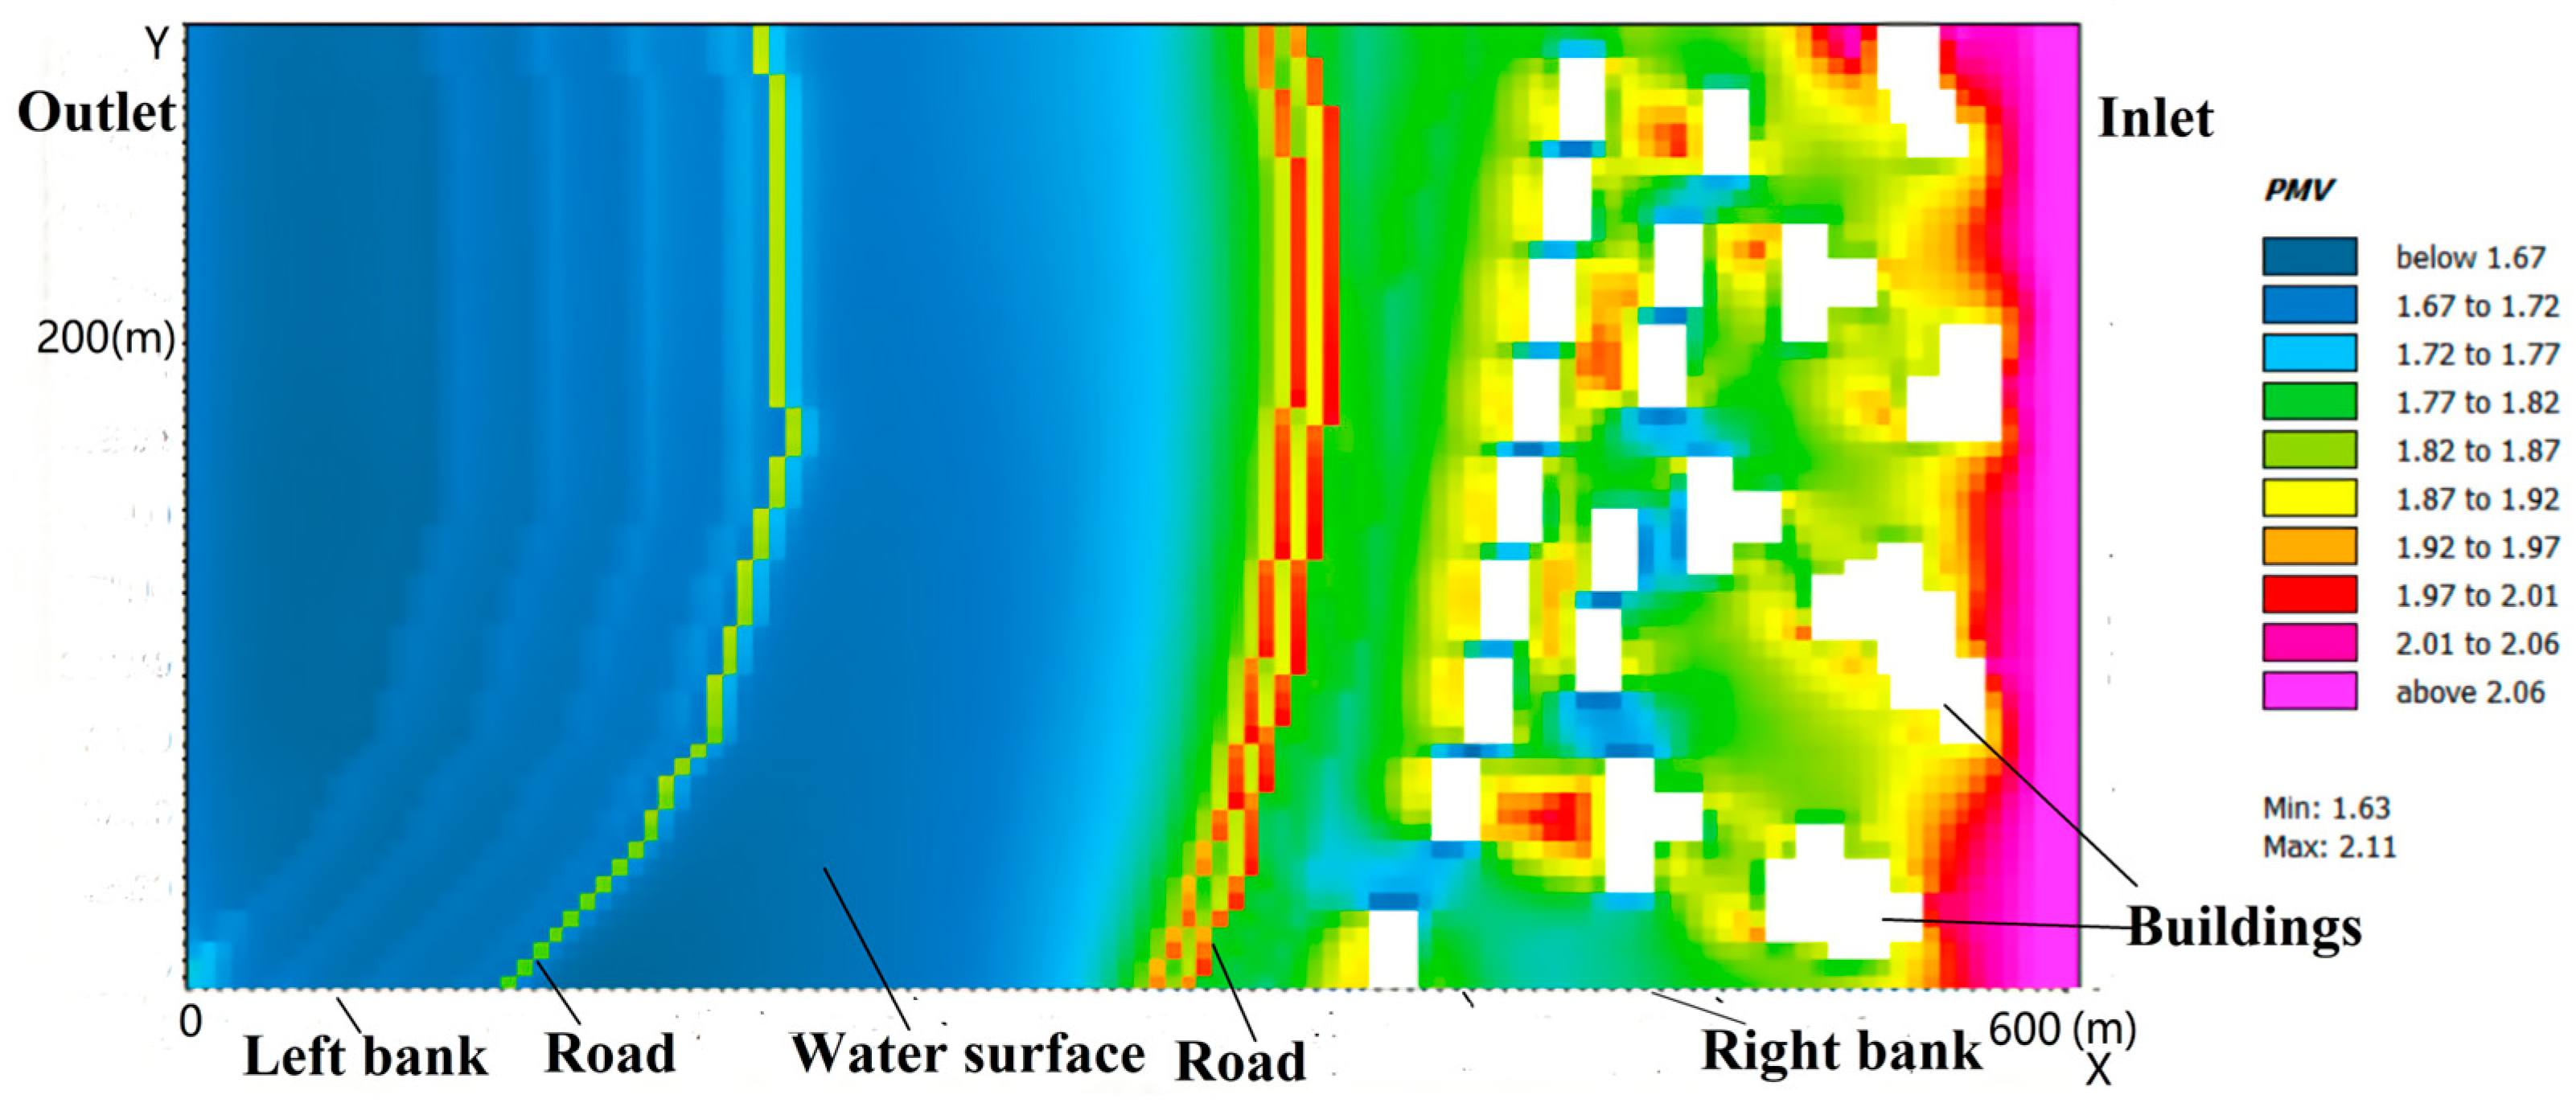
3.3. The Simulation Results of Thermal Comfort in the Study Area

Thermal comfort is a subjective sensory evaluation based on regional meteorological and human body parameters. Generally, the outdoor predicted mean vote (PMV) is used to evaluate regional thermal comfort. The parameters that affect the outdoor thermal comfort of a human body include air temperature, humidity, radiation temperature, air velocity, metabolic exercise intensity, and the thermal resistance of clothing. In the simulation experiment, the human body conditions of a 35-year-old man with a height of 175 cm and a weight of 75 kg were employed. The thermal resistance of clothing was a value of 0.9 CLO during light walking exercise.
The outdoor PMV distribution of the study area is shown in Figure 9. It can be observed that the PMV value on the left bank road is lower than that on the right bank. The main reason for this is that the river can effectively regulate the downwind thermal environment via evaporative cooling [38,39]. Thus, people feel more comfortable under the evaporative cooling effect of the river on the left bank. It should be noted that there are two red belts on both sides of the road on the right bank. The real-world scene is shown in Figure 10a, which consists of a granite road, grass, and stone wall. Under the sun’s radiation, the surface temperature of the stone wall and granite road increase faster than the surrounding area, which is because stone and granite have a smaller specific heat capacity than grass. Thus, the increase in PMV is mainly caused by the granite road and the stone wall.
Low PMV areas (PMV < 1.72) also exist in the residential areas. The real-world scene of a residential area is shown in Figure 10b. As illustrated, there are many large trees and green plants near the house, and the trees are able to block the sunshine and improve thermal comfort [40]. It can be concluded that thermal comfort is best when a location is shaded during summer. Thus, trees and green plants should be arranged along the bank and around houses to effectively enhance thermal comfort. According to the above analysis, we draw the conclusion that rivers, trees, and green plants play an important role in alleviating urban heat islands and regulating local microclimates.

4. Conclusions

This paper studied the influence of the Fu River on the microclimate of the inland city of Chengdu. ENVI-met software was employed to study the variation of air temperature, relative air humidity, and outdoor PMV. Different types of underlying surfaces were found to have varying effects on the air temperature and relative air humidity. These research results apply only to Chengdu. The following conclusions were obtained:
(1)
The river had a significant cooling effect on air temperature in the riverfront spaces. The temperature in the downwind region was lower than that of the upwind region. Conversely, the road had a warming effect on the air temperature. The order of influence of different underlying surfaces on air temperature was determined as: rivers > roads > trees.
(2)
The river had an obvious humidifying effect on the relative air humidity, while the road had little effect. The order of influence of different underlying surfaces on the relative air humidity was determined as: rivers > trees > roads.
(3)
The PMV results showed that the thermal comfort on the left bank was better than that on the right bank. Rivers, trees, and green plants play a crucial role in alleviating the urban heat islands and regulating the local microclimate.

Author Contributions

Conceptualization, methodology, investigation, writing—review and editing, X.Q.; project administration and funding acquisition, B.F.; methodology, L.X.; data curation, X.Z.; software, H.Y.; validation, S.T. All authors have read and agreed to the published version of the manuscript.

Funding

This research was supported by The National Natural Science Foundation of China (32071664).

Data Availability Statement

No new data were created or analyzed for this study. Data sharing is not applicable to this paper.

Acknowledgments

We thank the researchers from Xihua University and Institute of Mountain Hazards and Environment for their hard work and participation in the field research of this study.

Conflicts of Interest

The authors declare no conflict of interest.

References

  1. Sun, S.; Xu, X.; Lao, Z.; Liu, W.; Li, Z.; García, E.; He, L.; Zhu, J. Evaluating the impact of urban green space and landscape design parameters on thermal comfort in hot summer by numerical simulation. Build. Environ. 2017, 123, 277–288. [Google Scholar] [CrossRef]
  2. Kjellstrom, T.; Holmer, I.; Lemke, B. Workplace heat stress, health and productivity-an increasing challenge for low and middle-income countries during climate change. Glob. Health Action 2009, 2, 2047. [Google Scholar] [CrossRef]
  3. Lai, A.; Maing, M.; Ng, E. Observational studies of mean radiant temperature across different outdoor spaces under shaded conditions in densely built environment. Build. Environ. 2017, 114, 397–409. [Google Scholar] [CrossRef]
  4. Watanabe, S.; Nagano, K.; Ishii, J.; Horikoshi, T. Evaluation of outdoor thermal comfort in sunlight, building shade, and pergola shade during summer in a humid subtropical region. Build. Environ. 2014, 82, 556–565. [Google Scholar] [CrossRef]
  5. Fang, Z.; Feng, X.; Xu, X.; Zhou, X.; Lin, Z.; Ji, Y. Investigation into outdoor thermal comfort conditions by different seasonal field surveys in China, Guangzhou. Int. J. Biometeorol. 2019, 63, 1357–1368. [Google Scholar] [CrossRef]
  6. Niu, J.; Liu, J.; Lee, T.; Lin, Z.; Mak, C.; Tse, K.T.; Tang, B.S.; Kwok, K.C.S. A new method to assess spatial variations of outdoor thermal comfort: Onsite monitoring results and implications for precinct planning. Build. Environ. 2015, 91, 263–270. [Google Scholar] [CrossRef] [Green Version]
  7. Chen, L.; Ng, E. Outdoor thermal comfort and outdoor activities: A review of research in the past decade. Cities 2012, 29, 118–125. [Google Scholar] [CrossRef]
  8. Ng, E.; Cheng, V. Urban human thermal comfort in hot and humid Hong Kong. Energy Build. 2012, 55, 51–65. [Google Scholar] [CrossRef]
  9. Odhiambo, M.R.O.; Abbas, A.; Wang, X.; Elahi, E. Thermo-Environmental assessment of a heated venlo-type greenhouse in the Yangtze River delta region. Sustainability 2020, 12, 10412. Available online: https://ideas.repec.org/a/gam/jsusta/v12y2020i24p10412-d461184.html (accessed on 12 December 2020). [CrossRef]
  10. Santamouris, M.; Cartalis, C.; Synnefa, A.; Kolokotsa, D. On the impact of urban heat island and global warming on the power demand and electricity consumption of buildings—A review. Energy Build. 2015, 98, 119–124. [Google Scholar] [CrossRef]
  11. Xue, S.; Xiao, Y. Study on the outdoor thermal comfort threshold of Lingnan garden in summer. Procedia Eng. 2016, 169, 422–430. Available online: http://creativecommons.org/licenses/by-nc-nd/4.0/ (accessed on 31 October 2016). [CrossRef]
  12. Yang, X.; Peng, L.; Jiang, Z.; Chen, Y.; Yao, L.; He, Y.; Xu, T. Impact of urban heat island on energy demand in buildings: Local climate zones in Nanjing. Appl. Energy 2020, 260, 114279. [Google Scholar] [CrossRef]
  13. Anjos, M.; Targino, A.C.; Krecl, P.; Oukawa, G.Y.; Braga, R.F. Analysis of the urban heat island under different synoptic patterns using local climate zones. Build. Environ. 2020, 185, 107268. [Google Scholar] [CrossRef]
  14. Zheng, H.; Chen, Y.; Pan, W.; Cai, Y.; Chen, Z. Impact of land use/Land cover changes on the thermal environment in urbanization: A case study of the natural wetlands distribution area in Minjiang River estuary, China. Pol. J. Environ. Stud. 2019, 28, 3025–3041. Available online: http://www.pjoes.com/pdf-93743-37097?filename=37097.pdf (accessed on 5 March 2019). [CrossRef]
  15. Moyer, A.N.; Hawkins, T.W. River effects on the heat island of a small urban area. Urban Clim. 2017, 21, 262–277. [Google Scholar] [CrossRef]
  16. Li, X.; Koh, T.Y.; Entekhabi, D.; Roth, M.; Panda, J.; Norford, L.K. A multi-resolution ensemble study of a tropical urban environment and its interactions with the background regional atmosphere. J. Geophys. Res. Atmos. 2013, 118, 1–15. [Google Scholar] [CrossRef]
  17. Morakinyo, T.E.; Lau, K.K.-L.; Ren, C.; Ng, E. Performance of Hong Kong’s common trees species for outdoor temperature regulation, thermal comfort and energy saving. Build. Environ. 2018, 137, 157–170. [Google Scholar] [CrossRef]
  18. Teshnehdel, S.; Akbari, H.; Giuseppe, E.D.; Brown, R.D. Effect of tree cover and tree species on microclimate and pedestrian comfort in a residential district in Iran. Build. Environ. 2020, 178, 106899. [Google Scholar] [CrossRef]
  19. Park, M.; Hagishima, A.; Tanimoto, J.; Narita, K. Effect of urban vegetation on outdoor thermal environment: Field measurement at a scale model site. Build. Environ. 2012, 56, 38–46. [Google Scholar] [CrossRef]
  20. Zhang, B.; Xie, G.; Gao, J.; Yang, Y. The cooling effect of urban green spaces as a contribution to energy-saving and emission-reduction: A case study in Beijing, China. Build. Environ. 2014, 76, 37–43. [Google Scholar] [CrossRef]
  21. Cao, X.; Onishi, A.; Chen, J.; Imura, H. Quantifying the cool island intensity of urban parks using ASTER and IKONOS data. Landsc. Urban Plan. 2010, 96, 224–231. [Google Scholar] [CrossRef]
  22. Evans, J.M.; Schiller, S.D. Application of microclimate studies in town planning: A new capital city, an existing urban district and urban river front development. Atmos. Environ. 1996, 30, 361–364. [Google Scholar] [CrossRef]
  23. Xie, Q.; Li, J. Detecting the Cool Island Effect of Urban Parks in Wuhan: A City on Rivers. Int. J. Environ. Res. Public Health 2021, 18, 132. [Google Scholar] [CrossRef]
  24. Cai, Z.; Han, G.; Chen, M. Do water bodies play an important role in the relationship between urban form and land surface temperature? Sustain. Cities Soci. 2018, 39, 487–498. [Google Scholar] [CrossRef]
  25. Deng, Q.; Zhou, Z.; Li, C.; Yang, G. Influence of a railway station and the Yangtze River on the local urban thermal environment of a subtropical city. J. Asian Archit. Build Eng. 2022, 21, 589–604. [Google Scholar] [CrossRef]
  26. Piccolroaz, S.; Toffolon, M.; Robinson, C.T.; Siviglia, A. Exploring and Quantifying River Thermal Response to Heatwaves. Water 2018, 10, 1098. [Google Scholar] [CrossRef] [Green Version]
  27. Du, H.; Song, X.; Jiang, H.; Kan, Z.; Wang, Z.; Cai, Y. Research on the cooling island effects of water body: A case study of Shanghai, China. Ecol. Indic. 2016, 67, 31–38. [Google Scholar] [CrossRef]
  28. Cruz, J.A.; Blanco, A.C.; Garcia, J.J.; Santos, J.A.; Moscoso, A.D. Evaluation of the cooling effect of green and blue spaces on urban microclimate through numerical simulation: A case study of Iloilo River Esplanade, Philippines. Sustain. Cities Soc. 2021, 74, 103184. [Google Scholar] [CrossRef]
  29. Xiong, Y.; Zhang, J.; Xu, X.; Yan, Y.; Sun, S.; Liu, S. Strategies for improving the microclimate and thermal comfort of a classical Chinese garden in the hot-summer and cold-winter zone. Energy Build. 2020, 215, 109914. [Google Scholar] [CrossRef]
  30. Hathway, E.A.; Sharples, S. The interaction of rivers and urban form in mitigating the Urban Heat Island effect: A UK case study. Build. Environ. 2012, 58, 14–22. [Google Scholar] [CrossRef] [Green Version]
  31. Iakovoglou, V.; Gounaridis, D.; Zaimes, G.N. Riparian areas in urban settings: Two case studies from Greece. Int. J. Innov. Sus. Develop. 2013, 7, 271–288. [Google Scholar] [CrossRef]
  32. Norton, B.A.; Coutts, A.M.; Livesley, S.J.; Harris, R.J.; Hunter, A.M.; Williams, N.S.G. Planning for cooler cities: A framework to prioritise green infrastructure to mitigate high temperatures in urban landscapes. Landsc. Urban Plan. 2015, 134, 127–138. [Google Scholar] [CrossRef]
  33. Konarska, J.; Uddling, J.; Holmer, B.; Lutz, M.; Lindberg, F.; Pleijel, H.; Thorsson, S. Transpiration of urban trees and its cooling effect in a high latitude city. Int. J. Biometeorol. 2016, 60, 159–172. Available online: https://link.springer.com/article/10.1007/s00484-015-1014-x (accessed on 6 June 2015). [CrossRef] [PubMed]
  34. Tominaga, Y.; Sato, Y.; Sadohara, S. CFD simulations of the effect of evaporative cooling from water bodies in a micro-scale urban environment: Validation and application studies. Sustain. Cities Soc. 2015, 19, 259–270. [Google Scholar] [CrossRef]
  35. Xu, X.; Liu, S.; Sun, S.; Zhang, W.; Liu, Y.; Lao, Z.; Guo, G.; Smith, K.; Cui, Y.; Liu, W.; et al. Evaluation of energy saving potential of an urban green space and its water bodies. Energy Build. 2019, 188–189, 58–70. [Google Scholar] [CrossRef]
  36. Yang, X.; Peng, L.L.H.; Chen, Y.; Yao, L.; Wang, Q. Air humidity characteristics of local climate zones: A three-year observational study in Nanjing. Build. Environ. 2020, 171, 106661. [Google Scholar] [CrossRef]
  37. Steeneveld, G.J.; Koopmans, S.; Heusinkveld, B.G.; Theeuwes, N.E. Refreshing the Role of Open Water Surfaces on Mitigating the Maximum Urban Heat Island Effect. Landsc. Urban Plan. 2014, 121, 92–96. [Google Scholar] [CrossRef]
  38. Zhang, P.; Zhang, X.; Ma, Z.; Song, J. Numerical Study on the Affection of River System of Different Areas to Thermal Environment of Residential Neighborhood. Adv. Mater. Res. 2012, 433–440, 1422–1427. Available online: https://www.scientific.net/AMR.433-440.1422 (accessed on 15 January 2012). [CrossRef]
  39. Wang, J.; Meng, Q.; Tan, K.; Zhang, L.; Zhang, Y. Experimental investigation on the influence of evaporative cooling of permeable pavements on outdoor thermal environment. Build. Environ. 2018, 140, 184–193. [Google Scholar] [CrossRef]
  40. Hwang, R.L.; Lin, T.P.; Matzarakis, A. Seasonal effects of urban street shading on long-term outdoor thermal comfort. Build. Environ. 2011, 46, 863–870. [Google Scholar] [CrossRef]
Figure 1. Study area.
Water 15 01408 g001
Figure 2. Real-world pictures of the study area: (a) overall overview of the study area, (b) right bank, and (c) left bank.
Water 15 01408 g002
Figure 3. Small HOBO weather station.
Water 15 01408 g003
Figure 4. The ENVI-met model of the study area.
Water 15 01408 g004
Figure 5. The variation of air temperature with time.
Water 15 01408 g005
Figure 6. Air temperature distribution of the study area at 16:00.
Water 15 01408 g006
Figure 7. The variation of relative air humidity over time.
Water 15 01408 g007
Figure 8. The distribution of relative air humidity at 16:00.
Water 15 01408 g008
Figure 9. The outdoor PMV distribution of study area.
Water 15 01408 g009
Figure 10. The real scene picture (a) road (b) residential area.
Water 15 01408 g010
Table 1. Hourly meteorological parameters.
TimeSolar Radiation Intensity
(W/m2)
Air Temperature
(°C)
Relative Air Humidity
(%)
7:0075.8227.2890.60
8:00130.1928.6986.67
9:0074.9229.8979.85
10:0049.8030.2278.57
11:0090.9429.9479.08
12:00285.9930.1976.95
13:00646.9130.7573.27
14:00471.5531.8270.51
15:00800.0833.1660.08
16:00191.8734.7661.30
17:00247.5933.7865.47
18:00173.7533.0367.29
19:0076.4832.2570.99
Table 2. The parameters of the ENVI-met model.
Length (m)600Width (m)300
Grid size (m)2Expansion coefficient20%
The lowest height of the building (m)140
Table 3. Boundary parameters setting of the ENVI-met.
Simulation Duration (h)24
Air temperature (°C)Min: 27.28
Max: 34.76
Relative air humidity (%)Min: 60.08
Max: 90.60
Solar radiation intensity (W/m2)Max: 800.08
Wind speed (m/s)1.21
Soil temperature (°C)19.85
Soil moisture (%)70.00
Surface roughness0.02
Table 4. Comparison of air temperature between the measured value and the simulation value.
9:0012:0016:00
Measuring PointMeasured Value (°C)Simulation Value (°C)RE (%)Measured Value (°C)Simulation Value (°C)RE (%)Measured Value (°C)Simulation Value (°C)RE (%)
125.326.13.1627.526.53.6430.930.51.29
225.625.70.3927.426.72.5530.630.90.98
325.725.21.9528.327.14.2431.031.51.61
426.425.91.8927.326.43.3030.231.12.98
525.825.60.7827.126.90.7429.729.41.01
625.224.62.3827.326.43.3029.429.20.68
Table 5. The comparison of relative air humidity between the measured value and the simulation value.
9:0012:0016:00
Measured Value (%)Simulation Value (%)RE(%)Measured Value (%)Simulation Value (%)RE (%)Measured Value (%)Simulation Value (%)RE (%)
175.973.43.2967.669.22.3760.860.40.66
270.471.51.5669.268.80.5862.564.93.84
371.571.90.5668.969.30.5857.159.13.50
472.771.51.6570.169.70.5761.861.30.81
571.673.42.5168.870.62.6260.262.63.99
676.773.93.6572.869.64.4059.859.50.50
Disclaimer/Publisher’s Note: The statements, opinions and data contained in all publications are solely those of the individual author(s) and contributor(s) and not of MDPI and/or the editor(s). MDPI and/or the editor(s) disclaim responsibility for any injury to people or property resulting from any ideas, methods, instructions or products referred to in the content.

