Article

Effects of Groundwater Level Control on Soil Salinity Change in Farmland around Wetlands in Arid Areas: A Case Study of the Lower Reaches of the Shiyang River Basin, China

1
Institute of Hydrogeology and Environmental Geology, Chinese Academy of Geological Sciences, Shijiazhuang 050061, China
2
China University of Geosciences (Beijing), Beijing 100083, China
3
Key Laboratory of Groundwater Sciences and Engineering, Ministry of Natural Resources, Shijiazhuang 050061, China
*
Author to whom correspondence should be addressed.
Water 2023, 15(7), 1308; https://doi.org/10.3390/w15071308
Submission received: 23 February 2023 / Revised: 21 March 2023 / Accepted: 25 March 2023 / Published: 27 March 2023
(This article belongs to the Section Hydrogeology)

Abstract

:
The farmland around wetlands in the lower reaches of an arid area is susceptible to salinization. To explore the effects of the groundwater level control at an irrigation cycle scale on the salt concentration of the topsoil solution, this study carried out groundwater level control and irrigation experiments using the intelligent groundwater control and in-situ field monitoring system (also referred to as the groundwater control system) in the experimental base for groundwater control of the Shiyang River basin. On this basis, this study compared and analyzed the changes in groundwater depth, soil salinity, soil moisture content, and total water potential in zones with and without groundwater control (also referred to as the control and non-control zones, respectively). Results show: (1) When the groundwater depth increased by about 50 cm under the influence of the groundwater control system, the salt accumulation layer of the soil bulk shifted downward by about 20 cm, and the topsoil bulk salt (at a depth of less than 40 cm) decreased to below 5.0 g/kg; (2) In summer, the pore water electrical conductivity (ECp) of the topsoil in the control and non-control zones exhibited alternating rapid decreases and slow increases. In the concentration stage of the soil solution, the ECp of the topsoil in the non-control zone had significantly higher increased amplitude than that in the control zone, especially 3–8 days after irrigation. At this stage, the ECp of the topsoil in the control and non-control zones increased in two (slow and rapid increase) and three (slow, rapid, and fairly rapid increase) periods, respectively; (3) At the concentration stage of the topsoil solution, both the moisture content and solution salt content of the topsoil in the control zone were in a negative equilibrium state, with the absolute values of the equilibrium values gradually increasing. In contrast, the moisture content and solution salt content of the topsoil in the non-control zone were in negative and positive equilibrium, respectively, with the absolute values of their equilibrium values gradually increasing. The groundwater control system can mitigate the concentration rate of the topsoil solution by increasing the groundwater depth and influencing the water and salt equilibrium of the topsoil solution, which can create a suitable topsoil salt environment for crop growth. This study is of great significance for determining an appropriate ecological water level interval and optimizing groundwater control strategies for farmland around wetlands.

1. Introduction

In recent years, the ecological protection strategy and policies have been implemented in West China, including returning farmland to wetlands and reducing groundwater exploitation. Accordingly, the water area in wetlands in the lower reaches of the inland river basins in Northwest China has gradually increased, increasing the risk of salinization to surrounding farmland [1,2,3]. Both the ecological environment of wetlands and the salinization of farmland are sensitive to groundwater levels [4,5,6,7]. Therefore, in order to achieve a win-win situation for the ecological protection of wetlands and the prevention of salinization of farmland, an effective way is to control the groundwater depth at an appropriate interval in the boundary zone between wetlands and farmland [8,9,10]. According to studies and statistics, the arid areas free from serious salinization and those with a good ecological environment in Northwest China generally have a groundwater depth of greater than 1.9 m and less than 3 m, respectively [11,12]. Therefore, there is a limited appropriate interval of the groundwater depth in the boundary zone between wetlands and farmland. When control measures are taken, the groundwater depth of salinized farmland responds sensitively and shows repeated increases and decreases in summer due to strong evapotranspiration and frequent irrigation. In this case, the topsoil solution salt undergoes a complex process consisting of alternating dilution and concentration [13,14].
The response of topsoil salinity to changes in groundwater depth under the influence of groundwater control is an important basis for evaluating the control performance and optimizing the control schemes [15,16]. Researchers at home and abroad have carried out extensive qualitative and quantitative research on the relationship between groundwater depth and topsoil salinity by methods of greenhouse tests and field survey statistics. And the relevant relationship has been basically confirmed [17,18,19,20,21]. On the other hand, according to characteristics of meteorology, hydrogeology and crop salt tolerance in different areas, ecological groundwater level depth thresholds for each area have been proposed [22,23,24]. Based on the in-situ monitoring experiments conducted in the Kashi experimental area in Xinjiang, Chen YB et al. [25] concluded that there was a linear negative correlation between the salt content in topsoil and the groundwater depth under a fixed total dissolved solids (TDS) content of groundwater. Through laboratory experiments, Jia C [26] found that the topsoil in the Yellow River Delta was prone to salinization when the groundwater depth was less than 1.6 m. Current studies focus on the effects of groundwater depth on topsoil salinity in different regions on a scale of seasons or crop growth stages under static conditions on comprehensive analyses. Meanwhile, the soil salinity mainly refers to the water-soluble salts in the topsoil bulk in these studies. However, the salts in the soil that directly harm the crops refer to salt concentration of the topsoil solution, which is affected by both the moisture and solution salt equilibrium in the topsoil [27,28]. Therefore, it is necessary to deeply study the effects of groundwater depth on the salt concentration of the topsoil solution on a smaller scale (within the irrigation cycle) in the practical operation of the control system to well guide the practice in the farmland around wetland.
Relying on the experimental base for groundwater control in the lower reaches of the Shiyang River basin, this study carried out groundwater level control and irrigation experiments, comprehensively compared and analyzed the data such as moisture content, groundwater depth, the pore water electrical conductivity (ECp) of soil, and total water potential and investigated the change processes of salt content of the topsoil bulk, salt concentration of the topsoil solution and the characteristics of the moisture and solution salt equilibrium in the topsoil in the control and non-control zones on different time scales. This study is of great significance for further optimizing the interval of the ecological groundwater depth and relevant control measures in the boundary zone between wetlands and farmland on a small scale (within the irrigation cycle).

2. Materials and Methods

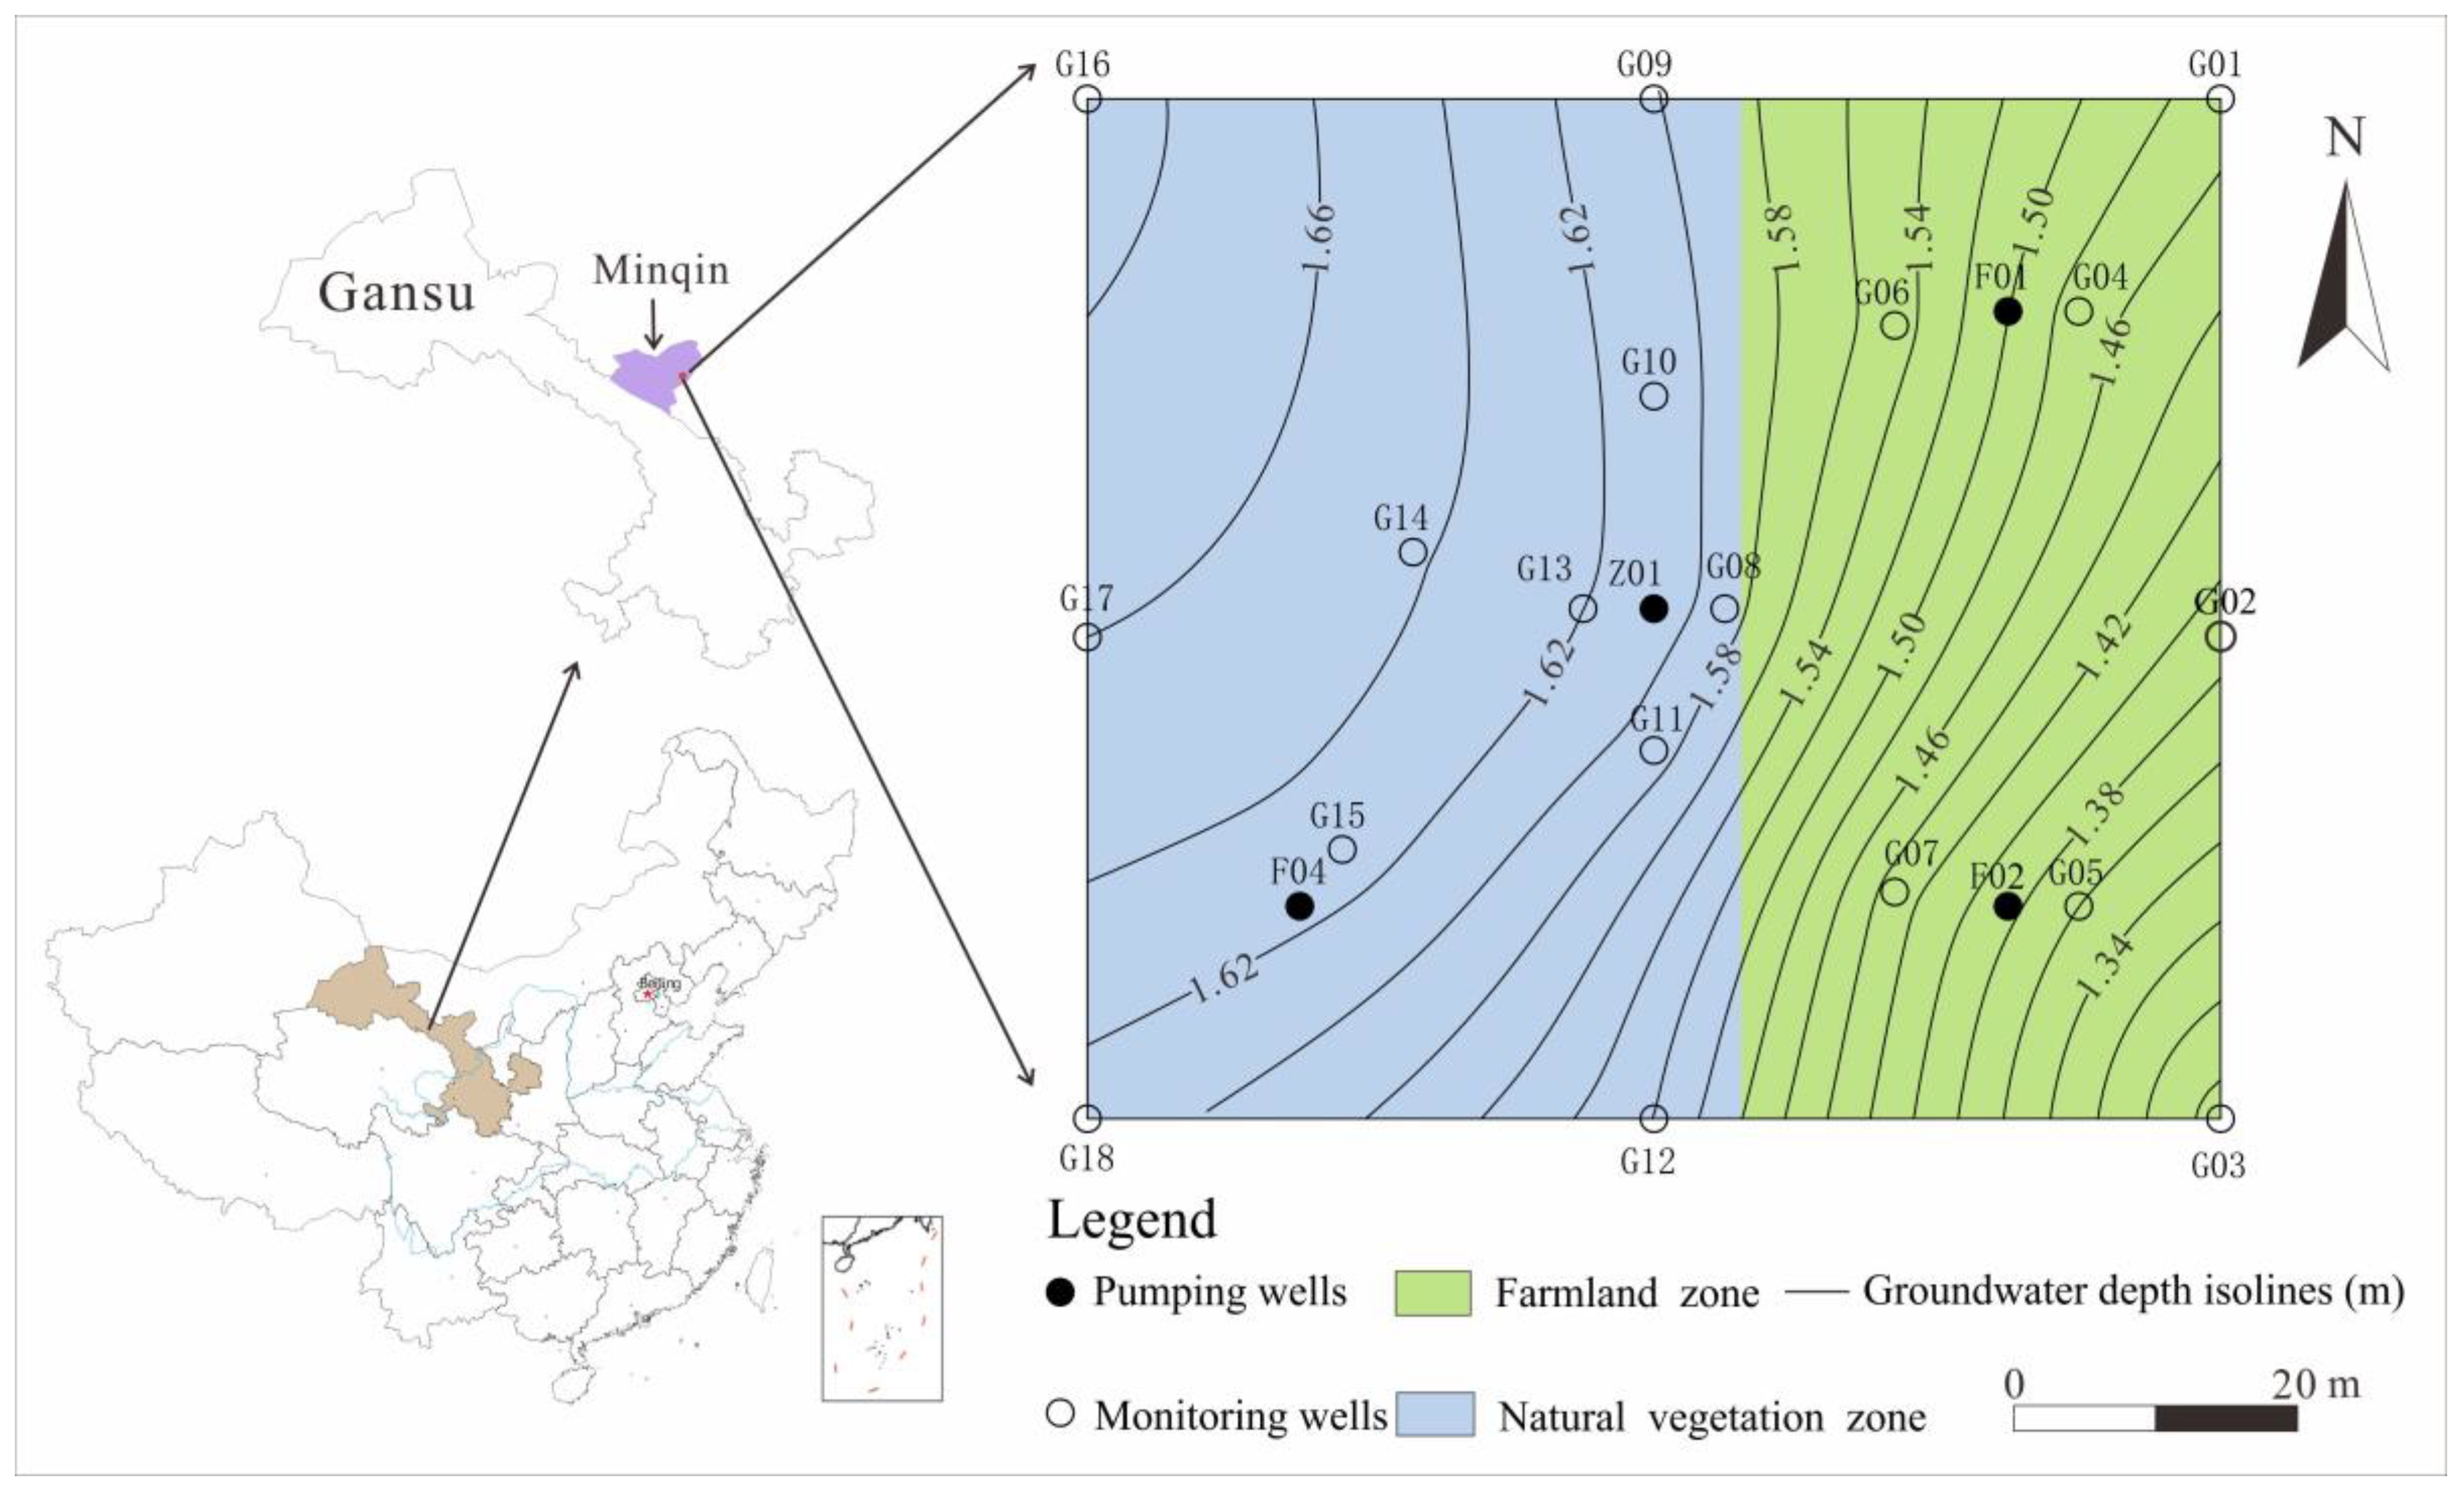
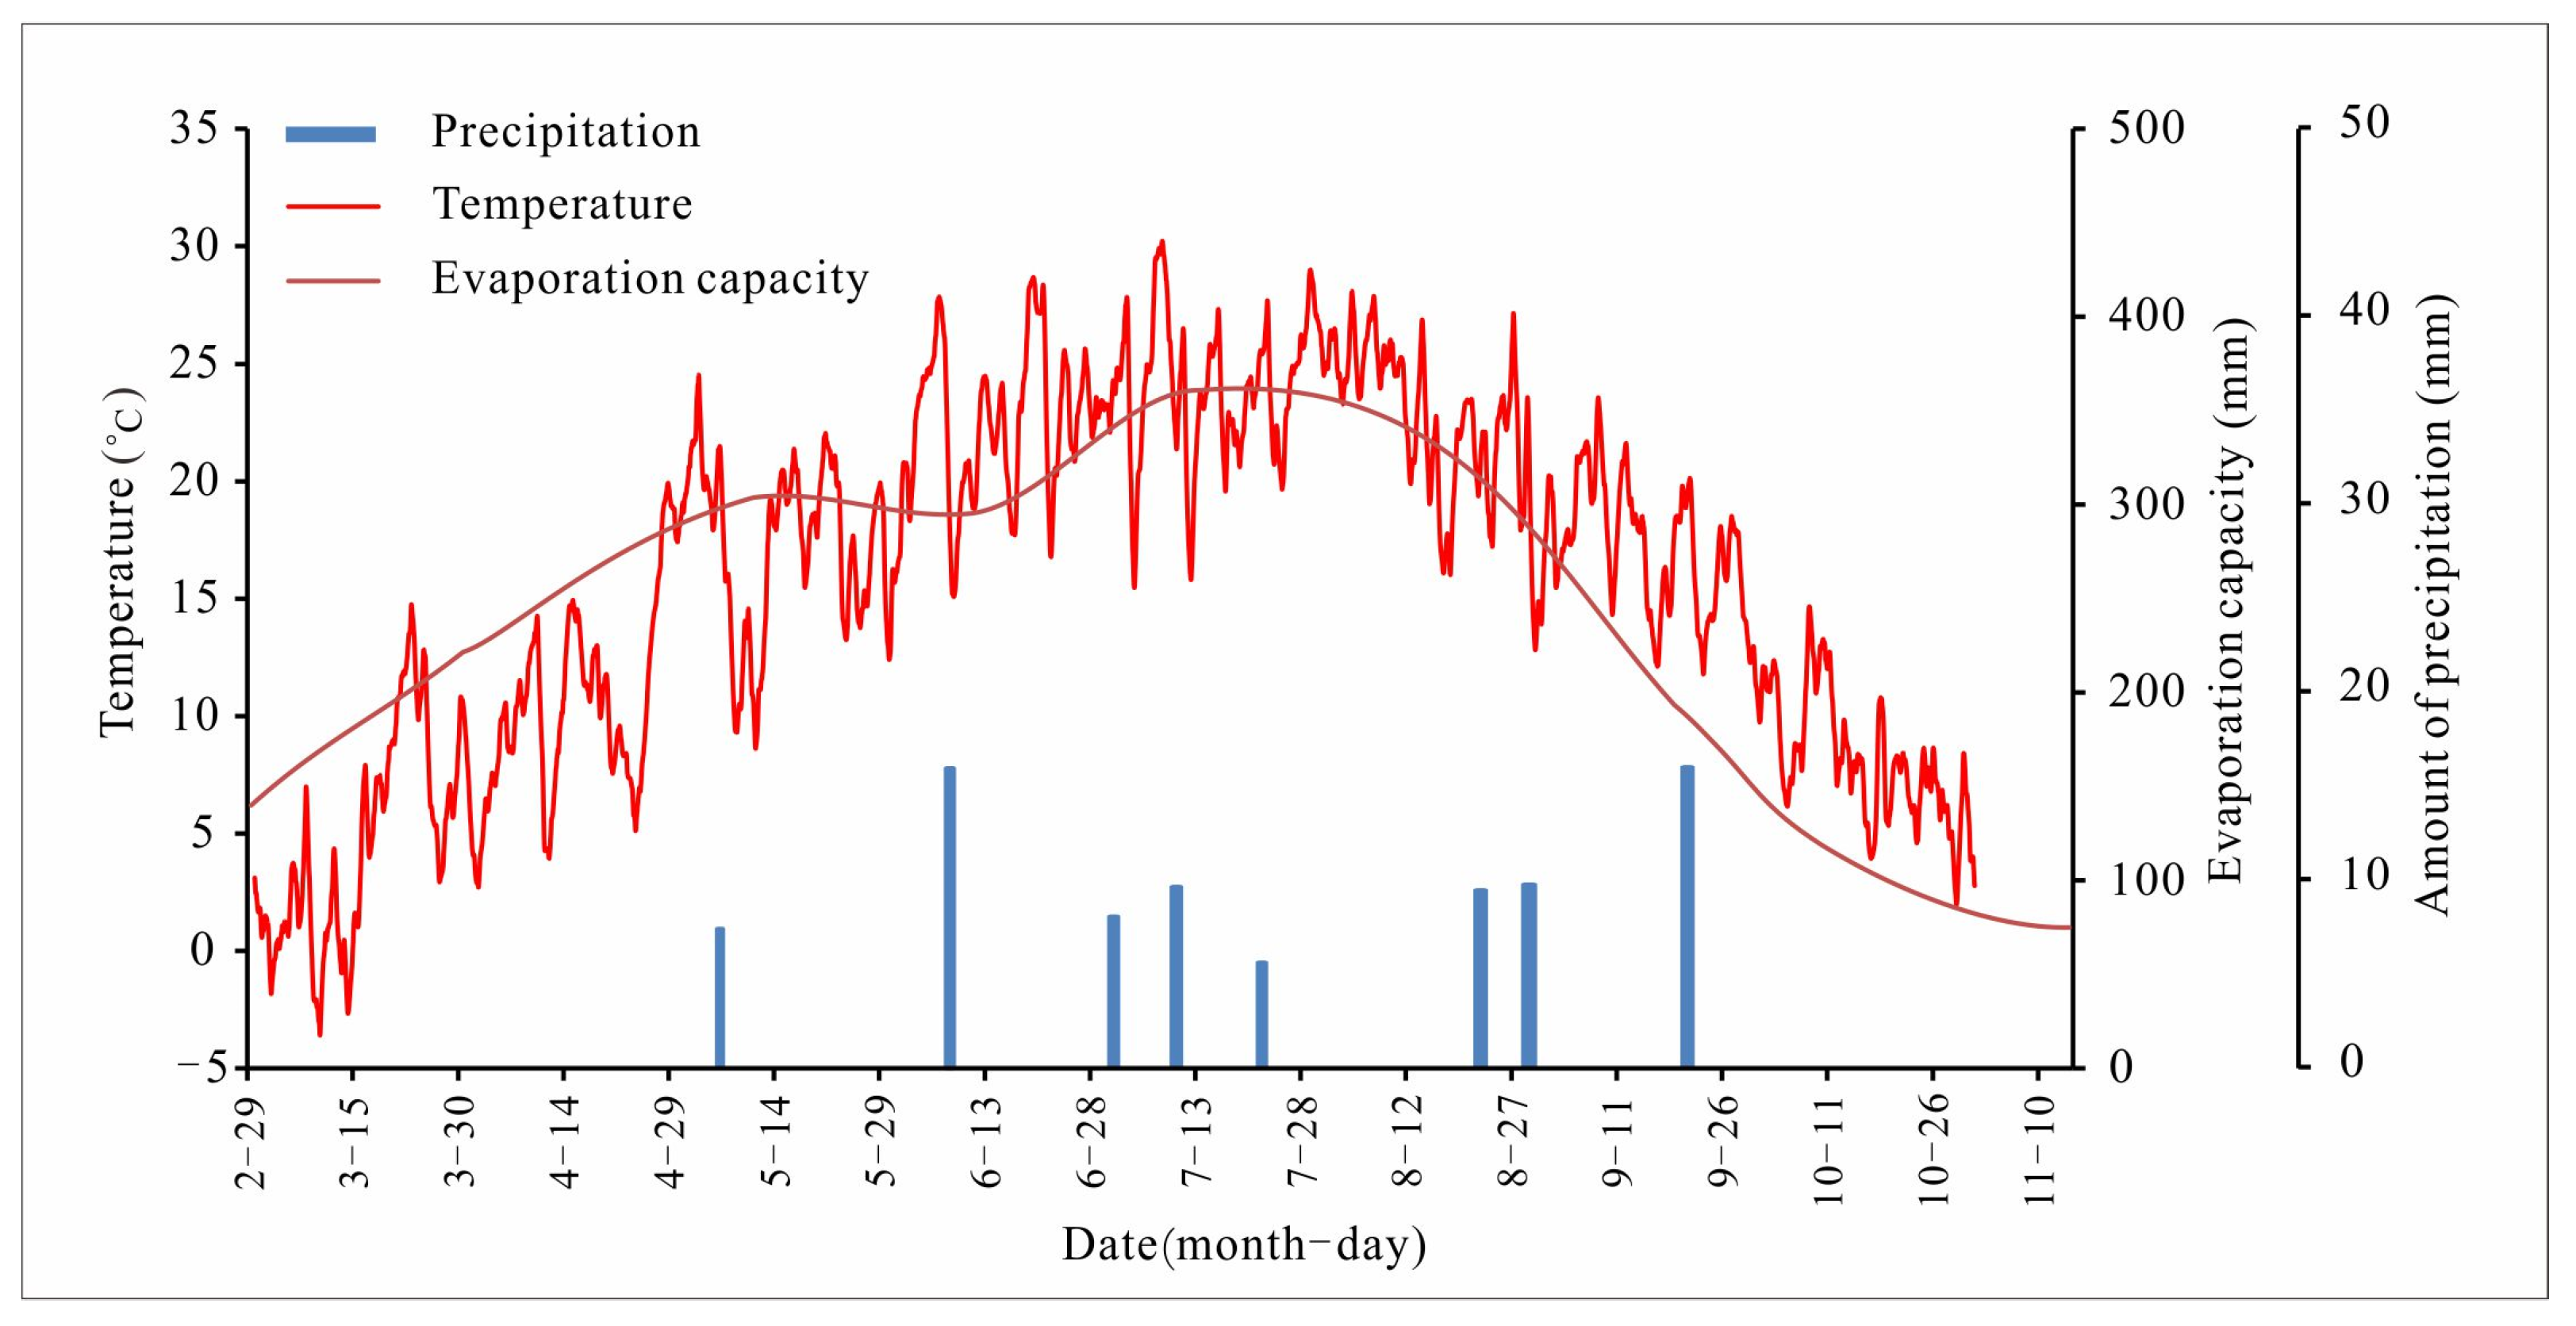
2.1. Overview of the Study Area

The experimental base for groundwater control on which this study relies is located in Dengmaying Lake in the lower reaches of the Shiyang River basin, with geographic coordinates of 38°06′2.4″ N and 103°20′1.0″ E. This base lies in the transition zone between a natural oasis and farmland and was a salt marsh before the 1970s. It has average annual precipitation and evaporation of 123.6 mm and 2063.5 mm, respectively. The lithological structure of the aeration zone in the experimental base consists of sandy loam at a depth of 0–80 cm, loam at a depth of 80–150 cm, and silty sands at a depth of 150–180 cm, with the capillary water supported by phreatic water rising to a height of about 1.7 m. The crops in the experimental base are dominated by sunflower and corn, and the natural vegetation primarily includes Kalidium foliatum and reed [29]. In the absence of control measures, the phreatic water in the experimental base has a depth of 1.0–1.6 m (Figure 1) and a TDS content of 7.63–13.24 g/L in summer. Meanwhile, during the season, the deep confined water in the base has a TDS content of less than 1.0 g/L.

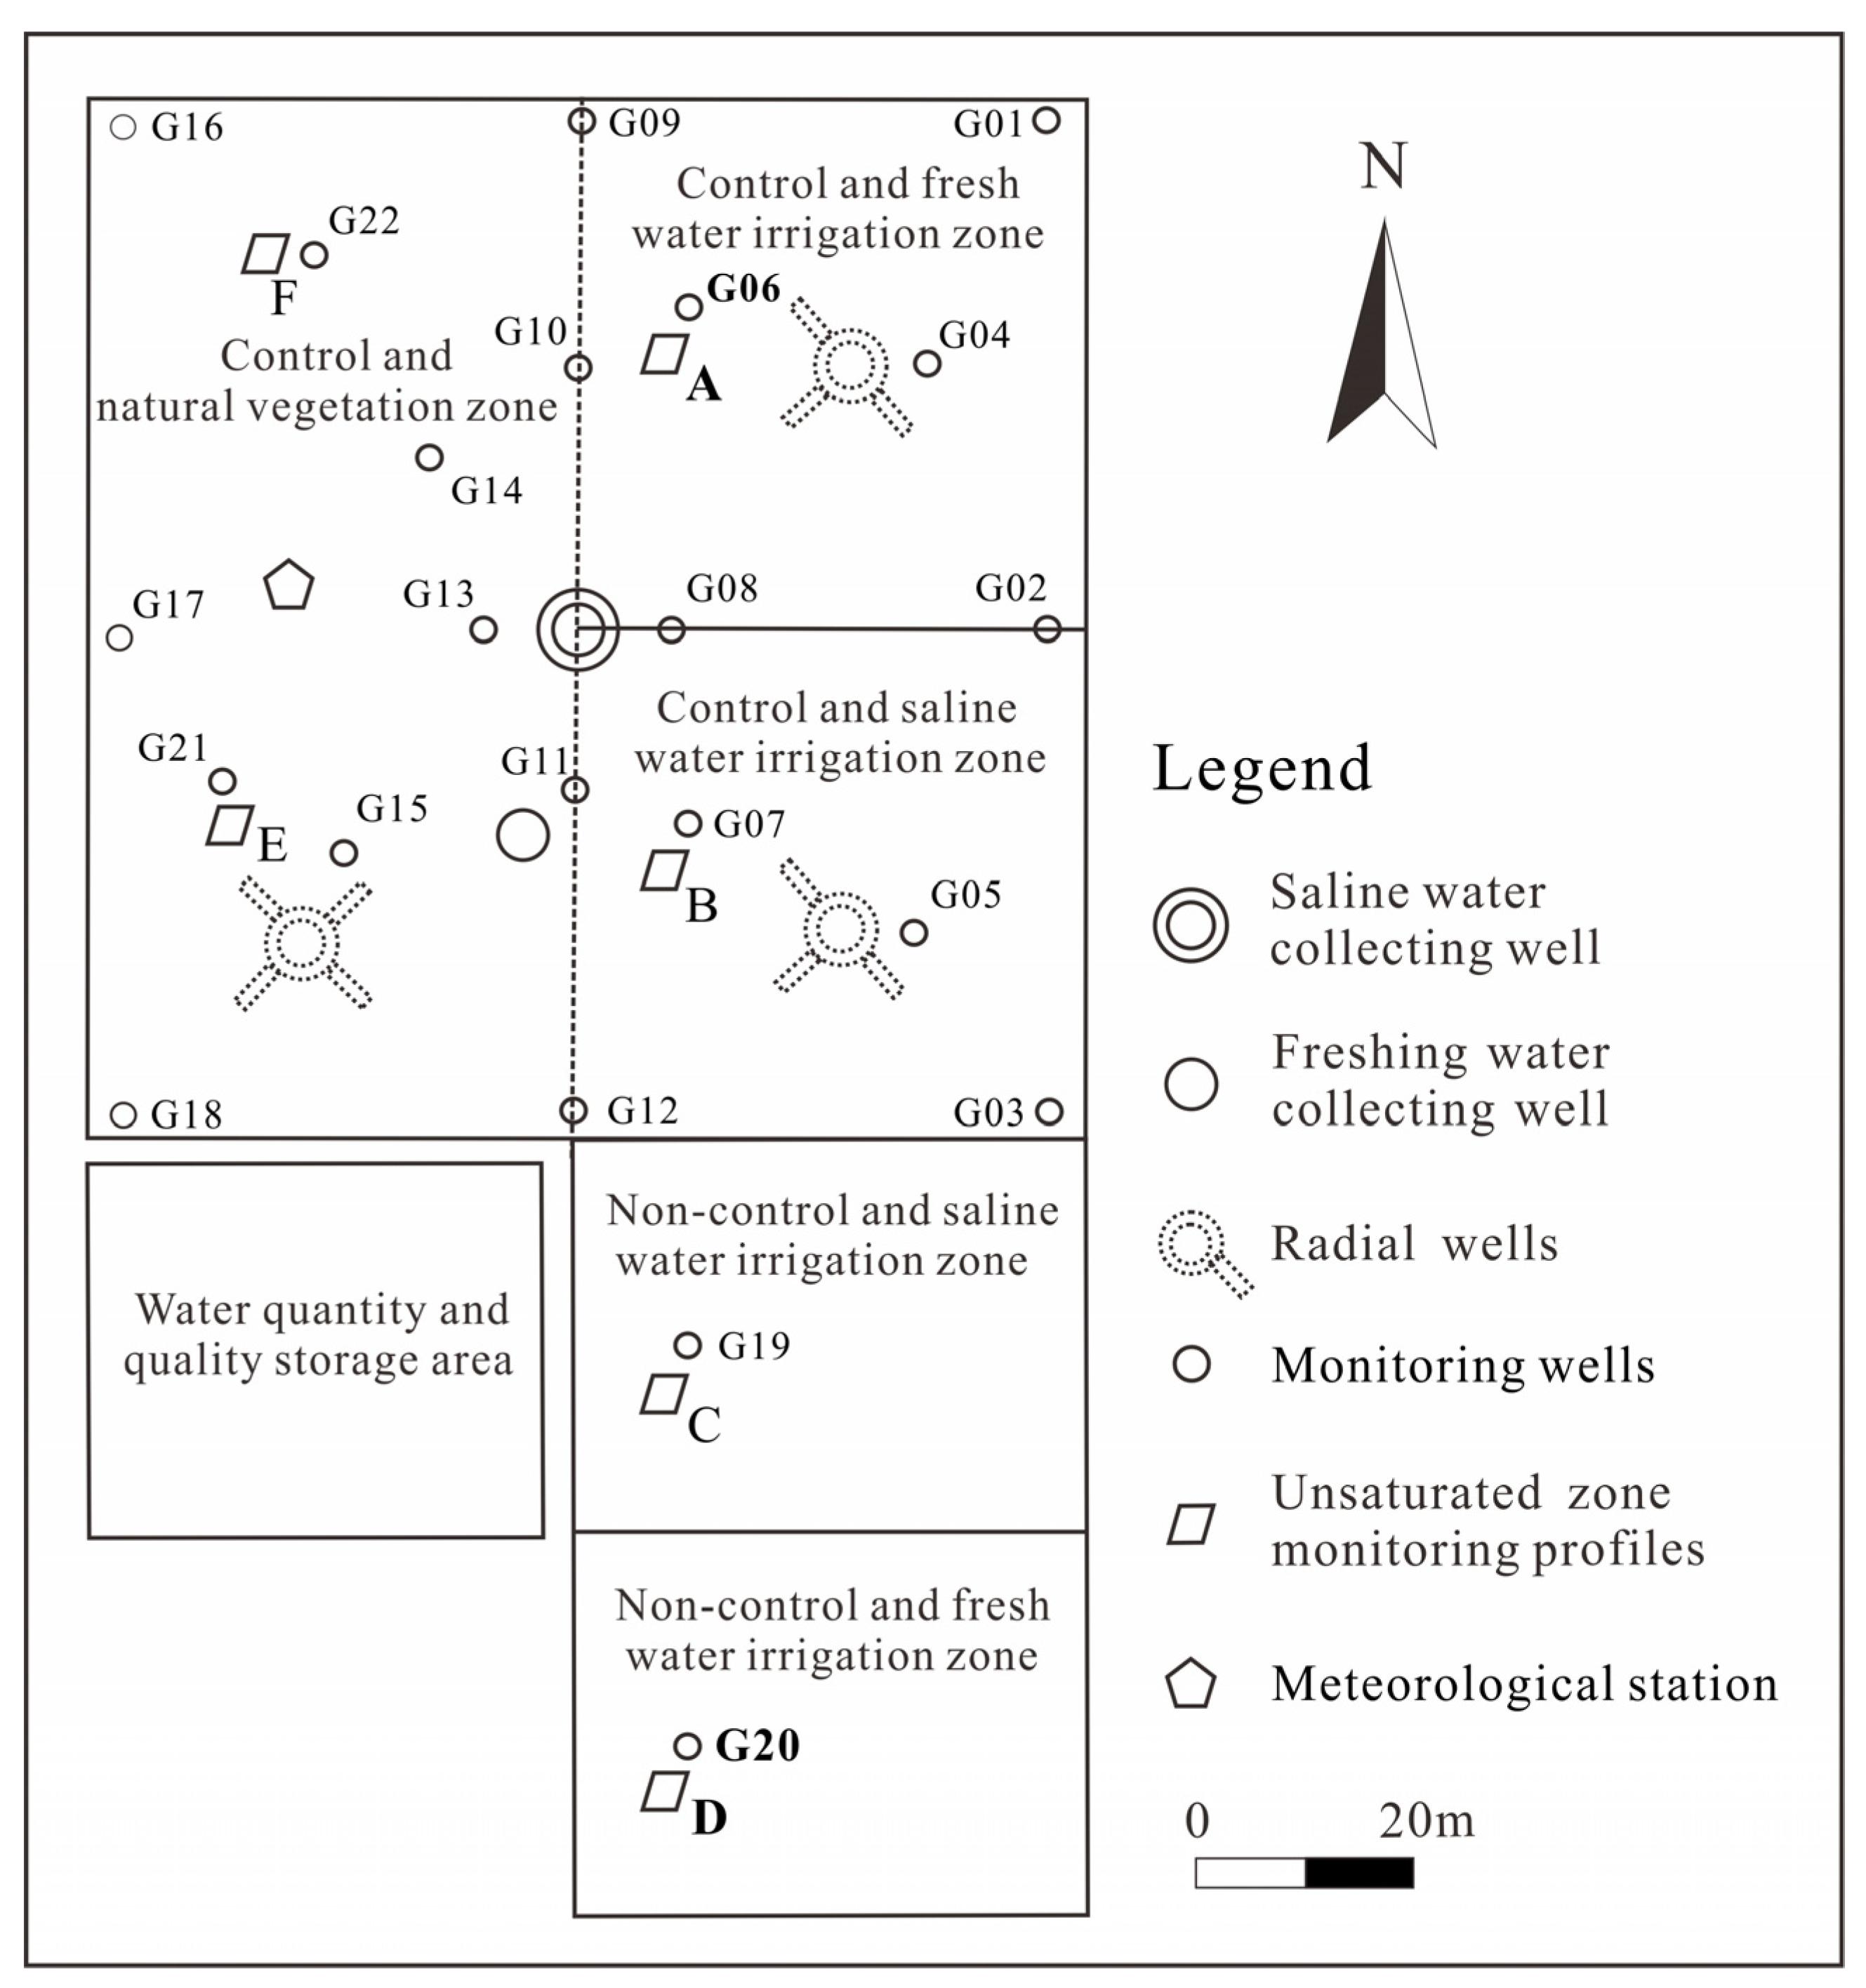
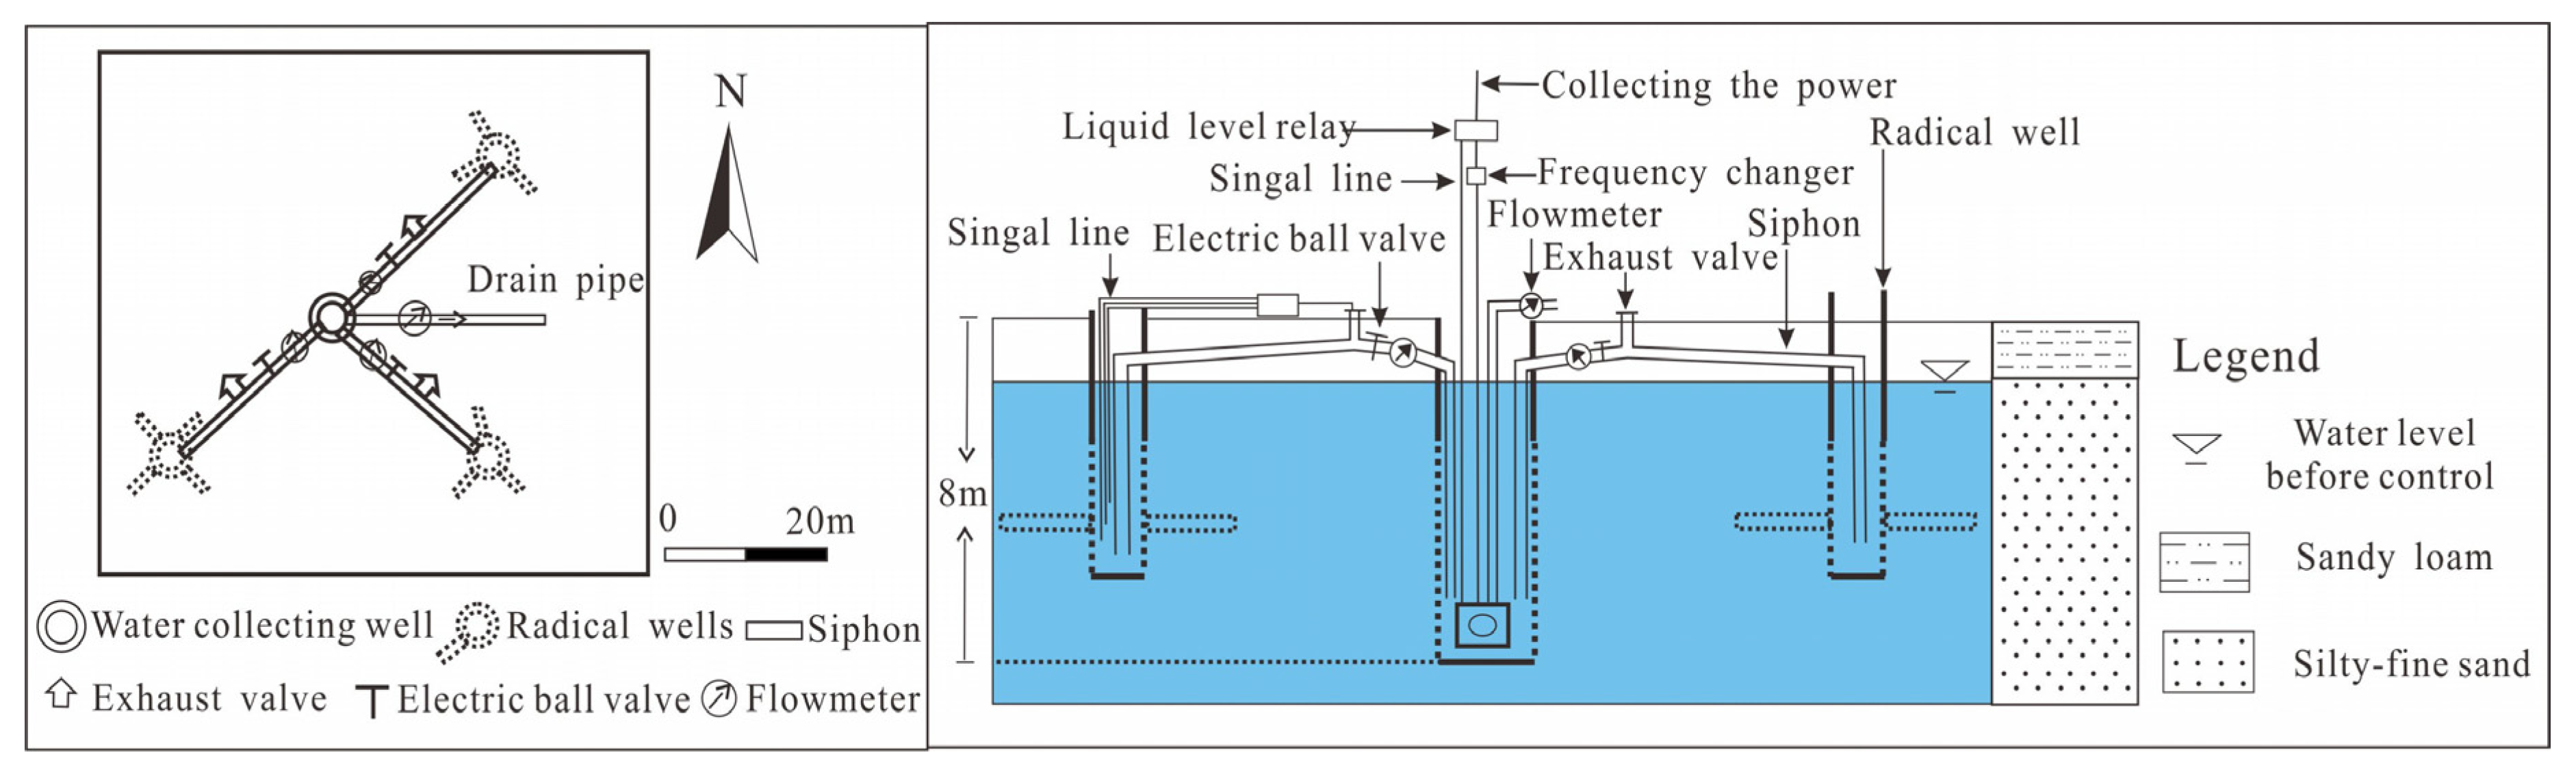
2.2. Experimental Design

Six functional zones were arranged in the experimental base in May 2019, including the freshwater irrigation zone with groundwater level control and the brackish-water irrigation zone with groundwater level control (Figure 2). This study primarily focused on the freshwater irrigation zone with groundwater level control (also referred to as the control zone) and the freshwater irrigation zone without groundwater level control (also referred to as the non-control zone). The non-control zone was located about 70 m to the south of the control zone. The terrain around the two zones was flat and the groundwater hydraulic gradient was small. There was no significant difference in the change characteristics of meteorology, irrigation and groundwater level and the lithologic structure conditions between two zones without the influence of the control system. The groundwater level in the control zone was controlled using the groundwater control system (Figure 3), which consisted primarily of a collection subsystem and an intelligent control subsystem. The collection subsystem consisted of a major pumping well and three radial wells around the major pumping well. Each radial well consisted of a large major vertical water intake well and 3–4 horizontal radial tubes, which had a length of 4 m and a diameter of 150 cm. The main pumping well was connected to each radial well by a siphon tube. The highest part of each siphon tube was located near the main pumping well, where an air vent was equipped. These siphon tubes were gradually lowered from the position of the highest part to the position about 50 cm above the bottom of wells, helping achieve that that the air in tubes discharged completely and that any remaining water in the tubes was automatically discharged when the water pumping stopped. The intelligent control subsystem was composed of electric ball valves, liquid level relays, AC contactors, and signal lines. Ranges of groundwater depths in wells were set according to requirements for the ecological l groundwater depth in the control zone. During the operation of the groundwater control system, when the groundwater depth in a well increased to the lower limit of the threshold (or decreased to the upper limit of the threshold), the system automatically stopped (started) pumping. In addition, the system was able to automatically adjust the pumping rate in response to the changes in the irrigation infiltration volume and lateral recharge, thus ensuring that the groundwater depth in the experimental area was within the appropriate depth range of ecological groundwater.
From July to August 2020, an irrigation experiment with groundwater control was carried out in the experimental base. The control target for the groundwater depth in the control zone was 1.7–1.9 m. Based on the results from previous pumping test at the irrigation experiment site, the control targets for groundwater depths at the major pumping well and wells F01, F02, and F03 were set at 6–7 m, 4.5–5.5 m, 4.5–5.5 m, and 4–5 m, respectively. The TDS content of the freshwater in the freshwater irrigation zones with and without water level control was 0.6 g/L. The two zones had the same irrigation time, frequency, and water volume. With a water volume of 900–1050 m3/hm2 in each irrigation, the total irrigation volume was 4500–5250 m3/hm2 in the groundwater control period, when the groundwater control system operated continuously.

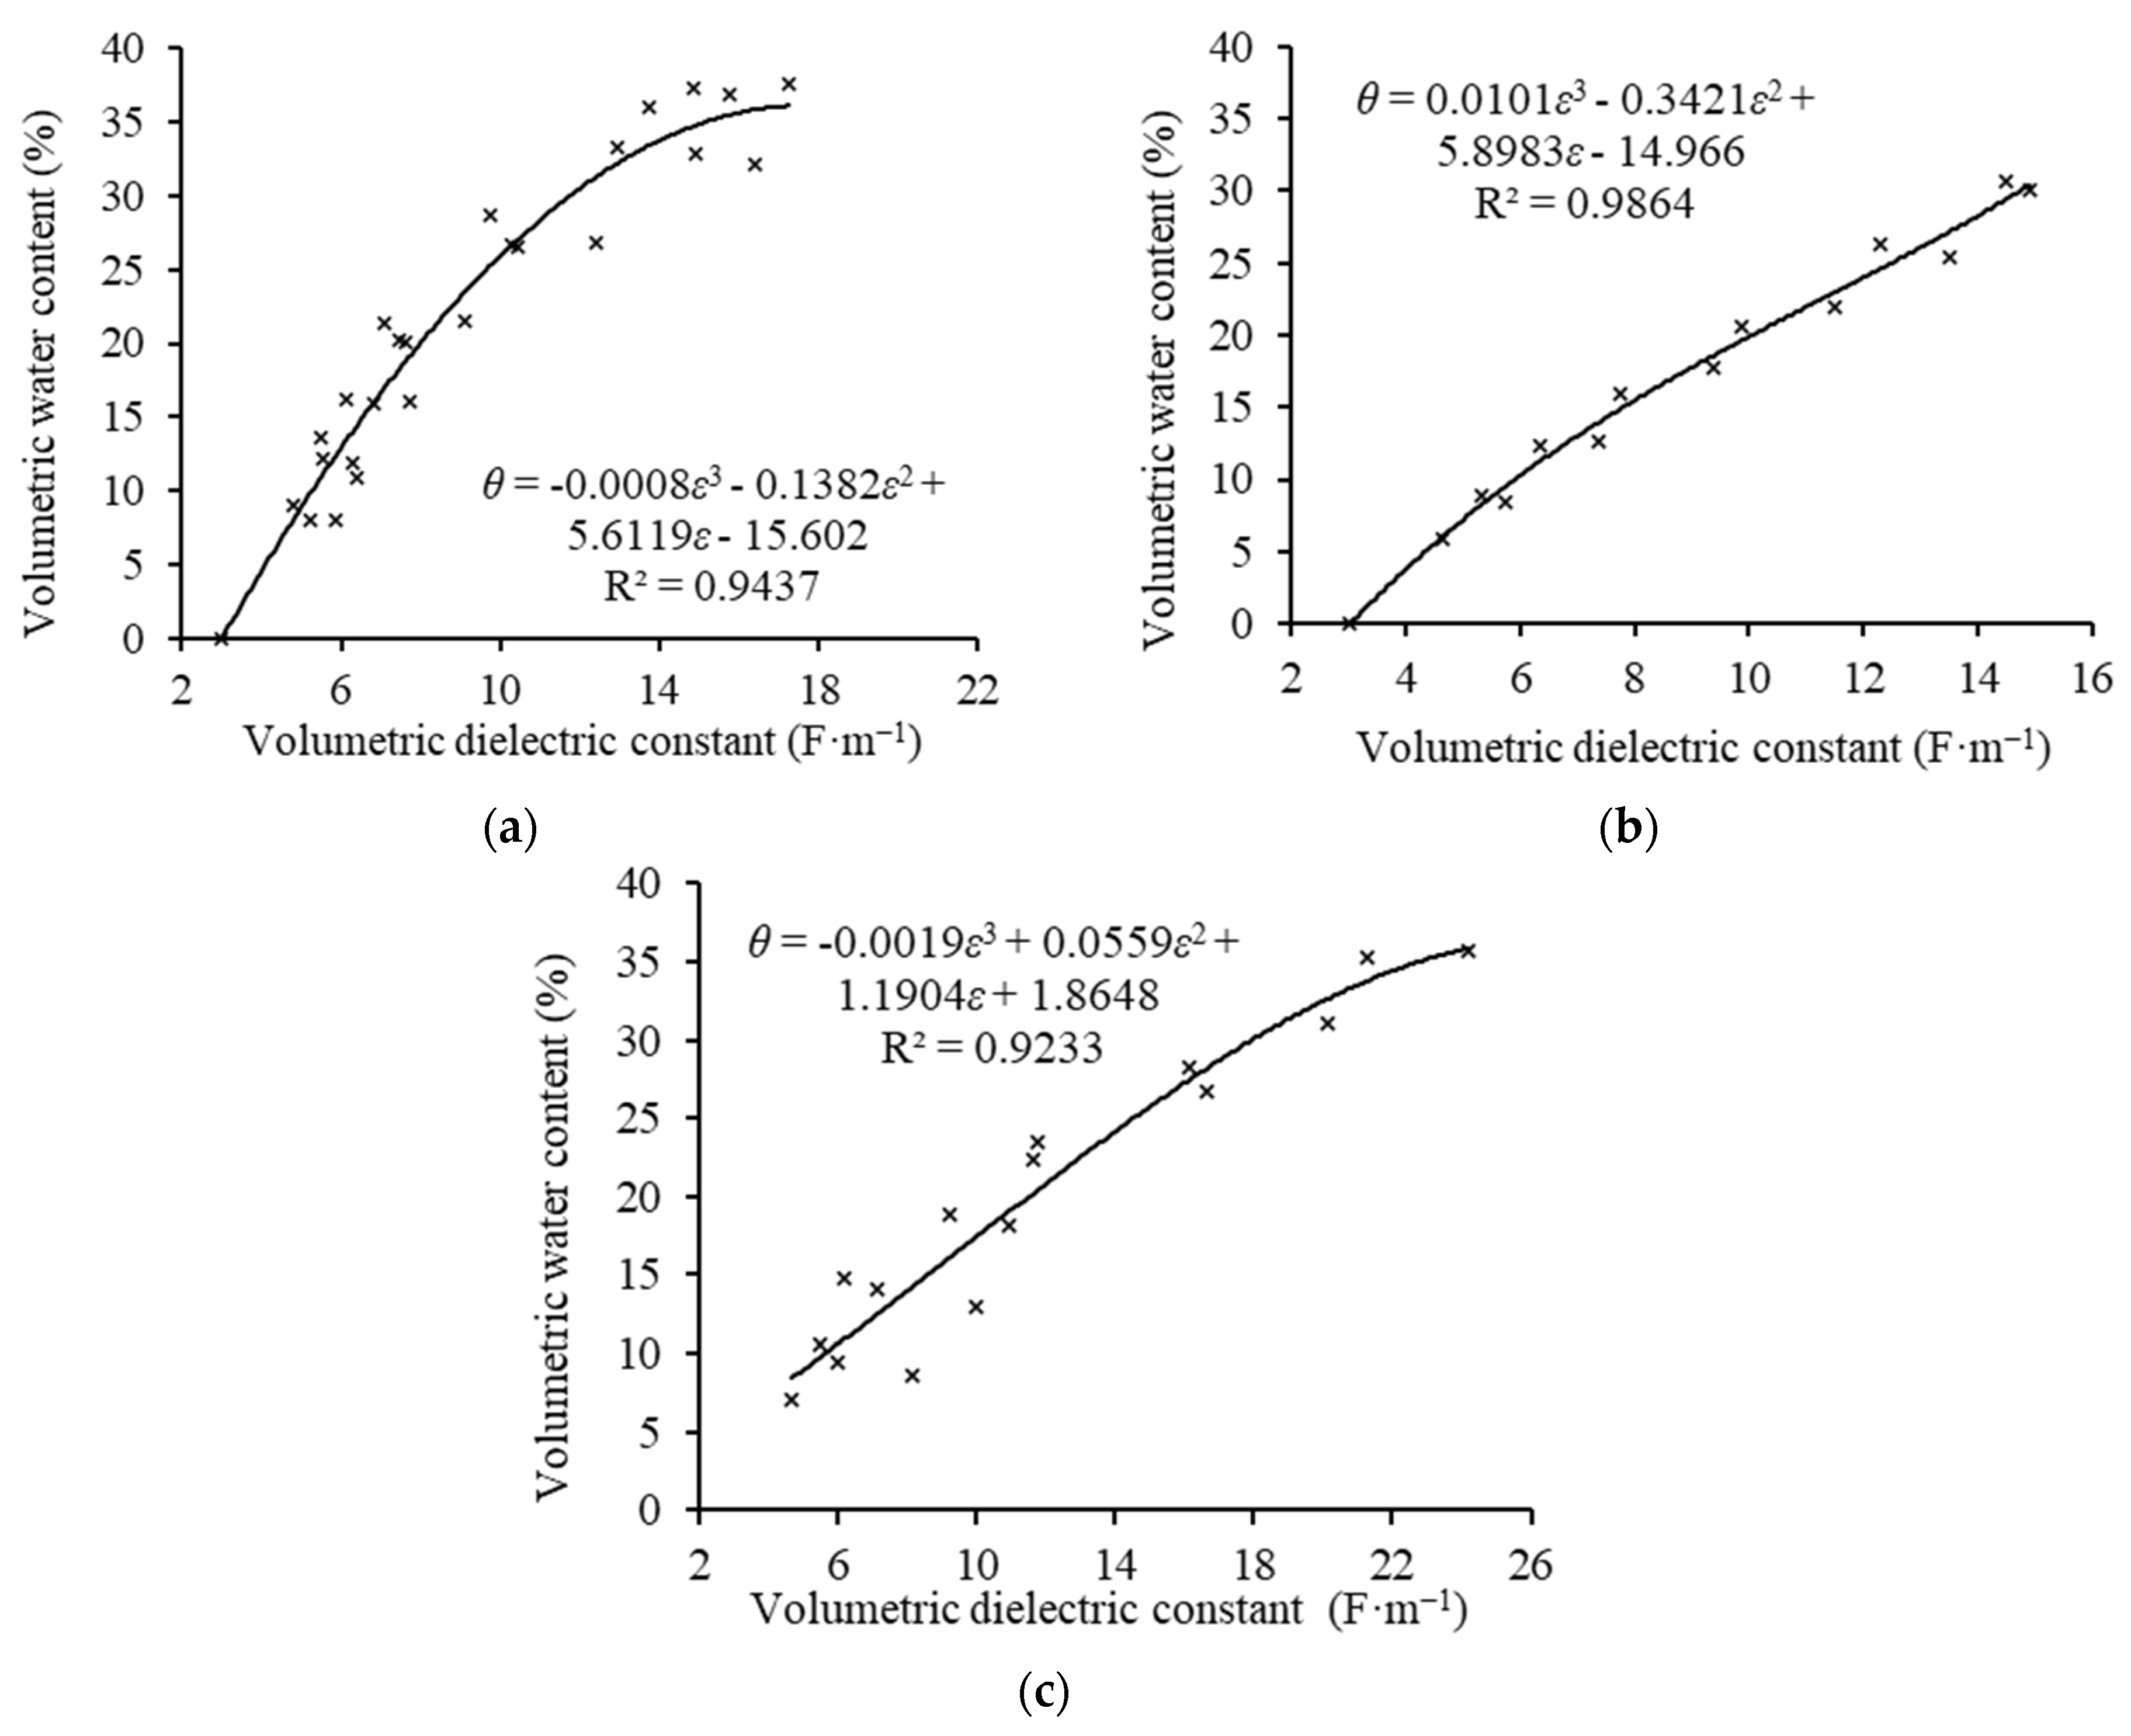
2.3. Data Acquisition

Monitoring profiles A and D for the aeration zone and groundwater monitoring holes G06 and G20 were deployed in the control zone and non-control zone, respectively. The monitoring points were located in the middle of the radial well and the boundary in each zone and could represent the groundwater depth and the distribution of water and salinity in the aeration zone in the two zones (Figure 2).
A HOBO weather station (made in Onset Company, Boston City, MA, USA) was employed to monitor meteorological elements, such as temperature and rainfall, in the experimental base. Solinst LTC sensors (made in Solinst Company, Toronto City, ON, Canada) were arranged in groundwater monitoring holes to automatically monitor the groundwater level. 5TE sensors and TEROS 21 soil water potential sensors (made in METER Company, Pullman City, WA, USA)were deployed at different depths along the monitoring profiles (A–F) of the aeration zone, with the former used to monitor moisture content, electrical conductivity, and temperature and the latter used to monitor the matric potential. The two sets of sensors were arranged at an interval of 20 cm vertically overall, with 5TE sensors densely deployed at a depth of 10 cm. The above elements were monitored at a frequency of 30 min/time.
Before and after the groundwater control period (on 29 June and 4 September), soil samples were collected at depths of 10 cm, 20 cm, 30 cm, 40 cm, 60 cm, 80 cm, 100 cm, and 120 cm along soil profiles near the representative monitoring points in the two zones. The samples were collected for three times in each sampling, and water-soluble salt was tested by quality method. The average value of the samples was used as the result.

2.4. Data Processing

5TE sensors can directly yield the values of volumetric dielectric constant, temperature, and volumetric electrical conductivity. Since there is a close correlation between volumetric moisture content and volumetric dielectric constant, this study determined the volumetric moisture content of the soil samples by establishing regression curve equations using the measured values of volumetric moisture content and volumetric dielectric constant. The detailed process is as follows: (1) The sandy loam, loam, and silty sands in the aeration zone were sampled three times individually using a cutting ring. The dry weight and wet weight of the soil samples of each lithology were determined, followed by the calculation of their dry bulk density, which was then averaged to determine the dry bulk density of each lithology; (2) A certain amount of each lithology was dried, pulverized, and sieved (80 mesh) and was then compacted in a plastic bucket; (3) The same weight of water was weighed and poured into the three plastic buckets, and the samples in the buckets were then stirred evenly and compacted. Afterward, the dielectric constant of the soil samples was measured using the 5TE sensors. After being dried, a small quantity of samples was measured to determine their wet weight and dry weight, followed by the calculation of their volumetric moisture content; (4) Water was added to each bucket again, followed by the operations in step (3); (5) Based on the dielectric constant measured using the sensors and the volumetric moisture content calculated using the drying method, the equations of the regression curves of volumetric moisture content (θ) vs. volumetric dielectric constant ( ε b ) of the three lithologies were established (Figure 4). Then, a series of volumetric moisture content values were calculated using the equations and a series of volumetric dielectric constant values.
The 5TE sensor can directly yield the electrical conductivity of soil mass. In this study, the soil pore water electrical conductivity was estimated by the Hilhorst model [30], as shown in Equation (1):
σ p = ε p σ b ε b ε 0   ( θ   >   0.1   m 3 · m 3 )
where σ p is the pore water electrical conductivity (mS·cm−1), σ b is the volumetric electrical conductivity (mS·cm−1), θ is the volumetric moisture content (%), ε b is the volumetric dielectric constant and ε 0 is the dielectric constant when σ b is 0. ε 0 was set to 6 in this study. ε p is the dielectric constant of pore water and was calculated by Equation (2):
ε p = 80.3 0.37 × ( T soil 20 )
where Tsoil is the soil temperature (°C).
In this study, only precipitation data with an odd number of times of precipitation greater than 5 mm were counted, and 24 h sliding average processing was used for temperature data.
In this study, Microsoft Excel 2019 was used for data organization, and Excel 2019 and CorelDRAW2018 were employed to plot.

3. Results

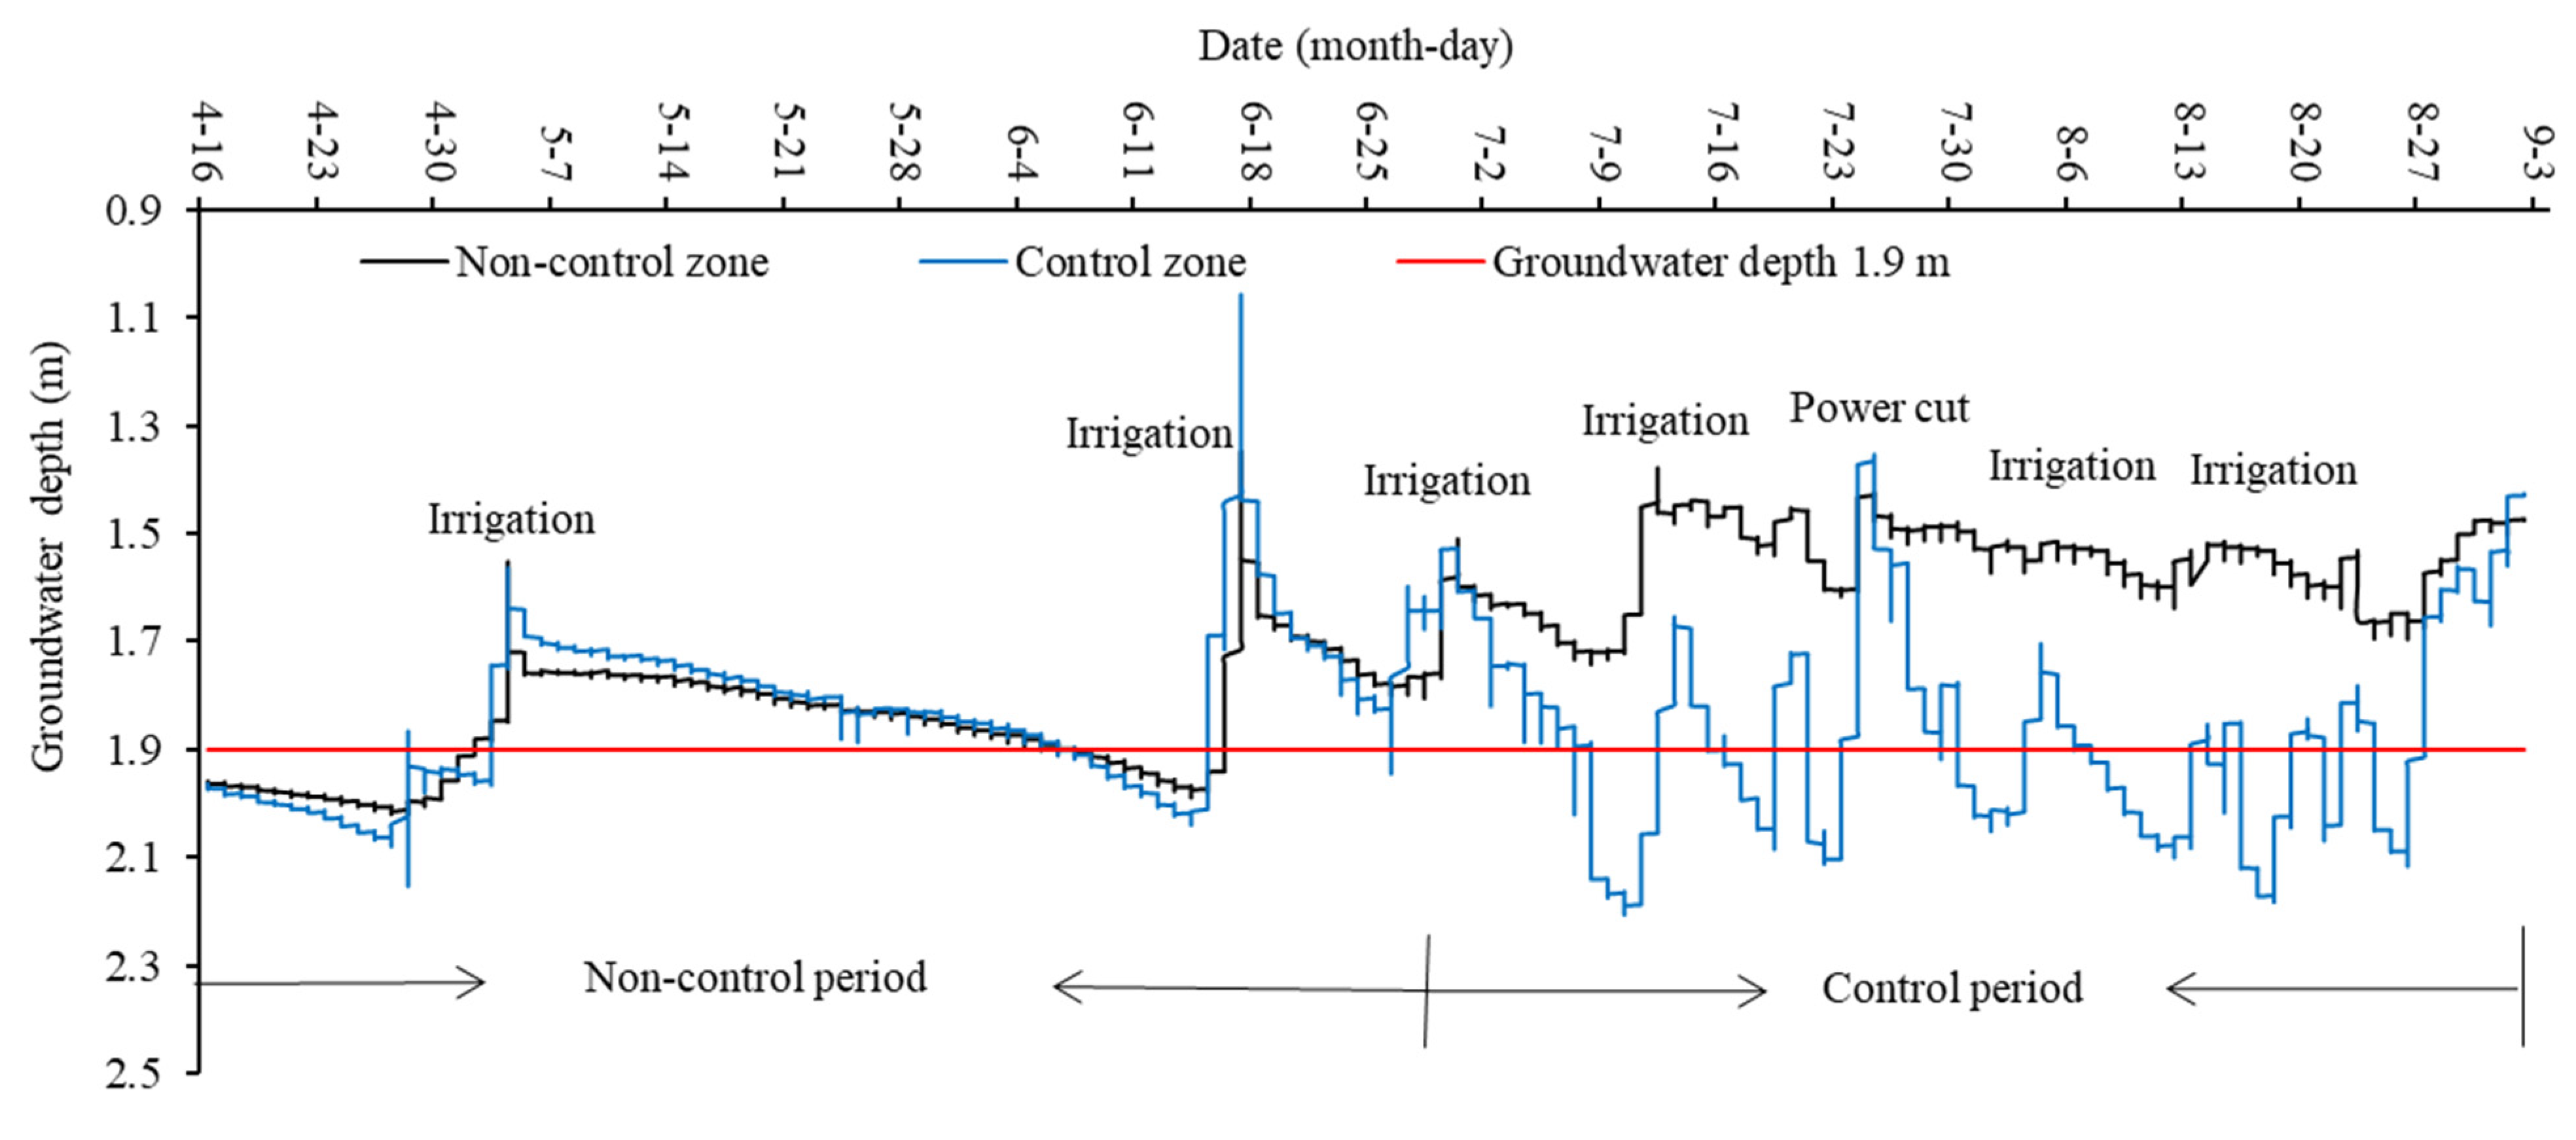
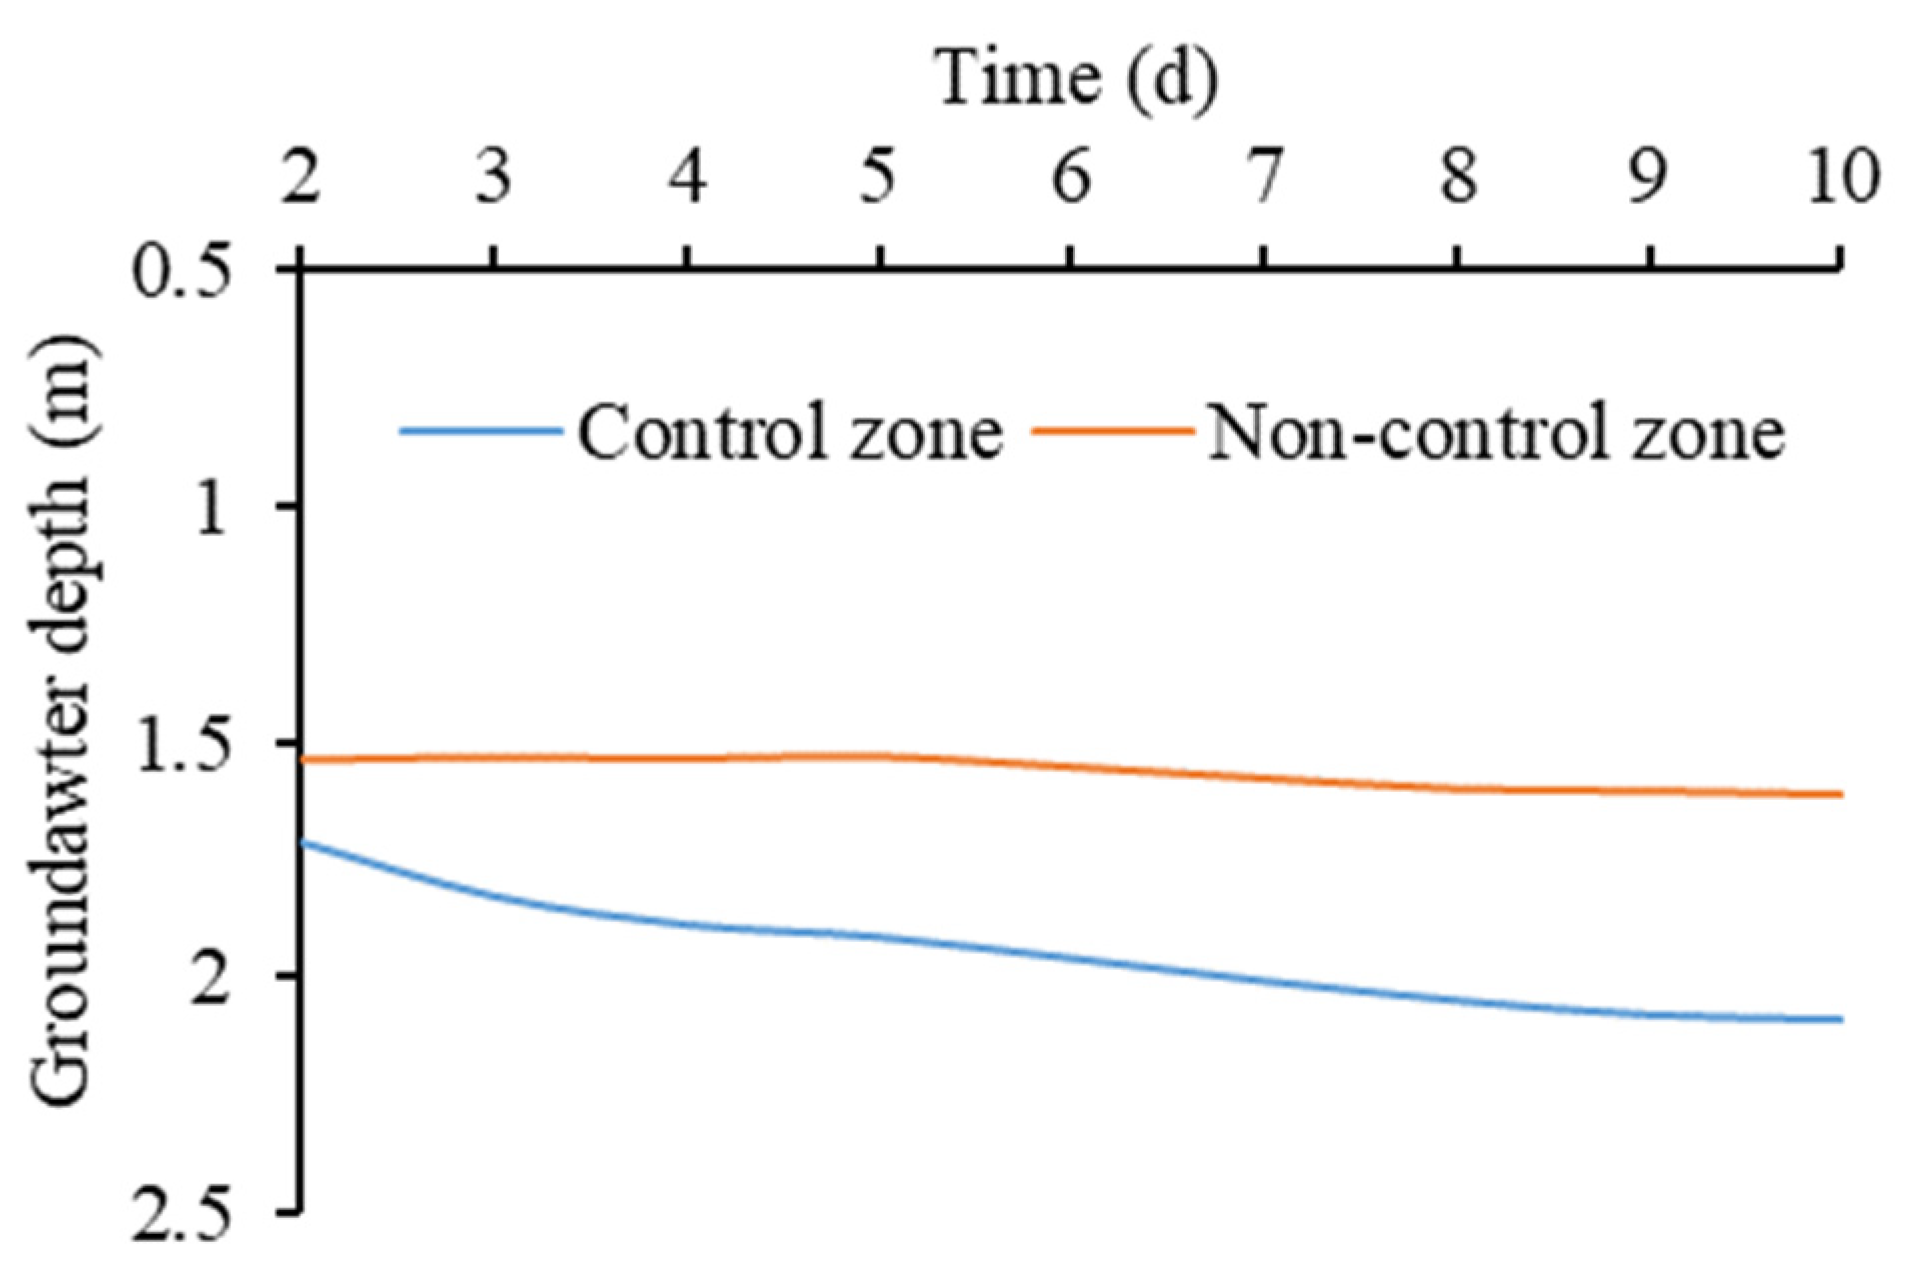
3.1. Changes in Groundwater Depth

The groundwater control system mitigated the salt accumulation in the topsoil primarily by increasing the groundwater depth. Figure 5 shows the changes in the groundwater depths in the typical monitoring holes G06 and G20, which were located in the control and non-control zones, respectively. According to this figure, during the non-control period of groundwater (from mid-April to the end of June), the two zones exhibited the same changing trends of the groundwater depths, which decreased rapidly and then increased slowly after each irrigation and showed a downward trend overall with an increase in irrigation frequency. During this period, the groundwater depths in the two zones were maintained at about 1.9 m, indicating a low risk of salinization. During the control period of groundwater (from July to August), the groundwater depth in the non-control zone continued to show a downward trend due to irrigation effects and remained at about 1.5 m after mid-July. In contrast, the groundwater depth in the control zone briefly decreased and then rapidly increased after each irrigation under the influence of the groundwater control system, thus remaining at about 1.9 m during the control period. As shown by the comparison between Figure 1 and Figure 6, the groundwater depth in the control zone increased from 1.3–1.6 m to 1.8–2.1 m under the influence of the control system. Therefore, the control system effectively controlled the groundwater depth in the control zone at a certain range.

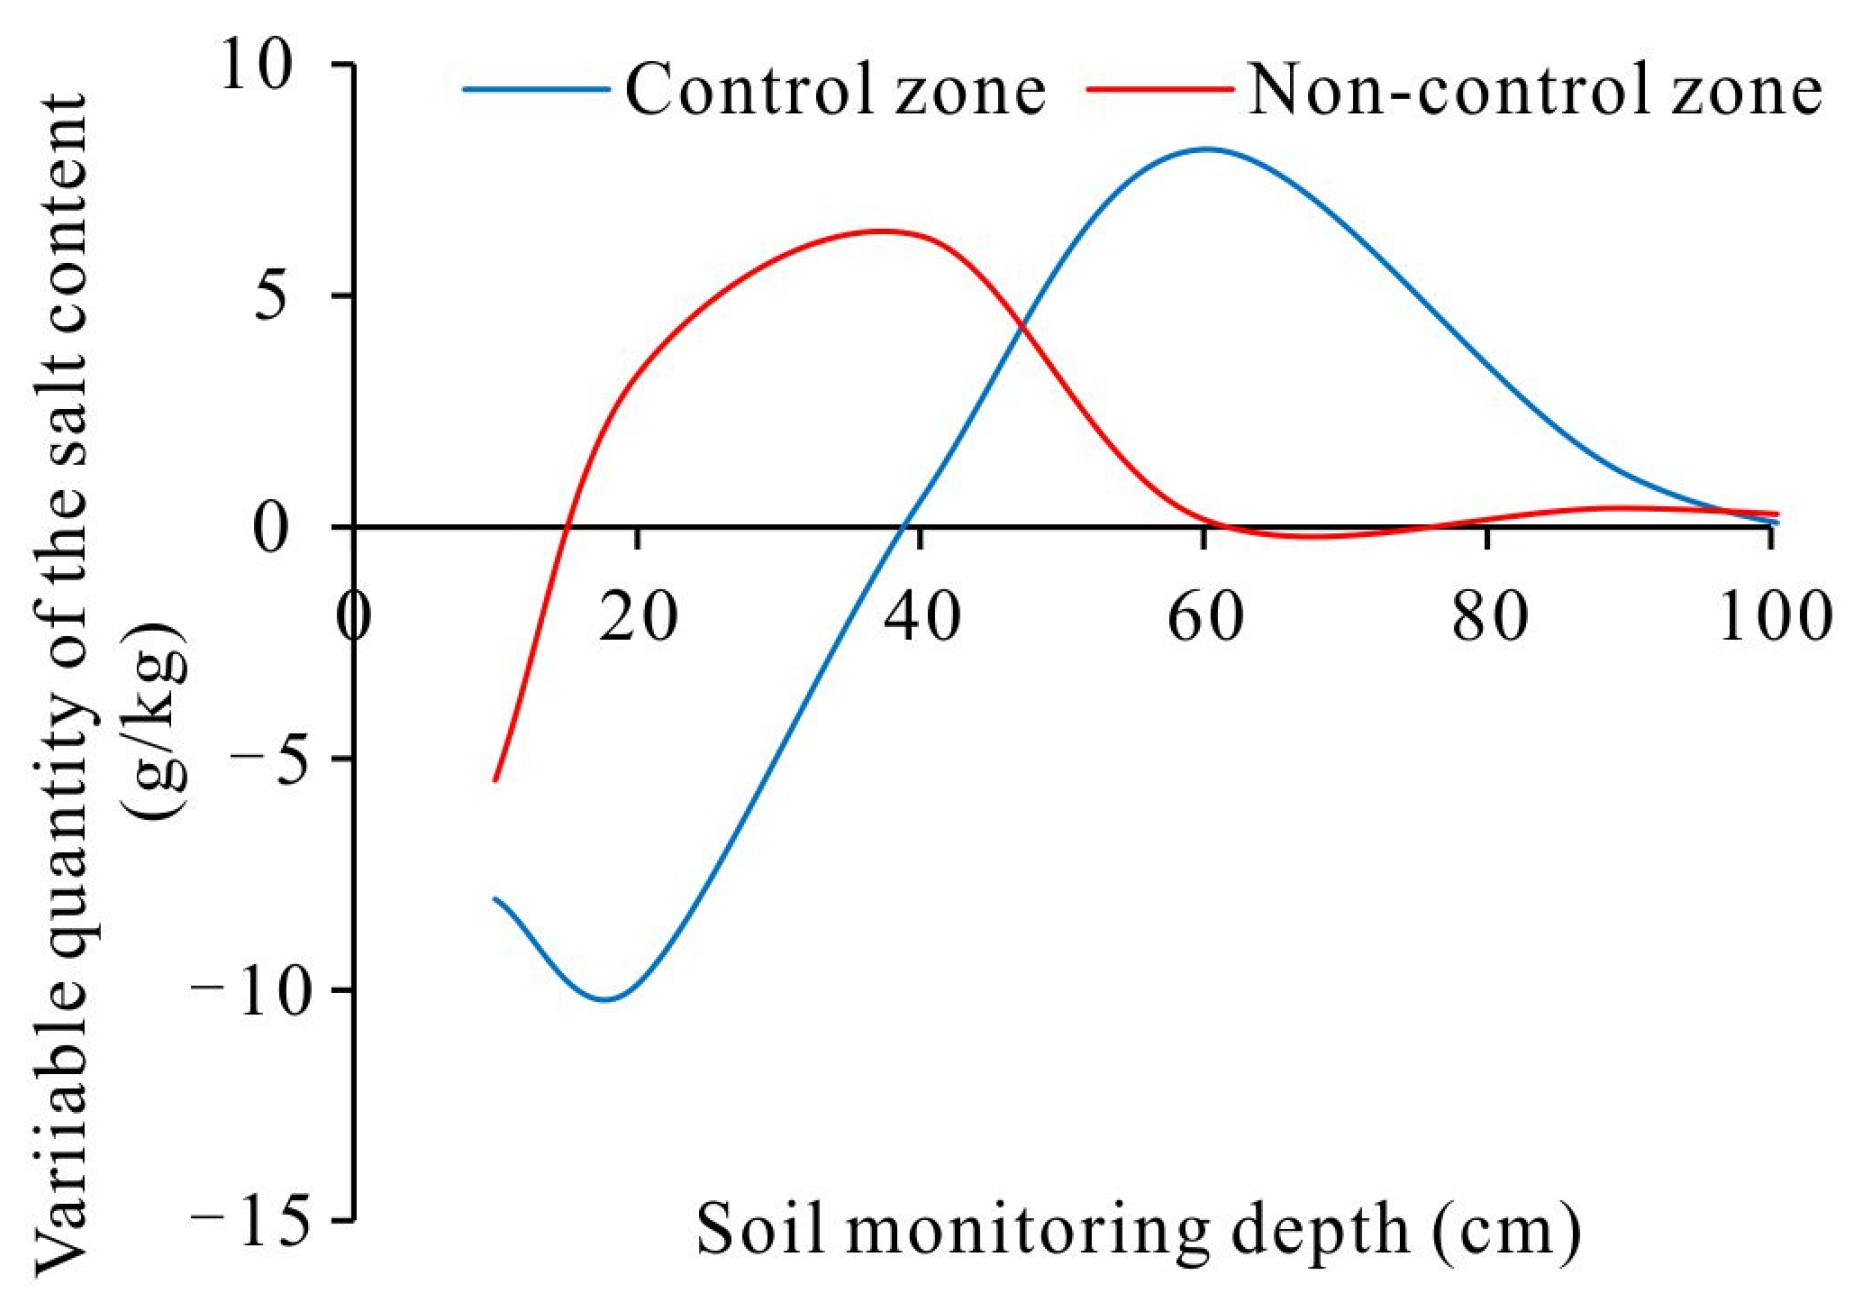
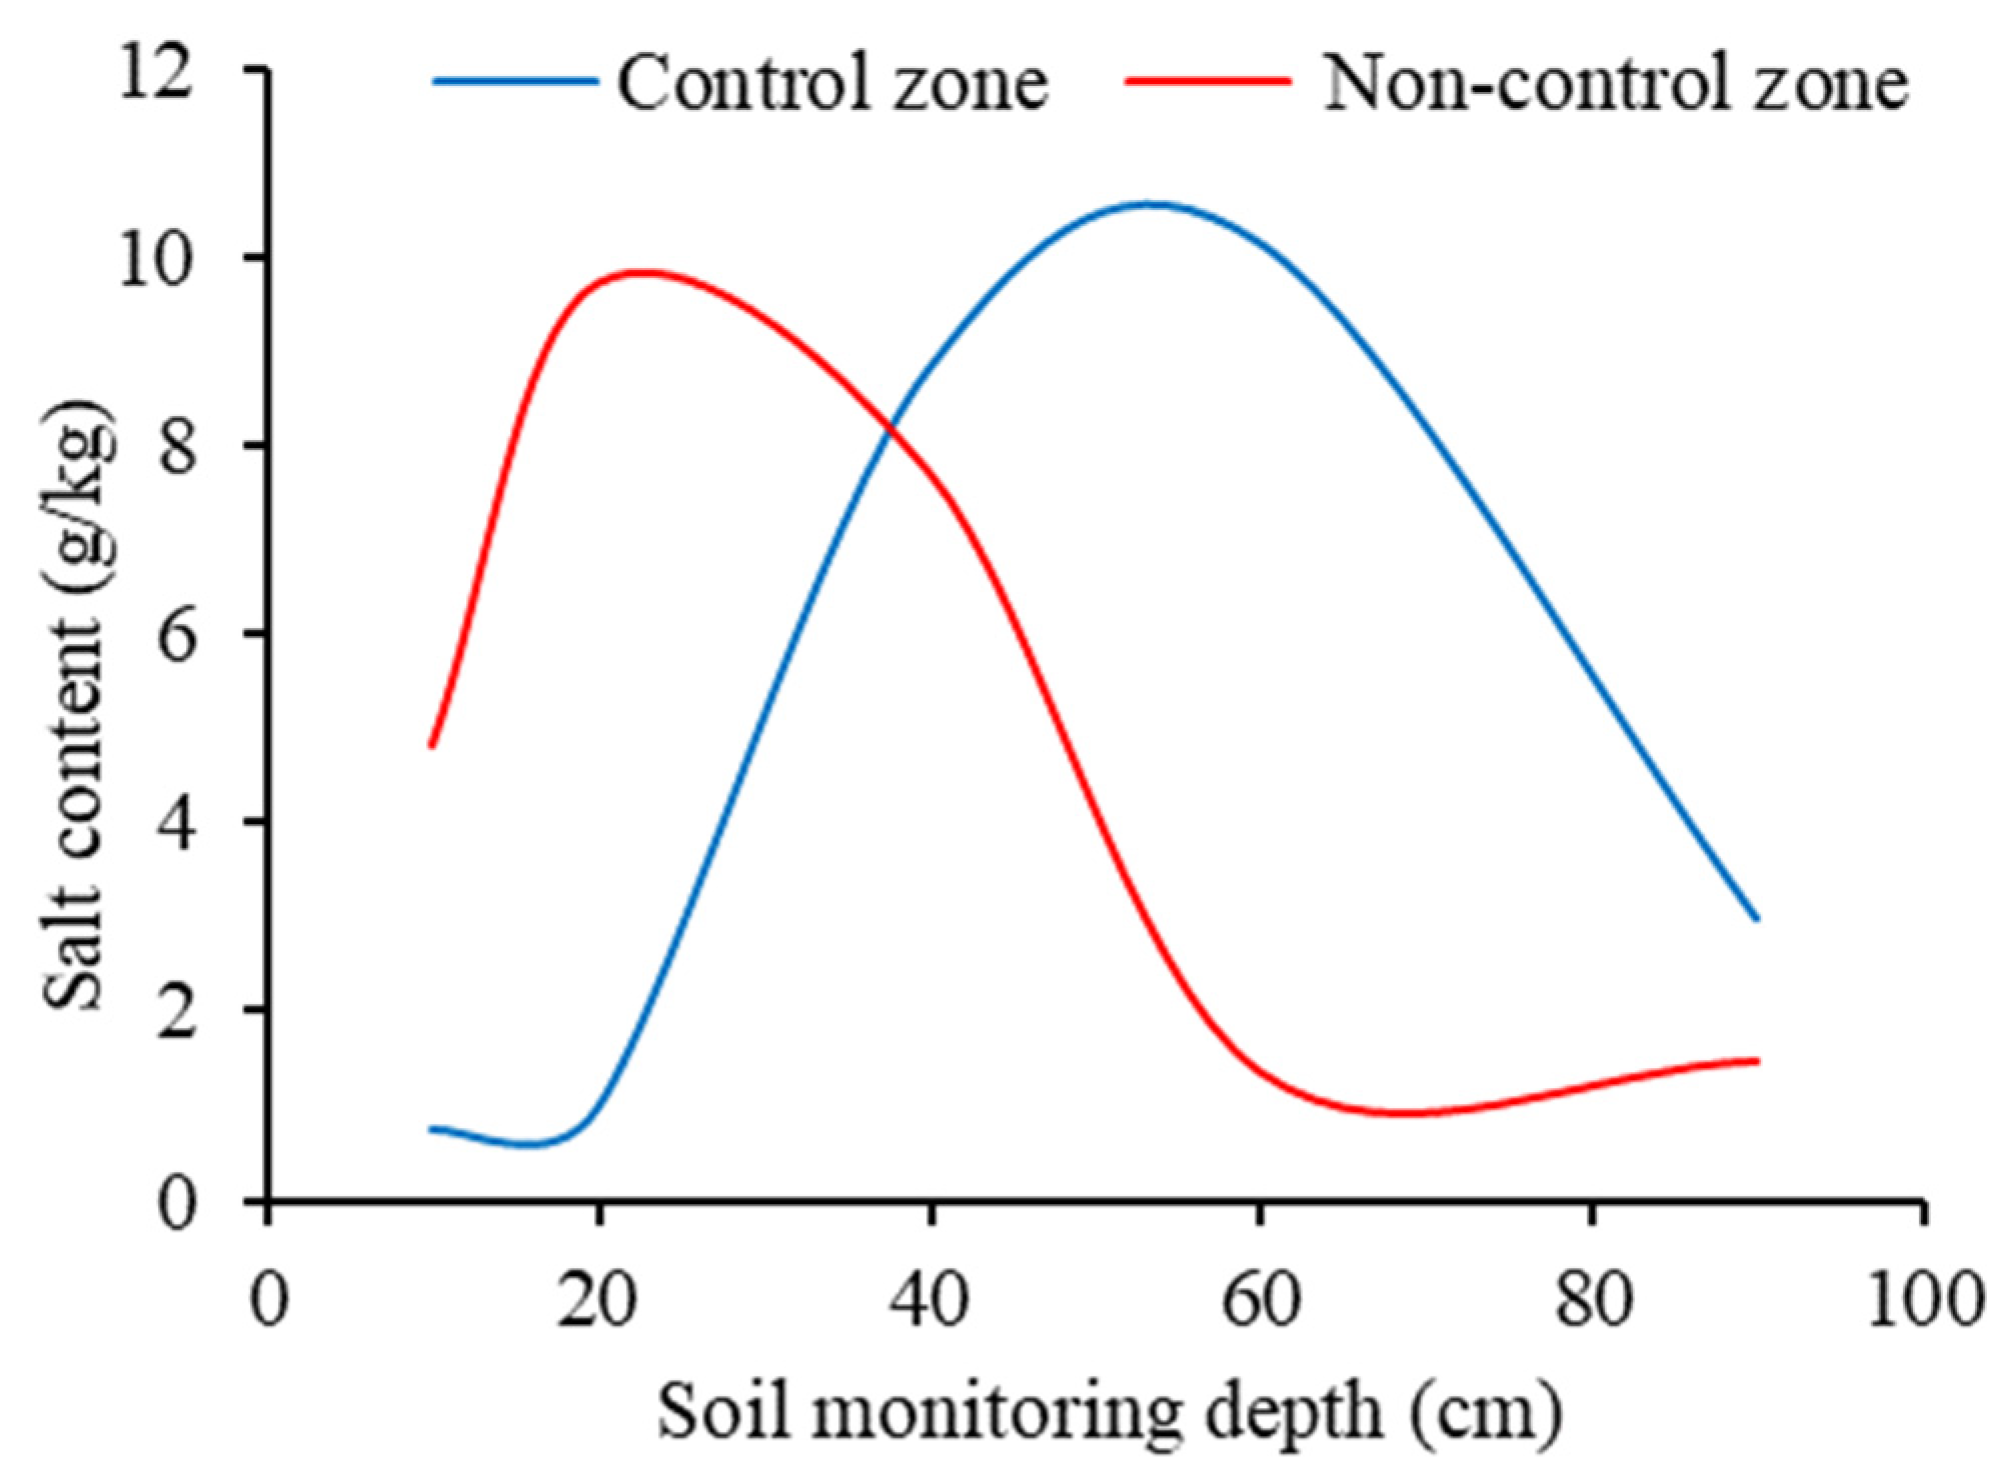
3.2. Changes in Soil Bulk Salt Content before and after the Control Period

The soil bulk salt content (which refers to the content of water-soluble salts in this study) is an important indicator reflecting the degree of soil salinization and can be used to determine the condition of soil salt accumulation over a period of time [31,32]. Figure 7 shows the variable quantity of the soil bulk salt content at different depths in the control and non-control zones before and after the groundwater control period (on 1 July and 1 September, respectively; positive and negative values denote an increase and a decrease, respectively). For the control zone, the topsoil bulk salt content decreased by 0~10 g/kg, while the soil bulk salt content at a depth of more than 40 cm increased by 0–8 g/kg, with the maximum increased amplitude of up to 9 g/kg occurring at a depth of 60 cm (Figure 7). For the non-control zone, the topsoil bulk salt content at a depth of 0–15 cm decreased by 0~5 g/kg, and the soil bulk salt content at a depth of more than 15 cm increased by 0~6 g/kg, with the maximum increased amplitude occurring at a depth of 30–40 cm. Therefore, the groundwater control system effectively restricted the topsoil salt accumulation, with the depth of the soil accumulation layer depth increasing from 30~40 cm to about 60 cm. As shown by the soil bulk salt content at different depths in the two zones after the groundwater control (Figure 8), the topsoil bulk salt content in the non-control zone was greater than 5 g/kg, while that in the control zone decreased to below the salt-tolerance threshold (5.0 g/kg) for crops.
Water is the carrier for salt migration, and water potential provides the energy basis for water migration. Water always flows from places with high water potential to those with low water potential [33,34]. In this study, the total water potential of the topsoil involved primarily the gravitational potential energy and matrix potential, and the gravitational potential energy of the surface was set to 0 kpa. As shown in the distribution of the total water potential along the soil profiles in the late stage of the groundwater control period (Figure 9), the total water potential along the aeration zone profile of the non-control zone gradually decreased from deep to shallow parts, thus forming energy channels for the transport of water and salts from the groundwater to the topsoil. In contrast, the total water potential along the aeration zone profile of the control zone was similar at a depth of 40–60 cm. As a result, no continuous energy channels for the transport of water and salts from the groundwater to the topsoil were formed. These results indicate that the groundwater control system effectively reduced the transport amount of water and salts from the groundwater to the topsoil.
Table 1 shows the variable quantity of the soil moisture content at different depths in the control and non-control zones 2 days and 10 days after irrigation within an irrigation cycle during the groundwater control period. According to this table, the soil moisture content at different depths in the two zones decreased to varying degrees, especially at a depth of 20 cm. This result indicates that the topsoil in the two zones experienced fairly intense evaporation and had similar evapotranspiration capacities. The decreased amplitude of moisture content in the control zone was high at a depth of 40 cm and low at a depth of 60 cm, while that in the non-control zone was low at depths of both 40 cm and 60 cm. This result reflects that the top of the supported capillary water in the non-control zone had a depth of 20–40 cm, while that in the control zone had a depth of 40–60 cm. Therefore, the depth of the top of the supported capillary water increased under the influence of the groundwater control system, further indicating that the groundwater control system can effectively reduce the amount of water and salts transported from groundwater to topsoil.

3.3. Changes in the Pore Water Electrical Conductivity of the Topsoil during the Groundwater Control Period

The salts in the soil that directly harm the crops refer to those dissolving in the soil solution. Therefore, it is more scientific to determine whether crops suffer salinity stress based on the soil pore water salt concentration [27,28]. There is a significantly positive correlation between pore water electrical conductivity and pore water salt concentration [35]. Therefore, the ECp of the soil can be used as the most direct indicator to reflect the effect of the groundwater control system on the soil salinity. The weighted average ECp of the soil at depths of 10 cm, 20 cm, and 40 cm was used to obtain the ECp of the topsoil. Figure 10 shows the variation amplitude of the ECp of the topsoil (base value: the ECp after the irrigation on July 13; positive and negative values denote an increase and a decrease, respectively) during the groundwater control period with the highest evaporation and irrigation frequency. According to this figure, the ECp of the topsoil in the control and non-control zones increased overall although it increased first and then decreased after each irrigation. This change process was the result of the effects of alternating irrigation-induced dilution and evapotranspiration-induced concentration of the topsoil solution. The ECp of the topsoil changed as follows: With an increase in the irrigation times, its decreased amplitude gradually decreased during the period of decrease (the irrigation-induced dilution stage), while its increased amplitude gradually increased during the period of increase (the evaporation-induced concentration stage). This occurred for the following reason. With the growth of crops, the soil evapotranspiration rate and the concentration rate of the topsoil solution gradually increased. Meanwhile, the accumulative topsoil salinity increased, and the irrigation-induced dilution gradually weakened. The overall increased amplitude of the ECp of the topsoil in the non-control zone was significantly greater than that in the control zone. This phenomenon occurred primarily in the evaporation-induced concentration stage, indicating that the groundwater control system mitigated the increasing rate of the topsoil pore water salt concentration primarily by reducing the increased amplitude of the ECp of the topsoil in the evaporation-induced concentration stage.

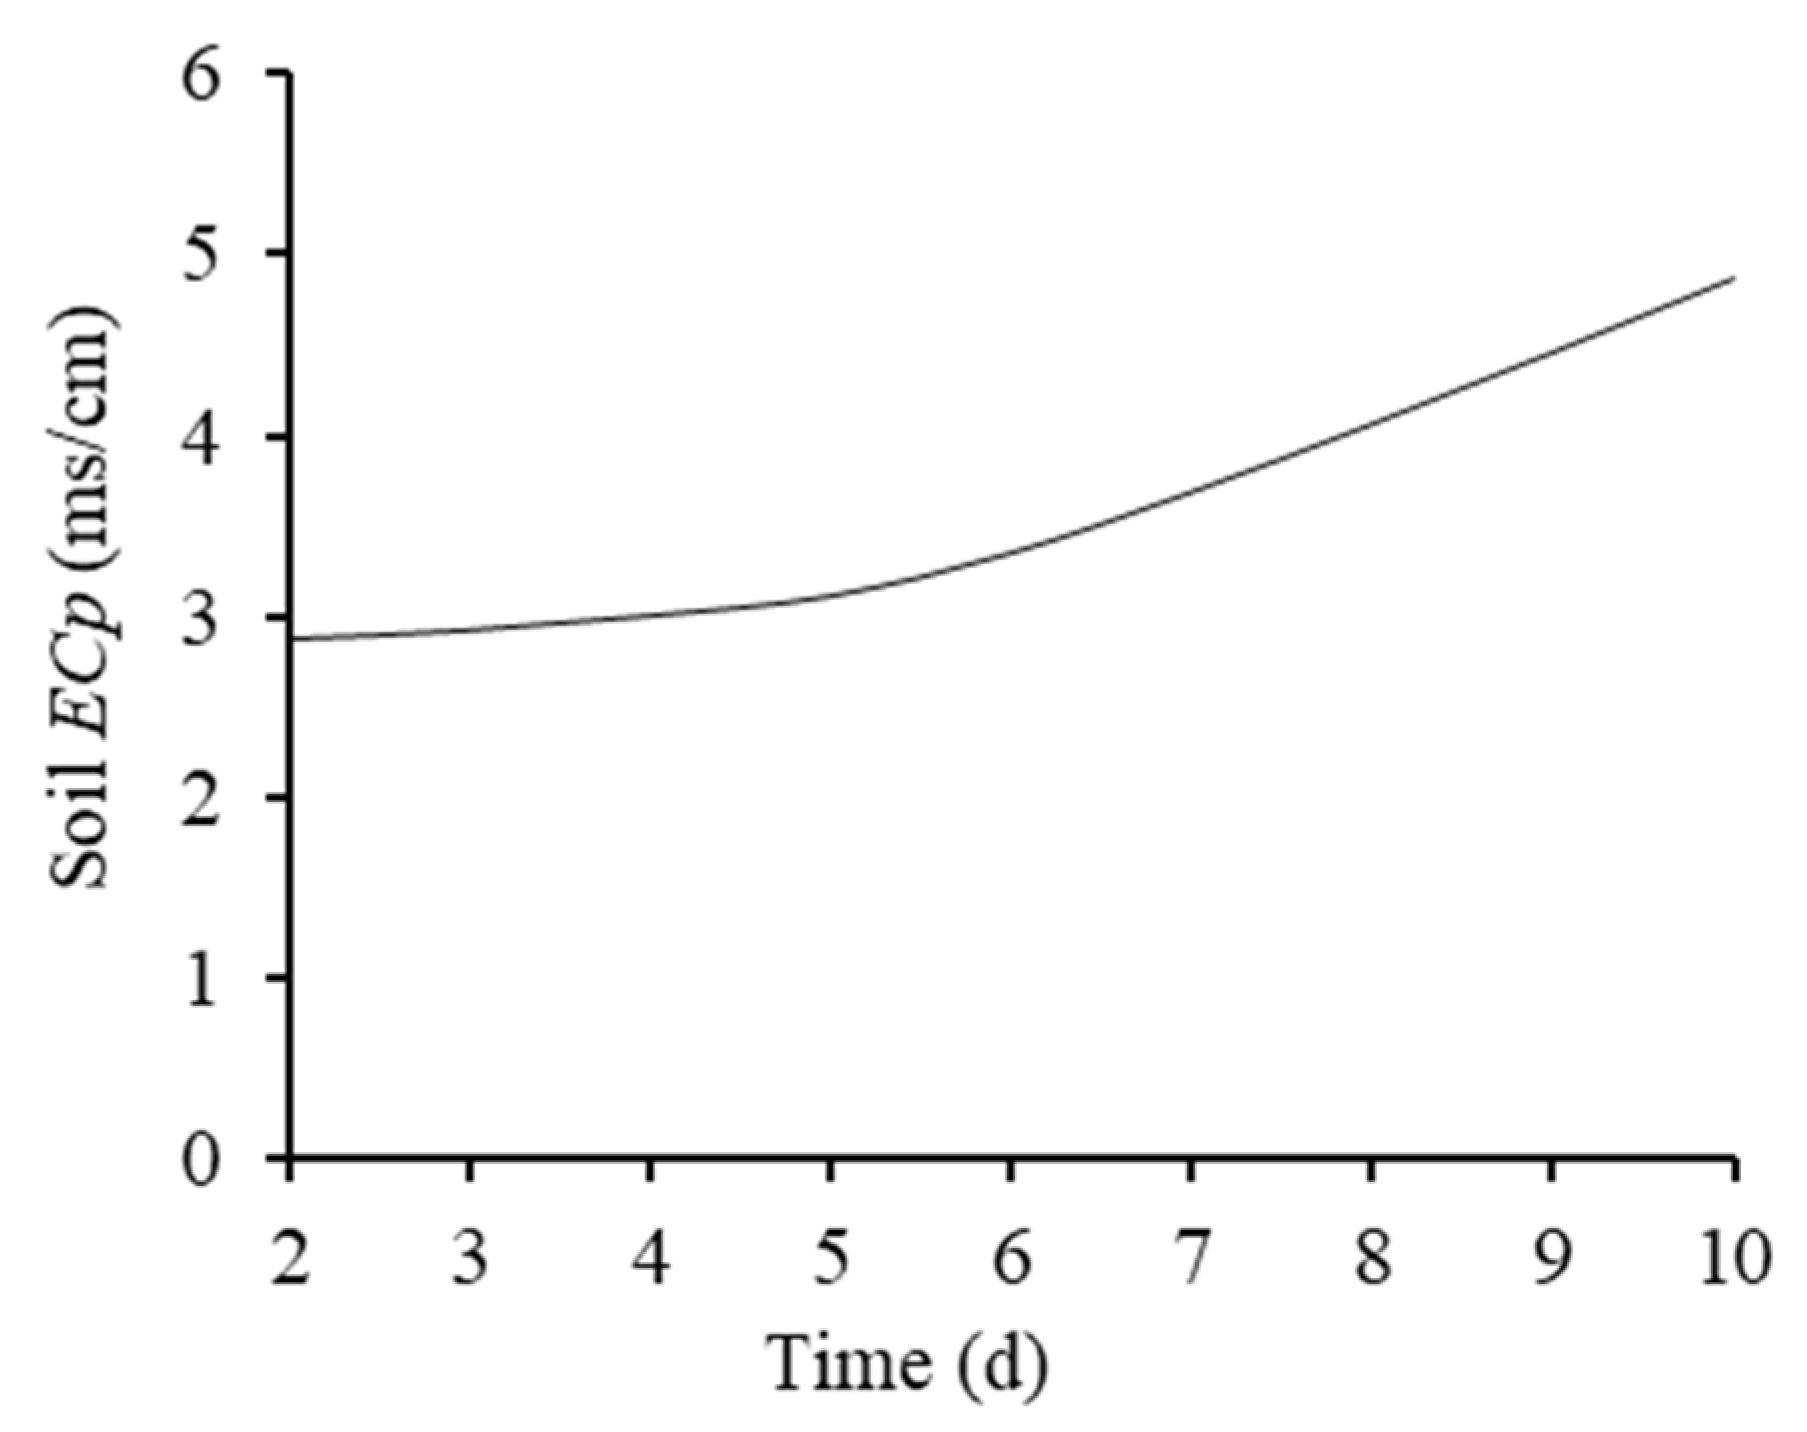
3.4. Changes in the ECp of the Topsoil in the Concentration Stage

3.4.1. Change Characteristics of the ECp of the Topsoil

Crops suffer the highest risks of salinity stress in the concentration stage of the topsoil solution, which is also a critical period when the groundwater control performance can be verified. As shown in Figure 10, the ECp of the topsoil generally reached the minimum 2 days after irrigation, which was, therefore, taken as the start of the concentration stage of the topsoil solution. The changes in the ECp of the topsoil in the concentration stage of the topsoil solution after irrigation on August 2 were analyzed as follows. Figure 11 shows the changing rates of the ECp of the topsoil in the control and non-control zones (base value: the ECp of the topsoil at the start of the salt concentration stage; positive and negative values denote an increase and a decrease, respectively). According to this figure, the average daily growth rate of the ECp of the topsoil in the control zone (3.01%) was significantly less than that in the non-control zone (4.21%) 3–10 days after the irrigation. The growth rates of the ECp of the topsoil in the control and non-control zones were 24.11% and 33.71%, respectively 10 days after the irrigation. The ECp of the topsoil in the control zone increased in two periods: the period of slow increase 3–5 days after the irrigation, with an average daily growth rate of 1.01%, and the period of rapid increase 5–10 days after irrigation, with an average daily growth rate of 4.22%. The ECp of the topsoil in the non-control zone increased in three periods: the period of slow increase 3–6 days after the irrigation, with an average daily growth rate of 2.59%; the period of rapid increase 6–8 days after the irrigation, with an average daily growth rate of 6.89%; and the period of fairly rapid increase 8–10 days after the irrigation, with an average daily growth rate of 4.79%. Therefore, the increased amplitude of the ECp of the topsoil in the control zone was significantly lower than that in the non-control zone 3–8 days after the irrigation, which was also a critical period when the groundwater control system mitigated the concentration rate of the soil solution.

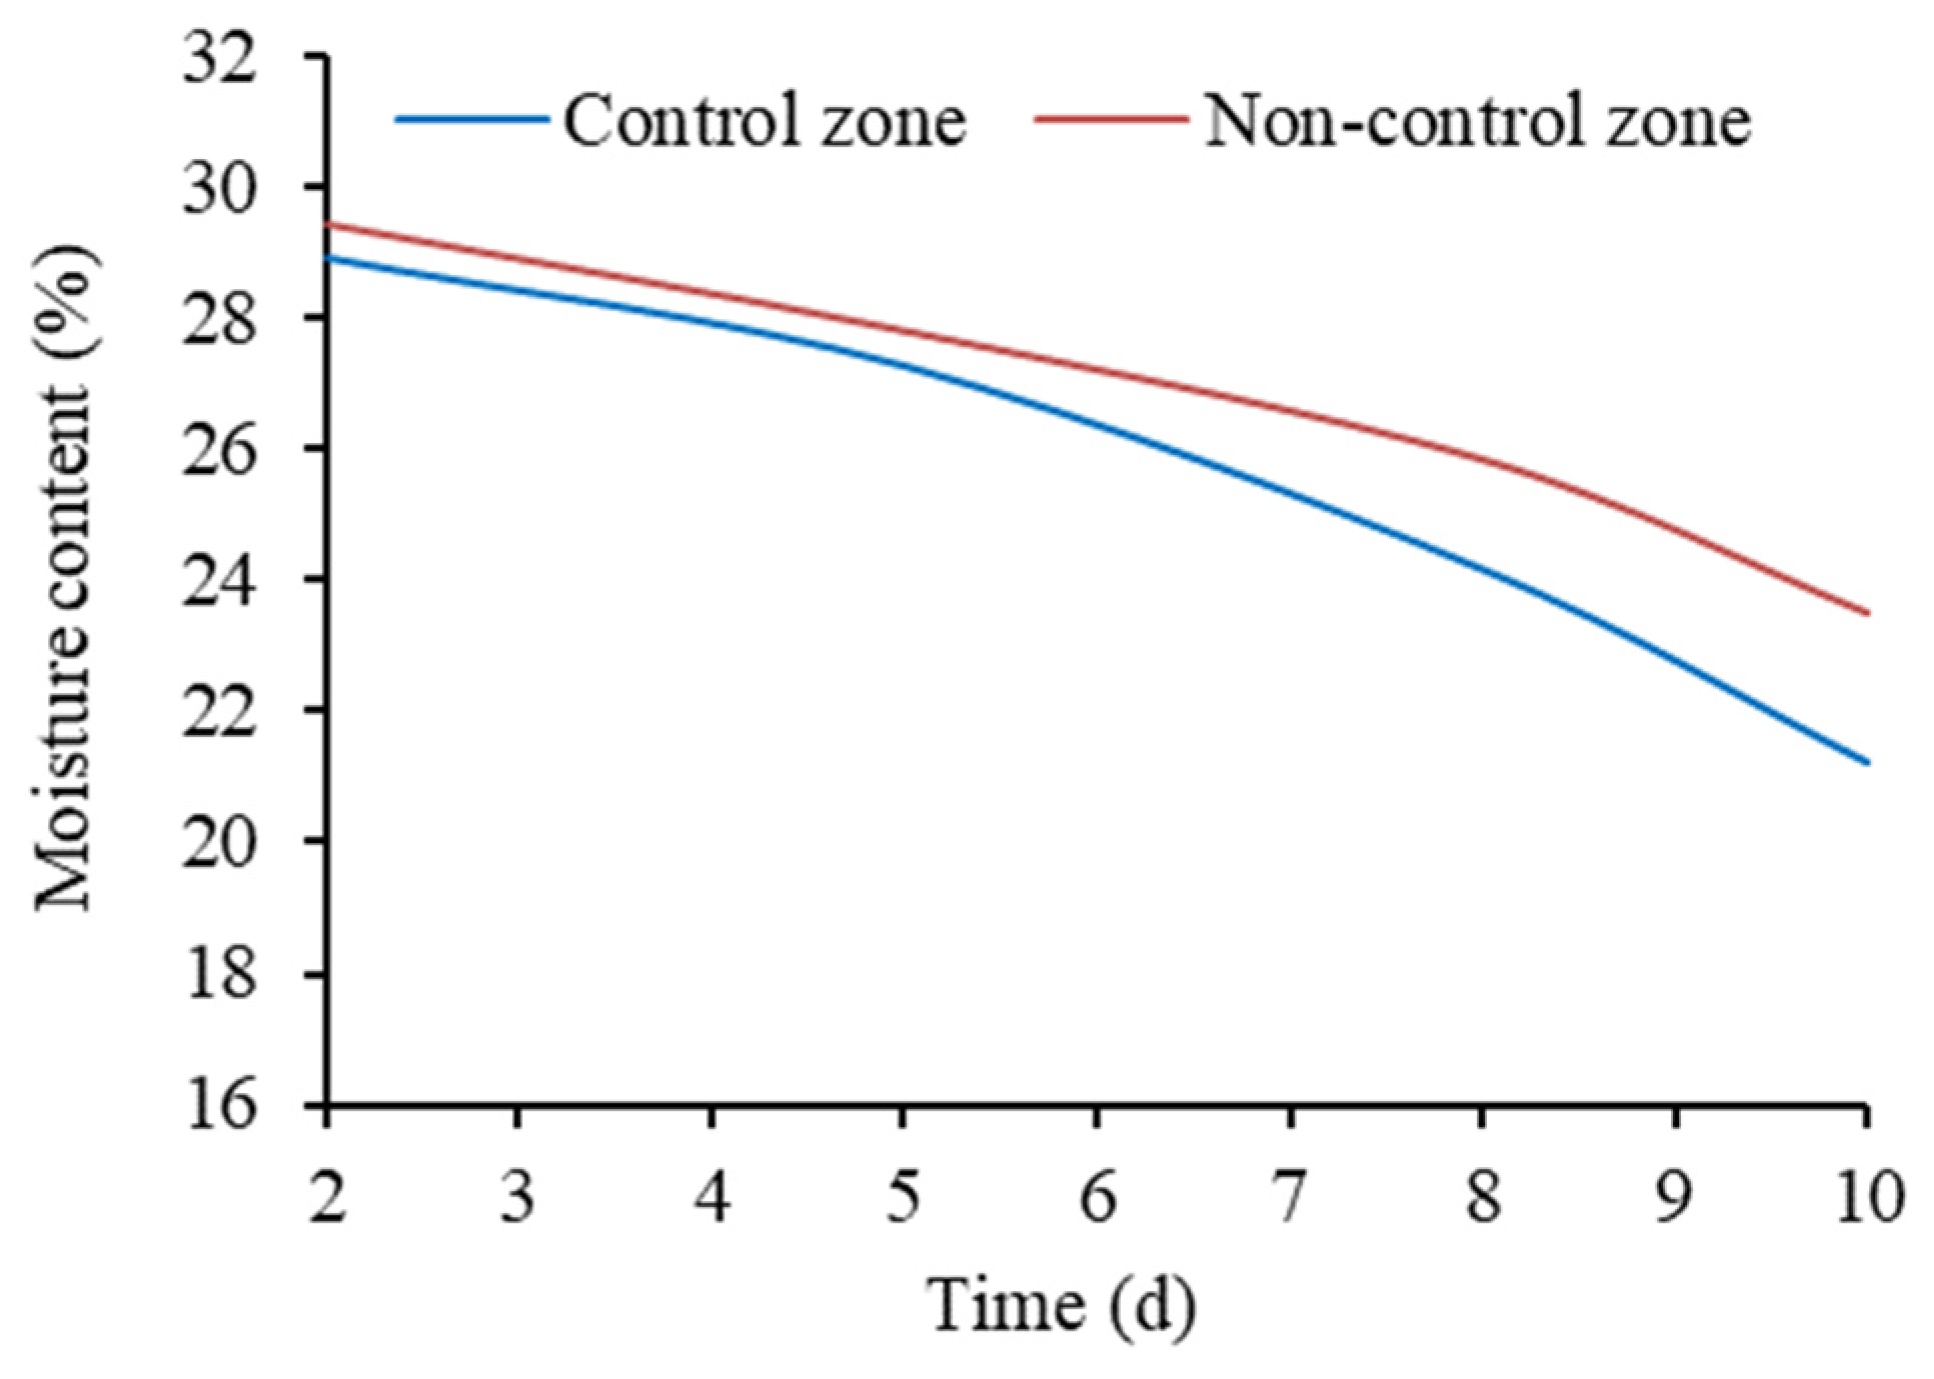
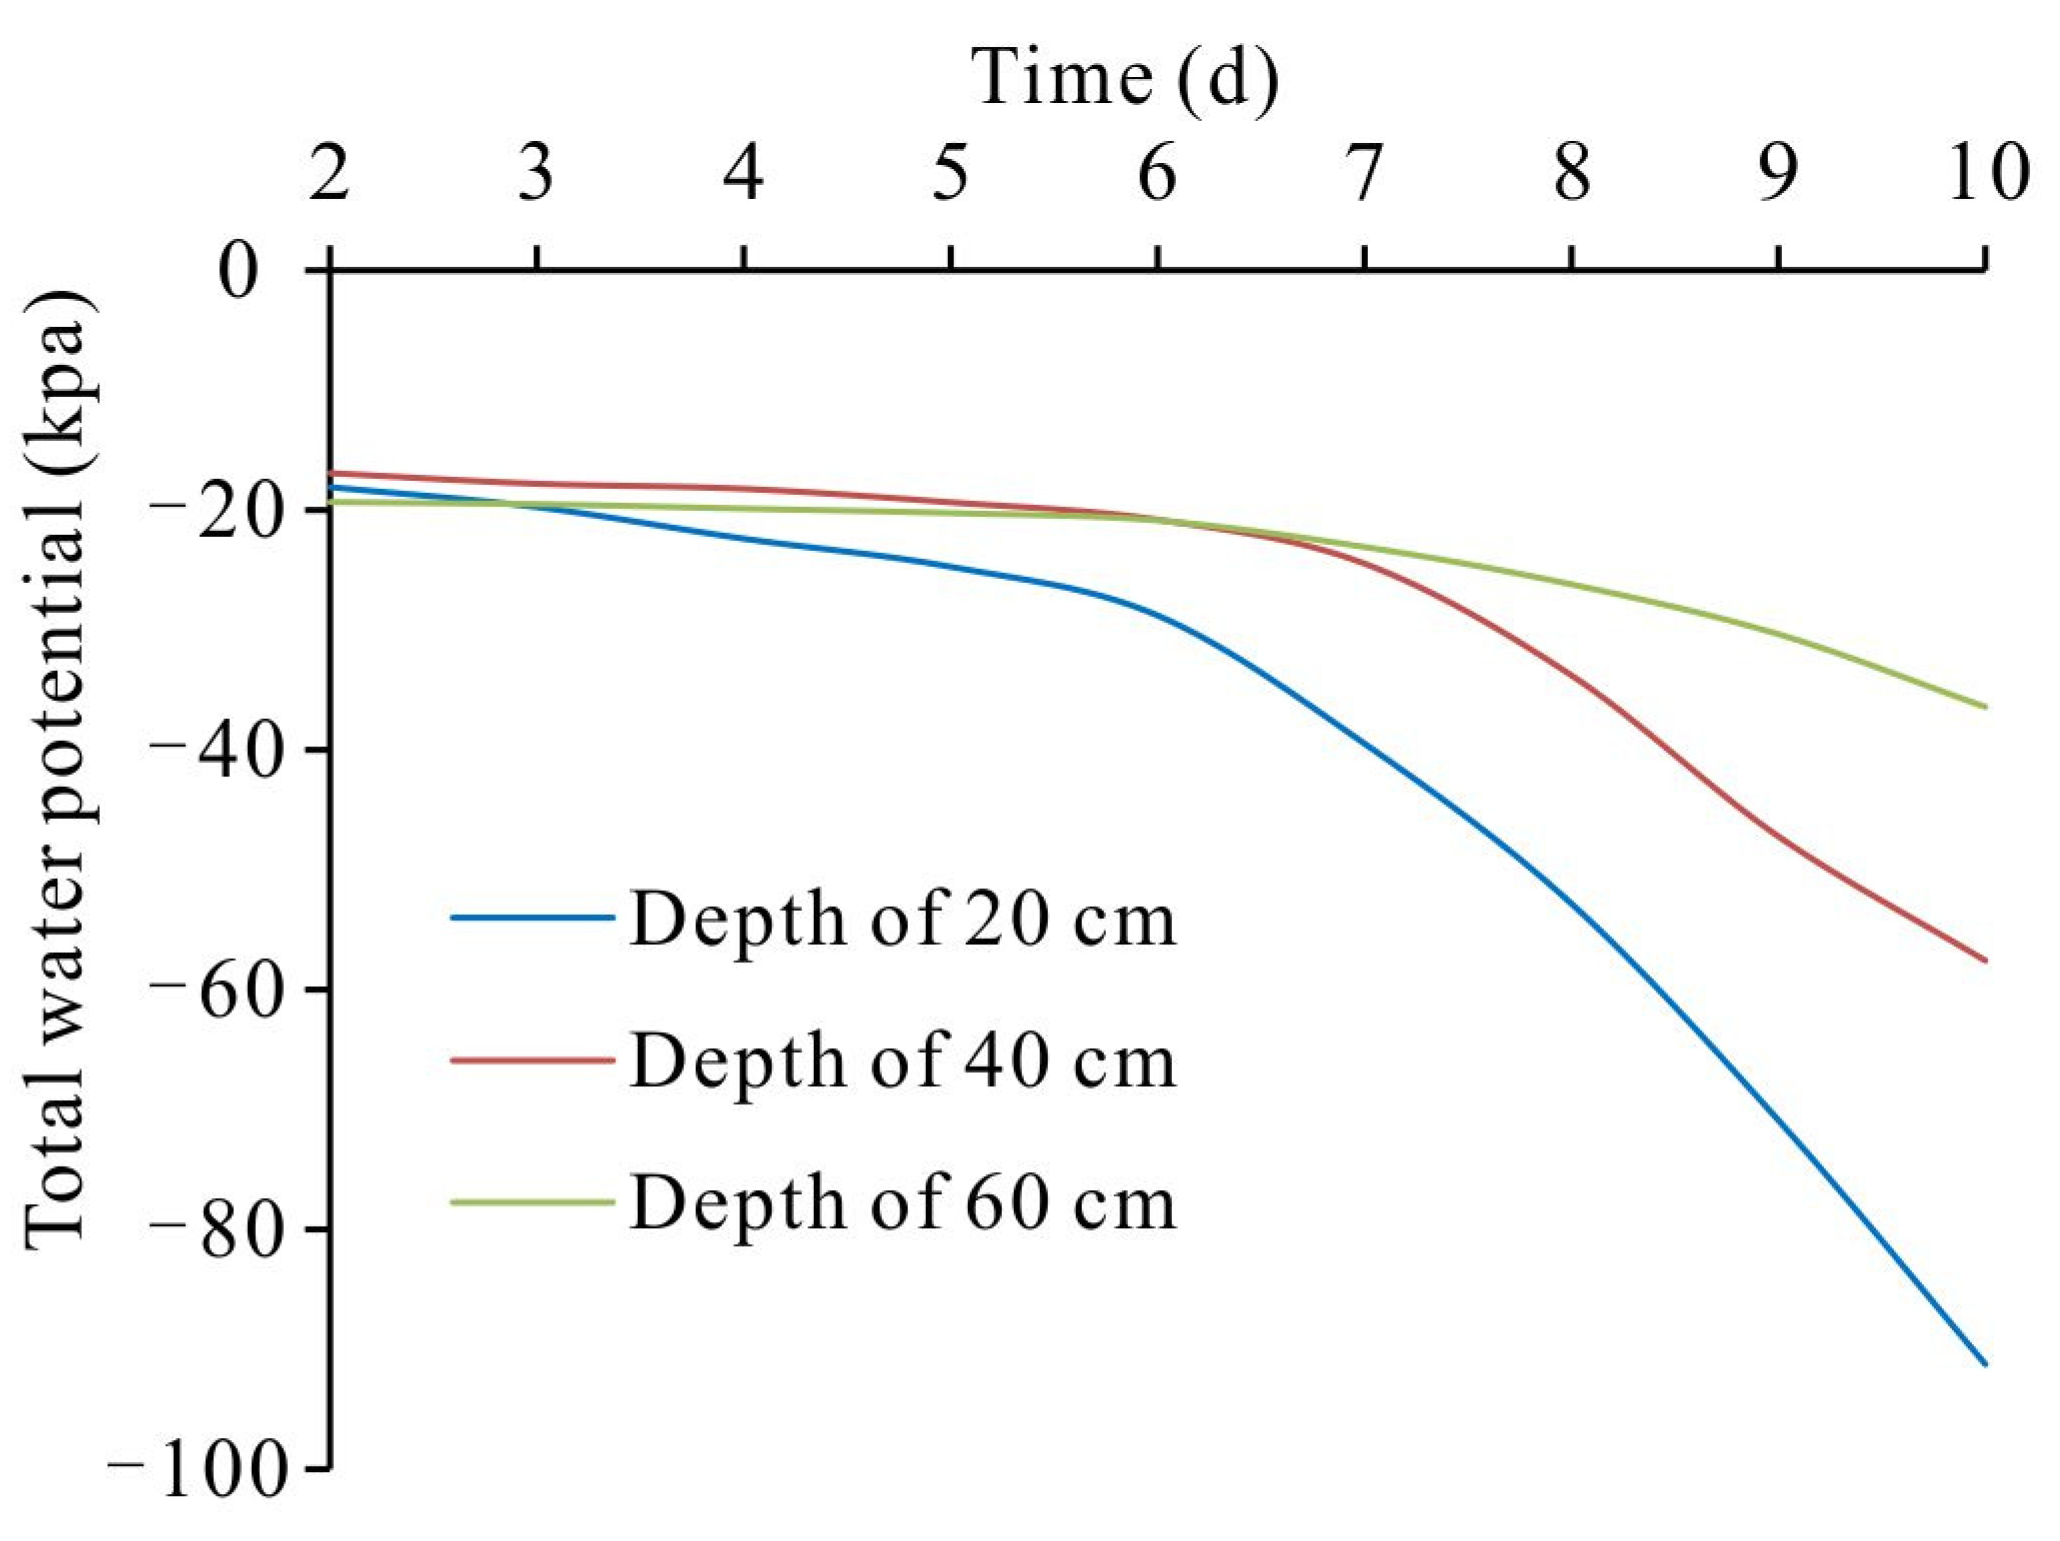
3.4.2. Analysis of Moisture and Salt Equilibrium in Topsoil Solution

The change in the salt concentration of soil solution is essentially the moisture and salt equilibrium in the topsoil solution under the combined effects of evapotranspiration, irrigation, and groundwater, which is relevant with moisture content and salt content of soil solution. The water and salts in soil migrate as follows within an irrigation cycle. After irrigation, the infiltration interface (zero flux plane) gradually shifts downward. The water and salts above the zero flux plane move upward due to evapotranspiration, while those under the zero flux plane infiltrate downward under the action of gravity. As evapotranspiration progresses, the groundwater can recharge water and salts to the topsoil through the supported capillary water in the case of a low groundwater burial depth. The product of the pore water electrical conductivity of the soil and volumetric moisture content (ECe; σ p · θ ) is similar to the product of the salt concentration and volume of soil water. Therefore, the change in the product represents the change in the total salt content of the soil solution [26].
Figure 12 shows the total water potential at a depth of 40 cm was greater than that at a depth of 20 cm 2–10 days after irrigation, with the difference obviously increasing 8–10 days after irrigation. The total water potential at a depth of 40 cm was greater than that at a depth of 60 cm 2–5 days after irrigation, with small difference, and the former was almost equal to the latter 5–10 days after irrigation. These results indicate that the zero flux plane shifted downward at a depth of 40–60 cm 2–5 days after irrigation. Meanwhile, the topsoil supplied water and salts to the atmosphere and the surface due to evapotranspiration, and a small amount of water and salts was input into the topsoil from the lower part due to the low groundwater burial depth. Consequently, the moisture content in the topsoil gradually decreased (Figure 13), indicating that the evapotranspiration rate of the topsoil water was greater than its input rate from the lower part. The ECe of the topsoil gradually decreased (Figure 14), indicating that the sum of the salt precipitation rate on the soil surface and the salt absorption rate of crops was greater than the input rate of salts from the lower part. Therefore, both the moisture content and salt content of the topsoil solution were in negative equilibrium 2–5 days after irrigation. The burial depth of the zero flux plane increased to greater than 60 cm 5–10 days after irrigation, during which the topsoil continuously supplied water and salts to the atmosphere and the surface due to evapotranspiration. Meanwhile, the groundwater control system increased the groundwater depth during this period (Figure 15). As a result, the water and salt input from the lower part almost disappeared. The total water potential distribution 10 days after the irrigation (Figure 9) also verifies the disappearance of the water and salt input into the topsoil from the lower part. 5–10 days after irrigation, the decreased rate of the topsoil moisture content increased (Figure 13), and the decreased amplitude of the ECe increased (Figure 14), indicating the fairly high evapotranspiration intensity of the topsoil. Meanwhile, the salt concentration of the soil solution increased gradually and the salt precipitation rate on the surface increased in the absence of water and salt input from the lower part. Furthermore, the absolute values of the negative equilibrium values of the moisture content and salt content of the topsoil solution both increased 5–10 days after irrigation.
Figure 16 shows changes in the total water potential at different depths in the non-control zone. According to this figure, the total water potential at a depth of 40 cm was greater than that at a depth of 20 cm 2–10 days after irrigation, with the difference gradually increasing; the total water potential at a depth of 40 cm was greater than that at a depth of 60 cm 2–6 days after irrigation, with the difference gradually decreasing; the total water potential at a depth of 60 cm was greater than that at a depth of 40 cm 6–10 days after irrigation, with the difference gradually increasing. These results indicate that the zero flux plane shifted downward at a depth of 40–60 cm 2–6 days after irrigation. Meanwhile, the topsoil supplied water and salts to the atmosphere and the surface due to evapotranspiration, and water and salts were input from the part under the topsoil due to the low groundwater depth (Figure 15). Consequently, the moisture content in the topsoil gradually decreased (Figure 13), indicating that the evapotranspiration rate of the topsoil water was greater than its recharge rate from the lower part. The ECe of the topsoil gradually increased (Figure 14), indicating that the sum of the salt precipitation rate on the soil surface and the salt absorption rate of crops was less than the input rate of salts from the lower part. Therefore, the moisture content and salt content of the topsoil solution were in negative and positive equilibrium, respectively 2–6 days after irrigation. The burial depth of the zero flux plane increased to greater than 60 cm 6–10 days after irrigation, during which the topsoil continuously supplied water and salts to the atmosphere and the surface and water and salts were input from the lower part due to the small groundwater depth (Figure 15). The total water potential distribution of the soil profile 10 days after the irrigation (Figure 9) also verifies the presence of the water and salt input into the topsoil from the lower part. The decreased rate of the topsoil moisture content increased 6–10 days after irrigation (Figure 13), indicating a decreased input rate of water under a stable evapotranspiration rate of the topsoil. With an increase in the salt concentration of the soil solution, the salt crystallization rate of the topsoil increased. However, the increased amplitude of the ECe of the topsoil increased, which occurred because the salt concentration of the input water from the lower part continuously increased (Figure 17). As a result, the absolute values of both the negative equilibrium value of the moisture content and the positive equilibrium value of the salt content of the topsoil solution increased 6–10 days after irrigation.
As shown by the above analyses, the topsoil in control and non-control zones continuously supplied water and salts to the atmosphere and the surface due to evapotranspiration in the concentration stage of the soil solution. The moisture and salt equilibrium in the control zone changed as follows in the concentration stage. In the early concentration stage, a small amount of low-salinity water was input into the topsoil from the lower part, and both the moisture content and salt content of the topsoil solution were in negative equilibrium. In the late concentration stage, the water and salt input from the lower part disappeared, and the absolute values of the negative equilibrium values of the moisture content and salt content increased. The moisture and salt equilibrium in the non-control zone changed as follows in the concentration stage. In the early concentration stage, the water with a stable salt concentration was input into the topsoil from the lower part, and the moisture content and salt content were in negative and positive equilibrium, respectively. In the late concentration stage, the salt concentration of the water input from the lower part gradually increased, and the absolute values of both the negative equilibrium values of the moisture content and the absolute positive equilibrium values of the salt content of topsoil solution increased.

4. Discussion

The temperature is high and the evapotranspiration capacity is strong in summer in the northwest arid region. The risk of soil salinization is high in lower watershed area with small groundwater depth. Figure 18 shows July to August 2020 in the test base was the period with the highest temperature and the highest evapotranspiration capacity. And the groundwater depth was small in the non-control zone (Figure 5). Irrigation and precipitation can effectively wash the topsoil salt and reduce the accumulation of salt in the topsoil. However, water resources are shortage in the northwest arid region, and the single precipitation of more than 10 mm is rarely seen. Increasing the depth of groundwater can effectively reduce transport amount of water and salt from groundwater to the topsoil, reducing the moisture content and the evapotranspiration of the topsoil. Then the topsoil salt accumulation rate slows down. In the control period, the depth of groundwater in control zone was greater than that in non-control zone (Figure 5). The topsoil moisture content and total water potential in control zone were smaller than that in non-control zone(Figure 9 and Figure 13).
The groundwater depth is an important and easily controlled factor that affects the topsoil salinity [36,37]. To prevent soil salinization and protect crops from salt damage, some researchers proposed the critical depth of groundwater. Wang Y et al. [23] proposed that the critical depth of groundwater at which no severe salinization occurred in the Luocheng irrigation area of the Heihe River basin was 1.29 m. Lee H [24] proposed that the optimal groundwater depth at which soil salinization and over-wetting can be avoided was 1.5–2.0 m. With the effect of the groundwater depth on the topsoil salinity as the theoretical basis, domestic and foreign researchers investigated the critical depth of groundwater primarily based on the time scale of seasons or crop growth stages [38,39,40]. Many studies have concluded that there is a negative correlation between the groundwater depth and the topsoil salinity [20,21,41,42], which is consistent with the conclusion drawn in this study. In other words, after the groundwater depth increases from 1.3–1.5 m to 1.7–1.9 m, the topsoil salinity decreases to below 5 g/kg and the salt accumulation layer shifted downward from 40 cm to 60 cm (Figure 7 and Figure 8).
The arid areas of Northwest China are characterized by high temperatures, evapotranspiration, irrigation frequency, and soil salt accumulation rate in summer. Accordingly, crops in these areas face a high risk of salinity stress in summer. As the most direct indicator affecting crop growth, soil solution salt concentration is affected by changes in both the moisture content and the salt content of soil solution and thus has a very complex change process. In summer, the soil solution salt undergoes alternating dilution and concentration. In the concentration stage, the topsoil solution salt concentration gradually increases, and the crops face the highest risk of salinity stress. Therefore, to effectively guide the evaluation of groundwater control effects and the optimization of control measures, it is necessary to analyze the effect of the groundwater depth on the topsoil solution salt concentration on an irrigation cycle scale. Present studies on the changes in the topsoil solution salt concentration under the influence of the groundwater control system (i.e., after the groundwater depth increases) mostly focus on the stage of salt leaching caused by irrigation and infiltration [43,44], with the purpose of guiding the salt leaching through rational irrigation. However, few studies have been carried out on the differences in the changes of the topsoil solution salt concentration and the characteristics of the moisture content and salt content equilibrium in the concentration stage of the topsoil solution. Based on an in-situ control and un-control zones in the field, this study revealed that the groundwater control system contributes to the significant decrease in the increased amplitude of the topsoil solution salt concentration in the concentration stage, especially 3–8 days after irrigation. This study also found out that the total topsoil solution salt content shifts from positive to negative equilibrium after the groundwater depth increased under the influence of the groundwater control system, thus effectively reducing the risk of salinity stress to crops.

5. Conclusions

(1)
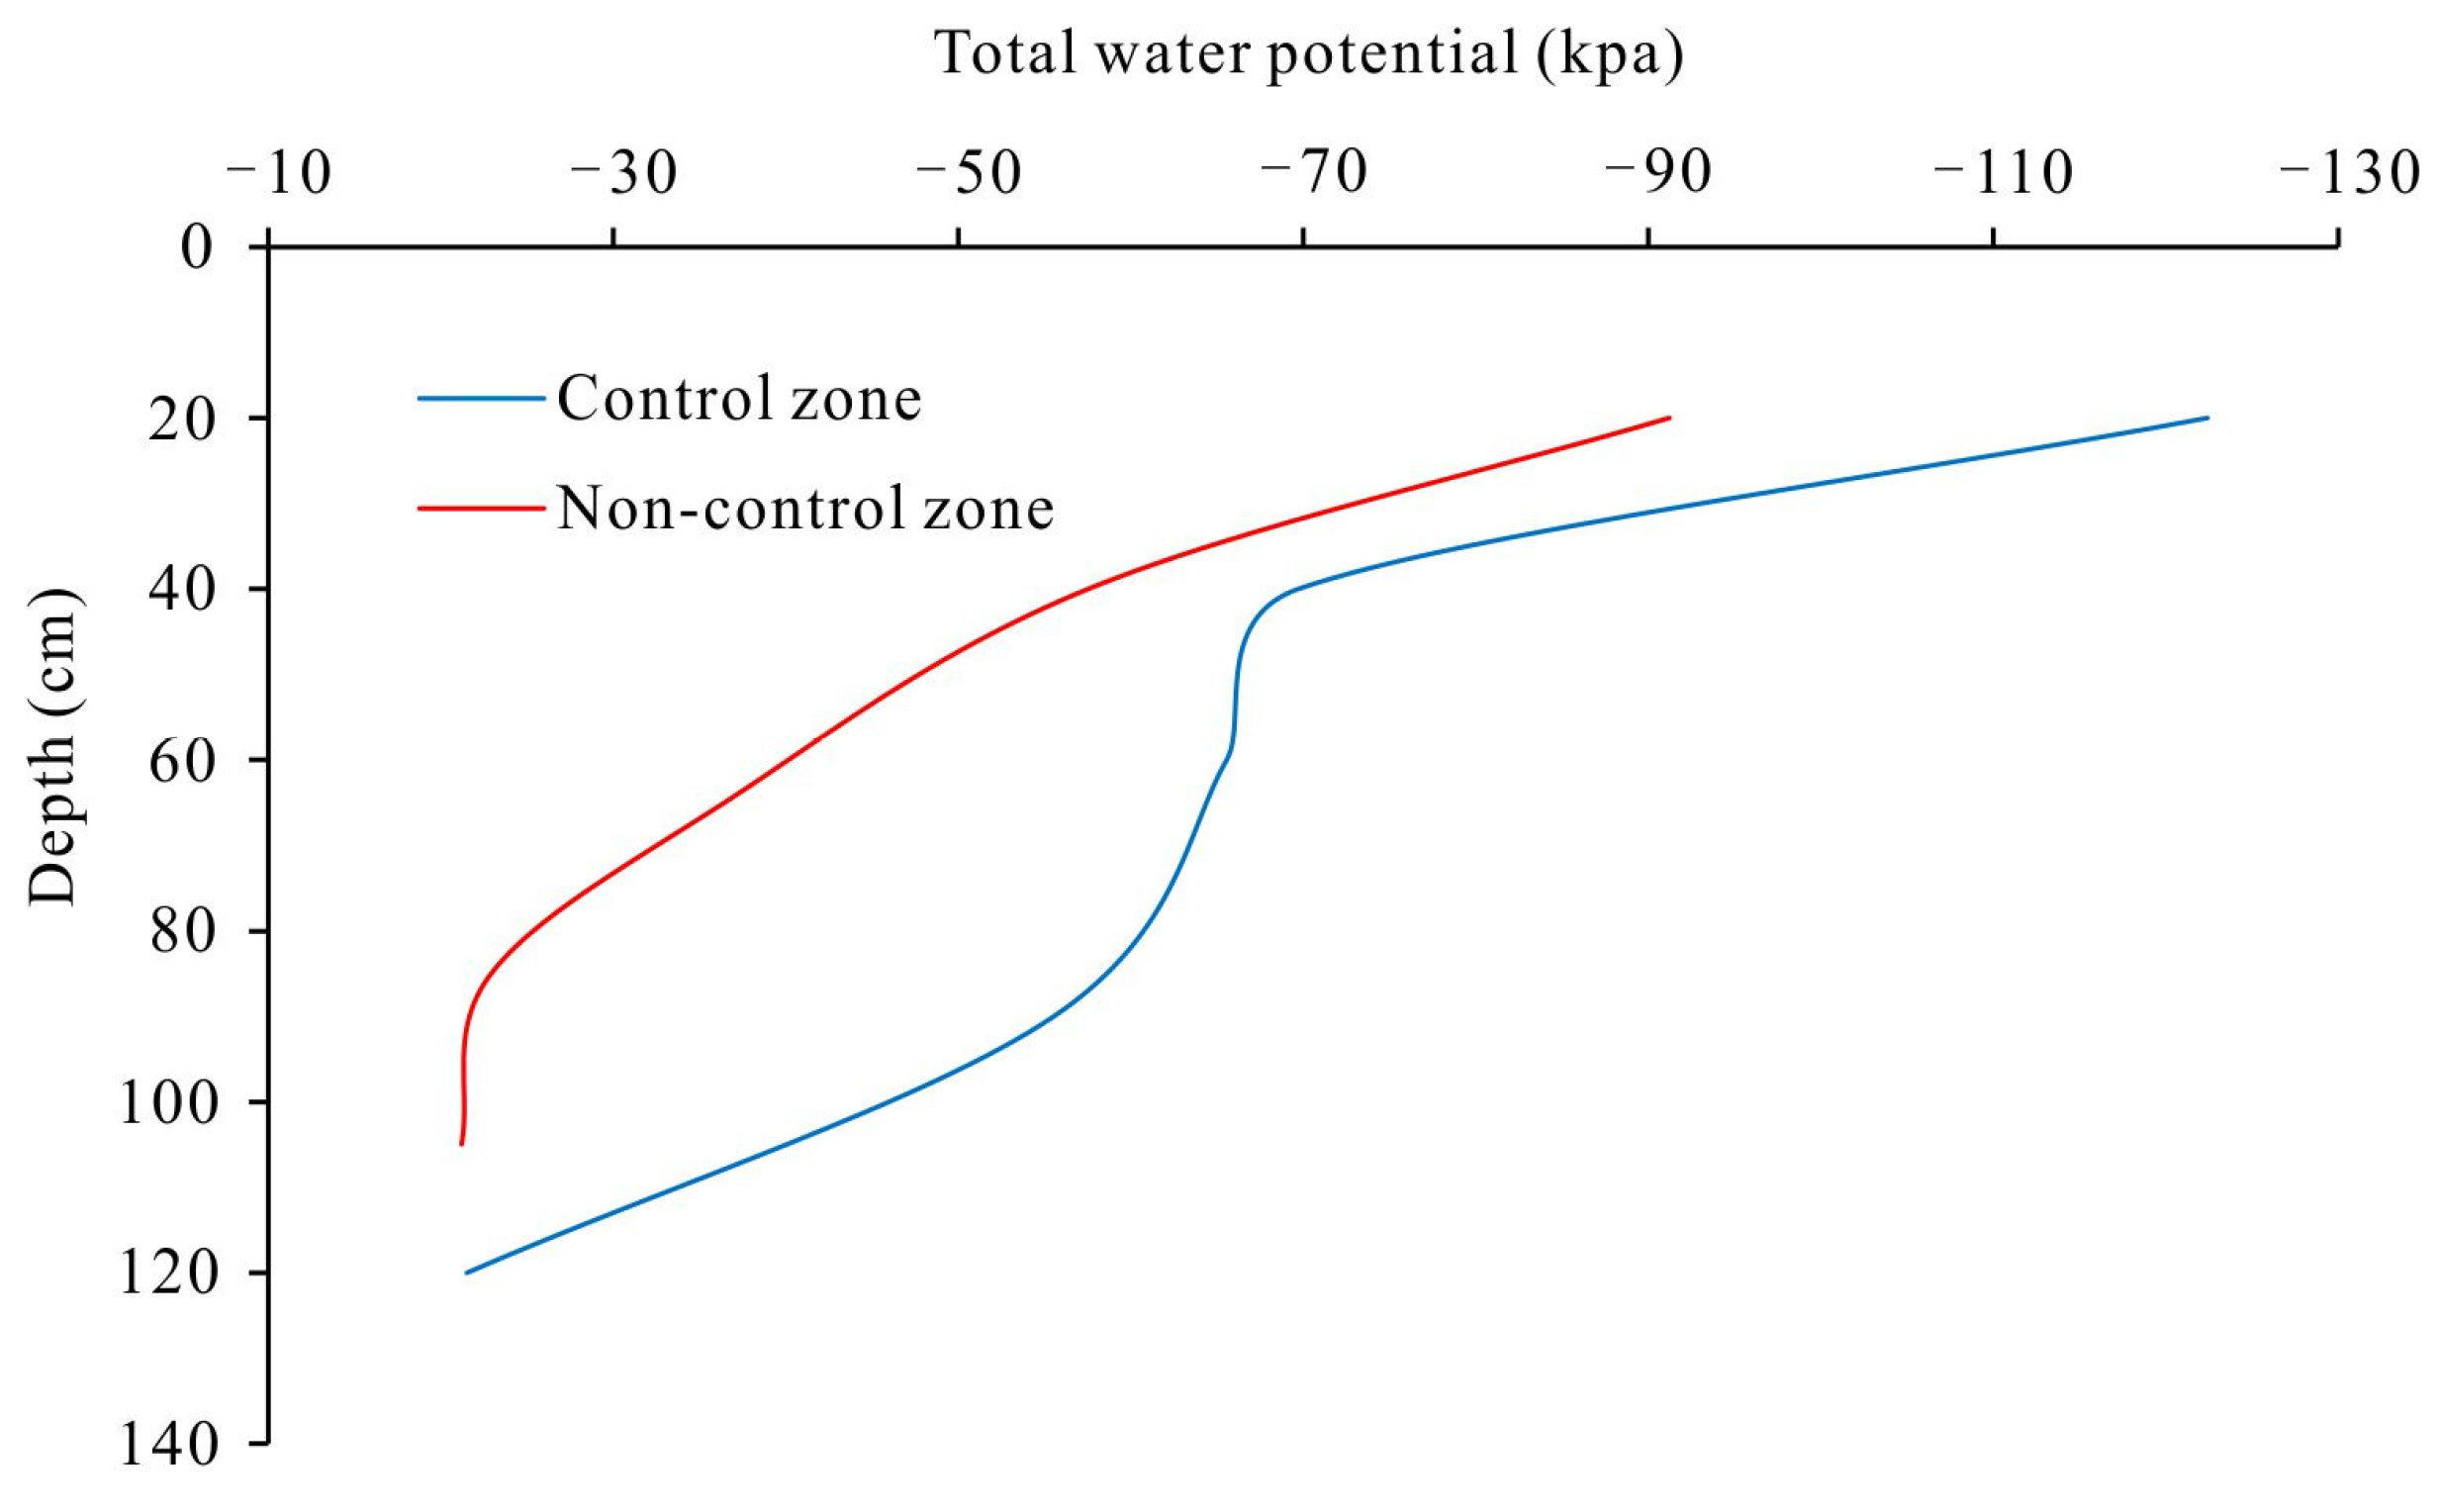
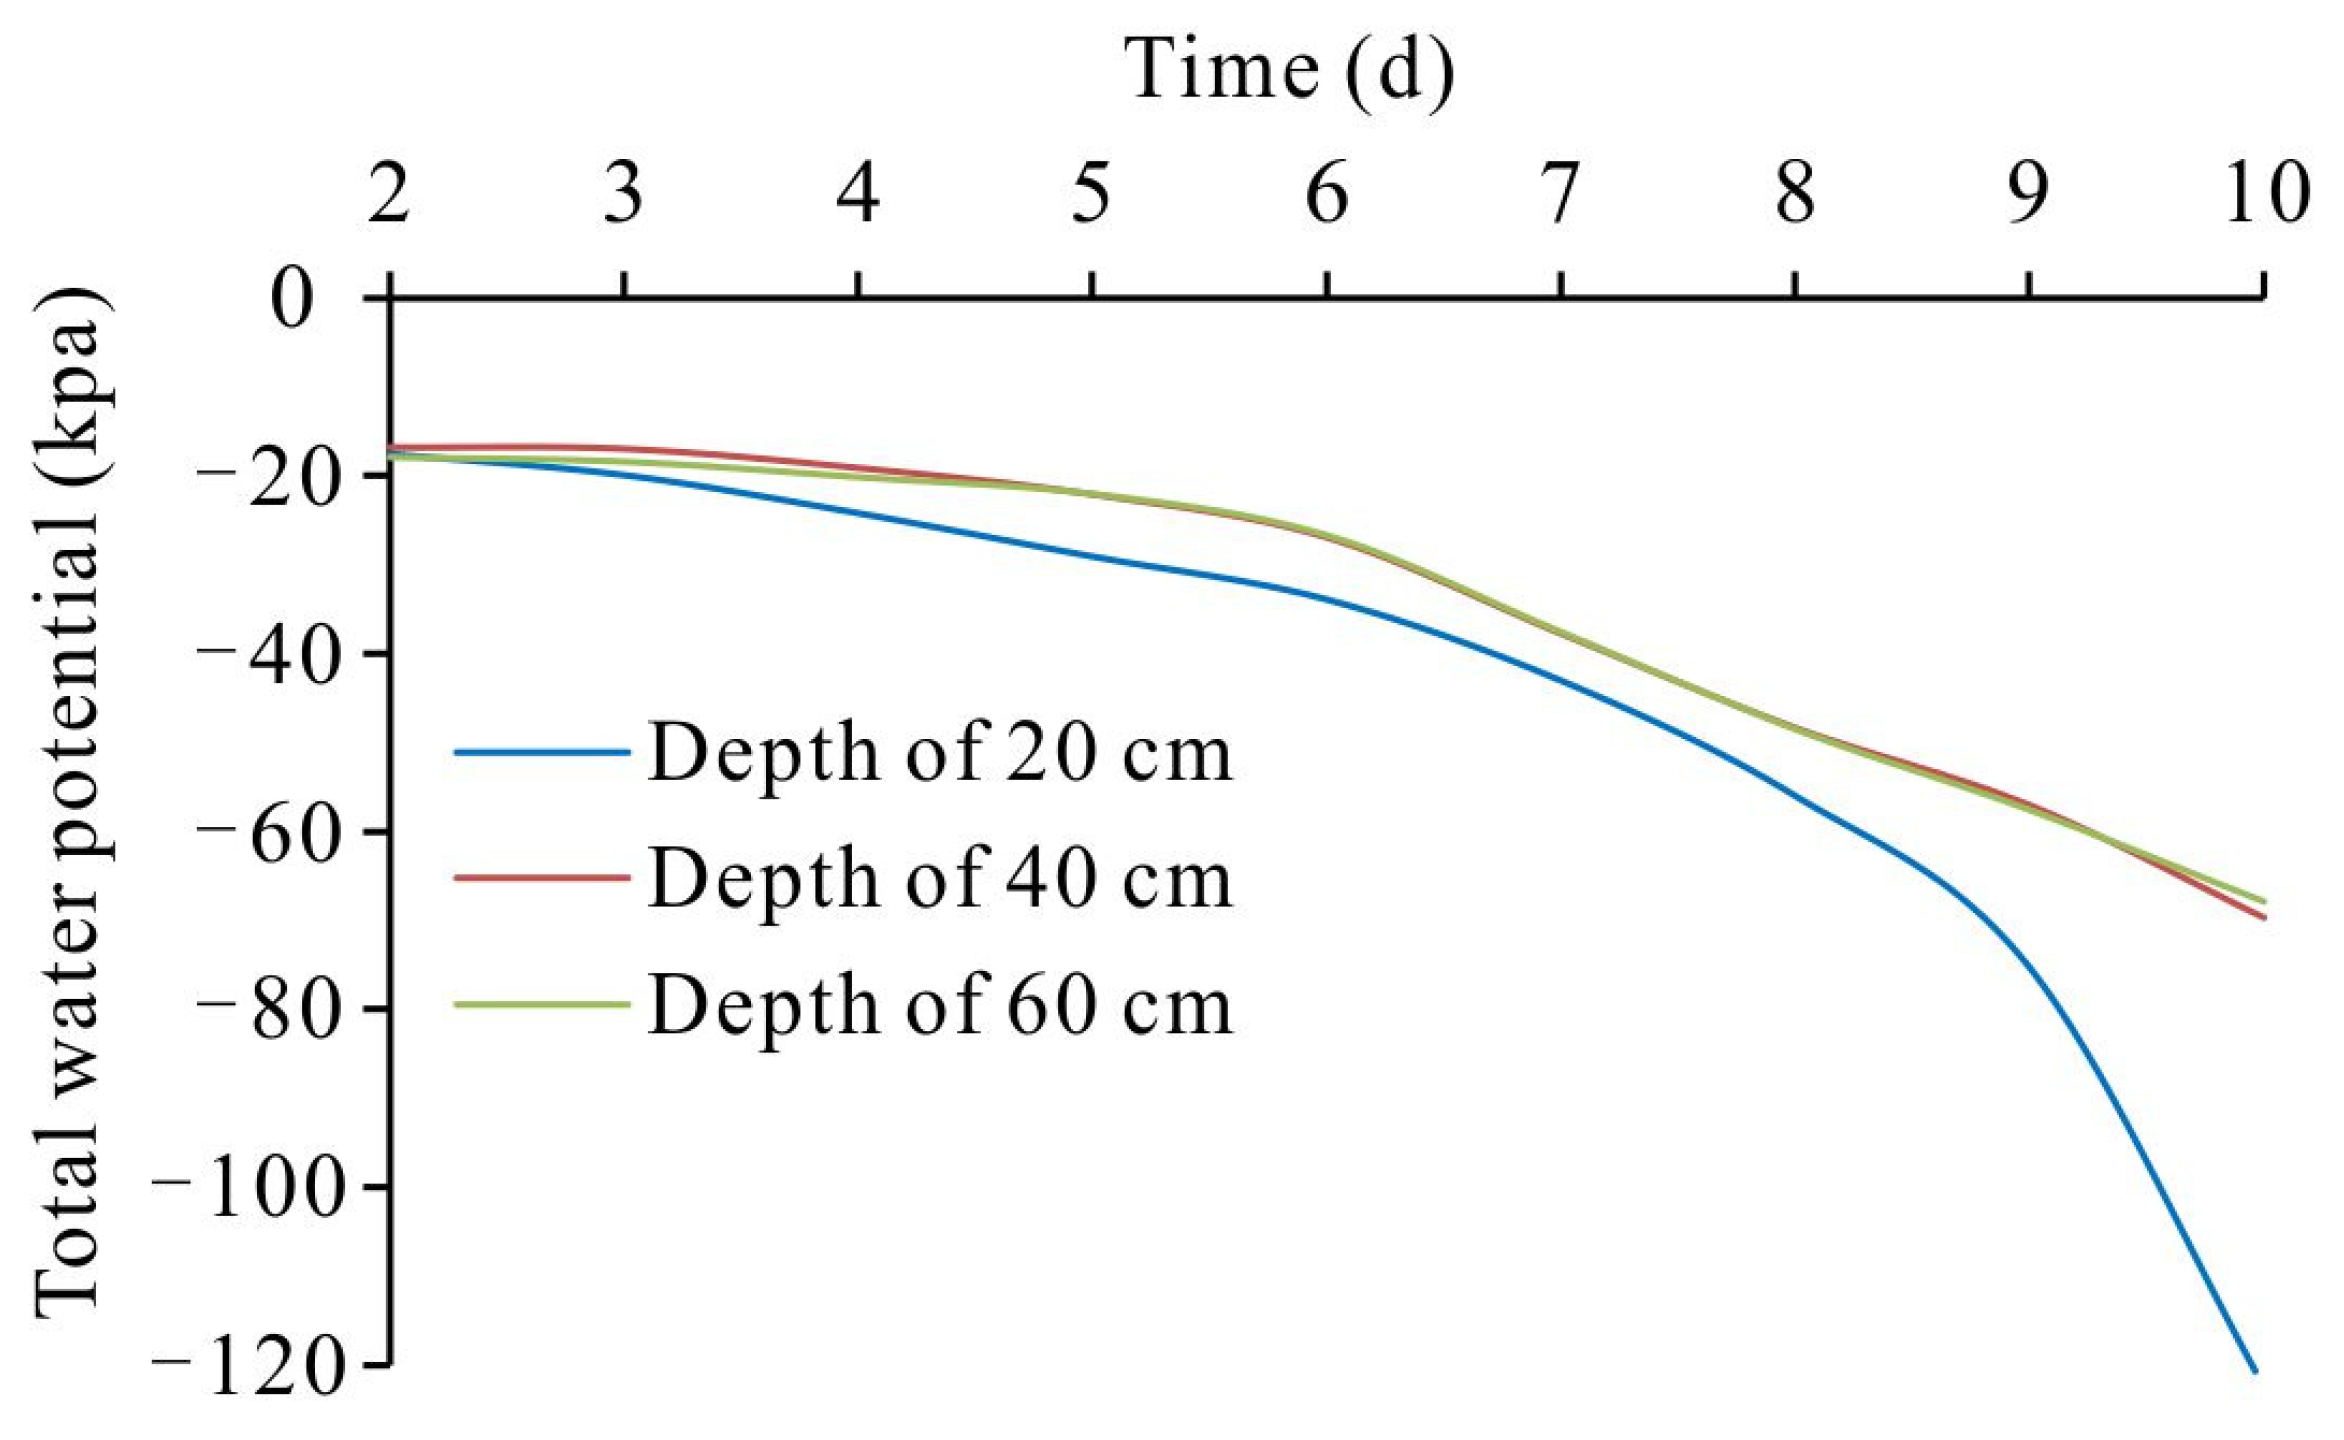
Under the continuous action of groundwater control system in summer with high temperature in arid regions, the groundwater depth increases in the control zone and the depth of the salt accumulation layer moves down, creating a suitable topsoil salt environment for crop growth.
(2)
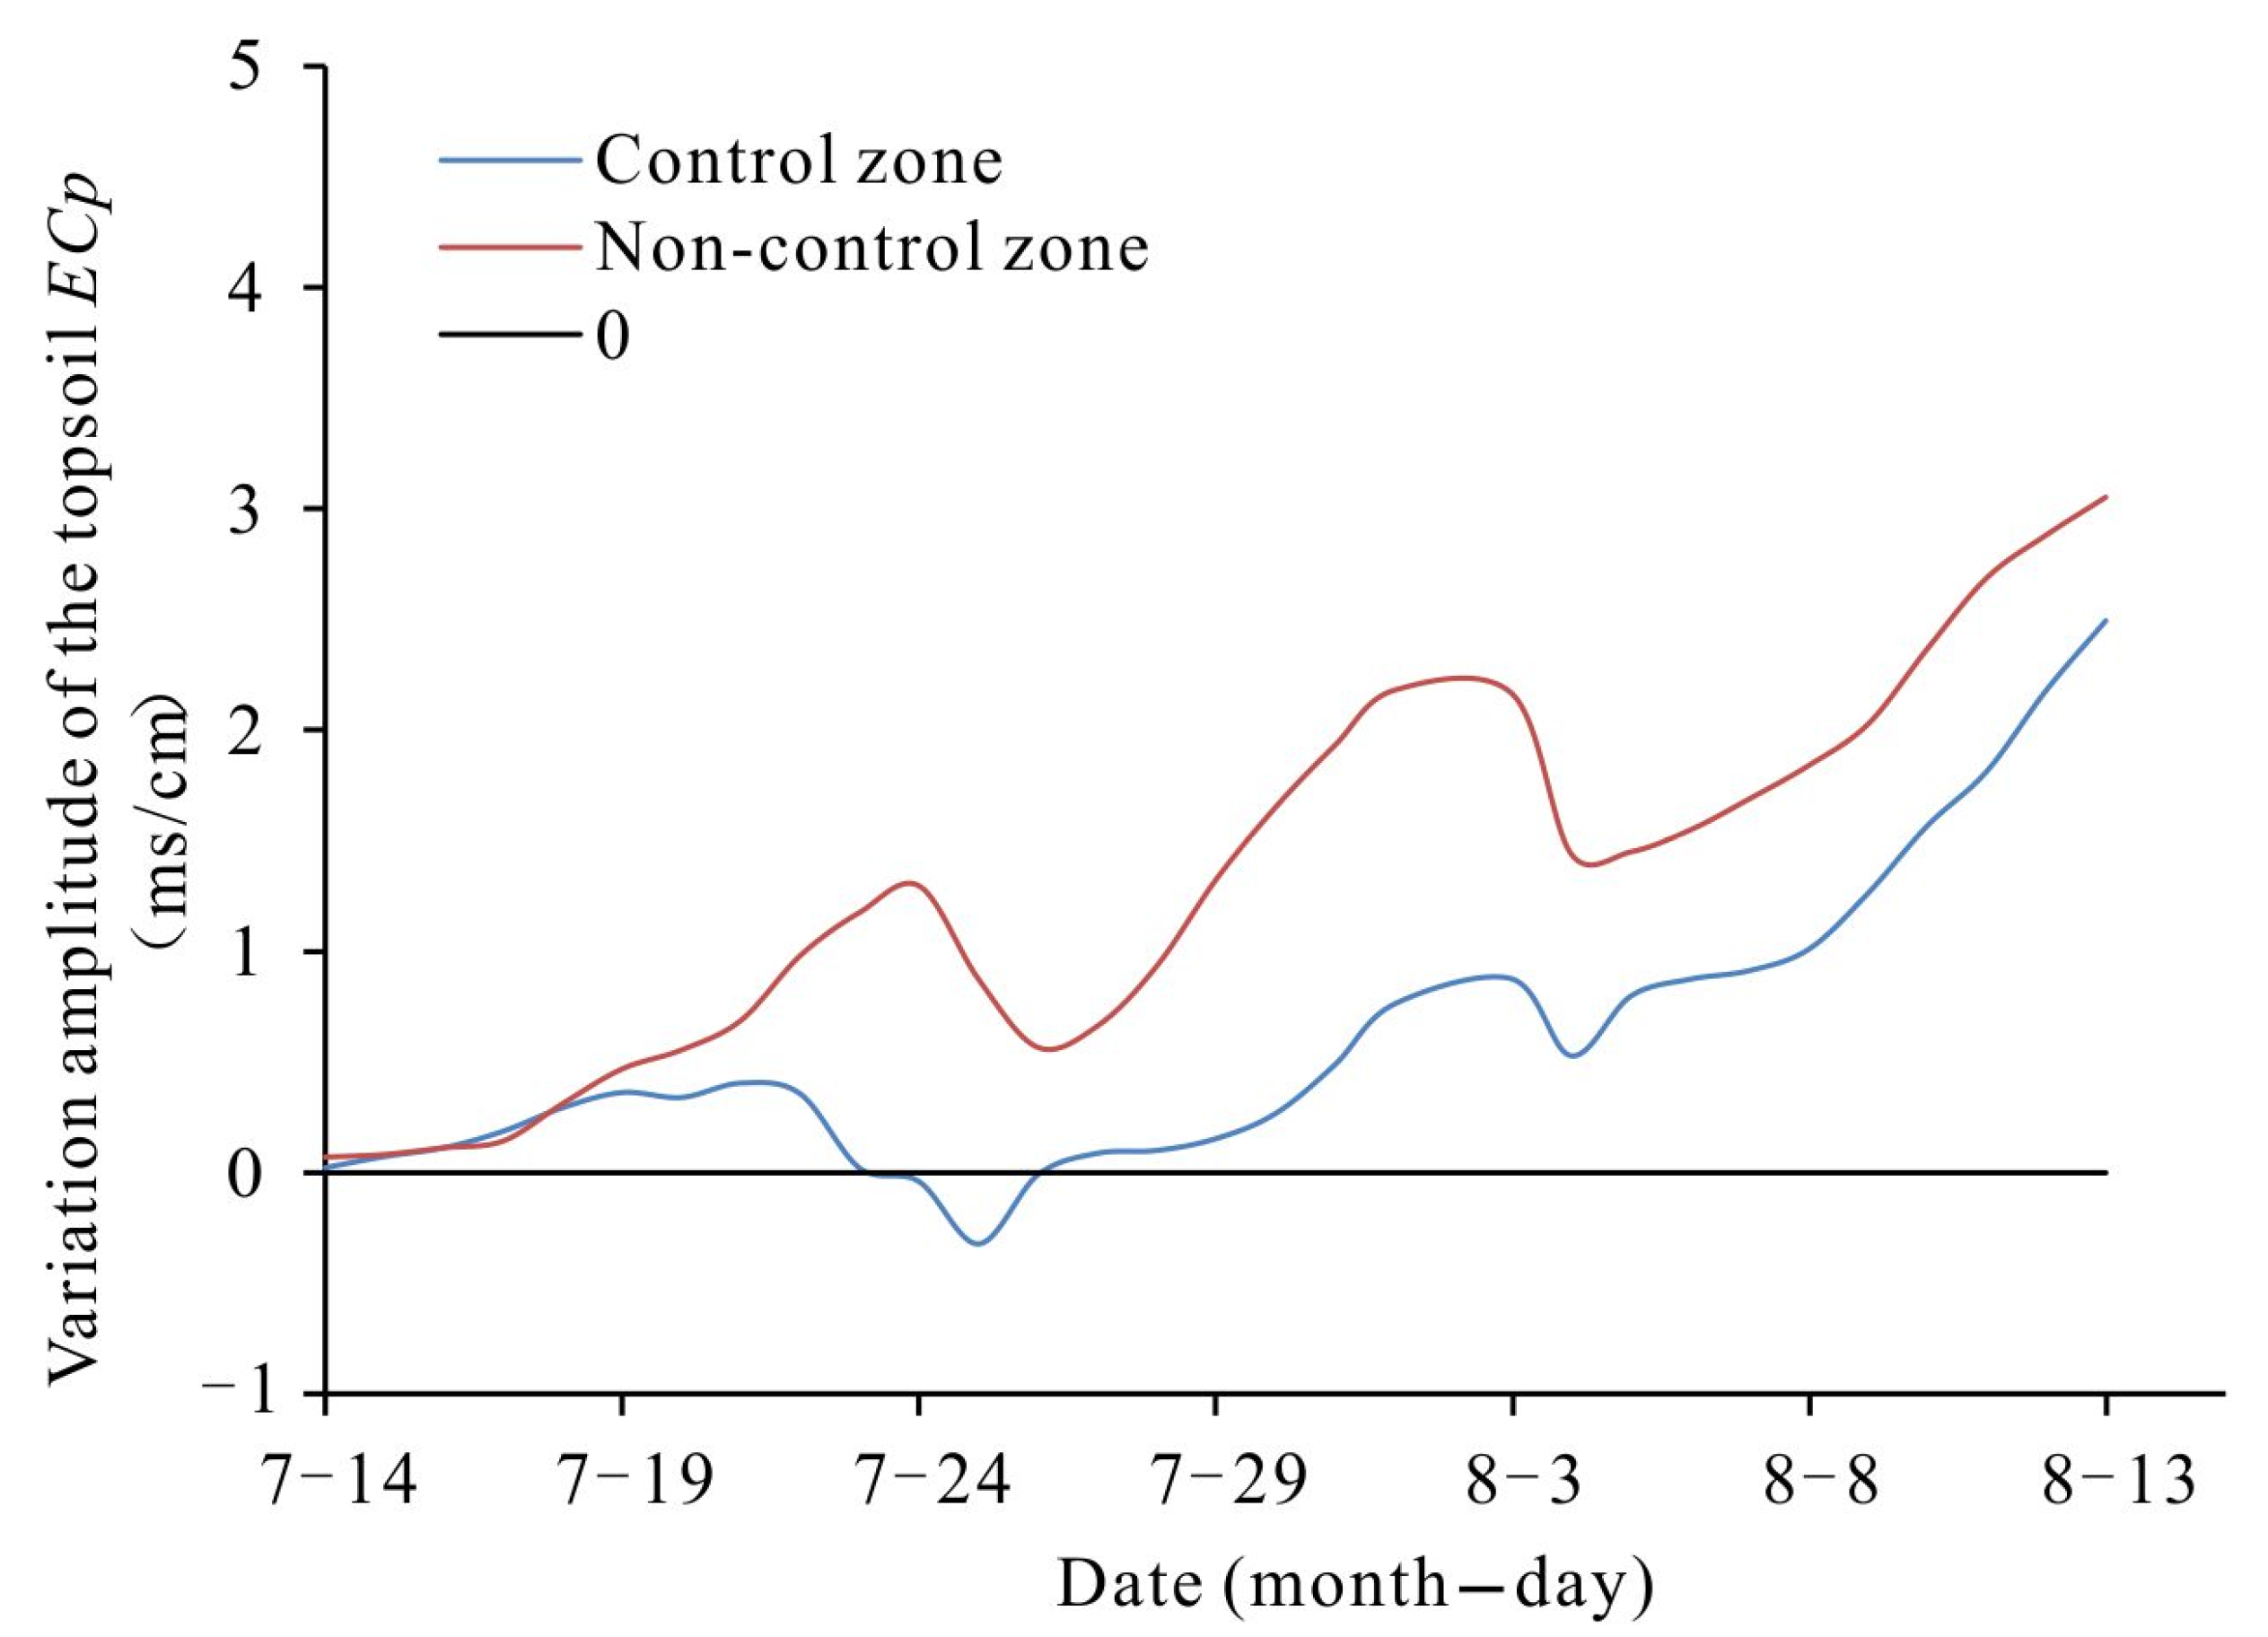
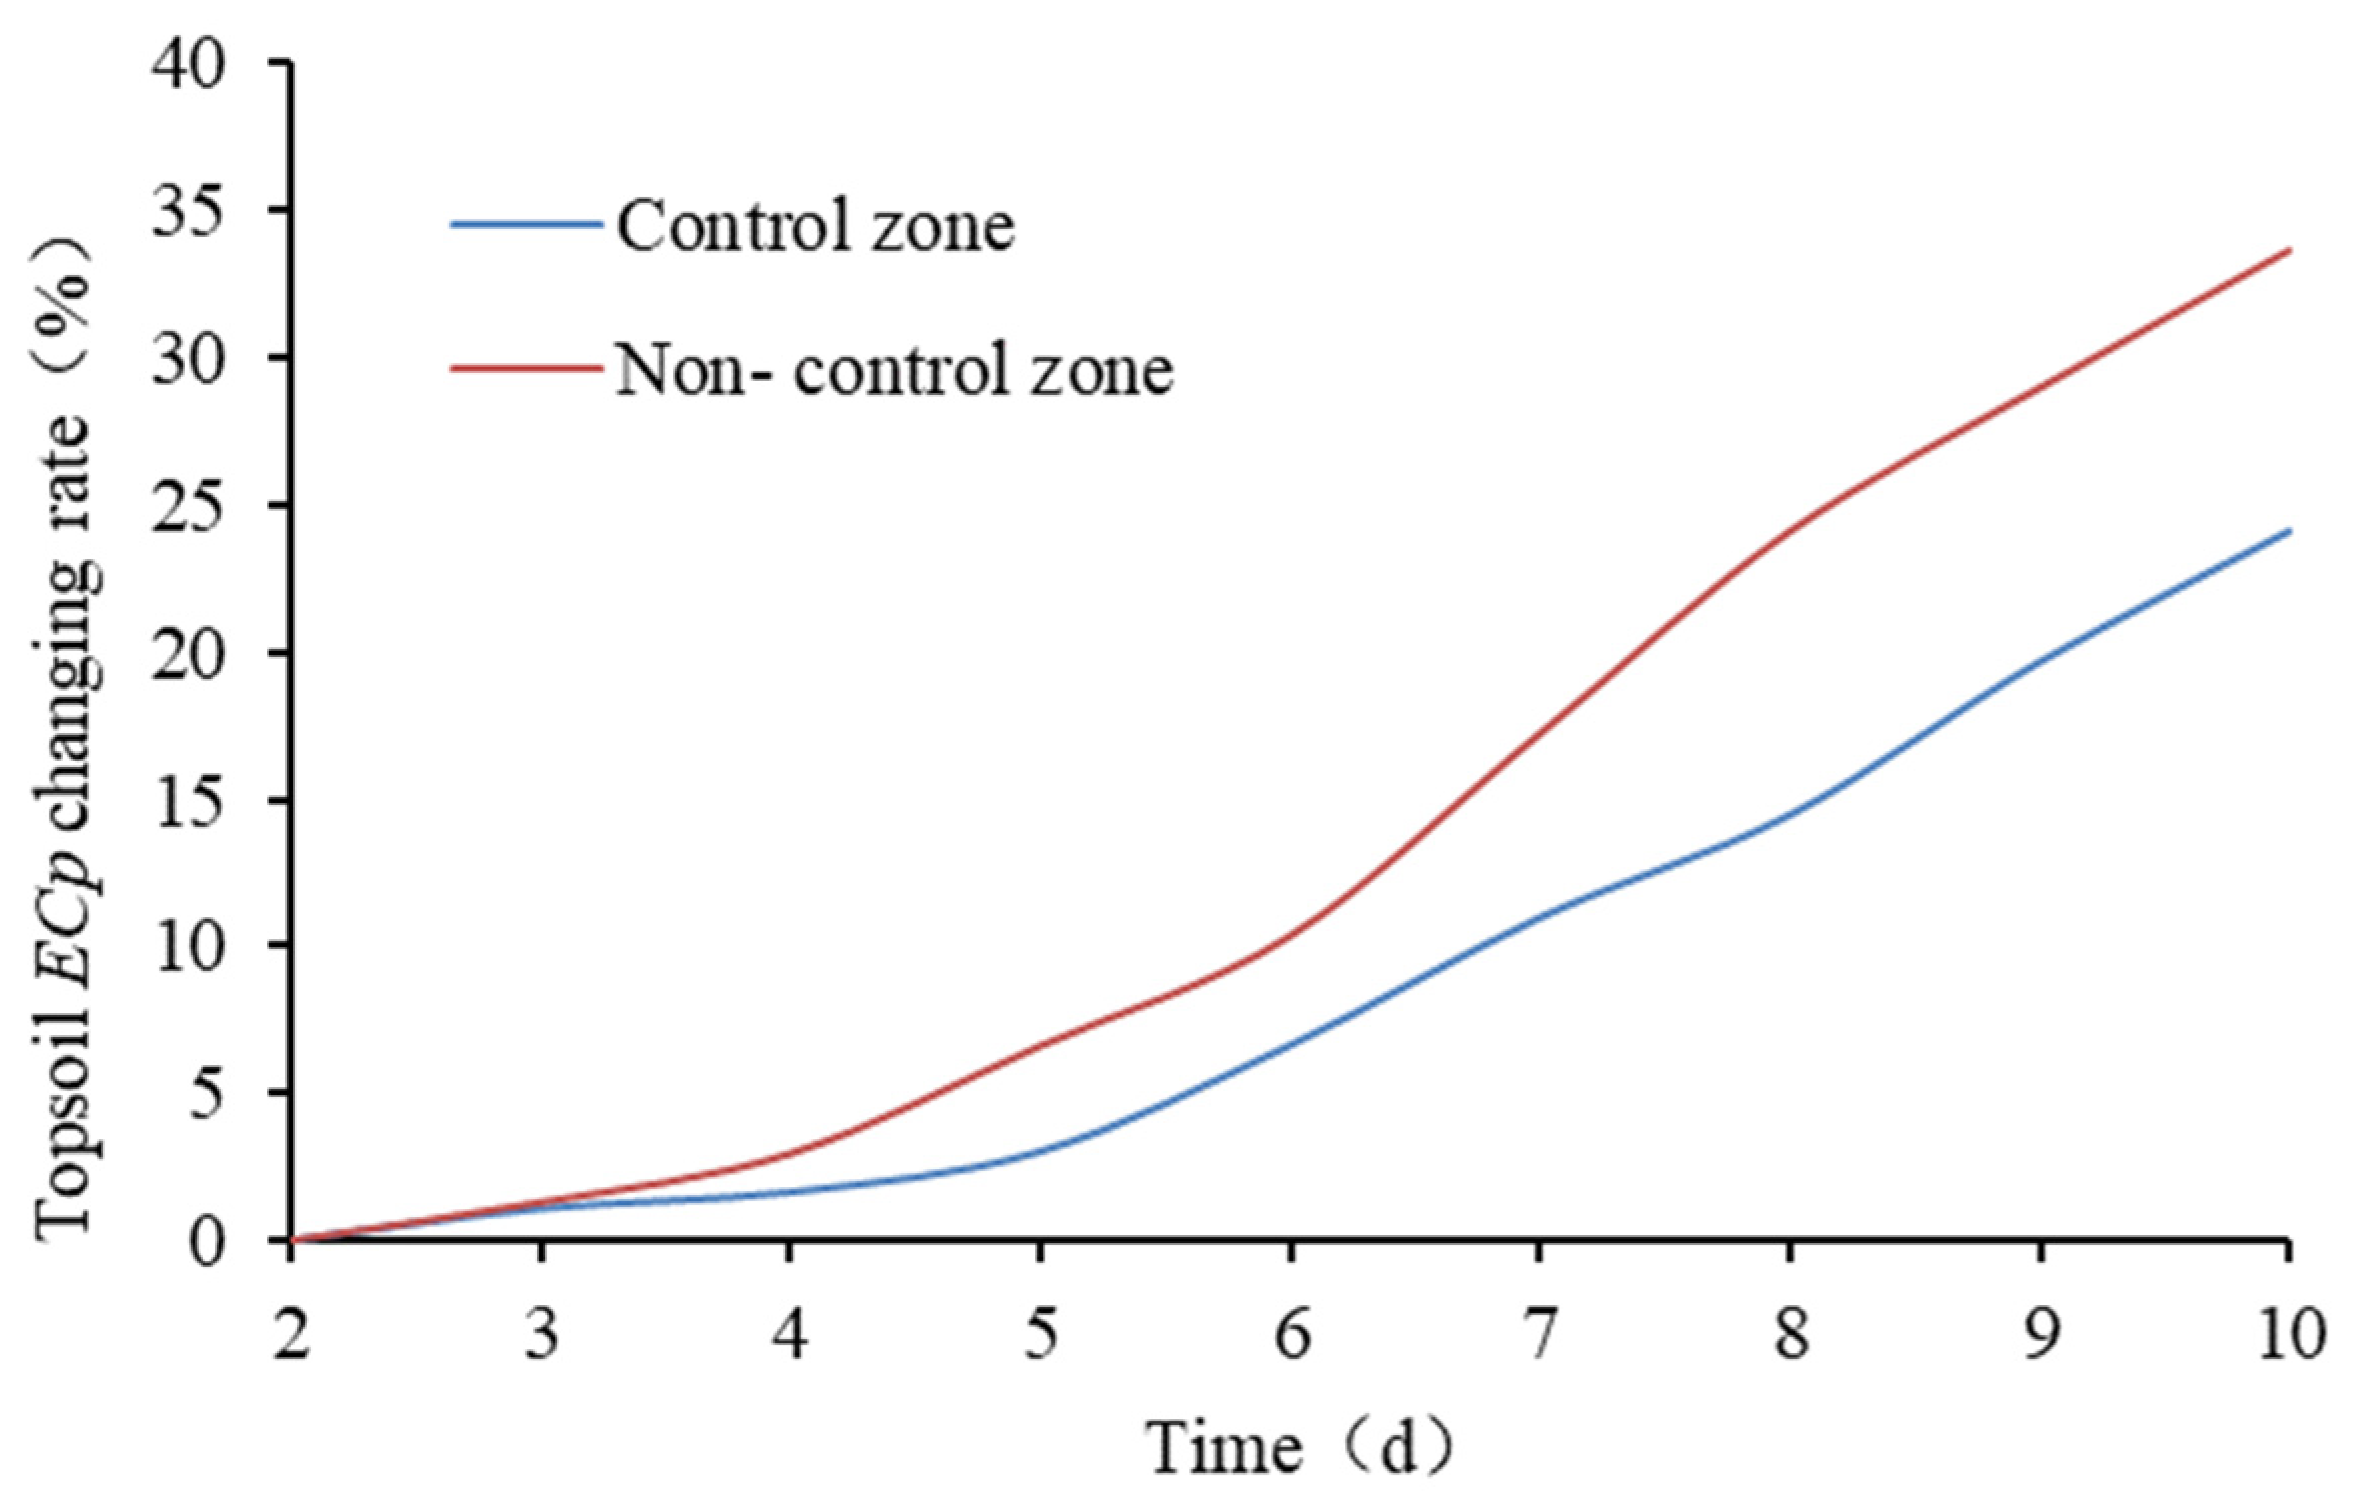
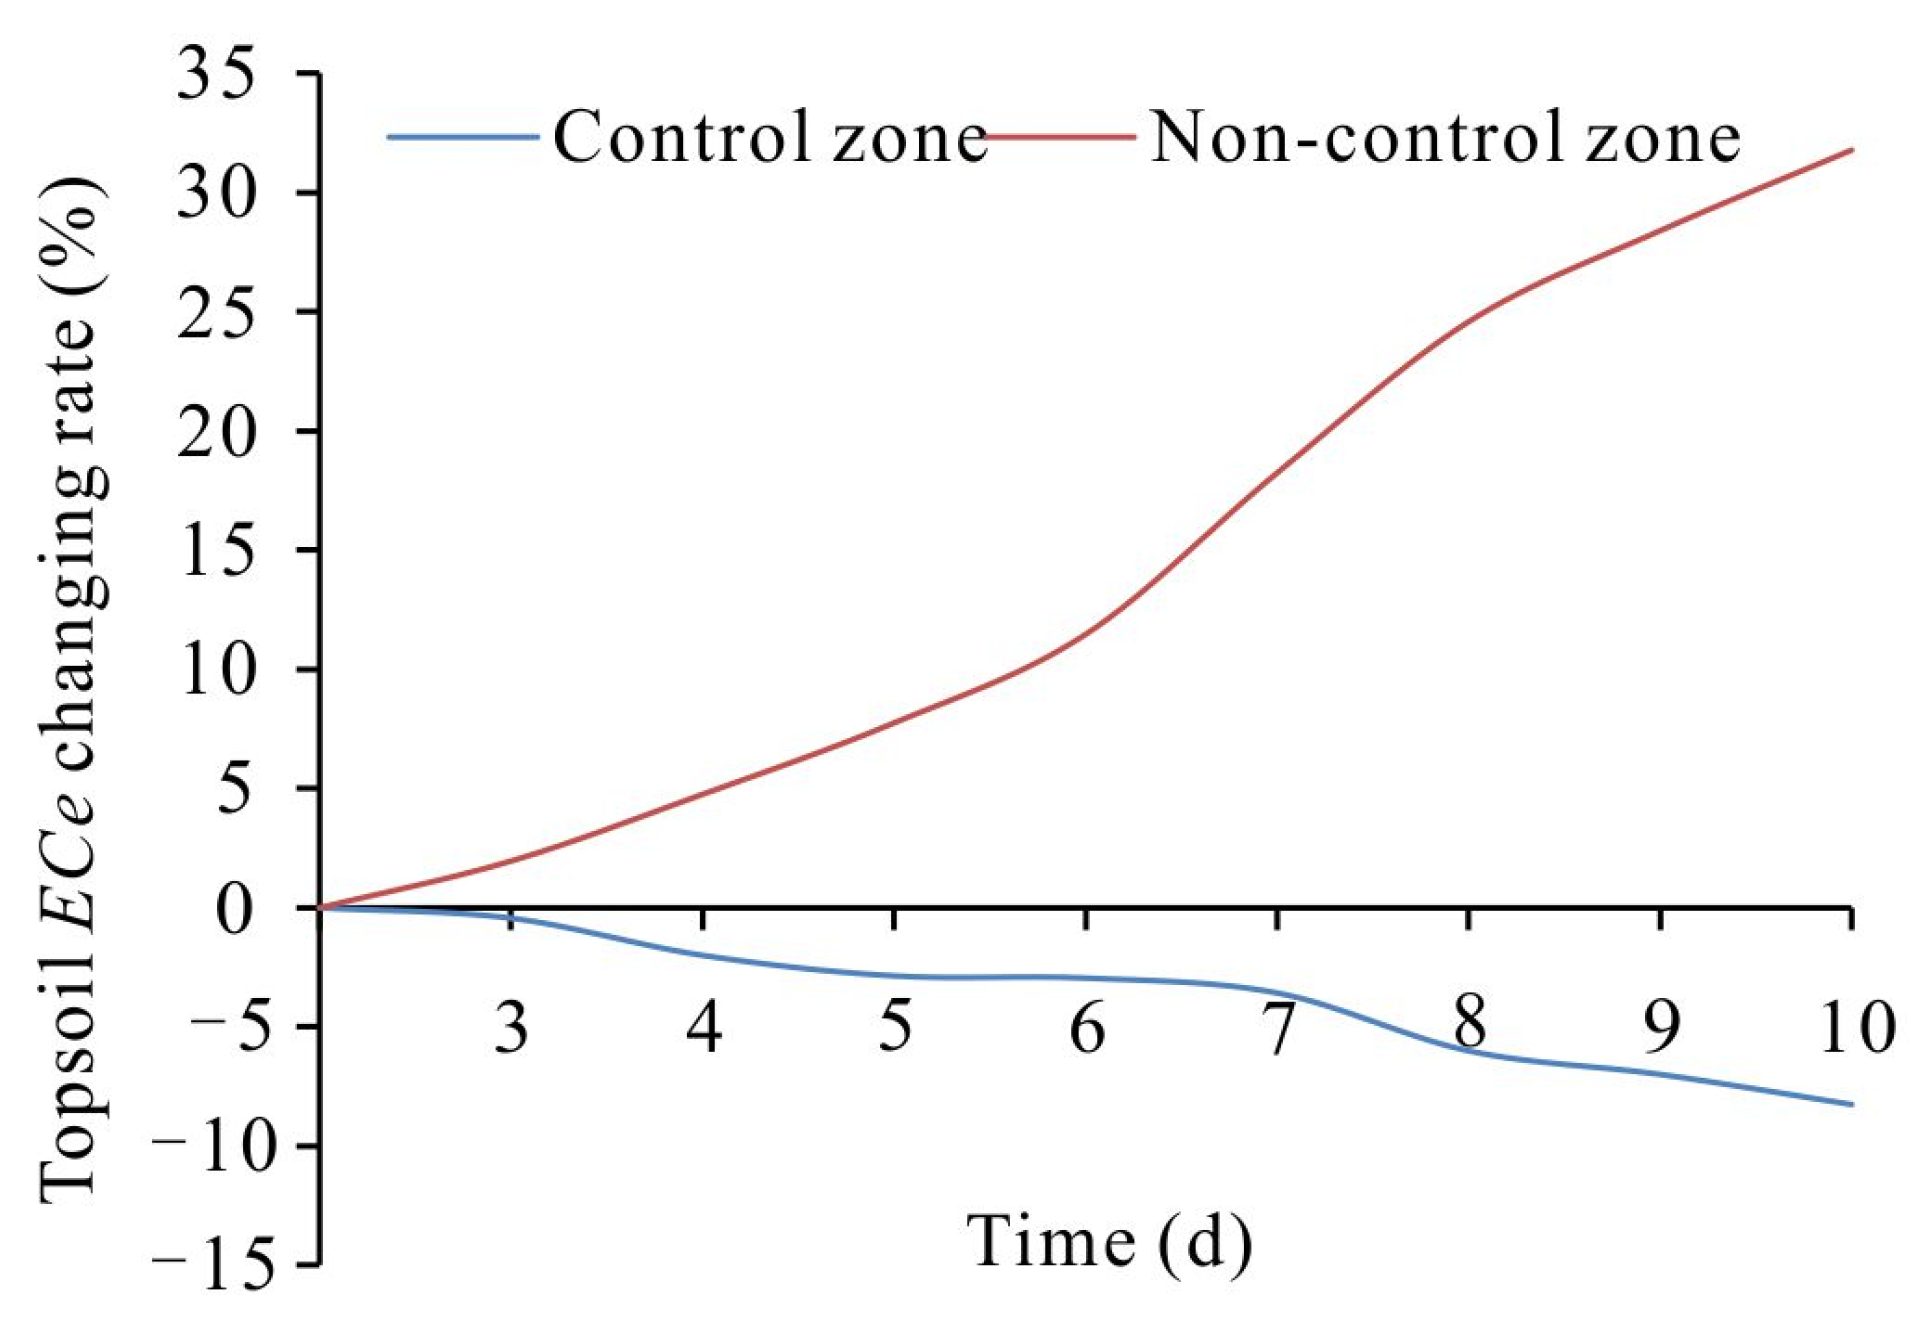
On an irrigation cycle scale, the groundwater control system contributes to the significant decrease in the increased amplitude of the topsoil ECp in the concentration stage of the topsoil solution, especially 3–8 days after irrigation.
(3)
The groundwater control system mitigates the concentration rate of the topsoil solution by increasing the groundwater depth, reducing salt transport amount from the groundwater to the topsoil and influencing the water and salt equilibrium of the topsoil solution. In the concentration stage of the soil solution, in the control zone both the moisture content and salt content of the topsoil solution are in negative equilibrium and in the non-control zone the moisture content and salt content of the topsoil solution are in negative and positive equilibrium, respectively.

Author Contributions

Conceptualization, G.Z.; methodology, P.L.; formal analysis, S.C.; investigation, Z.N., Q.W., H.C. and P.L.; Software, S.C. and P.L.; data curation, S.C.; writing—original draft preparation, P.L. and S.C.; writing—review and editing, P.L.; supervision, G.Z. and Z.N.; project administration, G.Z. and Z.N; funding acquisition, G.Z., Z.N. and P.L. All authors have read and agreed to the published version of the manuscript.

Funding

This research was funded by the Natural Science Foundation of Hebei Province (Grant No. D2021504040), the National Key R&D Program of China (Grant No. 2017YFC0406103), the Basic scientific research expenses of China Geological Survey (Grant No. SK202215) and the Geological survey project of China Geological Survey (Grant No. DD20230432).

Institutional Review Board Statement

Not applicable.

Informed Consent Statement

Not applicable.

Data Availability Statement

The data presented in this study are available on request from the corresponding author.

Conflicts of Interest

The authors declare no conflict of interest.

References

  1. Zhou, Y.; Zhao, R.; Zhao, H.; Zhang, L.; Zhang, M.; Zou, J. Effects of different fallow and wetting methods on soil and vegetation properties in the middle reaches of the Heihe River: A case study of Zhangye National Wetland Park. Acta Ecol. Sin. 2019, 39, 3333–3343. [Google Scholar] [CrossRef]
  2. Zhang, F.; Yu, A.; Wang, D. Ecological risk assessment due to land use/cover changes (LUCC) in Jinghe County, Xinjiang, China from 1990 to 2014 based on landscape patterns and spatial statistics. Environ. Earth Sci. 2018, 77, 491. [Google Scholar] [CrossRef]
  3. Wang, Y.; Li, J.; Guo, M.; Bao, A.; Hu, R.; Zhao, S. Time-series analysis of Sayram Lake area changes during 1989–2014. Arid Land Geogr. 2016, 39, 851–860. [Google Scholar] [CrossRef]
  4. Cui, H.; Zhang, G.; Wang, J.; Wang, Q.; Lang, X. Influence of multi-layered structure of vadose zone on ecological effect of groundwater in Arid Area: A case study of Shiyang River Basin, Northwest China. Water 2022, 14, 59. [Google Scholar] [CrossRef]
  5. Xu, Y.; Ge, Z.; Wang, J.; Li, W.; Feng, S. Study on relationship between soil salinization and groundwater table depth based on indicator Kriging. Trans. Chin. Soc. Agric. Eng. 2019, 35, 123–130. [Google Scholar] [CrossRef]
  6. Liu, M.; Nie, Z.; Cao, L.; Wang, L.; Lu, H.; Zhu, P. Comprehensive evaluation on the ecological function of groundwater in the Shiyang River watershed. J. Groundw. Sci. Eng. 2021, 9, 326–340. [Google Scholar] [CrossRef]
  7. Cao, L.; Nie, Z.; Liu, M.; Wang, L.; Wang, J.; Wang, Q. The ecological relationship of groundwater–soil–vegetation in the oasis–desert transition zone of the Shiyang River Basin. Water 2021, 13, 1642. [Google Scholar] [CrossRef]
  8. Zhang, Y.; Wang, X.; Yan, S.; Zhu, J.; Liu, D.; Liao, Z.; Li, C.; Liu, Q. Influences of Phragmites australis density and groundwater level on soil water in semiarid wetland, North China: Which is more influential? Ecohydrol. Hydrobiol. 2022, 22, 85–95. [Google Scholar] [CrossRef]
  9. Sun, H.; Liu, X.; Zhang, X. Regulations of salt and water of saline-alkali soil: A review. Chin. J. Eco-Agric. 2018, 26, 1528–1536. [Google Scholar] [CrossRef]
  10. Xu, Y.; Liu, H.; Gong, P.; Li, P.; Li, L.; Xu, Q.; Xue, B.; Guo, Y.; Zhang, Y.; Tian, R. Model-based optimization of design parameters of subsurface drain in cotton field under mulch drip irrigation. Water 2022, 14, 3369. [Google Scholar] [CrossRef]
  11. Zhai, J.; Dong, Y.; Qi, S.; Zhao, Y.; Liu, K.; Zhu, Y. Advances in ecological groundwater level threshold in Arid Oasis Regions. J. China Hydrol. 2021, 41, 7–14. [Google Scholar] [CrossRef]
  12. Li, M.; Ning, L.; Lu, T. Determination and the control of critical groundwater table in soil salinization area. J. Irrig. Drain. 2015, 34, 46–50. [Google Scholar] [CrossRef]
  13. Li, X.; Zhang, C.; Huo, Z. Optimizing irrigation and drainage by considering agricultural hydrological process in arid farmland with shallow groundwater. J. Hydrol. 2020, 585, 124785. [Google Scholar] [CrossRef]
  14. Yuan, C. Simulation soil water–salt dynamics in saline wasteland of Yongji Irrigation Area in Hetao Irrigation District of China. Water Sci. Technol. Water Supply 2020, 21, 2681–2690. [Google Scholar] [CrossRef]
  15. Wang, Y.; Zhao, Y.; Yan, L.; Deng, W.; Zhai, J.; Chen, M.; Zhou, F. Groundwater regulation for coordinated mitigation of salinization and desertification in arid areas. Agric. Water Manag. 2022, 271, 107758. [Google Scholar] [CrossRef]
  16. Shi, H.; Guo, J.; Zhou, H.; Wang, G.; Fu, X.; Li, Z. Effects of irrigation amounts and groundwater regulation on soil water and salt distribution in arid region. Nongye Jixie Xuebao/Trans. Chin. Soc. Agric. Mach. 2020, 51, 268–278. [Google Scholar] [CrossRef]
  17. Nie, S.; Bian, J.; Zhou, Y. Estimating the spatial distribution of soil salinity with geographically weighted regression kriging and its relationship to groundwater in the western Jilin irrigation area, Northeast China. Pol. J. Environ. Stud. 2021, 30, 283–293. [Google Scholar] [CrossRef]
  18. Li, H.; Wang, J.; Liu, H.; Wei, Z.; Miao, H. Quantitative Analysis of Temporal and Spatial Variations of Soil Salinization and Groundwater Depth along the Yellow River Saline–Alkali Land. Sustainability 2022, 14, 6967. [Google Scholar] [CrossRef]
  19. Ming, G.; Tian, F.; Hu, H. Effect of water table depth on soil water and salt dynamics and soil salt accumulation characteristics under mulched drip irrigation. Trans. Chin. Soc. Agric. Eng. 2018, 34, 90–97. [Google Scholar] [CrossRef]
  20. Zhang, H.; Li, Y.; Meng, Y.; Cao, N.; Li, D.; Zhou, Z.; Chen, B.; Dou, F. The effects of soil moisture and salinity as functions of groundwater depth on wheat growth and yield in coastal saline soils. J. Integr. Agric. 2019, 18, 2472–2482. [Google Scholar] [CrossRef]
  21. Dou, X.; Shi, H.; Miao, Q.; Tian, F.; Yu, D.; Zhou, L.; Liang, Z. Temporal and spatial variability analysis of soil water and salt and the influence of groundwater depth on salt in saline irrigation area. J. Soil Water Conserv. 2019, 33, 246–253. [Google Scholar] [CrossRef]
  22. Qi, Z.; Xiao, C.; Wang, G.; Liang, X. Study on ecological threshold of groundwater in typical salinization area of Qian’an County. Water 2021, 13, 856. [Google Scholar] [CrossRef]
  23. Wang, Y.; Chen, M.; Yan, L.; Yang, G.; Ma, J.; Deng, W. Quantifying threshold water tables for ecological restoration in Arid Northwestern China. Groundwater 2020, 58, 132–142. [Google Scholar] [CrossRef] [PubMed]
  24. Lee, H. Changes in soil salinity and upland crop productivity in reclaimed land as affected by groundwater table. Korean J. Soil Sci. Fertil. 2020, 53, 415–430. [Google Scholar] [CrossRef]
  25. Chen, Y.; Hu, S.; Luo, Y.; Tian, C.; Yin, C. Relationship between salt accumulation in topsoil of deserted land and groundwater in areas with shallow groundwater table in Kashi, Xinjiang. Acta Pedol. Sin. 2014, 51, 75–81. [Google Scholar] [CrossRef]
  26. Jia, C.; Zhang, R.; Chen, H.; Hu, Z.; Wang, J. Impact of groundwater level on salt dynamics and crop growth in coastal saline soil. J. Qingdao Agric. Univ. (Nat. Sci.) 2018, 35, 283–290. [Google Scholar] [CrossRef]
  27. Burian, S.J. Systems thinking for planning sustainable desert agriculture systems with saline groundwater irrigation: A review. Water 2022, 14, 3343. [Google Scholar] [CrossRef]
  28. Lim, S.J.; Shin, M.N.; Son, J.K.; Song, J.D.; Cho, K.H.; Lee, S.H.; Ryu, J.H.; Cho, J.Y. Evaluation of soil pore-water salinity using a Decagon GS3 sensor in saline-alkali reclaimed tidal lands. Comput. Electron. Agric. 2017, 132, 49–55. [Google Scholar] [CrossRef]
  29. Liu, P.; Zhang, G.; Cui, S.; Liu, S.; Nie, Z. Threshold value of ecological water table and dual control technology of the water table and its quantity in the salinized farmland around wetland in arid areas. Hydrogeol. Eng. Geol. 2022, 49, 42–51. [Google Scholar] [CrossRef]
  30. Hilhorst, M.A. A Pore Water Conductivity Sensor. Soil Sci. Soc. Am. J. 2000, 64, 1922–1925. [Google Scholar] [CrossRef] [Green Version]
  31. Ma, G.; Ding, J.; Han, L.; Zhang, Z. Digital mapping of soil salinization in arid area wetland based on variable optimized selection and machine learning. Trans. Chin. Soc. Agric. Eng. 2020, 36, 124–131. [Google Scholar] [CrossRef]
  32. Lin, Y.; Ding, N.; Fu, Q.; Ding, B.; Wang, J. The measurement of electric conductivity in soil solution and analysis of its correlative factors. Acta Agric. Zhejiangensis 2005, 17, 83–86. [Google Scholar] [CrossRef]
  33. Jing, W.; Jia, Z.; Luo, W. Definition, calculation and application of total water potential. Trans. Chin. Soc. Agric. Eng. 2008, 24, 27–32. [Google Scholar] [CrossRef]
  34. Xie, X.; Pu, L.; Zhu, M.; Xu, Y.; Wang, X.; Xu, C. Evolution and prospects in modeling of water and salt transport in soils. Sci. Geogr. Sin. 2016, 36, 1565–1572. [Google Scholar] [CrossRef]
  35. Zhang, Y.; Wang, W.; Hu, M.; Ling, G.; Hu, X.; Peng, X. Influence of bulk density and water content on soil electrical conductivity. Agric. Res. Arid. Areas 2022, 40, 162–169. [Google Scholar] [CrossRef]
  36. Chen, S.; Mao, X.; Shang, S. Response and contribution of shallow groundwater to soil water/salt budget and crop growth in layered soils. Agric. Water Manag. 2022, 266, 107574. [Google Scholar] [CrossRef]
  37. Yi, Q.; Cheng, Y.; Zhang, J. Analysis on the salt content characteristics of southern saline-alkali soil in Datong Basin and its causes. J. Groundw. Sci. Eng. 2014, 2, 63–72. [Google Scholar]
  38. Sun, G.; Zhu, Y.; Gao, Z.; Yang, J.; Qu, Z.; Mao, W.; Wu, J. Spatiotemporal patterns and key driving factors of soil salinity in dry and wet years in an arid agricultural area with shallow groundwater table. Agriculture 2022, 12, 1243. [Google Scholar] [CrossRef]
  39. Fan, H.; Zhang, R.; Xu, M.; Zhang, S.; Li, B. Seasonal changes and influencing factors of soil electrical conductivity in soil profile of Weibei region. J. Northwest AF Univ. (Nat. Sci. Ed.) 2018, 46, 107–115. [Google Scholar] [CrossRef]
  40. Chang, X.; Wang, S.; Chen, H.; Fu, X.; Xu, N.; Yang, X. Spatiotemporal changes and influencing factors of soil salinity in Hetao Irrigation District. J. Drain. Irrig. Mach. Eng. 2018, 36, 1000–1005. [Google Scholar] [CrossRef]
  41. Nurmamatjan, O.; Tashpolat, T.; Abdulla, A.; Deng, Y.; Mamat, S.; Zhang, F. The effects of spatial and temporal distribution of groundwater on the soil salinity in Keriya Oasis in Xinjiang. Water Sav. Irrig. 2016, 5, 23–27. Available online: https://elib.cugb.edu.cn. (accessed on 12 October 2022).
  42. Li, X.; Xia, J.; Zhao, X.; Yang, J. Water and salt distribution characteristics of shallow soil at different diving water levels. Sci. Soil Water Conserv. 2017, 15, 43–50. [Google Scholar] [CrossRef]
  43. Fu, T.; Yu, H.; Jia, Y.; Xu, X.; Guo, L. Application of an in situ electrical resistivity device to monitor water and salt transport in Shandong coastal saline soil. Arab. J. Sci. Eng. 2015, 40, 1907–1915. [Google Scholar] [CrossRef]
  44. Sun, X.; Bian, J.; Zhao, Y.; Yang, P.; Meng, X. An experimental study on water infiltration capacity and water-salt dynamic transport of saline soil. Res. Explor. Lab. 2021, 40, 12–17. [Google Scholar] [CrossRef]
Figure 1. Map showing the contours of phreatic water depth and the distribution of monitoring wells under no control measures.
Water 15 01308 g001
Figure 2. Function zones and monitoring points distribution in the experimental base.
Water 15 01308 g002
Figure 3. Intelligent groundwater control system for salinization prevention in farmland around wetlands.
Water 15 01308 g003
Figure 4. Corrected curves of moisture content of different lithologies. (a) Loam; (b) Sandy loam; (c) Silty sands.
Water 15 01308 g004
Figure 5. Changes in groundwater depths in the control and non-control zones.
Water 15 01308 g005
Figure 6. Contours of groundwater depth under the influence of the groundwater control system.
Water 15 01308 g006
Figure 7. Variable quantity of the soil bulk salt content at different depths in control and non-control zones before and after groundwater control period.
Water 15 01308 g007
Figure 8. Salt content in the soil bulk at different depths in control and non-control zones after groundwater control period.
Water 15 01308 g008
Figure 9. The total water potential at different depths along the monitoring profiles in the control and non-control zones.
Water 15 01308 g009
Figure 10. Increased amplitude of the ECp of the topsoil in the control and non-control zones.
Water 15 01308 g010
Figure 11. Change process of the topsoil ECp changing rates.
Water 15 01308 g011
Figure 12. Changes in total water potential at different depths in the control zone.
Water 15 01308 g012
Figure 13. Changes in the moisture content in control and non-control zones.
Water 15 01308 g013
Figure 14. Changes in the topsoil ECe changing rates in control and non-control zones.
Water 15 01308 g014
Figure 15. Changes in groundwater depths in control and non-control zones.
Water 15 01308 g015
Figure 16. Changes in total water potential at different depths in the non-control zone.
Water 15 01308 g016
Figure 17. Changes in the ECp of soil at a depth of 40 cm in the non-control zone.
Water 15 01308 g017
Figure 18. Main meteorological elements changes in 2020 in experimental base.
Water 15 01308 g018
Table 1. Soil moisture content and its variable quantity at different depths in the control and non-control zones 2 days and 10 days after irrigation (unit: %).
Depth/cmControl ZoneNon-Control Zone
2 Days after Irrigation10 Days after IrrigationVariable Quantity2 Days after Irrigation10 Days after IrrigationVariable Quantity
2028.3221.32−7.0029.5022.90−6.60
4030.9121.57−9.3430.9927.02−3.96
6031.3425.36−5.9831.3028.59−2.71
Disclaimer/Publisher’s Note: The statements, opinions and data contained in all publications are solely those of the individual author(s) and contributor(s) and not of MDPI and/or the editor(s). MDPI and/or the editor(s) disclaim responsibility for any injury to people or property resulting from any ideas, methods, instructions or products referred to in the content.

