Article

Design the Water Tariff Structure: Application and Assessment of a Model to Balance Sustainability, Cost Recovery and Wise Use

by
Maria Macchiaroli
,
Luigi Dolores
and
Gianluigi De Mare
*,†
Department of Civil Engineering, University of Salerno, 84084 Fisciano, Italy
*
Author to whom correspondence should be addressed.
These authors contributed equally to this work.
Water 2023, 15(7), 1309; https://doi.org/10.3390/w15071309
Submission received: 28 February 2023 / Revised: 20 March 2023 / Accepted: 23 March 2023 / Published: 27 March 2023
(This article belongs to the Section Water Resources Management, Policy and Governance)

Abstract

:
The sustainable management of water resources can be pursued through effective tariff policies capable of discouraging water wastefulness. Increasing Block Tariffs (IBT) represent a method of pricing the water service which consists of providing various tariff ranges, with a unit cost that increases as consumption increases. The definition of the consumption ranges and the relative tariffs must guarantee the right balance between the needs of the users and the need to protect the resource according to 2030 Sustainable Development Goals (SDGs). This study proposes an optimization model useful for ensuring the tariff structure complies with the guidelines dictated by the Integrated Text for Water Services Tariffs (TICSI), an Italian standard that aims to rationalize and level out the fee structure at the national level. The purpose of the model is to guarantee the sustainability of the tariffs for users, protect less well-off households, and, at the same time, to ensure that the fees grow with consumption in an optimal way for the operator, in compliance with the economic constraints imposed by the national authority (ARERA). The model, which consists of a non-linear function capable of minimizing the difference between the tariffs before and after TICSI’ rules implementation, was tested through a case study. Specifically, the optimal water tariffs for each consumption range were defined for an operator in Southern Italy. The proposed model makes it possible to integrate EU guidelines relating to “polluter pays” and the protection of water resources more effectively into the national regulatory framework.

1. Introduction

Sustainable Development Goal 6 (SDG6), which consists of guaranteeing access to water and sanitation for all, represents one of the main objectives of the UN2030 agenda [1]. Despite the important steps made to pursue this goal, the global water crisis continues to grow causing serious disruption in the domestic, agricultural, industrial and commercial sectors [2,3]. In many regions of the world, we are witnessing serious water shortages caused by drought, climate change, demographic growth and mismanagement of the resource [4]. Globally, water abstraction increased 6.5 times between 1900 and 2010 and reached 4000 km3 per year. The extracted water is mainly destined for agricultural (69%), industrial (19%) and municipal (12%) uses [5]. In recent decades, the global water demand has seen a growth rate twice as large as that of the world population. Demand is set to increase by 55% in 2050 compared to the 2000 reference scenario [6]. As of 2021, the total consumption of water on a planetary scale was approximately 4500 km3/year, while the amount of water that can no longer be recovered (i.e., which does not return to the source after use) was approximately 2450 km3/year, i.e., 55% of total consumption. Total water consumption has increased by about 24 km3/year in the last twenty years. In the same period, the amount of water that can no longer be recovered increased by about 12.6 km3/year. The domestic sector is responsible for 11% of the world’s total water consumption and 3% of the amount of non-recoverable water [7]. In Europe, 21% of abstracted water is used for public water supply [8]. In the ranking of per capita water consumption, Italy (153 m3/year), Ireland (128 m3/year), Bulgaria (119 m3/year) and Croatia (111 m3/year) are at the top. Most EU Member States, 20 out of 27 countries, withdrew between 45 and 90 m3 of fresh water per person for public supplies. The lowest volume is recorded in Malta, with 30 m3/year per person [9]. Italians are the largest consumers of water in Europe, with 220 L per day per capita against a European average of 165 L. Furthermore, again in Italy, in 2020 water losses of 41 m3/day per km of the network were recorded in the provincial capitals/metropolitan cities, corresponding to 36.2% of the total water introduced into the distribution network. The average monthly expenditure per household for the supply of water for domestic use was EUR 14.68 (equal to 0.6% of the total expenditure for the consumption of goods and services). Specifically, the average monthly household expenditure is EUR 17.48 in the South, EUR 16.50 in the Center and EUR 12.05 in the North [10].
To counter the problem of water scarcity, two different political strategies are being implemented all over the world. The first, oriented towards supply, consists of the expansion and efficiency of water infrastructures. The second, oriented towards demand, consists of limiting consumption by controlling water tariffs. The latter approach has raised doubts regarding social equity, as low-income households are more sensitive to price increases than high-income households. Nonetheless, a non-linear water pricing system is often used globally to incite users to reduce water consumption [11]. Pricing is a tool capable not only of improving the efficiency in the use of water resources but also of facilitating the recovery of costs by the operators, as in the energy sector [12,13,14,15]. The correlation between consumption and water tariff has been proven in many research papers. In this sense, a recent study estimated the representative function of standardized water consumption. It is shown that consumption depends on various parameters. Standing out among these are the population, concerning which there is a relationship of direct proportionality with consumption, and the price, concerning which there is a relationship of inverse proportionality. Therefore, the price of water is a parameter which, when it increases, leads to a decrease in water consumption [16]. The breakdown of water tariffs by consumption bracket is a policy many countries adopt to reward users who consume the least water and penalize those who waste the most. Many studies demonstrate the benefits in terms of reduction in consumption deriving from tariff articulation policies. According to these studies, higher tariffs reduce water consumption. Moreover, it has also been shown that in most cases consumption is price inelastic [17,18,19,20,21]. In this sense, in the United States, a 10% increase in the domestic water tariff on average results in a reduction in consumption of 3–4% in the short term and 6% in the long term [22]. In Europe, price elasticity is generally higher [23]. Globally, few studies have reported price elasticity estimates higher than −0.25 [24]. The breakdown of water tariffs by consumption range takes the form of Increasing Block Tariffs (IBT) [25]. The goal of the countries that use this approach is to reconcile economic accessibility with the creation of water infrastructures and the recovery of costs (including environmental ones). In this way, by applying increasing marginal tariffs as the consumption range increases, the intention is to make water for luxury uses more expensive than that consumed for necessity. Therefore, a large part of the operating, management and environmental costs end up weighing on the users who consume the most. Tariff structures designed in this way should allow poor groups to obtain greater benefits than higher-income consumers. The IBT is therefore a form of cross-subsidy in which the access to water of the poorest users is paid for by penalizing the higher consumption of the richest users [26,27]. However, some scholars believe that the IBT has hurt large and poor households that consume much more water than small and wealthy households [27,28]. In part, an attempt has been made to compensate for this unequal situation by reconciling the IBT structure with social tariffs in support of low-income households, as in certain context for the residential property markets [29,30]. Many authors highlight the benefits of IBTs, finding them more efficient compared to other tariff policies at reducing water consumption [31,32,33,34,35].
Within the European Community, Directive 2000/60/EC provides that the Member States are required to respect the principle of recovery of the costs of water services, including environmental and resource-related costs, according to the “polluter pay” principle. Water pricing policies must incentivize users to use water resources efficiently and contribute to the cost recovery of water services. To this end, it is necessary to regulate in detail the use of water in the following critical sectors: industry, agriculture and households [36]. In Communication COM(2000)477, the European Commission (EC) specifies that water tariffs must be proportionate to the water used or to the pollution produced, fulfilling an incentive function on the efficient use of water [37]. Furthermore, in the Communication COM(2014)177, it is noted that for the European Union (EU) the principle of affordability of water services is fundamental. In this sense, it is up to the individual national authorities to adopt measures to protect disadvantaged social groups, possibly to be integrated with IBT policies [38]. The EU recognizes that IBTs constitute a suitable means of encouraging the efficient use of water resources.
In Italy, European-oriented policies have been implemented by various resolutions whose purpose is the regulation of water services. In particular, the Regulatory Authority for Energy, Networks and the Environment (ARERA), an independent Italian body which carries out regulation and control activities in the fields of electricity, natural gas and water services, has issued the Resolution 665/2017/R/idr which introduces the Integrated Text on Water Services Tariffs (TICSI) with Annex A. The resolution contains the provisions concerning the criteria for the definition of the tariff structure applied to the users of the Integrated Water Service. The Area Government Bodies (EGA), i.e., the bodies identified by the Regions to which the exercise of responsibilities in the field of water resource management and water infrastructure planning is transferred, are called to follow the provisions of the TICSI for the reorganization of the fee structure for end users. Concerning domestic users, starting from 1 January 2018 a per capita criterion was introduced by which the tariff payments are determined according to the number of members of the household. The introduction of this criterion guarantees the possibility of rewarding virtuous behavior and, conversely, discouraging waste. The water tariffs are divided into consumption bands, following the IBT structure. The main objective of TICSI is to reorganize the fees applied to users by rationalizing the types and sub-types of use (for instance, domestic and non-domestic), and the tariffs for the collection and purification of industrial waste authorized for discharge into the public sewer. Another objective is to standardize the tariff structures applied at the national level. In Italy, before the introduction of TICSI, there was a strong lack of homogeneity regarding the classification criteria of the various user categories. Consequently, this non-homogeneity also extended to calculate the tariffs associated with each of the categories [39].
Although it was introduced in 2017, the TICSI resolution is still implemented with a certain slowness. In 2018, this forced the ARERA to start a monitoring procedure for its application (Resolution 636/2018/R/idr of 5 December 2018) [40]. Furthermore, the TICSI has not yet been effectively applied in various areas of Italy for various reasons (mainly related to the lack of documents and data necessary for tariff purposes). Nonetheless, the water service managers must in any case correctly apply the tariffs defined according to the methods established by the TICSI. These tariffs must then be approved by ARERA. In defining the breakdown of water tariffs according to the criteria established by TICSI, it is necessary to guarantee compliance with a series of economic constraints imposed by ARERA. The standard limits itself to defining these constraints but does not suggest a real iterative procedure to be applied to define the IBT structure. Basically, in defining the consumption ranges and the respective water tariffs, the operators are free to move in total freedom, as long as compliance with the basic constraints is guaranteed. However, the procedures adopted are not always capable of simultaneously optimizing and reconciling the financial objectives of the operators, those of saving for users (especially low-income users) and those of protecting the water resource promoted by the National Authority (ARERA).
Regarding the latter problem, the goal of this work is to propose a mathematical optimization model to implement the tariff structure established by the TICSI guaranteeing compliance with the economic constraints set by the standard. Specifically, a non-linear function is defined that can minimize the differences between the tariffs before and after TICSI [41,42,43]. The objective is to guarantee the sustainability of the tariffs for the most virtuous users and, at the same time, to ensure that the fees grow proportionally to consumption in an optimal manner for the operator. The proposed model is tested through a case study. In particular, for an operator of Southern Italy, the consumption bands and the respective water tariffs were defined through the optimization function. The subject of the study is only the domestic tariffs relating to the aqueduct service. The results were compared with those obtained by the operator following the general indications of TICSI without applying the mathematical model. It is demonstrated that the proposed function can better receive the community guidelines relating to the “polluter pays” principle and the protection of water resources. The model lends itself to valid applications even outside the Italian borders, with results effective for any IBT structure. The proposed operational protocol represents a valid tool to reduce water waste and ensure the pursuit of the SDG6 defined by the United Nations.
The work follows the following structure: Section 2 is dedicated to the analysis of reference literature on mathematical optimization models applied in the water sector; Section 3 describes the economic constraints established by TICSI and defines the proposed operating model; in Section 4 the model is applied to the case study and the main results are presented and discussed; Section 5 reports the main conclusions and highlights future research ideas.

2. State of the Art

The IBT is a mechanism used in water pricing which provides for the application of a tariff that progressively increases as consumption increases. According to this mechanism, each tariff is made up of a fixed portion and a variable portion. In particular, the fixed fee serves to guarantee a level of revenue per user with which to cover the fixed costs associated with the provision of the service, while the variable fee has the objective of promoting sustainable use of water using increasing tariffs for blocks of consumption. Therefore, it is only the variable portion that grows as the amount of water consumed increases. As anticipated, the main objective of the IBT is to promote more efficient and sustainable use of water, especially for those groups of users who consume the most [44].
The IBT approach is mainly oriented towards the conservation of water resources, but also towards the generation of revenues which are appropriately redistributed between high and low-income consumers. In this sense, Wichelns (2013) demonstrated that IBT can achieve a threefold objective of affordability, revenue generation and conservation, provided that: (1) the first tariff block is subsidized; (2) the tariff of the second tariff block is sufficient to cover the operating costs and subsidies provided to consumers of the first tariff block; (3) the consumed volumes of the third block are sufficient to cover both operating and investment costs [45,46].
Operations research models can be used to determine the number of consumption bands, the size of each band and the rates associated with them. These models can take into account various factors such as water demand, cost of water supply, regulatory target and consumer preferences. The aim is to find a combination of consumption bands and tariffs that maximize the profit of the water supplier or minimize the total costs for the consumers. However, it is important to note that the use of operational research models in water tariff design depends on the availability of accurate and reliable data on water demand, supply costs and consumer preferences. Furthermore, the effectiveness of such models may vary depending on local conditions and regulatory requirements.
There are many examples of the application of operational research models for the design of water tariffs. Most of these models simulate a change in the existing tariff and, therefore, the definition of a new tariff. Moreover, these models can be monoparametric or multiparametric, but also static or dynamic [28]. Among the models that use econometric techniques, we note that of Renzetti (1992), who used a simulation program to estimate the efficient prices of a water company representative of Vancouver, Canada [47]. García-Valiñas (2005) estimated for the Spanish municipality of Seville the optimal prices for the urban water distribution service based on the theoretical frameworks suggested by Ramsey (1927) and Feldstein (1972) [48]. Diakite et al. (2009) used econometric functions to design a non-linear social tariff for residential water in the Ivory Coast [49]. García-Valiñas et al. (2010) used a Stone–Geary utility function to estimate the amount of water that covers the basic needs of families residing in some municipalities in southern Spain, relating the amount of money paid for this level of consumption with middle incomes [50]. Rinaudo et al. (2012) used an econometric analysis to develop a regional water model for 300 municipalities in the South of France, simulating the potential impact of various water pricing scenarios on aggregate demand [51]. Reynaud (2016) constructed a water demand function for nine European countries demonstrating that, in most cases, the full cost recovery principle does not lead to substantial problems of water accessibility for households [52]. A second approach, again based on econometric models, consists of using aggregated data [28]. For example, Garcia and Reynaud (2004) used an econometric model to describe water supply and demand based on 50 French water utilities, estimating efficient prices at the aggregate level [53]. Other studies use simulation techniques. In this sense, Hoffman and du Plessis (2013) presented a model that considers the variation of the price elasticity per tariff block [54]. Sahin et al. (2017) evaluated, through a simulation model based on Dynamic System Modeling (SDM), the complex interrelationships between water tariff, demand and revenues that arise following the hypothetical introduction of an IBT structure in the Gold Coast region, Australia [34]. Ahmad and Prashar (2010) developed a dynamic simulation model for South Florida to capture the interrelationships between water availability and municipal, agricultural and environmental water needs [55]. Rosenberg (2010) applied an existing deductive model of residential water use to the intermittent supply system in Amman, Jordan [56]. Yates et al. (2013) explored the efficiency of a drought plan for a public water utility in California (USA) using specially developed software tools that correlate rates to other variables [57]. Based on three criteria (financial self-sufficiency, equity and economic efficiency), Nauges and Whittington (2017) simulated the transition from a uniform volumetric tariff to different IBT tariff hypotheses, analyzing the variations in terms of consumption and expenditure for families [58]. Wolak (2016) proposed an optimization model that considers multiple variables to define non-linear pricing plans for water utilities capable of pursuing the competing goals of revenue and water conservation [59].
As regards the ordinary least squares method (OLS) used in this study, it appears that it is not commonly used in the context of the Integrated Water Service to define the number of consumption blocks as well as the size and the unit tariff for each block. OLS is typically used for other water management purposes, such as estimating future water demand, predicting surface water flow, and estimating the level of water pollution. In all these cases, the least squares method is used to find the best mathematical relationship between two variables to minimize the difference between the observed and predicted values. For example, Chicoine et al. (1986), employ least squares estimates within a model of drinking water demand for some rural water districts [60]. Similarly, Nieswiadomy and Molina (1988) estimate a residential water demand equation using the least squares method and using a dataset on monthly water consumption per individual user within an IBT context [61]. The OLS model is applied in many other studies to estimate the demand for water by residential users [62,63,64,65,66].
Here, the OLS method is implemented, in compliance with the TICSI standard, to define the consumption bands and the respective water tariffs for a water manager operating in Southern Italy. The proposed model considers all the restrictions and requirements imposed by the national authority (ARERA). The model intends to reconcile the regulatory provisions with the objectives of sustainability of user tariffs and optimal growth of fees for the operator.

3. Model

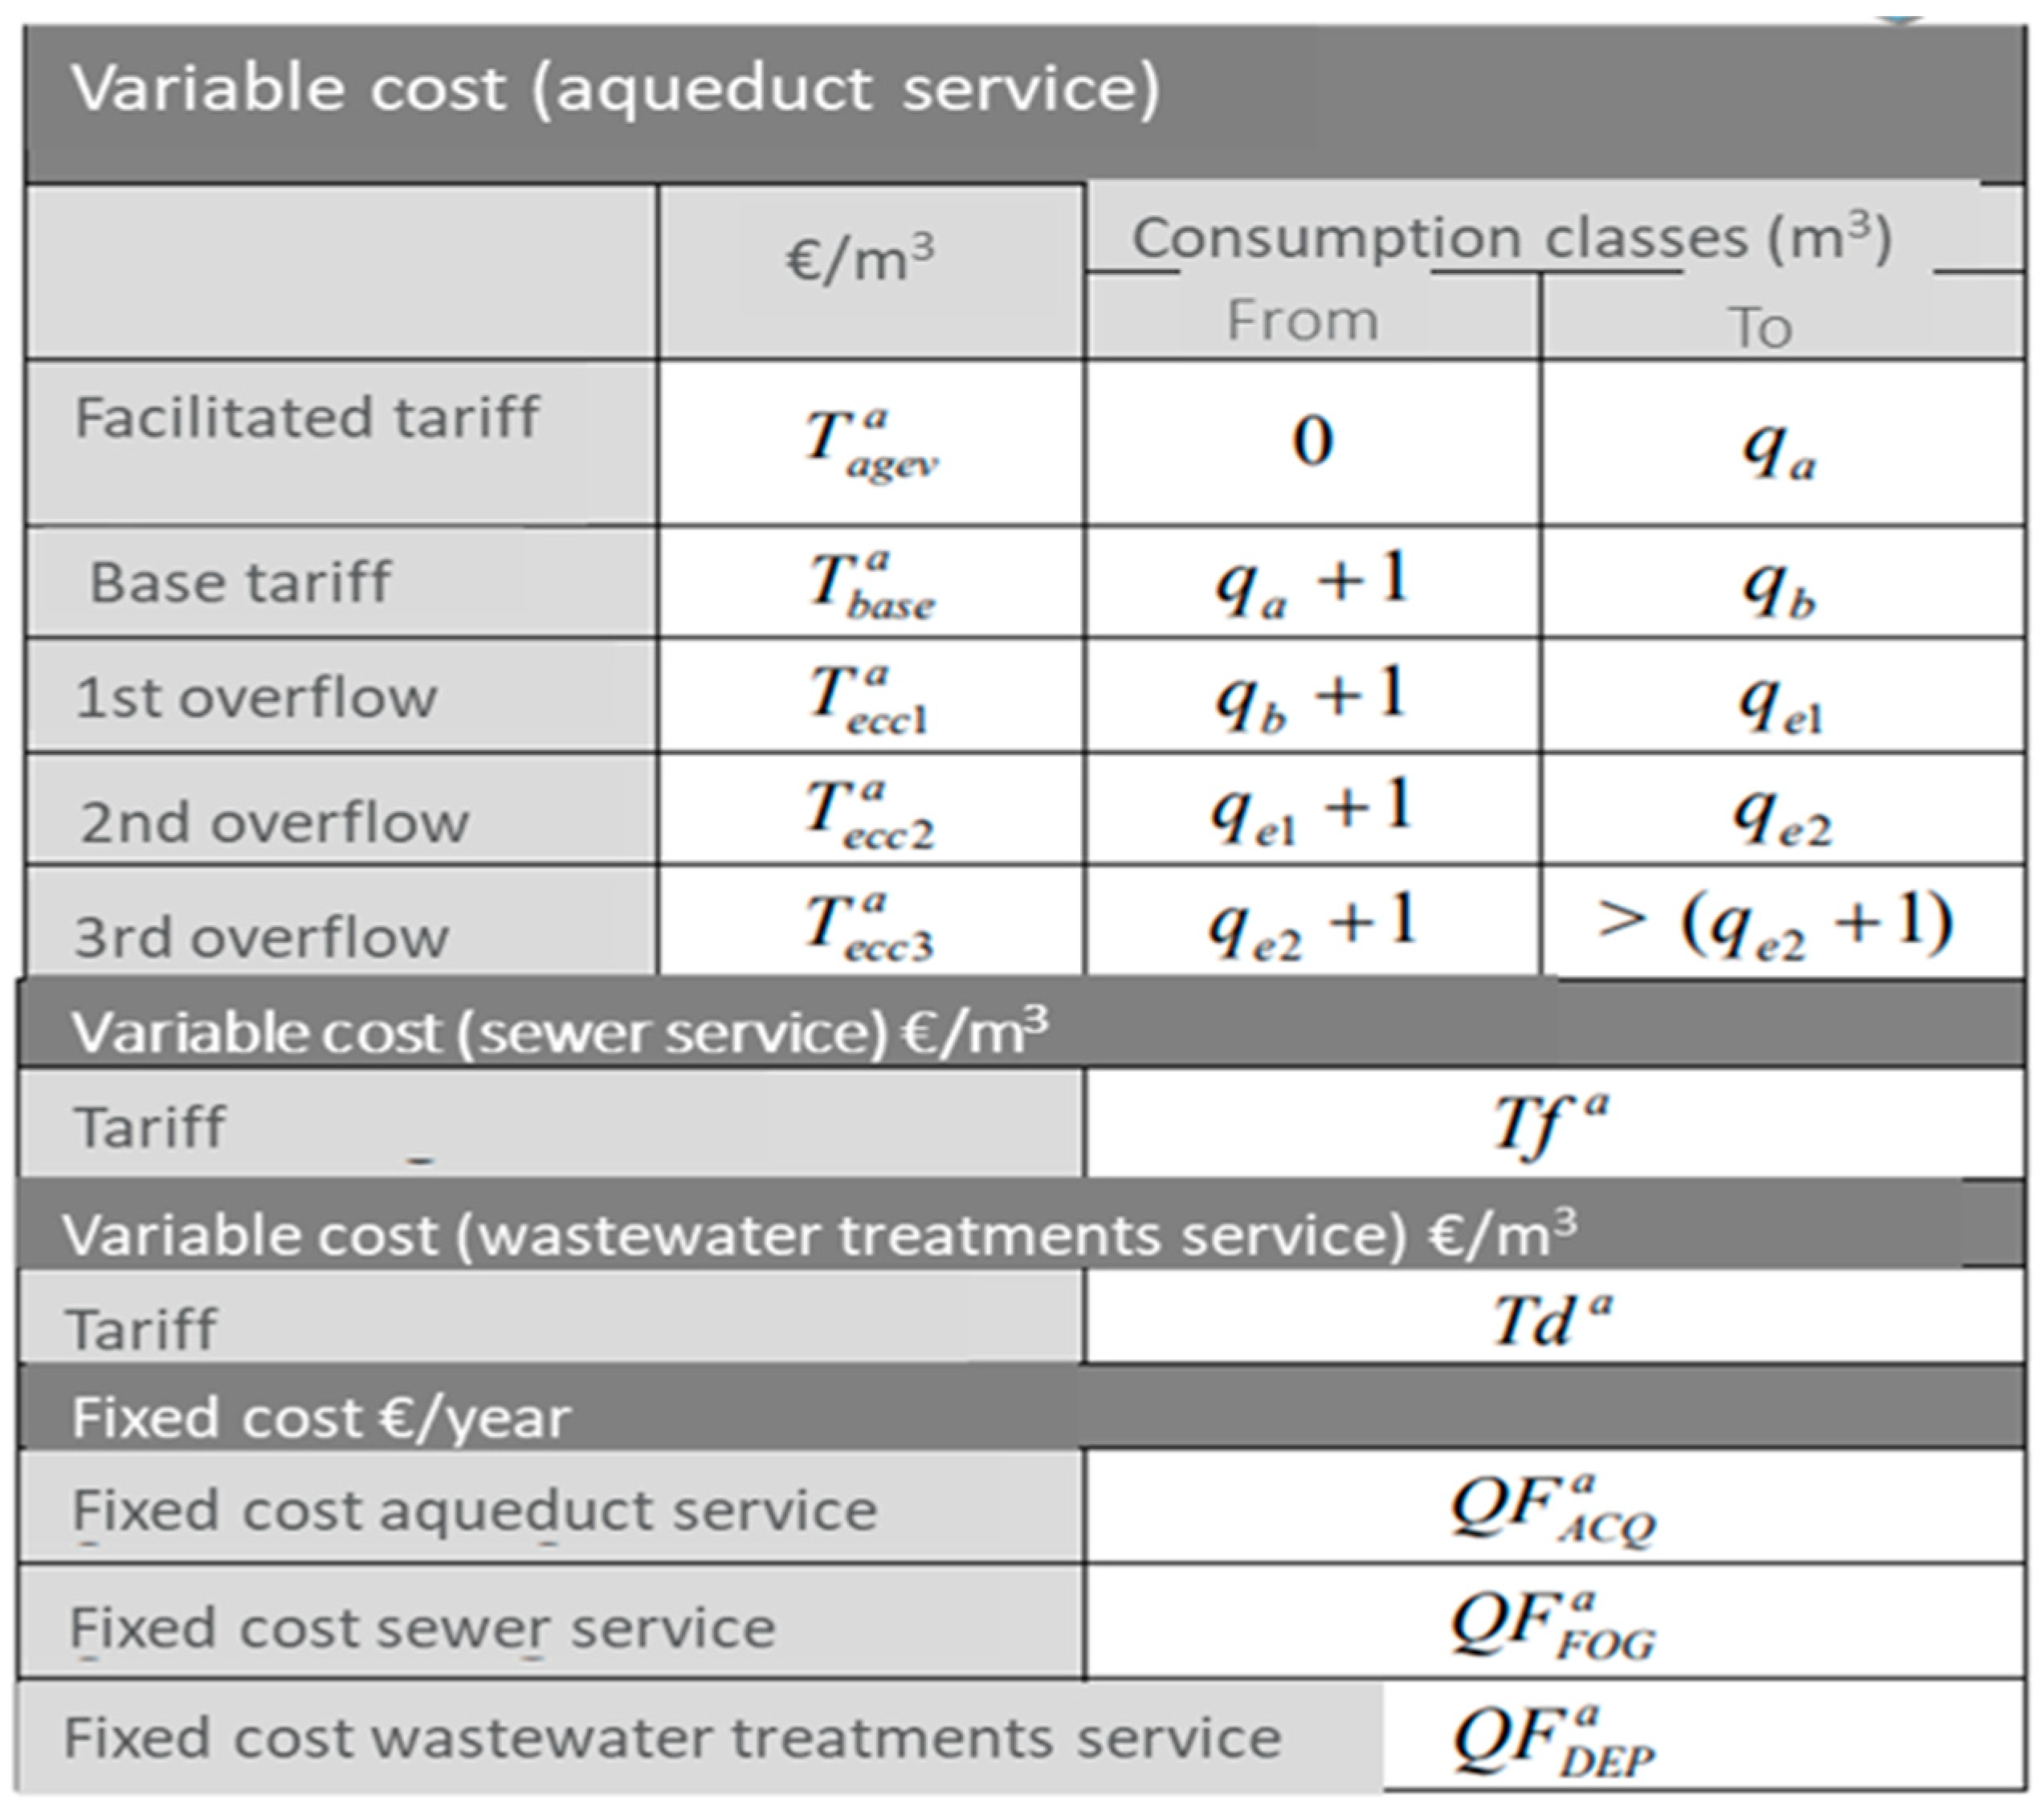
3.1. Model Constraints

The tariff structure represents an element of fundamental importance in the management of water resources, as it affects both the economic sustainability of the system and the ability to guarantee fair and sustainable access to water resources.
As anticipated, in Italy the Regulatory Authority for Energy, Networks and the Environment (ARERA), an independent body that carries out regulation and control activities in the fields of energy, waste and water services, with Resolution 665/2017/R/idr (Integrated Text on Water Services Tariffs-TICSI) redefines some concepts of water tariffs that had remained quite vague in previous tariff methods and redesigns the tariff structure, especially for domestic users, introducing some principles of fairness and seeking to standardize ranges and fees at the national level. The main objectives of the TICSI are the following:
  • ensuring a facilitated and continuous water supply for the largest families, with significant discounts aimed at guaranteeing everyone a sufficient volume of drinking water in the order of 50 L per inhabitant per day, equal to 18.25 cubic meters of water per year;
  • increasing the level of severity towards those who do not pay, so as not to jeopardize innovation in the sector due to physiological arrears;
  • encouraging the sustainable use of water resources through measures aimed at reducing water waste.
To pursue these objectives, the tariff models structured according to the provisions established by ARERA envisage a binomial subdivision of the tariff into a fixed portion (QF), which does not depend on consumption, and a variable portion (QV), proportional to consumption. These two tariff components are generally differentiated according to the type of use of the resource (domestic, commercial, industrial, etc.). For the water supply service only, the variable component (QV) is divided into ranges or blocks of consumption, which can vary from a minimum of three to a maximum of five. This subdivision allows the rate to be calibrated more precisely based on the user’s actual consumption, encouraging more efficient and responsible use of the resource.
ARERA, through the TICSI tariff system, regulates the various categories of users present on the national territory (domestic, industrial, etc.) and controls the effects that the new tariff structures have on the operator’s revenues. In this discussion, we will focus solely on the aqueduct service and domestic users. Following the application of the new fees, it is necessary to satisfy the following iso-revenue constraint:
u tarif _ u a ( vscal _ u a - 2 ) T = u tarif _ u new , a ( vscal _ u new , ( a - 2 ) ) T ,
where:
  • u tarif _ u a ( vscal _ u a - 2 ) T refers to the revenues generated by the application of the pre-existing tariffs to the original articulation of the scale variables (consumption ranges);
  • u tarif _ u new , a ( vscal _ u new , ( a - 2 ) ) T refers to the revenues generated by the application of the new tariffs to the new articulation of the scale variables (consumption ranges), determined starting from the re-modulation of the pre-existing variables based on the criteria established by the ARERA.
The iso-revenue constraint aims to ensure the economic sustainability of the water sector by avoiding any general increases in tariffs that could hurt users. Therefore, in a specific year, the revenues for the operator must remain constant if the total consumption of all users remains unchanged.
In addition to this constraint, TICSI considers the application of a series of criteria that vary according to the use of the resource. In defining consumption levels (see Figure 1), it is necessary to consider a first band with a reduced tariff (Tred) in compliance with the provisions of article 2 of the decree of the President of the Council of Ministers of 13 October 2016, to guarantee access universal to water. This range applies to domestic users only. The minimum value of subsidized consumption is set by law at 18.25 m3 of water per year (50 L per day) for each member of the domestic user. By analyzing households, it is possible to calculate what the minimum per capita consumption corresponds to, to be attributed to the subsidized range. The larger the household, the greater the variable subsidized band will be, to trigger the basic rate later.
Operators can determine the subsidized range starting from the capillary collection of user data. In the absence of certain data, ARERA allows you to define the subsidized rate range starting from the assumption that each family is made up of three members (standard per capita criterion). In addition to the first band with a discounted rate (Tred), a second band with a basic tariff (Tbas) and one to three excess tariffs (Texc,1, Texc,2, Texc,3) must also be defined. TICSI establishes that the new Tbas must be calculated by multiplying the previous basic tariff by a parameter, ϑ (tariff multiplier), in compliance with the regulatory schemes’ matrix (in Figure 2).
In compliance with Italian asymmetric regulation, based on different criteria to define the water tariff, through the tariff multiplier, a part of the costs incurred by the operators is transferred to consumers so that domestic users benefit from the service with continuity. Specifically, for the calculation of the parameter ϑ it is necessary to consider the costs of the fixed assets, operating, environmental and resource, and any higher costs due to the aggregation processes of the management of the water service and/or an improvement of the contractual quality. The tariff multiplier is determined based on the provisions governed by Article 3 of Annex A of Resolution 580/2019/R/ID (Water Tariff Method 2020–2023-MTI-3) and subsequent amendments [67]. The basic principle of the tariff multiplier ϑ is that of full cost recovery, sanctioned by the European Commission with the Communication COM(2000)477, according to which consumers must contribute, through the water tariff, to the coverage of operating, fixed, environmental and resource costs supported by operators [37].
Once the basic tariff (Tbas) has been determined, it is necessary to ensure that the reduced tariff (Tred) respects the following constraint:
50 %   T bas     T red     80 %   T bas .  
In most real application cases, Tred = 65% Tbas is set. Instead, for the excess tariffs (Texc,1, Texc,2, Texc,3), the following progressivity constraints must be respected:
T exc , 1     T exc , 2     T exc , 3 ,       and       T exc , max     6   T red .  
Finally, the fixed tariff QF of the aqueduct service must comply with the following constraint:
R ( QF )     20 %   TR ,  
where R(QF) indicates the fixed tariff revenues, while TR indicates the total revenue from the service. Once the constraints imposed by the national authority have been translated into formulas, it is possible to move on to the phase of definition of the mathematical optimization model [39].

3.2. Model Definition

It is possible to solve the problem of defining a tariff structure that respects the constraints of the TICSI using mathematical optimization tools. These tools have been used for several decades to support decisions regarding the management of water resources, but their application in the regulatory context of the SII and the definition of the fee structure is much less widespread. In particular, the application of the Ordinary Least Squares (OLS) method for determining the consumption bands and the respective water tariffs in compliance with the constraints established by the TICSI standard represents an absolute novelty. As is known, OLS is a mathematical technique used to estimate the parameters of a mathematical model, to minimize the difference between the observed values and those predicted by a model. The method was first formalized by the French mathematician Adrien-Marie Legendre at the end of the XVIII century [68]. Subsequently, the mathematician and physicist Carl Friedrich Gauss independently developed the OLS method, publishing his results in 1809. Gauss improved Legendre’s theory and introduced some fundamental mathematical concepts [69]. The method consists of identifying the parameter values of a mathematical model that minimize the sum of squared differences between the observed values and those predicted by the model (square deviation or sum of residual squares).
In the specific case, the mathematical optimization model for the definition of the tariff structure has four unknown variables: the three excess tariffs Texc,1, Texc,2, Texc,3 and the percentage of the impact of the fixed tariff revenues R(QF) on the total revenue from the service. The constraints to be respected are defined by Equations (1)–(4). The objective function of the model, which allows minimizing the sum of the squares of the differences between the fee paid by the ith user with the pre-TICSI articulation (yi) and that paid by the same user with the post-TICSI articulation ( y ¯ i ), is defined by the following Equation (5):
min i = 1 n y i y ¯ i 2 .
In general, minimization problems can be solved analytically if the mathematical model is linear, or by the use of numerical algorithms if the model is non-linear. The Generalized Reduced Gradient (GRG) is a numerical optimization algorithm used to solve minimization problems of nonlinear functions subject to constraints [70]. In general, the GRG algorithm can be used to solve a wide variety of nonlinear optimization problems, including nonlinear regression, parameter estimation, multivariate data analysis, and mathematical programming. So, the GRG can be used to solve regression problems involving the method of least squares, i.e., to find the parameter values of a nonlinear model that minimize the sum of the squared errors. The GRG algorithm is based on the gradual reduction of the size of the constraints of the problem, by selecting a subset of active constraints which define the boundary of the feasible region. The GRG algorithm then searches for model parameter values that minimize the objective function subject to these constraints. It allows the identification of local optimum solutions for smooth nonlinear problems, i.e., solutions that satisfy the Karush–Kuhn–Tucker (KKT) conditions [71,72,73]. In the present case, the GRG algorithm was applied to solve Equation (5). However, the method does not guarantee the presence of globally optimal solutions, i.e., those which are valid for any starting point. To solve this problem, the GRG method can be used with the Multistart option in the Excel software, which allows the provision of different starting points in the feasible domain and to search, from time to time, for optimal solutions. In this way, the possibility of finding globally optimal solutions is increased.
Returning to the reasons for this study, the tariff review produces a certain impact on consumers, although it does not involve any change in revenues for the manager. The minimization of the sum of the squares of the differences between the pre- and post-TICSI tariffs guarantees the sustainability of the tariff reform for users, in particular for the domestic population studied in this work.

4. Results and Discussion

4.1. Results

The model defined in Section 3 was implemented to determine the water tariffs for a Municipality in the area managed by an operator in the Campania region, in Southern Italy (Figure 3).
In the year of analysis, there was a total population of 612 inhabitants and about 165 households. As mentioned, only the aqueduct service relating to domestic use was analyzed. The water distributed to users comes 100% from local springs and production centers and is supplied directly through an interconnected water distribution network. The water service provided is aimed at satisfying the needs of users for diversified uses:
  • resident domestic use;
  • non-resident domestic use;
  • non domestic use.
As regards domestic use, the number of users served is 257. The total quantity of water supplied to domestic users each year is 31,136 m3/year.
The tariff structure for domestic users adopted by the operator before the introduction of the TICSI is presented in Table 1.
Table 1 shows that the tariff structure in force before the TICSI introduction, although it presented a reduced tariff (Tred), a basic tariff (Tbas) and an excess tariff (Texc,1), violated the constraints (2), (3) and (4) established by the TICSI regulation. The new consumption bands were determined once the new scale variables had been defined, i.e., the volumes of water consumed for the new tariff bands, respecting the standard per capita criterion. Figure 4 shows the users’ consumptions by tariff bands. In compliance with the TICSI reform, the basic tariff (Tbas) remains unchanged, while the reduced tariff (Tred) has been set at 65% of the basic rate.
To simplify the process, the basic tariff remains unchanged concerning the pre-existing situation (the tariff multiplier ϑ is therefore set equal to 1). Instead, the discount percentage (which, as mentioned, corresponds to 65% of the basic tariff) is established for the entire Optimal Territorial Area (ATO) by the local Government Body of the area (EGA). By ATO we mean the territory based on which the water services are organized. The EGAs, on the other hand, are the bodies identified by the Regions for each ATO to which the exercise of the Municipalities’ responsibilities in the field of water resource management is transferred, including the planning of water infrastructures. As already mentioned, it is up to the EGAs to prepare the tariff and send it to ARERA for approval [67].
The use of the solver, using the method described in Section 3, made it possible to define the new post-TICSI tariff structure for domestic users, as shown in Table 2.
Particularly interesting is the analysis of the impact that the application of the optimizing model has on domestic users. Figure 5 shows the trend of payments due by the ith user as a function of the volumes of water consumed for the following three scenarios: (i) application of the pre-existing tariff structure (in black); (ii) application of the tariff structure deriving from the TICSI elaborated by the operator without using the proposed model (in red); (iii) application of the tariff structure obtained through the adoption of the optimization model introduced in the present work (in green).
For the three scenarios analyzed, the graphs in Figure 5 describe how the payment to be paid to the operator varies for the individual user as consumption varies.

4.2. Discussion

From the analysis of the results, obtained by first applying the provisions regulated by TICSI and then integrating the latter with the proposed optimization model, some fundamental considerations emerge. In the first place, it is advisable to dwell on the tariff structure obtained by following the indications of the TICSI without the aid of the model. Examining the data reported in Table 1 and Table 2, it can be seen how there is a shift from a wider reduced tariff consumption range for the pre-TICSI scenario to a less wide one for the post-TICSI scenario. Furthermore, by implementing the indications of the standard, the Tred unit tariff also increases. The new articulation would seem disadvantageous for the more virtuous and attentive users of water consumption. However, in reality, the exact opposite happens due to a fundamental aspect. The simultaneous respect of the constraints represented by Equations (1) and (4) requires that the increase in Tred must correspond to a substantial lowering of the fixed tariff QF. The latter is reduced by 68.9%, generating a significant reduction in overall costs for users with low water impact (as can be seen from reading the graph in Figure 5 considering the consumptions between 0 and 100 m3). However, this significant saving for the first consumption range may not be perceived immediately if only the variable portion QV is observed. By this, raising the subsidized tariff and reducing the relative consumption range can set in motion a virtuous process which encourages all users, including those for whom consumption is already low, to reduce wastewater as much as possible. Always considering the post-TICSI scenario adopted by the operator, it can be verified that the basic tariff Tbas has remained unchanged compared to the previous situation (as mentioned, since the operator is a Municipality, a tariff multiplier ϑ equal to 1 is assumed). However, the related consumption range has also undergone a significant reduction in terms of size, as well as a reduction in minimum and maximum volumes. This leads to a significant increase in the fees paid by each user for consumption included in the second bracket. Starting from consumption exceeding 100 m3/user per year, the cost of the service begins to become higher than that envisaged for the pre-TICSI scenario. In this way, even less virtuous consumers could feel motivated to adopt more sustainable practices and reduce water waste. Furthermore, the post-TICSI articulation provides for the adoption of three excess tariffs, differently from the pre-TICSI one which considered only one. However, for large volumes of water consumed, the last excess tariff (Texc,1) for the post-TICSI scenario is less restrictive than the single excess tariff (Texc) envisaged for the pre-TICSI scenario. This attitude, which tends to penalize less those who consume too much, is one of the aspects that is corrected by applying the optimization model.
At this point, we need to dwell on the tariff articulation obtained by integrating the provisions regulated by the TICSI with the optimization model proposed in this study. Following the minimization of the sum of the squares of the differences between the pre and post-TICSI tariffs, for the single user it can be deduced that:
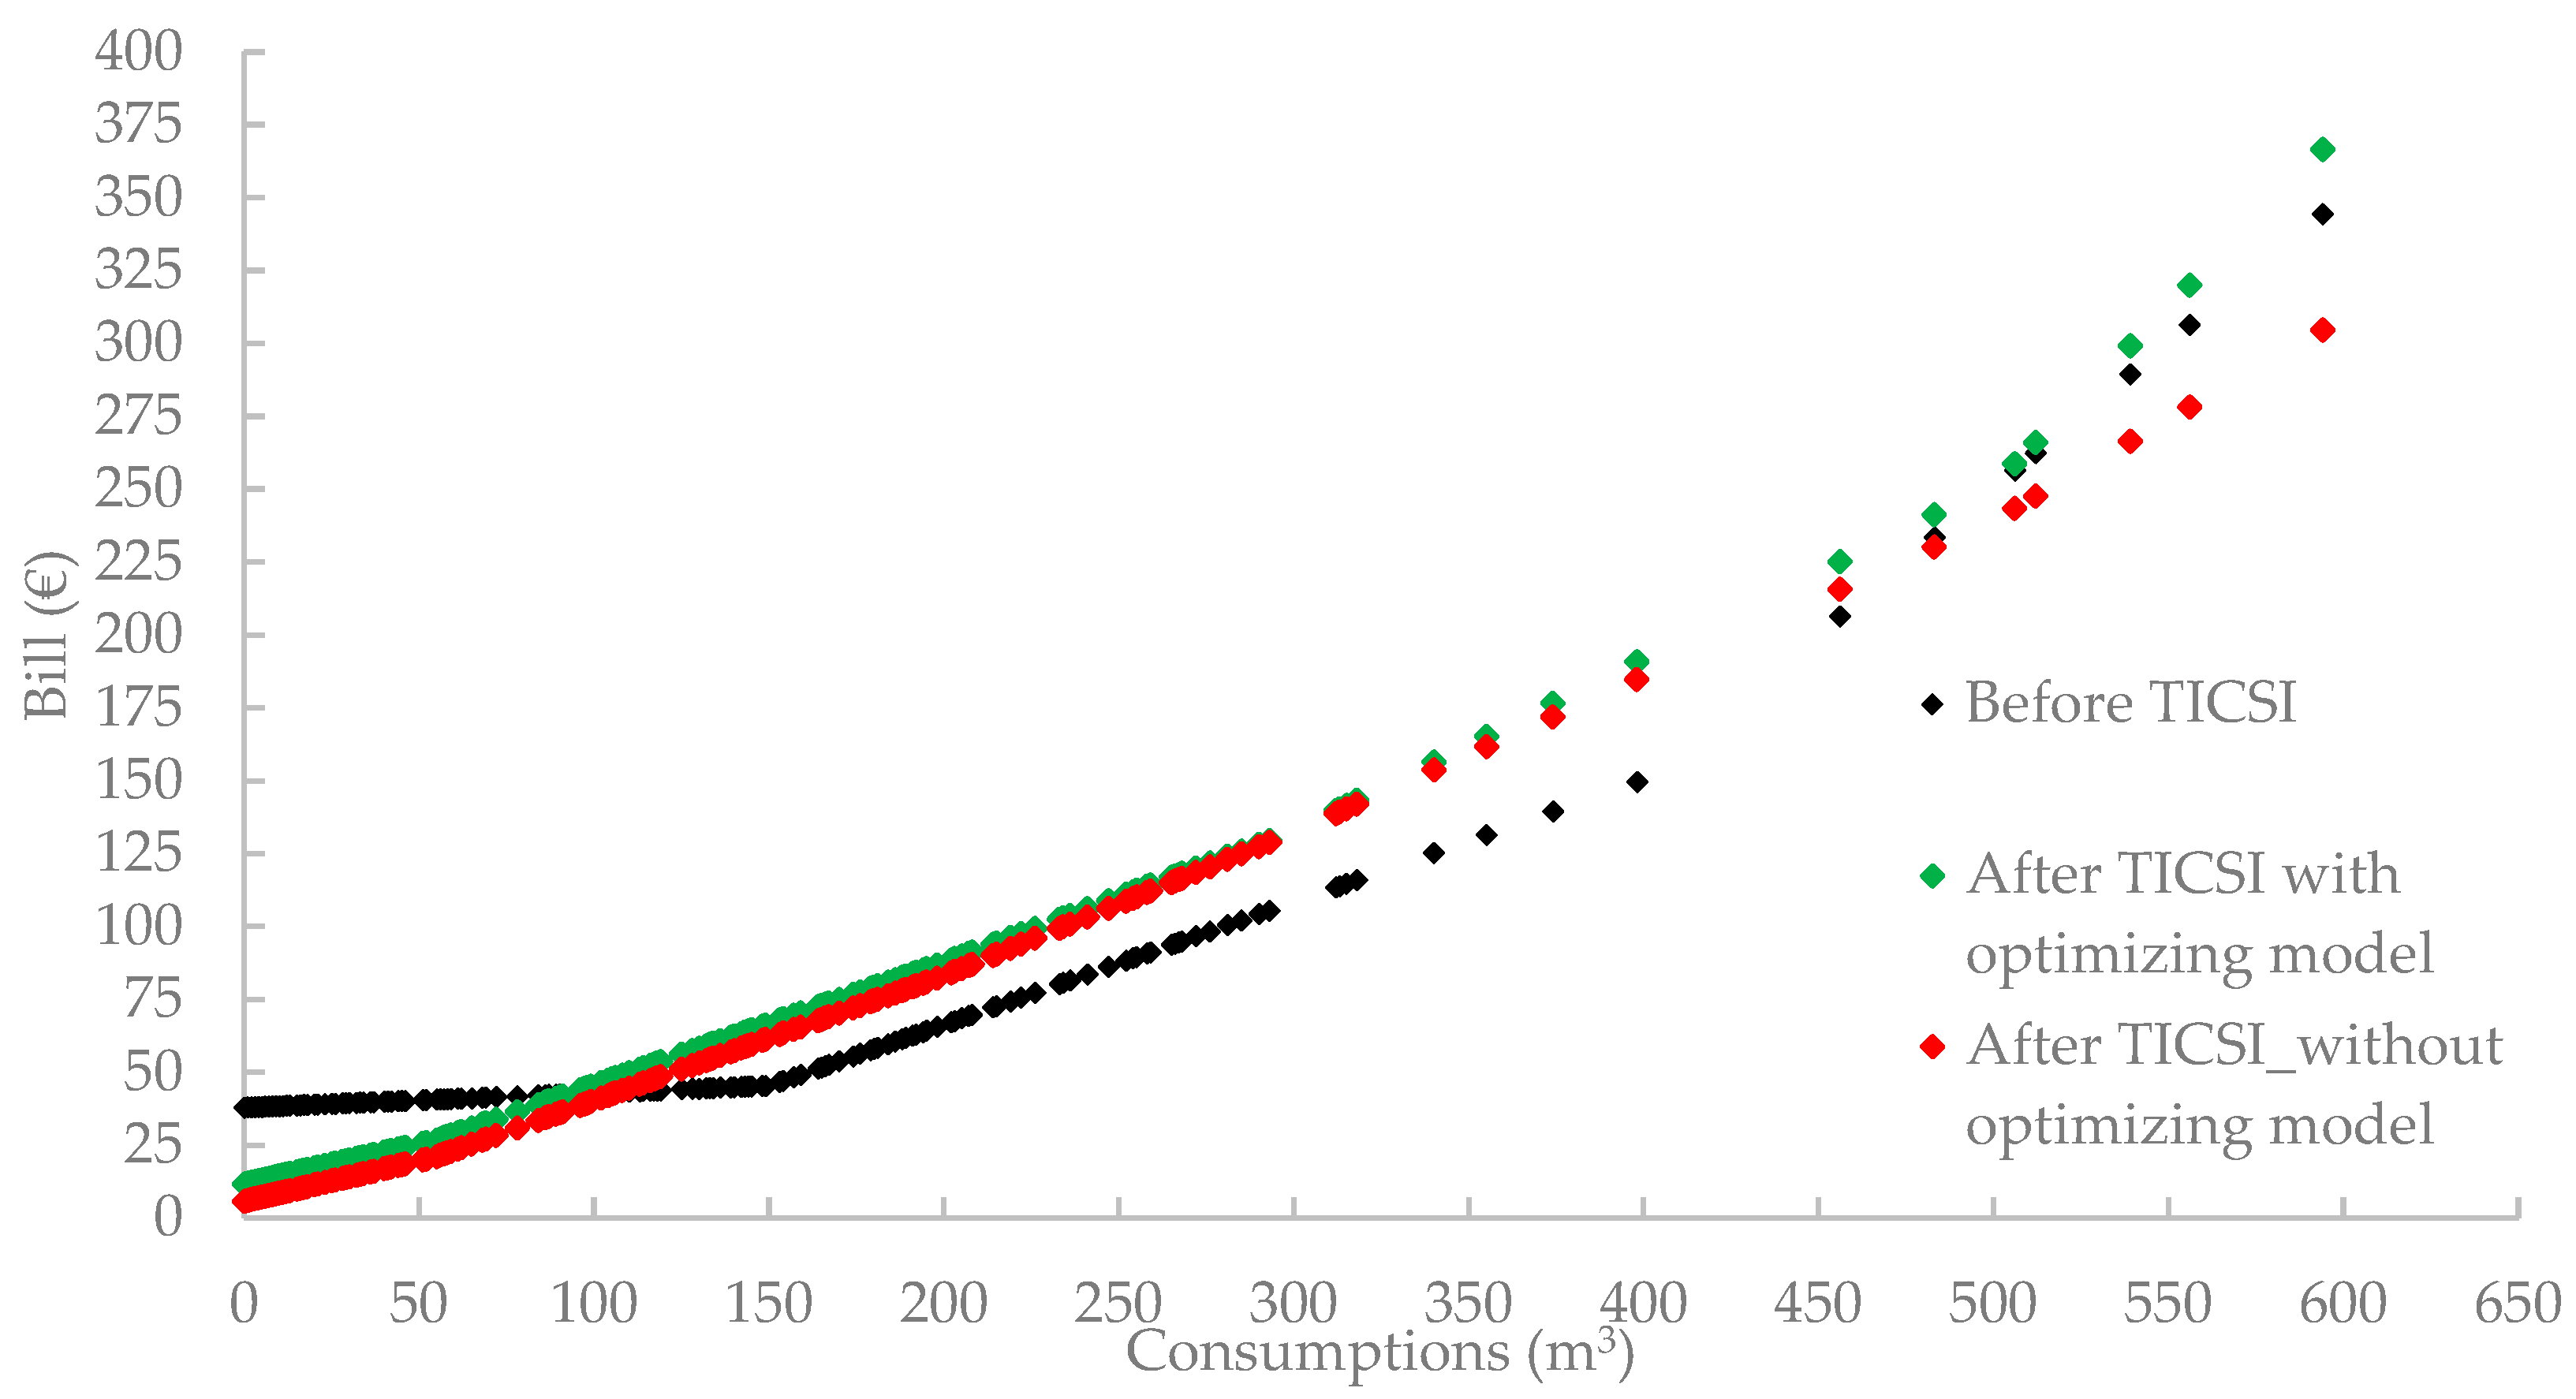
  • The reduced tariff (Tred), the basic tariff (Tbas) and the first excess tariff (Texc,1) do not involve a significant difference in terms of payment to be paid as consumption increases compared to the scenario in which the TICSI is applied without resorting to the optimization model. In fact, in Figure 5 it can be seen that, for consumption up to about 300 m3, the green curve roughly coincides with the red one;
  • The last two excess tariffs (Texc,2 and Texc,3) determine higher payments to be paid in proportion to consumption compared to the scenario in which the TICSI is applied without resorting to the proposed model;
  • The Texc,3 tariff involves a significant increase in spending for less virtuous users, exceeding the costs relating to both the pre-TICSI scenario and the post-TICSI scenario in the absence of the model.
This demonstrates that the model used differs from the iterative method adopted by the manager for processing the TICSI, since it allows for more complete transposition of the community guidelines relating to the “polluter pays” principle and the protection of water resources, ensuring that higher consumptions are associated at higher costs.

5. Conclusions

The management of water scarcity is a crucial issue for the protection of water resources and environmental sustainability. Through effective tariff policies, water service managers can incentivize consumers to reduce water consumption and adopt more sustainable practices, promoting more efficient and equitable management of water resources. Tariff policies can be used to influence consumer behavior, for example through the application of progressive tariffs which increase as water consumption increases or through discounts for those who adopt practices aimed at saving the resource. Furthermore, they can also be used to promote investments in infrastructures that improve the efficiency of the aqueduct service and reduce water losses. Tariff policies can therefore guarantee a fair distribution of water among all users, reducing waste and preventing the formation of monopolies in the water sector. Ultimately, they can play an important role in ensuring the availability and sustainability of water resources in the long term.
The IBT is a method of pricing the water service which provides for the subdivision of consumption into various blocks, each of which is associated with a different tariff. In particular, these tariffs envisage a unit cost of the service which increases with the increase in water consumption, to encourage efficient and economic use of the water resource by the users. The implementation of IBT is often considered an effective tool for combating the problem of water scarcity, as these tariffs make it possible to reduce water consumption and promote virtuous behavior on the part of users, thus avoiding excessive waste and encouraging the responsible use of the resource. However, the definition of the consumption ranges and the relative tariffs must be carefully evaluated, to guarantee the right balance between the needs of the users and the need to protect the water resource, avoiding penalizing consumers with a lower income.
The objective of this study is to present a mathematical optimization model, which has the purpose of implementing the new tariff structure established by TICSI, an Italian standard which aims to harmonize and rationalize the fee structure at the national level, ensuring compliance with the constraints and restrictions imposed by the regulatory body (ARERA). Specifically, a model is proposed which consists of a non-linear function capable of minimizing the difference between the tariffs before and after TICSI. The goal is to guarantee the sustainability of tariffs for virtuous users and, at the same time, ensure that they grow proportionally to consumption in an optimal way for the operator. The model was tested through a case study. Specifically, for a manager operating in Southern Italy, the consumption bands and the respective water tariffs were defined using the optimization model. Attention was focused on the domestic tariffs relating to the aqueduct service. The results were compared with those obtained by the operator by following the general indications of TICSI without applying the mathematical model. The proposed model guarantees compliance with all the constraints established by the National Authority (ARERA). Furthermore, the objective function which minimizes the difference between the fees before and after TICSI allows us to ensure sustainability for users even after the application of the reform. Unlike the iterative procedure adopted by the operator in the elaboration of the TICSI, the proposed model makes it possible to integrate the community guidelines relating to the “polluter pays” principle and the protection of water resources, guaranteeing that higher consumption corresponds to higher tariffs. The proposed operating protocol is easy to understand and apply for the Integrated Water Service operators and represents a valid tool for reducing water waste and ensuring the achievement of the SDG6 objective defined by the United Nations [74,75].
Possible future developments of the research could include the implementation of the proposed protocol for sewage and purification services as well as its application to all types of users (domestic, commercial, industrial, etc.) that make up the panel of consumers.

Author Contributions

Conceptualization, L.D., M.M. and G.D.M.; methodology, L.D., M.M. and G.D.M.; software, L.D., M.M. and G.D.M.; validation, L.D., M.M. and G.D.M.; formal analysis, L.D., M.M. and G.D.M.; investigation, L.D., M.M. and G.D.M.; data curation, L.D., M.M. and G.D.M.; writing—original draft preparation, L.D., M.M. and G.D.M.; writing—review and editing, L.D., M.M. and G.D.M.; supervision, L.D., M.M. and G.D.M. All authors have read and agreed to the published version of the manuscript.

Funding

This research received no external funding.

Data Availability Statement

The data presented in this study are available upon reasonable request from the corresponding author.

Conflicts of Interest

The authors declare no conflict of interest.

References

  1. United Nations (UN). Transforming our World: The 2030 Agenda for Sustainable Development. Available online: https://sdgs.un.org/2030agenda (accessed on 23 December 2022).
  2. Vollmer, D.; Harrison, I.J. H2O ≠ CO2: Framing and responding to the global water crisis. Environ. Res. Lett. 2021, 16, 011005. [Google Scholar] [CrossRef]
  3. Mishra, B.K.; Kumar, P.; Saraswat, C.; Chakraborty, S.; Gautam, A. Water Security in a Changing Environment: Concept, Challenges and Solutions. Water 2021, 13, 490. [Google Scholar] [CrossRef]
  4. Salehi, M. Global water shortage and potable water safety; Today’s concern and tomorrow’s crisis. Environ. Int. 2022, 158, 106936. [Google Scholar] [CrossRef] [PubMed]
  5. Leão, A.S.; Sipert, S.A.; Medeiros, D.L.; Cohim, E.B. Water footprint of drinking water: The consumptive and degradative use. J. Clean. Prod. 2022, 355, 131731. [Google Scholar] [CrossRef]
  6. Wang, R.; Zimmerman, J. Hybrid analysis of blue water consumption and water scarcity implications at the global, national, and basin levels in an increasingly globalized world. Environ. Sci. Technol. 2016, 50, 5143–5153. [Google Scholar] [CrossRef]
  7. Koronkevich, N.I.; Barabanova, E.A.; Zaitseva, I.S. Assessment of Modern Water Consumption in the World and on Continents and Its Impact on the Annual River Runoff. Her. Russ. Acad. Sci. 2022, 92, 199–206. [Google Scholar] [CrossRef]
  8. European Environment Agency. Drought and Excessive Water Consumption in Europe. Available online: https://www.eea.europa.eu/it/pressroom/newsreleases/siccita-e-consumo-eccessivo-di-acqua-in-europa (accessed on 24 December 2022).
  9. Rinnovabili.it. Thirsty Italy, in Second Place in Europe for Water Consumption per Person. Available online: https://www.rinnovabili.it/ambiente/acqua/litalia-assetata-al-secondo-posto-in-europa-per-consumi-dacqua-a-testa/ (accessed on 24 December 2022).
  10. Istat. Istat Statistics on Water—Years 2019–2021. Available online: https://www.istat.it/it/files//2022/03/REPORTACQUA2022.pdf (accessed on 22 December 2022).
  11. Ben Zaied, Y.; Taleb, L.; Ben Lahouel, B.; Managi, S. Sustainable Water Demand Management and Incentive Tariff: Evidence from a Quantile-on-Quantile Approach. Environ. Model. Assess. 2022, 27, 967–980. [Google Scholar] [CrossRef]
  12. Dinar, A.; Subramanian, A. Policy implications from water pricing experiences in various countries. Water Policy 1998, 1, 239–250. [Google Scholar] [CrossRef]
  13. Nesticò, A.; De Mare, G.; Frusciante, B.; Dolores, L. Construction Costs Estimate for Civil Works. A Model for the Analysis During the Preliminary Stage of the Project. In LNCS; Gervasi, O., Murgante, B., Misra, S., Borruso, G., Torre, C.M., Rocha, A.M.A.C., Taniar, D., Apduhan, B.O., Stankova, E., Cuzzocrea, A., Eds.; Springer: Cham, Switzerland, 2017; Volume 10408, pp. 202–217. [Google Scholar] [CrossRef]
  14. Dolores, L.; Macchiaroli, M.; De Mare, G. Financial Impacts of the Energy Transition in Housing. Sustainability 2022, 14, 4876. [Google Scholar] [CrossRef]
  15. De Mare, G.; Manganelli, B.; Nesticò, A. The Economic Evaluation of Investments in the Energy Sector: A Model for the Optimization of the Scenario Analyses. In Computational Science and Its Applications—ICCSA 2013; Lecture Notes in Computer Science; Springer: Berlin, Heidelberg, 2013; Volume 7972. [Google Scholar] [CrossRef]
  16. Bashar, A.M.; Nozari, H.; Marofi, S.; Mohamadi, M.; Ahadiiman, A. Investigation of factors affecting rural drinking water consumption using intelligent hybrid models. Water Sci. Eng. 2022, in press. [CrossRef]
  17. Arbues, F.; Villanua, I. Potential for pricing policies in water resource management: Estimation of urban residential water demand in Zaragoza, Spain. Urban Stud. 2006, 43, 2421–2442. [Google Scholar] [CrossRef]
  18. Domene, E.; Saurí, D. Urbanisation and water consumption: Influencing factors in the metropolitan region of Barcelona. Urban Stud. 2006, 43, 1605–1623. [Google Scholar] [CrossRef]
  19. Inman, D.; Jeffrey, P. A review of residential water conservation tool performance and influences on implementation effectiveness. Urban Water J. 2006, 3, 127–143. [Google Scholar] [CrossRef] [Green Version]
  20. March, H.; Saurí, D. The suburbanization of water scarcity in the Barcelona metropolitan region: Sociodemographic and urban changes influencing domestic water consumption. Prof. Geog. 2010, 62, 32–45. [Google Scholar] [CrossRef]
  21. Olmstead, S.M.; Stavins, R.N. Comparing price and nonprice approaches to urban water conservation. Water Resour. Res. 2009, 45, 1–10. [Google Scholar] [CrossRef] [Green Version]
  22. Stavenhagen, M.; Buurman, J.; Tortajada, C. Saving water in cities: Assessing policies for residential water demand management in four cities in Europe. Cities 2018, 79, 187–195. [Google Scholar] [CrossRef]
  23. OCDE. The Price of Water: Trends in OECD Countries; Organisation for Economic Co-operation and Development: Paris, France, 1999; pp. 1–174. [Google Scholar]
  24. Marzano, R.; Rouge, C.; Garrone, P.; Grilli, L.; Harou, J.J.; Pulido-Velazquez, M. Determinants of the price response to residential water tariffs: Meta-analysis and beyond. Environ. Model Softw. 2018, 101, 236–248. [Google Scholar] [CrossRef]
  25. Klassert, C.; Sigel, K.; Klauer, B.; Gawel, E. Increasing Block Tariffs in an Arid Developing Country: A Discrete/Continuous Choice Model of Residential Water Demand in Jordan. Water 2018, 10, 248. [Google Scholar] [CrossRef] [Green Version]
  26. Monteiro, H.; Roseta-Palma, C. Pricing for scarcity? An efficiency analysis of increasing block tariffs. Water Resour. Res. 2011, 47, 1–11. [Google Scholar] [CrossRef]
  27. Organization for Economic Co-operation and Development (OECD). Managing Water for All: An OECD Perspective on Pricing and Financing; OECD: Paris, France, 2009; Available online: https://www.oecd.org/env/42350563.pdf (accessed on 4 January 2023).
  28. Fuente, D. The design and evaluation of water tariffs: A systematic review. Utilities Policy 2019, 61, 100975. [Google Scholar] [CrossRef]
  29. De Mare, G.; Manganelli, B.; Nesticò, A. Dynamic Analysis of the Property Market in the City of Avellino (Italy). In Computational Science and Its Applications—ICCSA 2013; Lecture Notes in Computer Science; Springer: Berlin, Heidelberg, 2013; Volume 7973. [Google Scholar] [CrossRef]
  30. De Mare, G.; Nesticò, A.; Macchiaroli, M.; Dolores, L. Market Prices and Institutional Values. In LNCS; Gervasi, O., Murgante, B., Misra, S., Garau, C., Blečić, I., Taniar, D., Apduhan, B.O., Rocha, A.M.A.C., Tarantino, E., Torre, C.M., Eds.; Springer: Cham, Switzerland, 2017; Volume 10409, pp. 430–440. [Google Scholar] [CrossRef]
  31. Nieswiadomy, M.L. Estimating urban residential water demand: Effects of price structure, conservation, and education. Water Resour. Res. 1992, 28, 609–615. [Google Scholar] [CrossRef]
  32. Olmstead, S.M.; Hanemann, M.; Stavins, R.N. Water Demand under Alternative Price Structures. J. Environ. Econ. Manag. 2007, 54, 181–198. [Google Scholar] [CrossRef] [Green Version]
  33. Ratnasiri, S.; Wilson, C.; Athukorala, W.; Garcia-Valiñas, M.A.; Torgler, B.; Gifford, R. Effectiveness of two pricing structures on urban water use and conservation: A quasi-experimental investigation. Environ. Econ. Policy Stud. 2018, 20, 547–560. [Google Scholar] [CrossRef]
  34. Sahin, O.; Bertone, E.; Beal, C. A systems approach for assessing water conservation potential through demand-based water tariffs. J. Clean. Prod. 2017, 148, 773–784. [Google Scholar] [CrossRef] [Green Version]
  35. García-Valiñas, M.Á.; Suárez-Fernández, S. Are Economic Tools Useful to Manage Residential Water Demand? A Review of Old Issues and Emerging Topics. Water 2022, 14, 2536. [Google Scholar] [CrossRef]
  36. The European Parliament and the Council of The European Union. Directive 2000/60/EC of the European Parliament and of the Council of 23 October 2000 Establishing a Framework for Community Action in the Field of Water Policy. Available online: https://eur-lex.europa.eu/resource.html?uri=cellar:5c835afb-2ec6-4577-bdf8-756d3d694eeb.0004.02/DOC_1&format=PDF (accessed on 5 January 2023).
  37. Commission of the European Communities. COM(2000)477—Communication from the Commission to the Council, the European Parliament and the Economic and Social Committee: Pricing Policies for Enhancing the Sustainability of Water Resources. Brussels. 2000. Available online: https://eur-lex.europa.eu/LexUriServ/LexUriServ.do?uri=COM:2000:0477:FIN:EN:PDF (accessed on 5 January 2023).
  38. Commission of the European Communities. COM(2014)177—Communication from the Commission: On the European Citizens’ Initiative “Water and Sanitation are a Human right! Water is a Public good, not a Commodity!”. Brussels. 2014. Available online: https://ec.europa.eu/transparency/documents-register/detail?ref=COM(2014)177&lang=it (accessed on 5 January 2023).
  39. Regulatory Authority for Energy, Networks and Environment (ARERA). Deliberation 665/2017/R/idr of 28 September 2017, Attachment A—Integrated Text on Water Services Tariffs (TICSI). Available online: https://www.arera.it/allegati/docs/17/665-17all.pdf (accessed on 5 January 2023).
  40. Regulatory Authority for Energy, Networks and Environment (ARERA). Deliberation 636/2018/R/IDR5 of 5 December 2018—Initiation of the Procedure for Monitoring the Application of the Tariff Structure Criteria Contained in the Integrated Text on Water Services Tariffs (TICSI). Available online: https://www.arera.it/allegati/docs/18/636-18.pdf (accessed on 5 January 2023).
  41. Levenberg, K. A method for the solution of certain non-linear problems in least squares. Q. Appl. Math. 1944, 2, 164–168. [Google Scholar] [CrossRef] [Green Version]
  42. Abdi, H. The method of least squares. Encycl. Meas. Stat. 2007, 1, 530–532. [Google Scholar]
  43. Jiang, B.N. On the least-squares method. Comput. Methods Appl. Mech. Eng. 1998, 152, 239–257. [Google Scholar] [CrossRef]
  44. Suárez-Varela, M.; Martinez-Espineira, R.; González-Gómez, F. An analysis of the price escalation of non-linear water tariffs for domestic uses in Spain. Util. Policy 2015, 34, 82–93. [Google Scholar] [CrossRef] [Green Version]
  45. Wichelns, D. Enhancing the performance of water prices and tariff structures in achieving socially desirable outcomes. Int. J. Water Resour. Dev. 2013, 29, 310–326. [Google Scholar] [CrossRef]
  46. Hoque, S.F.; Wichelns, D. State-of-the-art review: Designing urban water tariffs to recover costs and promote wise use. Int. J. Water Resour. Dev. 2013, 29, 472–491. [Google Scholar] [CrossRef]
  47. Renzetti, S. Evaluating the welfare effects of reforming municipal water prices. J. Environ. Econ. Manag. 1992, 22, 147–163. [Google Scholar] [CrossRef]
  48. García-Valiñas, M.Á. Efficiency and equity in natural resources pricing: A proposal for urban water distribution service. Environ. Resour. Econ. 2005, 32, 183–204. [Google Scholar] [CrossRef]
  49. Diakité, D.; Semenov, A.; Thomas, A. A proposal for social pricing of water supply in Côte d’Ivoire. J. Dev. Econ. 2009, 88, 258–268. [Google Scholar] [CrossRef] [Green Version]
  50. García-Valiñas, M.A.; Martínez-Espiñeira, R.; González-Gómez, F. Affordability of residential water tariffs: Alternative measurement and explanatory factors in southern Spain. J. Environ. Econ. Manag. 2010, 91, 2696–2706. [Google Scholar] [CrossRef]
  51. Rinaudo, J.D.; Neverre, N.; Montginoul, M. Simulating the impact of pricing policies on residential water demand: A southern France case study. Water Resour. Manag. 2012, 26, 2057–2068. [Google Scholar] [CrossRef] [Green Version]
  52. Reynaud, A. Assessing the impact of full cost recovery of water services on European households. Water Resour. Econ. 2016, 14, 65–78. [Google Scholar] [CrossRef]
  53. Garcia, S.; Reynaud, A. Estimating the benefits of efficient water pricing in France. Resour. Energy Econ. 2004, 26, 1–25. [Google Scholar] [CrossRef]
  54. Hoffman, J.J.; Du Plessis, J.A. A model to assess water tariffs as part of water demand management. Water Sa 2013, 39, 423–428. [Google Scholar] [CrossRef] [Green Version]
  55. Ahmad, S.; Prashar, D. Evaluating municipal water conservation policies using a dynamic simulation model. Water Resour. Manag. 2010, 24, 3371–3395. [Google Scholar] [CrossRef]
  56. Rosenberg, D.E. Residential water demand under alternative rate structures: Simulation approach. J. Water Resour. Plan. Manag. 2010, 136, 395–402. [Google Scholar] [CrossRef] [Green Version]
  57. Yates, D.N.; Lavin, F.V.; Purkey, D.P.; Guerrero, S.; Hanemann, M.; Sieber, J. Using economic and other performance measures to evaluate a municipal drought plan. Water Policy 2013, 15, 648–668. [Google Scholar] [CrossRef] [Green Version]
  58. Nauges, C.; Whittington, D. Evaluating the performance of alternative municipal water tariff designs: Quantifying the tradeoffs between equity, economic efficiency, and cost recovery. World Dev. 2017, 91, 125–143. [Google Scholar] [CrossRef] [Green Version]
  59. Wolak, F.A. Designing nonlinear price schedules for urban water utilities to balance revenue and conservation goals. Natl. Bur. Econ. Res. 2016, 22503, 1–41. [Google Scholar] [CrossRef]
  60. Chicoine, D.L.; Deller, S.C.; Ramamurthy, G. Water demand estimation under block rate pricing: A simultaneous equation approach. Water Resour. Res. 1986, 22, 859–863. [Google Scholar] [CrossRef]
  61. Nieswiadomy, M.L.; Molina, D.J. Urban water demand estimates under increasing block rates. Growth Chang. 1988, 19, 1–12. [Google Scholar] [CrossRef] [Green Version]
  62. Saleth, R.M.; Dinar, A. Satisfying Urban Thirst: Water Supply Augmentation and Pricing Policy in Hyderabad City, India; World Bank Publications: Washington, DC, USA, 1997; Volume 395. [Google Scholar]
  63. Höglund, L. Household demand for water in Sweden with implications of a potential tax on water use. Water Resour. Res. 1999, 35, 3853–3863. [Google Scholar] [CrossRef]
  64. Pint, E.M. Household responses to increased water rates during the California drought. Land Econ. 1999, 75, 246–266. [Google Scholar] [CrossRef]
  65. Hansen, L.G. Water and energy price impacts on residential water demand in Copenhagen. Land Econ. 1996, 47, 66–79. [Google Scholar] [CrossRef]
  66. Hewitt, J.A.; Hanemann, W.M. A discrete/continuous choice approach to residential water demand under block rate pricing. Land Econ. 1995, 71, 173–192. [Google Scholar] [CrossRef]
  67. Regulatory Authority for Energy, Networks and Environment (ARERA). Deliberation 580/2019/R/IDR of 27 December 2019, Attachment A—Water Tariff Method 2020–2023—MTI-3. Available online: https://www.arera.it/allegati/docs/19/mti3_ti.pdf (accessed on 21 February 2023).
  68. Legendre, A.M. Nouvelles Méthodes Pour la Détermination des Orbites des Comètes; Histoire de l’Académie Royale des Sciences: Paris, France, 1805. [Google Scholar]
  69. Stigler, S.M. Gauss and the invention of least squares. Ann Statist. 1981, 9, 465–474. [Google Scholar] [CrossRef]
  70. Abadie, J.; Guigou, J. Numerical Experiments with the GRG Method; North-Holland Publishing Company: Amsterdam, Holland, 1970. [Google Scholar]
  71. Lasdon, L.S. Optimization Theory for Large Systems; Courier Corporation: North Chelmsford, MA, USA, 2002; pp. 1–560. [Google Scholar]
  72. Gould, N.I.; Orban, D.; Toint, P.L. CUTEst: A constrained and unconstrained testing environment with safe threads for mathematical optimization. Comput. Optim. Appl. 2015, 60, 545–557. [Google Scholar] [CrossRef]
  73. Pontryagin, L.S. Mathematical Theory of Optimal Processes; CRC Press: Boca Raton, FL, USA, 1987. [Google Scholar]
  74. Macchiaroli, M.; Dolores, L.; Nicodemo, L.; De Mare, G. Energy Efficiency in the Management of the Integrated Water Service. A Case Study on the White Certificates Incentive System. In LNCS; Gervasi, O., Murgante, B., Misra, S., Garau, C., Blečić, I., Taniar, D., Apduhan, B.O., Rocha, A.M.A.C., Tarantino, E., Torre, C.M., Eds.; Springer: Cham, Switzerland, 2021; Volume 12956, pp. 202–217. [Google Scholar] [CrossRef]
  75. Dolores, L.; Macchiaroli, M.; De Mare, G. Financial Targets for the Sponsee and the Sponsor in the Restoration/Recovery of the Historical and Architectural Heritage. In SIST; Bevilacqua, C., Calabrò, F., Della Spina, L., Eds.; Springer: Cham, Switzerland, 2020; Volume 177, pp. 155–165. [Google Scholar] [CrossRef]
Figure 1. Binomial structure of water tariff by ARERA Resolution 665/2017/R/idr (Integrated Text on Water Services Tariffs-TICSI).
Water 15 01309 g001
Figure 2. The regulatory schemes’ matrix by ARERA Resolution 580/2019/R/ID.
Water 15 01309 g002
Figure 3. The most relevant information about the area managed by the Water Service operator.
Water 15 01309 g003
Figure 4. Users’ consumptions distributions in tariff bands.
Water 15 01309 g004
Figure 5. The trend of payments as the volumes of water consumed change.
Water 15 01309 g005
Table 1. Water tariffs and consumption ranges adopted by the operator before the introduction of TICSI.
TariffConsumption Ranges (m3/Years)QV (EUR/m3)QF (EUR/Users)
MinMax
Tred01500.050038.000
Tbas1514000.4200
Texc,1>400 1.0000
Annual revenues (EUR)54179766
Table 2. Water tariffs and consumption ranges adopted by the operator following the application of the requirements introduced by the TICSI standard and considering the proposed optimization model.
TariffConsumption Ranges (m3/Years)QV (EUR/m3)QF (EUR/Users)
MinMax
Tred0550.272011.820
Tbas562000.4200
Texc,12013000.4510
Texc,23015000.5931
Texc,3>500 1.2258
Annual revenues (EUR)12,1473038
Disclaimer/Publisher’s Note: The statements, opinions and data contained in all publications are solely those of the individual author(s) and contributor(s) and not of MDPI and/or the editor(s). MDPI and/or the editor(s) disclaim responsibility for any injury to people or property resulting from any ideas, methods, instructions or products referred to in the content.

