Article

An Observational Study of Typhoon Talim over the Northern Part of the South China Sea in July 2023

1
Department of Architecture and Civil Engineering, City University of Hong Kong, Hong Kong, China
2
Hong Kong Observatory, Hong Kong, China
3
Shenzhen Meteorological Service, Shenzhen 518040, China
*
Author to whom correspondence should be addressed.
Atmosphere 2023, 14(9), 1340; https://doi.org/10.3390/atmos14091340
Submission received: 5 August 2023 / Revised: 18 August 2023 / Accepted: 21 August 2023 / Published: 25 August 2023
(This article belongs to the Special Issue Tropical Cyclones: Observations and Prediction)

Abstract

:
Extensive surface and upper air measurements of a typhoon over the northern part of the South China Sea, namely, Typhoon Talim in July 2023, are documented and analysed in this paper. A number of features have been observed from the upper air measurements. First, the log law and the power law were found to be appropriate in fitting the wind profiles of the typhoon in the first 1000 m or so above the sea surface. Second, a low-level jet with the height of the maximum wind speed of around 1000 m was observed in the lower troposphere from the observations of the radar wind profilers. This paper is also novel from the perspectives that the vertical wind profile from a Doppler LIDAR on an offshore platform over the northern part of the South China sea and ocean radar data are used to analyse the surface wind observations of a typhoon in the region. The results of this paper would be useful in understanding the structure of tropical cyclones, e.g., in wind engineering applications.

1. Introduction

Tropical cyclones often affect the coast of southern China in the summer each year. For instance, in Hong Kong, on average, there are around four to seven tropical cyclones affecting the territory each summer. Observational data of the cyclones have many important applications. The first direct application is the analysis of the location, intensity, and structure of the cyclone, e.g., based on the surface observations. The upper air data are also very valuable, not only in studying the structure of the cyclone, but they also have important applications, as in the design of wind load of tall buildings in southern China.
There have been a few studies of tropical cyclone wind structure based on field observational data. Song et al. [1] analysed mean wind profiles in the lowest 110 m of landfalling tropical cyclones based on tower measurements. Li et al. [2] modelled tropical cyclone wind spectra near the sea surface using offshore tower observations during Typhoon Hagupit. Giammanco et al. [3,4] investigated the kinematic and thermodynamic structure of the hurricane boundary layer based on dropsonde measurements. Shu et al. [5] showed that the wind profiles in tropical cyclones, especially the upper-level profiles, are significantly different from those in monsoons. Some theoretical tropical cyclone models have also been proposed, e.g., Vickery et al. [6]; Snaiki and Wu [7]; Fang et al., [8]. Their applications in engineering, e.g., in the structural design of buildings and bridges, have also been discussed [9].
Despite the valuable information provided by these studies, much more observational data in tropical cyclones should be collected and analysed in order to enhance the understanding of tropical cyclone wind structure and inform engineering applications, e.g., in wind-resistant design of structures. Such observational data, especially the upper air ones, are relatively sparse over the northern part of the South China Sea and along the coast of southern China. However, with the deployment of more meteorological equipment in the region, especially the ground-based remote sensing instruments, the amount of data collected for tropical cyclones over the South China coastal region and the adjacent waters has increased. The instruments include radar wind profilers and light detection and ranging (LIDAR) wind profilers. In particular, LIDAR wind profilers have been deployed in the offshore oil platforms, providing valuable data in the continuous observation of the atmospheric boundary layer inside and around the tropical cyclones. As reported in Hon and Chan [10], aircraft observation, especially the dropsondes, is also an important source of in situ upper air measurements inside tropical cyclones.
For the horizontal structure of the tropical cyclone, apart from in situ anemometers and weather stations, ocean radar has been deployed in the region to observe the spatial distributions of the surface winds, enabling an analysis of the wind structure of the tropical cyclone near the sea surface. Such data have not been documented before in the literature.
In the present paper, the observational data of a strong tropical cyclone case, namely, Typhoon Talim, in July 2023 have been analysed. This is the first time that a wide collection of observational data has been studied extensively, e.g., in the analysis of the vertical wind profiles for wind engineering applications (on topics such as occurrence of low-level jets and fitting of vertical wind profiles by the power and log laws), as well as the documentation of the horizontal structure of the surface wind field. It is hoped that this analysis will stimulate further studies of tropical cyclones in the region, such as comparisons of numerical weather prediction model results of the structure of the cyclones in comparison with actual observation data.

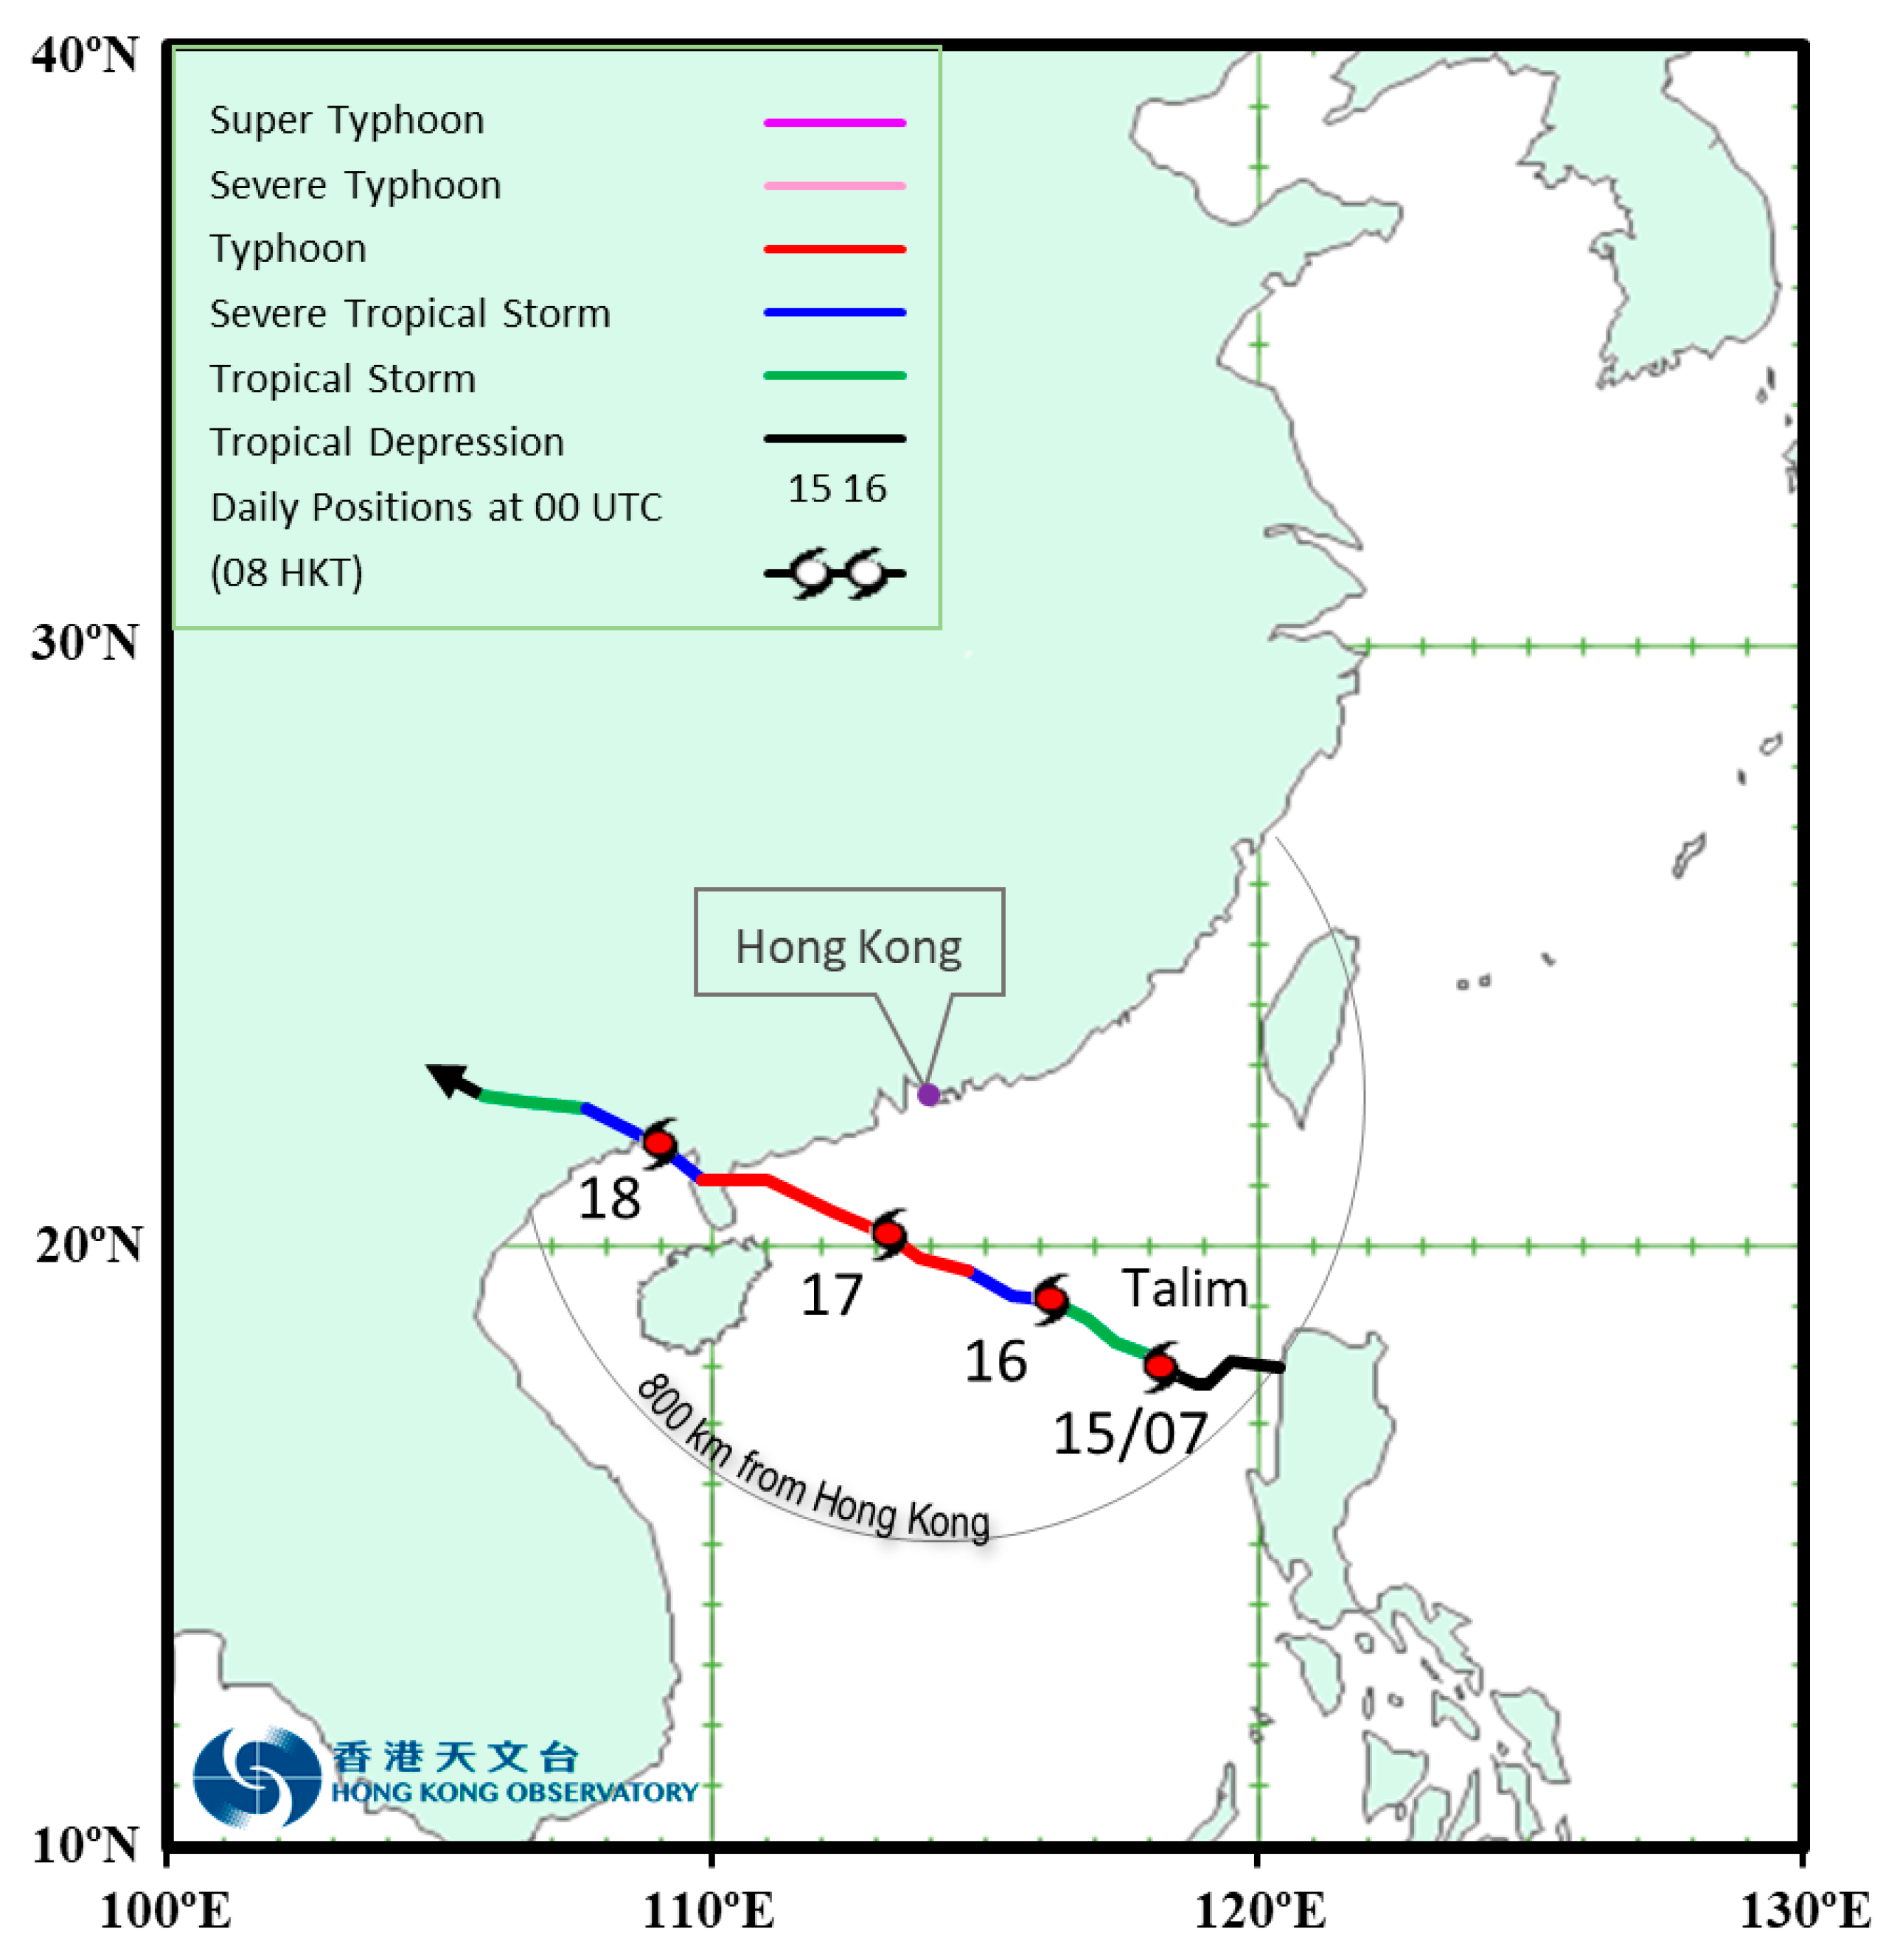
2. Life Cycle of Talim

Figure 1 shows the provisional best track of Talim. Talim formed as a tropical depression over the seas west of Luzon on the morning of 14 July 2023. It moved southwestwards slowly on that day. Talim turned to move northwestwards steadily across the northern part of the South China Sea on 15 July 2023 and intensified gradually, reaching the strength of a severe tropical storm the next morning. It developed into a typhoon on the night of 16 July 2023, reaching its peak intensity the next day with an estimated maximum sustained wind of around 140 km/h near its centre. Talim continued to move northwestwards and made landfall near Zhanjiang, Guangdong, on the night of 17 July 2023. Weakening gradually, Talim moved across Leizhou Peninsula and inland Guangxi on 18 July 2023, and finally, dissipated over the northern part of Vietnam on the morning of 19 July 2023.

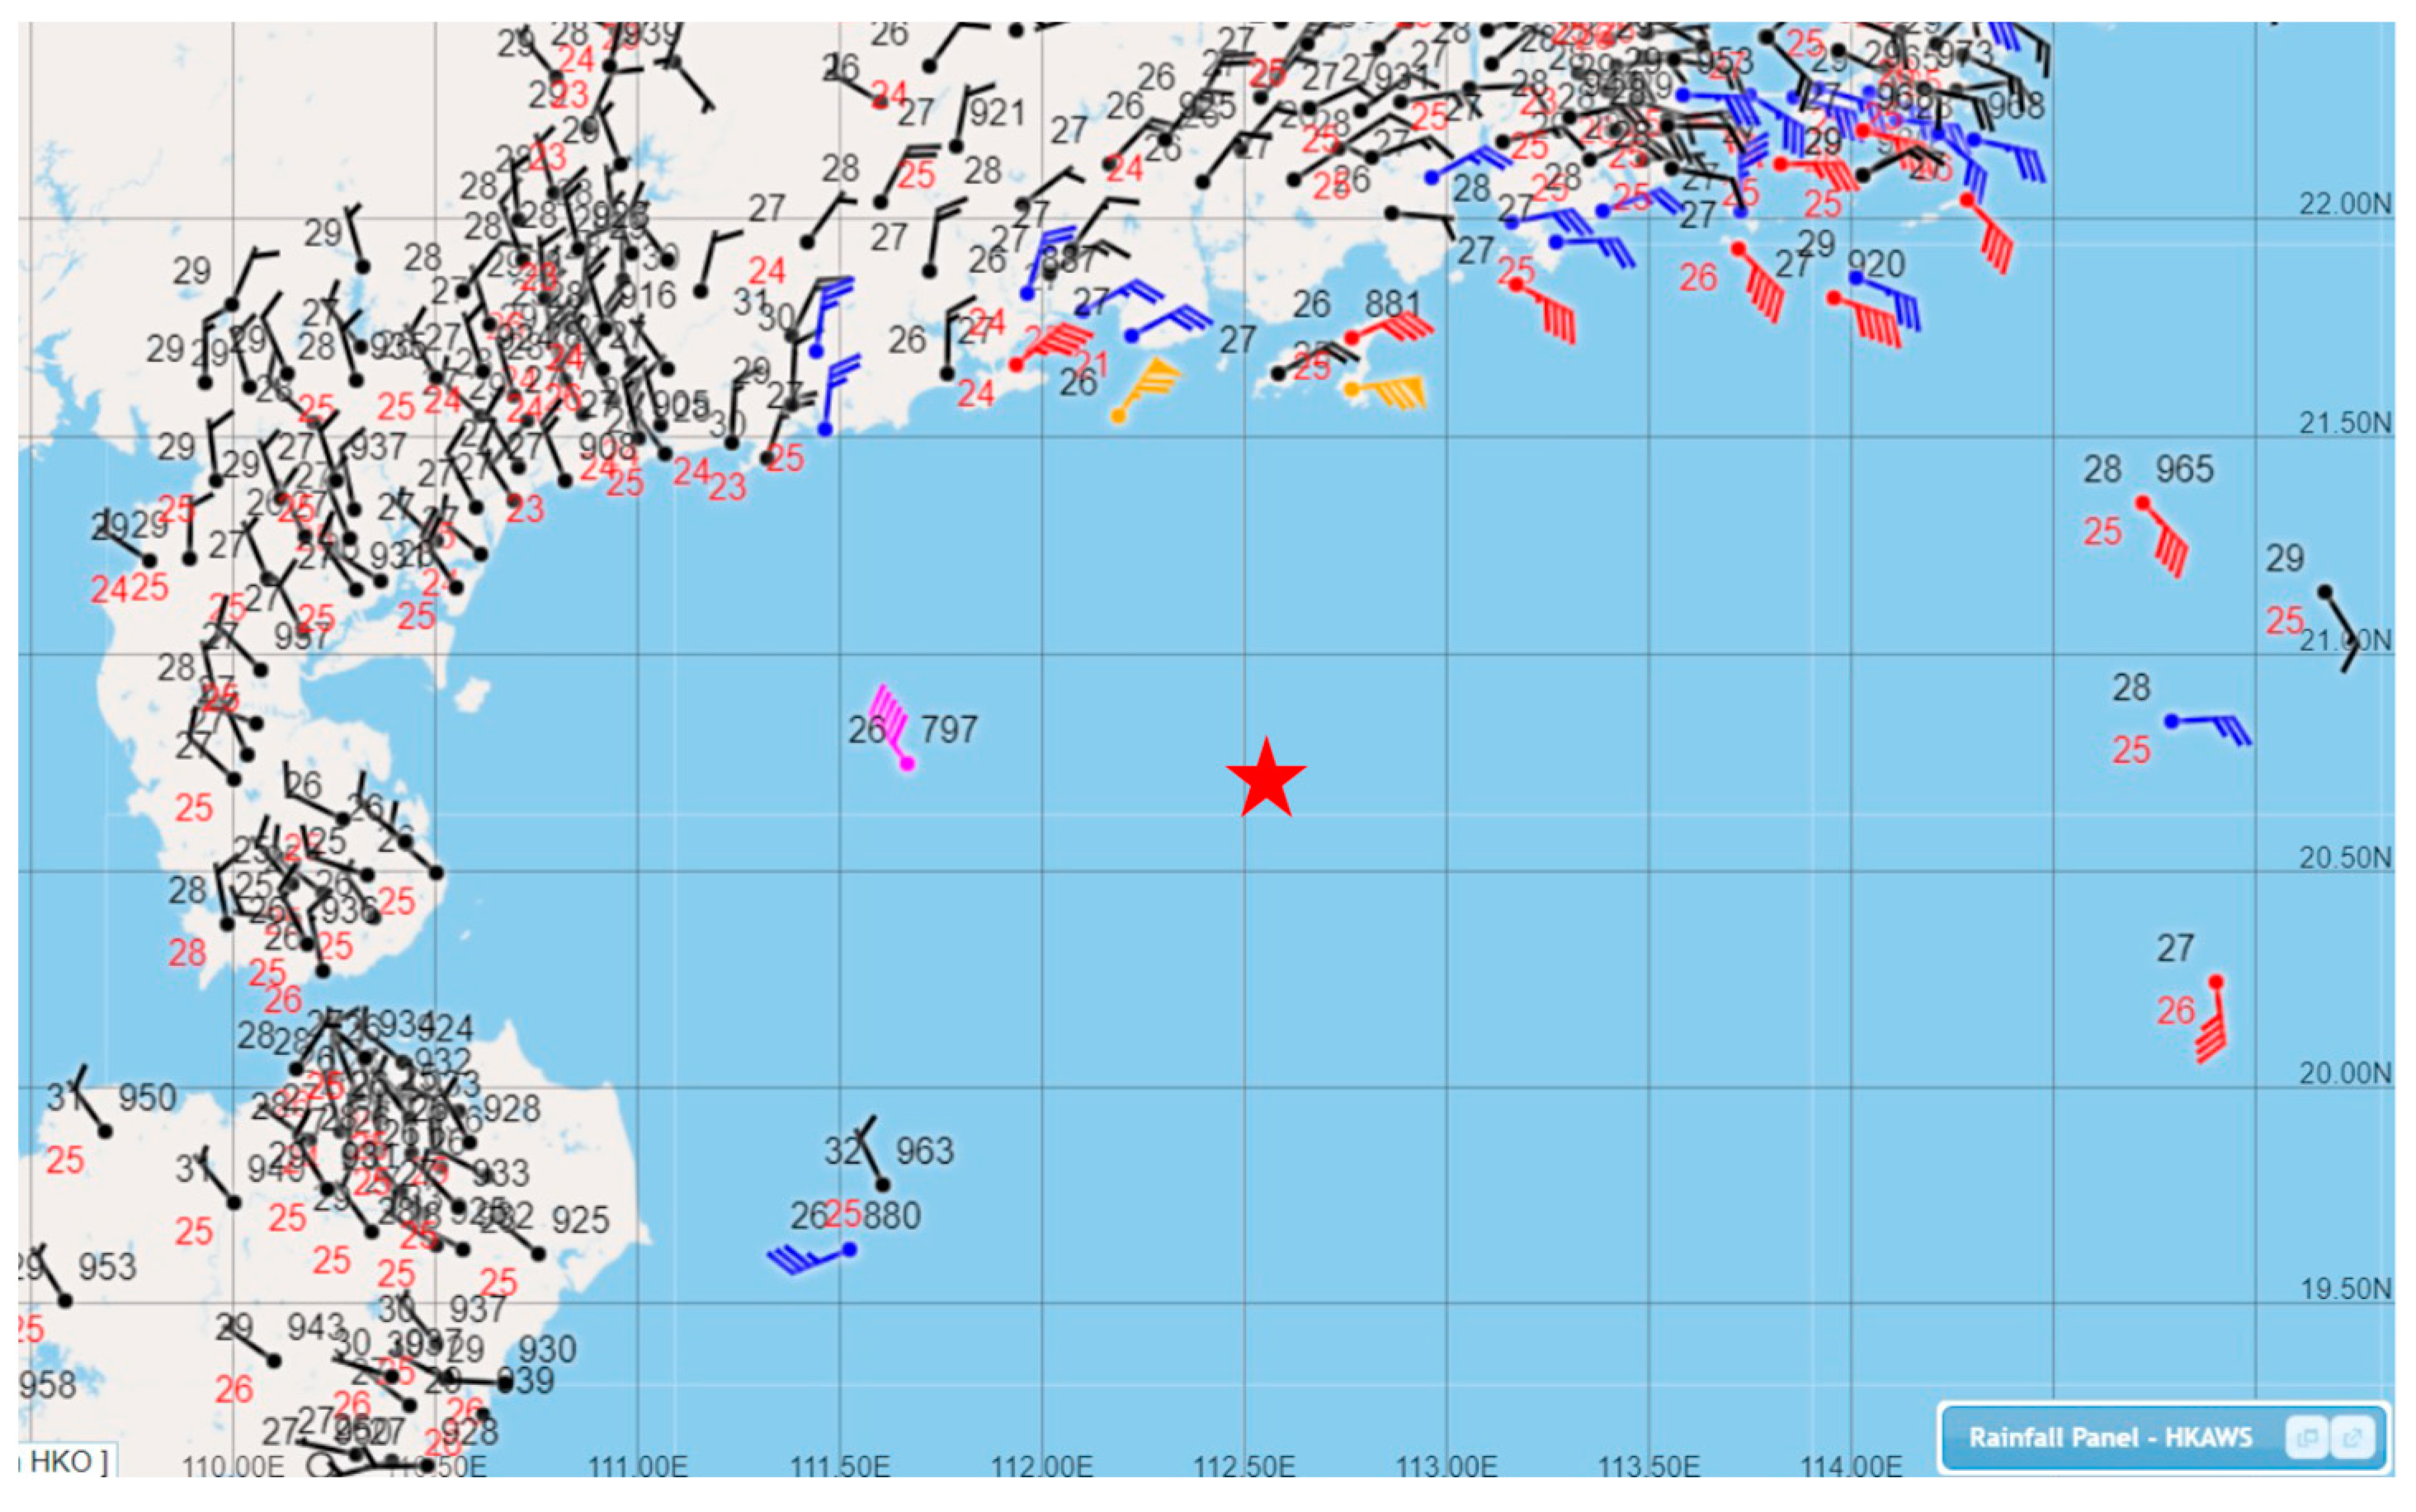
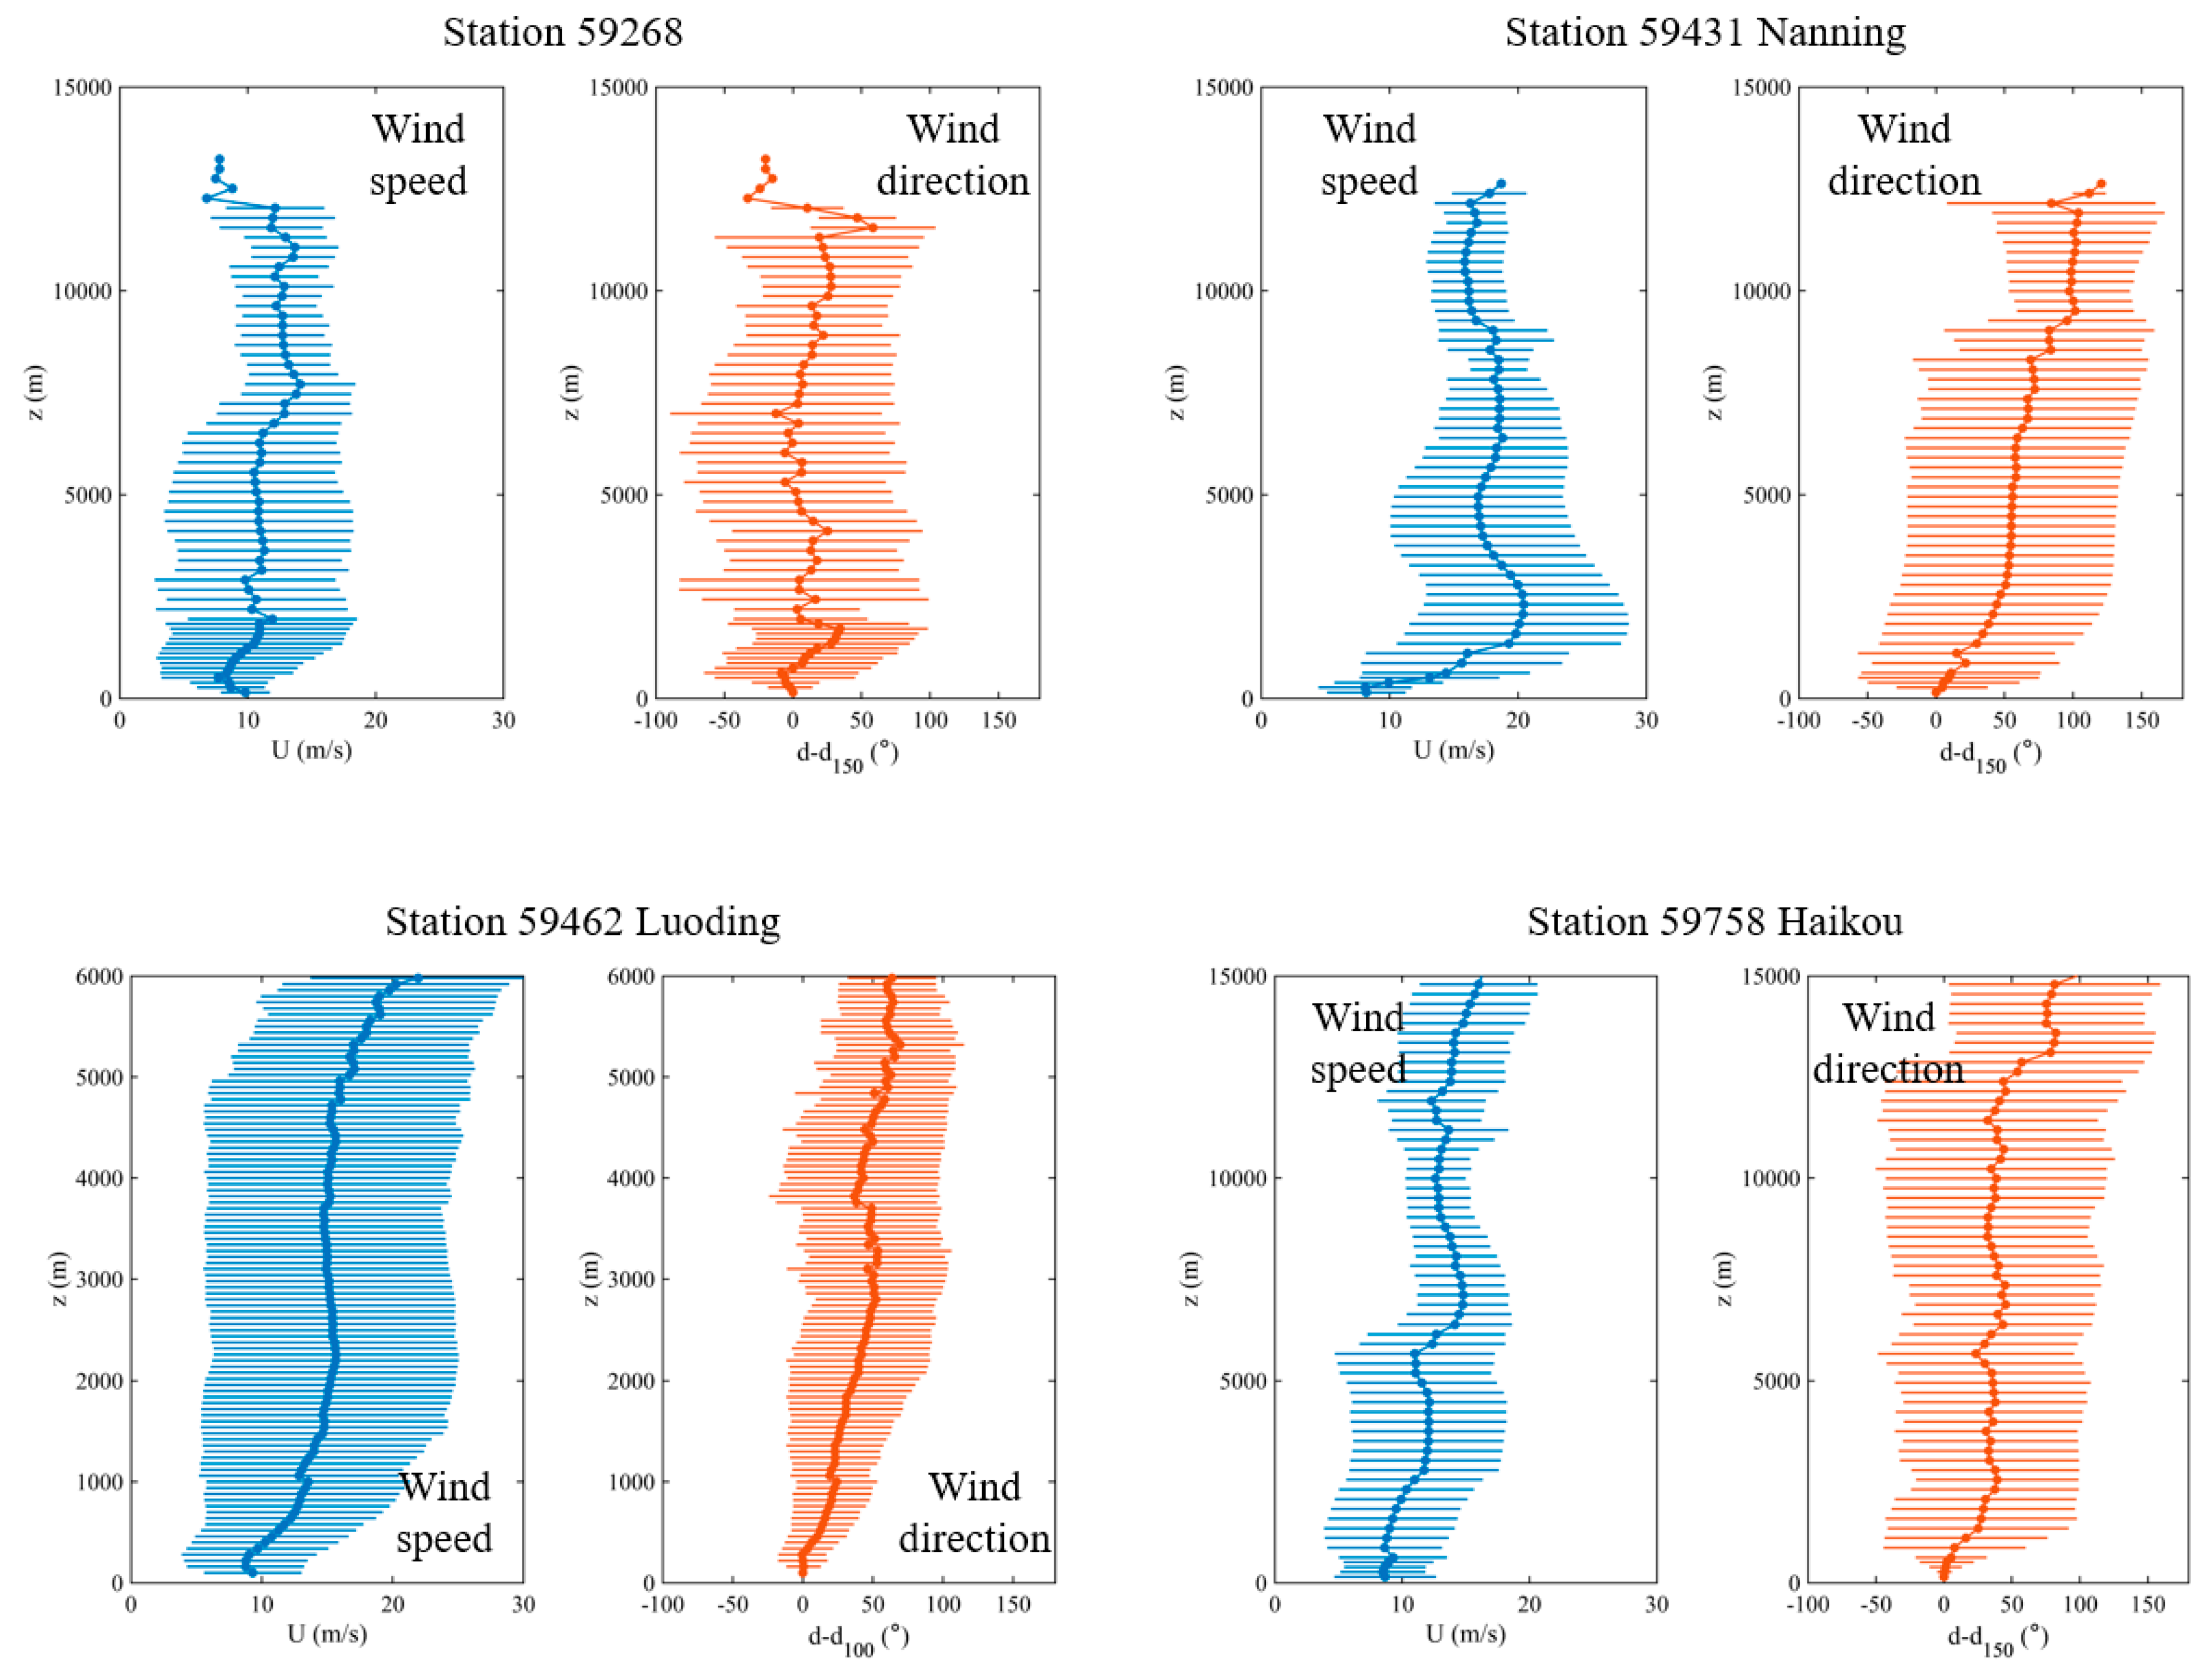
3. Surface and Upper Air Observations

A snapshot of the horizontal distribution of the surface wind of Typhoon Talim is given in Figure 2. It can be seen that the gale force wind distribution is rather extensive, with a gale radius in the order of 250 km when Talim was situated to the south of Hong Kong. On a couple of islands and offshore stations, even hurricane force winds in the order of 70 knots (the yellow wind barbs in Figure 2) were recorded. This is consistent with the dropsonde observations (discussed later) that the near surface wind could reach around 35 m/s. The extensive structure of Talim led to the strengthening of winds over the coastal areas of southern China when the cyclone was still several hundred kilometres away from the coast.
As an example of the radar wind profiler observations, the 925 hPa winds from the wind profilers in the region are shown in Figure 3a. The circulation of Typhoon Talim was very clear, and gale force winds were registered by a number of profilers near the Pearl River Estuary and the western coast of Guangdong. Among the profiles, the one at Xuwen (location in Figure 3a) is rather close to the centre of Talim. The profiler data (time–height cross section) is shown in Figure 3b. With the passage of the cyclone, the low-level winds changed from northwesterly to southwesterly. Before the change of the wind direction, a jet of hurricane force wind was observed within the atmospheric boundary layer. This profiler is able to measure the winds up to around 16 km and, thus, provides valuable information of the vertical structure of Talim.

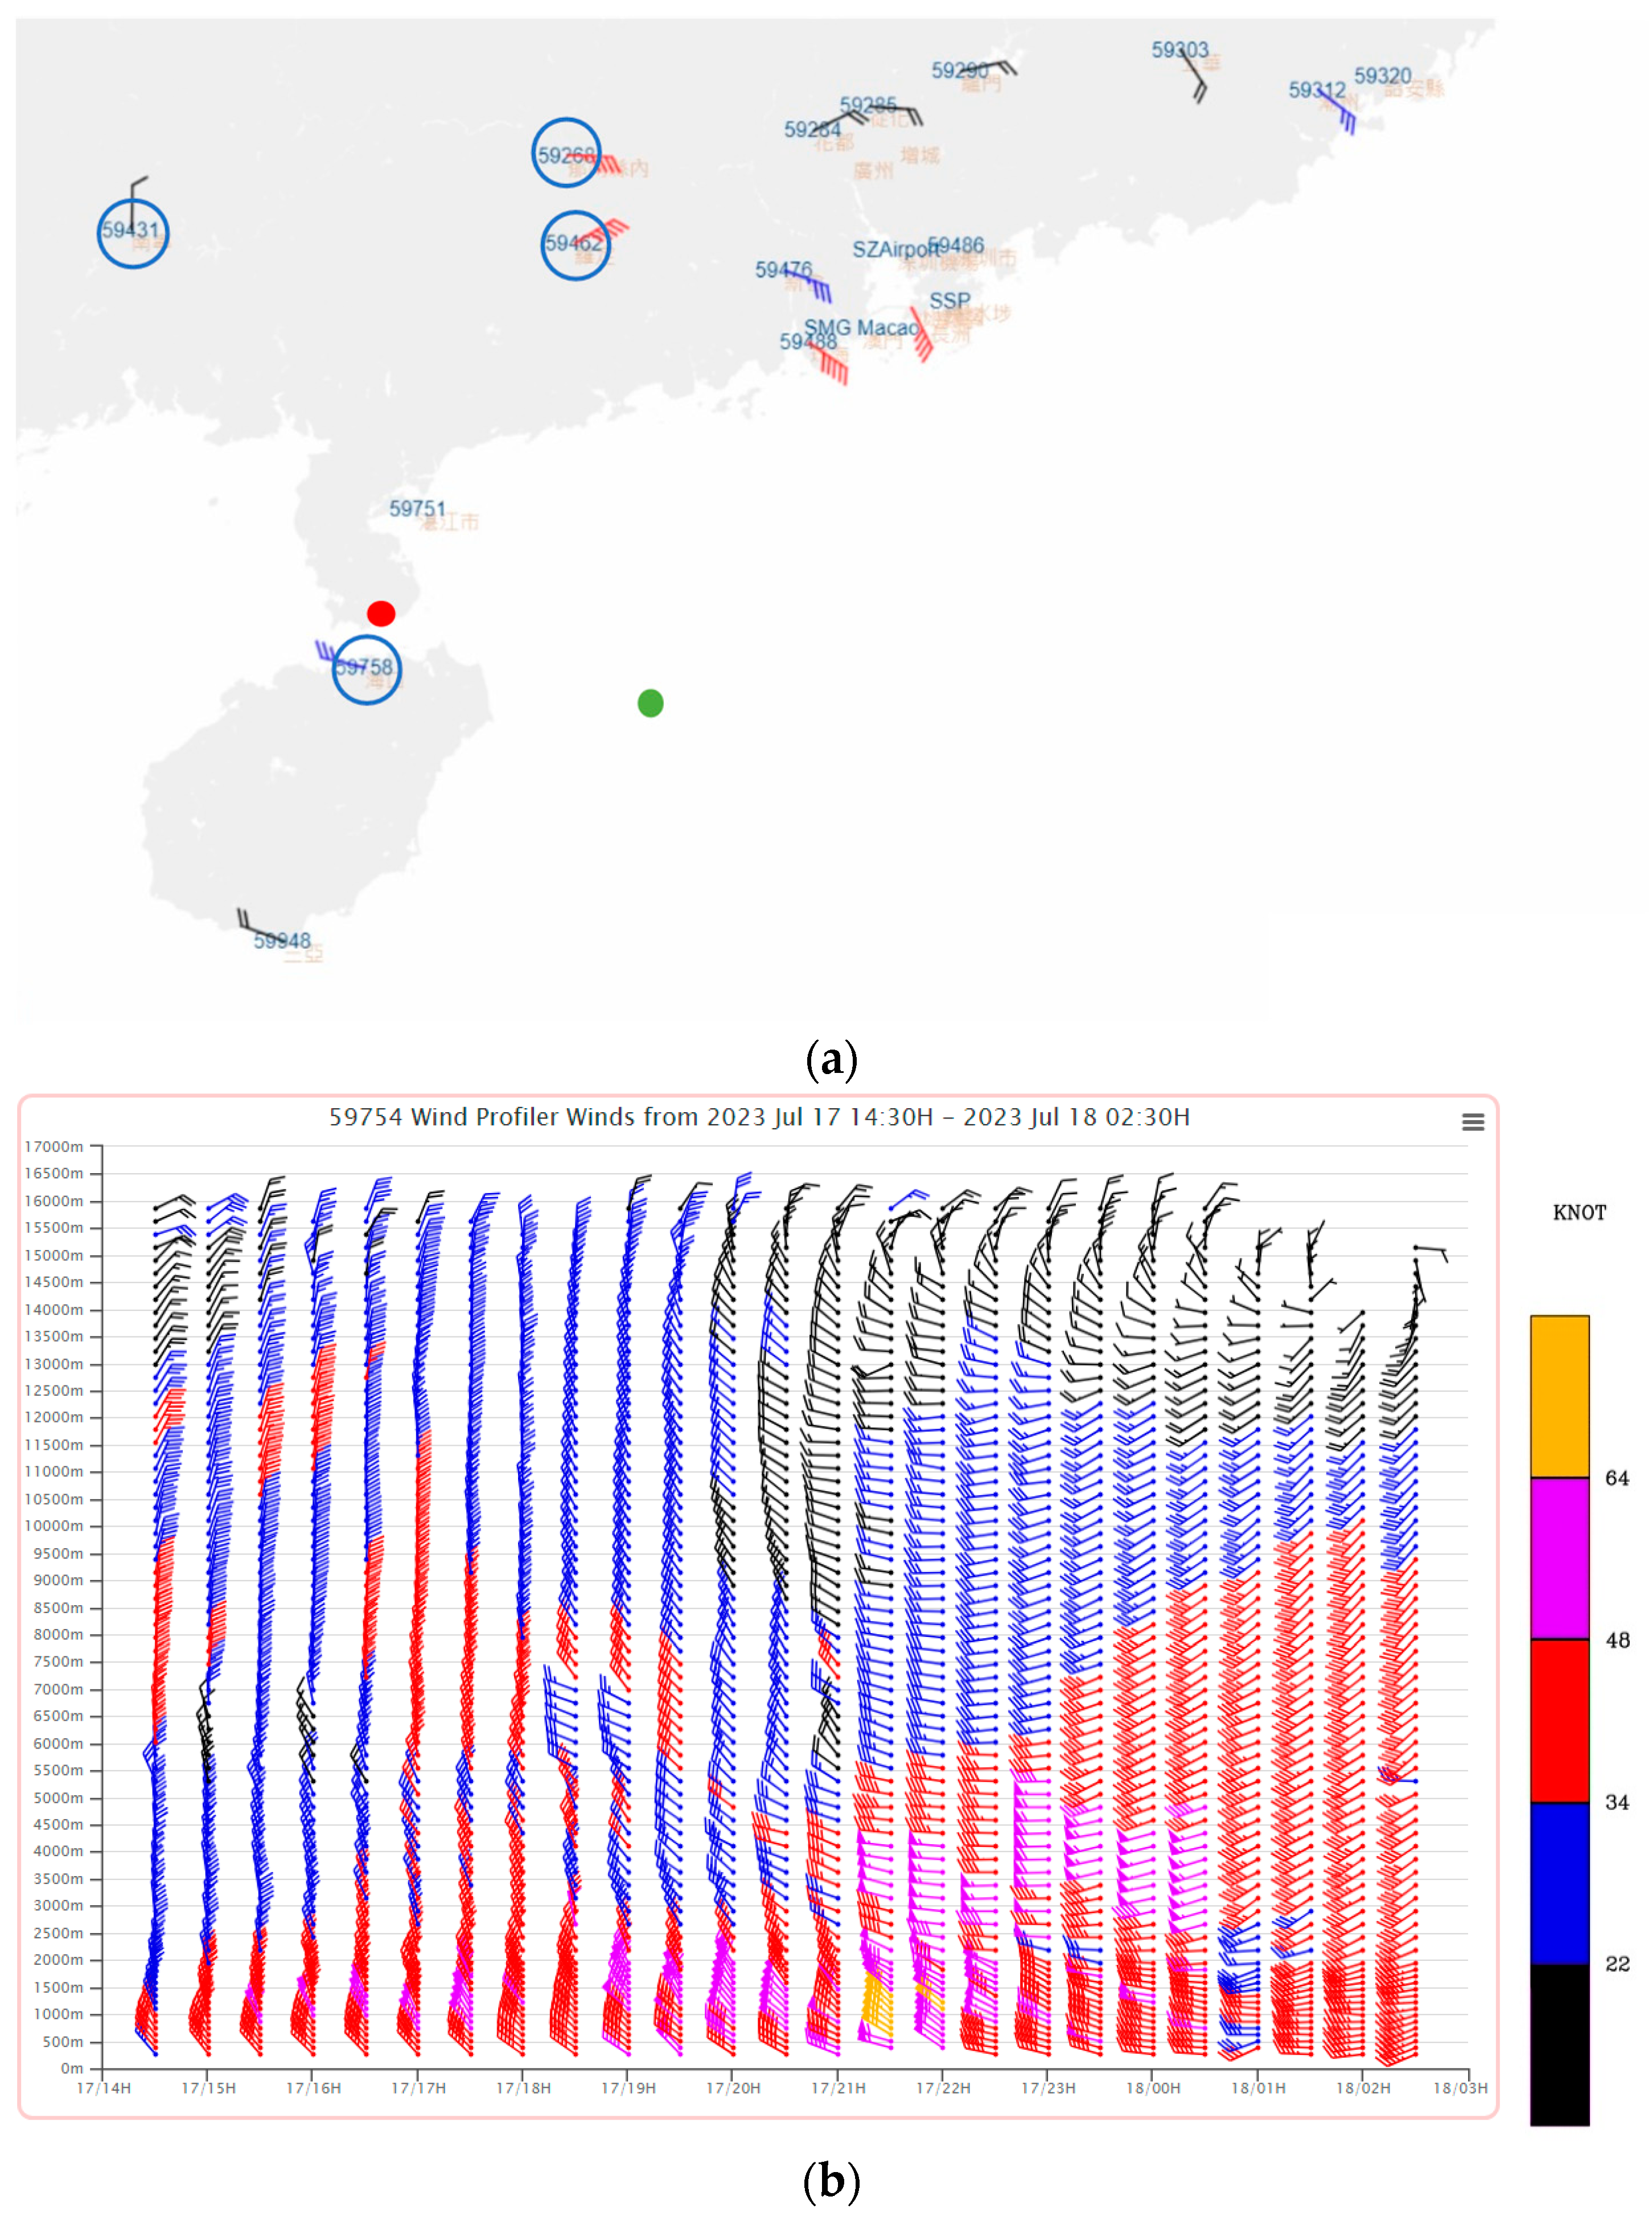
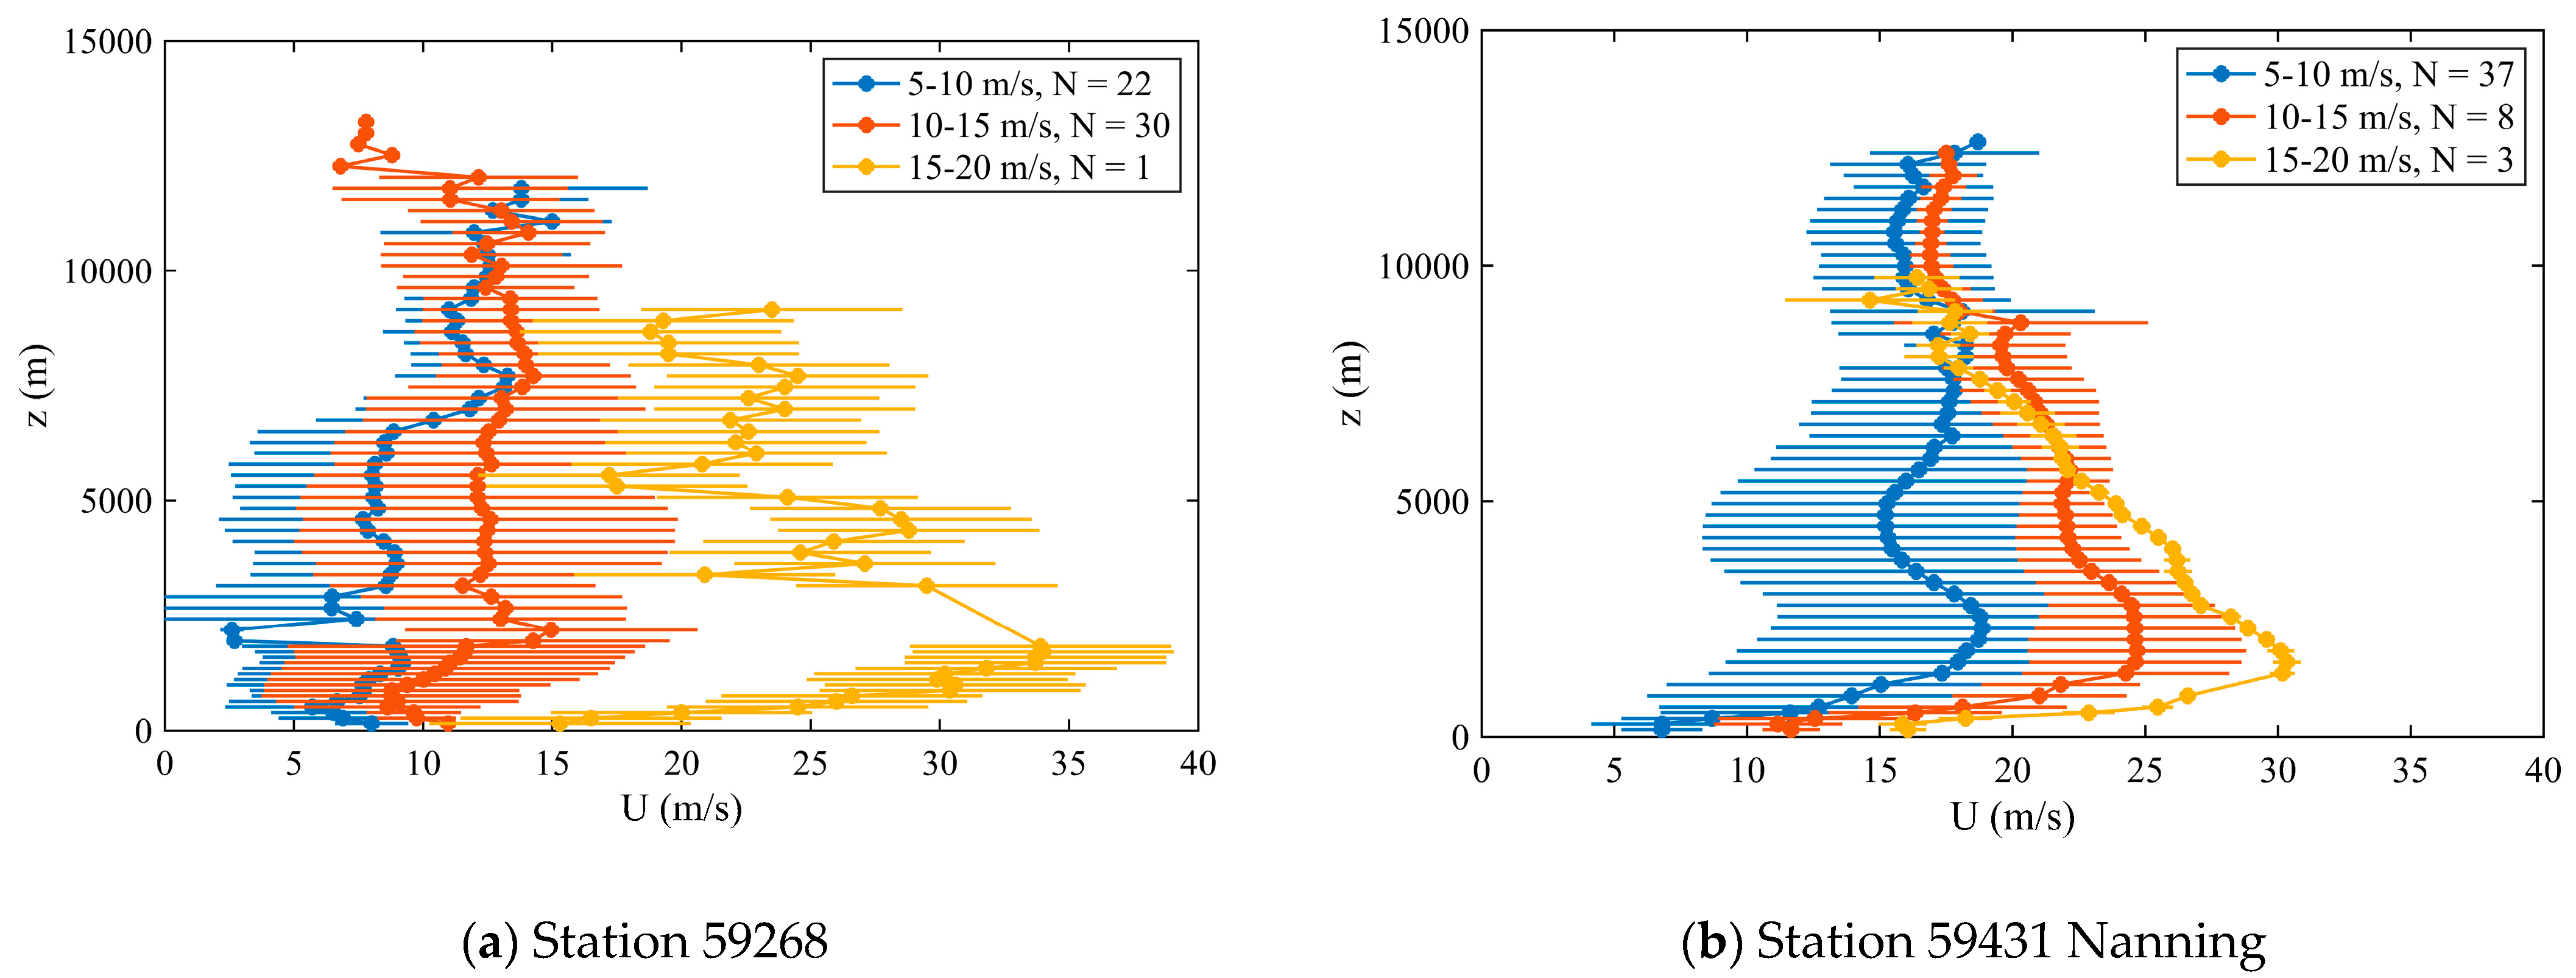
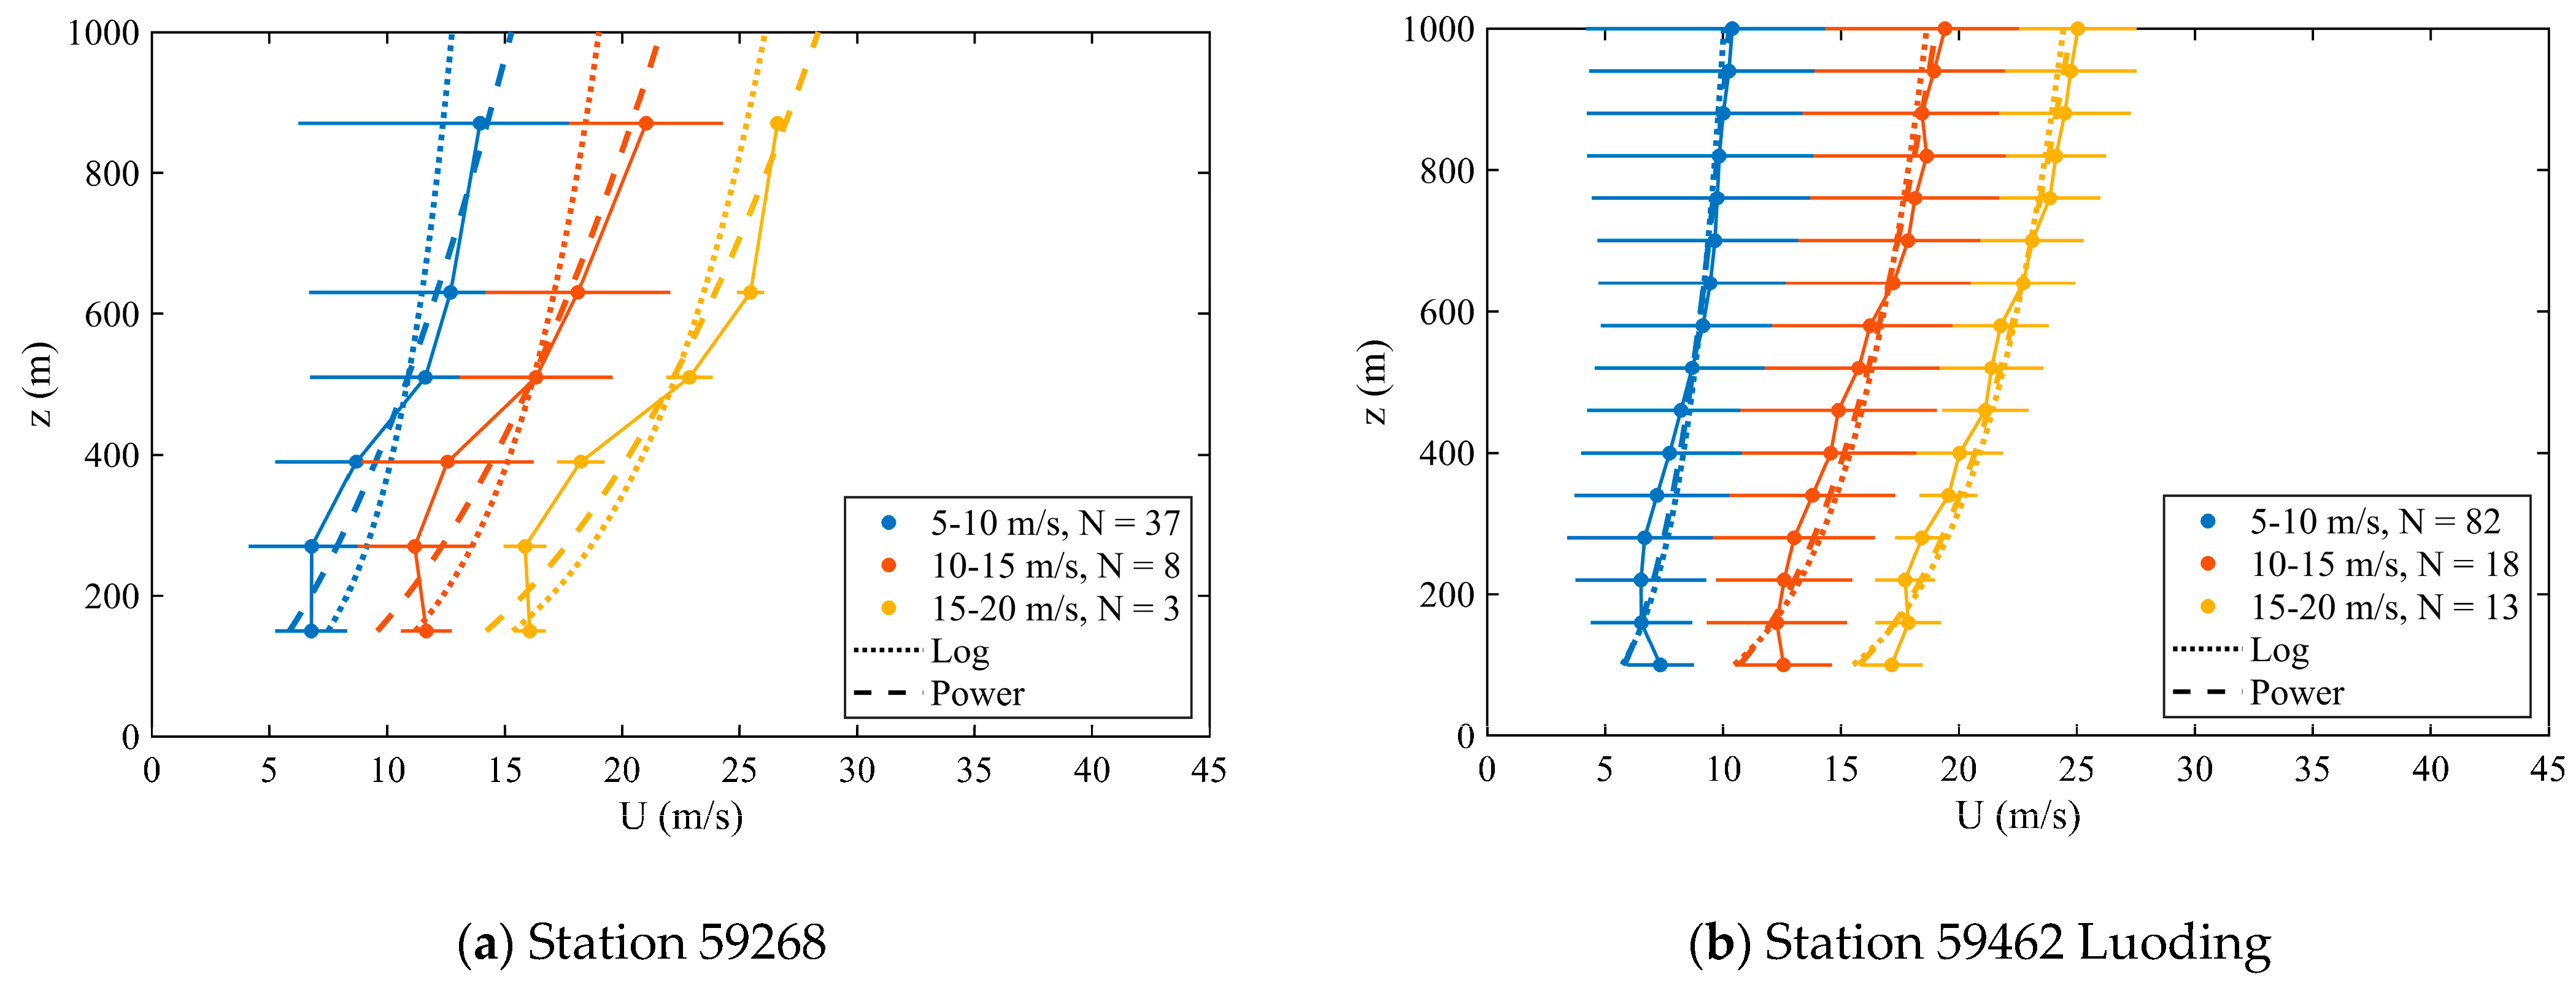
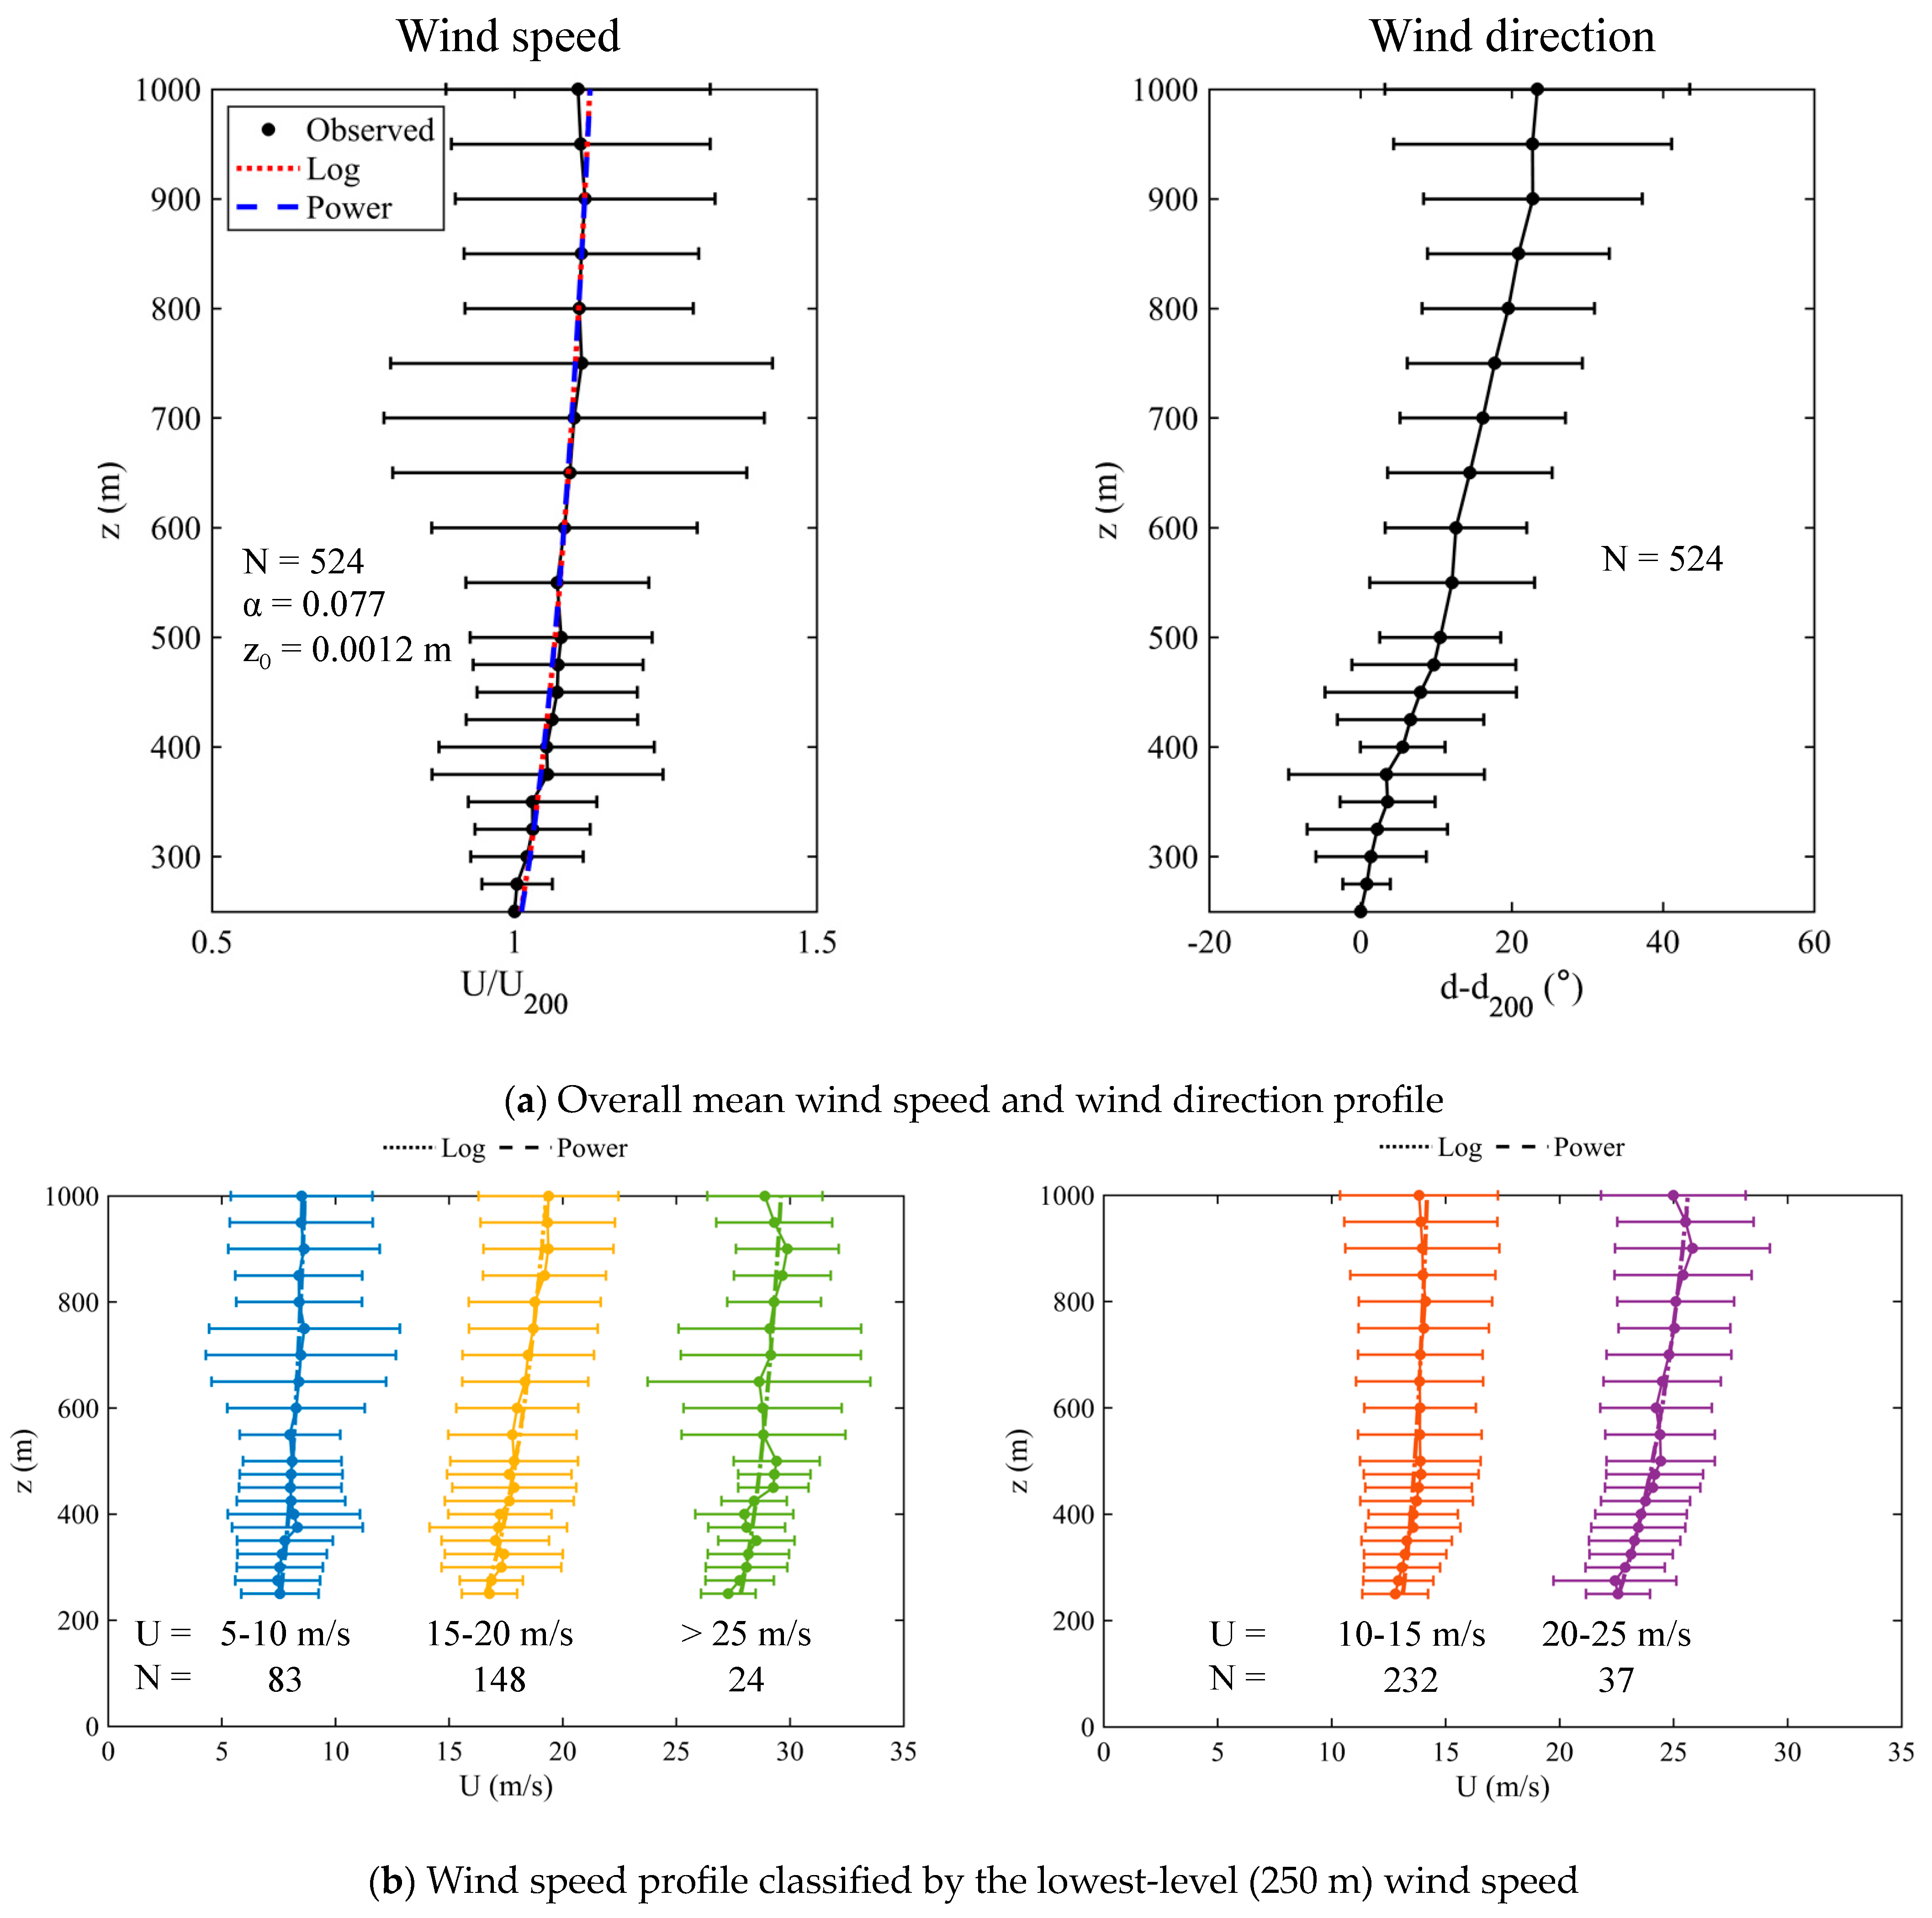
4. Radar Wind Profiler Data Analysis

The vertical wind profiles measured by the Xuwen profiler are analysed further in Figure 4. Different stratifications of wind speeds were tried out, e.g., based on the lowest-level (i.e., 270 m) wind for different wind speed classes (Figure 4a), and the distance from the centre of Talim (Figure 4b). It could be seen that, at relatively higher wind speed (e.g., above around 15 m/s at a height of 270 m) and for both the eyewall and the outer circulation, there is a clear signature of the low-level jet, with a height of around 500 m to 1000 m above the sea surface. This would have important implications for the design of wind code for tall buildings in the region to withstand the strong winds associated with tropical cyclones. For the wind direction (Figure 4b), there was clockwise rotation of the wind below 2000 m or so and then anticlockwise rotation aloft between 2000 m and 4000 m. The veering of winds would have important applications in wind engineering as well (such as Weerasuriya et al. [11]). The wind speed profiles below 1000 m were fitted to the log law and power law in Figure 5 based on different stratifications of wind speeds. In general, the vertical wind shear below 1000 m is very low. This is probably because the wind profiler is located in a smooth and flat terrain near the coast. The log law and power law can be used to describe the vertical wind profiles despite some “kinks”. Such kinks have also been reported in previous observational studies of tropical cyclone wind profiles at coastal locations, e.g., Tse et al. [12]. The kinks may be caused by coastal internal boundary layer (IBL) development due to the terrain transition across the coastline.
Apart from the Xuwen profiler, the vertical wind profiles of Talim have also been analysed by using a number of other radar wind profilers. Figure 6 shows the results of the station 59268 and the station 59431 Nanning (locations in Figure 3a). Similar to the Xuwen profiler, there are clear signatures of the occurrence of a low-level jet at a height of around 1000 m. The low-level jet feature becomes more pronounced with increasing wind speed (i.e., decreasing distance to the storm centre). The height of the maximum wind speed, or the jet height, also tends to decrease with increasing wind speed. Such feature has also been reported in previous studies, e.g., Franklin et al. [13]; Giammanco et al. [4]; He et al. [14]. The low-level jet, also known as the supergradient boundary layer flow, is a prominent characteristic of tropical cyclones, especially near the eyewall. Its presence can be attributed to the boundary layer spin-up mechanism [15]. In the boundary layer of a tropical cyclone, the air loses its absolute angular momentum to the surface due to convergence. In certain inner radii of the cyclone, such as the eyewall, where the loss rate of absolute angular momentum is relatively small, the wind speed within the boundary layer can exceed that above it, resulting in a supergradient flow [16]. The existence of supergradient flow in the tropical cyclone boundary layer is supported by other observational studies [17,18] and numerical simulations [19]. The boundary layer wind speed profile below 1000 m has also been analysed (Figure 7). There are some kinks in the observed wind profiles, and the profiles show some deviation from the log law and power law. There are some possible explanations for this deviation. One possible cause is the development of an IBL due to the inhomogeneous terrain near the observation locations [20]. Another possible contributing factor is the topographic effects induced by nearby mountains [14]. As for the wind direction, winds generally rotate clockwise with height, not just within the atmospheric boundary layer but extending to a height of around, say, 6000 m or even 15,000 m based on the wind profiler data from the station 59268 and the station 59462 Luoding (Figure 8). As a result, based on various wind profiler data, the veering of winds with height is an important feature of the wind field of tropical cyclones for wind engineering applications.

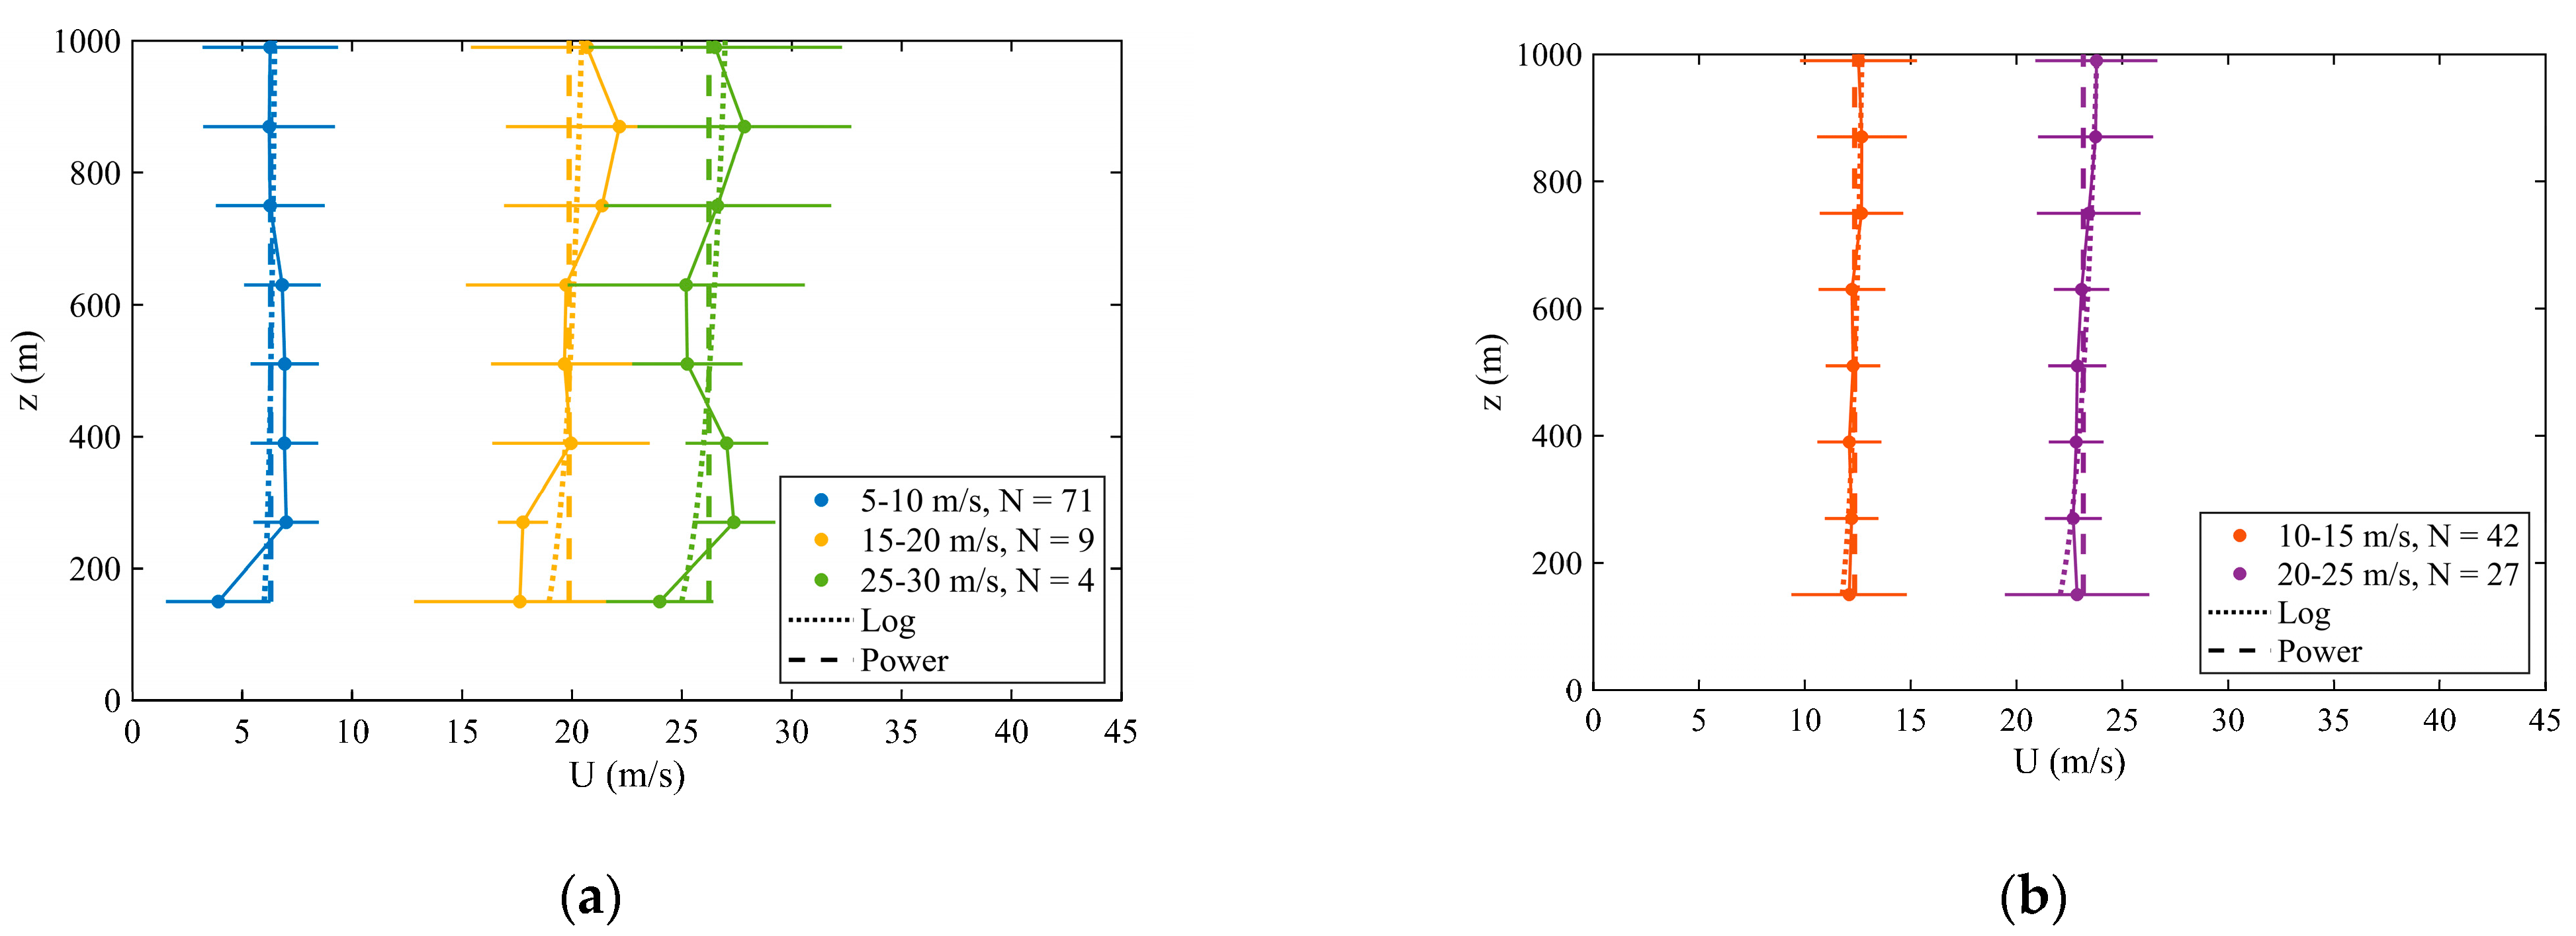
5. LIDAR Wind Profiler Data Analysis

There is a LIDAR wind profiler on an offshore platform (location in Figure 3a) over the south China coastal waters. This instrument provides valuable information about the vertical wind profile over the sea. The analysis results of the vertical wind profile within the atmospheric boundary layer are given in Figure 9. With and without the wind-speed stratification (based on the wind speed at the lowest observation height 250 m), the log law and the power law fit the wind speed profiles rather well. The goodness-of-fit of the wind profiles at the offshore location to the log law and power law is much higher than those at coastal (Figure 5) and inland (Figure 7) locations. Such good fit is also found in previous studies, e.g., Powell et al., (2003). This can be explained by the fact that the sea surface is relatively more homogenous than land surfaces, and the influences from the IBL and topographic effects are usually nonexistent or negligible for offshore wind profiles. The wind direction generally shows veering of winds with height, which is consistent with the radar wind profiler observations as well as previous studies [21].
The roughness length and the power law exponent for various wind speed ranges have been determined from the fitting of the profiles and they are summarised in Table 1. In general, α is in the order of 0.1, and z0 is in the order of 0.01 m or smaller, which may be expected over the open sea. Nevertheless, there is no clear relationship between α/z0 and wind speed. This is different from previous studies since marine surface roughness is generally regarded to first increase and then level off or decrease with increasing wind speed due to the air–sea interaction [22,23]. Possible explanations include the inhomogeneous dynamical features in the tropical cyclones and the thermodynamic effects (e.g., the atmospheric stability effects). This information is valuable for wind engineering applications in the south China coastal waters.

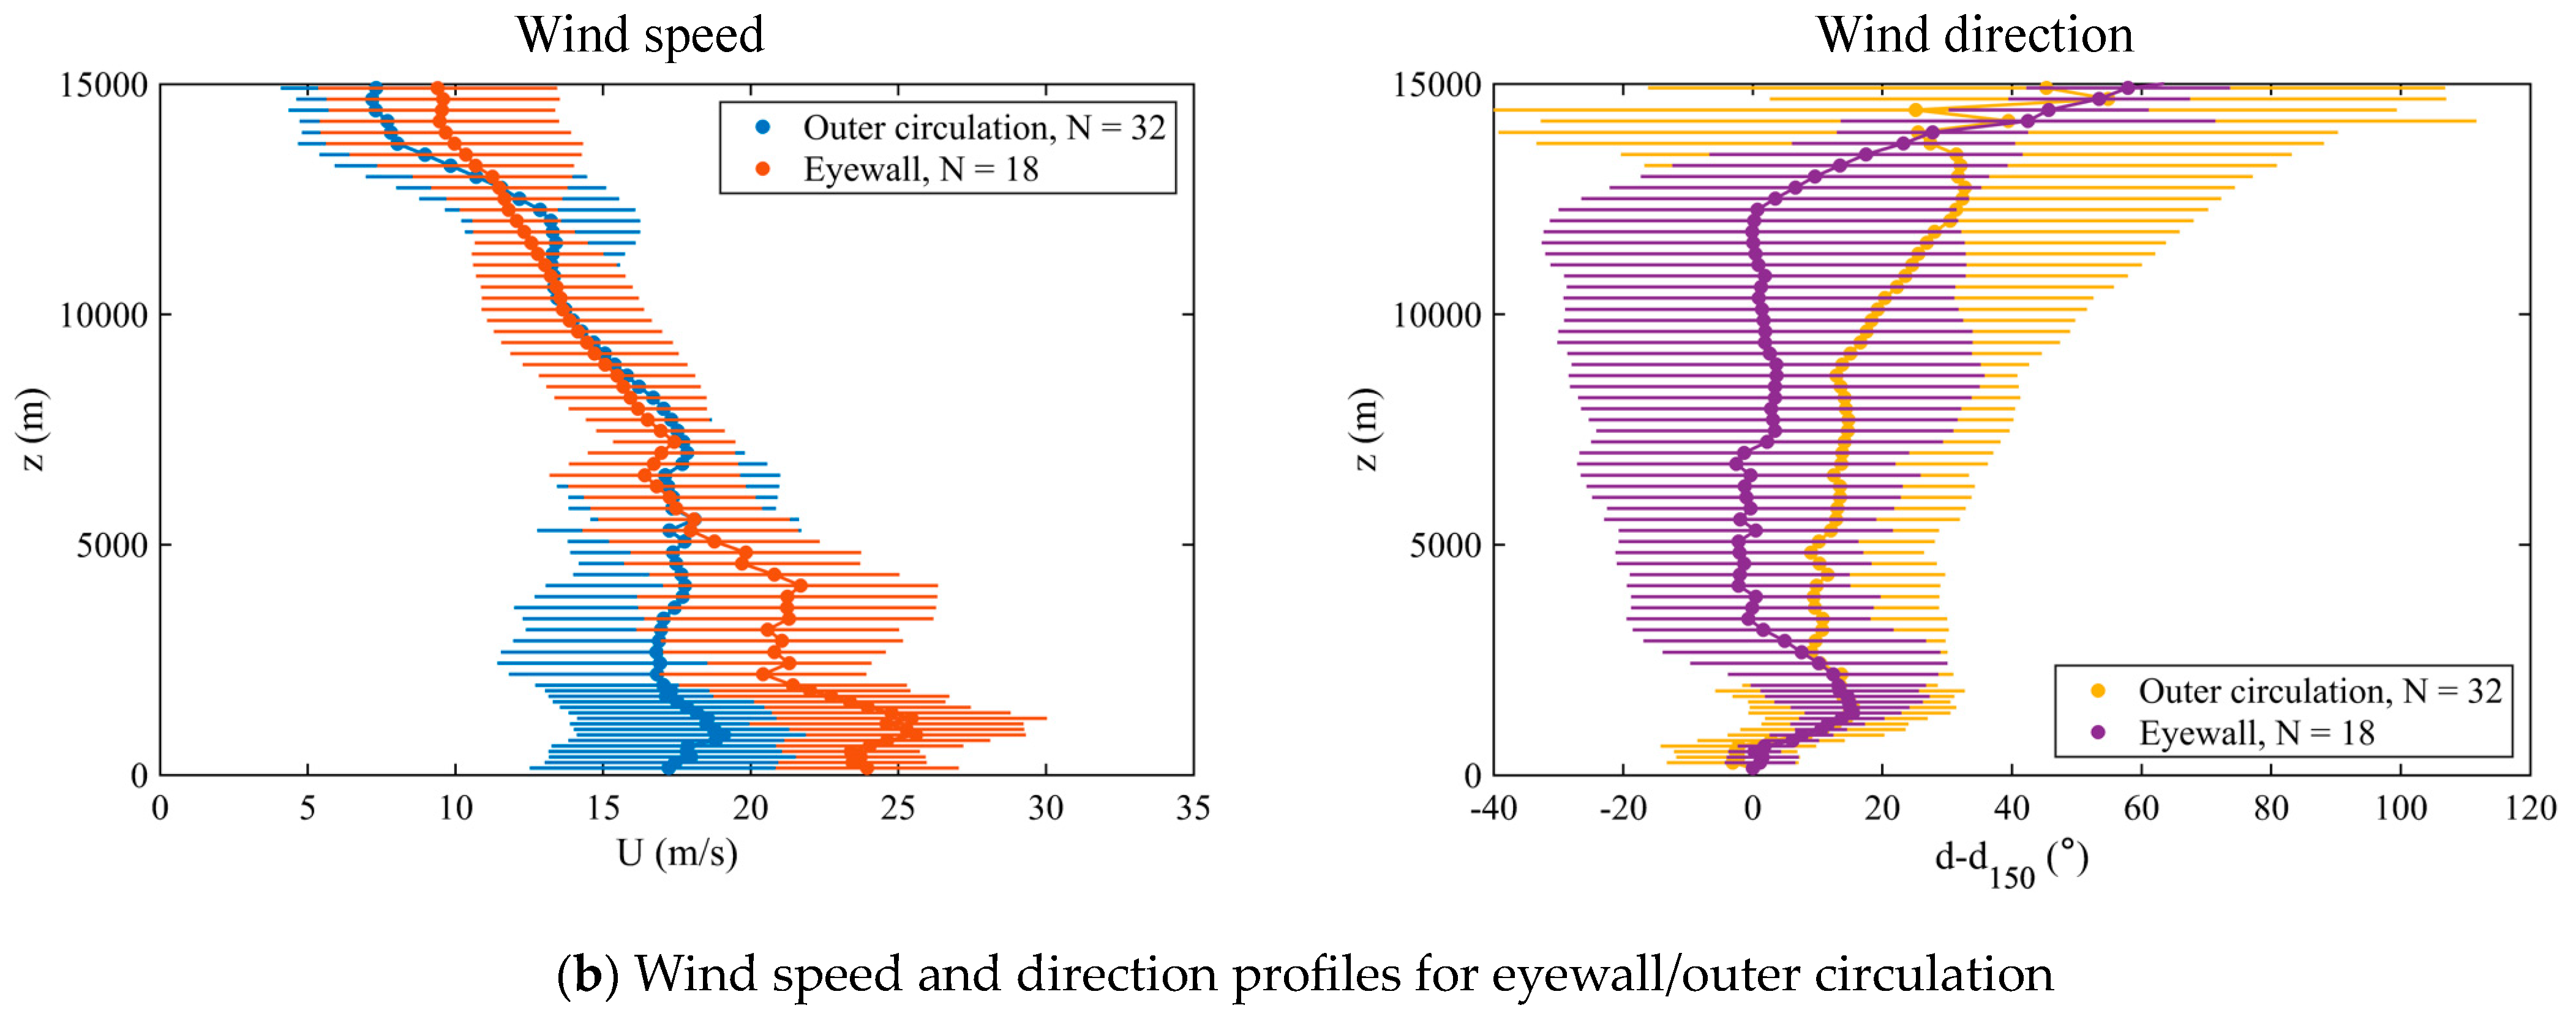
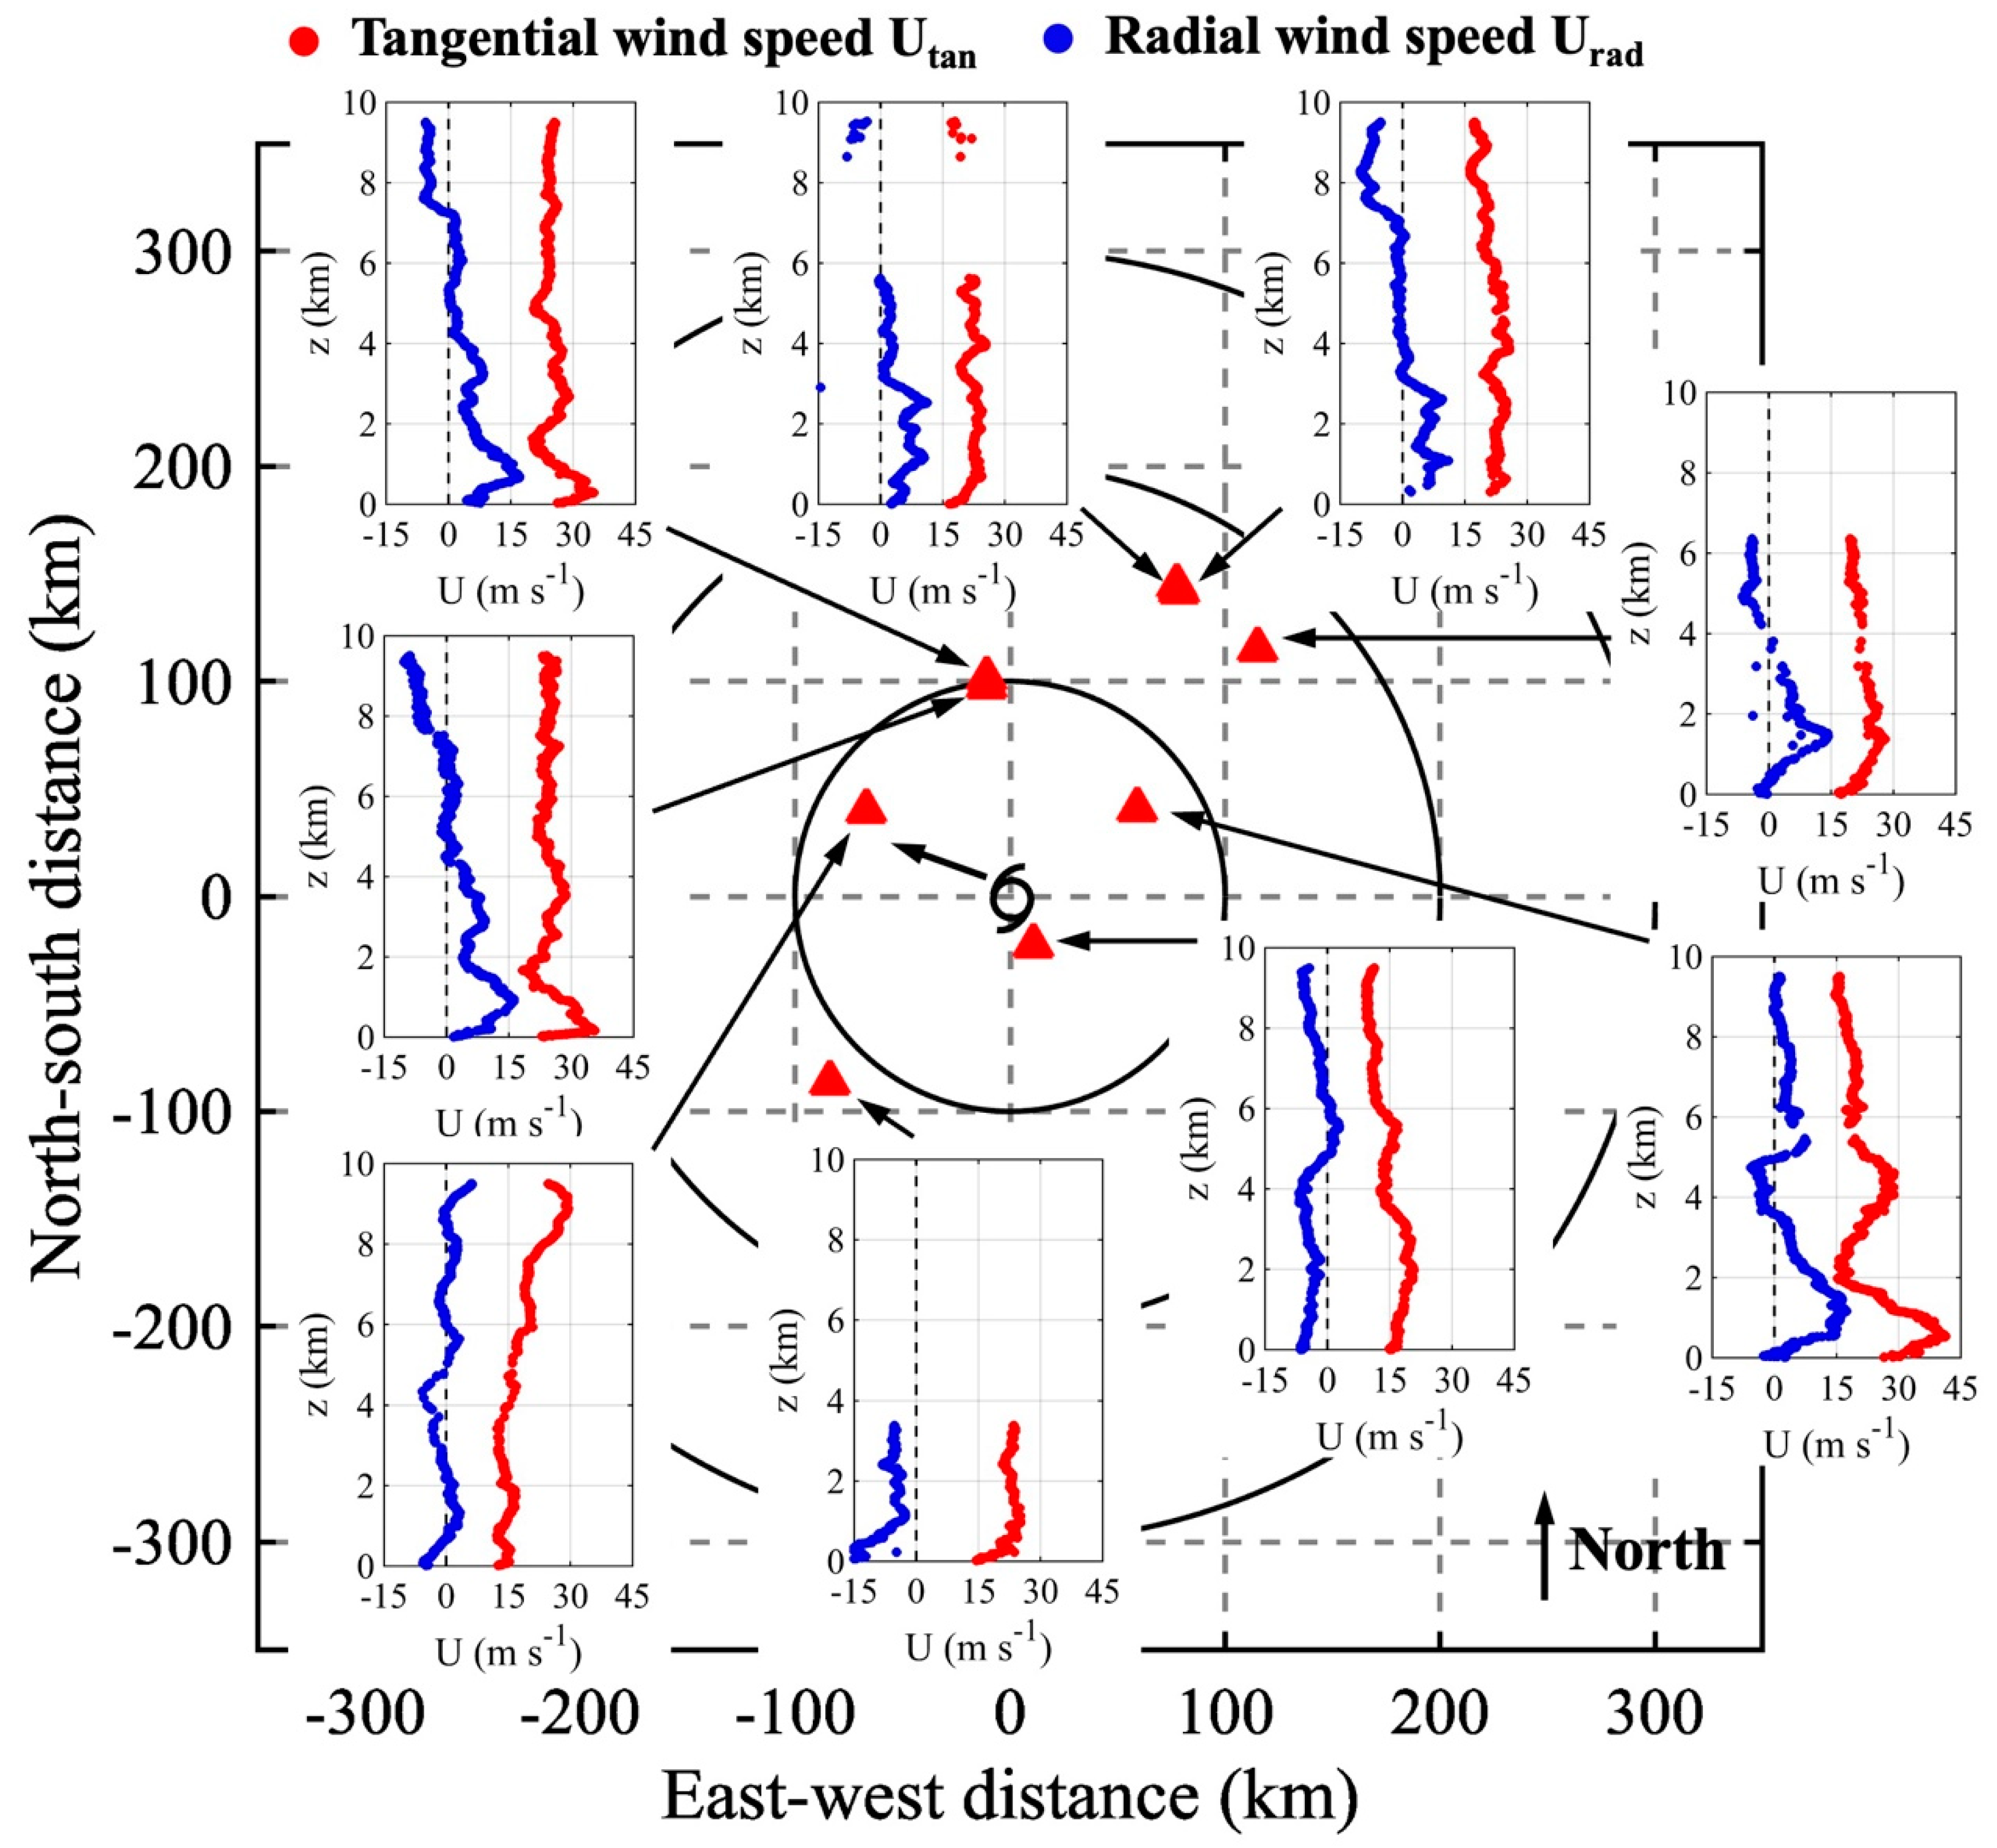
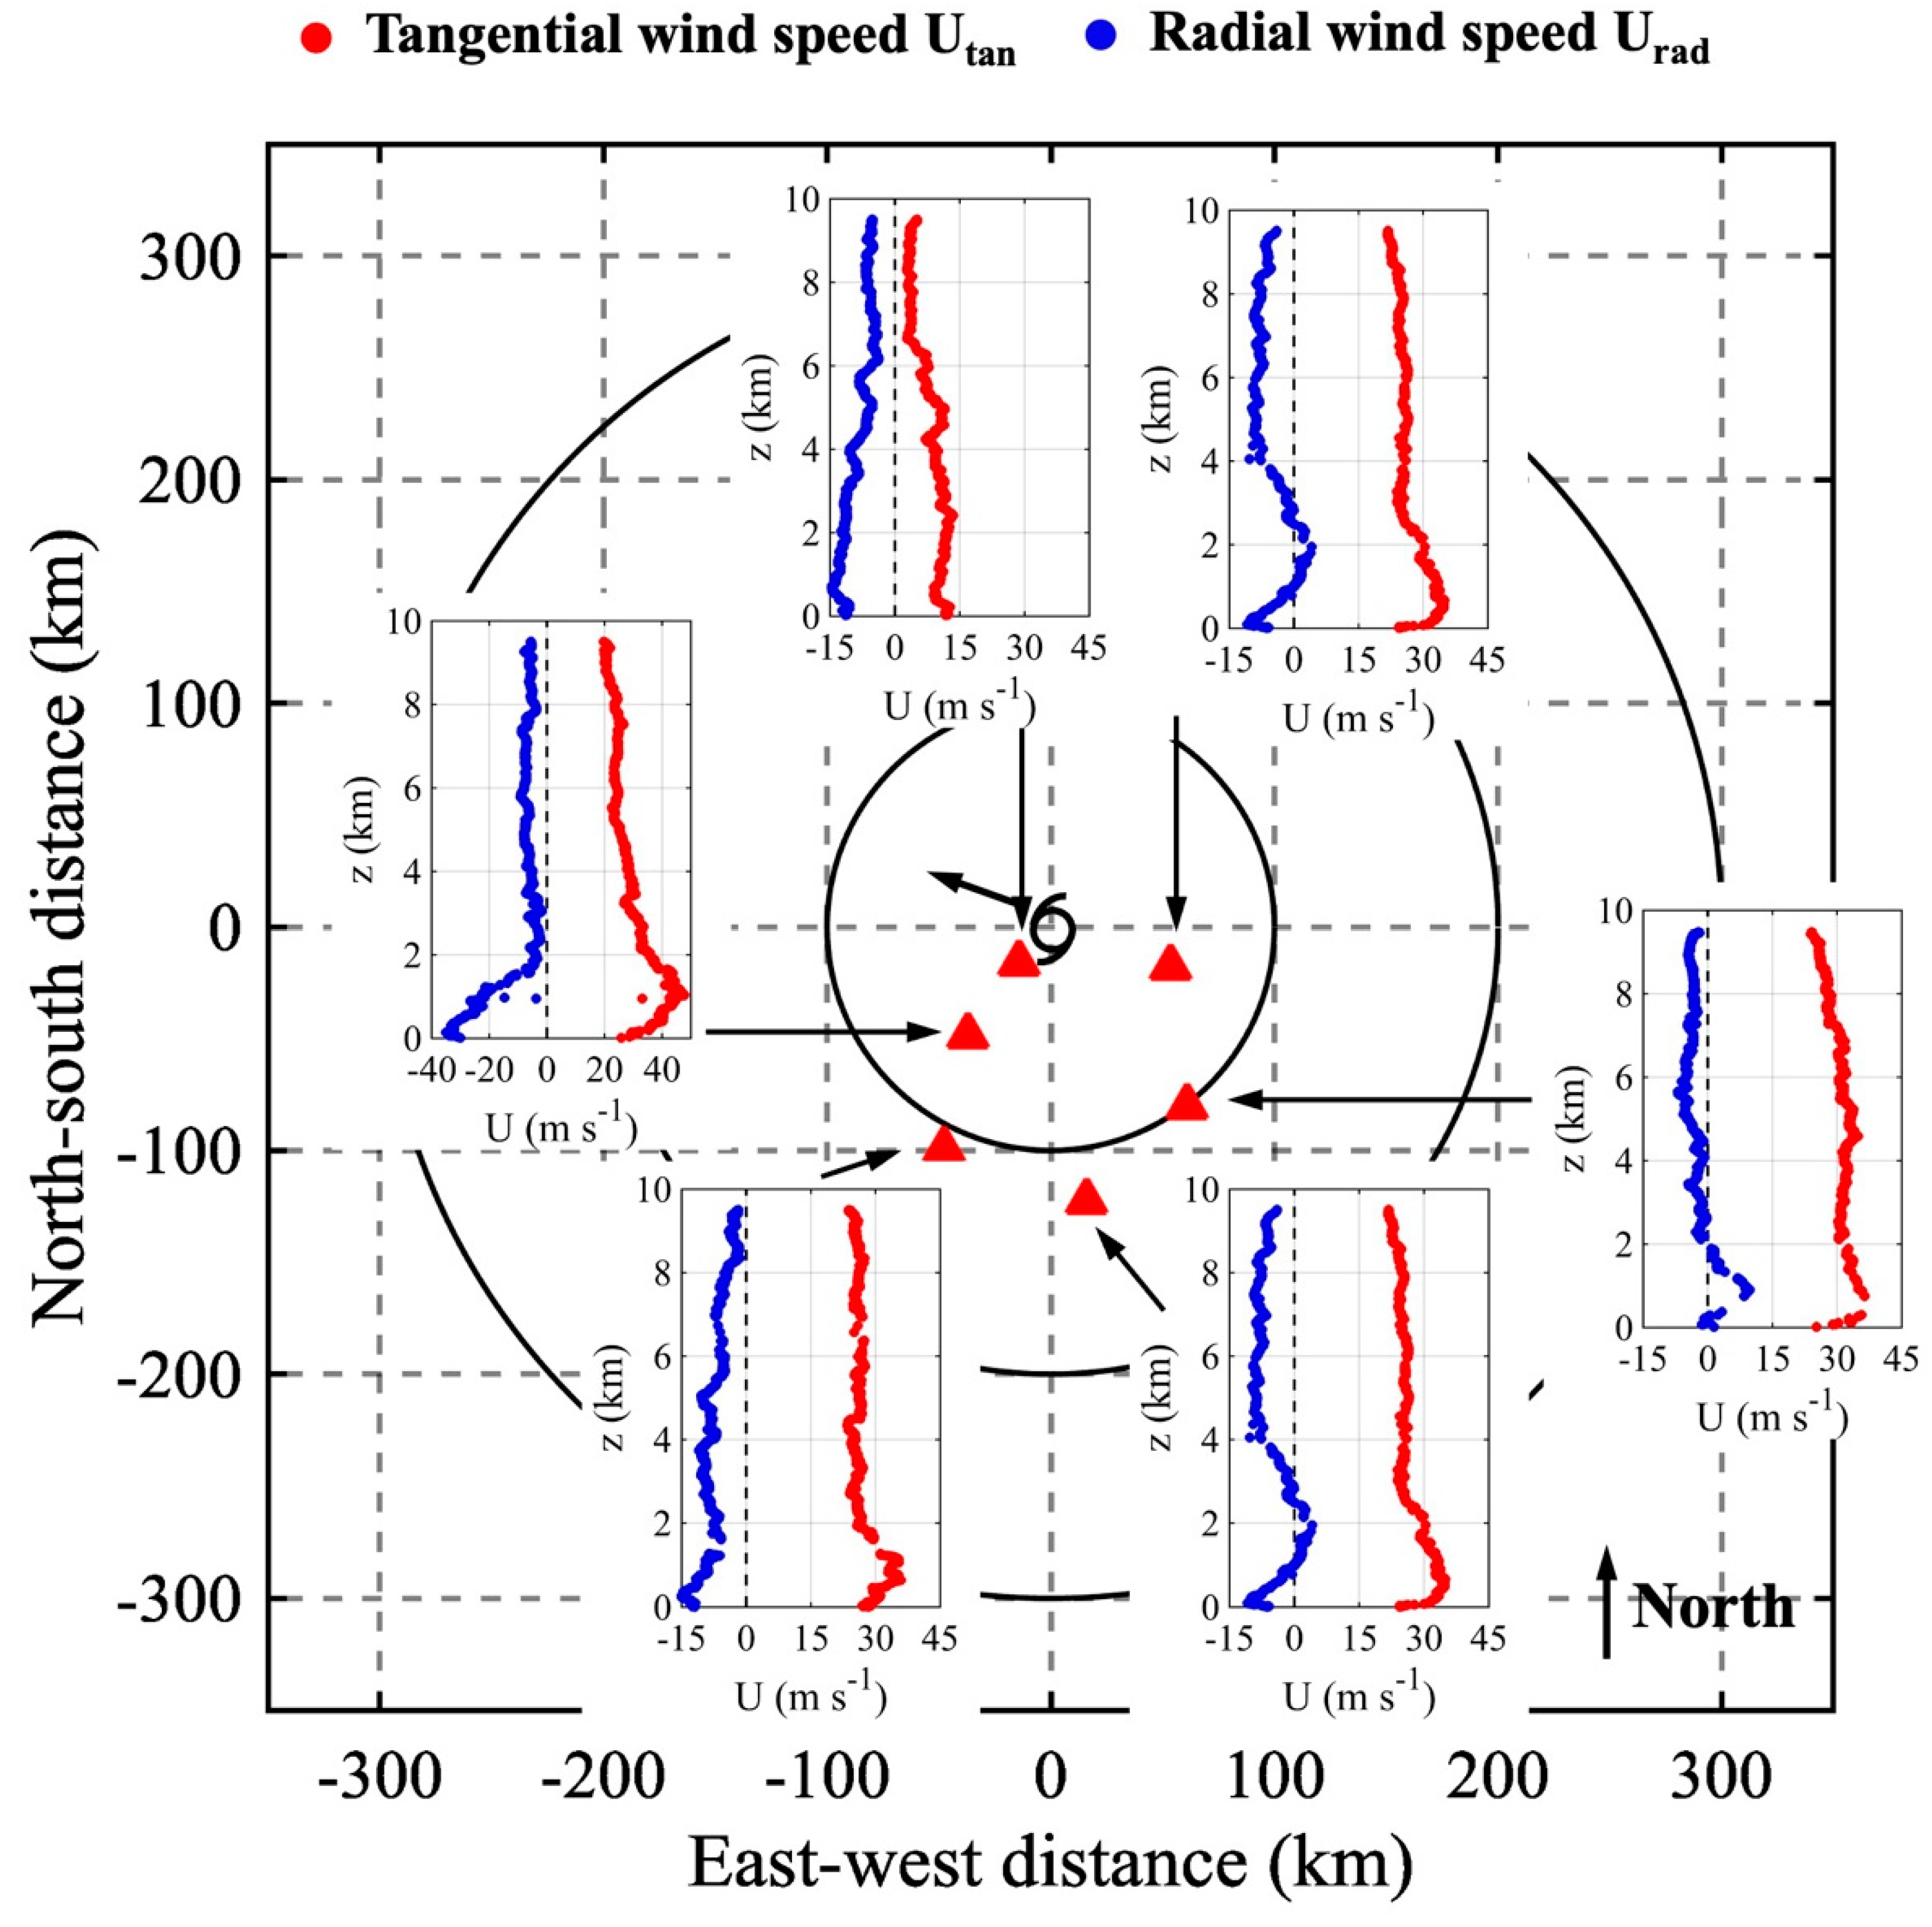
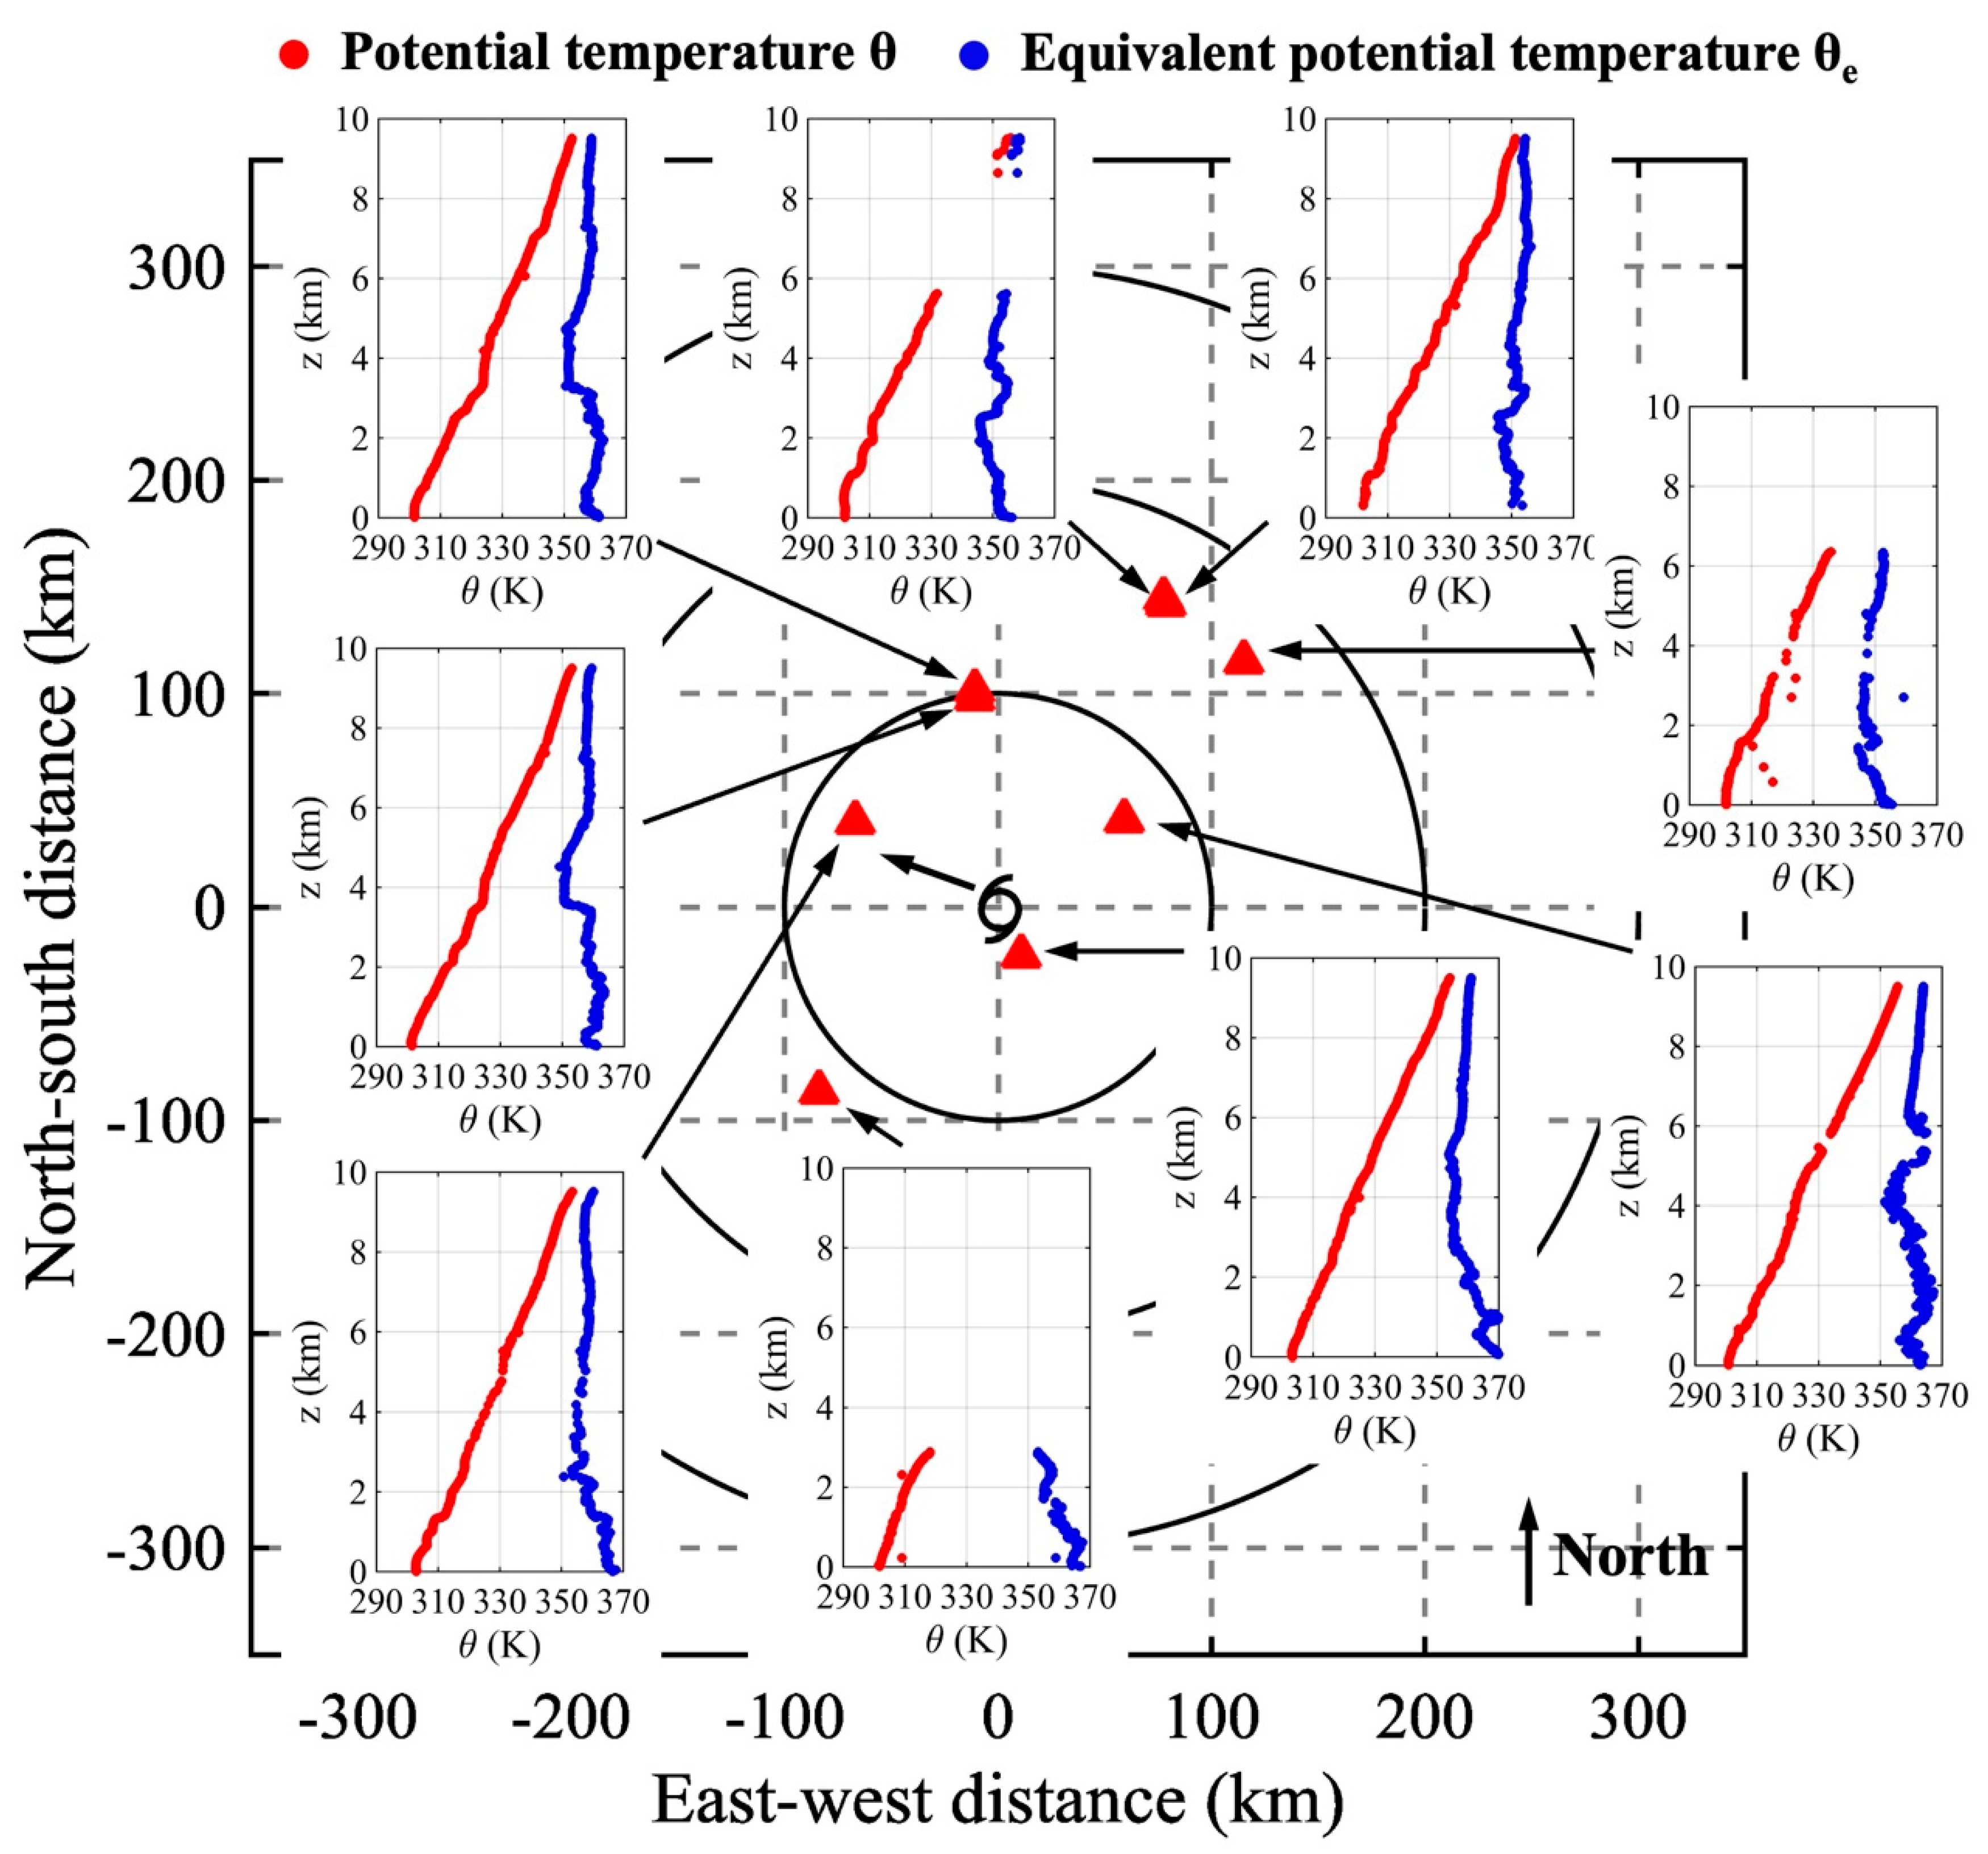
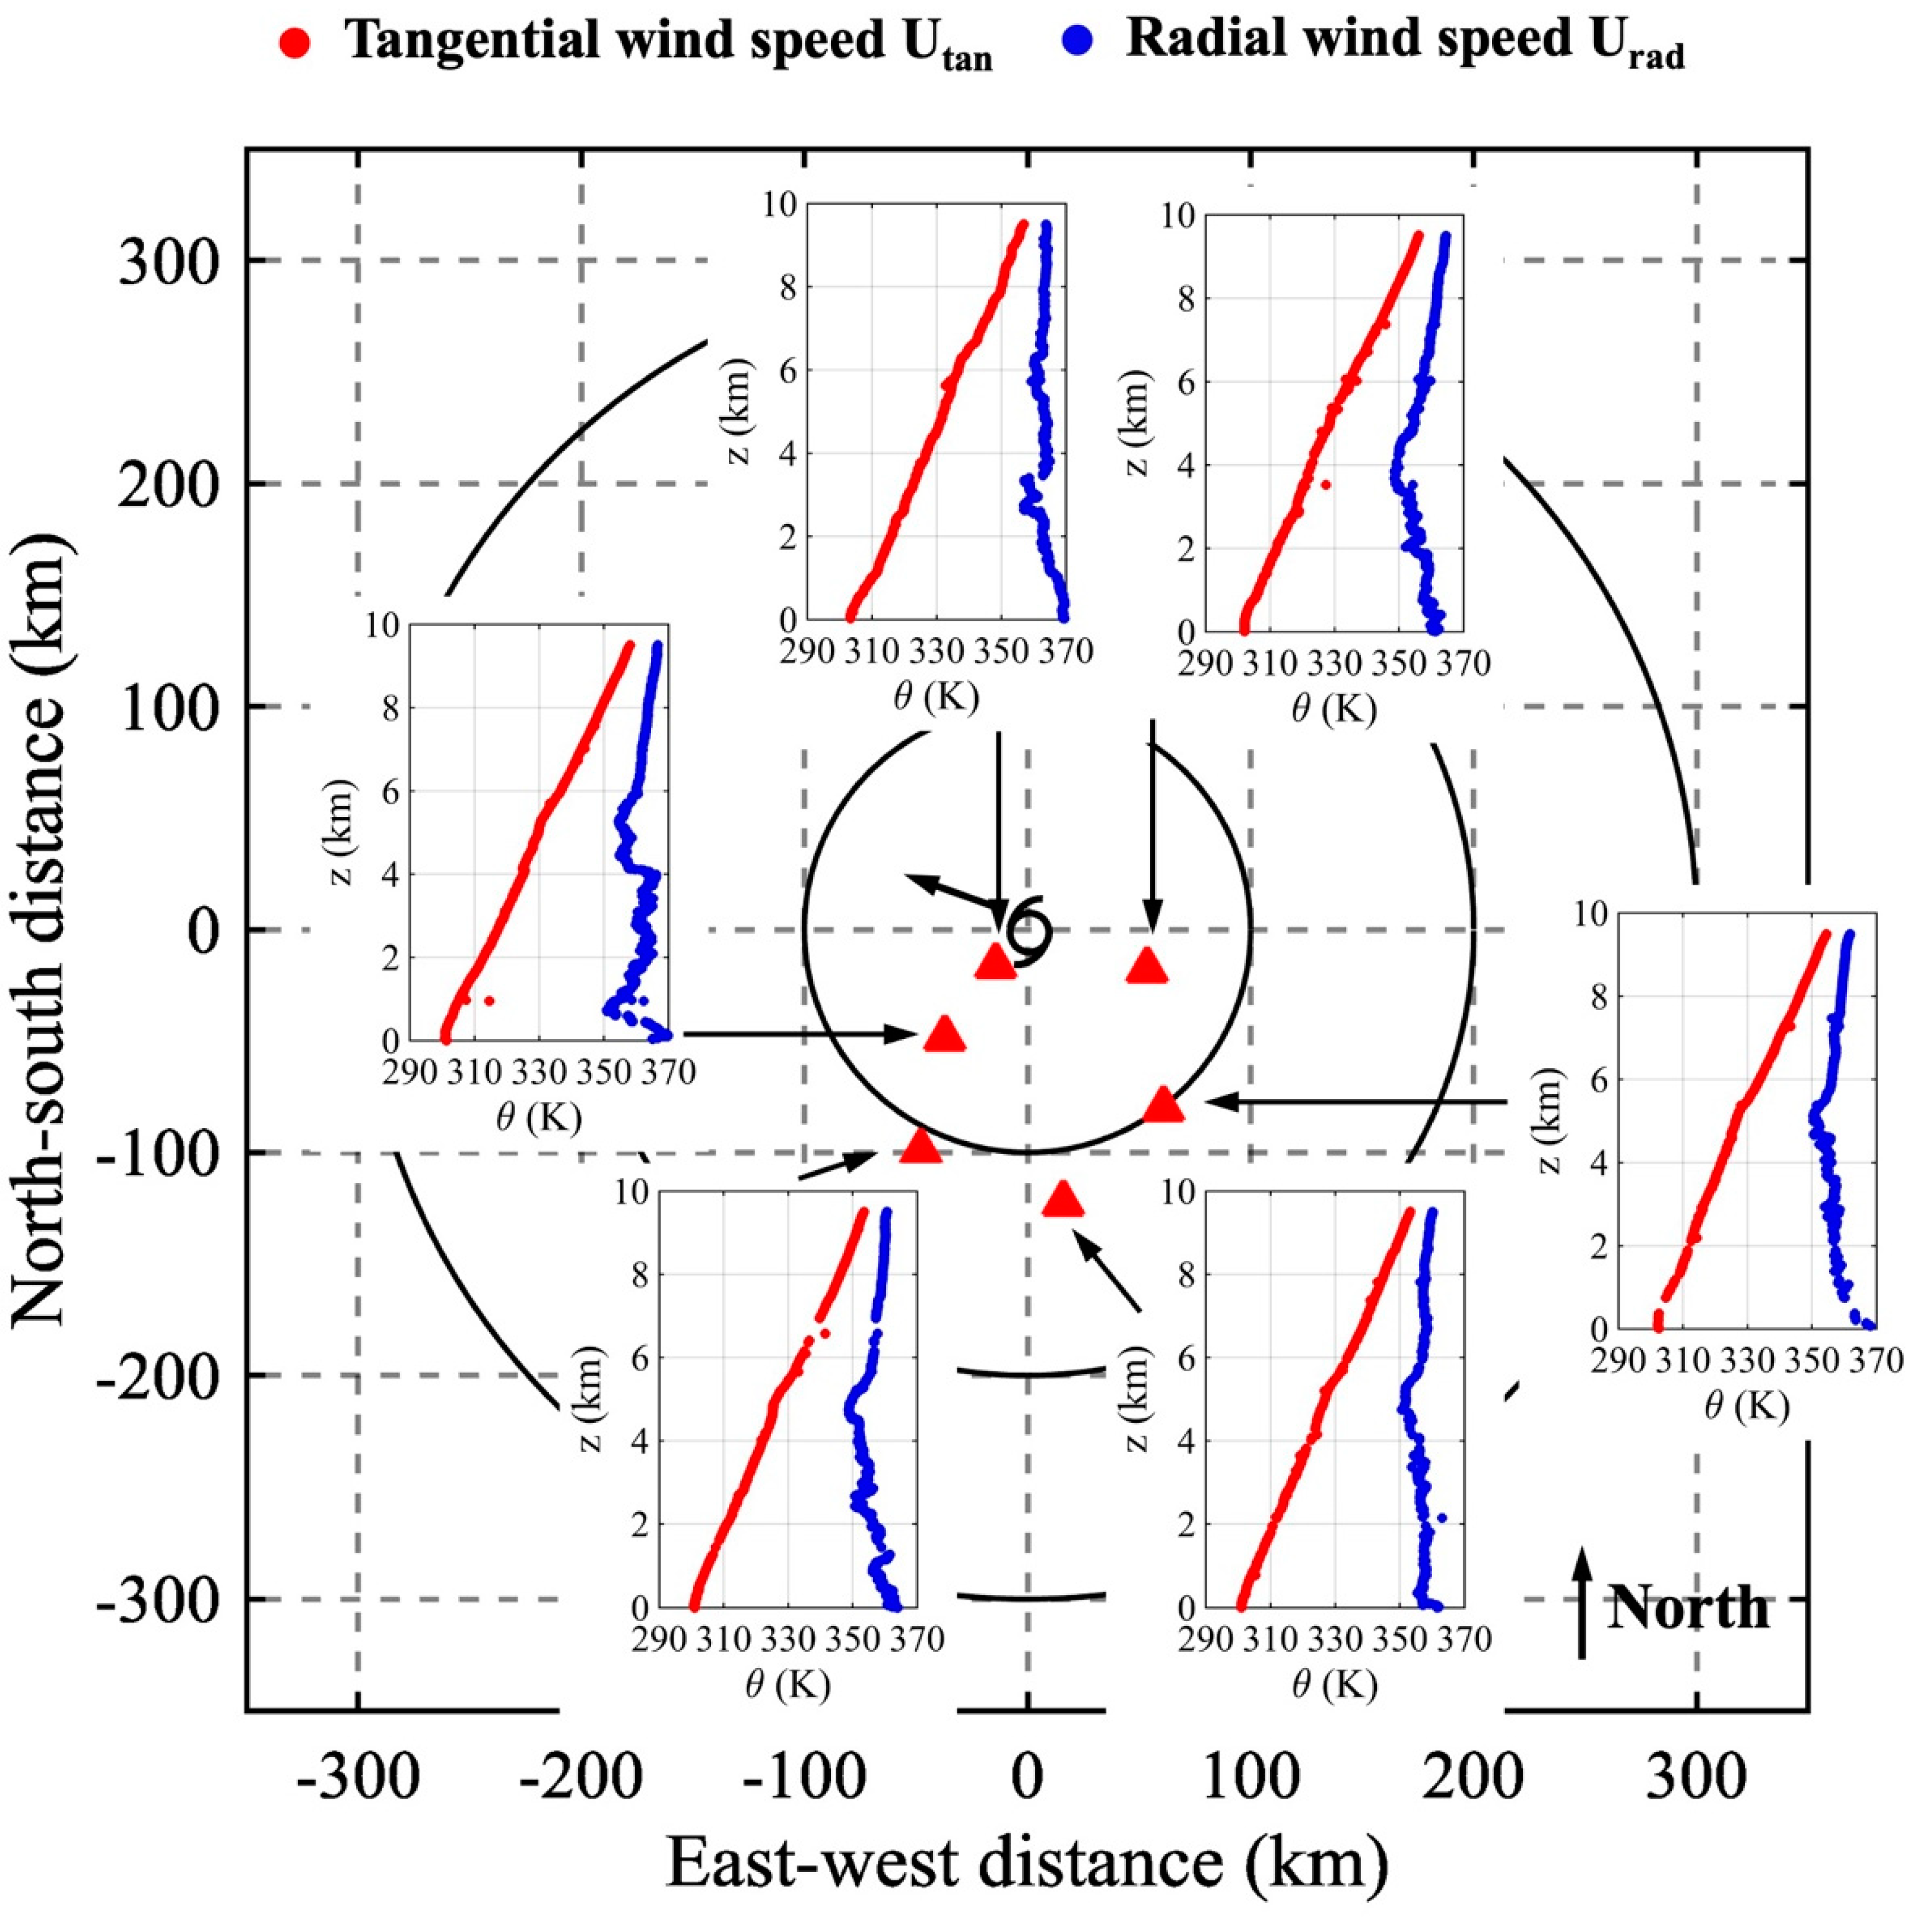
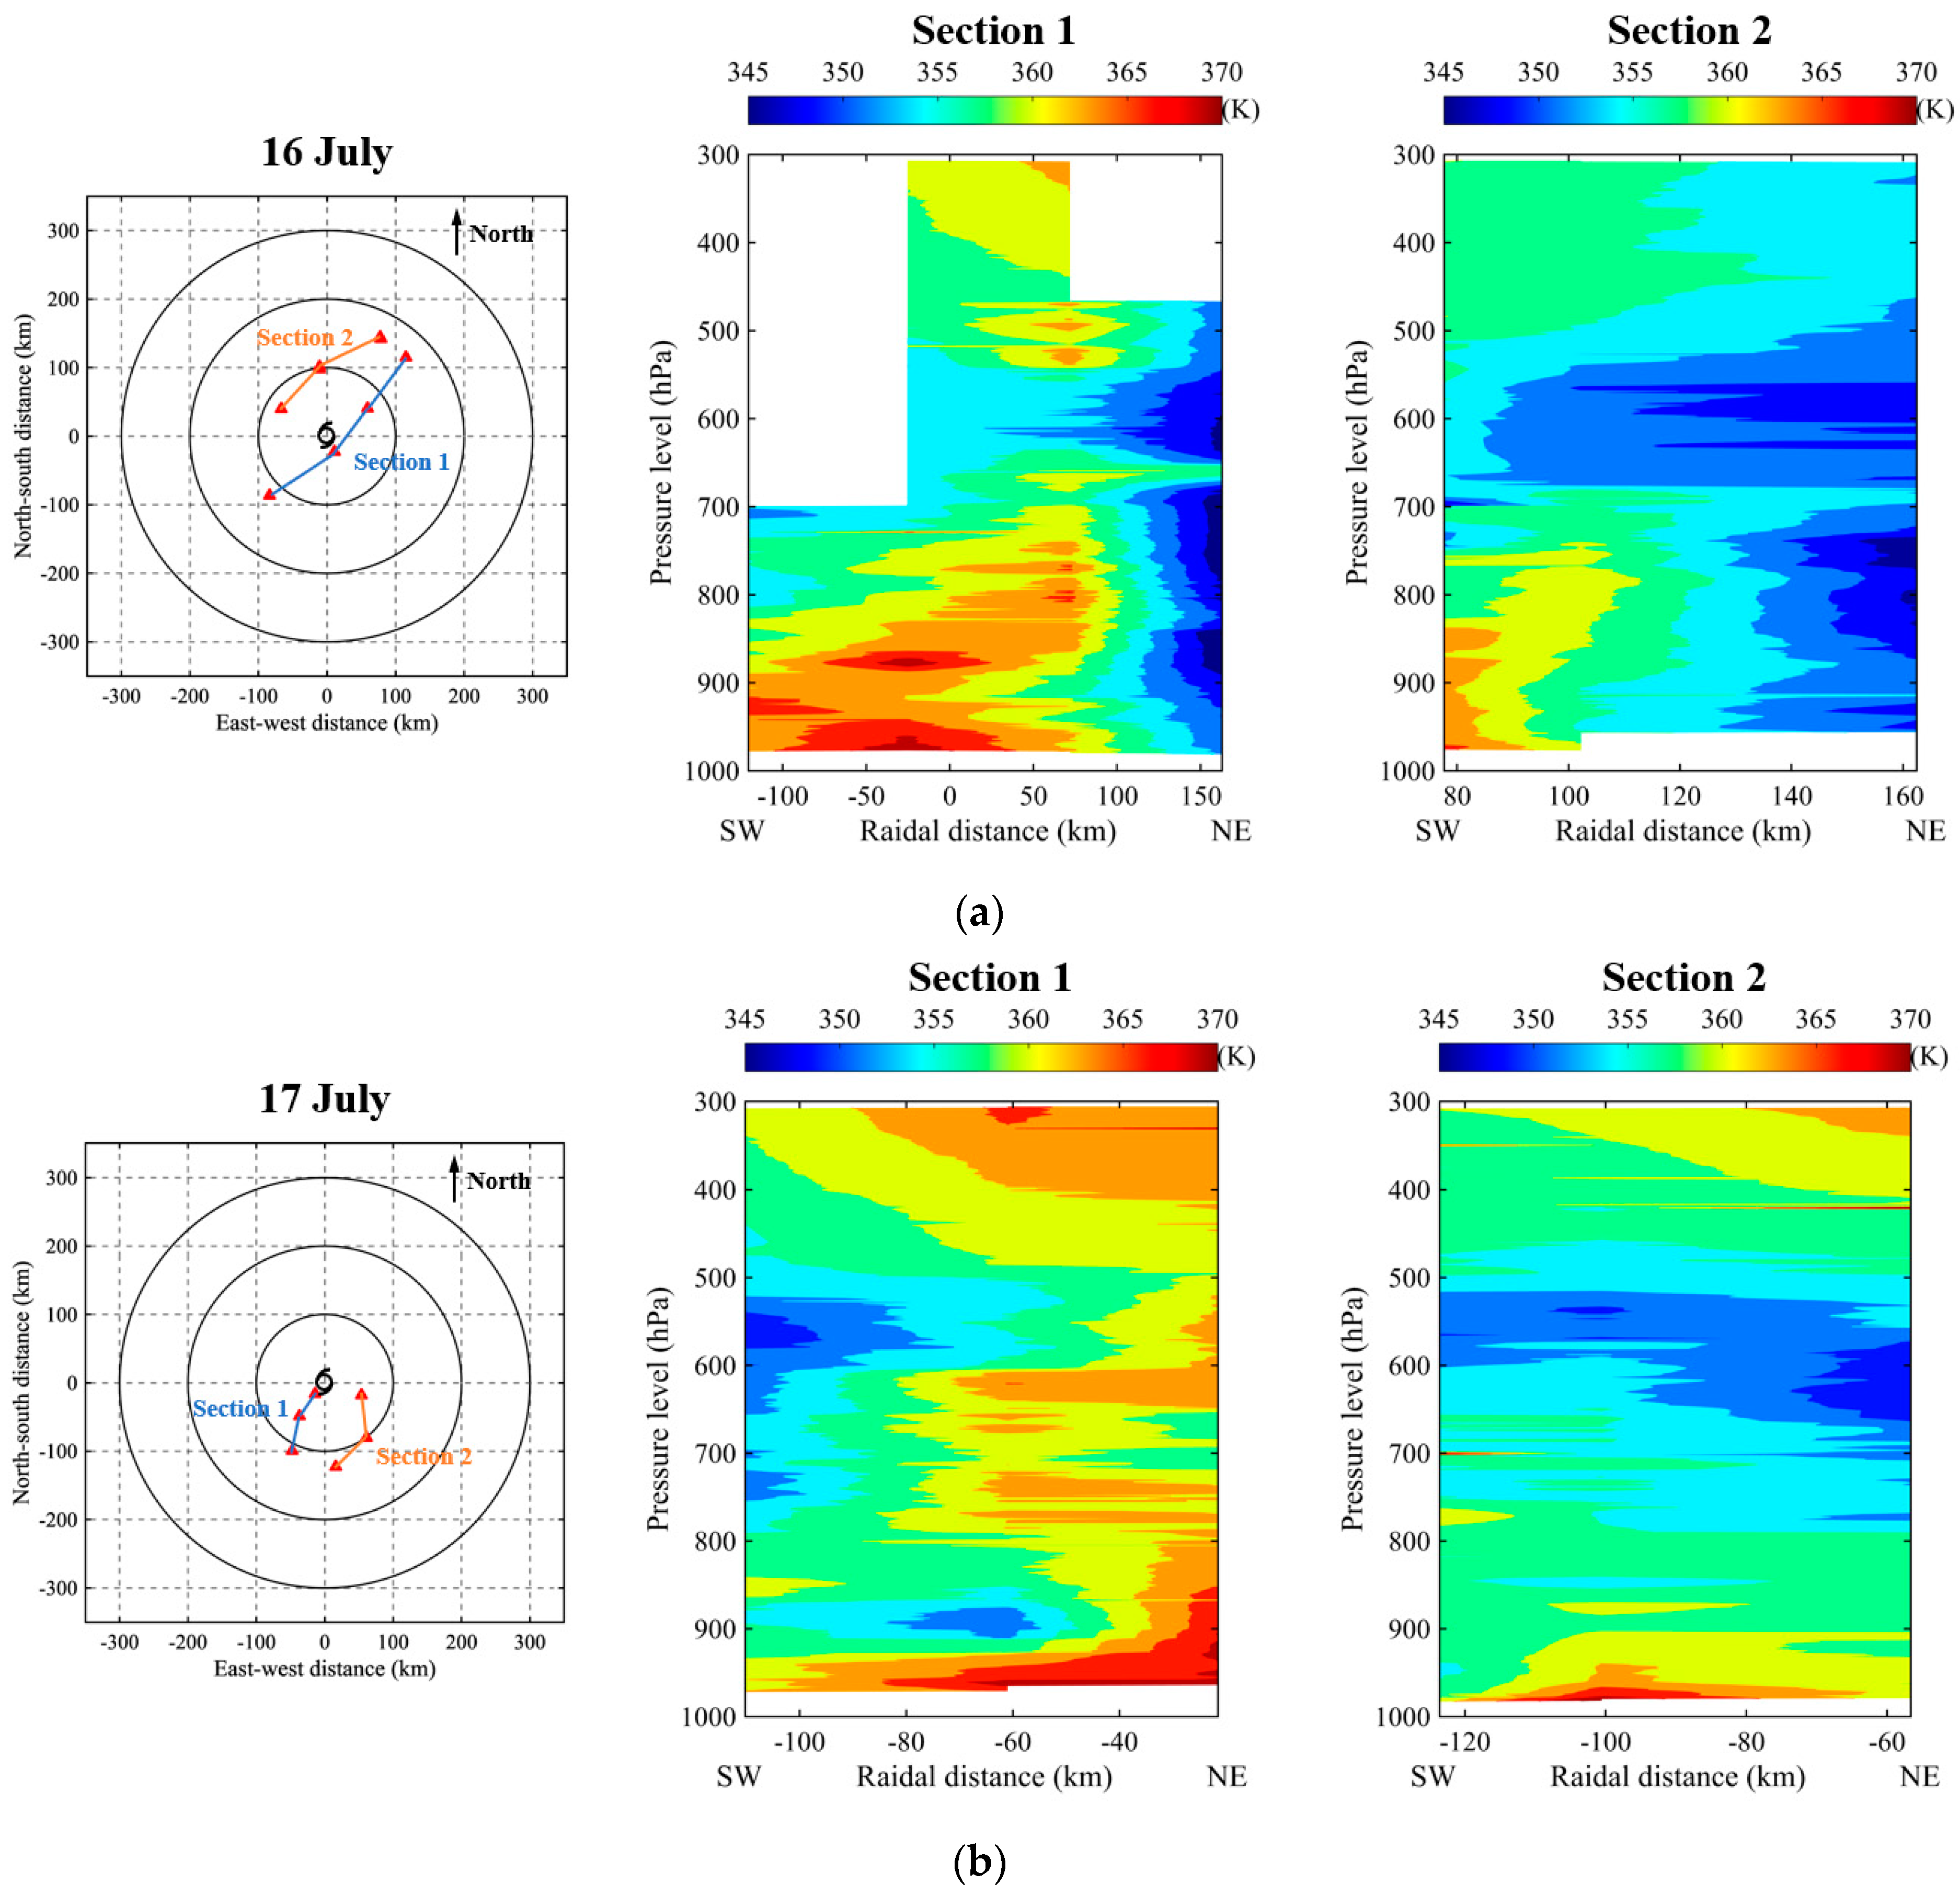
6. Dropsonde Data Analysis

As in He et al. [24], the dropsonde data have been analysed by considering the radial/tangential flow and the equivalent potential temperature profiles. Dropsondes were launched on two days, namely, the 16 and 17 July 2023. The results are summarised in Figure 10, Figure 11, Figure 12 and Figure 13.
For the radial flow, inflow is not apparent in the atmospheric boundary layer from the dropsonde launch of 16 July 2023 (Figure 10). On the following day, a limited number of dropsondes show inflow on the western and southern sides of Talim, which may be related to the prevalence of the southwest monsoon (Figure 11). In general, there is not much inflow within the atmospheric boundary layer that supports rapid intensification of Talim in the study period.
For the equivalent potential temperature profiles on the two days (Figure 12 and Figure 13), there is a slight sign of instability of the atmospheric boundary layer, but the equivalent potential temperature does not fall rapidly with height within the first 2 km or so above the sea surface. Again, this is consistent with the meteorological satellite observation that Talim was not intensifying rapidly during this period.
The vertical cross sections of equivalent potential temperatures are shown in Figure 14 for the two days. On the first day, below 700 hPa or so, there appears to be tilting of the cyclone centre with height, with the warm core structure not well-aligned vertically (Figure 14a). The vertical alignment appears slightly better on the following day (Figure 14b). Such observations will be compared with reanalysis data from numerical weather prediction models in the future.
The vertical wind profiles obtained from dropsondes have been fitted with the various laws in the literature and the results are shown in Figure 15. Consistent with the previous studies (e.g., He et al. [24]) of tropical cyclones in the region, the Vickery et al. [6] model appears to be the best in explaining the vertical variation of wind speed with height. This is because the Vickery et al. [6] model was developed based on dropsonde observations in hurricanes and is able to empirically describe the low-level jet feature in tropical cyclones using a boundary layer height scale parameter. On the other hand, the conventional models (e.g., log, power, D-H, and Gryning) were not developed for tropical cyclones and cannot reproduce the low-level jet feature. At a distance of around 60 km from the centre of Talim, the wind speed could reach 35 m/s, which is consistent with the surface observations mentioned earlier in this paper.

7. Preliminary Observations from Ocean Radar

The first set of HF ocean radar in Hong Kong installed in 2021 and operating at 5275 MHz at Cape D’Aguilar is paired up with another set at Shanwei operated by the South China Sea Bureau of the Ministry of Natural Resources of China. Though extracting information on winds and waves from much weaker or partial parts of the backscattered signals of the composite radar data that are easily corrupted by noise and interference presents much challenges [25,26,27], the derived second order measurements could sometimes provide very useful wind information and the trend of wind speed over the sea areas up to about 250 km southeast of Hong Kong. Figure 16 shows the wind speed observations from the ocean radar pair when Talim was edging closer to the south China coast on 16–17 July 2023. The observations revealed a relatively large vortex structure of Talim with a gale wind radius in the order of 250 km (deep red region in Figure 16) and a storm wind radius in the order of 180 km (purple region in the same figure) over the northern quadrant. Storm force winds affected outlying islands south of Hong Kong including Huangmaozhou on the morning of 17 July 2023 matched well with the extrapolation of the ocean radar wind speed field. It is evident that ocean radar observations would be useful for monitoring the development of tropical cyclones near shore and for the nowcasting of high winds and waves over coastal areas if the wind retrieval algorithm is well tuned and the signal-to-noise ratio is sufficiently high.

8. Conclusions

This paper provides a comprehensive document of the observations, both surface and upper air, of Typhoon Talim over the northern part of the South China Sea. It is confirmed from the various surface observations that Talim is indeed a typhoon. The ocean radar data are also found to provide an unprecedented view of the surface wind pattern associated with Talim.
The upper air measurements show that, in the marine tropical cyclone boundary layer below 1000 m or so above sea surface, the log law and the power law fit the wind speed profile very well. The applicability of the log law and power law to the offshore wind profiles was also reported in previous observational studies, e.g., Powell et al., [22]. However, for wind profiles at coastal and inland locations, the goodness-of-fit of the wind profiles to the log law and power law is relatively low, and some “kinks” can be seen in the profiles. This is probably caused by the inhomogeneous terrain, which leads to an internal boundary layer development. Another possible contributing factor is the topographic effects induced by nearby mountains.
A low-level jet is observed from the radar wind profiler observations. Notably, the height of the maximum wind speed, or the jet height, decreases as the wind speed increases. These characteristics can be explained by the boundary layer spin-up mechanism as described by Smith and Montgomery [15]. The low-level jet feature holds particular significance in wind engineering applications as it contradicts the assumption made in many wind and structural design codes. These codes typically assume that wind speed increases with height and then remains constant beyond a specified gradient height (e.g., ASCE [28]). Given the rise of supertall buildings, it becomes imperative to enhance wind codes by incorporating the updated understanding of tropical cyclone wind profiles, e.g., the low-level jet feature, since underestimating wind speeds can lead to unsafe design and building damage, while overestimating them may result in unnecessary overdesign and increased costs.
More and more weather buoys and offshore wind profilers would be deployed in the region. Case studies and statistical analysis should be conducted in the future for tropical cyclones over the northern part of the South China Sea. The upper air data, in particular, would be useful for wind engineering applications, especially for the design of future skyscrapers.

Author Contributions

Conceptualization, P.-W.C.; formal analysis, J.H.; writing–original draft preparation, P.-W.C., C.-W.C. and C.-C.L.; writing–review and editing, P.-W.C. and J.H.; data curation, C.-W.C., B.M., C.-C.L. and H.-Y.L.; supervision, Q.L. All authors have read and agreed to the published version of the manuscript.

Funding

The second author was funded by grants from the Science, Technology and Innovation Commission of Shenzhen Municipality (Project No: SGDX2020110309300301, JCYJ20220818101201003), the National Natural Science Foundation of China (Project No: 52278538), and the Research Grants Council of Hong Kong (Project No: CityU 11204020, CityU 11206922, CityU 11213523).

Data Availability Statement

The dropsonde data are available upon reasonable request to the Hong Kong Observatory.

Conflicts of Interest

The authors declare no conflict of interest.

References

  1. Song, L.; Chen, W.; Wang, B.; Zhi, S.; Liu, A. Characteristics of wind profiles in the landfalling typhoon boundary layer. J. Wind Eng. Ind. Aerodyn. 2016, 149, 77–88. [Google Scholar] [CrossRef]
  2. Li, L.; Xiao, Y.; Kareem, A.; Song, L.; Qin, P. Modeling typhoon wind power spectra near sea surface based on measurements in the South China sea. J. Wind Eng. Ind. Aerodyn. 2012, 104–106, 565–576. [Google Scholar] [CrossRef]
  3. Giammanco, I.M.; Schroeder, J.L.; Powell, M.D. GPS dropwindsonde and WSR-88D observations of tropical cyclone vertical wind profiles and their characteristics. Weather. Forecast. 2013, 28, 77–99. [Google Scholar] [CrossRef]
  4. Giammanco, I.M.; Schroeder, J.L.; Powell, M.D. Observed characteristics of tropical cyclone vertical wind profiles. Wind. Struct. Int. J. 2012, 15, 65–86. [Google Scholar] [CrossRef]
  5. Shu, Z.R.; Li, Q.S.; He, Y.C.; Chan, P.W. Vertical wind profiles for typhoon, monsoon and thunderstorm winds. J. Wind Eng. Ind. Aerodyn. 2017, 168, 190–199. [Google Scholar] [CrossRef]
  6. Vickery, P.J.; Wadhera, D.; Powell, M.D.; Chen, Y. A hurricane boundary layer and wind field model for use in engineering applications. J. Appl. Meteorol. Climatol. 2009, 48, 381–405. [Google Scholar] [CrossRef]
  7. Snaiki, R.; Wu, T. A linear height-resolving wind field model for tropical cyclone boundary layer. J. Wind Eng. Ind. Aerodyn. 2017, 171, 248–260. [Google Scholar] [CrossRef]
  8. Fang, G.; Pang, W.; Zhao, L.; Rawal, P.; Cao, S.; Ge, Y. Toward a refined estimation of typhoon wind hazards: Parametric modeling and upstream terrain effects. J. Wind Eng. Ind. Aerodyn. 2021, 209, 104460. [Google Scholar] [CrossRef]
  9. Fang, G.; Pang, W.; Zhao, L.; Xu, K.; Cao, S.; Ge, Y. Tropical-cyclone-wind-induced flutter failure analysis of long-span bridges. Eng. Fail. Anal. 2022, 132, 105933. [Google Scholar] [CrossRef]
  10. Hon, K.-k.; Chan, P.W. A decade (2011–2020) of tropical cyclone reconnaissance flights over the South China Sea. Weather 2022, 77, 308–314. [Google Scholar] [CrossRef]
  11. Weerasuriya, A.U.; Hu, Z.Z.; Zhang, X.L.; Tse, K.T.; Li, S.; Chan, P.W. New inflow boundary conditions for modeling twisted wind profiles in CFD simulation for evaluating the pedestrian-level wind field near an isolated building. Build. Environ. 2018, 132, 303–318. [Google Scholar] [CrossRef] [PubMed]
  12. Tse, K.T.; Li, S.W.; Chan, P.W.; Mok, H.Y.; Weerasuriya, A.U. Wind profile observations in tropical cyclone events using wind-profilers and doppler SODARs. J. Wind. Eng. Ind. Aerodyn. 2013, 115, 93–103. [Google Scholar] [CrossRef]
  13. Franklin, J.L.; Black, M.L.; Valde, K. GPS dropwindsonde wind profiles in hurricanes and their operational implications. Weather. Forecast. 2003, 18, 32–44. [Google Scholar] [CrossRef]
  14. He, Y.C.; Chan, P.W.; Li, Q.S. Observations of vertical wind profiles of tropical cyclones at coastal areas. J. Wind Eng. Ind. Aerodyn. 2016, 152, 1–14. [Google Scholar] [CrossRef]
  15. Smith, R.K.; Montgomery, M.T.; Van Sang, N. Tropical cyclone spin-up revisited. Q. J. R. Meteorol. Soc. 2009, 135, 1321–1335. [Google Scholar] [CrossRef]
  16. Montgomery, M.T.; Smith, R.K. Recent developments in the fluid dynamics of tropical cyclones. Annu. Rev. Fluid Mech. 2017, 49, 541–574. [Google Scholar] [CrossRef]
  17. Kepert, J.D. Observed boundary layer wind structure and balance in the Hurricane Core. Part I: Hurricane Georges. J. Atmos. Sci. 2006, 63, 2169–2193. [Google Scholar] [CrossRef]
  18. Kepert, J.D. Observed boundary layer wind structure and balance in the hurricane core. Part II: Hurricane Mitch. J. Atmos. Sci. 2006, 63, 2194–2211. [Google Scholar] [CrossRef]
  19. Zhang, J.A.; Marks, F.D. Effects of Horizontal Diffusion on Tropical Cyclone Intensity Change and Structure in Idealized Three-Dimensional Numerical Simulations. Mon. Weather. Rev. 2015, 143, 3981–3995. [Google Scholar] [CrossRef]
  20. He, J.Y.; Chan, P.W.; Li, Q.S.; Li, L.; Zhang, L.; Yang, H.L. Observations of wind and turbulence structures of Super Typhoons Hato and Mangkhut over land from a 356 m high meteorological tower. Atmos. Res. 2022, 265, 105910. [Google Scholar] [CrossRef]
  21. Shu, Z.R.; Li, Q.S.; He, Y.C.; Chan, P.W. Observational study of veering wind by Doppler wind profiler and surface weather station. J. Wind Eng. Ind. Aerodyn. 2018, 178, 18–25. [Google Scholar] [CrossRef]
  22. Powell, M.D.; Vickery, P.J.; Reinhold, T.A. Reduced drag coefficient for high wind speeds in tropical cyclones. Nature 2003, 402, 279–283. [Google Scholar] [CrossRef] [PubMed]
  23. He, J.Y.; Li, Q.S.; Chan, P.W. Reduced gust factor for extreme tropical cyclone winds over ocean. J. Wind. Eng. Ind. Aerodyn. 2021, 208, 104445. [Google Scholar] [CrossRef]
  24. He, J.Y.; Hon, K.K.; Chan, P.W.; Li, Q.S. Dropsonde observations and numerical simulations for intensifying and weakening tropical cyclones over the northern part of the South China Sea. Weather 2022, 77, 332–338. [Google Scholar] [CrossRef]
  25. Barrick, D.E.; Evans, M.W.; Weber, B.L. Ocean surface currents mapped by radar. Science 1977, 198, 138–144. [Google Scholar] [CrossRef]
  26. Wyatt, L.R.; Green, J.J.; Middleditch, A.; Moorhead, M.D.; Howarth, J.; Holt, M.; Keogh, S. Operational wave, current and wind measurements with the pisces HFR. J. Ocean Eng. 2006, 31, 819–834. [Google Scholar] [CrossRef]
  27. Mantovani, C.; Corgnati, L.; Horstmann, J.; Rubio, A.; Reyes, E.; Quentin, C.; Cosoli, S.; Asensio, J.L.; Mader, J.; Griffa, A. Best practices on high frequency radar deployment and operation for ocean current measurement. Front. Mar. Sci. 2020, 7, 210. [Google Scholar] [CrossRef]
  28. ASCE. Minimum Design Loads and Associated Criteria for Buildings and Other Structures; ASCE/SEI 7-22; ASCE: Reston, VA, USA, 2022. [Google Scholar]
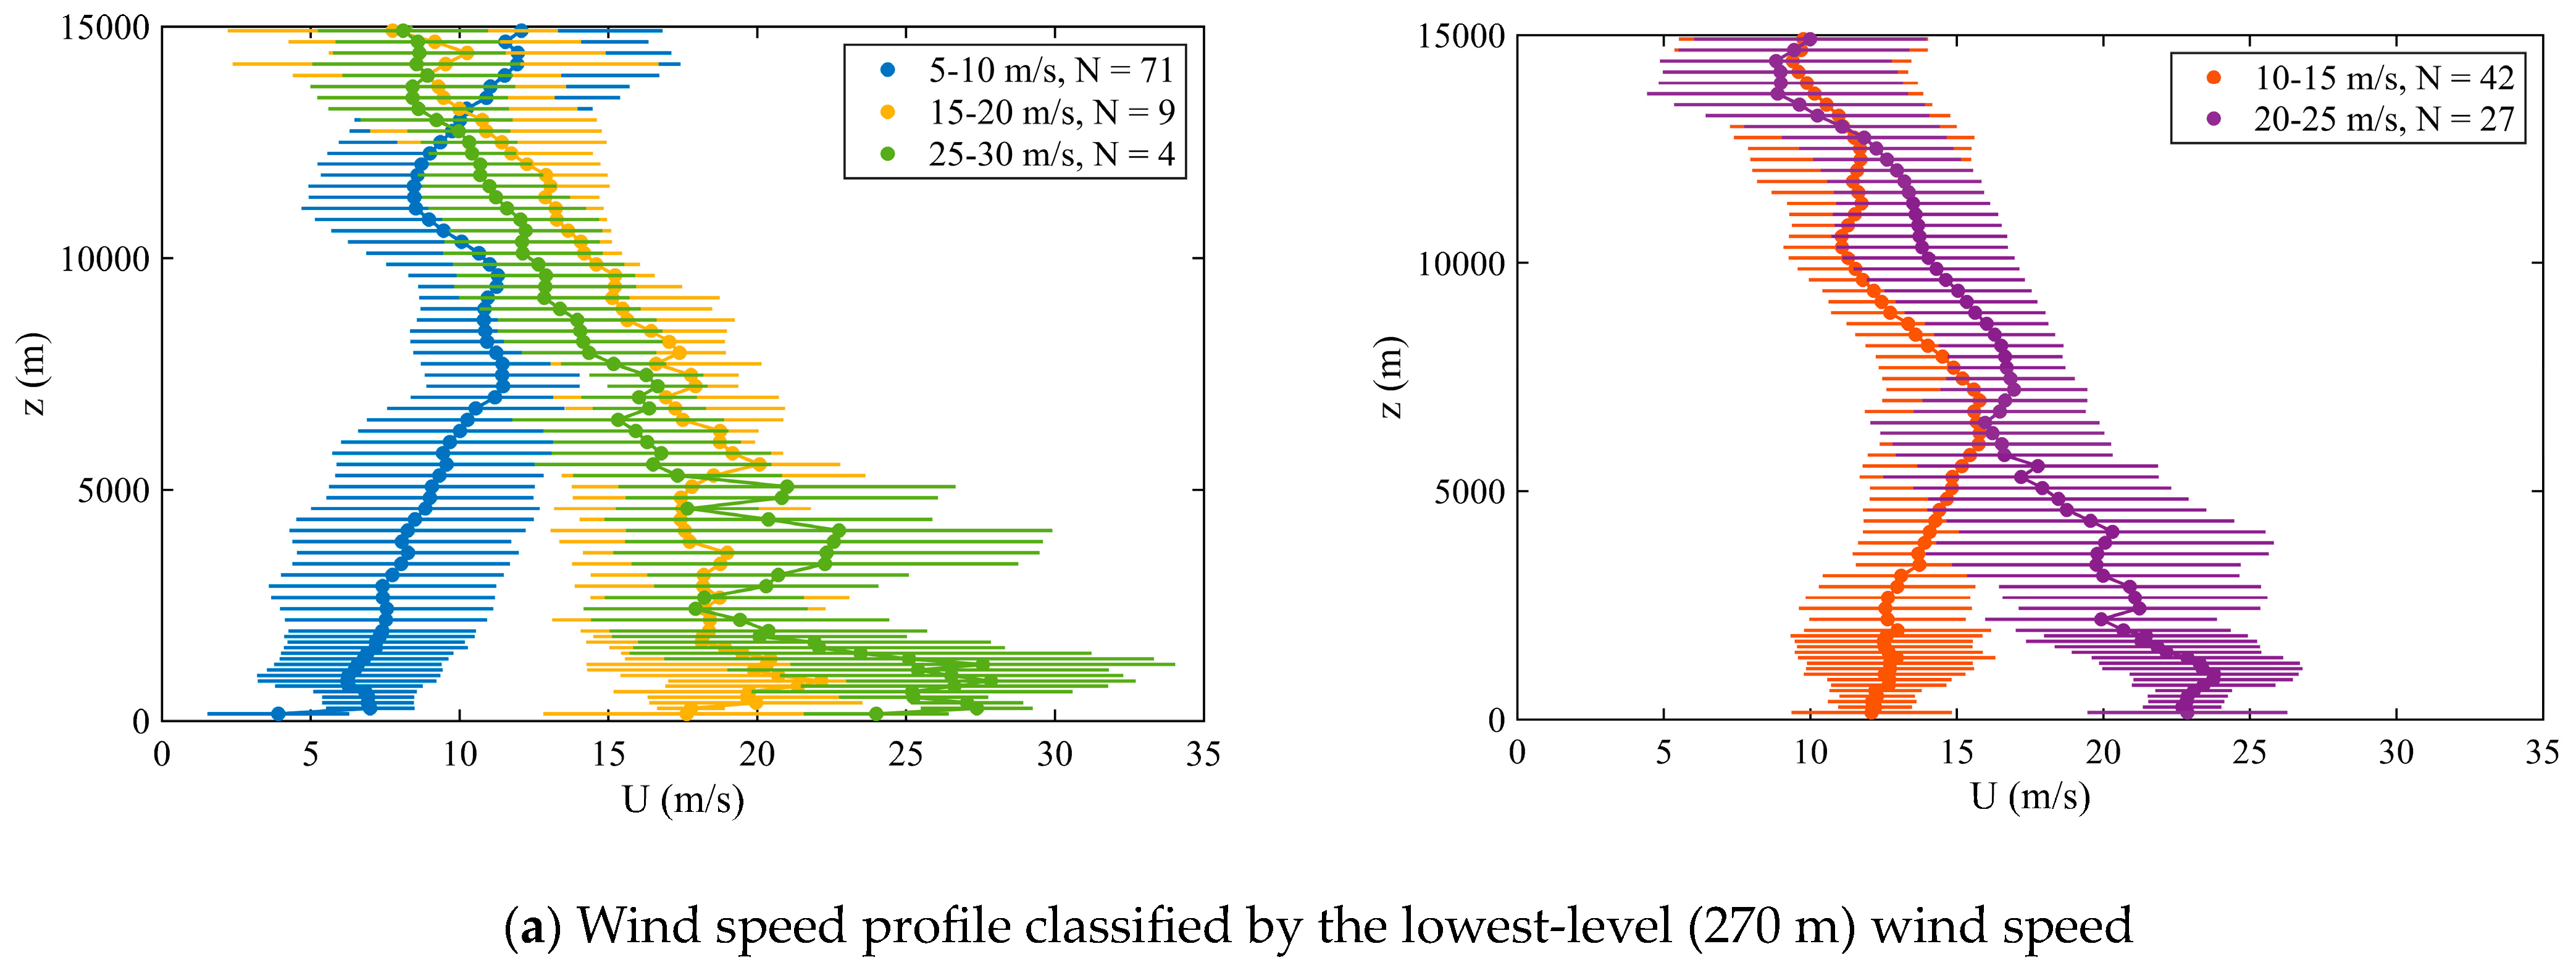
Figure 1. Provisional best track of Talim in July 2023.
Atmosphere 14 01340 g001
Figure 2. Surface observations at 0440 UTC 17 July 2023. The location of Talim is indicated by a red star symbol.
Atmosphere 14 01340 g002
Figure 3. (a) The 925 hPa winds from the wind profilers at 1000 UTC 17 July 2023, with the location of the wind profilers of stations 59,268, 59,431 Nanning, 59,462 Luoding, and 59,758 Haikou are highlighted in blue circles. The location of wind profiler at station 59,754 Xuwen at 20.24° N, 110.16° E and an offshore platform at 19.65° N, 112.11° E over the south China coastal waters are indicated by a red dot and a green dot, respectively; and (b) time series of radar wind profiler observations at station 59,754 (Xuwen) from 0630 UTC to 1830 UTC 17 July 2023. Yellow wind barbs indicate hurricane force winds (≥64 knots).
Atmosphere 14 01340 g003
Figure 4. Vertical wind profiles at Xuwen stratified by (a) the lowest-level (270 m) wind speed; and (b) distance from the centre of Talim during 0000 UTC 17 July 2023–0100 UTC 18 July 2023. Dot: mean; Error bar: standard deviation; N: number of samples; Eyewall: distance between the wind profiler and storm centre = 100–150 km, 0900–1800 UTC 17 July 2023; Outer circulation: distance between the wind profiler and storm centre = 150–300 km, 0000–0900 UTC 17 July 2023 and 1800 UTC 17 July 2023–0100 UTC 18 July 2023.
Atmosphere 14 01340 g004aAtmosphere 14 01340 g004b
Figure 5. Wind speed profiles below 1000 m fitted with log law and power law based on different stratifications of wind speeds at Xuwen. (a) 5–10, 15–20, and 25–30 m/s; (b) 10–15, and 20–35 m/s.
Atmosphere 14 01340 g005
Figure 6. Similar to Figure 4a, but at (a) station 59268 and (b) station 59431 Nanning.
Atmosphere 14 01340 g006
Figure 7. Similar to Figure 5, but at (a) station 59268 and (b) station 59462 Luoding.
Atmosphere 14 01340 g007
Figure 8. Similar to Figure 4a, but at station 59268, station 59431 Nanning, station 59462 Luoding, and station 59758 Haikou.
Atmosphere 14 01340 g008
Figure 9. Similar to Figure 5 but over an offshore platform at 19.65° N, 112.11° E over the south China coastal waters. α: power law exponent; z0: roughness length. Only wind profile samples with the lowest-level (250 m) wind speed larger than 5 m/s during the typhoon passage are included.
Atmosphere 14 01340 g009
Figure 10. Vertical profiles of tangential (red) and radial (blue) wind speeds of Typhoon Talim at 0700UTC 16 July 2023. Tangential wind speed: anticlockwise positive; radial wind speed: outflow positive. Red triangles represent dropsonde locations relative to the storm centre.
Atmosphere 14 01340 g010
Figure 11. Vertical profiles of tangential (red) and radial (blue) wind speeds of Typhoon Talim at 0200UTC 17 July 2023. Tangential wind speed: anticlockwise positive; radial wind speed: outflow positive. Red triangles represent dropsonde locations relative to the storm centre.
Atmosphere 14 01340 g011
Figure 12. Vertical profiles of potential temperature (red) and equivalent potential temperature (blue) of Typhoon Talim at 0700UTC 16 July 2023. Red triangles represent dropsonde locations relative to the storm centre.
Atmosphere 14 01340 g012
Figure 13. Vertical profiles of potential temperature (red) and equivalent potential temperature (blue) of Typhoon Talim at 0200UTC 17 July 2023. Red triangles represent dropsonde locations relative to the storm centre.
Atmosphere 14 01340 g013
Figure 14. Vertical cross sections of equivalent potential temperatures of Typhoon Talim on (a) 16 July and (b) 17 July 2023.
Atmosphere 14 01340 g014
Figure 15. Fitting of selected vertical profiles of wind speeds in the lowest 1000 m near the eyewall of Typhoon Talim (a) at 0700UTC 16 July 2023 and (b) at 0200UTC 17 July 2023 to the wind profile models, including the logarithmic law, Vickery et al. (2009) model, Gryning et al. (2007) model, Deaves and Harris (1978) model, and power law. d represents the distance to the storm centre.
Atmosphere 14 01340 g015
Figure 16. Wind speed observations from the ocean radar pair of Hong Kong and Shanwei. The tropical cyclone symbol marks the position of Talim as determined from surface observations and satellite fixes. (a) 1100 UTC, (b) 1500 UTC, (c) 1730 UTC, and (d) 2100 UTC, 16 July 2023.
Atmosphere 14 01340 g016
Table 1. Variation of fitted z0 and α with the lowest-level (250 m) wind speed.
Wind Speed (m/s)z0 (m)α
5–100.0130.093
10–151.1 × 10−50.056
15–200.0460.108
20–250.0100.092
>259.3 × 10−80.044
Disclaimer/Publisher’s Note: The statements, opinions and data contained in all publications are solely those of the individual author(s) and contributor(s) and not of MDPI and/or the editor(s). MDPI and/or the editor(s) disclaim responsibility for any injury to people or property resulting from any ideas, methods, instructions or products referred to in the content.

