Article

A Two-Stage Hybrid Model for Determining the Scopes and Priorities of Joint Air Pollution Control

Business School, University of Shanghai for Science and Technology, Shanghai 200093, China
*
Author to whom correspondence should be addressed.
Atmosphere 2023, 14(5), 891; https://doi.org/10.3390/atmos14050891
Submission received: 11 April 2023 / Revised: 11 May 2023 / Accepted: 18 May 2023 / Published: 19 May 2023

Abstract

:
Due to the spillover nature of air pollution, the territorial separate governance mode is ineffective in combating pollution, making Joint Prevention and Control of Air Pollution (JPCAP) among multiple regions the only viable option. However, determining the appropriate scopes and priorities for JPCAP is known to be a challenging and significant issue. To address this, we propose a new two-stage hybrid model. In the first stage, making use of long-term, wide area monitoring data provided by the air pollution monitoring network, we propose a new method for subdividing large regions into sub-regions by using data mining techniques. In the second stage, we propose a comprehensive decision-making framework to evaluate the priorities of JPCAP sub-regions from three different perspectives, namely, the impact of a sub-region on the pollution level of the entire target region, as well as the urgency and elasticity of sub-regional air pollution control. A case study is conducted on 27 cities of the Yangtze River Delta region of China. The case study demonstrates the validity and practicality of the proposed two-stage hybrid model. This work provides a viable tool for the effective implementation of air pollution control in China and other regions of the world.

1. Introduction

With China’s rapid urbanization, air pollution dominated by PM 2.5 (the smallest category of particles, with an aerodynamic equivalent diameter of 2.5 μ m or less) has emerged as a persistent problem in recent years that urgently requires a solution [1]. Since 2015, the number of days with PM 2.5 as the main pollutant has accounted for 66.8% of the total pollution days in China [2]. PM 2.5 poses a serious risk to human health [3,4], and long-term exposure may cause respiratory and cardiovascular diseases [5]. PM 2.5 -related deaths in China have increased by approximately 23% in the last 15 years [6]. Although China’s current air quality has improved significantly, the concentration of PM 2.5 in residents’ living environment remains over 6 times higher than the standard set by the World Health Organization [7,8]. The Chinese government has considered air pollution to be a high priority political issue [9]. Accordingly, the control of PM 2.5 pollution has received extensive research attention.
The atmosphere is a very complicated system. As a pollutant, PM 2.5 is susceptible to transboundary transport via atmospheric circulation, resulting in regional air pollution [10,11,12]. Hence, the air quality in one city could be highly influenced by neighboring cities [13]. McDuffie et al. investigated the formation and development of air pollution [14]. Greenstone et al. focused on transboundary pollution dispersion and interaction to investigate the migration and spillover effects of atmospheric pollutants [15]. Crippa et al. studied the spatial and temporal variability of regional air pollution in China [16]. These studies have indicated that PM 2.5 in Chinese cities is significantly influenced by regional transboundary transport. The regional characteristics of atmospheric pollution have triggered many scholars to draw attention to joint pollution control [17,18,19]. Tomson et al. investigated the air pollution control of individual cities at the microscopic level [20]. Zou et al. discussed the joint control of regional air pollution from a macroscopic perspective [21]. Song et al. analyzed the barriers existing in regional air pollution joint control and their effects [22]. Zhou et al. investigated the cost-effectiveness of regional air pollution joint control [23]. These studies have shown that joint air pollution control in specific regions is more effective and efficient than implementing a single pollution control plan in each city.
Furthermore, numerous practical applications have shown that implementing Joint Prevention and Control of Air Pollution (JPCAP) could effectively alleviate regional air pollution problems [18,24,25]. To strengthen the joint governance of air pollution, China has formulated and implemented a series of relevant policies. China designated 13 key joint governance regions for the air pollution control based on the level of economic development and the severity of air pollution in 2012 [26]. To ensure good air quality in Beijing during the Asia-Pacific Economic Cooperation (APEC) period, Beijing and five neighboring provinces implemented a stringent JPCAP. The joint policy produced excellent results, giving rise to the “APEC Blue” phenomenon [27]. To improve the ambient air quality in the Beijing-Tianjin-Hebei region and surrounding areas, Chinese government formulated a joint control policy involving 28 cities (including 2 municipalities and 26 prefecture-level cities, referred to as the policy of the “2 + 26” cities) in 2017 [28]. However, China’s current regional environmental governance cooperation disregards the spatial and temporal heterogeneity of air pollution [29,30]. The majority of joint control regions heavily overlap the scope of urban economic zones, resulting in an overly broad scope of joint control regions and difficult coordination. Furthermore, there are currently few studies investigating JPCAP from the perspective of refined localized joint pollution control and differentiated governance for an urban economic zone.
Since joint air pollution control is more effective and efficient than implementing a single pollution control plan in individual cities [31,32,33], the scientific formulation for JPCAP is a reliable path to improving both local and global air quality levels [34]. There are currently few long-term JPCAP practices in China, and the key JPCAP elements (such as the scopes and priorities of joint control regions) require further clarification [6,35]. There are two major families of methods for determining the region scopes of JPCAP, one based on economic and social development status and the other on Air Basin theory [36,37]. The former’s application in China includes the joint control regions of Beijing-Tianjin-Hebei, Yangtze River Delta (YRD), and Pearl River Delta [38]. The latter application practices include the Southern California Coastal Air Pollution Control Zone in the United States and the Acid Rain Control Zone and Sulfur Dioxide Pollution Control Zone in China [19]. However, both of two family methods have flaws. The former disregards the impact of a number of factors on regional division, such as local terrain, climate, pollutant transmission, and pollutant composition. The latter fails to account for administrative division, which will impede future coordination of joint control regions.
Regional air quality is the result of a combination of multiple factors such as regional geographical conditions, meteorological conditions, economic development status, population distribution, industrial structure, and pollution emissions [10,39,40]. On the one hand, the level of pollution transmission between cities is heavily influenced by geographical and meteorological conditions [10,12]. On the other hand, the pollution emission characteristics of each city are significantly influenced by its economic development status, population distribution, industrial structure, and pollution emission [40]. Many studies have shown that the focus and difficulty of regional air pollution control lies in reducing and weakening the degree of interaction between sub-regions of the target region [12,41]. Therefore, cities with high pollution transmission and similar emission characteristics should be clustered together for joint pollution control [42]. Given that long-term pollutant monitoring data is in fact the result of a combination of geographical, meteorological, economic, and social factors, cities with the most correlated pollutant monitoring data should be divided into the same JPCAP sub-region. In this paper, we will explore a novel idea of determining the scopes of JPCAP sub-regions by analyzing and mining long-term pollutant monitoring data.
To further enhance air pollution control in China, it is imperative to implement more refined localized joint control and differentiated governance within urban economic zones that are densely populated and highly industrialized. This study proposes a novel two-stage hybrid model to address the challenges of determining the scopes and priorities of JPCAP sub-regions. Based on air pollutant monitoring data sequences from January 2016 to December 2021 (72-month study period), the cities in the target region are first classified using the hierarchical cluster analysis. The issue of determining the optimal cluster partition is a significant and challenging one, and this work employs the silhouette coefficient to evaluate the quality of each cluster partition. As the quality of cluster partitions improve, the silhouette coefficients increase. Therefore, the optimal cluster partition can be identified by means of the silhouette coefficient. A multi-criteria decision-making framework is proposed to determine the sub-regional governance priority for JPCAP by defining three indicators: health damage caused by sub-regional air pollution, the impact of sub-regional pollution on the entire region, and the elasticity in sub-regional air pollution control. Next, we propose a weighted ViseKriterijumska Optimizacija I Kompromisno Resenje (VIKOR) method to support the decision-making process. Its advantage lies in that it considers not only the maximization of group utility (namely, total score across all indicators) and minimization of individual regret (namely, the lowest score of all indicators), but also the weighting of evaluation indicators, making the decision more rational.
The primary contributions of this study are as follows.
  • We define an indicator system to evaluate the priority of JPCAP sub-regions for air pollution control, including the impact of a sub-region on the pollution level of the entire region, as well as the urgency and elasticity of sub-regional air pollution control.
  • We propose a new two-stage hybrid model based on the data mining techniques and multi-attribute decision making method for determining the appropriate scopes and priorities of JPCAP sub-regions.
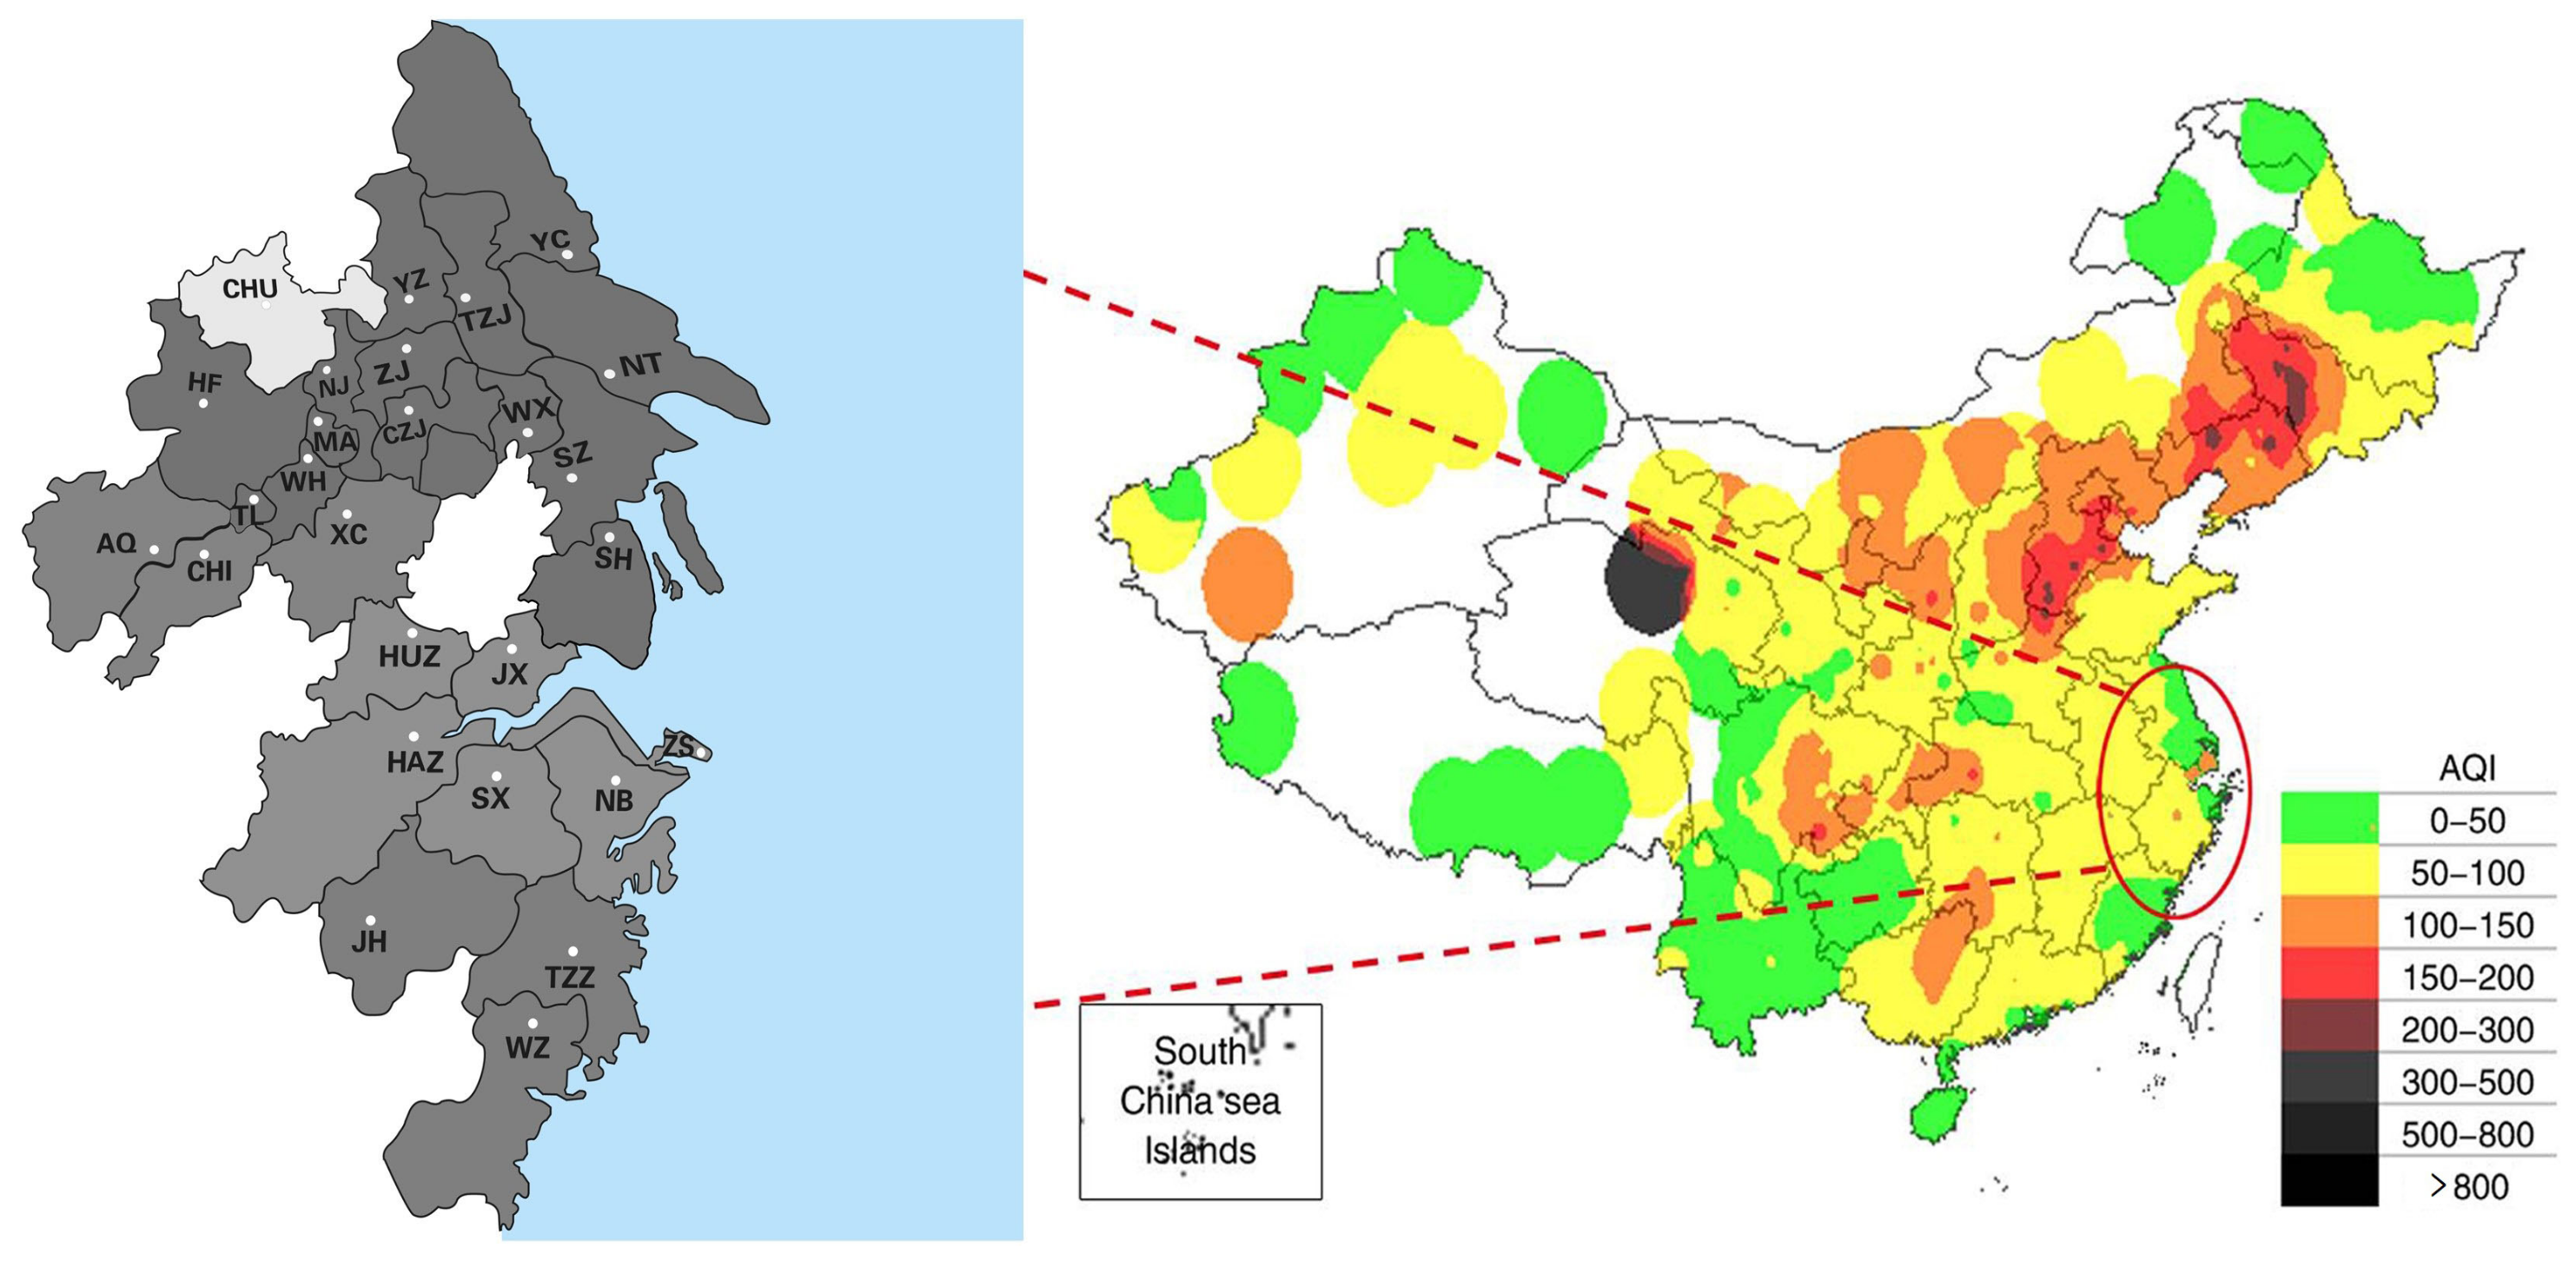
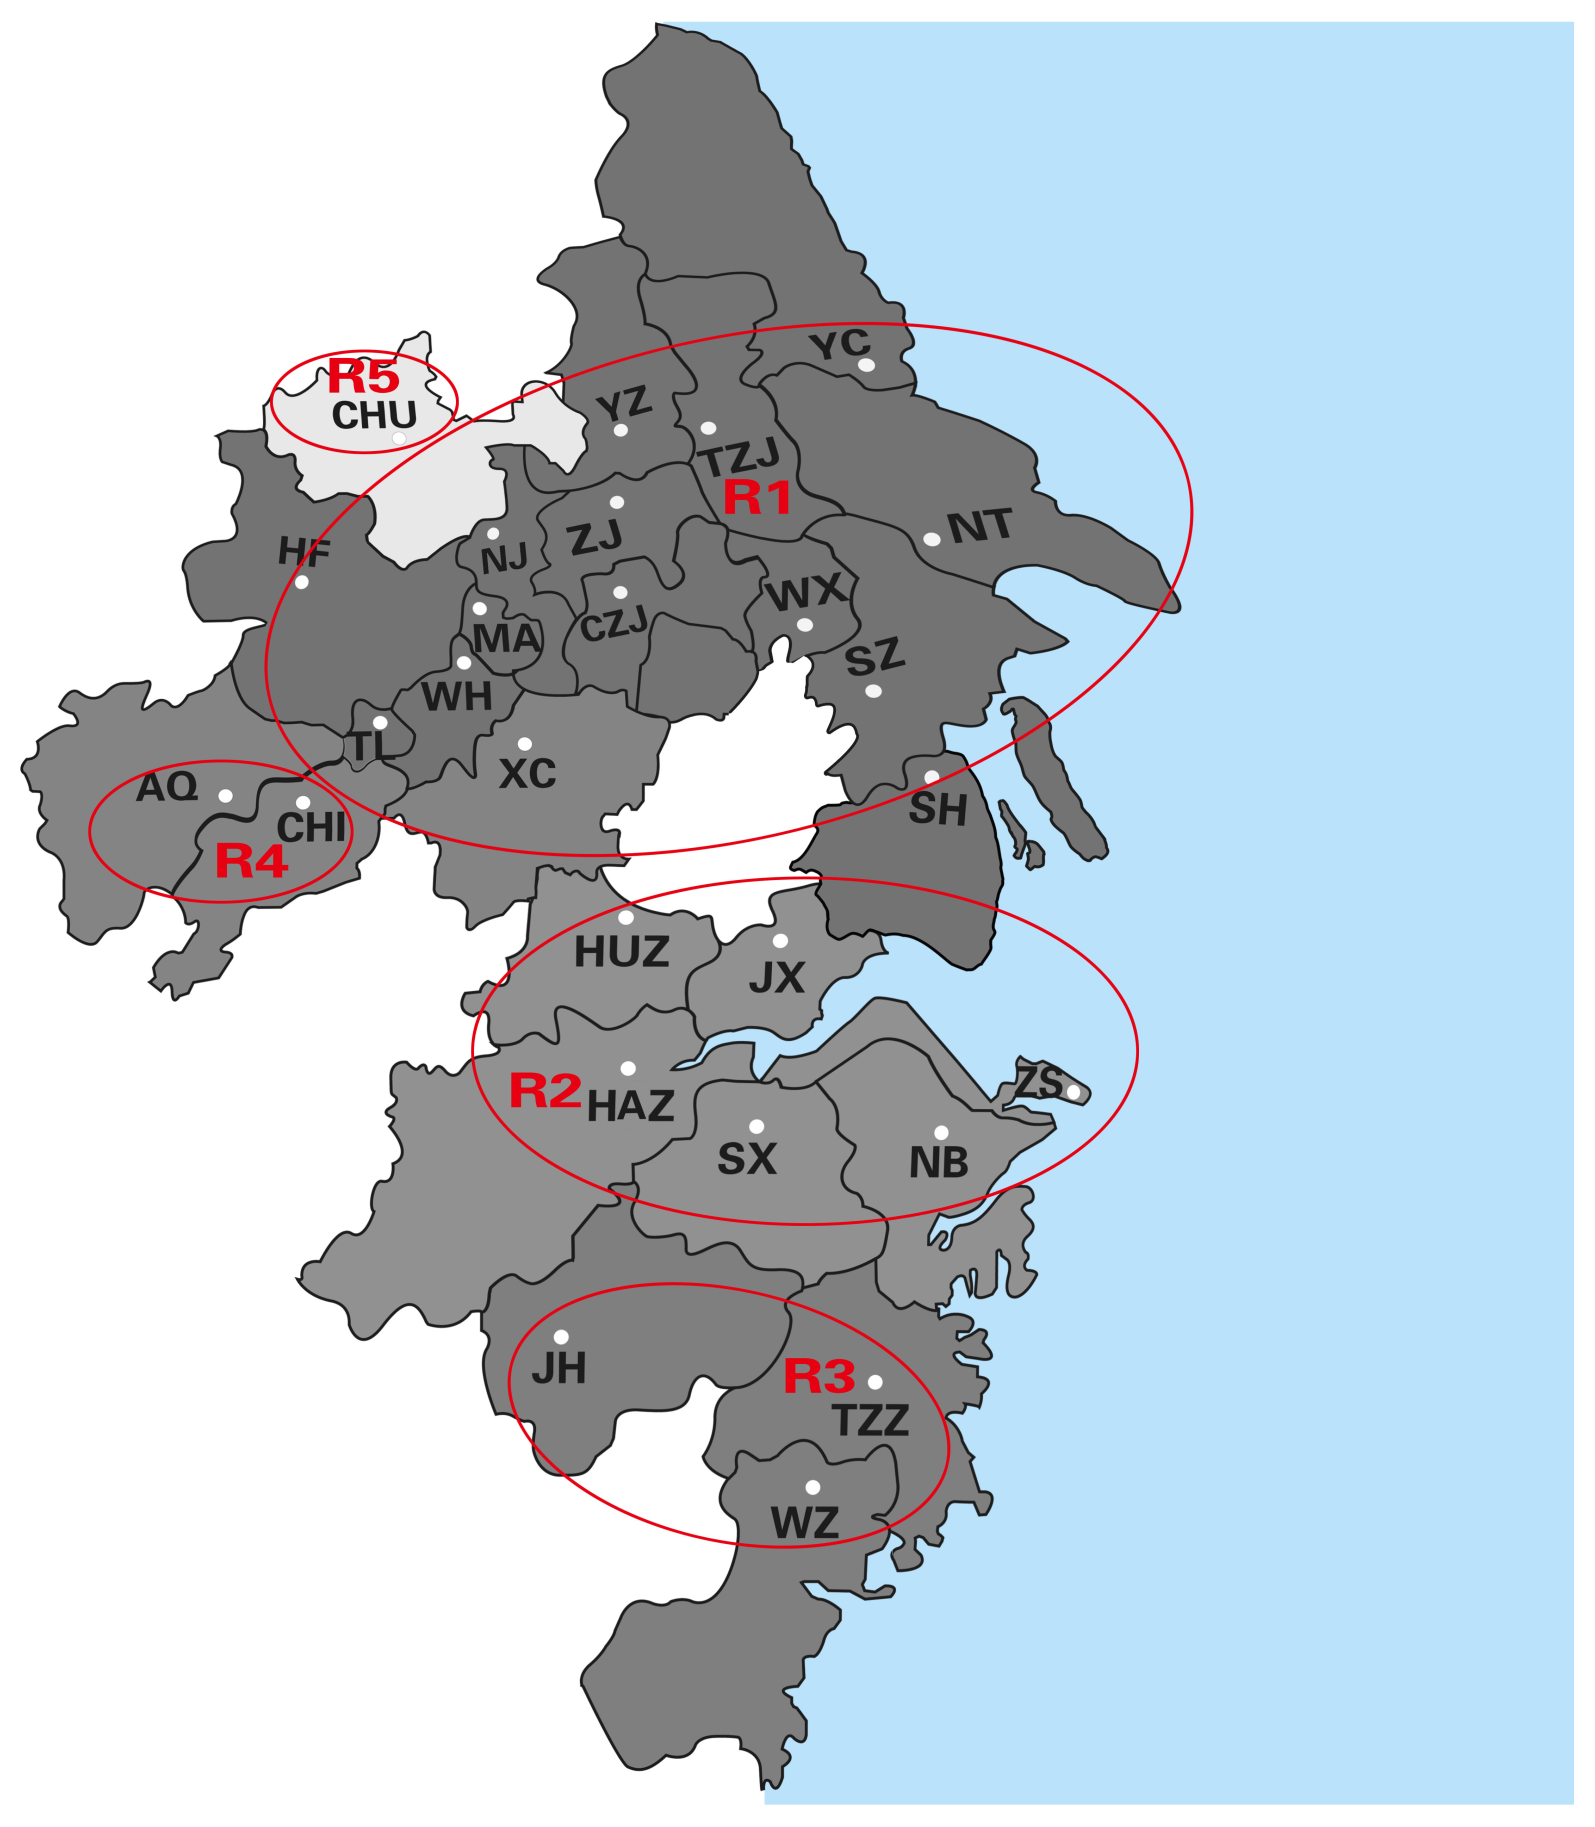
  • This work conducts a case study with 27 cities in the YRD region. The experimental results demonstrate that the proposed model is scientific and reasonable.
The remainder of this paper is organized as follows. Section 2 describes the proposed two-stage hybrid model in detail. In Section 3, we apply the proposed model to a case study region, and analyze the results further. Finally, the conclusion and policy implication is presented in Section 4.

2. Methods

As previously stated, the implementation and optimization of JPCAP for a specific region is critical for controlling air pollution. In this paper, we propose a new two-stage hybrid model for determining the scopes and priorities of JPCAP sub-regions, laying the groundwork for effective regional joint air pollution control. In particular, in the first stage, we propose a method for determining the scope of the joint action based on regional long-term pollution monitoring data. In the second stage, we first identify the key elements of regional joint air pollution control and define an evaluation indicator system for joint action priorities. Then we propose a method for prioritizing JPCAP sub-regions based on the multi-attribute comprehensive evaluation theory. Figure 1 depicts the process of the proposed two-stage hybrid model for determining the scopes and priorities of air pollution control, which is detailed below.

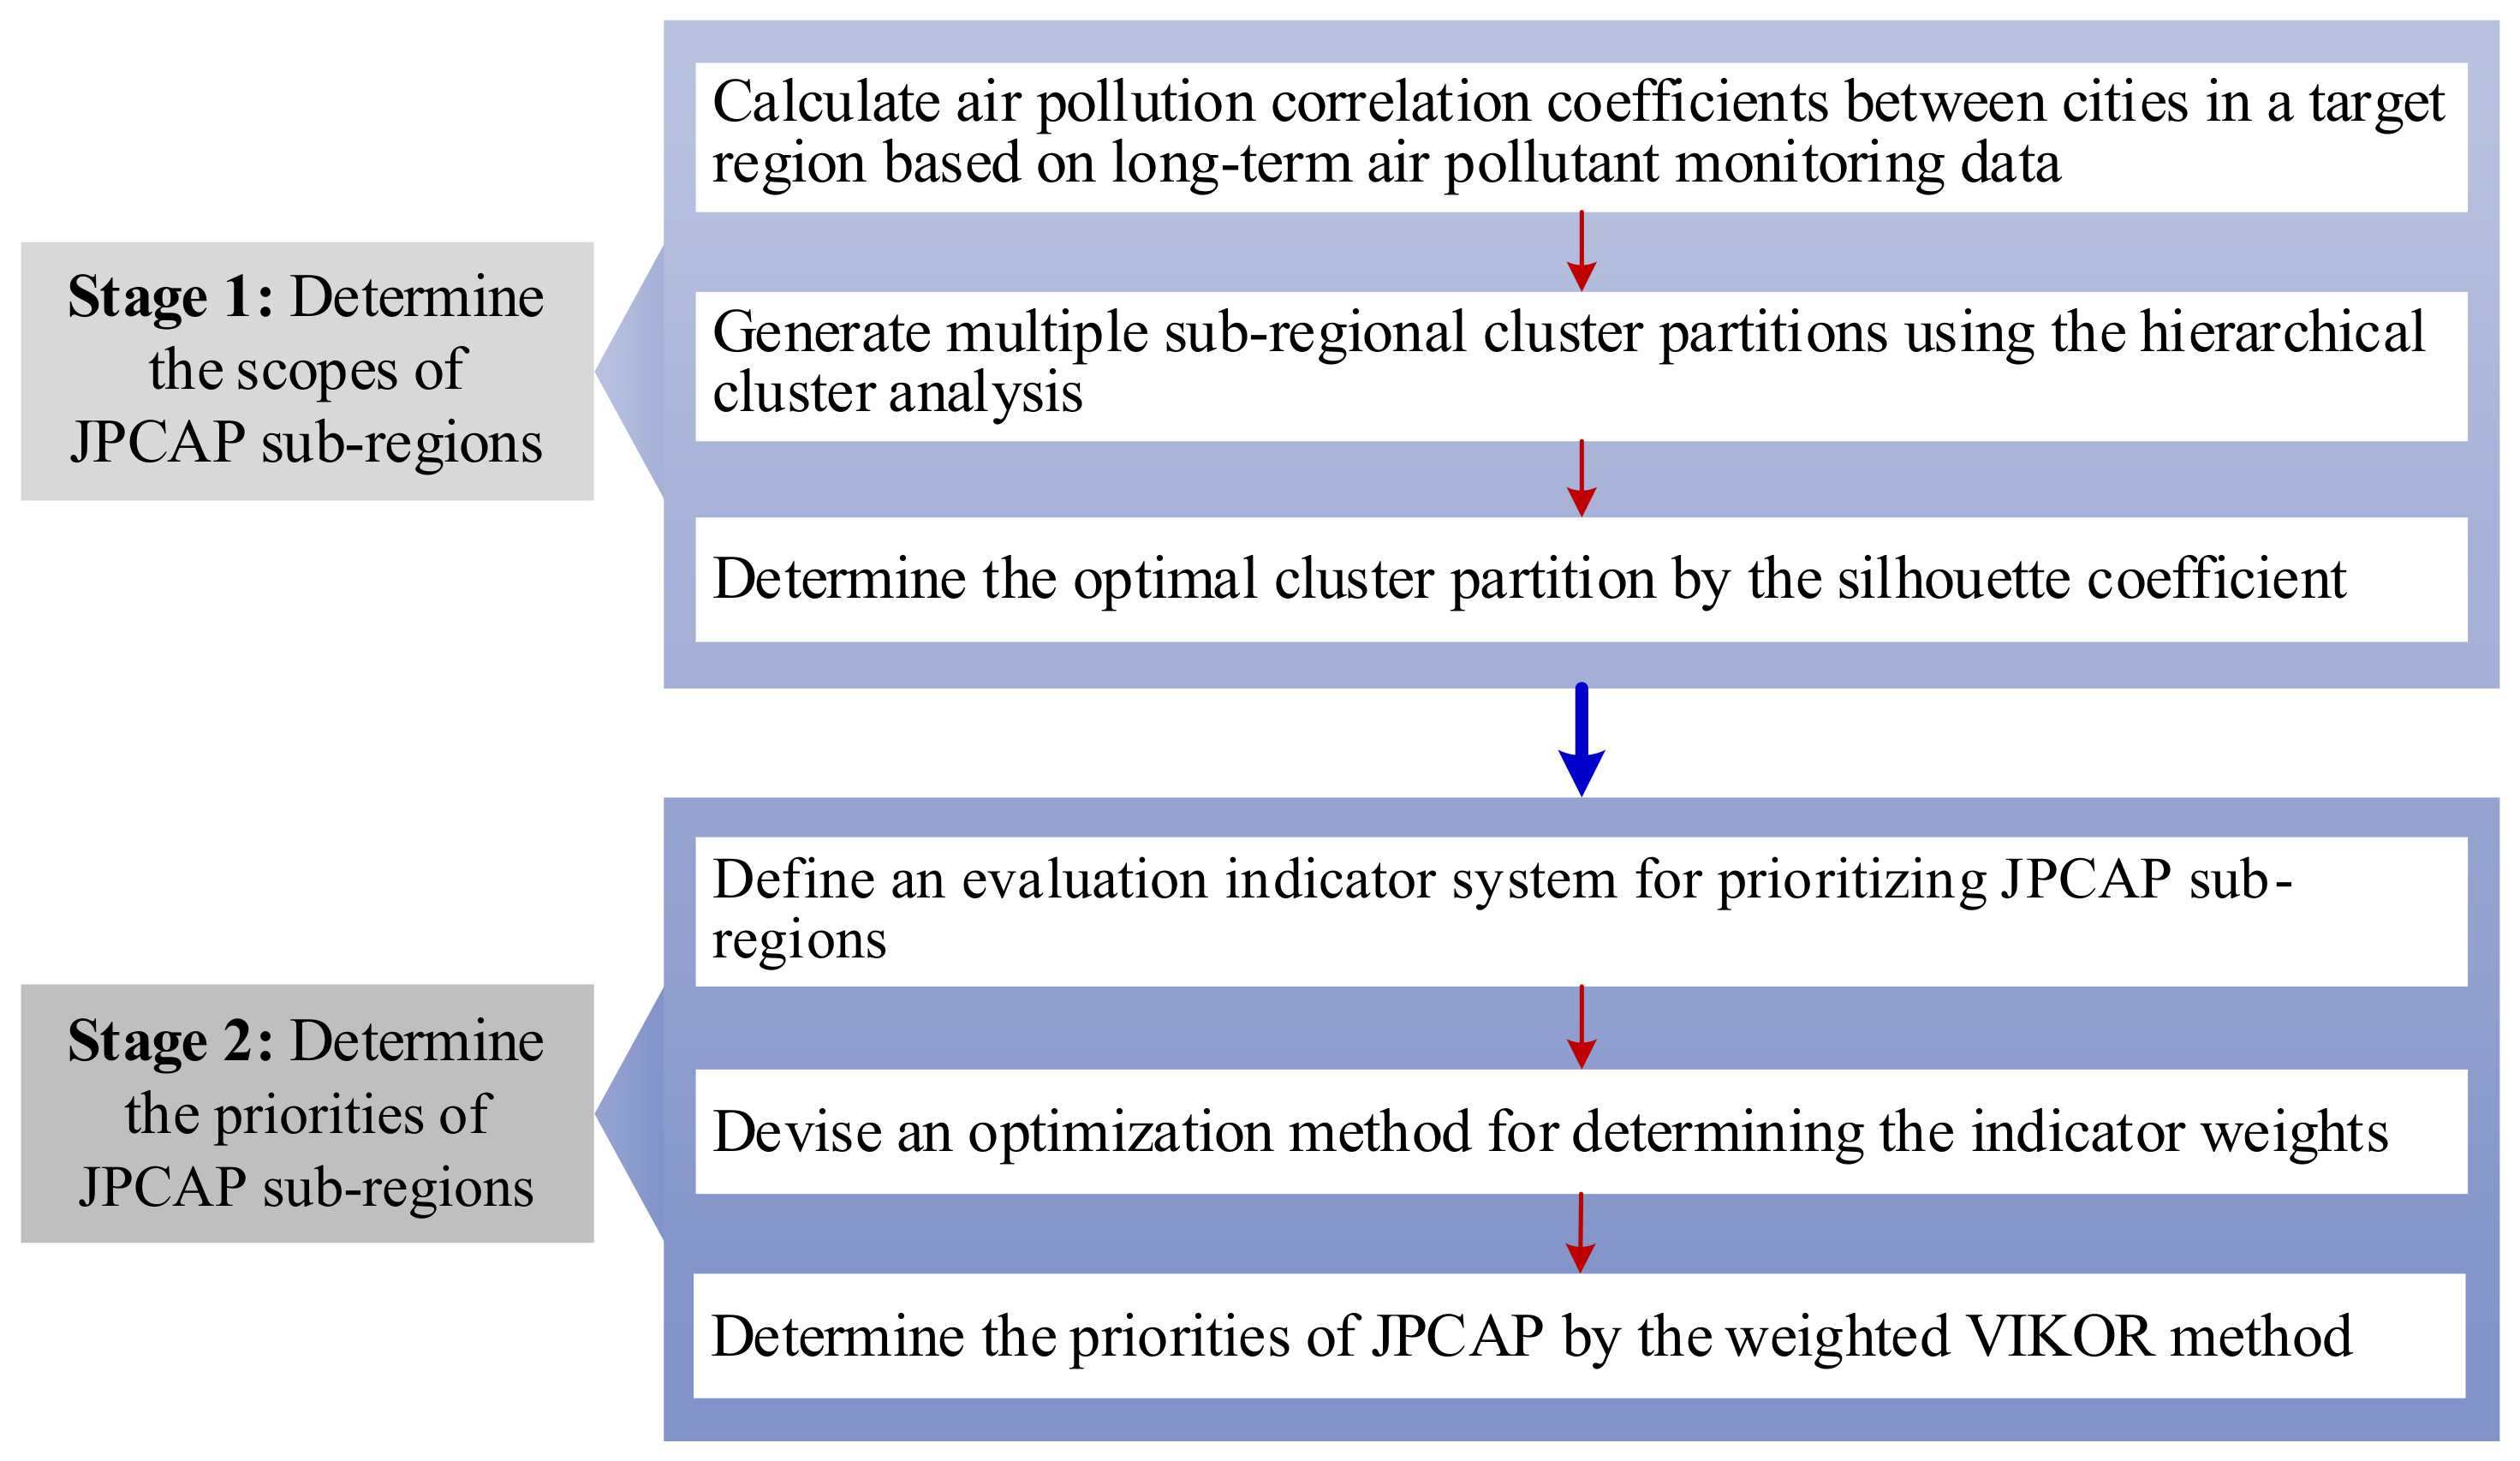
2.1. Stage 1: Determining the Sub-Regional Scopes of JPCAP Based on an Extended Hierarchical Cluster Analysis Technique

Many studies have shown that the focus and difficulty of regional air pollution control lies in reducing and weakening the degree of interaction between sub-regions of the entire region [35,43]. Cities with high pollution transmission and similar emission characteristics should be clustered together for joint governance. The goal of this stage is to divide a large target region with m cities into several sub-regions using the hierarchical clustering analysis and silhouette coefficient, and the specific steps are as follows.
i:
Based on long-term and wide-area air pollutant monitoring data, we conduct air pollution correlation analysis between cities in the target region with the Pearson correlation coefficient, and construct a correlation matrix P = ( r i j ) m × m on m cities, where r i j refers to the correlation between city i  ( i = 1 , 2 , , m ) and city j  ( j = 1 , 2 , , m ) .
ii:
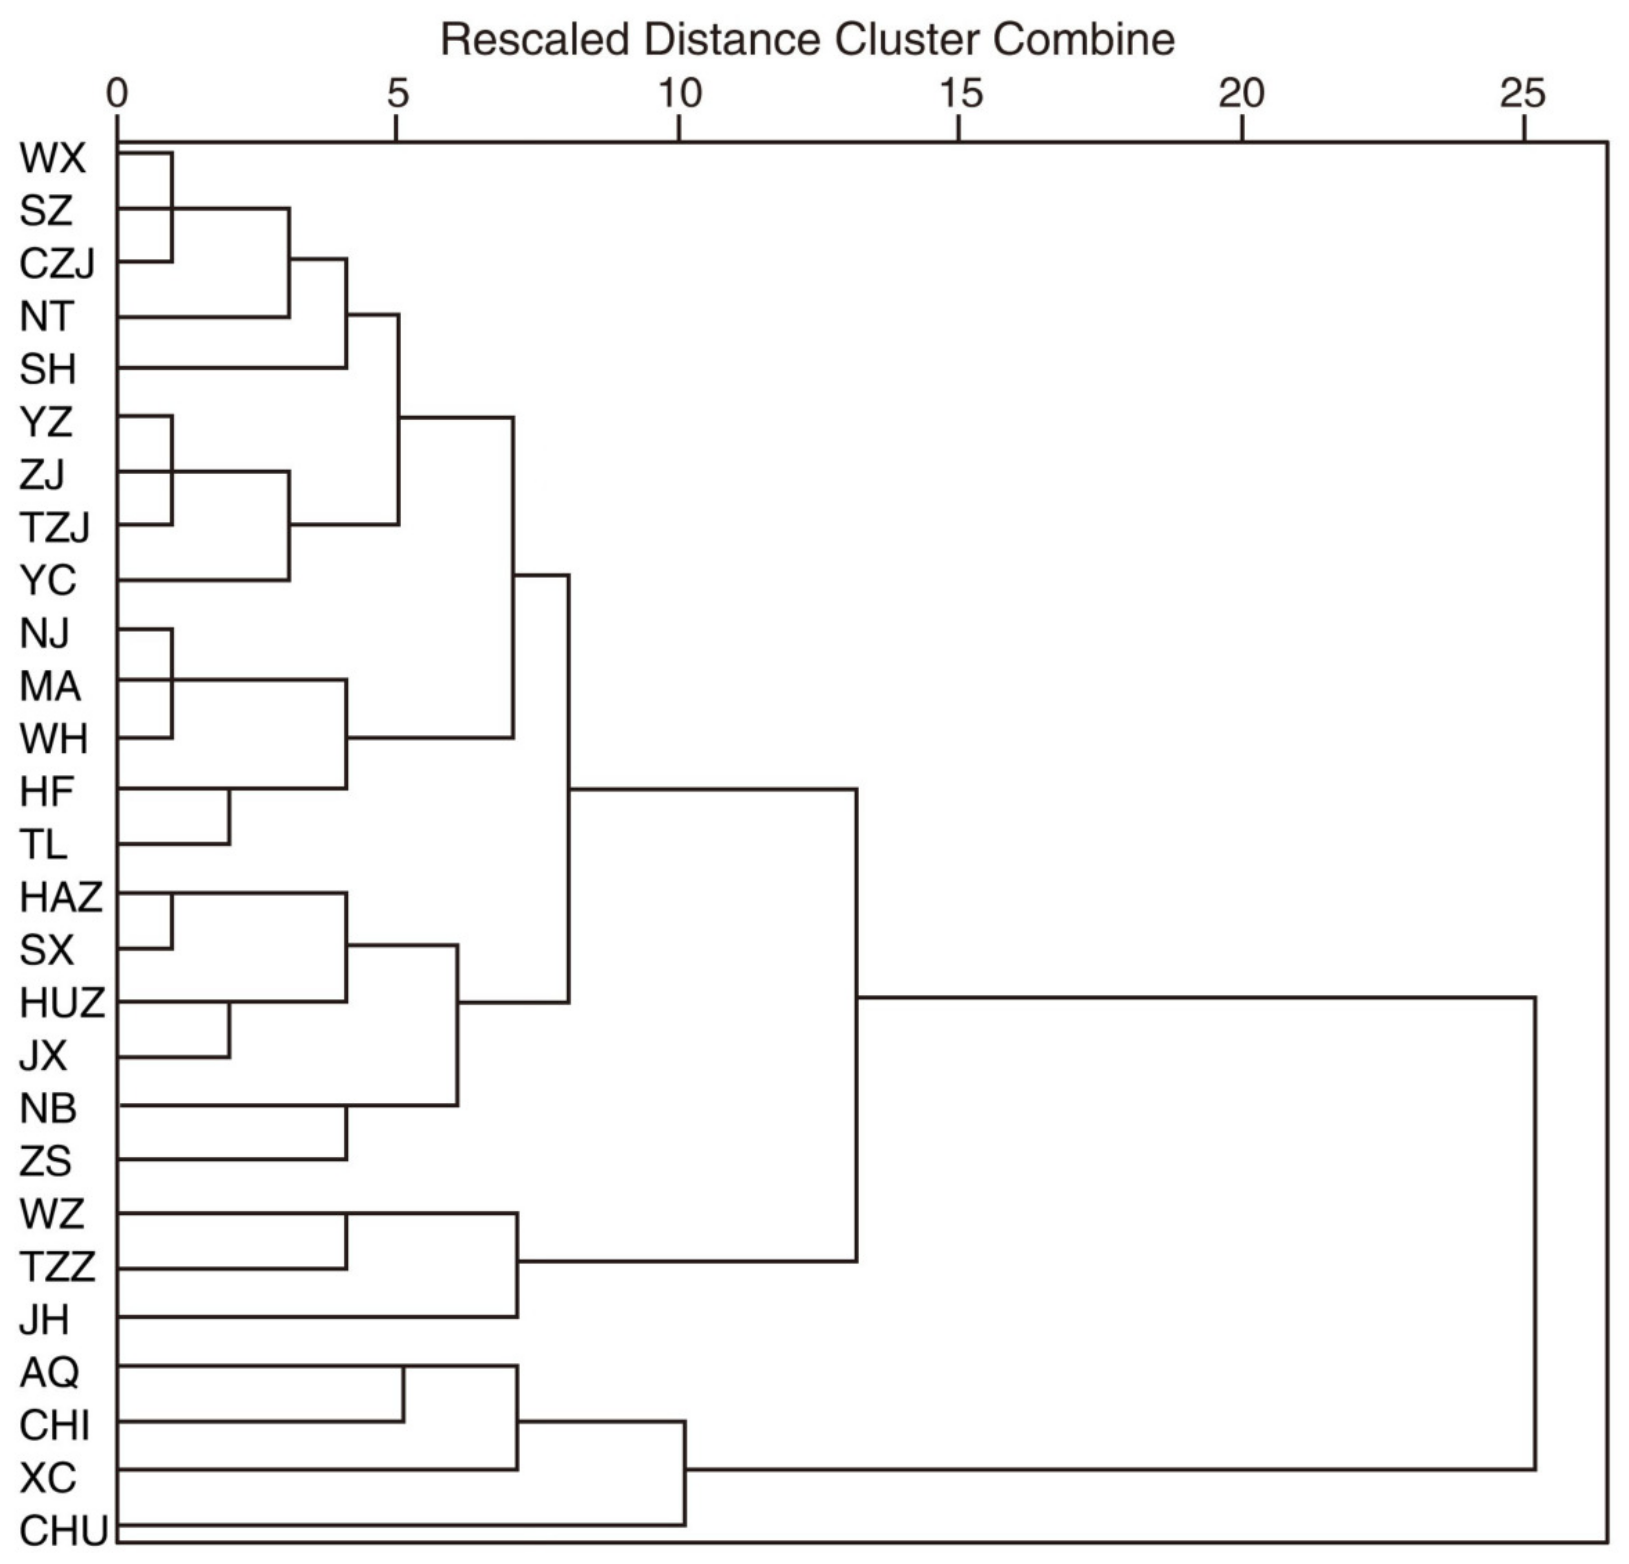
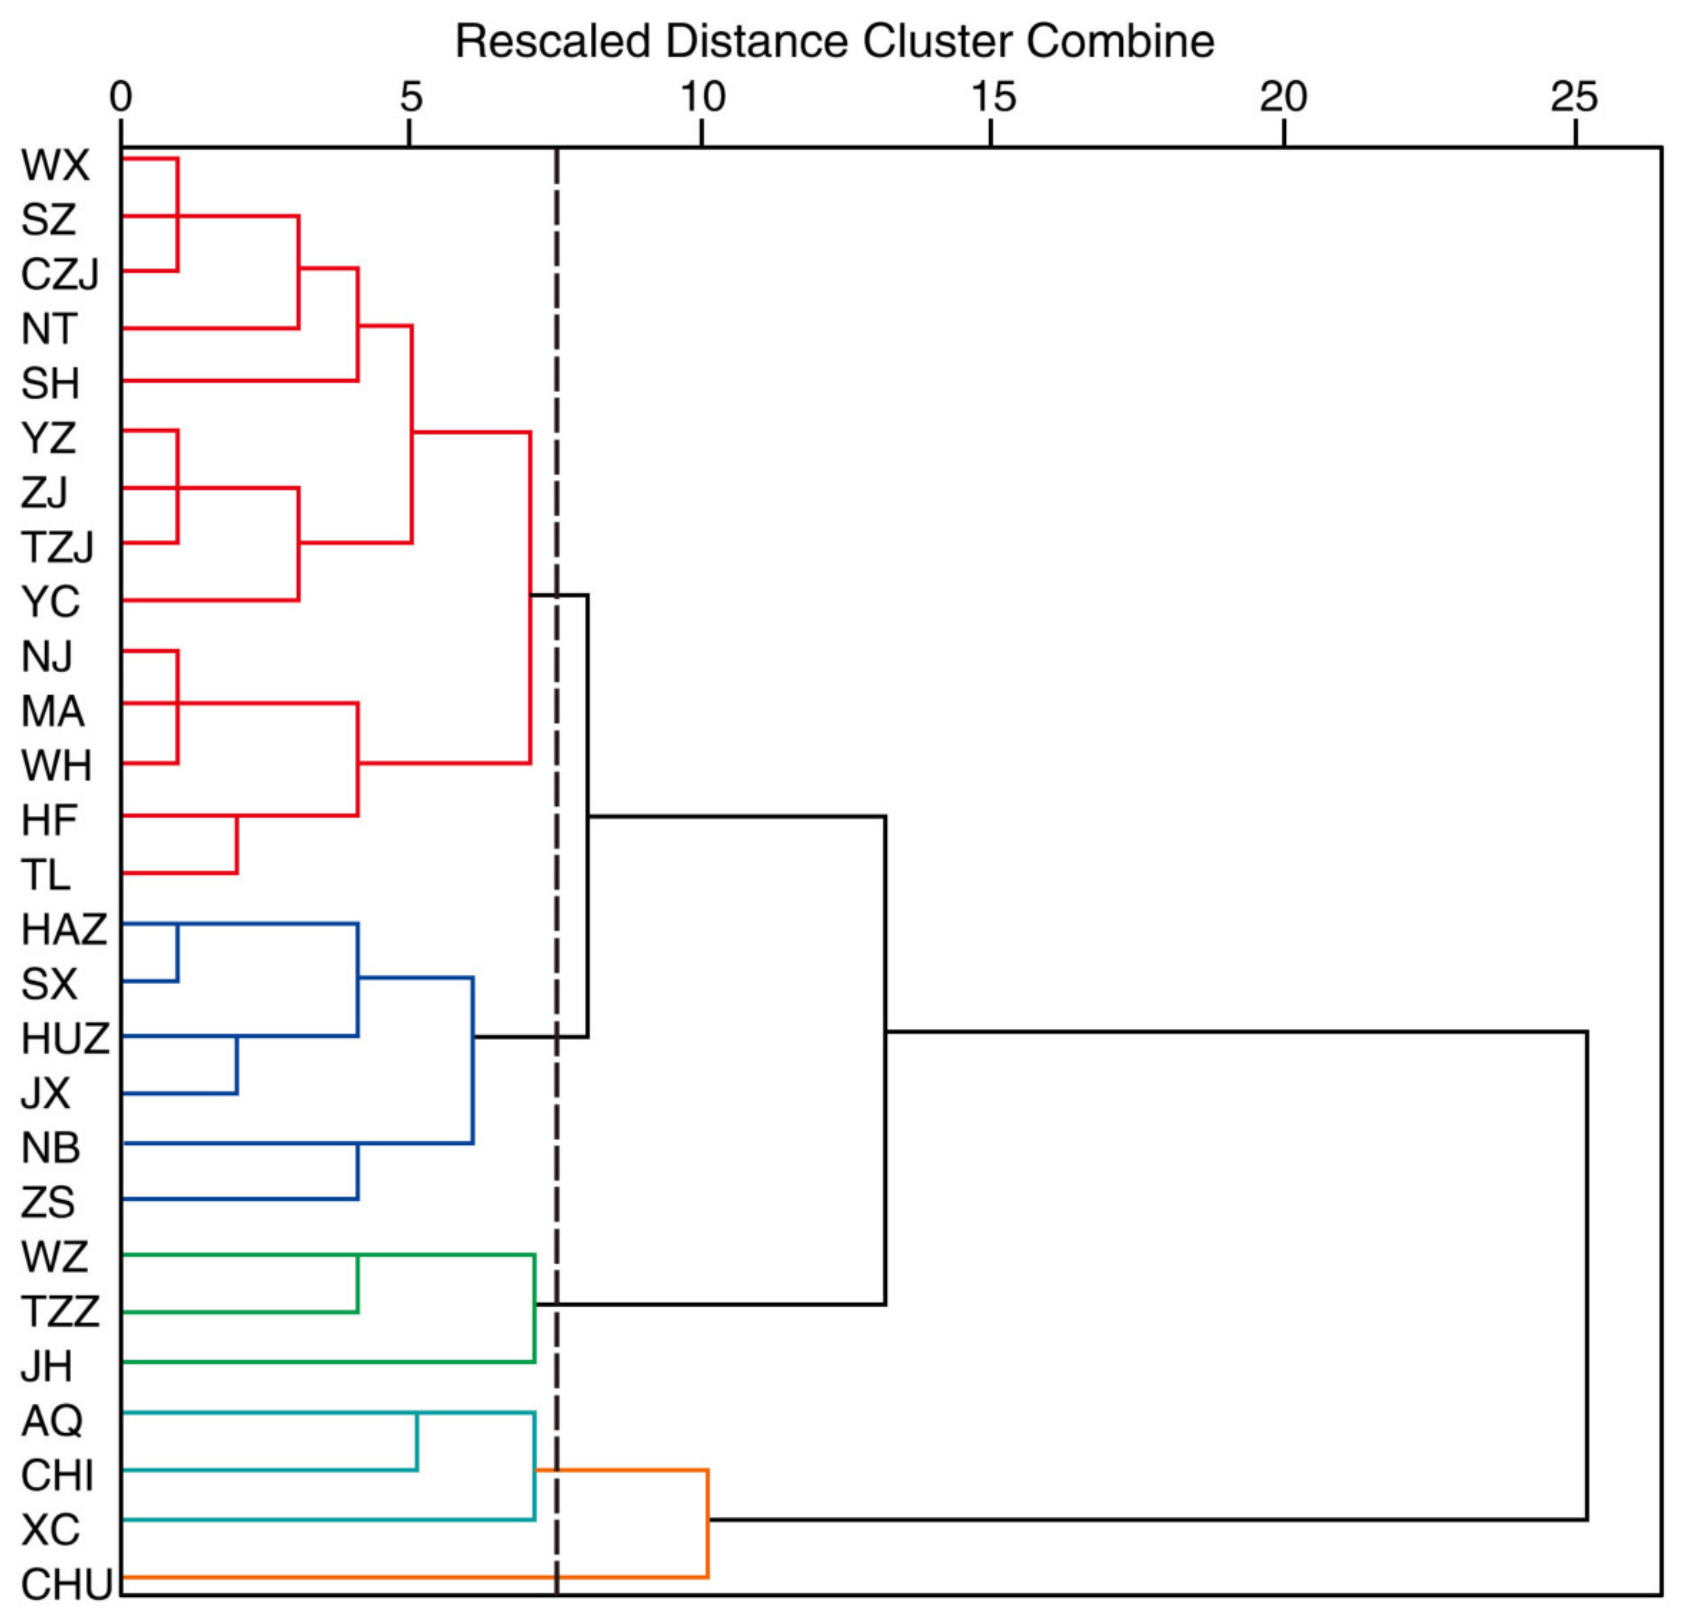
Divide the cities of the target region into different clusters by means of agglomerative hierarchical clustering. At first, consider each city to be a separate cluster. Then, we merge the two clusters with the highest correlation coefficient to form a new cluster. Repeat the procedure until all clusters have been assigned to a large cluster.
iii:
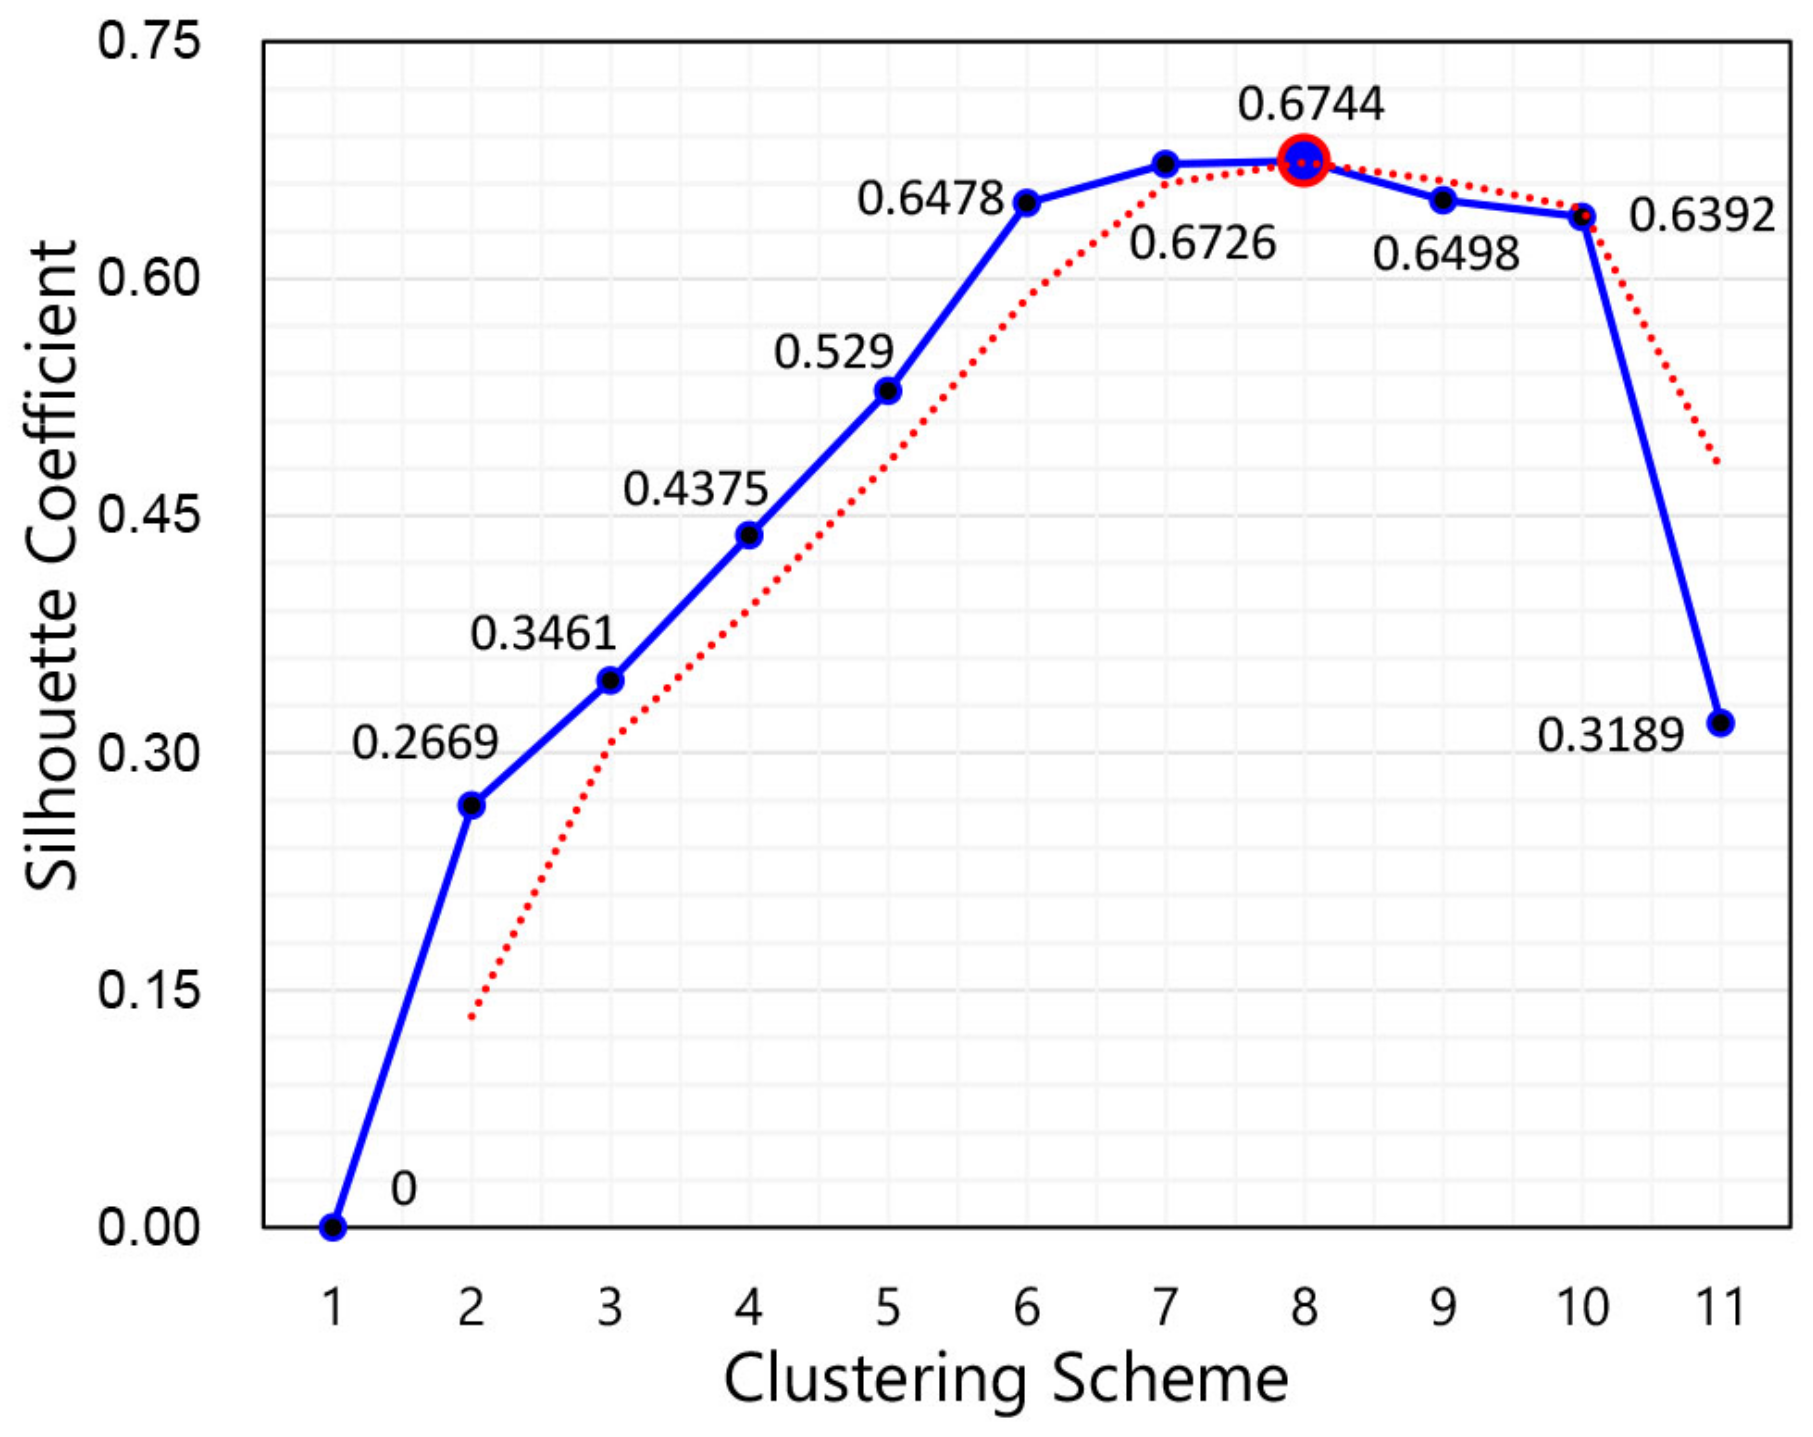
Identify the optimal cluster partition by means of the silhouette coefficient. Researchers frequently use the cohesion and separation coefficients to evaluate the quality of cluster partition [44]. The cohesion coefficient quantifies the degree of agglomeration of cities within a cluster by quantifying the similarity of any city to other cities in the cluster. The separation coefficient assesses the degree of separation of cities between clusters by quantifying the distance of any city from cities in other clusters. It’s worth noting that the distance between cities is the inverse of their similarity. The silhouette coefficient, which combines the effects of intra-cluster cohesion and inter-cluster separation, is thus more rational. According to the silhouette coefficient definition, the larger the silhouette coefficient is, the tighter the connections within clusters and the sparser connections between clusters are. The cluster partition with the highest silhouette coefficient is optimal and should be chosen.

2.2. Stage 2: Determining the Priorities of JPCAP Sub-Regions Based on a Comprehensive Decision-Making Framework

Regional differentiation governance in JPCAP is directly related to the cost-effectiveness of air pollution control, which can be improved through reasonable sub-regional priority setting. To assign appropriate priorities to sub-regions of JPCAP, a new weighted VIKOR method is proposed in this work. Firstly, we define three evaluation indicators from various perspectives, namely, the impact of a sub-region on the pollution level of the entire region, as well as the urgency and elasticity of sub-regional air pollution control. Secondly, we construct a decision matrix and develop an optimization method for determining the indicator weights. Finally, we prioritize JPCAP sub-regions using the weighted VIKOR method. The specific process is as follows.

2.2.1. Define Evaluation Indicators

In this paper, we determine the joint action priorities of JPCAP sub-regions by taking into account the impact of sub-regional pollution on the entire region, as well as the urgency and elasticity of sub-regional air pollution control, avoiding the one-dimensional analysis that results from only considering pollutant concentrations. First of all, the degree of impact of a sub-region on the pollution level of the entire region should be used as an evaluation indicator. Sub-regions that have a greater impact on the entire region should be prioritized. Next, the ultimate purpose of JPCAP is to reduce the health damage from air pollution. Hence, it is necessary to define a pollution control urgency indicator for a sub-region from the perspective of reducing the health damage caused by sub-regional air pollution. Moreover, each sub-region has a different elasticity of pollution control (i.e., the natural variation in the level of a pollutant) from others due to its different geographical location, climate, and pollution purification conditions. Thus, we choose the elasticity of sub-regional air pollution control as one of the evaluation indicators in this study. The three evaluation indicators are defined in detail below.
First, I m i denotes the impact of the pollution from sub-region i ( i = 1 , 2 , , k , where k is the number of sub-regions) on the entire region. The impact depends mainly on two factors: the correlation of the pollution and the sub-region area. S l i denotes the correlation between sub-region i ( i = 1 , 2 , , k ) and the entire region regarding the air pollutant monitoring data sequences. Specifically, a linear regression is performed on the two monitoring data sequences, and the slope of the linear function is taken to denote the correlation degree. A r i denotes the area of sub-region i ( i = 1 , 2 , , k ), and j = 1 k A r j represents the area of the entire region. Therefore, the correlation S l i can be expressed by Equation (1) and the impact I m i of sub-region i can be presented by Equation (2). The definition details are as follows
S l i = T r p c i S r p i ,
I m i = S l i × A r i j = 1 k A r j ,
where T r p represents the daily average concentration of a pollutant in the entire region, and S r p i denotes the daily average concentration of a pollutant in sub-region i ( i = 1 , 2 , , k ). c i is a constant parameter. The greater the value of I m i is, the higher the priority for sub-region i in implementing JPCAP is.
Second, H d i represents the health damage from air pollution within sub-region i ( i = 1 , 2 , , k ). The health damage from pollution is the most important factor in determining the priorities of pollution control in sub-regions. Over the years, researchers have carried out numerous studies aimed at quantifying the health impacts of specific air pollutants. Tang et al. discovered a significant positive correlation between the air quality index and the respiratory illness cases after conducting a thorough data analysis [45]. Maji et al. applied epidemiological relative risk as a metric to quantify the harmful effects of PM 2.5 concentration on health. They also offered a linear integrated exposure risk function to calculate the PM 2.5 concentration’s impact [46]. Wang et al. elucidated the complex, nonlinear positive correlation between changes in PM 2.5 concentration and corresponding changes in health impacts [47]. Drawing upon the above findings, it is evident that no definitive conclusion has been established regarding the mathematical relationship between air pollution and public health damage in existing research. Since this is an unresolved issue, there is currently no established standard to reference. To ensure alignment with the context of this article and the established model’s characteristics, a linear relationship between air pollution and the extent of health damage is assumed in this study. Consequently, the mathematical relationship between air pollution concentration and health damage can be presented by Equation (3). In sub-region i, the health damage H d i can be calculated by multiplying the population density D e n i by the daily average concentration D a c i of a concerned air pollutant, which is defined as
H d i = D e n i × D a c i ,
where D e n i can be obtained by dividing the total population by the urban area. The higher the value of H d , the more urgent it is to control the pollutant in the specific sub-region.
Third, we use the elasticity of sub-regional air pollution control to express its pollution control potential. In general, the coefficient of variation of the pollution concentration can reflect its concentration range in a sample period. The greater the coefficient of variation is, the greater the potential of air quality improves. Therefore, we use the long-term coefficient of variation of the pollution concentration in a sub-region to measure the potential of pollution control. P c i represents the potential of pollution control in sub-region i ( i = 1 , 2 , , k ). This variation coefficient of pollution can be used to characterize the extent of pollutant concentration fluctuation within a sub-region. The larger the pollutant concentration fluctuation in a sub-region, the more pollution control potential there is. The P c i of sub-region i ( i = 1 , 2 , , k ) is defined as
P c i = S d i D a c i ,
where S d i represents the standard deviation of the daily average concentration in sub-region i, and D a c i denotes the mean of the daily average concentration in sub-region i. The higher the value of P c i , the greater the priority of sub-region i in implementing JPCAP.

2.2.2. Construct and Weight Decision Matrix

We construct a decision matrix based on the indicators defined above and assign weights to each indicator. The specific steps are as follows.
i:
Construct the decision matrix X = ( x i j ) k × 3 = { Im T , Hd T , Pc T } , where k refers to the number of sub-regions. The impact of pollution on the entire region from each sub-region, can be calculated using Equations (1) and (2) to construct the vector Im = { I m 1 , I m 2 , , I m k } . The health damage for these sub-regions can be computed using Equation (3) to construct the vector Hd = { H d 1 , H d 2 , , H d k } . The potential of pollution control in these sub-regions, can be calculated using Equation (4) to construct the vector Pc = { P c 1 , P c 2 , , P c k } .
ii:
Standardize the decision matrix X = ( x i j ) k × 3 . Due to the different natures of the indicators, they have different ranges or units of measurement. Thus, the decision matrix must be standardized as follows
v i j = x i j × ( 1 + x i j x j 2 × ( x j + x j ) ) ,
u i j = v i j i = 1 k v i j k ,
where x j = min { x 1 j , x 2 j , , x k j } and x j + = max { x 1 j , x 2 j , , x k j } , ( j = 1 , 2 , 3 ) . U = ( u i j ) k × 3 represents the standardized decision matrix.
iii:
Determine the weights W = { w 1 , w 2 , w 3 } for three evaluation indicators. First, we define the positive ideal solution Z + = { u 1 + , u 2 + , u 3 + } , u j + = max { u 1 j , u 2 j , , u k j } ( j = 1 , 2 , 3 ) . Second, minimize the sum of Euclidean weighted distance between each sub-region and the positive ideal solution, and we can obtain the weights W = { w 1 , w 2 , w 3 } for indicators 1 (impact of pollution, I m ), 2 (health damage, H d ), and 3 (potential of control, P c ). The proposed indicator weighting optimization method is mathematically defined as
min i = 1 k j = 1 3 [ w j ( u j + u i j ) ] 2 , s . t . j = 1 3 w j = 1 .
iv:
Obtain the weighted decision matrix Y = ( y i j ) k × 3 , y i j = u i j × w j ( i = 1 , 2 , , k ; j = 1 , 2 , 3 ) .

2.2.3. Determine the Priorities of JPCAP Based on VIKOR

As well-known, the TOPSIS and VIKOR are two common multi-criteria decision-making methods, which are both based on an aggregating function representing “closeness to the ideal”. The TOPSIS method determines a solution with the shortest distance to the ideal solution and the greatest distance from the negative-ideal solution, but it does not consider the relative importance of these distances. The VIKOR method for compromise ranking determines a solution that balances the “group utility” of the majority with the individual regret of the “opponent”, achieving a maximum group benefit and a minimum individual regret [48]. In this paper, the VIKOR method is applied for the first time to the comprehensive evaluation of JPCAP sub-region priorities in order to make more rational decisions. The group utility of a sub-region refers to the total score across all evaluation indicators. The individual regret of a sub-region refers to the lowest score out of all evaluation indicators. This work employs the weighted VIKOR method to assign appropriate priorities to the sub-regions of JPCAP.
i:
Calculate the maximum group utility S i for sub-region i  ( i = 1 , 2 , , k ) under three evaluation indicators, as defined below
S i = j = 1 3 y i j .
ii:
Calculate the minimum individual regret value R i for sub-region i  ( i = 1 , 2 , , k ) , as defined below
R i = min j = 1 , 2 , 3 { y i j } .
iii:
Calculate the comprehensive evaluation value Q i for sub-region i  ( i = 1 , 2 , , k ) , as defined below
Q i = ρ S i S S + S + ( 1 ρ ) R i R R + R ,
where S + = max { S 1 , S 2 , , S k } , S = min { S 1 , S 2 , , S k } , R + = max { R 1 , R 2 , , R k } , R = min { R 1 , R 2 , , R k } , and ρ is a compromise factor. Without loss of generality, we set ρ = 0.5 , which means that the decision results from a compromise between group utility and individual regret.
iv:
Obtain the priorities for JPCAP sub-regions by ranking Q = { Q 1 , Q 2 , , Q k } in descending order. The top-ranked sub-regions are assigned higher priority in pollution control.

3. An Illustrative Case

3.1. Materials

To validate the proposed model, we conduct a case study using the YRD region in China. The YRD region is one of the most prosperous regions in China, with its large population and industry. It is located in the lower reaches of the Yangtze River (29.20’ N, 123.25’ S), and is bordered by the Yellow Sea and the East China Sea, as shown in Figure 2. The region has a warm and humid subtropical climate, and the high humidity is not conducive for the removal of pollutants from the air. The region serves as a critical policy-testing ground for China’s implementation of the regional integration strategy.The region serves as a critical policy-testing ground for China’s implementation of the regional integration strategy. In this context, it is becoming increasingly important for YRD cities to strengthen cooperation in preventing and controlling air pollution.
For any air pollutant, the proposed model in this paper can be used to optimize JPCAP in a target region. Due to space constraints, we will just take PM 2.5 as an example to illustrate its utility.
The YRD region is one of the most heavily polluted areas in China. As a result, it has become essential for the YRD region to implement JPCAP. The 27 cities in the YRD region are chosen for case study, including Shanghai (SH), Nanjing (NJ), Wuxi (WX), Changzhou (CZJ), Suzhou (SZ), Nantong (NT), Yangzhou (YZ), Zhenjiang (ZJ), Yancheng (YC), Taizhou-Jiangsu (TZJ), Hangzhou (HAZ), Ningbo (NB), Wenzhou (WZ), Huzhou (HUZ), Jiaxing (JX), Shaoxing (SX), Jinhua (JH), Zhoushan (ZS), Taizhou-Zhejiang (TZZ), Hefei (HF), Wuhu (WH), Maanshan (MA), Tongling (TL), Anqing (AQ), Xuancheng (XC), Chuzhou (CHU), and Chizhou (CHI). We collected monitoring data from January 2016 to December 2021 from the website “https://aqicn.org/map/china/cn/” (accessed on 10 January 2022), and obtained the total of 59,130 data records for daily average PM 2.5 concentration in the 27 cities. The total population and the urban area can be obtained from the Chinese city statistical yearbook (6-year study period, from 2016 to 2021).

3.2. Results and Discussion

Our experimental results are categorized into two parts: the first pertains to the sub-region scopes of JPCAP, while the second focuses on the priority of each sub-region. In the following sections, we present the findings from both aspects and provide a detailed analysis.

3.2.1. The Scopes of JPCAP Sub-Regions for the YRD Region

We utilize the correlation analysis, clustering analysis, and silhouette coefficient to determine JPCAP’s sub-regional scopes for the YRD region. Most of the daily average concentrations of PM 2.5 in the 27 cities are strongly correlated, with the Pearson correlation coefficients ranging from 0.58 to 0.96. SH, which is a mega-city in the study region, is closely related to other cities except WZ, JH, AQ, CHU, CHI, and XC. The PM 2.5 levels in CHU is weakly correlated with those in the other cities, except for AQ, CHI, and XC.
The YRD 27 cities are then subjected to the hierarchical cluster analysis based on the Pearson correlation coefficients, and the optimal cluster partition is determined by the silhouette coefficient. The dendrogram of 11 clustering partition alternatives is presented in Figure 3. The silhouette coefficients for these cluster partitions are shown in Figure 4. The red dashed line represents the rate of change in the silhouette coefficient between consecutive cluster partitions. The silhouette coefficient for the first cluster partition is 0, and that for the eleventh cluster partition is 0.3189. The eighth cluster partition has the maximum silhouette coefficient of 0.6744, indicating that this cluster partition (marked by dotted line in Figure 5) is optimal. On this basis, the YRD region is divided into five sub-regions, including R1 = {SH, NJ, WX, CZJ, SZ, NT, YZ, ZJ, YC, TZJ, HF, WH, MA, TL}, R2 = {HAZ, NB, HUZ, JX, SX, ZS}, R3 = {WZ, JH, TZZ}, R4 = {AQ, CHI, XC} and R5 = {CHU}.
Although natural activities can produce PM 2.5 , the main sources of PM 2.5 are anthropogenic emissions [49,50]. Human activities can emit PM 2.5 directly. Besides, they emit certain gaseous pollutants that can be converted into PM 2.5 [51,52]. The main gaseous pollutants that are converted to PM 2.5 are sulfur dioxide (SO 2 ), nitrogen oxides (NO x ), ammonia (NH 3 ), and volatile organic compounds (VOC s ) [53]. Other anthropogenic sources include road dust, construction dust, industrial dust, and kitchen fumes. The factors affecting a city’s PM 2.5 level may be endogenous or exogenous. Endogenous factors include the city’s industrial structure, economic development, and population, etc. Exogenous factors mainly lie in the diffusion of PM 2.5 across city boundaries [43]. The emission of PM 2.5 particles from a city can act as an exogenous factor affecting the air quality of a neighboring downwind city. This explains why regional pollution levels are so highly correlated between adjacent cities. When defining the scopes of JPCAP sub-regions, both exogenous and endogenous factors should be considered.
In addition to forming mathematical clusters (as shown in Figure 5), the cities in each cluster also form physically contiguous territories, as seen in Figure 6. We use ArcGIS software (http://www.arcgis.com, accessed on 1 February 2022) to produce an initial draft of the map, which was subsequently refined to create the final version depicted in Figure 6. It would be difficult for cities separated by a large geographical distance to collaborate in JPCAP implementation. To some extent, this indicates that our JPCAP region division is practical. SH, NJ, WX, CZJ, SZ, NT, YZ, ZJ, YC, TZJ, HF, WH, MA, and TL are grouped into R1. There are no significant geographical barriers between these cities. Furthermore, the cities in R1 have a highly mobile population that travels between these cities. HAZ, NB, HUZ, JX, SX, and ZS in R2, are also physically close and have a similar industrial structure, such as e-commerce industry, textile industry, and light manufacturing, etc. There are evident geographical barriers between sub-regions R1 and R4, as well as between sub-regions R2 and R3, such as mountains (Jingting Mountain, Tiantai Mountain) and huge water body (Taihu Lake). CHU alone forms a distinct sub-region R5 located in the northwest corner of the study region, separated from the rest by high mountains (Langya and Ta-pieh Mountains). High mountains prevent the diffusion of air pollutants and Large area water bodies reduce the diffusion impact, which should be the main reasons for the low Pearson coefficient of air pollution between sub-regions.
Based on these analysis, the JPCAP’s sub-regional scopes derived from the proposed model are consistent with the regional context, indicating that our work of determining the scopes of JPCAP sub-regions has practical implications. In contrast with geographical boundaries such as mountains and bodies of water, which physically interfere with pollutant transport, municipal administrative boundaries cannot be used as the basis for scoping sub-regions. In fact, one of the key aspects of JPCAP is that it breaks down administrative boundaries and persuades cities in the identical group to cooperate to implement JPCAP, which is highly correlated with the regional integration strategy in China.

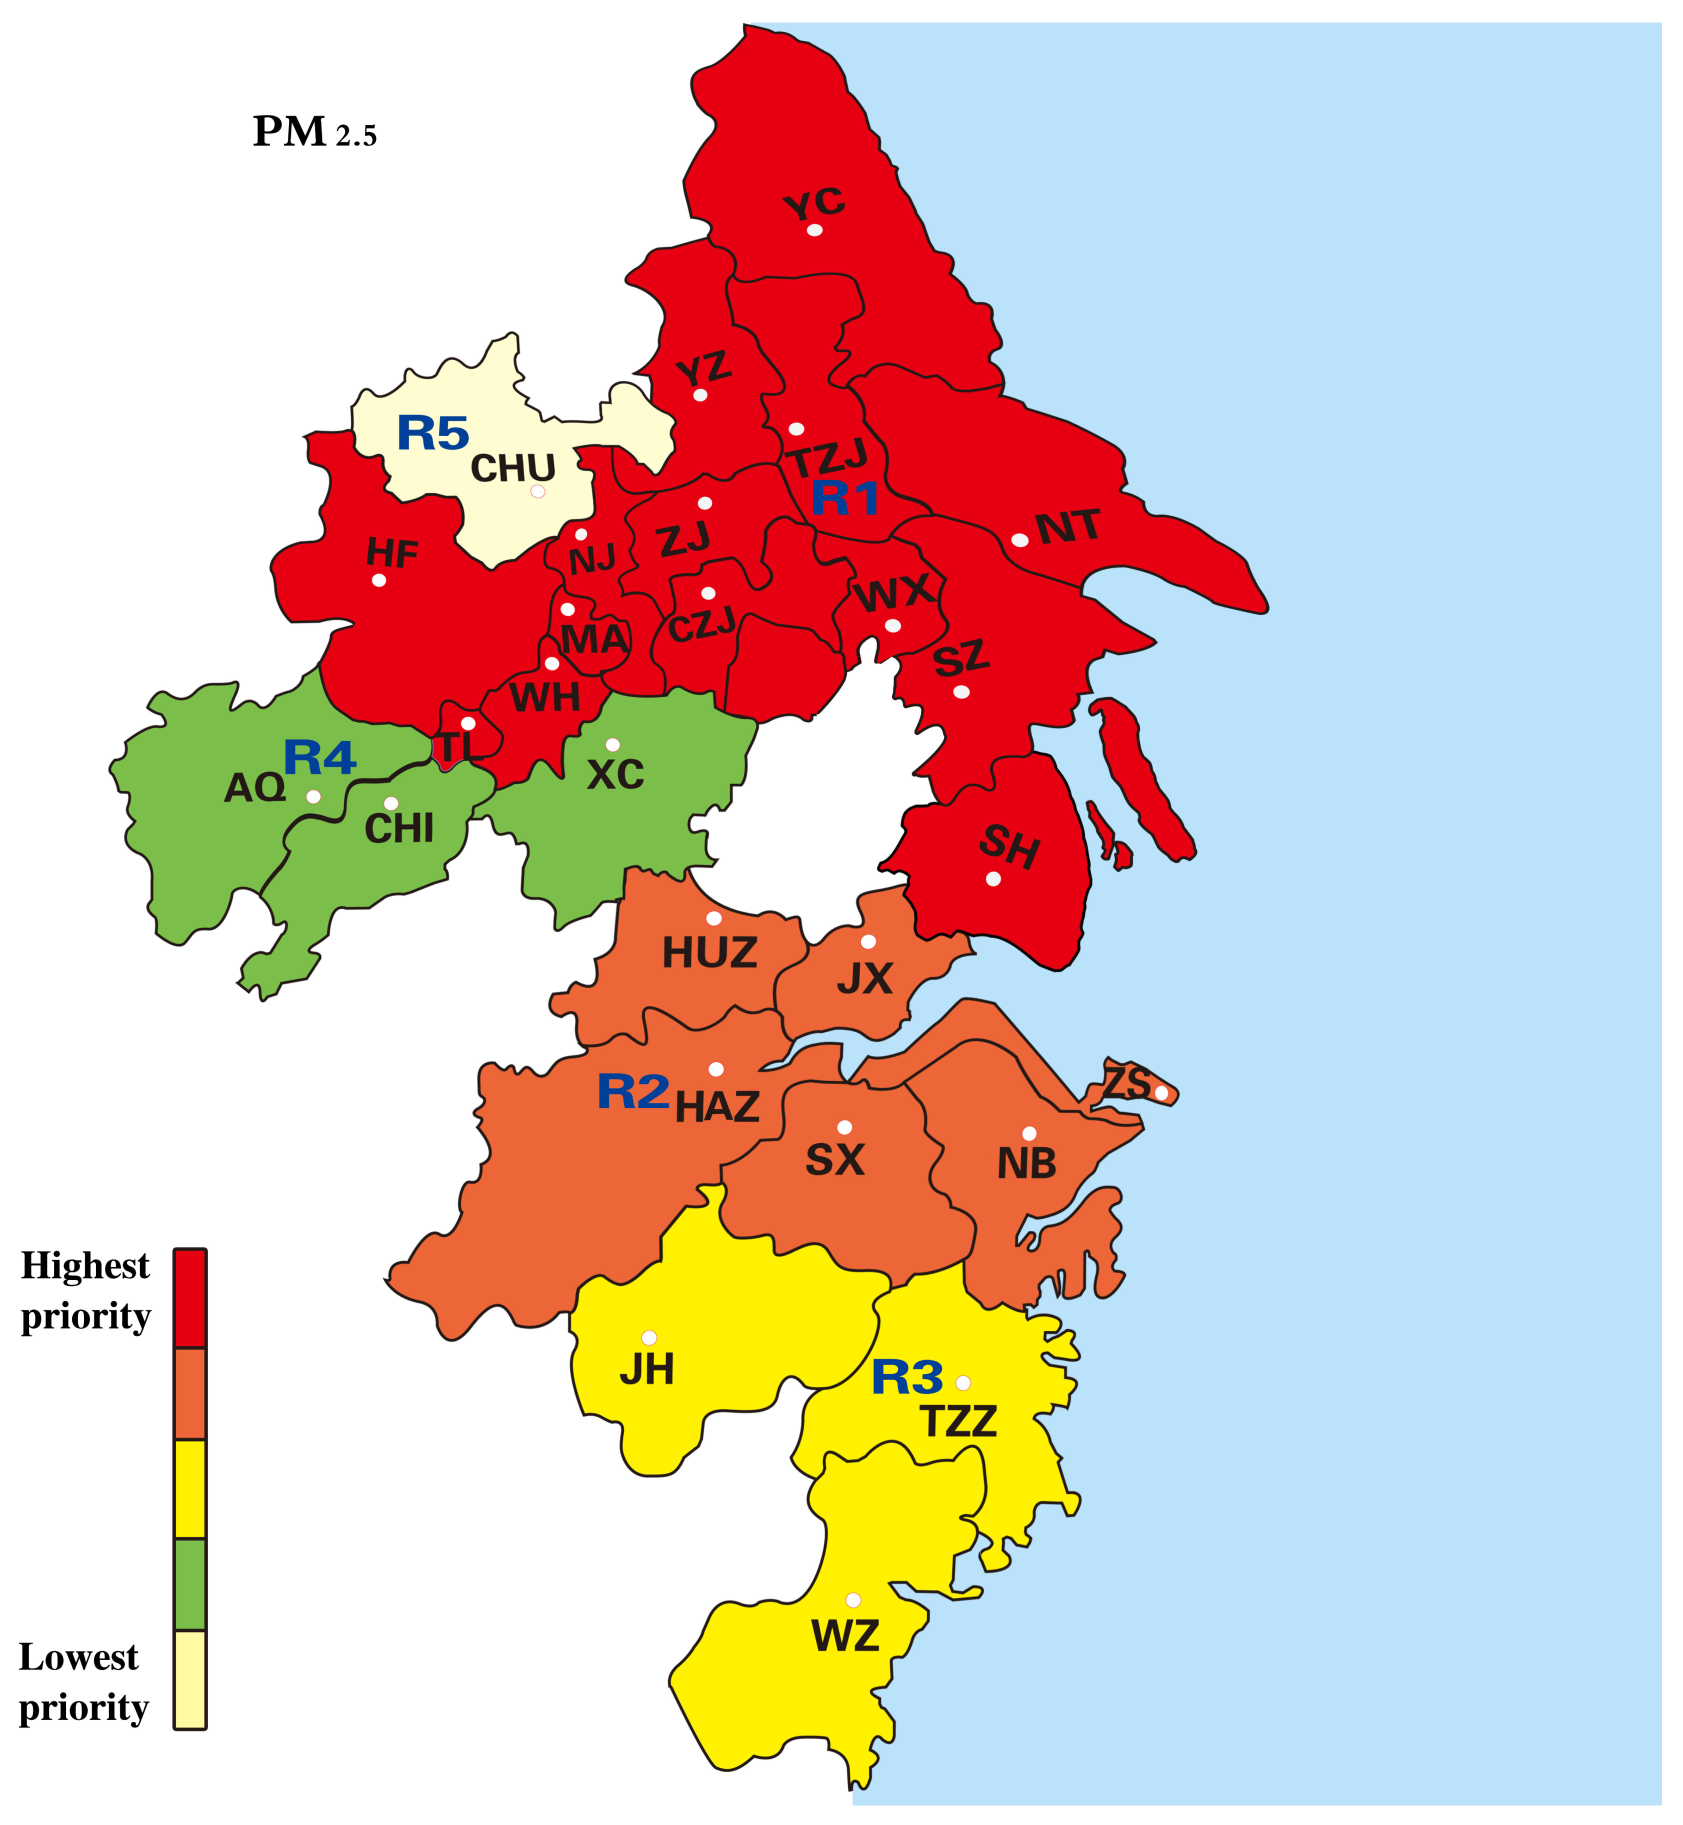
3.2.2. The Priorities of JPCAP Sub-Regions for the YRD Region

Before applying the proposed weighted VIKOR method to determine the priorities of JPCAP sub-regions, it is necessary to identify and calculate three evaluation indicators. To calculate the impact of sub-regions on the entire region, we utilized one-dimensional linear regression. The results are presented in Table 1. Additionally, Table 2 displays the health damage ( H d ) for the five sub-regions. Table 3 shows that there is no significant difference in pollution control potential among the sub-regions, with R4 exhibiting slightly higher pollution control potential compared to the other sub-regions.
In the YRD region, the impact of the pollution from each sub-region on the entire target region depends mainly on two factors: the pollution correlation and the sub-region area. PM 2.5 from the five sub-regions has a significant impact on the YRD region. Among the five sub-regions, R1 has the strongest impact on the entire region, followed by R2, and R5 has the smallest impact. The health damage ( H d ) is highest for R1 (46,011) and lowest for R4 (8508). Both R2, R3 and R5 have health damage levels over 15,000, which are also at a relatively high level. R1 has a large population (97.5 million people), accounting for 63% of the YRD region’s total population. The health damage of air pollution to human living in R1 is significantly higher than that of other sub-regions. Protecting public health is the top priority, so R1 should have a higher priority for controlling and preventing PM 2.5 than other sub-regions. Compared to the health damage H d and the pollution impact I m , there is less difference among the potential P c of PM 2.5 control for the five sub-regions. The P c value of R4 is highest, followed by R2 and R1. The sub-regions with higher P c values have the potential to achieve more significant effects in controlling PM 2.5 .
The proposed weighted VIKOR method was then utilized to calculate the priorities of the five JPCAP sub-regions in the YRD region. Table 4 presents the resulting outcomes. Figure 7 clearly shows that R1 > R3 > R2 > R4 > R5. Sub-region R1, which includes SH, NJ, WX, CZJ, SZ, NT, YZ, ZJ, YC, TZJ, HF, WH, MA, and TL, should control and prevent PM2.5 most urgently. The priority is the lowest for R5.
Sub-region R2 ranks second for implementing JPCAP, followed by R3. Sub-region R2 contains six cities and is larger than other three regions, so it will have a greater impact on the pollution levels in the YRD region. This gives R2 higher priority than R3 for implementing JPCAP. From a practical point of view, it’s worth noting that the cities in R2 are adjacent to Shanghai. Driven by cooperation with Shanghai, these cities have updated their industries from traditional manufacturing to emerging industries, such as the new materials industry, new energy industry, and e-commerce industry, which produce lower pollutant emissions than traditional manufacturing. In contrast, the pillar industry of JH is automobile manufacturing, which is strongly associated with the metal manufacturing industry. During metal production, many fine particles are generated both from the metal extraction processes and combustion of fuel to drive these processes. During the automobile manufacturing process, the friction between metals and the cutting and shaping of car parts produce metal powders that float in the air and easily form PM 2.5 . The industries of WZ are dominated by power generation, clothing, footwear, and automobile industries, etc. Coal-fired power plants emit a large amount of air pollutants, which has a significant negative impact on the air quality of nearby areas. The footwear industries generate large amounts of leather granules during the process of cutting and stitching of footwear. Similarly, the major industries in TZZ include power generation, automobile manufacturing, and plastic molding, etc, which generate large amounts of dust. These factors explain why R2 has a higher priority than R3 in implementing JPCAP. Our findings reveal that the urgency of pollution control varies throughout YRD’s sub-regions, owing to differences in population structure, industrial structure, and pollution situation, etc.
Weighting the three indicators is one of the focuses of this work, so it is essential to validate our indicator weighting method. We compare the proposed weighted VIKOR analysis with the classical VIKOR analysis (where the weights of the three indicators are the same, namely 1 / 3 ). The prioritization results differ between the weighted and unweighted experiments. The result of the latter is R1 > R3 > R2 > R4 > R5, that is, R2 and R3 change their priorities compared with the weighted VIKOR analysis. This change results from an underestimation of the weight of health damage in the unweighted analysis and an overestimation of the weight of the potential of air pollution control. Given that health damage should be the primary consideration in the JPCAP prioritization ranking, the priorities of R1 > R3 > R2 > R4 > R5 in the weighted analysis seem more defensible.
The aforementioned analysis indicates the scientific and practical viability of our proposed hybrid model for dividing a large target region into several sub-regions and evaluating their priorities. This work holds significant practical implications for promoting efficient and effective regional joint control, improving regional air quality, and establishing a scientific policy-making basis for regional air pollution joint control mechanisms.

4. Conclusions

JPCAP is an imperative strategy to tackle the increasingly severe regional air pollution problem. Determining the appropriate scopes and priorities of JPCAP sub-regions is critical to policy-making for joint air pollution control. This work proposes a two-stage hybrid model to identify and prioritize JPCAP sub-regions based on long-term monitoring data of air quality in the target region. In the first stage, to determine the scopes of JPCAP sub-regions, we develop an extended hierarchical clustering analysis to group all cities of the target region, and employ the silhouette coefficient to identify the optimal cluster partition. In the second stage, to prioritize these JPCAP sub-regions, we construct a prioritization decision-making framework by defining three key evaluation indicators, and propose a weighted VIKOR method to support the decision process. These three indicators are defined by considering the dimensions of health damage caused by sub-regional pollution, the impact of sub-regional pollution on the entire region, and the potential of sub-regional pollution control. The proposed weighted VIKOR method takes into account not only the maximum group benefit and the minimum individual regret, but also the weights of different indicators, resulting in more reasonable priority outcomes. Finally, we conduct a case study using the YRD region, and the results demonstrate the validity of the proposed hybrid model.
The significance of this study mainly lies in its capacity to provide a concrete and feasible solution for implementing JPCAP in a target region, i.e. determining the scopes and priorities of JPCAP sub-regions. When resources, capabilities, and capitals are limited, governments should focus on the most urgent pollution control sub-region. Compared to the current practice of treating large regions uniformly, the proposed hybrid model allows for differentiated governance and is more effective in coordinating resources, saving funds, and improving air quality. Furthermore, the proposed hybrid model can be widely extended to the joint control of various air pollution factors, such as PM 10 , SO 2 , NO 2 , CO, and other air pollutants, in China and other regions of the world. The proposed model may be reasonable and practical to air pollution control and sustainable development, and further enrich the toolbox of air pollution control by governments around the world.

Author Contributions

Conceptualization, P.Y. and L.Z.; methodology, P.Y. and H.Y.; validation, H.Y. and L.C.; formal analysis, H.Y.; investigation, H.Y.; resources, L.Z.; data curation, L.C.; writing—original draft preparation, P.Y. and H.Y.; writing—review and editing, P.Y., H.Y., L.Z. and L.C.; project administration, L.Z.; funding acquisition, P.Y. and L.Z. All authors have read and agreed to the published version of the manuscript.

Funding

This research was funded by grants from the National Social Science Foundation of China (Grant number, 18AZD005, 21BGL217), the National Natural Science Foundation of China (Grant number, 71874108).

Institutional Review Board Statement

Not applicable.

Informed Consent Statement

Not applicable.

Data Availability Statement

The PM 2.5 observation data can be obtained from air quality monitoring stations in each Chinese city through the link “https://aqicn.org/map/china/cn/” (accessed on 10 January 2022). The total population and the urban area can be obtained from China City Statistical Yearbook through the link “http://cnki.gpic.gd.cn/CSYDMirror/Yearbook” (accessed on 10 January 2022).

Conflicts of Interest

The authors declare no conflict of interest.

References

  1. Sulaymon, I.D.; Zhang, Y.; Hu, J.; Hopke, P.K.; Zhang, Y.; Zhao, B.; Xing, J.; Li, L.; Mei, X. Evaluation of regional transport of PM2.5 during severe atmospheric pollution episodes in the western Yangtze River Delta, China. J. Environ. Manag. 2021, 293, 112827. [Google Scholar] [CrossRef] [PubMed]
  2. Li, G.; Fang, C.; He, S. The influence of environmental efficiency on PM2.5 pollution: Evidence from 283 Chinese prefecture-level cities. Sci. Total Environ. 2020, 748, 141549. [Google Scholar] [CrossRef] [PubMed]
  3. Cohen, A.J.; Brauer, M.; Burnett, R.; Anderson, R.; Frostad, J.; Estep, K. Estimates and 25-year trends of the global burden of disease attributable to ambient air pollution: An analysis of data from the Global Burden of Diseases Study 2015. Lancet 2017, 389, 1907–1918. [Google Scholar] [CrossRef] [PubMed]
  4. Requia, W.J.; Higgins, C.D.; Adams, M.D.; Mohamed, M.; Koutrakis, P. The health impacts of weekday traffic: A health risk assessment of PM2.5 emissions during congested periods. Environ. Int. 2018, 111, 164–176. [Google Scholar] [CrossRef]
  5. Lelieveld, J.; Pozzer, A.; Pöschl, U.; Fnais, M.; Haines, A.; Münzel, T. Loss of life expectancy from air pollution compared to other risk factors: A worldwide perspective. Cardiovasc. Res. 2020, 116, 1910–1917. [Google Scholar] [CrossRef]
  6. Wang, W.; Zhao, C.; Dong, C.; Yu, H.; Wang, Y.; Yang, X. Is the key-treatment-in-key-areas approach in air pollution control policy effective? Evidence from the action plan for air pollution prevention and control in China. Sci. Total Environ. 2022, 843, 156850. [Google Scholar] [CrossRef]
  7. Fontes, T.; Li, P.; Barros, N.; Zhao, P. Trends of PM2.5 concentrations in China: A long term approach. J. Environ. Manag. 2017, 196, 719–732. [Google Scholar] [CrossRef]
  8. Maji, K.J.; Dikshit, A.K.; Arora, M.; Deshpande, A. Estimating premature mortality attributable to PM2.5 exposure and benefit of air pollution control policies in China for 2020. Sci. Total Environ. 2018, 612, 683–693. [Google Scholar] [CrossRef]
  9. Tilt, B. China’s air pollution crisis: Science and policy perspectives. Environ. Sci. Policy 2019, 10, 275–280. [Google Scholar] [CrossRef]
  10. Khuzestani, R.B.; Schauer, J.J.; Wei, Y.; Zhang, L.; Cai, T.; Zhang, Y. Quantification of the sources of long-range transport of PM2.5 pollution in the Ordos region, Inner Mongolia, China. Environ. Pollut. 2017, 229, 1019–1031. [Google Scholar] [CrossRef]
  11. Masiol, M.; Benetello, F.; Harrison, R.M.; Formenton, G.; Gaspari, F.D.; Pavoni, B. Spatial, seasonal trends and transboundary transport of PM2.5 inorganic ions in the Veneto region (Northeastern Italy). Atmos. Environ. 2015, 117, 19–31. [Google Scholar] [CrossRef]
  12. Güçlü, Y.S.; Dabanlı, İ.; Şişman, E.; Şen, Z. Air quality (AQ) identification by innovative trend diagram and AQ index combinations in Istanbul megacity. Atmos. Pollut. Res. 2019, 10, 88–96. [Google Scholar] [CrossRef]
  13. Moufarrej, L.; Courcot, D.; Ledoux, F. Assessment of the PM2.5 oxidative potential in a coastal industrial city in Northern France: Relationships with chemical composition, local emissions and long range sources. Sci. Total Environ. 2020, 748, 141448. [Google Scholar] [CrossRef]
  14. McDuffie, E.E.; Smith, S.J.; O’Rourke, P.; Tibrewal, K.; Venkataraman, C.; Marais, E.A.; Zheng, B.; Crippa, M.; Brauer, M.; Martin, R.V. A global anthropogenic emission inventory of atmospheric pollutants from sector- and fuel-specific sources (1970–2017): An application of the Community Emissions Data System (CEDS). Earth Syst. Sci. Data 2020, 12, 3413–3442. [Google Scholar] [CrossRef]
  15. Greenstone, M.; He, G.; Li, S.; Zou, E. China’s war on pollution: Evidence from the first 5 years. Rev. Environ. Econ. Policy 2021, 15, 281–299. [Google Scholar] [CrossRef]
  16. Crippa, M.; Solazzo, E.; Huang, G.; Guizzardi, D.; Koffi, E.; Muntean, M.; Schieberle, C.; Friedrich, R.; Janssens-Maenhout, G. High resolution temporal profiles in the emissions database for global atmospheric research. Sci. Data 2020, 7, 121–137. [Google Scholar] [CrossRef]
  17. Burkart, K.; Canário, P.; Breitner, S.; Schneider, A.; Scherber, K.; Andrade, H.; Alcoforado, M.J.; Endlicher, W. Interactive short-term effects of equivalent temperature and air pollution on human mortality in Berlin and Lisbon. Environ. Pollut. 2013, 183, 54–63. [Google Scholar] [CrossRef]
  18. Xue, J.; Zhao, S.; Zhao, L.; Zhu, D.; Mao, S. Cooperative governance of inter-provincial air pollution based on a black–scholes options pricing model. J. Clean. Prod. 2020, 277, 124031. [Google Scholar] [CrossRef]
  19. Albahri, A.S.; Al-Obaidi, J.R.; Zaidan, A.A.; Albahri, O.S.; Hamid, R.A.; Zaidan, B.B.; Alamoodi, A.H.; Hashim, M. Multi-biological laboratory examination framework for the prioritization of patients with COVID-19 based on integrated AHP and group VIKOR methods. Int. J. Inf. Tech. Decis. 2020, 19, 1247–1269. [Google Scholar] [CrossRef]
  20. Tomson, M.; Kumar, P.; Barwise, Y.; Perez, P.; Forehead, H.; French, K.; Morawska, L.; Watts, J.F. Green infrastructure for air quality improvement in street canyons. Environ. Int. 2021, 146, 106288. [Google Scholar] [CrossRef]
  21. Zou, B.; Li, S.; Lin, Y.; Wang, B.; Cao, S.; Zhao, X.; Peng, F.; Qin, N.; Guo, Q.; Feng, H.; et al. Efforts in reducing air pollution exposure risk in China: State versus individuals. Environ. Int. 2020, 137, 105504. [Google Scholar] [CrossRef] [PubMed]
  22. Song, Y.; Li, Z.; Yang, T.; Xia, Q. Does the expansion of the joint prevention and control area improve the air quality? Evidence from China’s Jing-Jin-Ji region and surrounding areas. Sci. Total Environ. 2020, 706, 136034. [Google Scholar] [CrossRef] [PubMed]
  23. Zhou, Z.; Tan, Z.; Yu, X.; Zhang, R.; Wei, Y.M.; Zhang, M.; Sun, H.; Meng, J.; Mi, Z. The health benefits and economic effects of cooperative PM2.5 control: A cost-effectiveness game model. J. Clean. Prod. 2019, 228, 1572–1585. [Google Scholar] [CrossRef]
  24. Li, H.; Ma, Y.; Duan, F.; He, K.; Zhu, L.; Huang, T.; Kimoto, T.; Ma, X.; Ma, T.; Xu, L.; et al. Typical winter haze pollution in Zibo, an industrial city in China: Characteristics, secondary formation, and regional contribution. Environ. Pollut. 2017, 229, 339–349. [Google Scholar] [CrossRef] [PubMed]
  25. Wang, H.; Zhao, L. A joint prevention and control mechanism for air pollution in the Beijing-Tianjin-Hebei region in China based on long-term and massive data mining of pollutant concentration. Atmos. Environ. 2018, 174, 25–42. [Google Scholar] [CrossRef]
  26. Liu, K.; Lin, B. Research on influencing factors of environmental pollution in China: A spatial econometric analysis. J. Clean. Prod. 2019, 206, 356–364. [Google Scholar] [CrossRef]
  27. Brimblecombe, P.; Zong, H. Citizen perception of APEC blue and air pollution management. Atmos. Environ. 2019, 214, 116853. [Google Scholar] [CrossRef]
  28. Dong, J.; Liu, P.; Song, H.; Yang, D.; Yang, J.; Song, G.; Miao, C.; Zhang, J.; Zhang, L. Effects of anthropogenic precursor emissions and meteorological conditions on PM2.5 concentrations over the “2 + 26” cities of Northern China. Environ. Pollut. 2022, 315, 120392. [Google Scholar] [CrossRef]
  29. Sawut, R.; Li, Y.; Kasimu, A.; Ablat, X. Examining the spatially varying effects of climatic and environmental pollution factors on the NDVI based on their spatially heterogeneous relationships in Bohai Rim, China. J. Hydrol. 2023, 617, 128815. [Google Scholar] [CrossRef]
  30. Ariken, M.; Zhang, F.; Chan, N.W.; Kung, H. Coupling coordination analysis and spatio-temporal heterogeneity between urbanization and eco-environment along the Silk Road Economic Belt in China. Ecol. Indic. 2021, 121, 107014. [Google Scholar] [CrossRef]
  31. Zhang, N.; Ma, F.; Qin, C.; Li, Y. Spatiotemporal trends in PM2.5 levels from 2013 to 2017 and regional demarcations for joint prevention and control of atmospheric pollution in China. Chemosphere 2018, 210, 1176–1184. [Google Scholar] [CrossRef]
  32. Xie, Y.; Zhao, L.; Xue, J.; Gao, O.; Li, H.; Jiang, R.; Qiu, X.; Zhang, S. Methods for defining the scopes and priorities for joint prevention and control of air pollution regions based on data-mining technologies. J. Clean. Prod. 2018, 185, 912–921. [Google Scholar] [CrossRef]
  33. Dong, Z.; Wang, S.; Xing, J.; Chang, X.; Ding, D.; Zheng, H. Regional transport in Beijing-Tianjin-Hebei region and its changes during 2014–2017: The impacts of meteorology and emission reduction. Sci. Total Environ. 2020, 737, 139792. [Google Scholar] [CrossRef]
  34. He, J.; Zhang, L.; Yao, Z.; Che, H.; Gong, S.; Wang, M.; Zhao, M.; Jing, B. Source apportionment of particulate matter based on numerical simulation during a severe pollution period in Tangshan, North China. Environ. Pollut. 2020, 266, 115133. [Google Scholar] [CrossRef]
  35. Sun, L.; Du, J.; Li, Y.F. A new method for dividing the scopes and priorities of air pollution control based on environmental justice. Environ. Sci. Pollut. Res. 2021, 28, 12858–12869. [Google Scholar] [CrossRef]
  36. Wu, D.; Xu, Y.; Zhang, S. Will joint regional air pollution control be more cost-effective? An empirical study of China’s Beijing–Tianjin–Hebei region. J. Environ. Manag. 2015, 149, 27–36. [Google Scholar] [CrossRef]
  37. Cai, S.; Wang, Y.; Zhao, B.; Wang, S.; Chang, X.; Hao, J. The impact of the “air pollution prevention and control action plan” on PM2.5 concentrations in Jing-Jin-Ji region during 2012–2020. Sci. Total Environ. 2017, 580, 197–209. [Google Scholar] [CrossRef]
  38. Zhang, M.; Liu, X.; Sun, X.; Wang, W. The influence of multiple environmental regulations on haze pollution: Evidence from China. Atmos. Pollut. Res. 2020, 11, 170–179. [Google Scholar] [CrossRef]
  39. Ormanova, G.; Karaca, F.; Kononova, N. Analysis of the impacts of atmospheric circulation patterns on the regional air quality over the geographical center of the Eurasian continent. Atmos. Res. 2020, 237, 104858. [Google Scholar] [CrossRef]
  40. Acheampong, A.O. Modelling for insight: Does financial development improve environmental quality? Energ. Econ. 2019, 83, 156–179. [Google Scholar] [CrossRef]
  41. Yang, Y.; Zhao, L.; Wang, C.; Xue, J. Towards more effective air pollution governance strategies in China: A systematic review of the literature. J. Clean. Prod. 2021, 297, 126724. [Google Scholar] [CrossRef]
  42. Govender, P.; Sivakumar, V. Application of k-means and hierarchical clustering techniques for analysis of air pollution: A review (1980–2019). Atmos. Pollut. Res. 2020, 11, 40–56. [Google Scholar] [CrossRef]
  43. Xue, J.; Xu, Y.; Zhao, L.; Wang, C.; Rasool, Z.; Ni, M.; Wang, Q.; Li, D. Air pollution option pricing model based on AQI. Atmos. Pollut. Res. 2019, 10, 665–674. [Google Scholar] [CrossRef]
  44. Yang, P.; Liu, X.; Xu, G. A dynamic weighted TOPSIS method for identifying influential nodes in complex networks. Mod. Phys. Lett. B 2018, 32, 1850216. [Google Scholar] [CrossRef]
  45. Tang, S.; Yan, Q.; Shi, W.; Wang, X.; Sun, X.; Yu, P.; Wu, J.; Xiao, Y. Measuring the impact of air pollution on respiratory infection risk in China. Environ. Pollut. 2018, 232, 477–486. [Google Scholar] [CrossRef] [PubMed]
  46. Maji, K.; Ye, W.; Arora, M.; Nagendra, S. PM2.5-related health and economic loss assessment for 338 Chinese cities. Environ. Int. 2018, 121, 392–403. [Google Scholar] [CrossRef]
  47. Wang, J.; Zhang, L.; Niu, X.; Liu, Z. Effects of PM2.5 on health and economic loss: Evidence from Beijing-Tianjin-Hebei region of China. J. Clean. Prod. 2020, 257, 120605. [Google Scholar] [CrossRef]
  48. Yang, P.; Xu, G.; Chen, H. Multi-attribute ranking method for identifying key nodes in complex networks based on GRA. Int. J. Mod. Phys. B 2018, 32, 1850363. [Google Scholar] [CrossRef]
  49. Choi, J.; Park, R.J.; Lee, H.M.; Lee, S.; Jo, D.S.; Jeong, J.I.; Henze, D.K.; Woo, J.H.; Ban, S.J.; Lee, M.D.; et al. Impacts of local vs. trans-boundary emissions from different sectors on PM2.5 exposure in South Korea during the KORUS-AQ campaign. Atmos. Environ. 2019, 203, 196–205. [Google Scholar] [CrossRef]
  50. Upadhyay, A.; Dey, S.; Chowdhury, S.; Goyal, P. Expected health benefits from mitigation of emissions from major anthropogenic PM2.5 sources in India: Statistics at state level. Environ. Pollut. 2018, 242, 1817–1826. [Google Scholar] [CrossRef]
  51. Ashayeri, M.; Abbasabadi, N.; Heidarinejad, M.; Stephens, B. Predicting intraurban PM2.5 concentrations using enhanced machine learning approaches and incorporating human activity patterns. Environ. Res. 2021, 196, 110423. [Google Scholar] [CrossRef]
  52. Morillas, H.; Marcaida, I.; Maguregui, M.; Upasen, S.; Gallego-Cartagena, E.; Madariaga, J.M. Identification of metals and metalloids as hazardous elements in PM2.5 and PM10 collected in a coastal environment affected by diffuse contamination. J. Clean. Prod. 2019, 226, 369–378. [Google Scholar] [CrossRef]
  53. Kim, E.; Kim, B.U.; Kim, H.C.; Kim, S. Direct and cross impacts of upwind emission control on downwind PM2.5 under various NH3 conditions in Northeast Asia. Environ. Pollut. 2021, 268, 115794. [Google Scholar] [CrossRef]
Figure 1. The flowchart of the proposed two-stage hybrid model.
Atmosphere 14 00891 g001
Figure 2. Locations of the 27 cities in the YRD region (left) and Air Quality Index (AQI) map of China on 18 November 2020 (right).
Atmosphere 14 00891 g002
Figure 3. Hierarchical cluster analysis in the YRD region based on the Pearson correlation coefficients at the inter-city PM 2.5 levels.
Atmosphere 14 00891 g003
Figure 4. Silhouette coefficient values (blue line) and trend curve (red line) for the 11 cluster partitions revealed by the dendrogram in Figure 3.
Atmosphere 14 00891 g004
Figure 5. The optimal cluster partition (marked by dotted line).
Atmosphere 14 00891 g005
Figure 6. The scopes of air pollution control for the YRD region. Note that the white area located in the center is Taihu Lake.
Atmosphere 14 00891 g006
Figure 7. The priorities of JPCAP sub-regions for the YRD region. Note that the white area located in the center is Taihu Lake.
Atmosphere 14 00891 g007
Table 1. Results of the indicator I m .
Sub-Region S l Area I m
R10.80396,2730.3172
R21.00567,2400.2773
R31.02532,6050.1371
R40.97934,2010.1374
R50.15913,3980.0087
Table 2. Results of the indicator H d .
Sub-RegionPopulation D e n D a c H d
R197,462,7001012.3645.449946,011
R230,947,800459.0335.225116,171
R319,146,200587.2232.587319,135
R45,806,700169.7850.11518508
R54,079,000304.4558.851617,917
Table 3. Results of the indicator P c .
Sub-Region S d D a c P c
R126.504945.44990.5833
R220.820235.22510.5911
R317.086032.58730.5243
R429.871950.11510.5961
R531.331658.85160.5324
Table 4. Results of JPCAP prioritization.
Sub-RegionSRQPriority
R11.50390.91761.00001
R21.05370.49040.36482
R30.98000.48090.31463
R40.84460.46840.22714
R50.61780.35730.00005
Disclaimer/Publisher’s Note: The statements, opinions and data contained in all publications are solely those of the individual author(s) and contributor(s) and not of MDPI and/or the editor(s). MDPI and/or the editor(s) disclaim responsibility for any injury to people or property resulting from any ideas, methods, instructions or products referred to in the content.

