
Study of Landfalling Typhoon Potential Maximum Gale Forecasting in South China
Abstract
:1. Introduction
2. Data and Methods
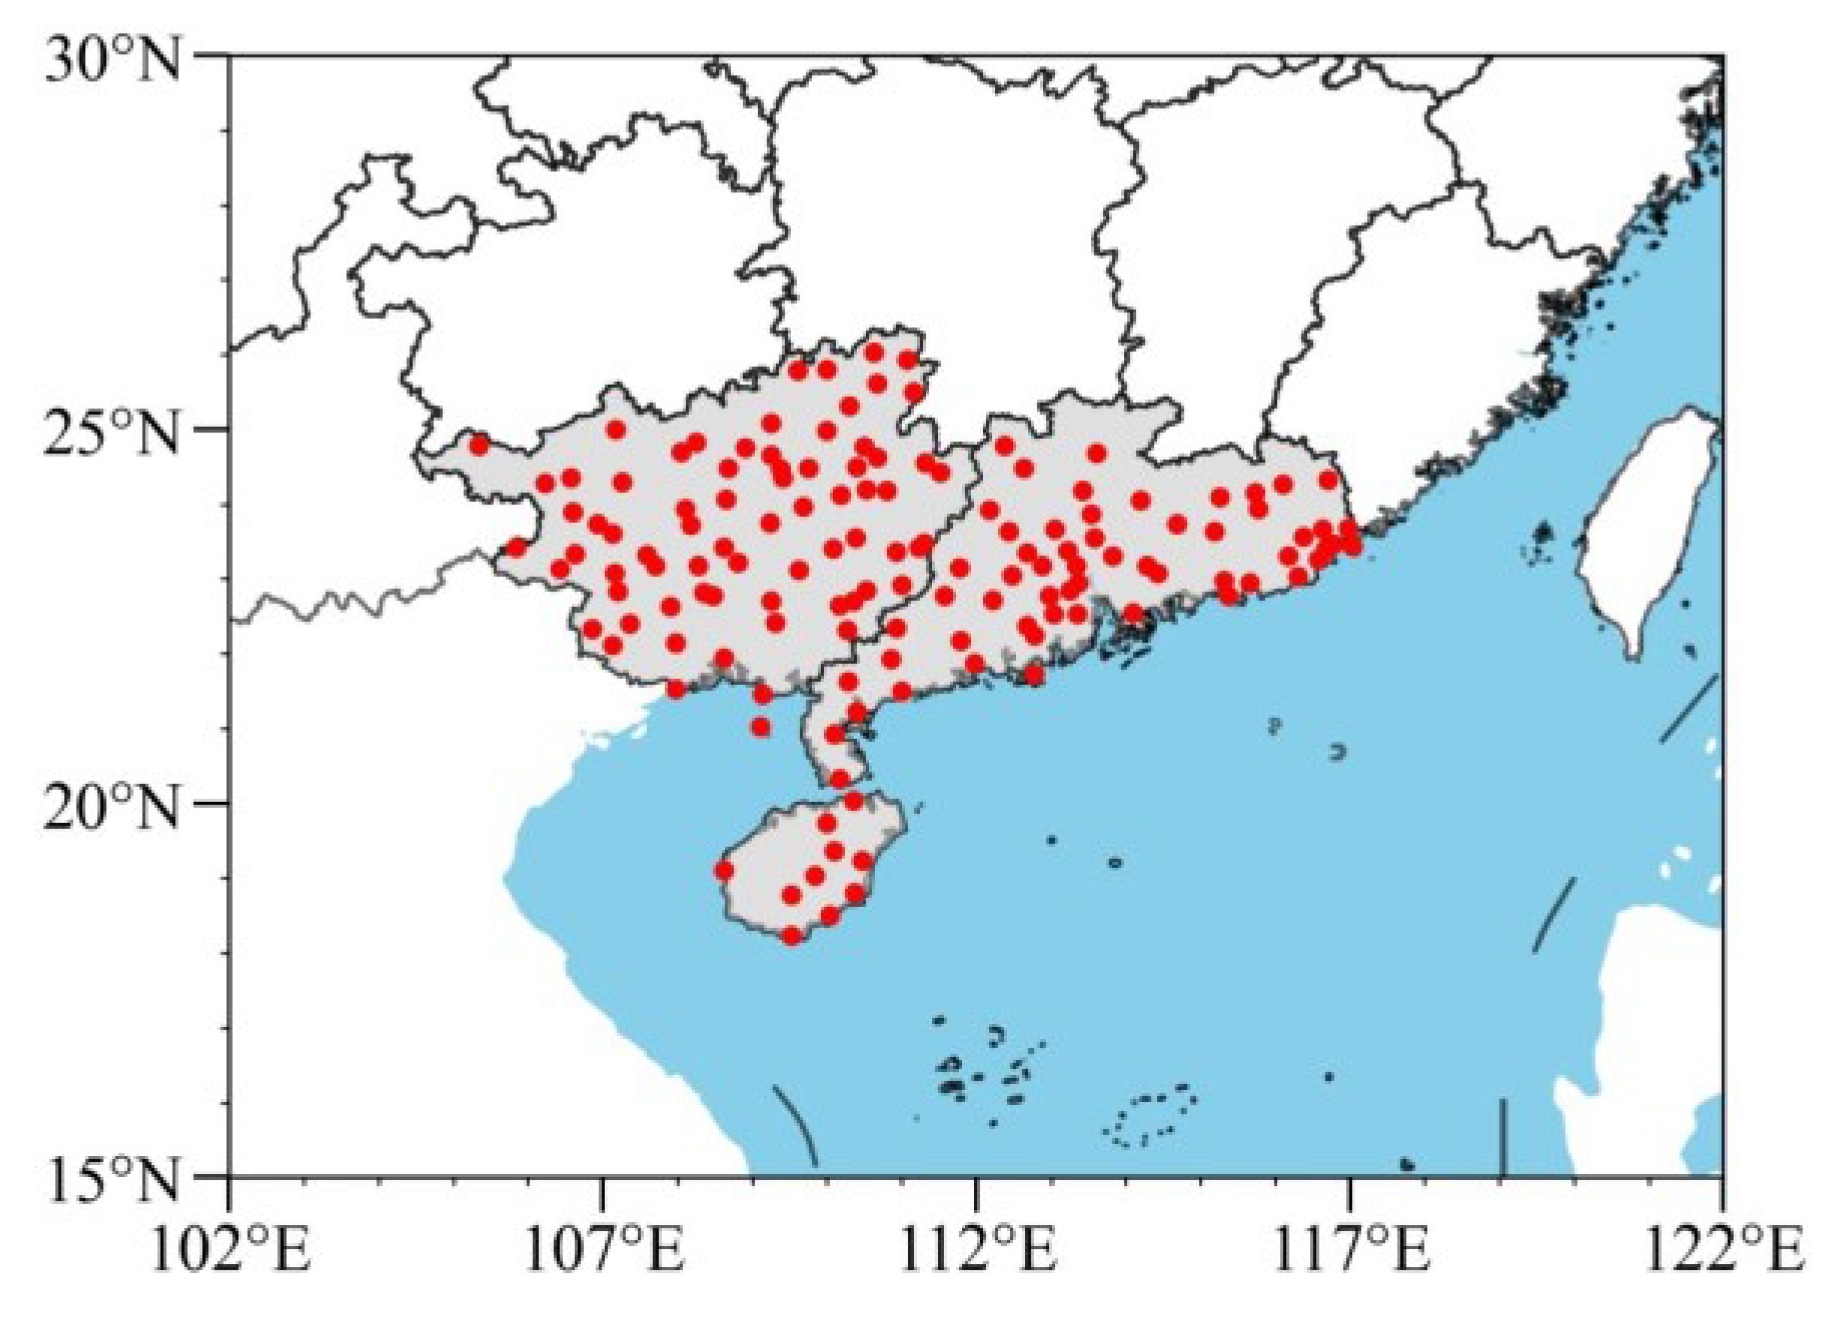
2.1. Data
2.2. Methods
2.2.1. DSAEF_LTG Model
2.2.2. Two Improvements of the DSAEF_LTG Model
2.2.3. Other Methods
- (1)
- TC track similarity area index (TSAI)
- (2)
- Evaluation methods
3. Experimental Design
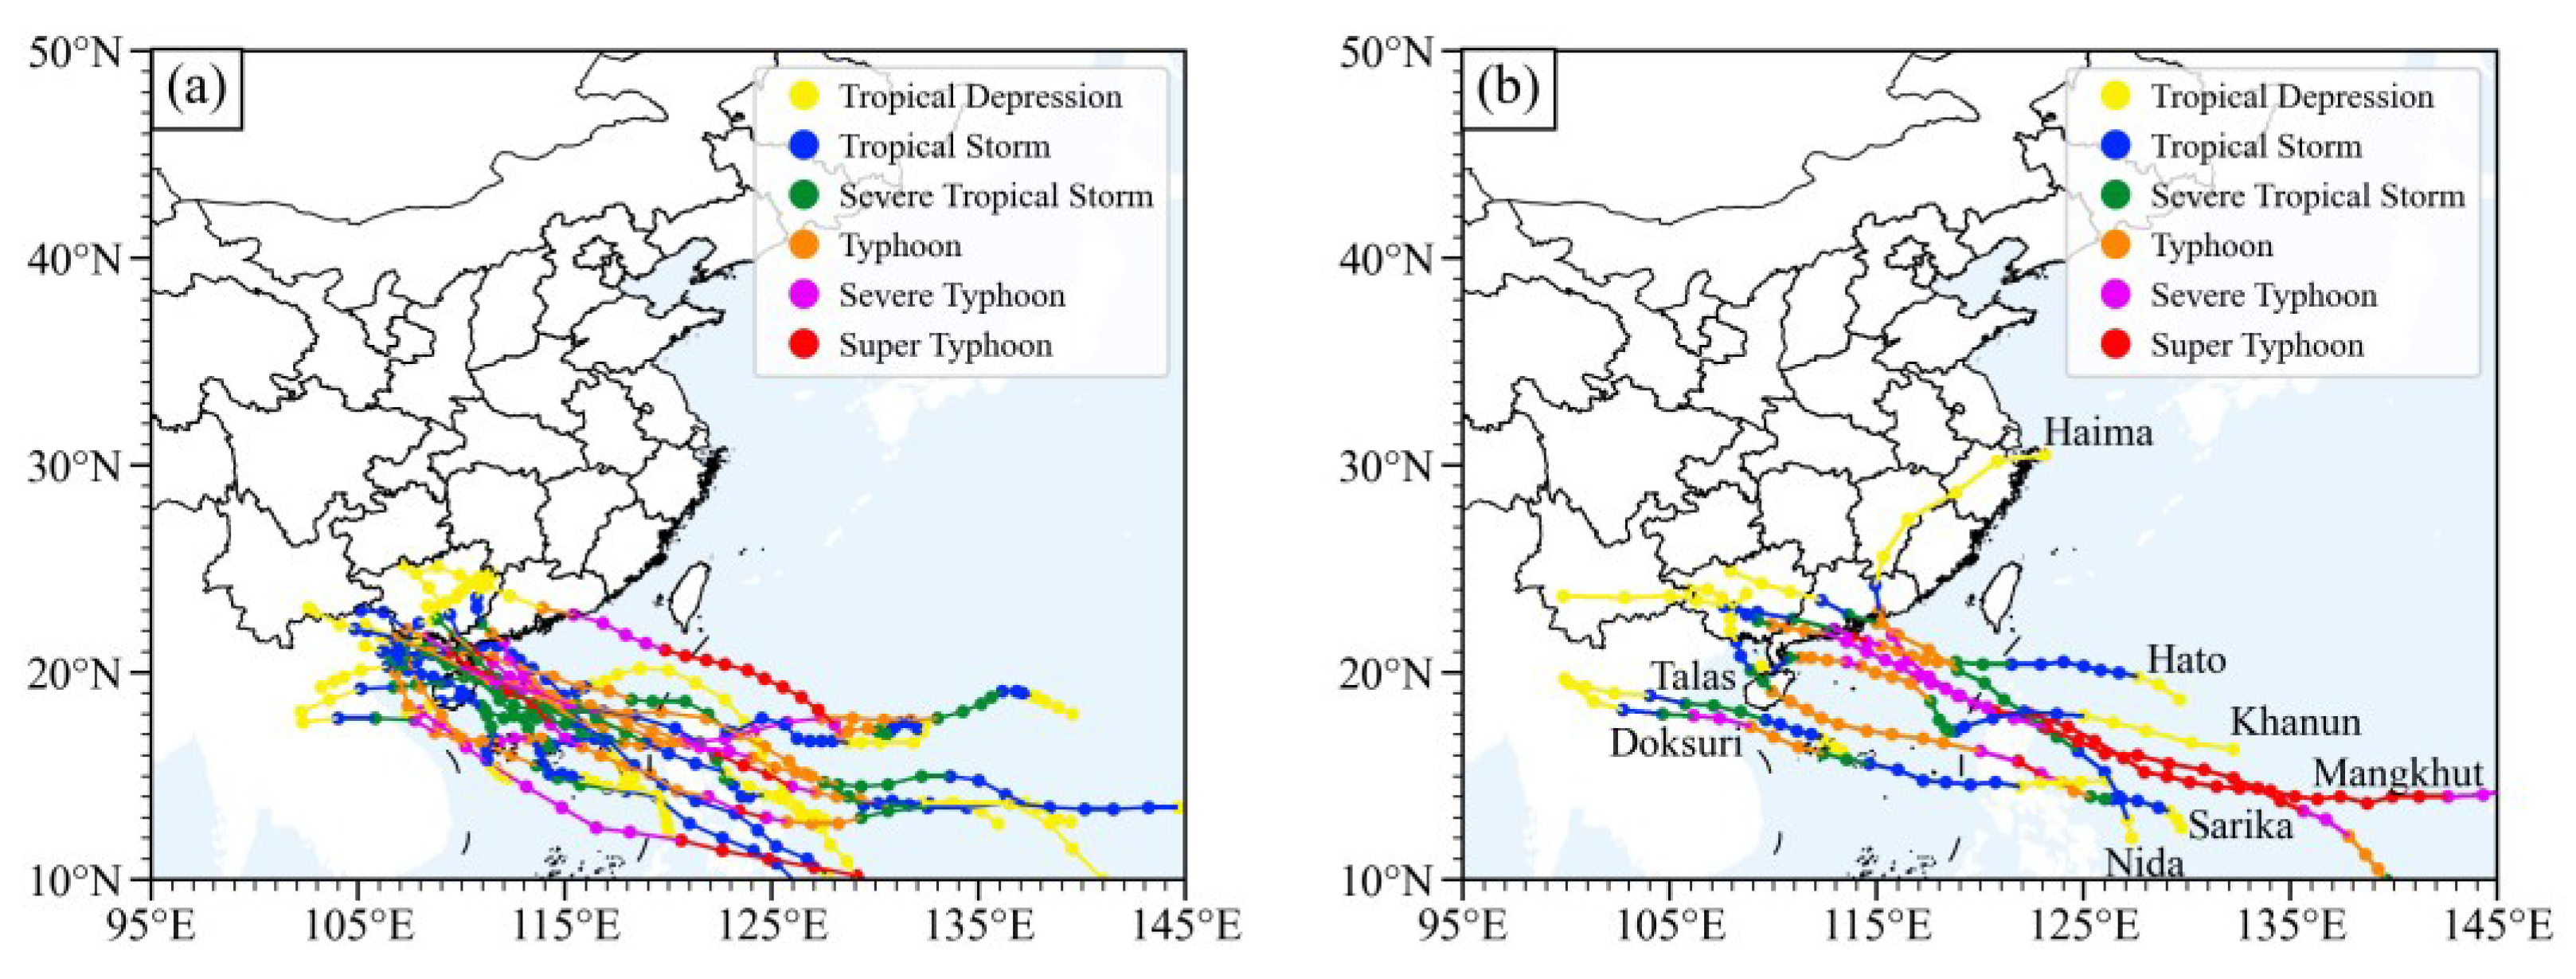
3.1. Target TC
3.2. Improvement Experiments
4. Results
5. Conclusions
- (1)
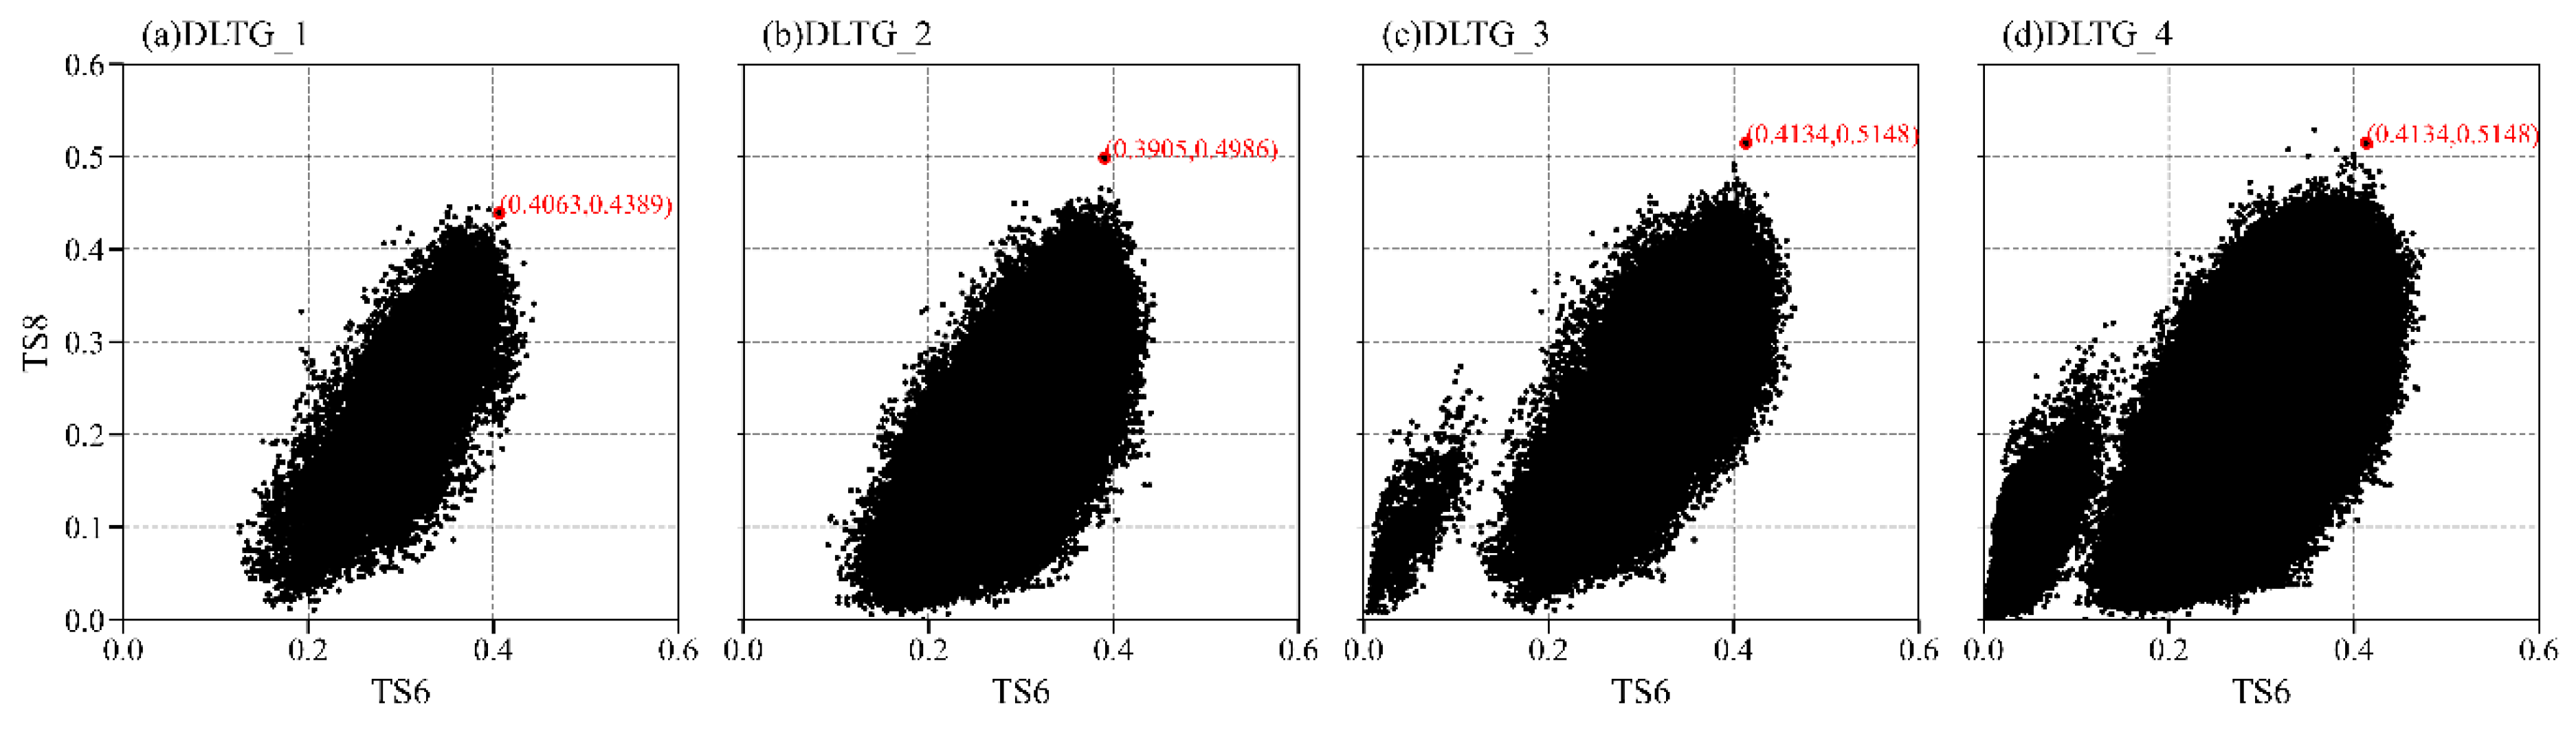
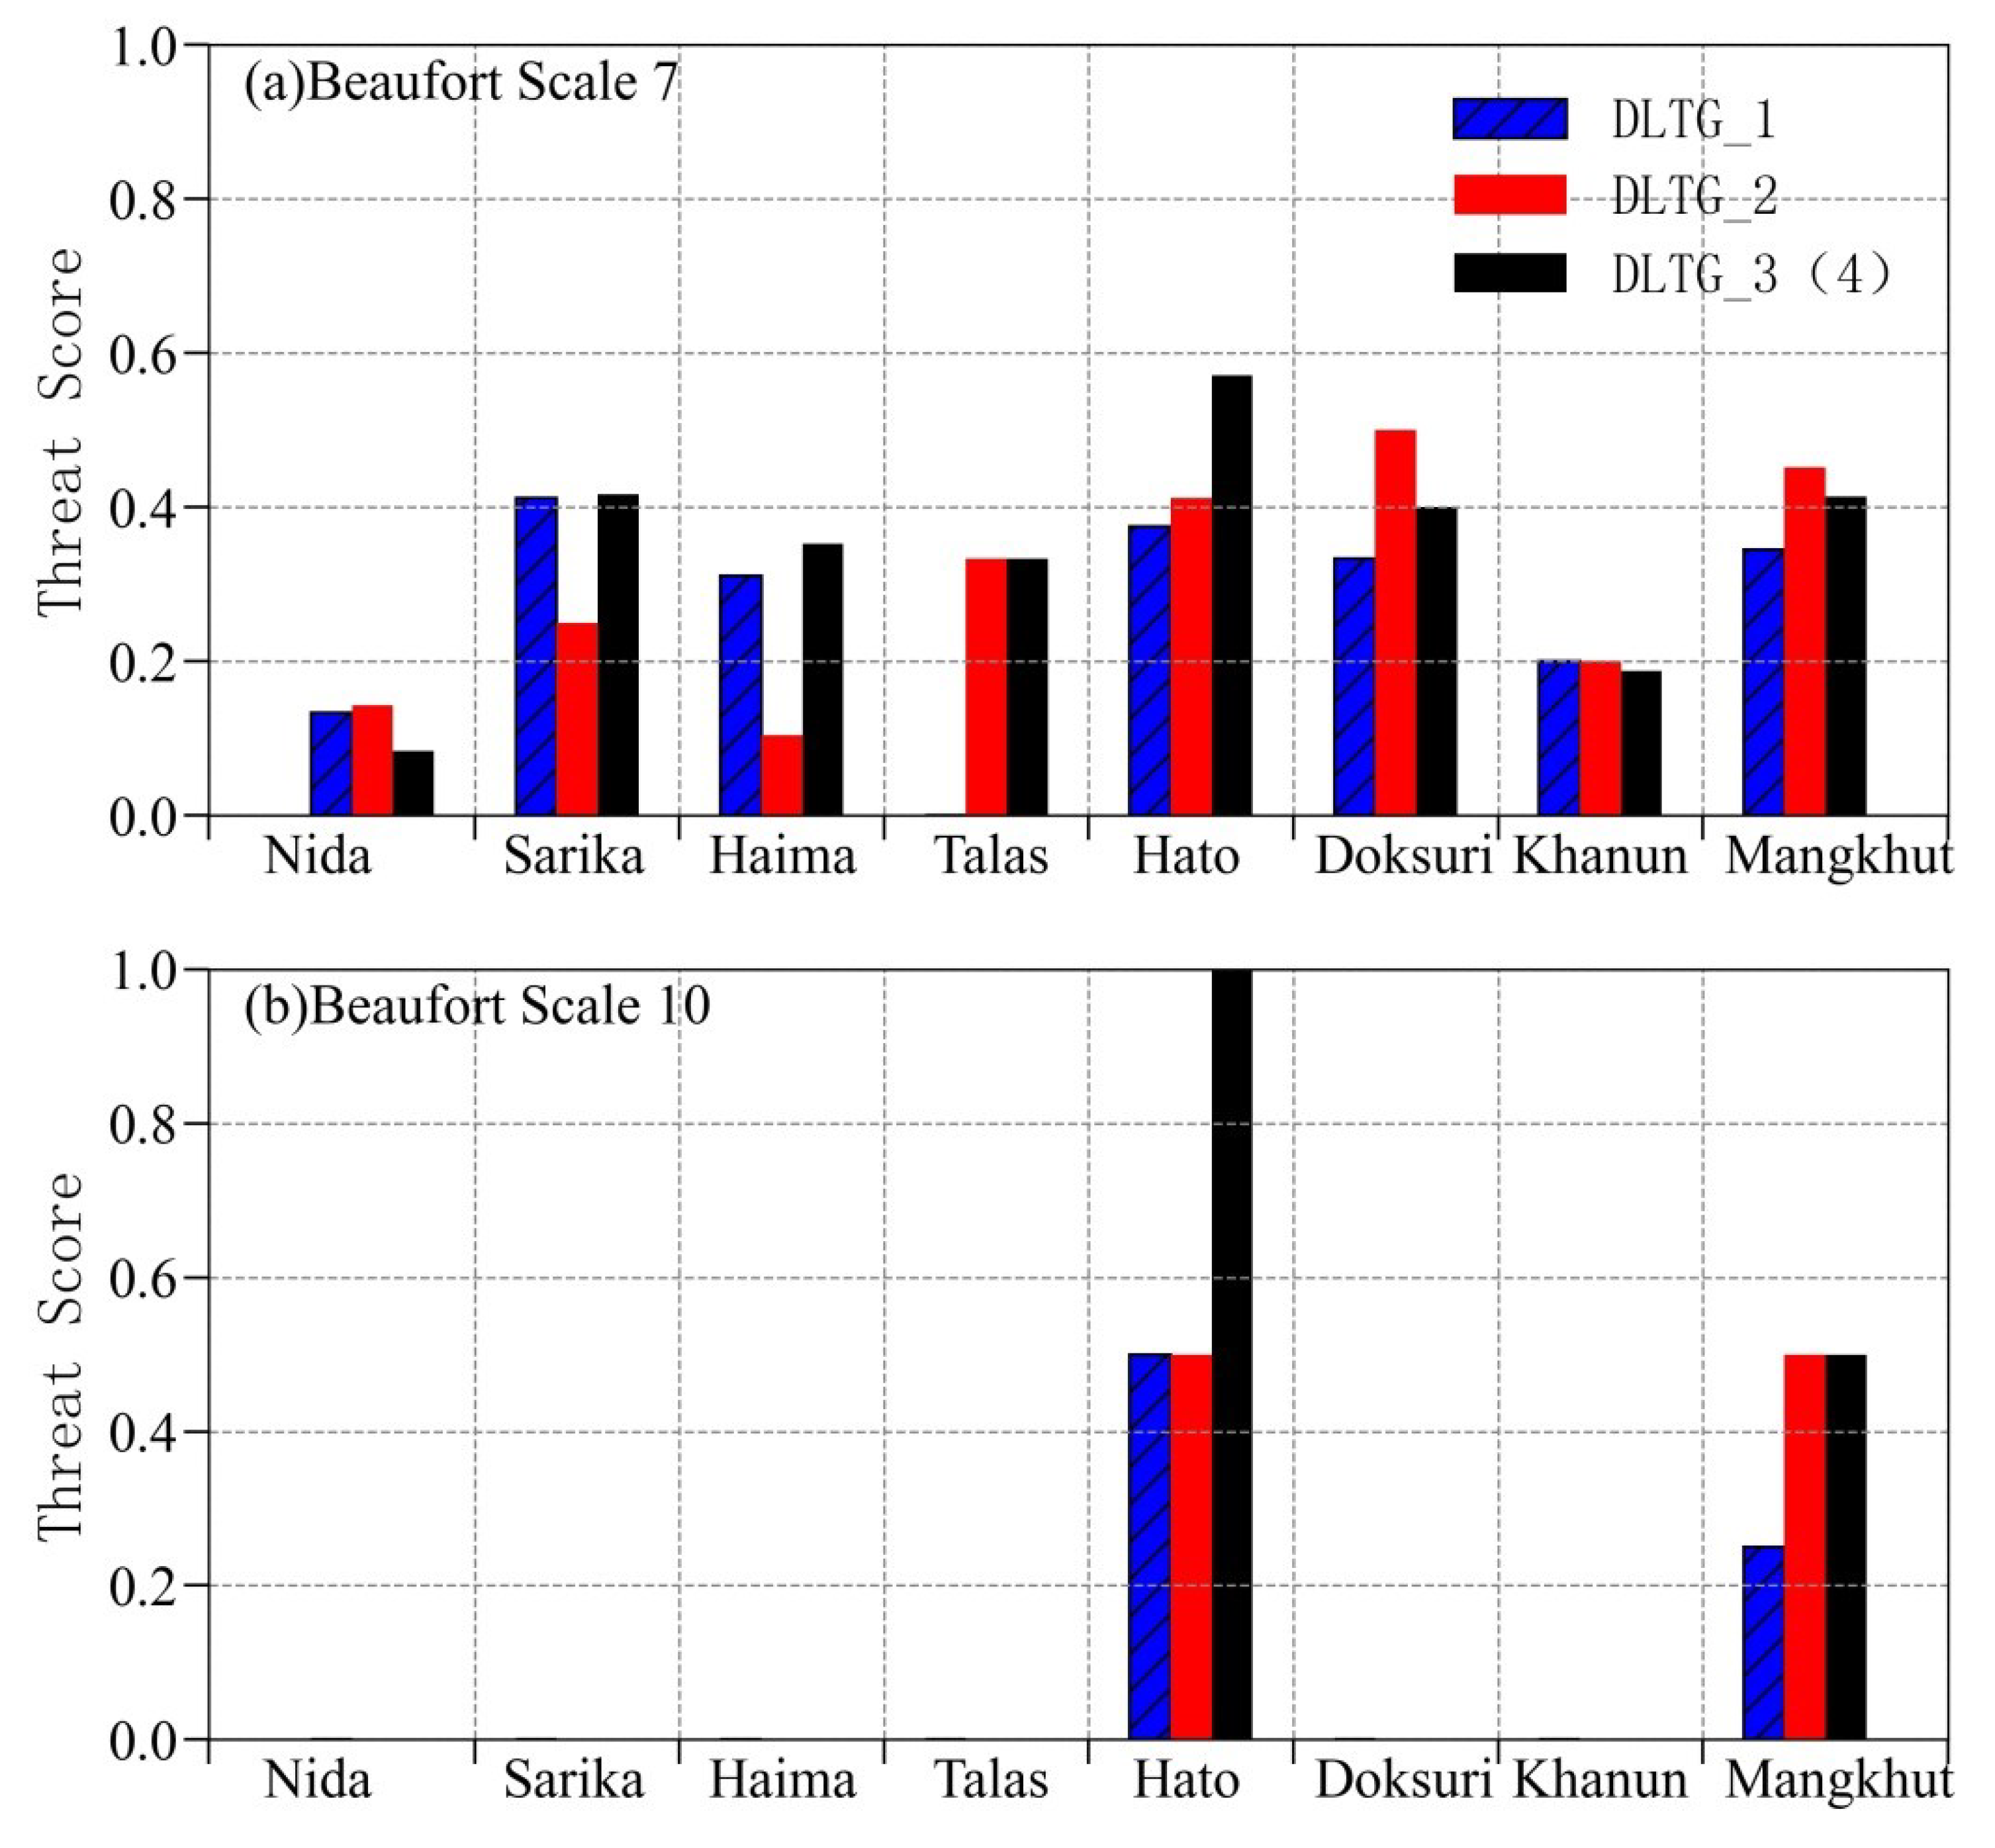
- The training sample experiments showed that the introduction of TC translation speed similarity or improvement of the ensemble scheme separately showed marked improvement effects, and that the TSsum reached 0.8891 and 0.9284, respectively, which exceeded that of the unimproved model (0.8451). However, when the two improvements were introduced simultaneously, the introduction of the TC translation speed similarity did not produce an improvement effect. Further analysis of the model parameter values revealed that introduction of TC translation speed similarity has no impact on the results when simultaneously adding a new ensemble scheme in the DSAEF_LTG model.
- (2)
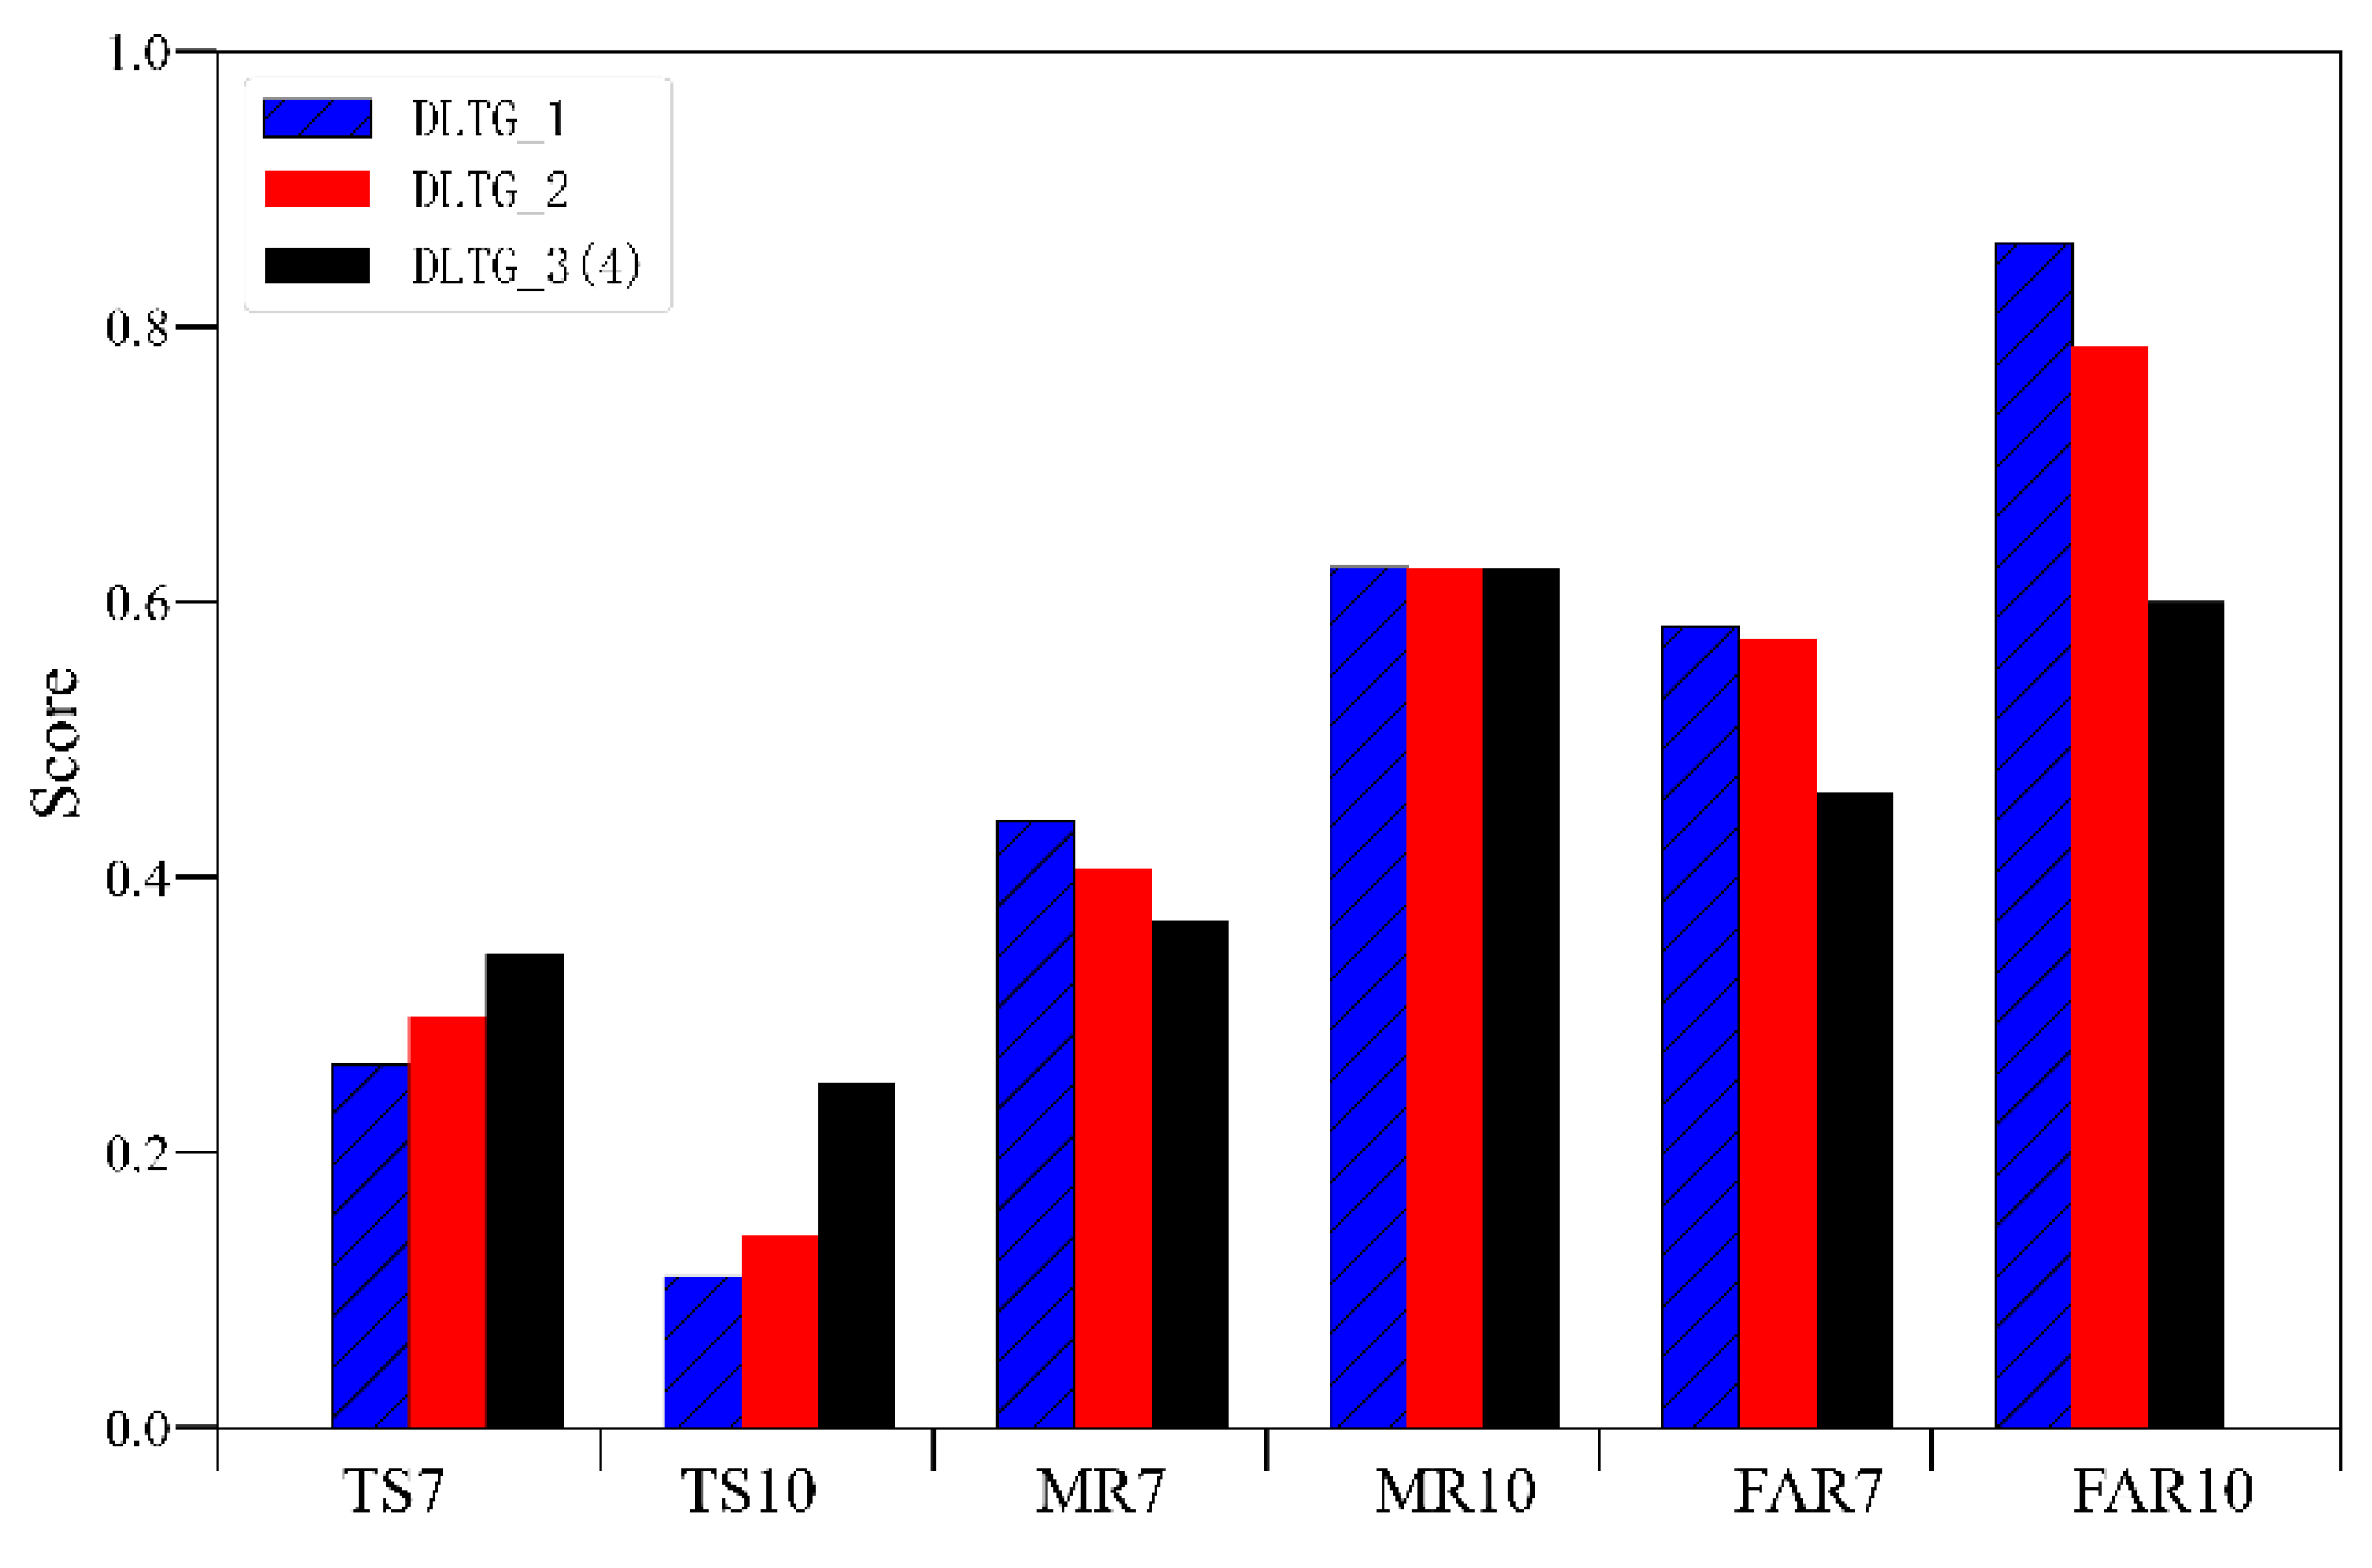
- The results of the independent sample forecasting experiments showed that the DSAEF_LTG model can be improved by adding TC translation speed similarity or by adding new ensemble schemes; the TS was 0.26 for a gale greater than Beaufort Scale 7, and the TS was 0.34 when adding a new ensemble scheme, i.e., 31% higher than that of the original ensemble scheme. Moreover, the FAR and MR scores also decreased in comparison with those realized before the model improvement. The improved TS of the ensemble scheme reached 0.25, i.e., 127% higher than the TS of the original scheme, reflecting the advantage of the model for extreme typhoon gales greater than Beaufort Scale 10.
- (3)
- The results of the independent sample forecasting experiments also showed that when TC translation speed similarity and new ensemble schemes are introduced simultaneously, the forecasting effect is the same as that when the TC translation speed similarity is introduced alone, with a TS of 0.35 (0.25) for a gale at the threshold of Beaufort Scale 7 (Beaufort Scale 10). The ensemble scheme improvement can adjust the gale fields of multiple similar TCs, which makes the forecast results more reasonable. This potentially explains why the model performs better after the ensemble scheme improvement than after the introduction of TC translation speed similarity.
Author Contributions
Funding
Institutional Review Board Statement
Informed Consent Statement
Data Availability Statement
Acknowledgments
Conflicts of Interest
References
- Peduzzi, P.; Chatenoux, B.; Dao, H.; Bono, A.D. Global trends in tropical cyclone risk. Nat. Clim. Change 2012, 2, 289–294. [Google Scholar] [CrossRef]
- Chen, L.S.; Duan, Y.H.; Song, Y.L.; Xu, Y.L. Typhoon Forecast and Its Disasters; Meteorological Press: Beijing, China, 2012; pp. 2–3. [Google Scholar]
- Powell, M.D.; Reinhold, T.A. Predicting Tropical Cyclone Destructive Potential by Integrated Kinetic Energy According to the Powell/Reinhold Scale. U.S. Patent US7970543 B2, 28 June 2011. [Google Scholar]
- Zhou, Y.; Ni, Z.; Vetter, P.A.; Xu, H.; Hong, B.; Wang, H.; Li, W.; Liu, S. Model Simulation of StormSurge in the Northwestern South China Sea Under the Impact of Sea Level Rise: A Case Study of Super Typhoon Rammasun (2014). Front. Mar. Sci. 2022, 9, 878301. [Google Scholar] [CrossRef]
- Wang, Q.; Xu, Y.; Wei, N.; Wang, S.; Hu, H. Forecast and service performance on rapidly intensification process of Typhoons Rammasun (2014) and Hato (2017). Trop. Cyclone Res. Rev. 2019, 8, 18–26. [Google Scholar] [CrossRef]
- Zhang, X.; Wei, N.; Wang, Q. Influence of radiation diurnal variation on the rapid intensification process of super Typhoon Rammasun (1409) in the South China Sea. Front. Earth Sci. 2022, 10, 940418. [Google Scholar] [CrossRef]
- Zhang, L.J.; Li, L.S. People-oriented emergency response mechanism—An example of the emergency work when typhoon Meranti stroked Xiamen. Int. J. Disaster Risk Reduct. 2019, 38, 101185. [Google Scholar] [CrossRef]
- Yu, J.H.; Xue, H.X.; Song, J. Tropical cyclone potential hazard in Southeast China and its linkage with the East Asian westerly jet. Asia-Pac. J. Atmos. Sci. 2017, 53, 295–304. [Google Scholar] [CrossRef]
- Qian, C.H.; Duan, Y.H.; Ma, S.H. The current status and future development of China operational typhoon forecasting and its key technologies. Adv. Meteorol. Sci. Technol. 2012, 2, 36–43. [Google Scholar]
- Dong, Y. Distribution Characteristics and Forecast of Tropical Cyclone Gales in Guangxi; Guangxi Normal University: Guangxi, China, 2014. [Google Scholar]
- Messner, J.W.; Mayr, G.J. Probabilistic Forecasts Using Analogs in the Idealized Lorenz96 Setting. Mon. Weather Rev. 2011, 139, 1960–1971. [Google Scholar] [CrossRef]
- Wilson, K.A.; Gallo, B.T.; Skinner, P.; Clark, A.; Heinselman, P.; Choate, J.J. Analysis of End User Access of Warn-on-Forecast Guidance Products during an Experimental Forecasting Task. Weather Clim. Soc. 2021, 13, 859–874. [Google Scholar] [CrossRef]
- Knaff, J.A.; Sampson, C.R.; Demaria, M. Statistical Tropical Cyclone Wind Radii Prediction Using Climatology and Persistence. Weather Forecast. 2007, 22, 781–791. [Google Scholar] [CrossRef]
- Knaff, J.A.; Sampson, C.R.; Musgravek, D. Statistical tropical cyclone wind radii prediction using climatology and persistence: Updates for the western north Pacific. Weather Forecast. 2018, 33, 1093–1098. [Google Scholar] [CrossRef]
- Demaria, M.; Knaff, J.A.; Knabb, R. A new method for estimating tropical cyclone wind speed probabilities. Weather Forecast. 2009, 24, 1573–1591. [Google Scholar] [CrossRef]
- DeMaria, M.; Knaff, J.; Brennan, M.J.; Brown, D.P.; Knabb, R.D.; DeMaria, R.T.; Schumacher, A.B.; Lauer, C.A.; Roberts, D.P.; Sampson, C.R.; et al. Improvements to the operational tropical cyclone wind speed probability model. Weather Forecast. 2013, 28, 586–602. [Google Scholar] [CrossRef]
- Hoover, B.T.; Morgan, M.C. Validation of a Tropical Cyclone Steering Response Function with a Barotropic Adjoint Model. J. Atmos. Sci. 2010, 67, 1806–1816. [Google Scholar] [CrossRef]
- Maini, P.; Kumar, A.; Rathore, L.S.; Singh, S.V. Forecasting Maximum and Minimum Temperatures by Statistical Interpretation of Numerical Weather Prediction Model Output. Weather Forecast. 2003, 18, 938–952. [Google Scholar] [CrossRef]
- Sun, J.B.; Qian, Y.Z.; Chen, P.Y.; Zheng, Z.; Le, Y.L. The Artificial Neural Network Method on the Station Wind in Landfall Typhoon. Meteorol. Mon. 2010, 36, 81–86. [Google Scholar]
- Ren, F.; Ding, C.; Zhang, D.-L.; Chen, D.; Ren, H.-L.; Qiu, W. A Dynamical-Statistical-Analog Ensemble Forecast Model: Theory and An Application to Heavy Rainfall Forecasts of Landfalling Tropical Cyclones. Mon. Weather Rev. 2020, 148, 1503–1517. [Google Scholar] [CrossRef]
- Li, L.F.; Ren, F.M.; Liu, C.X.; Wan, Q.L. Overview of research advances in forecasting of typhoon gale. J. Mar. Meteorol. 2022, 42, 50. [Google Scholar] [CrossRef]
- Titley, H.A.; Cloke, H.L.; Harrigan, S.; Pappenberger, F.; Prudhomme, C.; Robbins, J.C.; Stephens, E.M.; Zsoter, E. Key Factors Influencing the Severity of Fluvial Flood Hazard from Tropical Cyclones. J. Hydrometeor. 2021, 22, 1801–1817. [Google Scholar] [CrossRef]
- Chen, Y.X. DSAEF_LTG Model Study of Dynamic-Statistical Similar Ensemble Prediction of Landfall Tropical Cyclone Gales; Chengdu University of Information Technology: Chengdu, China, 2020. [Google Scholar]
- Li, L.; Chen, Y.; Ren, F.; Liu, C.; Ma, Y.; Wan, Q. Experiment with the dynamical–statistical–analog ensemble forecast model for landfalling typhoon gale over South China. Front. Earth Sci. 2022, 10, 987001. [Google Scholar] [CrossRef]
- Jia, L.; Ren, F.; Ding, C.; Jia, Z.; Wang, M.; Chen, Y.; Feng, T. Improvement of the ensemble methods in the dynamical-statistical-analog ensemble forecast model for landfalling typhoon precipitation. J. Meteorol. Soc. Jpn. 2022, 100, 575–592. [Google Scholar] [CrossRef]
- Su, Z.; Ma, Y.; Jia, L.; Ren, F.; Ding, C. Application of the improved dynamical–Statistical–Analog ensemble forecast model for landfalling typhoon precipitation in Fujian province. Front. Earth Sci. 2023, 10, 1018851. [Google Scholar] [CrossRef]
- Ren, F.; Qiu, W.; Ding, C.; Jiang, X.; Wu, L.; Xu, Y.; Duan, Y. An objective track similarity index and its preliminary application to predicting precipitation of landfalling tropical cyclones. Weather Forecast. 2018, 33, 1725–1742. [Google Scholar] [CrossRef]
- Rupp, J.A.; Lander, M.A. A Technique for Estimating Recurrence Intervals of Tropical Cyclone-Related High Winds in the Tropics: Results for Guam. J. Appl. Meteor. Climatol. 1996, 35, 627–637. [Google Scholar] [CrossRef]
- Cao, C.; Wang, Z.D.; Zheng, F. Causal Analysis of Strong Wind Weather in Zhejiang Induced by Typhoon Morakot. Meteorol. Sci. Technol. 2013, 41, 1109–1115. [Google Scholar] [CrossRef]
- Jia, L.; Ren, F.; Ding, C.; Wang, M. Improving the Forecast Performance of the DSAEF_LTP Model by Incorporating TC Translation Speed Similarity. Weather Forecast. 2022, 37, 1855–1865. [Google Scholar] [CrossRef]
- Ma, Y.Q.; Ren, F.M.; Jia, L.; Ding, C.C. Experiments with the improved dynamical-statistical-analog ensemble forecast model for landfalling typhoon precipitation over South China. J. Trop. Meteorol. 2022, 28, 139–153. [Google Scholar] [CrossRef]
- Sampson, C.R.; Knaff, J.A. A consensus forecast for tropical cyclone gale wind radii. Weather Forecast. 2015, 30, 1397–1403. [Google Scholar] [CrossRef]
- Zhao, Y.J.; Li, J.N.; Dong, X.H.; Feng, Y. The impact of resolution on the simulation results of typhoon hato (2017). J. Trop. Meteorol. 2019, 35, 629–643. [Google Scholar] [CrossRef]


| Parameters | Description | Number of Values |
|---|---|---|
| Initial time (P1) | 1: 1200 UTC on Day1, 2: 0000 UTC on Day 1, 3: 1200 UTC on Day 2, 4: 0000 UTC on Day 2. (Day 1: the day of TC gale occurring on land; Day 2: the day before Day 1) | 2 × 2 = 4 |
| Similarity region (P2) | Parameters of TSAI with rectangular shape. Its southeastern vertex (C) can be the TC position at 00, 12, 24, 36, or 48 h prior to the initial time, and the northwestern vertex (A) can be the TC position at 00, 06, or 12 h prior to the maximum lead time. The 1st–15th values are combinations of C and A. The 16th–20th values are based on the first value, i.e., C represents the TC position at the initial time and A represents the TC position at the maximum lead time. Further details regarding the 16th–20th values can be found in Jia et al. [25] | 20 |
| Threshold of the segmentation ratio of a latitude extreme point (P3) | A parameter of the TSAI: 1: 0.1; 2: 0.2; 3: 0.3 | 3 |
| The overlapping percentage threshold of two TC tracks (P4) | A parameter of the TSAI: 1: 0.9; 2: 0.8; 3: 0.7; 4: 0.6; 5: 0.5; 6: 0.4 | 6 |
| Seasonal similarity (P5) | A parameter indicating the TC landfall date: 1: entire year; 2: May–November; 3: July–September 4: same landfall month as the target TC 5: within 15 d of the target TC landfall time | 5 |
| Intensity similarity (P6) | Four categories 1: average intensity on the first windy day 2: maximum intensity on the first windy day 3: average intensity on all windy days 4: maximum intensity on all windy days Five levels 1: all grades; 2: the target TC intensity is the same grade or above that of the historical TC; 3: the same grade or below; 4: only the same grade 5: the same grade or one grade different | 4 × 5 |
| Translation speed similarity (P7) | Three categories: 1. Average TC translation speed on the first windy day * 2. Minimum average TC translation speed on the first windy day * 3. Average TC translation speed on all windy days * Two Grading criteria: 1. mean *; 2. K-means clustering* Five levels: 1: all grades *; 2: the target TC intensity is the same grade or above that of the historical TC *; 3: the same grade or below *; 4: only the same grade *; 5: the same grade or one grade different * | 30 |
| Number (N) of analog TCs screened for the ensemble forecast (P8) | 1–10 for 1, 2, …, 10, respectively | 10 |
| Ensemble forecast scheme (P9) | 1. mean; 2. maximum; 3. 90th percentile *; 4. fuse *; 5. probability matching mean (PM) *; 6. equal difference-weighted mean (ED-WM) *; 7. TSAI-weighted mean (TSAI-WM) *. | 7 |
| Total number of schemes | 4 × 20 × 3 × 6 × 5 × 20 × 30 × 10 × 7 | 302,400,000 |
| TC Translation Speed Indicator | Single-Station TC Potential Maximum Gale |
|---|---|
| Average TC translation speed on the first windy day | 0.1254 * |
| Maximum TC translation speed on the first windy day | 0.0531 |
| Minimum TC translation speed on the first windy day | 0.1809 * |
| Average TC translation speed on all windy days | 0.1201 * |
| Maximum TC translation speed on all windy days | 0.1077 |
| Minimum TC translation speed on all windy days | 0.0390 |
| TC Translation Speed Indicator | Method | TC Translation Speed of Cut-Off Points (km/h) | ||||||
|---|---|---|---|---|---|---|---|---|
| First day’s average translation speed | Average segmentation | 12.79 | 14.82 | 17.16 | 19.63 | 22.38 | 26.37 | 12.79 |
| K-means clustering | 6.83 | 11.42 | 15.51 | 19.39 | 23.7 | 28.34 | 6.83 | |
| First day’s minimum translation speed | Average segmentation | 8.19 | 11.38 | 12.97 | 15.19 | 18.02 | 20.48 | 8.19 |
| K-means clustering | 1.73 | 5.82 | 10.22 | 15.47 | 21.63 | 28.02 | 1.73 | |
| Average translation speed | Average segmentation | 12.95 | 15.22 | 17.96 | 20.1 | 22.7 | 26.08 | 12.95 |
| K-means clustering | 11.79 | 16.18 | 20.1 | 23.62 | 27.61 | 31.9 | 11.79 | |
| Name | Computational Procedure |
|---|---|
| 90th percentile | For each station, (i), i = 1, 2, …, m, where m is sorted from minimum to maximum. (r) is the potential maximum gale ranked r. d = 1 + (m − 1)0.9 The integer part of d is r and the decimal part is f |
| Fuse | Calculation rules of forecast potential maximum gale at each station: If , ; If the 90% percentile values of (i) ≥ 17.2 , = the 90% percentile value of (i); If the 75% percentile values of (i) ≥ 17.2 , = the 75% percentile value of (i); If the median value of (i) ≥ 10.8, = the median value of (i); If none of the above happen, = the 10% percentile value. |
| Probability matching mean (PM) | All gale data for m members of 140 stations were arranged in ascending order (containing gale data for 140 × n stations). The data were divided into 140 equal parts from 140 × n maximum to minimum, and the median of each part was retained as glm(k), k = 1, 2, …, 140. Averaging Gale(i) over each station, ranking the average values from largest to smallest, and recording the position of each value in the series. Corresponding to the glm(k) of each station based on the k of each station, and glm(k) is the predicted gale for this station, gale = glm(k). |
| Equal difference-weighted mean (ED-WM) | The weight of the potential maximum gale for the selected similar TC, the similarity rank I of which is: (i = 1, 2, …, m), = . |
| TSAI-weighted mean (TSAI-WM). | , the weight of the potential maximum gale for the selected similar TC whose similarity rank i is: , = . |
| Parameter | DLTG_1 | DLTG_2 | DLTG_3 | DLTG_4 |
|---|---|---|---|---|
| Initial time | 3 (1200 UTC on Day 2) | 3 | 3 | 3 |
| Similarity region | 20: shifting A1B1C1D1 (the 16th scheme) to the right by the distance of D1D2 and downward by the distance of B1B2. | 16 or 17: (ABCD: the first kind of parameter value of the original similarity region; and A1B1C1D1, a square with side length of 2000 km, is the 16th scheme of the similarity region. The midpoints of B and B1 are taken as B2, and the midpoints of D and D1 are taken as D2, which makes A2B2C2D2 the 17th scheme. | 17 | 17 |
| Threshold of the segmentation ratio of a latitudinal extreme point | 2 (0.2) | 3 (0.3) | 2 (0.2) | 2 (0.2) |
| Overlapping percentage threshold of two TC tracks | 5 (0.5) | 6 (0.4) | 6 (0.4) | 6 (0.4) |
| Seasonal similarity | 1 (entire year) | 1 or 2 (entire year or May–November) | 1 or 2 | 1 or 2 |
| Intensity similarity | 2/5 (maximum intensity on the first windy day/the same grade or one grade different) | 1/5 (1: average intensity on the first windy day/the same grade or one grade different) | 1/5 | 1/5 |
| Translation speed similarity | / | 2/2/3 (minimum TC translation speed on the first windy day/K-means clustering/the same grade or below) | / | 1–3/1–2/1 (all categories/all grading criteria/all levels) |
| Number (N) of analog TCs screened for the ensemble forecast | 2 | 2 | 3 | 3 |
| Ensemble forecast scheme | 2 (maximum) | 2 | 7 (probability matching mean (PM)) | 7 |
Disclaimer/Publisher’s Note: The statements, opinions and data contained in all publications are solely those of the individual author(s) and contributor(s) and not of MDPI and/or the editor(s). MDPI and/or the editor(s) disclaim responsibility for any injury to people or property resulting from any ideas, methods, instructions or products referred to in the content. |
© 2023 by the authors. Licensee MDPI, Basel, Switzerland. This article is an open access article distributed under the terms and conditions of the Creative Commons Attribution (CC BY) license (https://creativecommons.org/licenses/by/4.0/).
Share and Cite
Su, Z.; Li, L.; Ren, F.; Zhu, J.; Liu, C.; Wan, Q.; Sun, Q.; Jia, L. Study of Landfalling Typhoon Potential Maximum Gale Forecasting in South China. Atmosphere 2023, 14, 888. https://doi.org/10.3390/atmos14050888
Su Z, Li L, Ren F, Zhu J, Liu C, Wan Q, Sun Q, Jia L. Study of Landfalling Typhoon Potential Maximum Gale Forecasting in South China. Atmosphere. 2023; 14(5):888. https://doi.org/10.3390/atmos14050888
Chicago/Turabian StyleSu, Zhizhong, Lifang Li, Fumin Ren, Jing Zhu, Chunxia Liu, Qilin Wan, Qiongbo Sun, and Li Jia. 2023. "Study of Landfalling Typhoon Potential Maximum Gale Forecasting in South China" Atmosphere 14, no. 5: 888. https://doi.org/10.3390/atmos14050888