Article

Pollution Levels for Airborne Hexavalent Chromium of PM2.5 in Typical Cities of China

1
College of Environmental Science and Engineering, Beijing Forestry University, Beijing 100083, China
2
Analytical and Testing Center, Beijing Normal University, Beijing 100875, China
3
State Key Laboratory of Environmental Criteria and Risk Assessment, Chinese Research Academy of Environmental Sciences, Beijing 100012, China
4
Institute of Carbon Neutrality, Qilu Zhongke, Jinan 250100, China
5
Key Laboratory of Cloud-Precipitation Physics and Severe Storms, Institute of Atmospheric Physics, Chinese Academy of Sciences, Beijing 100029, China
*
Author to whom correspondence should be addressed.
Atmosphere 2023, 14(2), 209; https://doi.org/10.3390/atmos14020209
Submission received: 30 November 2022 / Revised: 27 December 2022 / Accepted: 13 January 2023 / Published: 19 January 2023

Abstract

:
As a carcinogenic pollutant, hexavalent chromium (Cr(VI)) in the ambient air has serious influences on public health. Due to its instability and difficulty in chemical analysis, few studies have been conducted on the regional concentration level of environmental Cr(VI), especially in China. The pollution levels of Cr(VI) in ambient PM2.5 were determined in two sampling sites of Beijing and Qingdao from September to December 2020. The concentrations of Cr(VI) were determined using Ion Chromatography-inductively coupled plasma mass spectrometry(IC-ICP-MS), and the Cr concentrations were simultaneously analyzed by Inductively Coupled Plasma-atomic emission spectrometry(ICP-AES). The main results are as follows: (1) Based on the analysis of samples collected at the sampling sites of Beijing and Qingdao, the concentrations of Cr(VI) in PM2.5 were (0.140 ± 0.065) ng/m3 and (0.091 ± 0.073) ng/m3, respectively; (2) During the sampling period, the mean ratio of Cr(VI) to Cr was (0.0623 ± 0.0969). The ratio of Cr(VI)/Cr in Beijing and Qingdao were 0.076 ± 0.104 and 0.041 ± 0.039, respectively. In conclusion, compared with other countries, the concentration of Cr(VI) at the sampling sites of Beijing and Qingdao showed lower values. The average concentration of Cr(VI) estimated by the ratio of this research in China is lower than that in South Korea and similar to those in Canada and Australia.

1. Introduction

Chromium exists in the atmosphere, solid waste, water and soil, and presents mainly in trivalent (Cr(III)) and hexavalent oxidation states (Cr(VI)). Trivalent chromium (Cr(III)) is a trace element that the human body needs [1,2]. However, hexavalent chromium (Cr(VI)) is a carcinogenic heavy metal which has been enlisted as one of the 187 hazardous air pollutants in Clean Air Act Amendments, and is recognized as a very strong epithelial stimulant and carcinogen [3].
Most toxic airborne Cr(VI) is from anthropogenic sources (60–70%), including the metallurgical industry, the refractory production industry, chemical processes, etc. [4,5,6,7,8]. In addition, compared with coarse particles, Cr(VI) is more widely enriched in fine particles [9,10]. The fine particles can be transported over long distances. Thus, it is important to research the characteristics of Cr(VI) in fine particles [11,12,13,14]. Due to the toxicity of Cr(VI), many countries and organizations have issued limits on it. The World Health Organization (WHO) recommended the baseline limit of hexavalent chromium with an excess lifetime risk (RR values) of 1:10,000, 1:100,000 and 1:100,000 to be 2.5, 0.25, 0.0025 ng/m3, respectively [15], and the standard limit of China is 0.025 ng/m3 [16]. However, the studies on Cr(VI) in the atmosphere are limited. In addition, Cr(VI) is more unstable than Cr(III), as oxidants and reducing agents will promote its internal conversion [17,18,19,20].
Cr(VI) is a global toxic pollutant that threatens human health and the ecological environment. As early as the 1960s, many researchers began to focus on the toxicity of Cr(VI) [21,22,23]. Countries around the world have begun to monitor Cr(VI), but the monitoring started late in China, and few studies were conducted on the distribution characteristics of Cr(VI) concentration [24,25,26,27]. In order to get information on airborne Cr(VI) in China, some studies estimated the concentration of Cr(VI) by multiplying the average ratio of Cr(VI) and Cr in dust, 0.13. The studies indicated that the range of the Cr concentration in China is 3.90–321 ng/m3, and the average concentration of Cr(VI) might be as high as 10.5 ng/m3, using the average ratio of Cr(VI) to total Cr (0.13) from references to estimate, which is much higher than the suggested values of national ambient air quality standards (GB3095-2012) of 0.025 ng/m3 [28,29,30]. However, few studies have investigated the accuracy of this estimation method or the concentration of airborne Cr(VI) in China. Due to the special properties of Cr(VI) in ambient air, the accurate measurement of Cr(VI) in ambient air has the following challenges: (1) the concentration of Cr(VI) in ambient air is low; (2) the stability of Cr(VI) samples is low; (3) Cr(III) and Cr(VI) conversion may occur during the sampling and extraction of Cr(VI) [31]. Therefore, measuring Cr(VI) in ambient air requires a sensitive and reliable method with a low detection limit. The ion chromatography-inductively coupled plasma mass spectrometry (IC-ICP-MS) method is widely used in food, toys and other detection fields because of its low detection limit and stable detection performance [32]. In this study, airborne PM2.5 was collected in Beijing and Qingdao. The concentrations of total chromium and Cr(VI) in the samples were determined using Inductively Coupled Plasma-atomic emission spectrometry (ICP-AES) and Ion Chromatography-inductively coupled plasma mass spectrometry (IC-ICP-MS), respectively.

2. Materials and Methods

2.1. Sampling Collection

With the development of rapid urbanization and industrialization, the anthropogenic emission sources of airborne heavy metals include metal smelting in the iron and steel industry, vehicle exhaust, and the combustion of fossil fuels, etc., in Beijing and surrounding areas. Qingdao is an important port city and tourist city along the coast of China. The main sources of heavy metals in ambient PM2.5 are the combustion of fossil fuels, emissions from process production and vehicle exhausts in Qingdao.
Two sampling sites were selected in this research. One site (Beijing) was located at the Chinese Research Academy of Environmental Sciences in the northeast of Beijing (40.04° N, 116.41° E). Another site (Qingdao) was located at Qingdao University in the eastern sea area of Qingdao (36.04° N, 120.42° E). There were no obvious pollution sources around the two sites, which may represent the concentration levels of hexavalent chromium in the ambient air of Qingdao and Beijing.
Cellulose filters (90 mm diameter, Whatman 541, Whatman plc, USA) were selected for sampling due to their hydrophilic and tough properties [33,34,35]. Cr(VI) is relatively stable in alkaline solutions, but it is easy to transform in acidic solutions by using organic compounds and metal elements such as ferrous ions [36]. Thus, it is essential to reduce the Cr background value and maintain the alkaline state of the filters.
The following methods was used to pretreat the filters. Firstly, the filters were soaked in 10% nitric acid and then rinsed thoroughly with deionized water (pH = 6–6.5) and dried completely. The dried filters were then soaked in 0.12 M sodium bicarbonate solution and dried completely [3]. The pretreatment of the filters not only reduced the blank value of Cr, but also decreased the inter-conversion between Cr(III) and Cr(VI) during sampling [5]. Therefore, the pretreated filters can better capture and preserve airborne Cr(VI). In this research, the pretreated filters significantly lowered the filter background levels of Cr from 22.6 ng (no pretreated filters) to 0.061 ng. These filters should be kept in the freezer below −15 °C until they are needed in the field sampling.
The airborne PM2.5 were collected at both sites using medium volume air samplers (TH-150A, Wuhan Tianhong Instruments Co., Ltd., China) at a flow rate of 100 L/min. The sampling period was from September to December 2020. The PM2.5 filters were collected for 20 h, i.e., from 8:00 am to 6:00 pm (daytime sampling), and 7:00 pm to 6:00 am next day (night sampling), to determine concentration of Cr and Cr(VI) in atmospheric PM2.5.
To investigate the stability of the Cr(VI) during storage, Swift et al. spiked the Cr(VI) standard solution on a clean filter without sampling [17]. The results showed that the Cr(VI) could be kept stable for more than 11 days, and the recoveries were 102–110% during this period. However, knowledge on the field measurements of stability in Cr(VI) samples was still limited. In this research, the filters spiked with 5 ng Cr(VI) standard solutions were sampled in the ambient air, and the samples were stored at −18 °C after sampling. The results are shown in Table 1. The storage time ranged from 1 to 34 days after being sampled. For Cr(VI), almost all samples had recovery rates of Cr(VI) above 87% from Day 1 to Day 29. However, the recovery rate of Cr(VI) reduced rapidly after that, i.e., from 38% on Day 30 to 19% on Day 34. This showed that Cr(VI) samples were relatively stable at −18 °C, but should be chemically analyzed within 3 weeks.

2.2. Extraction and Analysis of Total Chromium and Hexavalent Chromium

The extraction of Cr from PM2.5 samples was carried out following the method recommended in the national standards (HJ 777-2015). The extraction solution of Cr was analyzed by ICP-AES (SPECTROARCOS EOP, SPECTRO Analytical Instruments GmbH, Germany), and the instrumental parameters are shown in Table 2. The analysis line of Cr was selected as 267.716 nm, which has high sensitivity, low background, and no interference from other elements.
The extraction of Cr(VI) was carried out under alkaline status. The samples were added with 10 mL of NaHCO3 solution (20 mmol/L, pH = 9) and extracted in an ultrasonic cleaning machine (KQ-500, Kunshan Ultrasonic Instruments Co., Ltd., Shanghai, China) for 1 h. As higher temperatures may promote the inter-conversion between Cr(III) and Cr(VI) [37,38], the ultrasonic temperature was maintained below 25 °C in this study [39].
The Cr(VI) was analyzed by IC-ICP-MS (iCAP RQ, Thermo Fisher Scientific Inc., USA; Dionex ICS-200, Thermo Fisher Scientific Inc., USA), which has high sensitivity and a wide linear detection range. A chromatographic column was needed to separate Cr(III) and Cr(VI) ions before measuring the Cr(VI). In this study, the AG7 (50 mm × 4 mm) chromatographic column was selected to quickly and effectively separate the chromium species and to meet the determination requirements. Furthermore, some key operating conditions, including the ionic concentration of the mobile phase for IC, dwell time, retention time and measurement mode for ICP-MS, were optimized. The ammonium nitrate solution (4 mL nitric acid, 5 mL concentrated ammonia water, 0.2233 g Na2EDTA, add ultrapure water to make the volume to 1 L) was used to be the IC mobile phase. The instrumental parameters are presented in Table 3.
Before determining the Cr(VI) samples, a standard working curve was established, as shown in Figure 1. The result shows that the equation is y = 9573.4x + 763.19, R2 = 0.9999, which indicates good linear correlation.

2.3. Quality Control and Quality Assurance

The quality control of the sampling process, extraction and analysis method complies with the relevant standards [40,41,42]. The precision and accuracy of the extraction and analysis methods of total chromium and hexavalent chromium were evaluated by examining the relative standard deviation (RSD), the recovery of Cr and Cr(VI), and the method detection limit (MDL) of Cr and Cr(VI). As there are no standard values of Cr(VI) and Cr in ambient air, the standard soil samples and standard solutions were used to examine the method accuracy for Cr and Cr(VI) detection. A total of 25 samples with two types were used, including 10 ng Cr standard solution and 0.1 mg standard soil, to calculate the RSD and recovery of the Cr method. At the same time, there were also 25 samples spiked with 5 ng Cr(VI) standard solution to obtain the RSD and recovery of Cr(VI) method. Table 4 summarizes the RSD and recovery of the two methods mentioned above. The MDL was estimated according to the national standards of HJ 168-2010 [40]. In this study, the MDL of Cr and Cr(VI) are 0.13 and 0.0015 ng/m3, respectively. The MDL of Cr(VI) in this study is lower than that found by Meng et al. (0.08 ng/m3) and the EPA method (0.19 ng/m3) [3,43].
The IC-ICP-MS method for the determination of Cr(VI) was optimized with a spiked recovery of 92.78% and an accuracy of 7.8%. Compared with the method of ion chromatography, the method used in this study had a shorter detection time and lower detection limit, which can accurately determine the concentration of Cr(VI) in atmospheric PM2.5.

2.4. Backward Trajectory Potential Source Contribution Functions(PSCF) and Concentration Weight Trajectory(CWT) Analysis

The air mass backward trajectories were calculated by HYSPIT-4 model in this study. This model was run with the meteorological data of the Global Data Assimilation System (GDAS) provided by the National Center for Environmental Prediction (NCEP).
In this study, the backward trajectories were calculated every 1 h at a height of 500 m above ground level (AGL) during the sampling time from September to December, 2020. The spatial range extends from 110° E to 130° E and 30° N to 55° N at 0.1° × 0.1° resolution.
The PSCF analysis is based on the results of the backward trajectory HYSPLIT model and combined with Cr(VI) concentrations at the sampling sites to obtain the possible distribution of pollution sources [44]. The PSCF area of the sampling sites was set to a rectangular grid (i, j) at a resolution of 0.1° × 0.1°, and the PSCF model is defined as:
PSCF ij = m ij n ij
where   n ij represents the total number of end points falling in the grid (i, j); m ij is designated as the number of “polluted” end points in the same grid.
Since PSCF analysis is conditional on probability estimation, the results may have higher uncertainty when the n ij is small. In order to reduce the influence of the error of PSCF due to the n ij , the weighting function W ij is introduced [45]:
W ij = { 1.00 ,   3 n ave < n ij 0.70 , 1.5 n ave < n ij 3 n ave 0.40 , n ave < n ij 1.5 n ave 0.17 , n ij n ave
where n ave is the average number of trajectory end points.
In order to reflect the contribution of the grids to the pollution levels of the sampling site, the CWT model was used. It could calculate the grid trajectories corresponding to the pollutant concentration and the trajectory residence time. The CWT model is defined as:
C ij = l = 1 M C l × τ ijl l = 1 M τ ijl · W ij
where C ij is the average weight concentration of the grid (i, j), l is the trajectory, C l is the pollutant concentration, when the trajectory l through the grid (i, j) at the sampling site, τ ijl is the residence time of trajectory l in the grid. The weighting function W ij is the same as that of the PSCF model.

3. Results

3.1. Ambient Cr(VI) Concentrations in Sampling Sites

The concentrations of Cr(VI) at the two sampling sites from September to December 2020 are shown in (Figure 2a). The concentration of Cr(VI) in PM2.5 in Beijing ranged from 0.006 ng/m3 to 0.266 ng/m3, with a median value of 0.146 ng/m3. During the sampling period, the Cr(VI) in Beijing was similar to the average level (0.2 ng/m3) in Beijing determined by Di et al. [46]. The average concentration of Cr at the observation point was close to that of 3.6 ng/m3 measured by Cui et al. [47] in Beijing in 2017. The range of Cr(VI) concentration in ambient PM2.5 in Qingdao was 0.002–0.303 ng/m3, and the median and average concentrations were 0.074 ng/m3 and (0.091 ± 0.073) ng/m3, respectively.
Due to the weather as well as the COVID-19 pandemic, there were less observation data in September in Qingdao that may not be valid for Cr(VI) concentrations for September in Qingdao. Therefore, only observation data for October, November, and December in Qingdao are shown in Figure 2b. The concentration of Cr(VI) in December at the Beijing and Qingdao sampling sites were both highest during the sampling period, as shown in (Figure 2b). The Cr(VI) concentrations in Beijing and Qingdao in December were 0.177, 0.157 ng/m3, respectively. The reason for the higher concentration in December in the Beijing and Qingdao sampling sites may the adverse meteorological conditions in winter, the coal-fired heating influence and the transportation from surrounding areas [48]. In the meantime, the stable meteorological conditions in December make it difficult for the local accumulation of air pollutants to spread.
During the observation period, the total and monthly average concentration of Cr(VI) in Beijing were higher than those in Qingdao, indicating that the contribution of Cr(VI) in PM2.5 between these two cities is different.

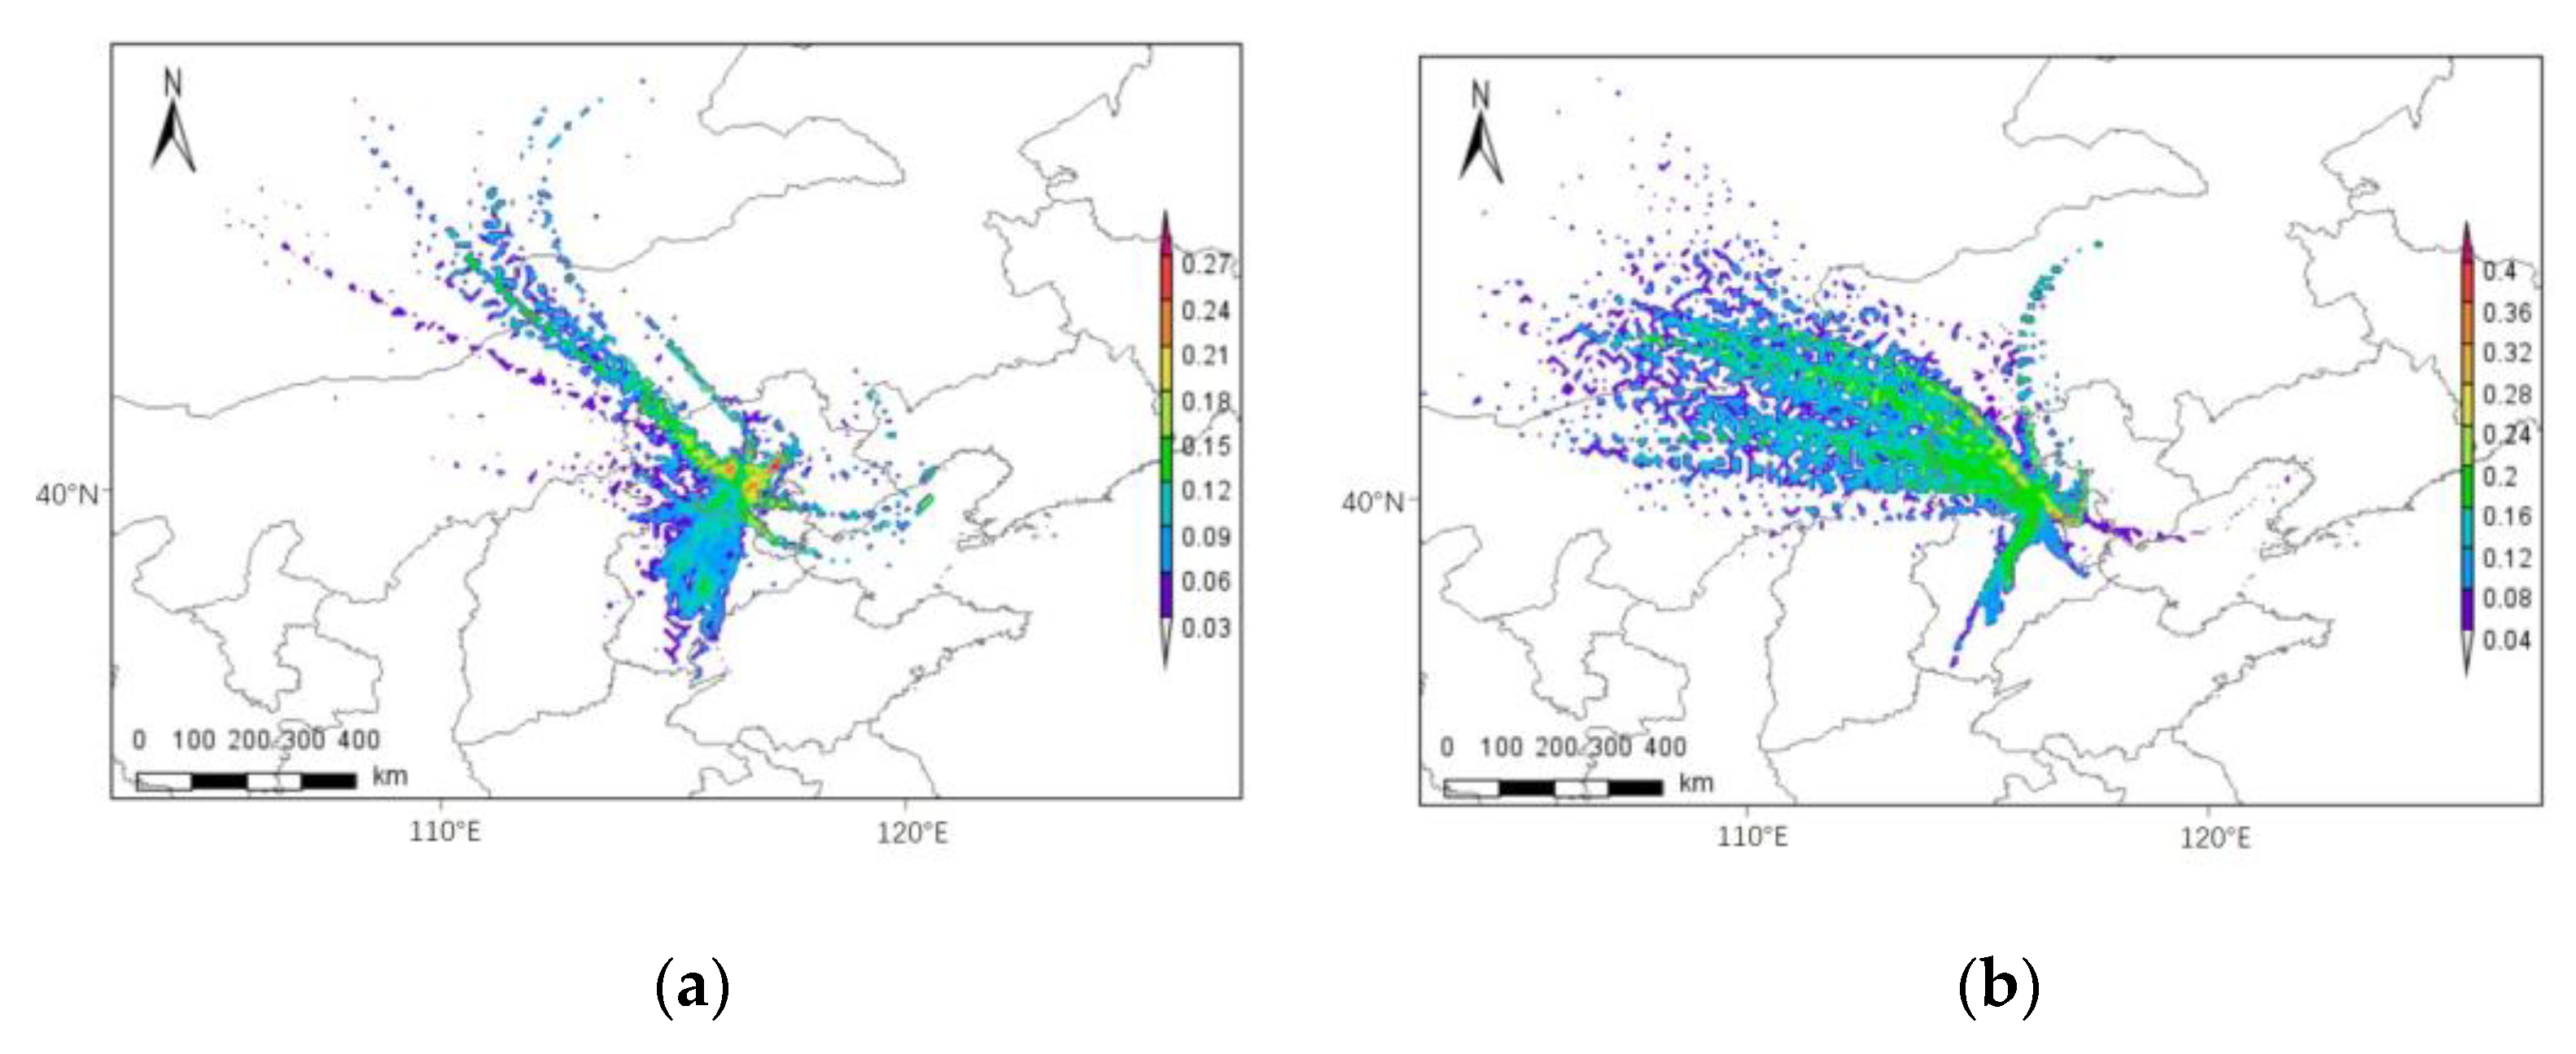
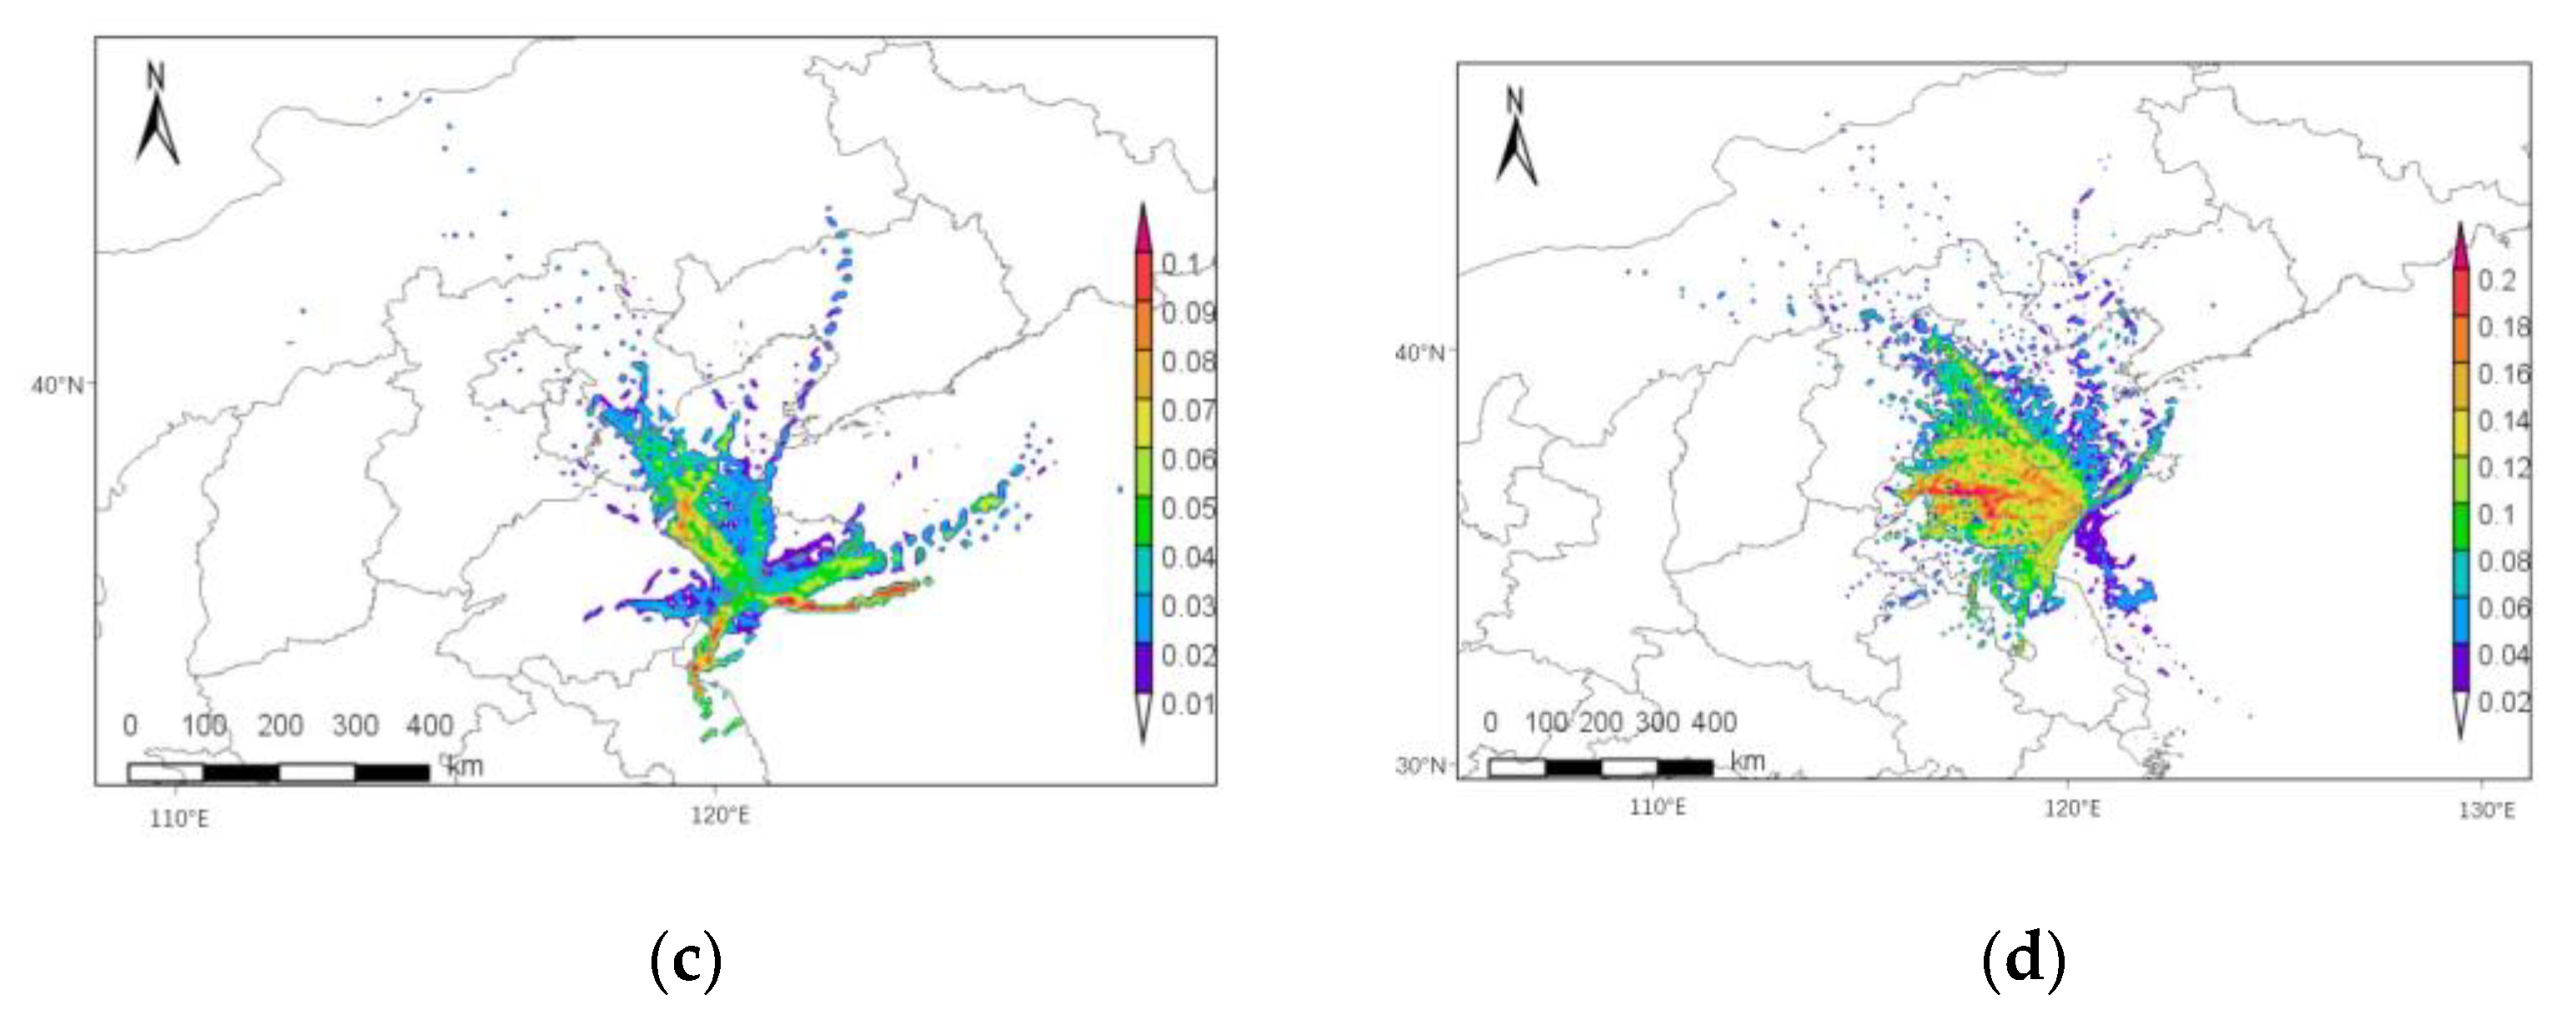
3.2. Regional Transport

The results of seasonal backward trajectory potential source contribution functions (PSCF) distribution of Beijing and Qingdao are shown in Figure 3. Due to the effects of monsoons, the temporal variation of Cr(VI) in Beijing and Qingdao were influenced significantly by different wind directions. Through computerized models, in autumn, the high-value areas of WPSCF in Beijing were in northern Beijing, northern Hebei province, central Inner Mongolia, and northern Tianjin (Figure 3a). The potential source areas of PSCF in winter were larger than those in autumn, and distribution of the main potential sources has also changed (Figure 3b). The high-values of WPSCF observed in Beijing are mainly due to local and surrounding area emissions, especially in Hebei province. The coal-fired power plants and cement production enterprises are concentrated in the southern part of Hebei province, which made a great contribution to Cr(VI) in Beijing [49].
The main potential sources of PSCF in Qingdao in autumn came from the south and northeast of the Yellow Sea, the northern area of Shandong province, and the Bohai Sea (Figure 3c). In winter, the potential source of PSCF was significantly different from those in autumn. The high-value areas of WPSCF were primarily from most of the inland Shandong province and the southern part of Jiangsu province (Figure 3d).
As the PSCF method can only analyze the proportion of pollution trajectories in a certain grid, it cannot indicate the contribution of the grid to the pollution of sampling sites. The concentration-weighted trajectory (CWT) analysis was calculated based on the backward trajectory data during the sampling period. The results of Beijing and Qingdao are presented in Figure 4. The darker the color was, the higher the level of the grid concentration was.
In autumn, the WCWT area in Beijing included central and northern Beijing, northern Hebei province, central Inner Mongolia, and northern Tianjin (Figure 4a). Among them, the WCWT value for Cr(VI) exceeds 0.21 ng/m3 in some parts of northern and central Beijing. In winter, the high-value areas of WCWT and PSCF were notably different (Figure 4b). Southern Beijing and northern Tianjin have a primary contribution to the Cr(VI) pollution. In addition, the distribution areas of local medium contribution in Beijing had sharply increased. The results indicate that the conditions of the stable boundary layer and the influence of fossil fuel burning led to a crucial contribution of Cr(VI) pollution in local sources in winter [50].
The WCWT area in autumn in Qingdao demonstrated that the Cr(VI) showed higher levels in northern Shandong province and the southern Bohai Sea (Figure 4c). The ocean air masses from the south and northeast with the WCWT value for Cr(VI) exceeding 0.09 ng/m3 were deemed as the major contributors in autumn. In winter, the WCWT contribution area was similar to the potential source area of PSCF, mainly in most areas of Shandong province (Figure 4d). The central part of Shandong province had the highest WCWT value (>0.16 ng/m3). Zibo and Jinan, which are located in the central part of Shandong Province, have many petrochemical and steel industries, which may have contributed to the Cr(VI) pollution in Qingdao; meanwhile, the emission of local petrochemical enterprises in Qingdao also contributes to some pollution [51].

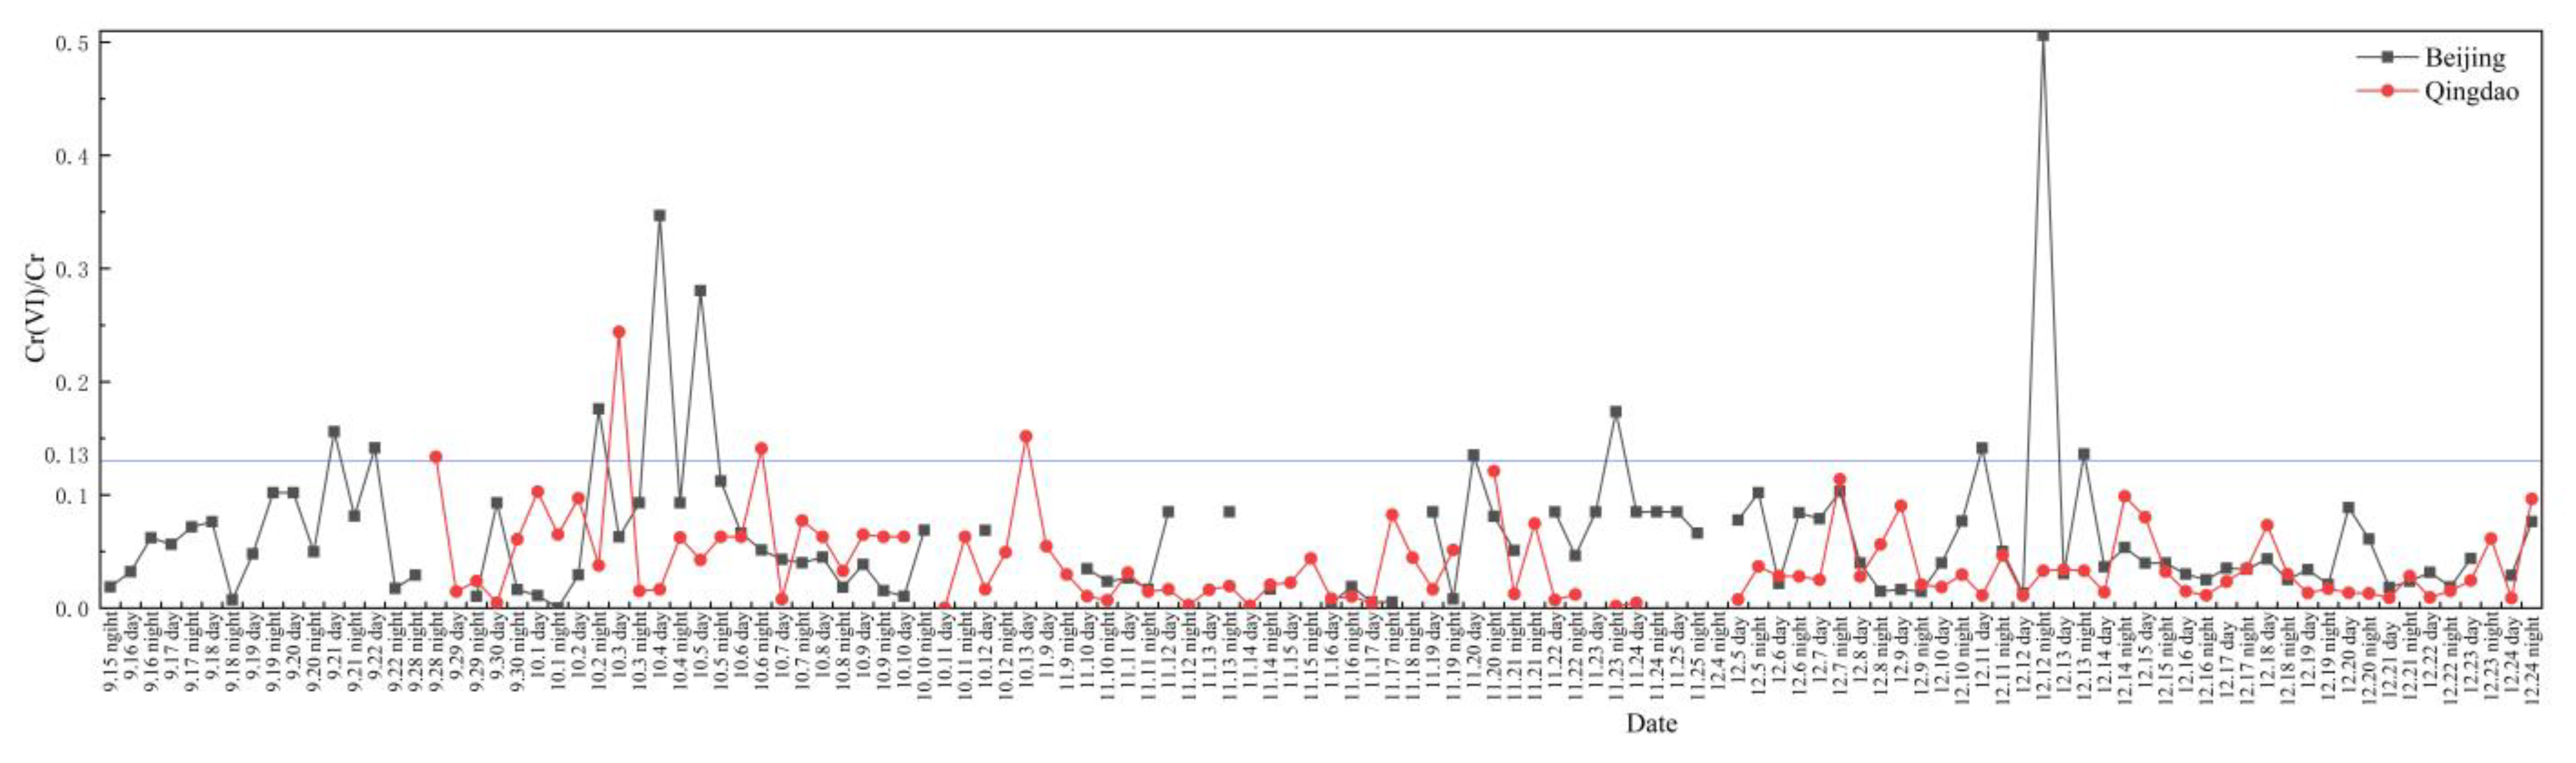
3.3. The Ratio of Cr(VI)/Cr in Ambient PM2.5

Many studies showed that the ratio of Cr(VI)/Cr in ambient air varied from 10% to 70% [52,53,54]. Many domestic studies on the regional pollution concentrations of airborne Cr(VI) are estimated by referring to the ratio of Cr(VI) to total Cr in dust (0.13) in China [30]. However, the estimation of this method needs to be verified by the on-site observation experiments.
In this study, the ratio of Cr(VI)/Cr in atmospheric PM2.5 was calculated by measuring both Cr(VI) and total Cr in Beijing and Qingdao simultaneously. During the sampling period, the daily variation of the ratio of Cr(VI)/Cr are shown in Figure 5. The average value of Cr(VI)/Cr is (0.0623 ± 0.0969), which is about one half of the ratio (0.13) in dust cited in other studies [55,56]. In Beijing, the ratio of Cr(VI)/Cr was (0.076 ± 0.104), with the range of (0.004–0.506) during the sampling periods. In Qingdao, the average values were (0.041 ± 0.039), with the range of (0.0003–0.244). The ratio in the above two cities were about 41.53% lower than the ratio in dust. The results indicate that the percentage of Cr(VI) in the total Cr in atmospheric PM2.5 is lower than that in dust. Thus, the main oxidation state of Cr in atmospheric fine particles may be Cr(III), as the concentration of Cr(III) is significantly higher than Cr(VI).

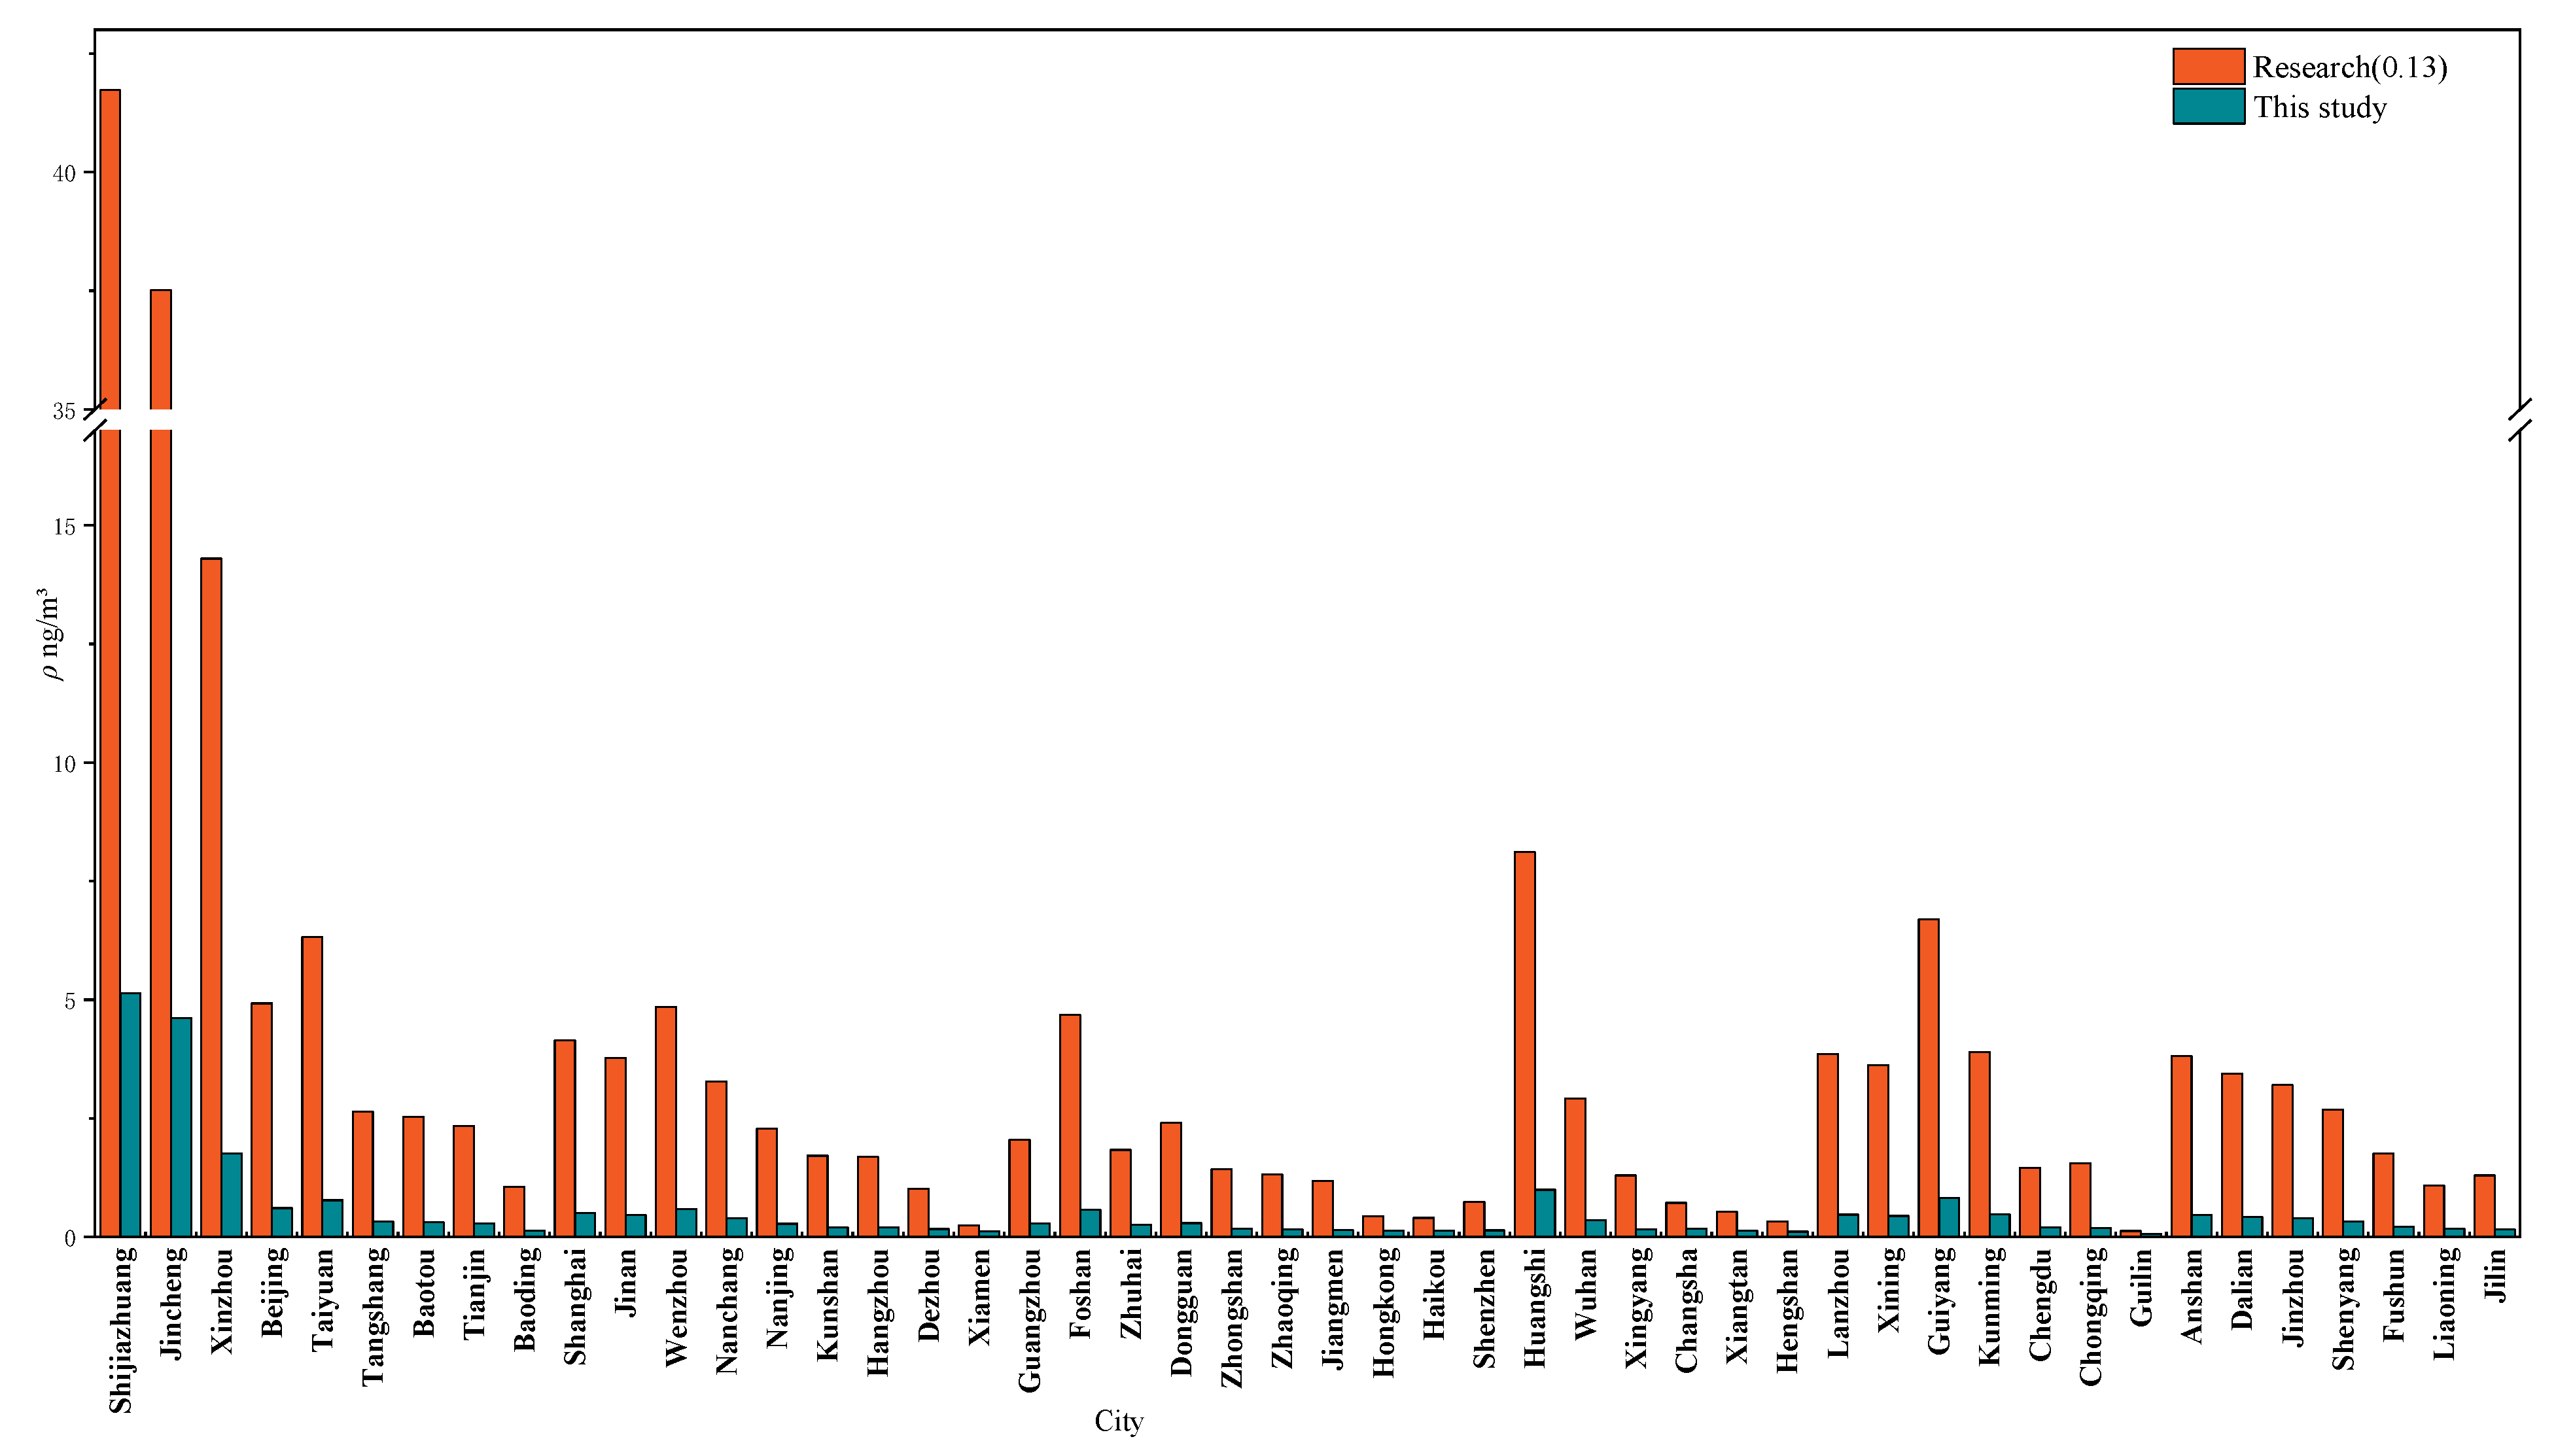
3.4. The Regional Concentration of Cr(VI) in Ambient PM2.5 in China

As we know, there are few studies on the observation monitoring of atmospheric Cr(VI) due to the complexity of sampling and chemical analysis. Most studies reported the concentration of atmospheric Cr directly. In order to estimate the regional concentration of Cr(VI) by Cr in different cities, the ratio of Cr(VI)/Cr was calculated following different levels of Cr in this research, as shown in Table 5. The results showed that the higher the Cr concentration, the lower the percentage of Cr(VI) in total chromium.
According to the classification of Cr(VI)/Cr and Cr in different cities of China [31], the Cr(VI) concentration (ρ) for different cities was estimated using the following two formulas:
ρ = r i × ρ ( Cr )
ρ = 0.13 × ρ ( Cr )
where, r i is the ratio of Cr(VI)/Cr, when the concentration level of Cr is i , as shown in Table 5; ρ ( Cr ) is the Cr concentration in each city [31]; and 0.13 is the ratio of Cr(VI)/Cr in dust [30].
Following the formulas above, the concentration of Cr(VI) in 48 cities were estimated, as shown in Figure 6. The sampling data of Cr concentration in 48 cities were analyzed by ICP-MS, ICP-AES and fluorescence spectroscopy. The significance test of the above data shows that the homogeneity of variance test value p is 0.279, which is greater than 0.05, which shows that the data difference is small and the results are reliable [31].The nationwide average value of Cr(VI) was (0.52 ± 1.04) ng/m3 and (4.04 ± 8.51) ng/m3, by using Equations (4) and (5), respectively. As we know, different industrial emissions may produce different valences of chromium compounds. For example, industrial waste and cement production mainly accompany the generation of Cr(VI) compounds, including chromate (CrO42−) and dichromate (Cr2O72−), while Cr(III) is mainly emitted from the mining (FeCr2O4) [57,58]. Therefore, further studies are needed to work on the Cr(VI) emissions.
As shown in Figure 6, the highest Cr(VI) concentration of 5.14 ng/m3 was in Shijiazhuang city, and the lowest was in Guilin city (0.07 ng/m3). Shijiazhuang city is well known as having many industrial activities, including steel smelting, coking, construction, the chemical industry, etc. In addition, it has intensive road networks and huge transport capacity in it. Thus, the industrial emissions and mobile exhaust may contribute to the high Cr(VI) concentrations in Shijiazhuang [59].
The spatial variation of Cr(VI) concentration was discussed in seven regions, i.e., North China, East China, South China, Central China, and the northwest, southwest, and northeast regions. The highest Cr(VI) concentration was shown in North China (1.13 ± 1.58 ng/m3), the second was in East China (0.85 ± 1.89 ng/m3), and the lowest was in South China (0.19 ± 0.12 ng/m3). In North China, industrial coal emissions from Shanxi, Hebei and Shandong provinces may be the important contribution to the high concentration of Cr(VI). In East China, the Cr mines in abundance [29] may contribute the high Cr(VI) concentration. In addition, the large amount of Cr(VI) emitted from leather production in Zhejiang province also contributes to the content of Cr(VI) in the ambient air of East China. According to China’s anthropogenic chromium emission inventory, the provinces with more chromium emissions in China were Hebei Province, Shandong Province, and Jiangsu Province, while the chromium emissions were lower in the Tibet Autonomous Region, Qinghai Province, and the Ningxia Autonomous Region in western China. That was mainly due to the smaller populations and lower economic strength in these regions [48].

3.5. Comparison of Cr(VI) Content in China with Other Countries

The concentration levels of Cr(VI), Cr and the ratio of Cr(VI)/Cr in different countries are shown in Table 6. The concentration of Cr(VI) in atmospheric PM2.5 ranges from 0.002 to 0.303 ng/m3 in this research. As shown in Table 6, the highest Cr(VI) concentration was shown in Iran (6.88 ng/m3) [60], and the lowest was in the United States (0.024 ng/m3) [61]. In Asia, the Cr(VI) concentration in Korea was 0.381 ng/m3 [62], which was higher than that in Beijing and Qingdao in this research. In Europe, the Cr(VI) concentration varies greatly in different countries. The Cr(VI) concentration was 0.8 ng/m3 in Germany, higher (3.2 ng/m3) in Belgium, and the highest (6.24 ng/m3) in Poland [6,54,63]. The concentration at sampling sites in Beijing and Qingdao was at a relatively low level in the world, which was similar with those in Australia (0.08–0.87 ng/m3) and higher than those in the United States (0.024 ng/m3) [61,64]. The Cr(VI) concentration (0.52 ng/m3) calculated by Equations (4) and (5), based on the actual determination, was higher than that in Republic of Korea (0.381 ng/m3), and showed similar levels with those in Canada (0.55 ng/m3) and Australia (0.08–0.87 ng/m3) [52,62,64]. The ratio of Cr(VI) to Cr varies greatly in different countries. It was 0.763 in Germany, but only 0.008 in the United States. The ratio between Beijing and Qingdao in China was in the middle level, which was higher than Korea (0.028) and Belgium (0.044), but lower than Iran (0.241) and Germany (0.763) [54,60,61,62,63].

4. Conclusions

In order to determine the pollution levels of atmospheric Cr(VI), two sampling sites were studied in Beijing and Qingdao from September to December 2020. The concentrations of Cr(VI) were determined using Ion Chromatography-inductively coupled plasma mass spectrometry (IC-ICP-MS), and the Cr concentrations were simultaneously analyzed by Inductively Coupled Plasma-atomic emission spectrometry (ICP-AES). The results showed that the Cr(VI) concentrations in atmospheric PM2.5 in Beijing and Qingdao ranged from 0.006–0.266 ng/m3 and 0.002–0.303 ng/m3, and the mean levels of Cr(VI) in the two cities were (0.140 ± 0.065) ng/m3 and (0.091 ± 0.073) ng/m3, respectively. The results of a potential sources analysis of Beijing showed that Cr(VI) were mainly from emissions and transportation in the northern surrounding areas in autumn, while in winter it was affected more by the southern and the surrounding areas of Beijing. In Qingdao, Cr(VI) was more affected by the marine air mass in autumn, and the main potential source in winter was from surrounding areas in Shandong Province.
During the sampling period, the mean ratio of Cr(VI) to Cr was (0.0623 ± 0.0969). The ratio of Cr(VI)/Cr in Beijing and Qingdao were 0.076 ± 0.104 and 0.041 ± 0.039, respectively. Concentrations of Cr(VI) in 48 cities of China were estimated by the ratio of Cr(VI)/Cr obtained from this research. The average Cr(VI) concentration in 48 cities across the country was (0.52 ± 1.04) ng/m3, based on the ratio of Cr(VI) to Cr (0.0623 ± 0.0969) obtained from this research. Nationwide, the Cr(VI) concentrations were highest in North China ((1.13 ± 1.58) ng/m3), followed by East China ((0.85 ± 1.89) ng/m3), and the lowest Cr(VI) concentration was (0.19 ± 0.12) ng/m3 in South China. Industrial coal emissions, abundant Cr mines and leather production may be important contributions to the high concentration of Cr(VI). Compared with other countries, the concentration of Cr(VI) at the sampling sites of Beijing and Qingdao showed lower values. The average concentration of Cr(VI) estimated by the ratio of this research in China is lower than that in South Korea and similar with those in Canada and Australia.

Author Contributions

Conceptualization, W.Z., J.G. and L.W.; methodology, W.Z. and L.W.; software, L.W.; validation, J.G., W.Z.; formal analysis, J.G. and L.W.; investigation, L.W.; resources, H.L.; data curation, H.W.; writing—original draft preparation, L.W.; writing—review and editing, W.Z.; visualization, J.G.; supervision, B.C.; project administration, W.Z.; funding acquisition, W.Z. All authors have read and agreed to the published version of the manuscript.

Funding

This research was funded by National Key Research and Development Program of China grant number No.2019YFC0214200.

Institutional Review Board Statement

Not applicable.

Informed Consent Statement

Not applicable.

Data Availability Statement

Not applicable.

Conflicts of Interest

The authors declare no conflict of interest.

References

  1. Padarauskas, A.; Schwedt, G. Simultaneous ion-pair chromatography of inorganic anions and cations using on-column derivatization with chelating agents and UV detection. Fresenius J. Anal. Chem. 1995, 351, 708–713. [Google Scholar] [CrossRef]
  2. Huang, S.; Lu, Q.; Ma, X.; Chen, Y.; Maimaiti, R. A Facilely Synthesized Tourmaline&ndash; Biochar Composite for Enhanced Removal of Cr(VI) from Aqueous Solution. Atmosphere 2022, 13, 1643. [Google Scholar] [CrossRef]
  3. U.S. Environmental Protection Agency. Standard Operation Procedure for the Determination of Hexavalent Chromium in Ambient Air Analyzed by Ion Chromatography (IC); Work Assignment 5-03; U.S. Environmental Protection Agency: Research Triangle Park, NC, USA, 2006.
  4. Kotaś, J.; Stasicka, Z. Chromium occurrence in the environment and methods of its speciation. Environ. Pollut. 2000, 107, 263–283. [Google Scholar] [CrossRef] [PubMed]
  5. Seigneur, C.; Constantinou, E. Chemical kinetic mechanism for atmospheric chromium. Environ. Sci. Technol. 1995, 29, 222–231. [Google Scholar] [CrossRef]
  6. Wietlik, R.; Molik, A.; Molenda, M.; Trojanowska, M.; Siwiec, J. Chromium(III/VI) speciation in urban aerosol. Atmos. Environ. 2011, 45, 1364–1368. [Google Scholar] [CrossRef]
  7. Samad, A.; Arango, K.; Alvarez Florez, D.; Chourdakis, I.; Vogt, U. Assessment of Coarse, Fine, and Ultrafine Particles in S-Bahn Trains and Underground Stations in Stuttgart. Atmosphere 2022, 13, 1875. [Google Scholar] [CrossRef]
  8. Shrestha, S.; Peel, M.C.; Moore, G.A.; Gaydon, D.S.; Poulton, P.L.; Dutta, S.K. Effect of Anthropogenic Aerosols on Wheat Production in the Eastern Indo-Gangetic Plain. Atmosphere 2022, 13, 1896. [Google Scholar] [CrossRef]
  9. Pumure, I.; Sithole, S.D.; Kahwai, S.G.T. Characterisation of Particulate Matter Emissions from the Zimbabwe Mining and Smelting Company (Zimasco) Kwekwe Division (Zimbabwe): A Ferrochrome Smelter. Environ. Monit. Assess. 2003, 87, 111–121. [Google Scholar] [CrossRef]
  10. Singh, D.K.; Gupta, T. Role of transition metals with water soluble organic carbon in the formation of secondary organic aerosol and metallo-organics in PM1 sampled during post monsoon and pre-winter time. J. Aerosol Sci. 2016, 94, 56–69. [Google Scholar] [CrossRef]
  11. Huang, X.; Ding, A.; Wang, Z.; Ding, K.; Gao, J.; Chai, F.; Fu, C. Amplified transboundary transport of haze by aerosol–boundary layer interaction in China. Nat. Geosci. 2020, 13, 428–434. [Google Scholar] [CrossRef]
  12. Zhao, B.; Wu, W.; Wang, S.; Xing, J.; Chang, X.; Liou, K.N.; Jiang, J.H.; Gu, Y.; Jang, C.; Fu, J.S.; et al. A modeling study of the nonlinear response of fine particles to air pollutant emissions in the Beijing–Tianjin–Hebei region. Atmos. Chem. Phys. 2017, 17, 12031–12050. [Google Scholar] [CrossRef] [Green Version]
  13. Lin, L.; Fan, Z.; Lioy, P. Characterization of Chromium Species Distribution as a Function of Particle Size in Chromium Waste Laden Soils. Epidemiology 2008, 19, 1489–1500. [Google Scholar] [CrossRef]
  14. Pettine, M.; Capri, S. Digestion treatments and risks of Cr(III)–Cr(VI) interconversions during Cr(VI) determination in soils and sediments—A review. Anal. Chim. Acta 2005, 540, 231–238. [Google Scholar] [CrossRef]
  15. WHO. Air Quality Guidelines for Europe; WHO: Geneva, Switzerland, 2000; pp. 125–162. [Google Scholar]
  16. GB3095-2012; Ambient Air Quality Standards. Ministry of Ecology and Environment of People’s Republic of China: Beijing, China, 2012.
  17. Swift, P.; Howell, M.; Tedder, D. Collection and Analysis of Hexavalent Chromium in Ambient Air. Eastern Research Group. 2007. Available online: https://www.epa.gov/sites/default/files/2021-03/documents/hexavalent-chromium-paper-06.pdf (accessed on 12 January 2023).
  18. Huang, L.; Fan, Z.T.; Chang, H.Y.; Hopke, P.K.; Lioy, P.J.; Buckley, B.T.; Lin, L.; Ma, Y. Interconversion of Chromium Species During Air Sampling: Effects of O3, NO2, SO2, Particle Matrices, Temperature, and Humidity. Environ. Sci. Technol. 2013, 47, 4408–4415. [Google Scholar] [CrossRef] [PubMed] [Green Version]
  19. Ball, J.W.; Nordstrom, D.K. Critical Evaluation and Selection of Standard State Thermodynamic Properties for Chromium Metal and Its Aqueous Ions, Hydrolysis Species, Oxides, and Hydroxides. J. Chem. 1998, 43, 895–918. [Google Scholar] [CrossRef]
  20. Ball, J.W. Thermodynamic and Isotopic Systematics of Chromium Chemistry. Ph.D. Thesis, The University of Arizona, Tucson, AZ, USA, 1996. [Google Scholar]
  21. Baetjer, A.M.; Lowney, J.F.; Steffee, H.; Budacz, V. Effect of chromium on incidence of lung tumors in mice and rats. AMA Arch. Ind. Health 1959, 20, 124–135. [Google Scholar]
  22. Baetjer, A.M.; Damron, C.M.; Budacz, V. The distribution and retention of chromium in men and animals. AMA Arch. Ind. Health 1959, 20, 136–150. [Google Scholar]
  23. Vigliani, E.C.; Zurlo, N. Experiences of the Clinica del Lavoro with Maximum Allowable Concentrations of Industrial Poisons. Arch. Gewerbepath. Gewerbehyg. 1955, 13, 528–534. [Google Scholar]
  24. U.S. National Institute for Occupational Safety and Health. Chromium,Hexavelent by IonChromatography. OSHAID-215; OSHA Salt Lake Technical Center. 1998. Available online: https://www.osha.gov/sites/default/files/methods/id215_v2.pdf (accessed on 12 January 2023).
  25. U.S. Environmental Protection Agency. Environmental Monitoring Near Industrial Sites, Chromium; US NTIS PB-271 881; U.S. Environmental Protection Agency: Washington, DC, USA, 1977.
  26. U.S. Environmental Protection Agency. Reviews of the Environmental Effects of Pollutants. III. Chromium; US EPA 600/1-78-023; U.S. Environmental Protection Agency: Washington, DC, USA, 1978.
  27. U.S. Environmental Protection Agency. Methods for the Chemical Analysis of Water and Wastes; US EPA-600/4-79-020; U.S. Environmental Protection Agency: Washington, DC, USA, 1983.
  28. Xie, C.; Yang, W.; Zhang, W.J.; Li, W.; Han, B.; Wang, X.H.; Zhao, X.Y.; Chen, M.D.; Bai, Z.P. Pollution characteristics and health risk assessment of heavy metals in PM2.5 in 23 Chinese cities. J. Environ. Health 2019, 36, 693–702. [Google Scholar] [CrossRef]
  29. Zou, T.; Kang, W.; Zhang, J.; Wang, M.; Zhong, B. Concentrations and Distribution Characteristics of Atmospheric Heavy Metals in Urban Areas of China. Res. Environ. Sci. 2015, 28, 1053–1061. [Google Scholar] [CrossRef]
  30. Tan, J.H.; Duan, J.C. Heavy metals in aerosol in China: Pollution, sources, and control strategies. J. Grad. Univ. Chin. Acad. Sci. 2013, 30, 145–155. [Google Scholar] [CrossRef]
  31. Wang, L.X.; Li, H.; Zhang, W.J.; Qi, J.Y.; Tian, H.Z.; Huang, K.; Chen, D.S.; Guo, J.H. Regional Pollution Characteristics of Heavy Metals in PM2.5. Res. Environ. Sci. 2021, 34, 849–862. [Google Scholar] [CrossRef]
  32. Heitkemper, D.; Vela, N.; Stewart, K.; Westphal, C. Determination of total and speciated arsenic in rice by ion chromatography and inductively coupled plasma mass spectrometry. J. Anal. At. Spectrom. 2001, 16, 299–306. [Google Scholar] [CrossRef]
  33. Marlow, D.; Wang, J.; Tj, W.; Ashley, K. Field test of a portable method for the determination of hexavalent chromium in workplace air. Am. Lab. 2000, 32, 26. [Google Scholar] [CrossRef]
  34. Dao, X.; Lu, Y.B.; Teng, E.J.; Zhang, L.L.; Wang, C.; Li, L.H. Determination of hexavalent chromium in atmospheric particles PM2.5 and PM10 by ion chromatography with inductively coupled plasma mass spectrometry. Chin. J. Chromatogr. 2014, 32, 936–941. [Google Scholar] [CrossRef] [PubMed]
  35. Ashley, K.; Howe, A.M.; Demange, M.; Nygren, O. Sampling and analysis considerations for the determination of hexavalent chromium in workplace air. J. Environ. Monit. 2003, 5, 707–716. [Google Scholar] [CrossRef]
  36. Rai, D.; Moore, D.A.; Hess, N.J.; Rao, L.; Clark, S.B. Chromium(III) hydroxide solubility in the aqueous Na+-OH--H2PO4--HPO42--PO43--H2O system: A thermodynamic model. J. Solut. Chem. 2004, 33, 1213–1242. [Google Scholar] [CrossRef]
  37. Cannon, R.; Earley, J. On the Effect of trans Ligands on the Rate of Some Bridged Electron-Transfer Reactions 1. J. Am. Chem. Soc. 1965, 87, 5264. [Google Scholar] [CrossRef]
  38. Inoue, Y.; Sakai, T.; Kumagai, H. Simultaneous determination of chromium(III) and chromium(VI) by ion chromatography with inductively coupled plasma mass spectrometry. J. Chromatogr. A 1995, 706, 127–136. [Google Scholar] [CrossRef]
  39. Wang, L.; Guo, J.; Li, H.; Zhang, W.; Wang, H. Verification and Optimization of a Sampling and Analytical Method to Measure Cr(VI) in Ambient PM2.5. Res. Environ. Sci. 2021, 4, 1–13. (In Chinese) [Google Scholar] [CrossRef]
  40. HJ 168-2010; Environmental Monitoring—Technical Guideline on Drawing and Revising Analytical Method Standards. Ministry of Ecology and Environment of People’s Republic of China: Beijing, China, 2010.
  41. HJ 799-2015; Ambient Air-Determination of Hexavalent Chromium (VI)—Ion Chromatography with Post-Column Method. Ministry of Ecology and Environment of People’s Republic of China: Beijing, China, 2015.
  42. HJ 777-2015; Ambient Air and Waste Gas from Stationary Sources Emission—Determination of Metal Elements Particulate Matter-Inductively Coupled Plasma Optical Emission Spectrometry. Ministry of Ecology and Environment of People’s Republic of China: Beijing, China, 2015.
  43. Meng, Q.; Fan, Z.; Buckley, B.; Lin, L.; Huang, L.; Yu, C.-H.; Stiles, R.; Bonanno, L. Development and evaluation of a method for hexavalent chromium in ambient air using IC-ICP-MS. Atmos. Environ. 2011, 45, 2021–2027. [Google Scholar] [CrossRef]
  44. Zhu, L.; Huang, X.; Shi, H.; Cai, X.H.; Song, Y. Transport pathways and potential sources of PM10 in Beijing. Atmos. Environ. 2011, 45, 594–604. [Google Scholar] [CrossRef]
  45. Dong, X.L.; Zhang, L.Y.; Liu, D.M.; Che, R.J.; Yuan, Y.S. Source tracing of biomarkers in the organic pollutants from atmospheric particulates in Beijing city during Summer. J. Univ. Chin. Acad. Sci. 2007, 24, 601–611. [Google Scholar] [CrossRef]
  46. Di, Y.; Zhou, R.; Yu, Y. Characteristic and source apportionment of hexavalent chromiumn in particulate matter in Beijing(in Chinese). Environ. Chem. 2014, 33, 2117–2122. [Google Scholar] [CrossRef]
  47. Cui, Y.; Ji, D.; Chen, H.; Gao, M.; Maenhaut, W.; He, J.; Wang, Y. Characteristics and Sources of Hourly Trace Elements in Airborne Fine Particles in Urban Beijing, China. Geophys. Res. Atmos. 2019, 124, 11595–11613. [Google Scholar] [CrossRef]
  48. Cheng, H.G.; Zhou, T.; Li, Q.; Lu, L.; Lin, C.Y. Anthropogenic chromium emissions in china from 1990 to 2009. PLoS ONE 2014, 9, e87753. [Google Scholar] [CrossRef]
  49. Tian, H.Z.; Liu, K.; Zhou, J.; Lu, L.; Hao, J.; Qiu, P.; Gao, J.; Zhu, C.; Wang, K.; Hua, S. Atmospheric Emission Inventory of Hazardous Trace Elements from China’s Coal-Fired Power Plants-Temporal Trends and Spatial Variation Characteristics. Environ. Sci. Technol. 2014, 48, 3575–3582. [Google Scholar] [CrossRef]
  50. Zhong, Y.; Wang, X.; Cheng, S. Characteristics and Source Apportionment of PM2.5 and O3 during Winter of 2013 and 2018 in Beijing. Atmosphere 2020, 11, 1324. [Google Scholar] [CrossRef]
  51. Zong, Z.; Wang, X.; Tian, C.; Chen, Y.; Fu, S.-F.; Qu, L.; Ji, L.; Li, J.; Zhang, G. PMF and PSCF based source apportionment of PM2.5 at a regional background site in North China. Atmos. Res. 2017, 203, 207–215. [Google Scholar] [CrossRef] [Green Version]
  52. Bell, R.W.; Hipfner, J.C. Airborne Hexavalent Chromium in Southwestern Ontario. J. Air Waste Manag. Assoc. 1997, 47, 905–910. [Google Scholar] [CrossRef] [Green Version]
  53. Sheehan, P.; Ricks, R.; Ripple, S.; Paustenbach, D. Field evaluation of a sampling and analytical method for environmental levels of airborne hexavalent chromium. Am. Ind. Hyg. Assoc. J. 1992, 53, 57–68. [Google Scholar] [CrossRef] [PubMed]
  54. Nusko, R.; Heumann, K.G. Cr(III)/Cr(VI) speciation in aerosol particles by extractive separation and thermal ionization isotope dilution mass spectrometry. Fresenius J. Anal. Chem. 1997, 357, 1050–1055. [Google Scholar] [CrossRef]
  55. Gao, Y. The Research about the Distribution and Modality Analysis of the Chromium in the Dustfall on the Campus of Chengdu University of Technology. Ph.D. Thesis, Chengdu University of Technology, Chengdu, China, 2007. (In Chinese). [Google Scholar]
  56. Jin, X.; Fan, J.; Niu, H.; Ling, P.; Yu, Q. Analysis of Sources and Concentrations of Heavy Metal Contents in PM10 over a Four-Season Cycle in a Heavily Industrialised City in China. Pol. J. Environ. Stud. 2019, 28, 3227–3234. [Google Scholar] [CrossRef] [PubMed]
  57. Huggins, F.E.; Shah, N.; Huffman, G.P.; Kolker, A.; Crowley, S.; Palmer, C.A.; Finkelman, R.B. Mode of occurrence of chromium in four US coals. Fuel Process. Technol. 2000, 63, 79–92. [Google Scholar] [CrossRef]
  58. Turk, K.; Rietschel, R. Effect of processing cement to concrete on hexavalent chromium levels. Contact Dermat. 1993, 28, 209–211. [Google Scholar] [CrossRef]
  59. Cui, X.T.; Luan, W.L.; Li, S.M.; Song, Z.F. An analysis of the sources of heavy metals in atmospheric dustfall of Shijiazhuang City. Geol. China 2012, 39, 1108–1115. [Google Scholar] [CrossRef]
  60. Talebi, S.M. Determination of total and hexavalent chromium concentrations in the atmosphere of the city of Isfahan. Environ. Res. 2003, 92, 54–56. [Google Scholar] [CrossRef]
  61. U.S. Environmental Protection Agency. National Monitoring Programs Annual Report (UATMP, NATTS, CSATAM); NC 27560, 1203; U.S. Environmental Protection Agency: Wahington, DC, USA, 2013.
  62. Kang, B.-W.; Kim, J.-H.; Lee, H.-S.; Hong, J.-H.; Kim, R.-H.; Seo, Y.-K.; Han, J.; Baek, K.-M.; Kim, M.-J.; Baek, S.-O. Distribution of Airborne Hexavalent Chromium Concentrations in Large Industrial Complexes in Korea. Asian J. Atmos. Environ. 2016, 10, 208–216. [Google Scholar] [CrossRef] [Green Version]
  63. Tirez, K.; Silversmit, G.; Bleux, N.; Adriaenssens, E.; Roekens, E.; Servaes, K.; Vanhoof, C.; Vincze, L.; Berghmans, P. Determination of hexavalent chromium in ambient air: A story of method induced Cr(III) oxidation. Atmos. Environ. 2011, 45, 5332–5341. [Google Scholar] [CrossRef]
  64. Li, Y.; Pradhan, N.; Foley, R.; Low, G. Selective determination of airborne hexavalent chromium using inductively coupled plasma mass spectrometry. Talanta 2002, 57, 1143–1153. [Google Scholar] [CrossRef]
  65. Borai, E.H.; El-Sofany, E.A.; Abdel-Halim, A.S.; Soliman, A.A. Speciation of hexavalent chromium in atmospheric particulate samples by selective extraction and ion chromatographic determination. TrAC Trends Anal. Chem. 2002, 21, 741–745. [Google Scholar] [CrossRef]
  66. Khlystov, A.; Ma, Y. An on-line instrument for mobile measurements of the spatial variability of hexavalent and trivalent chromium in urban air. Atmos. Environ. 2006, 40, 8088–8093. [Google Scholar] [CrossRef]
Figure 1. Standard curve for the determination of Cr(VI).
Atmosphere 14 00209 g001
Figure 2. The diurnal variation (a) and monthly variation (b) of Cr(VI) Concentration in Beijing and Qingdao.
Atmosphere 14 00209 g002aAtmosphere 14 00209 g002b
Figure 3. Distribution of potential source of PM2.5 in autumn (September, October, November) and winter (December) in Beijing (a,b) and Qingdao (c,d), respectively.
Atmosphere 14 00209 g003
Figure 4. Distribution of concentration-weighted trajectory method analysis in autumn (September, October, November) and winter (December) in Beijing (a,b) and Qingdao (c,d), respectively.
Atmosphere 14 00209 g004aAtmosphere 14 00209 g004b
Figure 5. Frequency distribution of Cr(VI)/Cr (the purple line represents the ratio of Cr(VI) to total Cr in dust (0.13) in China).
Atmosphere 14 00209 g005
Figure 6. Comparison of Cr(VI) Concentrations in Various Cities.
Atmosphere 14 00209 g006
Table 1. Storage time of Cr(VI) in field sampling.
Storage Time/dPercent Recovery
197.75%
295.8%
396%
494.64%
590.03%
2197.75%
2293.85%
2392.35%
2487.15%
2593.03%
26103.7%
2789.17%
2892.71%
2997.37%
3038.53%
3128.42%
3229.55%
3317.56%
3419.03%
Table 2. Operating parameters for ICP-AES.
ParametersValues
Power1300
Gas flow0.7 L/min
Auxiliary gas flow0.2 L/min
Cooling air flow15 L/min
Dwell time10 s
Table 3. Operating parameters for IC-ICP-MS.
ParametersValue
ICChromatographic columnIonPac AG7, Guard, 4 × 50 mm
Sample volume25 μL
Eluent flow1 min/L
Pump pressure2.9 MPa
ICP-MSRF power1500 w
Cooling argon gas14 L/min
Auxiliary argon gas0.8 L/min
Nebulizer argon gas1.0 L/min
Dwell time0.1 s
Duration180 s
Measurement modeKED
Table 4. The precision and recovery efficiency of Cr(VI).
TypeNumber of Spiked SamplesType of Spiked SamplesMeanSDRSD(%)Percent Recovery
Cr2010 ng Cr standard solution8.76 ng0.748 ng8.587.63%
Cr50.1 mg standard soil0.09 mg0.733 mg8.190.35%
Cr(VI)255 ng Cr(VI) standard solution4.64 ng0.367 ng7.892.78%
Table 5. Classification table of Cr(VI)/Cr.
Concentration Level of Cr (ng/m3)Cr(VI) (ng/m3)Cr(VI)/Cr
8–140.1590.0160
6–7.90.1450.0215
4–5.90.1560.0327
2–3.90.1260.0445
1–1.90.0930.0657
<10.0690.1416
Table 6. Comparison of Cr and Cr(VI) Concentrations in this study with those in other countries.
LocationCr(ng/m3)Cr(VI) (ng/m3)Cr(VI)/CrStudy
Poland28.3986.2400.377Wietlik et al. [6]
Germany1.0470.8000.763Nusko and Heumann [54]
Egypt3.38760.8200.240Borai and El-Sofany [65]
America2.6800.0240.008EPA [61]
Iran30.1306.8800.241Talebi et al. [60]
Belgium653.2000.044Tirez et al. [63]
Republic of Korea13.2440.3810.028Kang et al. [62]
Canada 0.550 Bell et al. [52]
Australia 0.080–0.870 Li et al. [64]
America 0.500 Khlystov et al. [66]
Beijing, China3.8310.1400.076This study
Qingdao, China3.7070.0910.041This study
China20.3000.520
Disclaimer/Publisher’s Note: The statements, opinions and data contained in all publications are solely those of the individual author(s) and contributor(s) and not of MDPI and/or the editor(s). MDPI and/or the editor(s) disclaim responsibility for any injury to people or property resulting from any ideas, methods, instructions or products referred to in the content.

