Article

Spatiotemporal Patterns of Sea Ice Cover in the Marginal Seas of East Asia

1
Tianjin Meteorological Information Centre, Tianjin 300074, China
2
Tianjin Key Laboratory for Oceanic Meteorology, Tianjin 300074, China
3
Department of Atmospheric Science, School of Environmental Science, China University of Geosciences, Wuhan 430074, China
4
Laboratory for Climate Studies, National Climate Center, China Meteorological Administration, Beijing 100081, China
5
Tianjin Climate Center, Tianjin 300074, China
6
State Key Laboratory of Severe Weather, Chinese Academy of Meteorological Sciences, Beijing 100081, China
7
Key Laboratory of Transportation Meteorology of China Meteorological Administration, Nanjing Joint Institute for Atmospheric Sciences, Nanjing 210041, China
8
CMA Earth System Modeling and Prediction Centre, Beijing 100081, China
9
Binhai New Area Meteorological Bureau, Tianjin 300450, China
*
Author to whom correspondence should be addressed.
Atmosphere 2023, 14(2), 207; https://doi.org/10.3390/atmos14020207
Submission received: 3 December 2022 / Revised: 10 January 2023 / Accepted: 12 January 2023 / Published: 19 January 2023
(This article belongs to the Special Issue Advances in Transportation Meteorology)

Abstract

:
Using multisource sea ice fusion data, the spatiotemporal characteristics of sea ice cover were analyzed for the marginal seas of East Asia for the period 2005–2021. The results show that there were obvious differences in the beginning and end dates of the sea ice in the different sea areas. The northern Sea of Japan had the longest ice period, and Laizhou Bay and Bohai Bay in the Bohai Sea had the shortest ice period. The time when the largest sea ice extent appeared was relatively stable and mostly concentrated in late January to mid-February. There were obvious spatial differences in the duration of the sea ice cover in the marginal seas of East Asia. The duration of the sea ice cover gradually decreased from high latitude to low latitude and from nearshore to open seas. The annual average duration of the sea ice cover was more than 100 days in most of the Sea of Japan and approximately 20 days in most of Laizhou Bay and Bohai Bay. The melting speed was significantly faster than the freezing speed in the Bohai Sea and Yellow Sea, resulting in asymmetric changes in the daily sea ice extent in the two seas. The increasing trends in the maximum sea ice extent and total sea ice extent were 0.912 × 10⁵ km2/10 yr and 0.722 × 10⁷ km2/10 yr, respectively, from 2005 to 2013, both of which passed the significance test at the 0.05 level.

1. Introduction

The marginal seas of East Asia include the Bohai Sea, the Yellow Sea and the Sea of Japan. There are frequent economic and trade activities among the coastal countries in this sea area, and sea ice disaster is one of the major marine disasters in winter. The huge destructive power of sea ice seriously threatens marine transportation, offshore oil exploration, offshore engineering construction and marine fishery [1,2,3]. Under the background of global climate change, there are obvious interannual and interdecadal variations in sea ice in the marginal seas of East Asia in winter [4,5,6,7,8,9,10,11]. The research on the characteristics of intra-annual, interannual and long-term changes in the sea ice of the marginal seas of East Asia has important theoretical and practical significance. It will help to accurately and comprehensively reveal the temporal and spatial patterns of sea ice formation, development and ablation, and it will be useful for understanding the mechanism and impact of climate change in the northern region, improving the prediction and prevention of sea ice disaster in the marginal seas of East Asia.
The trend in the extent of sea ice in the marginal seas of East Asia has received extensive attention. Using a variety of satellite data, Wang et al. [12] analyzed the temporal and spatial distribution of sea ice in the Bohai Sea from 1996 to 2011, where the maximum value of the annual maximum sea ice extent exceeded 3.0 × 10⁴ km2, and the minimum value of the annual maximum sea ice extent was less than 1.0 × 10⁴ km2. Using moderate resolution imaging spectroradiometer (MODIS) sea ice data, Ouyang et al. [13] found that the average maximum sea ice extent in the Bohai Sea was 2.3 × 10⁴ ± 0.8 × 10⁴ km2 during the period 2000–2016. Using the reconstructed daily sea ice extent data, Yu et al. [14] showed that the trends in the annual maximum sea ice extent and the annual average sea ice extent were −0.33 ± 0.18% yr−1 and −0.51 ± 0.16% yr−1 from 1958 to 2015 in the Bohai Sea. Based on the daily sea ice data of the National Snow and Ice Data Center (NSIDC) in the United States, Liu et al. [15] showed that the period with the largest sea ice extent in the Bohai Sea and Yellow Sea was from late January to late February each year. The interannual oscillation of the ice extent was obvious, showing a trend of first increasing and then decreasing over 2007–2018, and there was a significant negative correlation with the coastal temperature of the Bohai Sea and Yellow Sea during the same period. According to Ken and Takuya [16], the sea ice in the Sea of Japan is mainly located in the Tatar Strait in the northwest of the Sea of Japan and the coast of Siberia. The changes in the sea ice in the Sea of Japan are not consistent with global climate change, which may be affected by local climatic factors. The change in the sea ice extent in the marginal seas of East Asia may be closely related to the warming of Northeast Asia.
At present, studies on sea ice mainly use satellite remote data, including visible, infrared, passive microwave and active microwave remote sensing [8,17,18]. Visible remote sensing has a high resolution, but it cannot be applied for monitoring at night. In addition, clouds have a great influence on visible and infrared remote sensing [19]. The microwave data are not limited by day and night, are less affected by clouds and fog, and have high spatiotemporal continuity, but passive microwave remote sensing currently has a low resolution [20,21,22]. Active microwave remote sensing has a high resolution but has shortcomings such as a long revisit time and high cost [23]. Therefore, the visible, infrared, passive microwave, and active microwave sensors for monitoring sea ice have their own advantages and disadvantages. The multisource fusion data combine the advantages of the above sensor data to form high-resolution sea ice cover fusion data [24,25,26]. In the marginal seas of East Asia, high-resolution fusion sea ice data are used to conduct sea ice cover research, and the high-resolution continuous monitoring of sea ice in the marginal seas of East Asia can be realized, which can clearly and continuously display the variation characteristics of sea ice in the marginal seas of East Asia. At present, research on sea ice cover has yet to be carried out in the marginal seas of East Asia using high-resolution fusion sea ice data.
Based on the high-resolution daily sea ice cover data from 2005 to 2021, which was developed using multisource data, this study analyzed the temporal and spatial characteristics of the sea ice cover and sea ice extent in the marginal seas of East Asia and estimated the trends in the sea ice extent in the sea areas over the last 17 years.

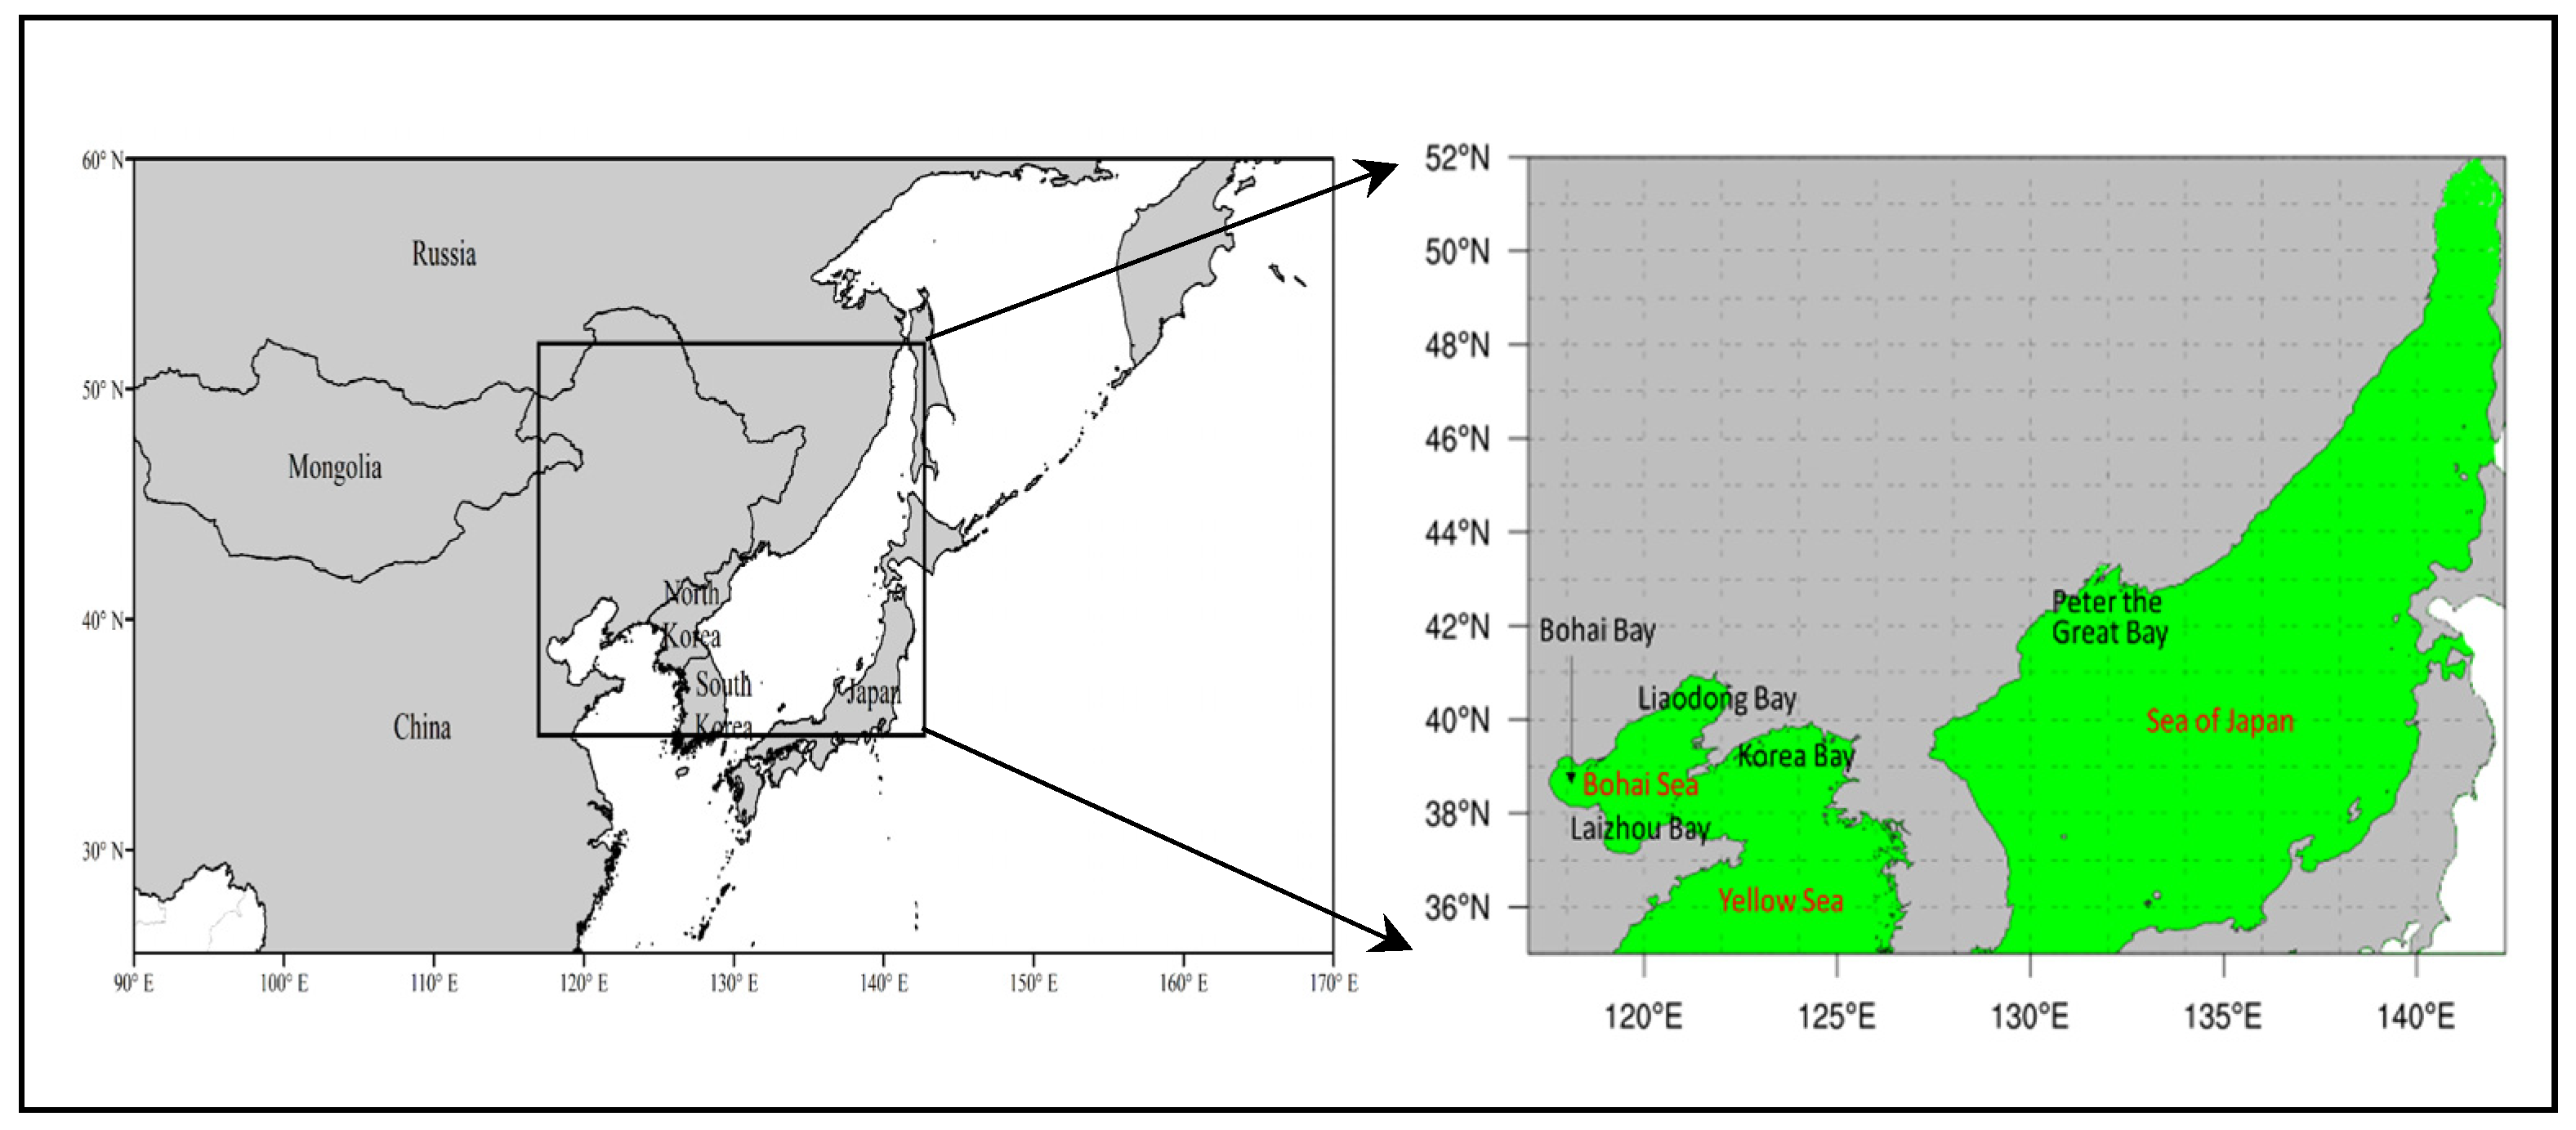
2. Materials and Methods

The IMS (interactive multisensory snow and ice mapping system) sea ice cover data used in this study were from the National Ice Center (NIC) [27,28]. The spatial resolution of the IMS data is 4 km, and the time resolution is 1 day. The NIC sea ice products have an ideal spatiotemporal resolution and high confidence relative to other single-source sea ice extent data [29]. The NIC sea ice product contains daily sea ice cover data from March 2004 to June 2021, with a total of only 8 missing days.
The value of the sea ice extent (SIE) in this study was the sum of the extent of all ice pixels. The annual SIE was the sea ice cover from November of the previous year to May of the current year. For example, the SIE from November 2006 to May 2007 was defined as the annual SIE in 2007. For the missing sea ice data, the values of the previous day and the next day were used to fill in by means of linear interpolation. The maximum value of the SIE in the marginal seas of East Asia in a year is defined as the maximum sea ice extent (MSIE) in that year, and the total sea ice extent (TSIE) in that year is represented by the daily cumulative amount of the SIE. In the marginal seas of East Asia, there are only SIE values from November to May of the following year. The trend in the SIE was estimated using the least squares method, and the significance level of the linear trend was judged by the t-test method.
The study area (117–142.3° E, 35–52° N) was the Bohai Sea, the central and northern Yellow Sea, and the Sea of Japan (Figure 1). The six areas where sea ice frequently occurs include Liaodong Bay in the northern Bohai Sea, Bohai Bay in the western Bohai Sea, Laizhou Bay in the southern Bohai Sea, Korea Bay in the northern Yellow Sea, Peter the Great Bay in the western Sea of Japan, and the northern Sea of Japan. The latitudes of the northern Sea of Japan and the Laizhou Bay are the highest and the lowest, respectively.

3. Results

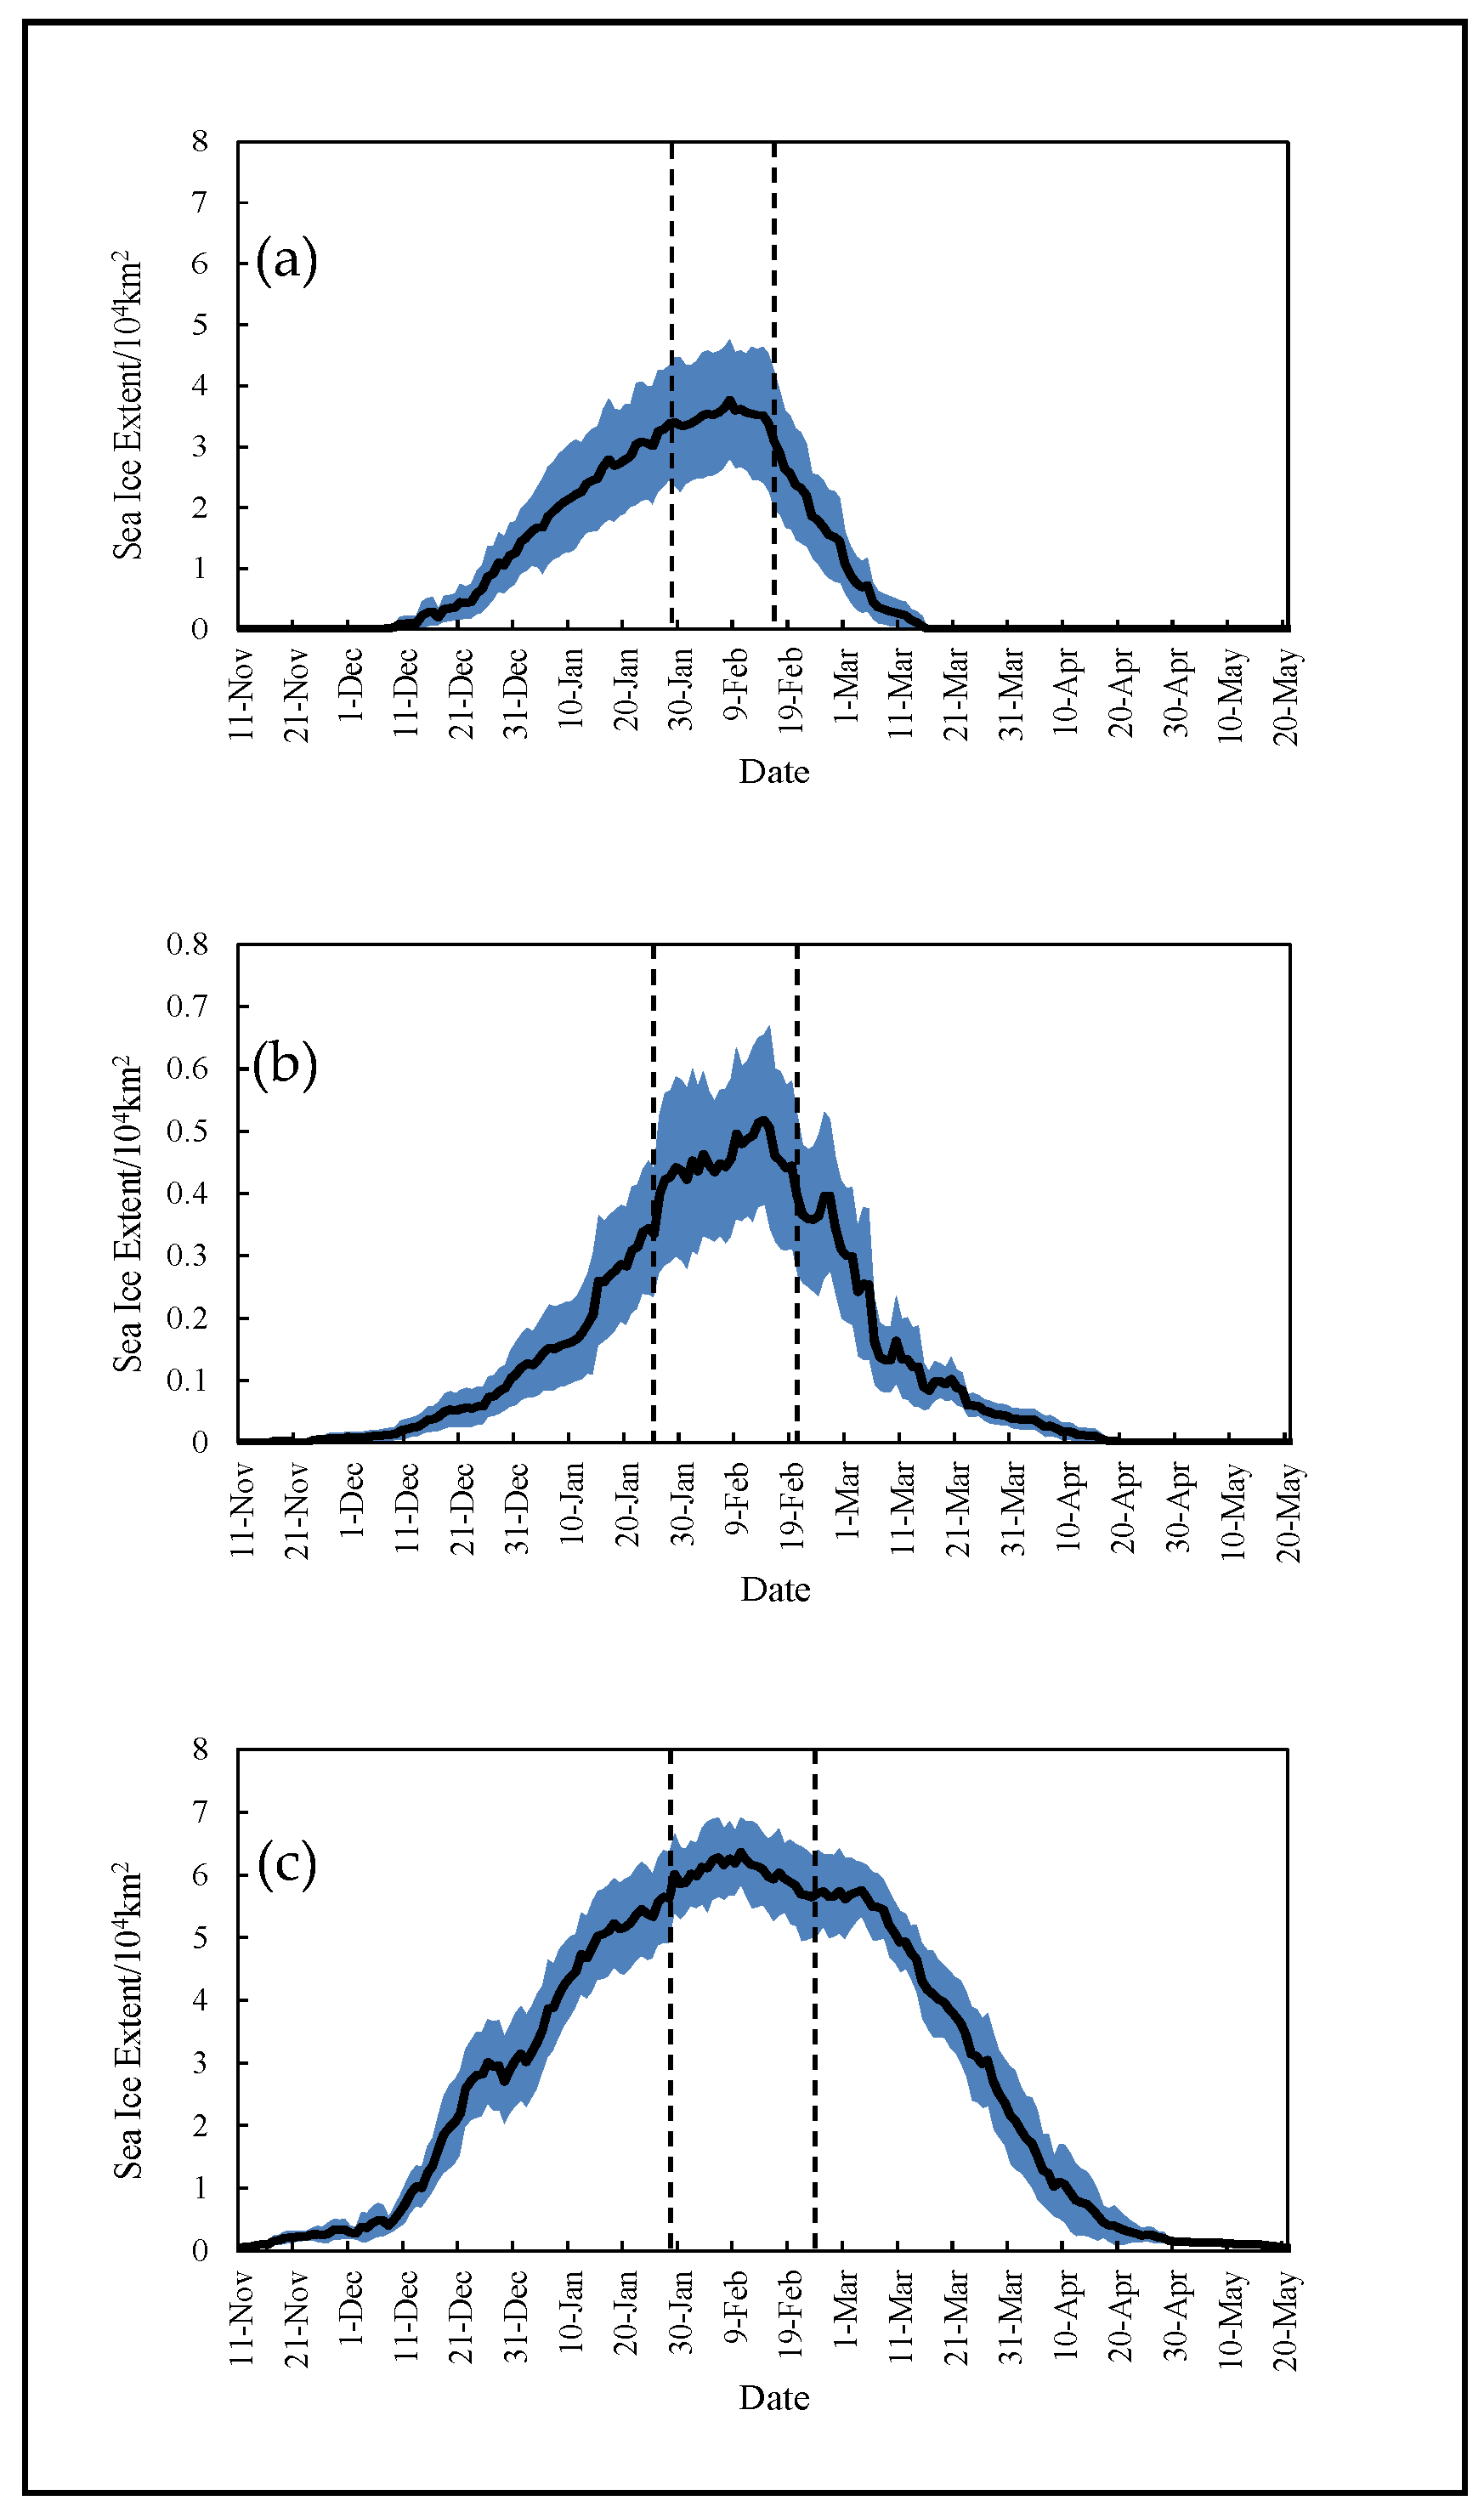
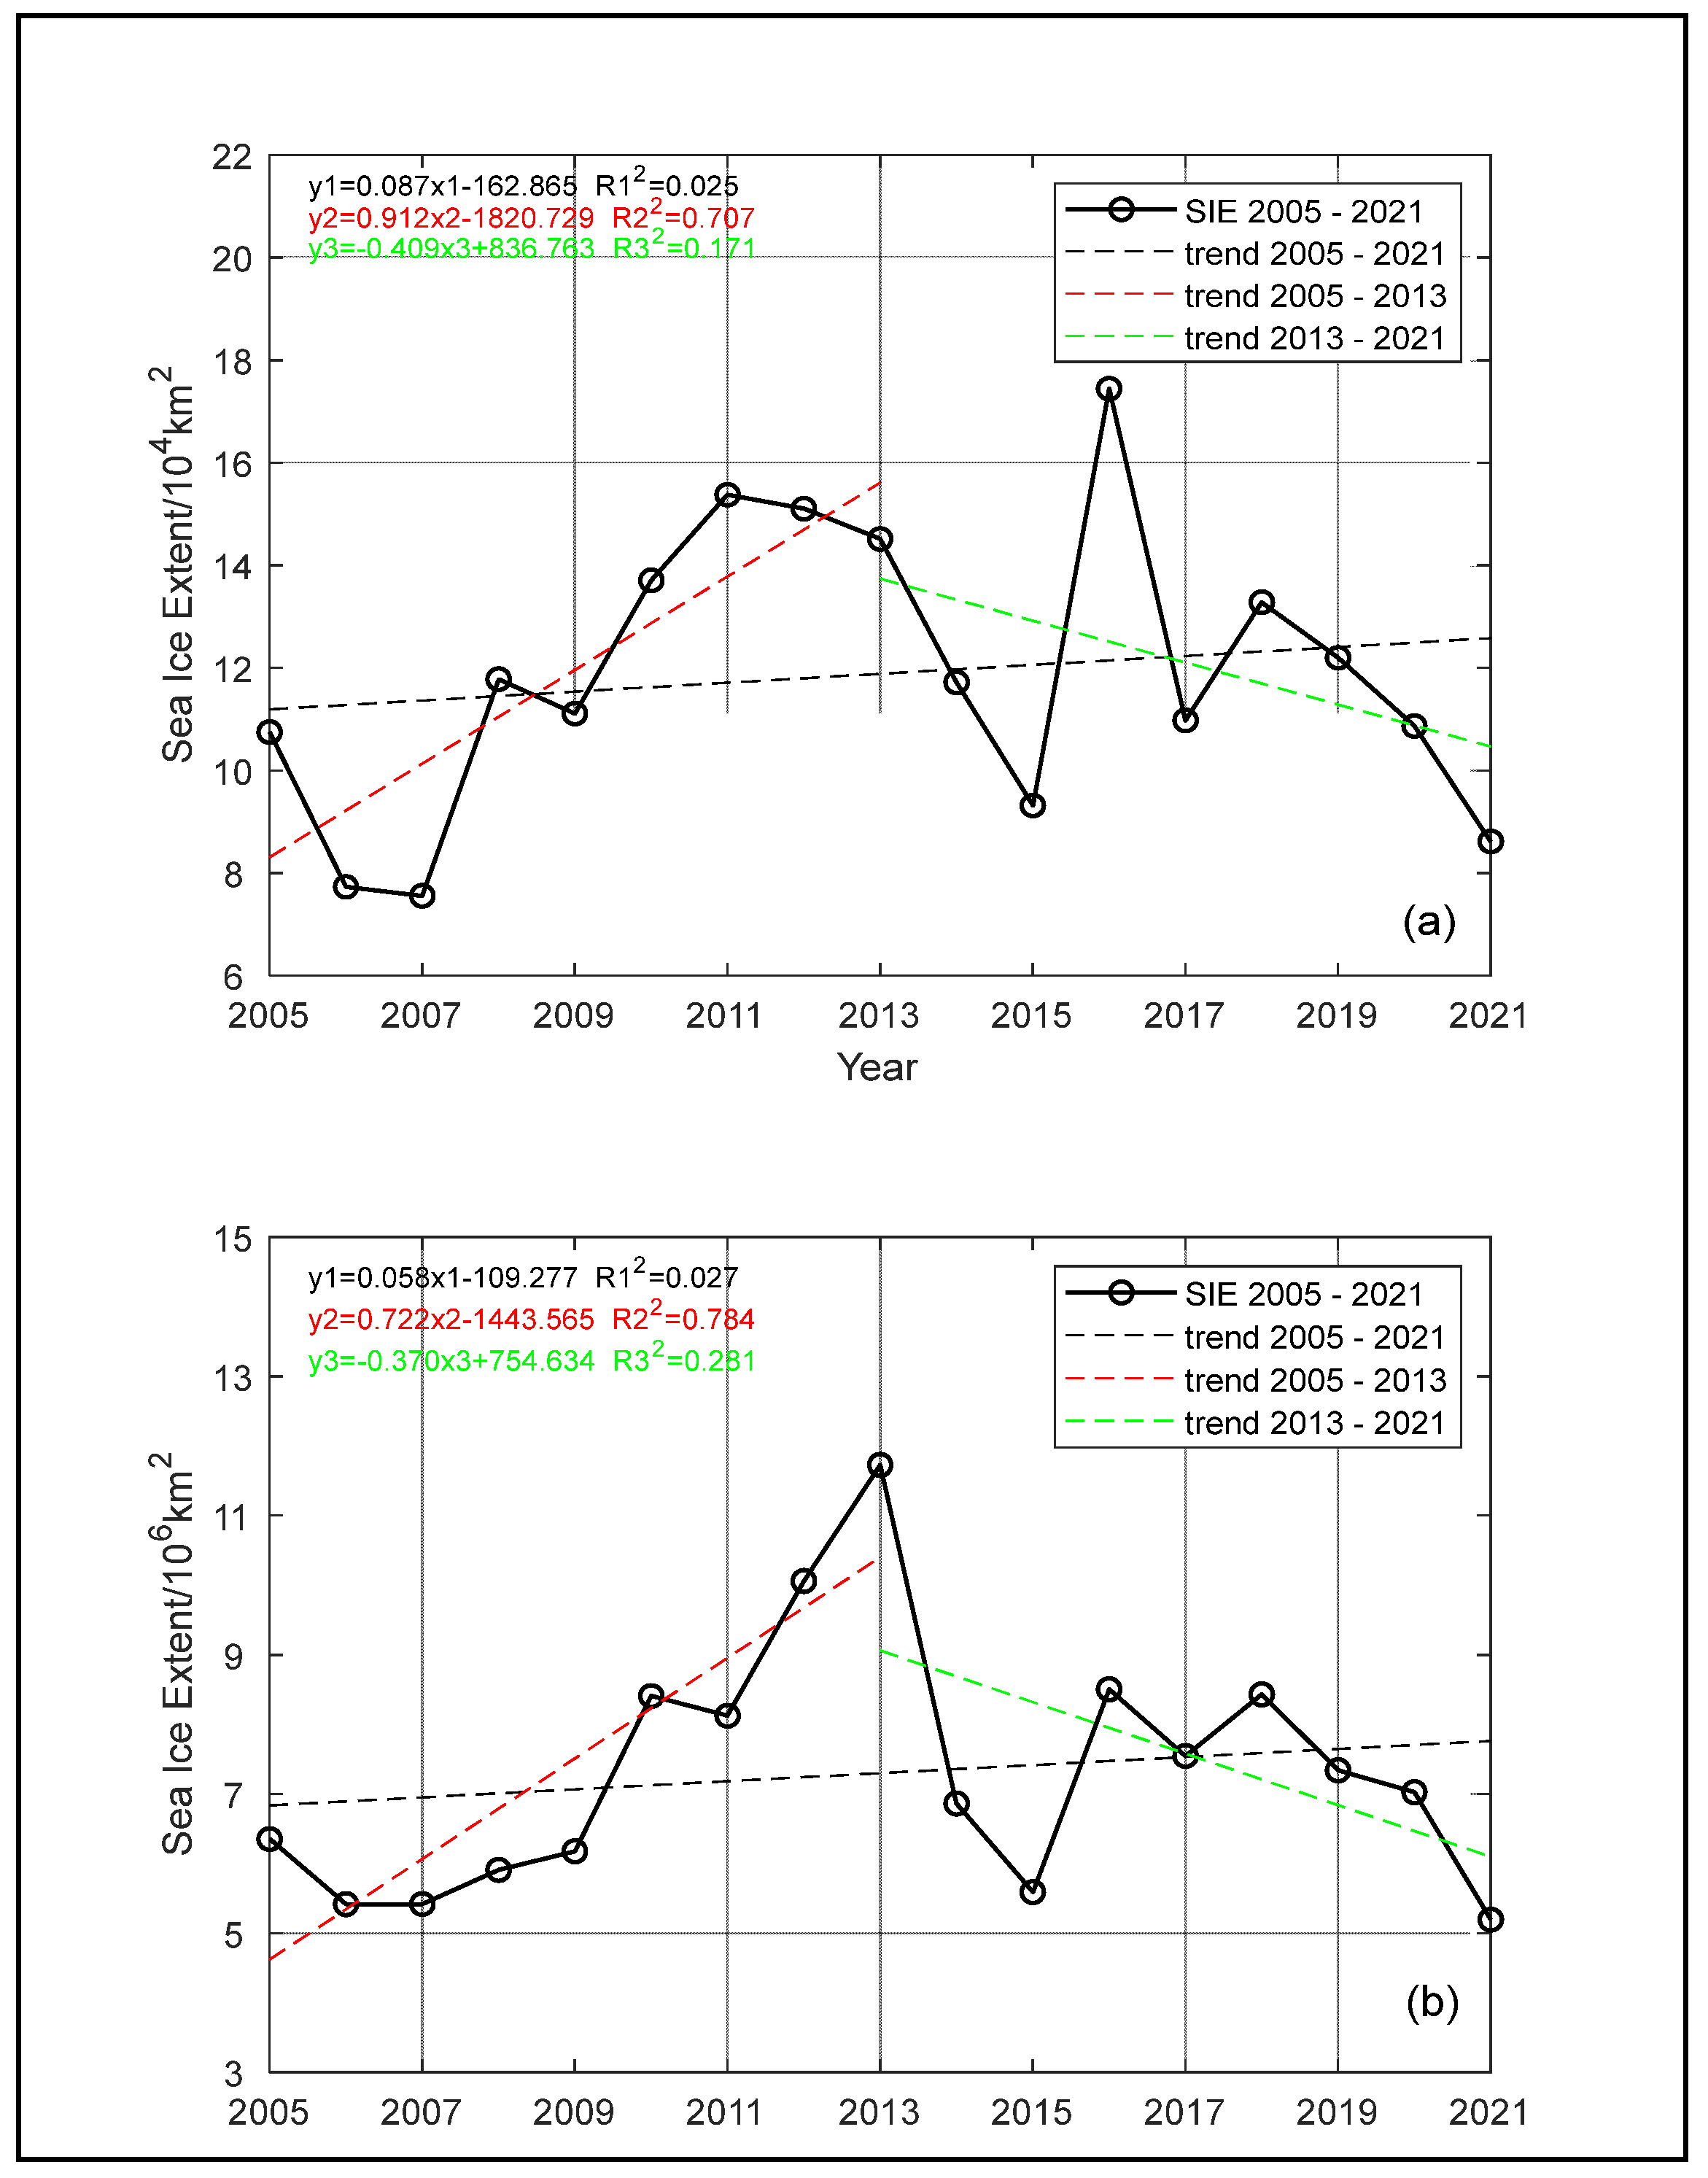
3.1. Temporal Characteristics of Sea Ice Extent

Table 1 shows the multiyear average first ice date and last ice date of the sea ice in the major sea areas of the marginal seas of East Asia from 2005 to 2021, as well as the occurrence time of the MSIE. There were obvious differences in the first and last ice dates of the sea ice in the different sea areas of the marginal seas of East Asia, but the time of the MSIE in each sea area was concentrated from late January to mid-February. As the latitude of the northern Sea of Japan is the highest, the average freezing time was the earliest in this area, which was 13 November. The average melting time of the sea ice was the latest in the northern Sea of Japan, which was May 16. The ice period lasted for approximately 184 days in the northern Sea of Japan, which was significantly longer than the other sea areas. Liaodong Bay, Korea Bay and Peter the Great Bay had similar first ice dates, with sea ice appearing in mid-to-late December, but the ice period in the Peter the Great Bay was longer than that of the other sea areas. The freezing times of Bohai Bay and Laizhou Bay were the latest, the melting time was the earliest, and the ice period was the shortest of all of the areas.

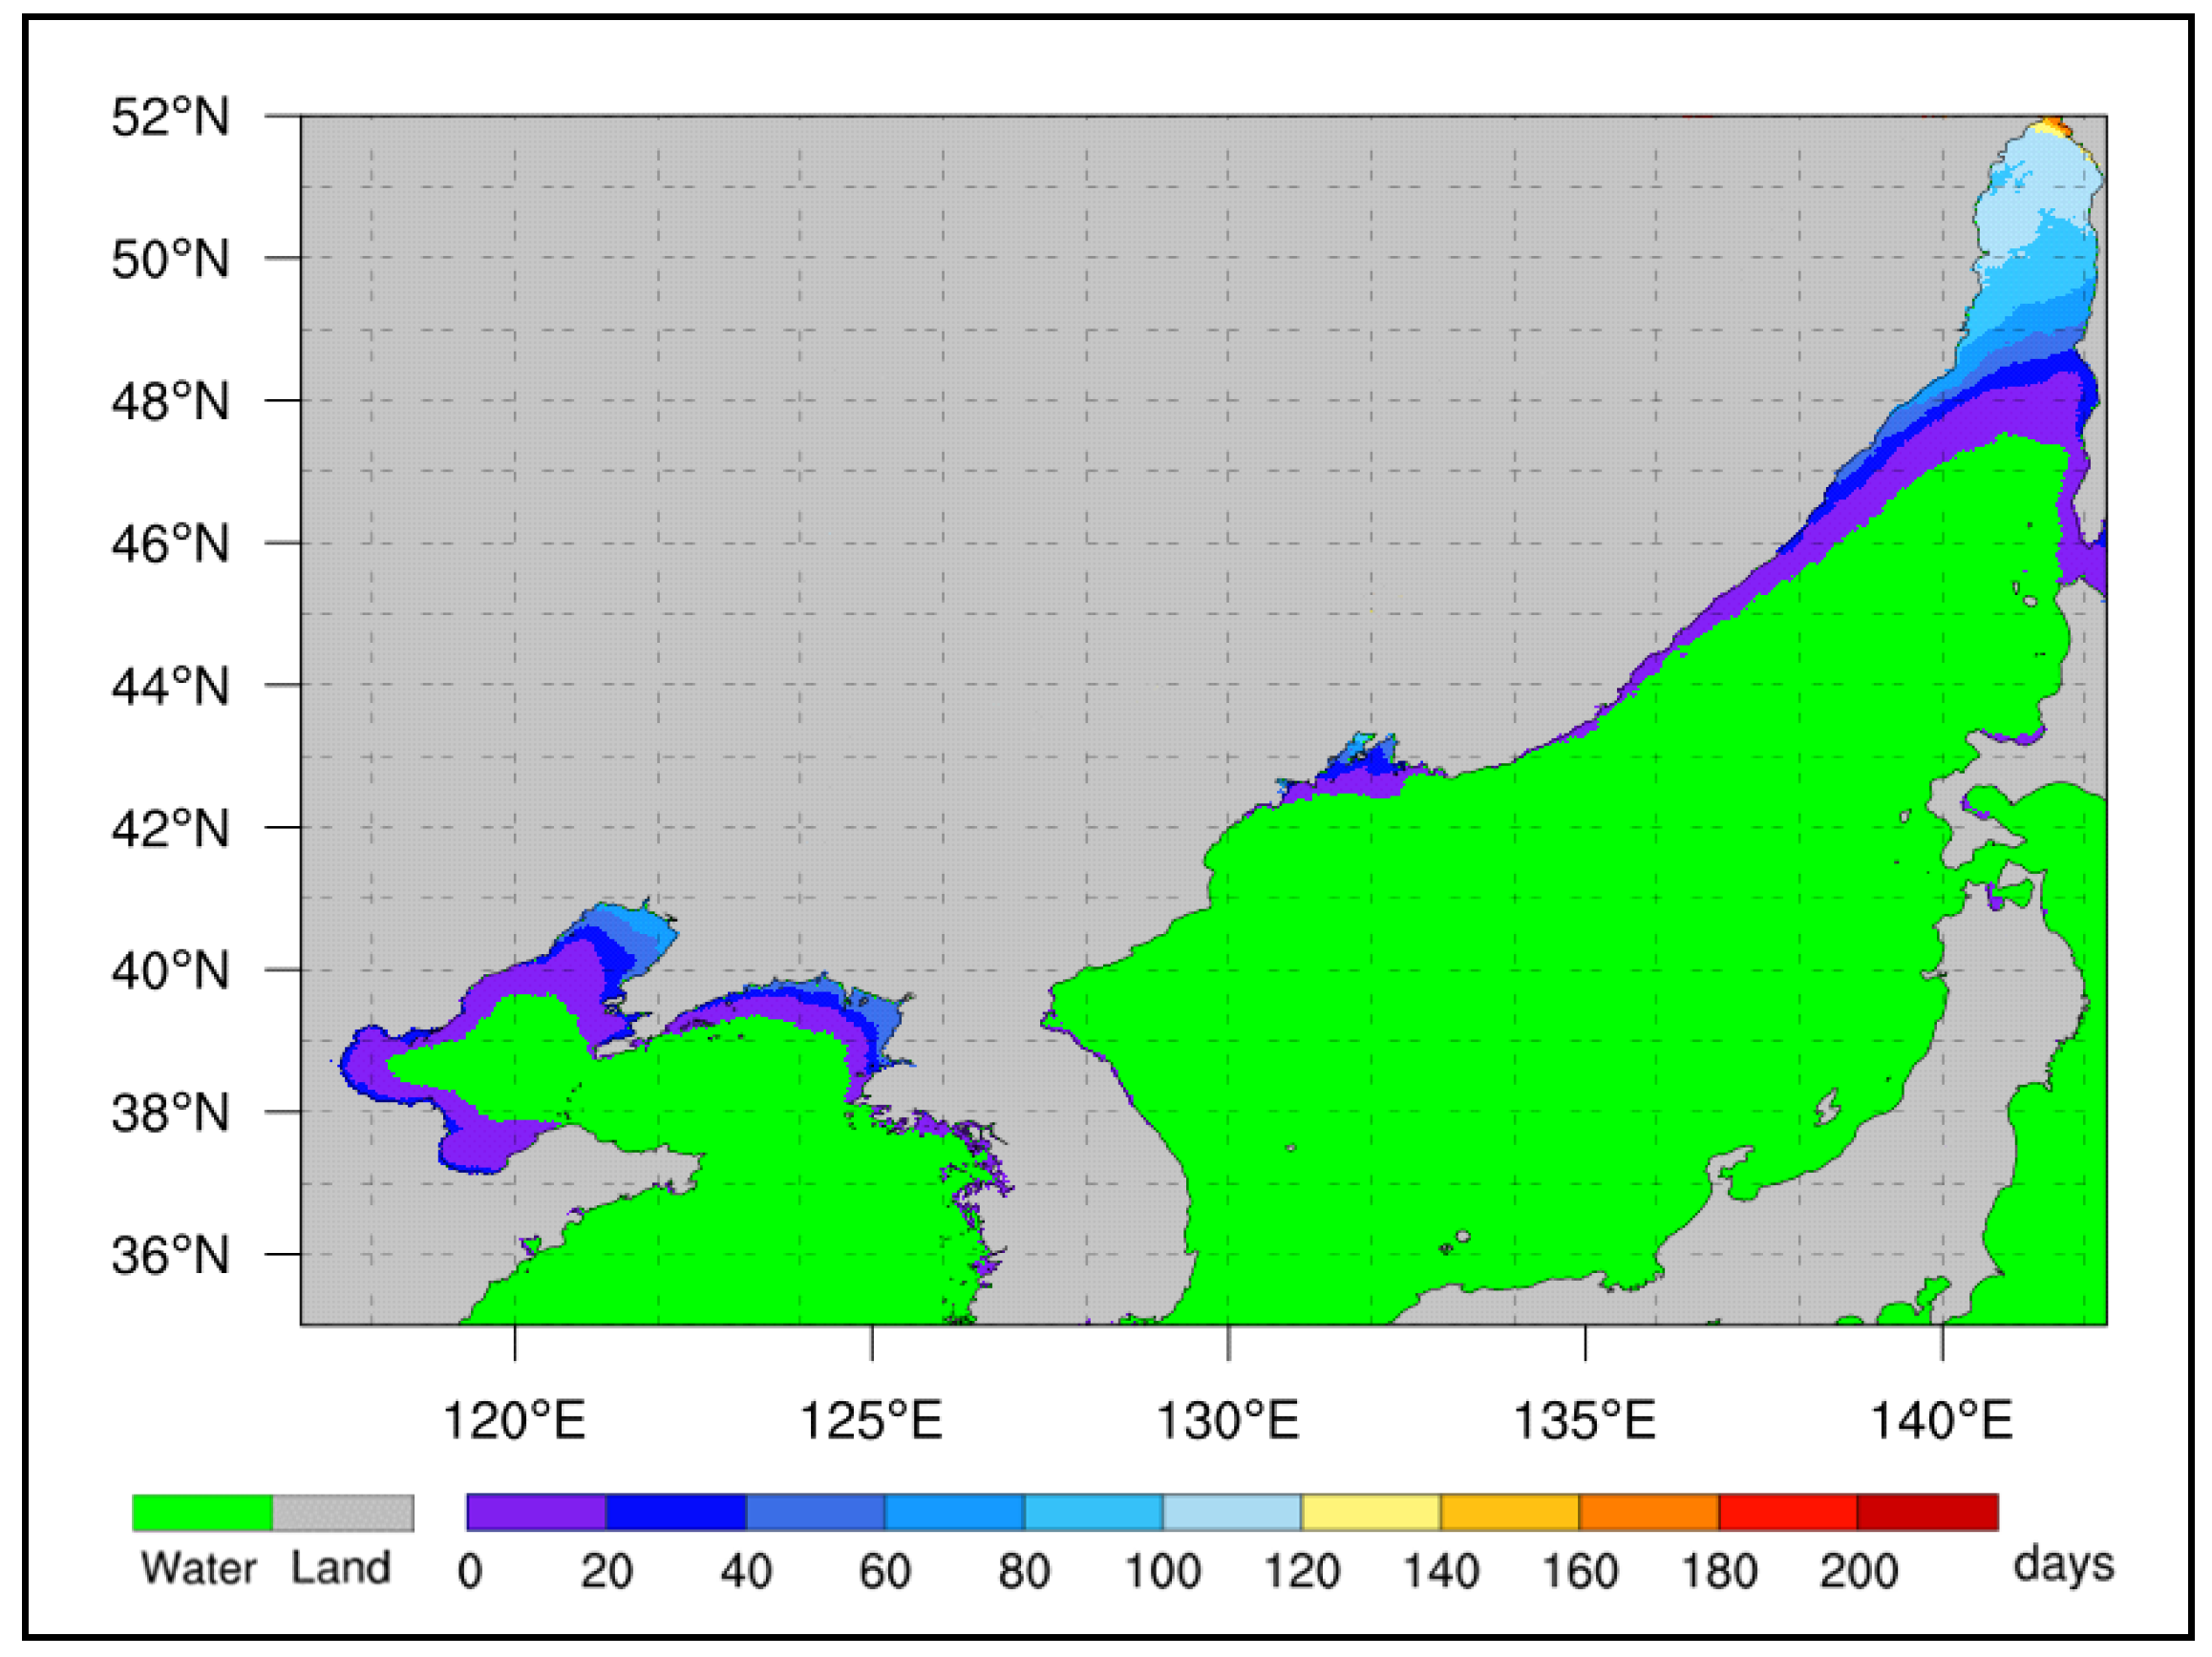
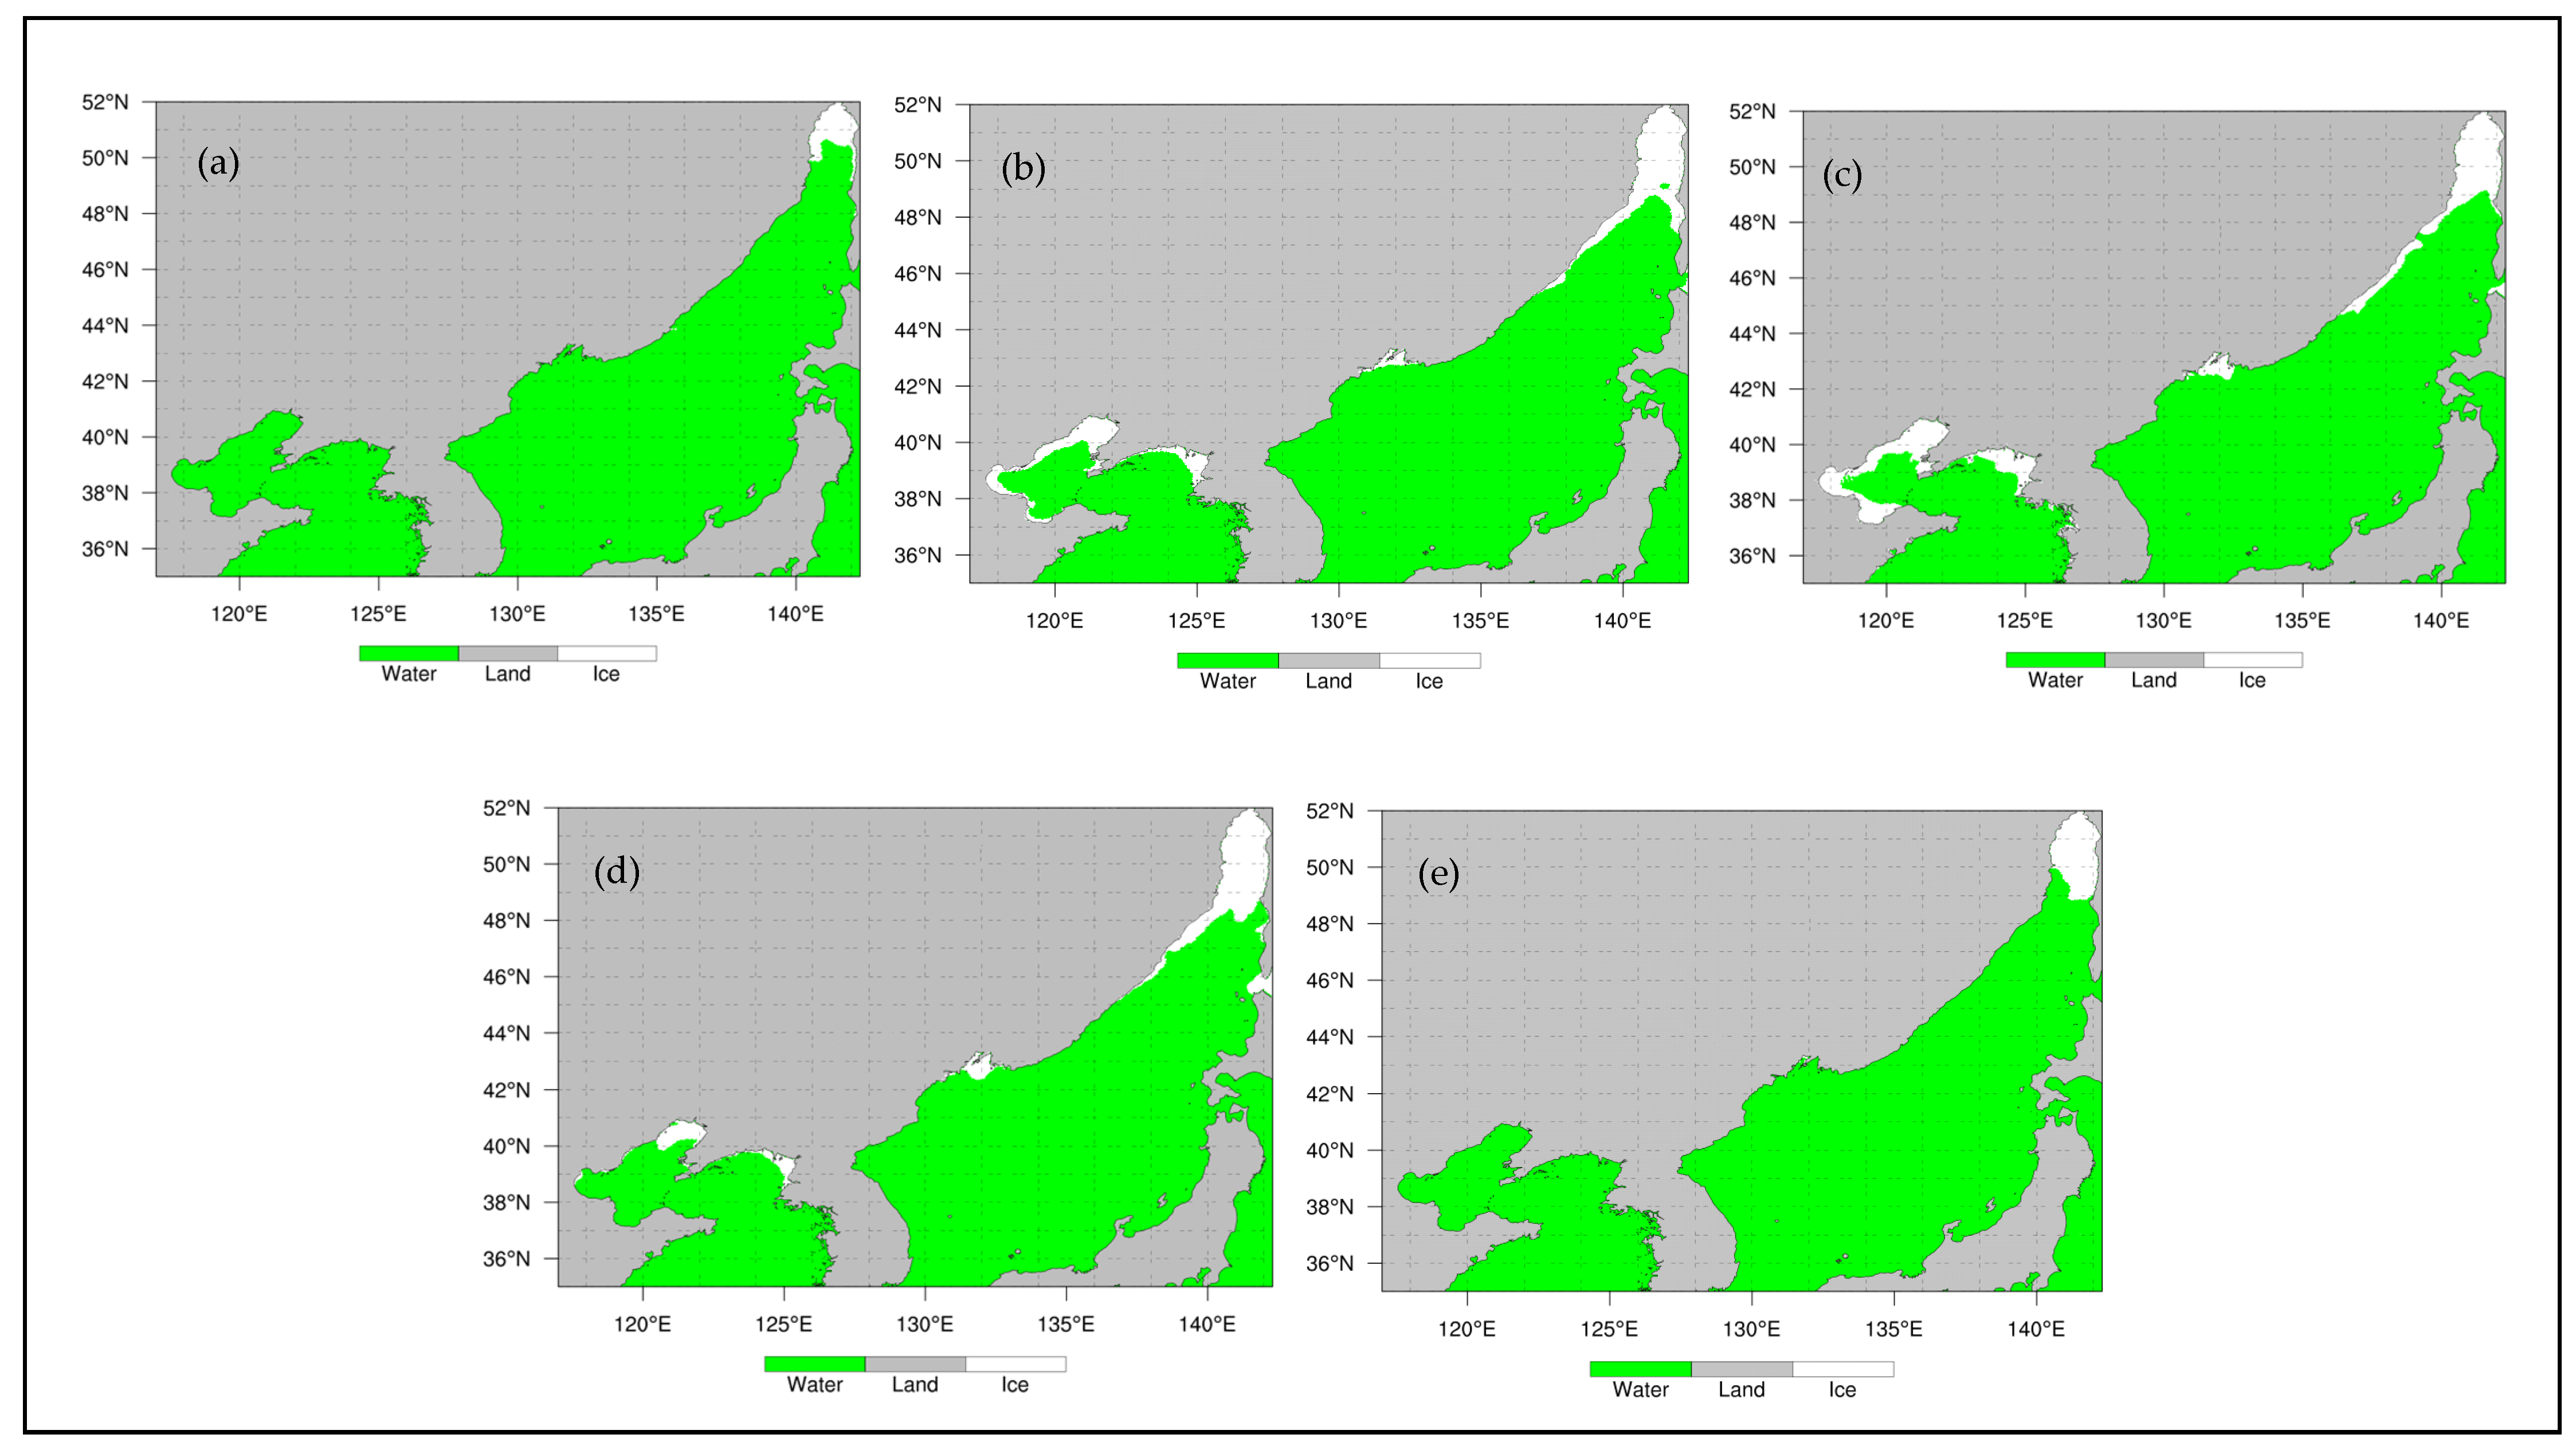
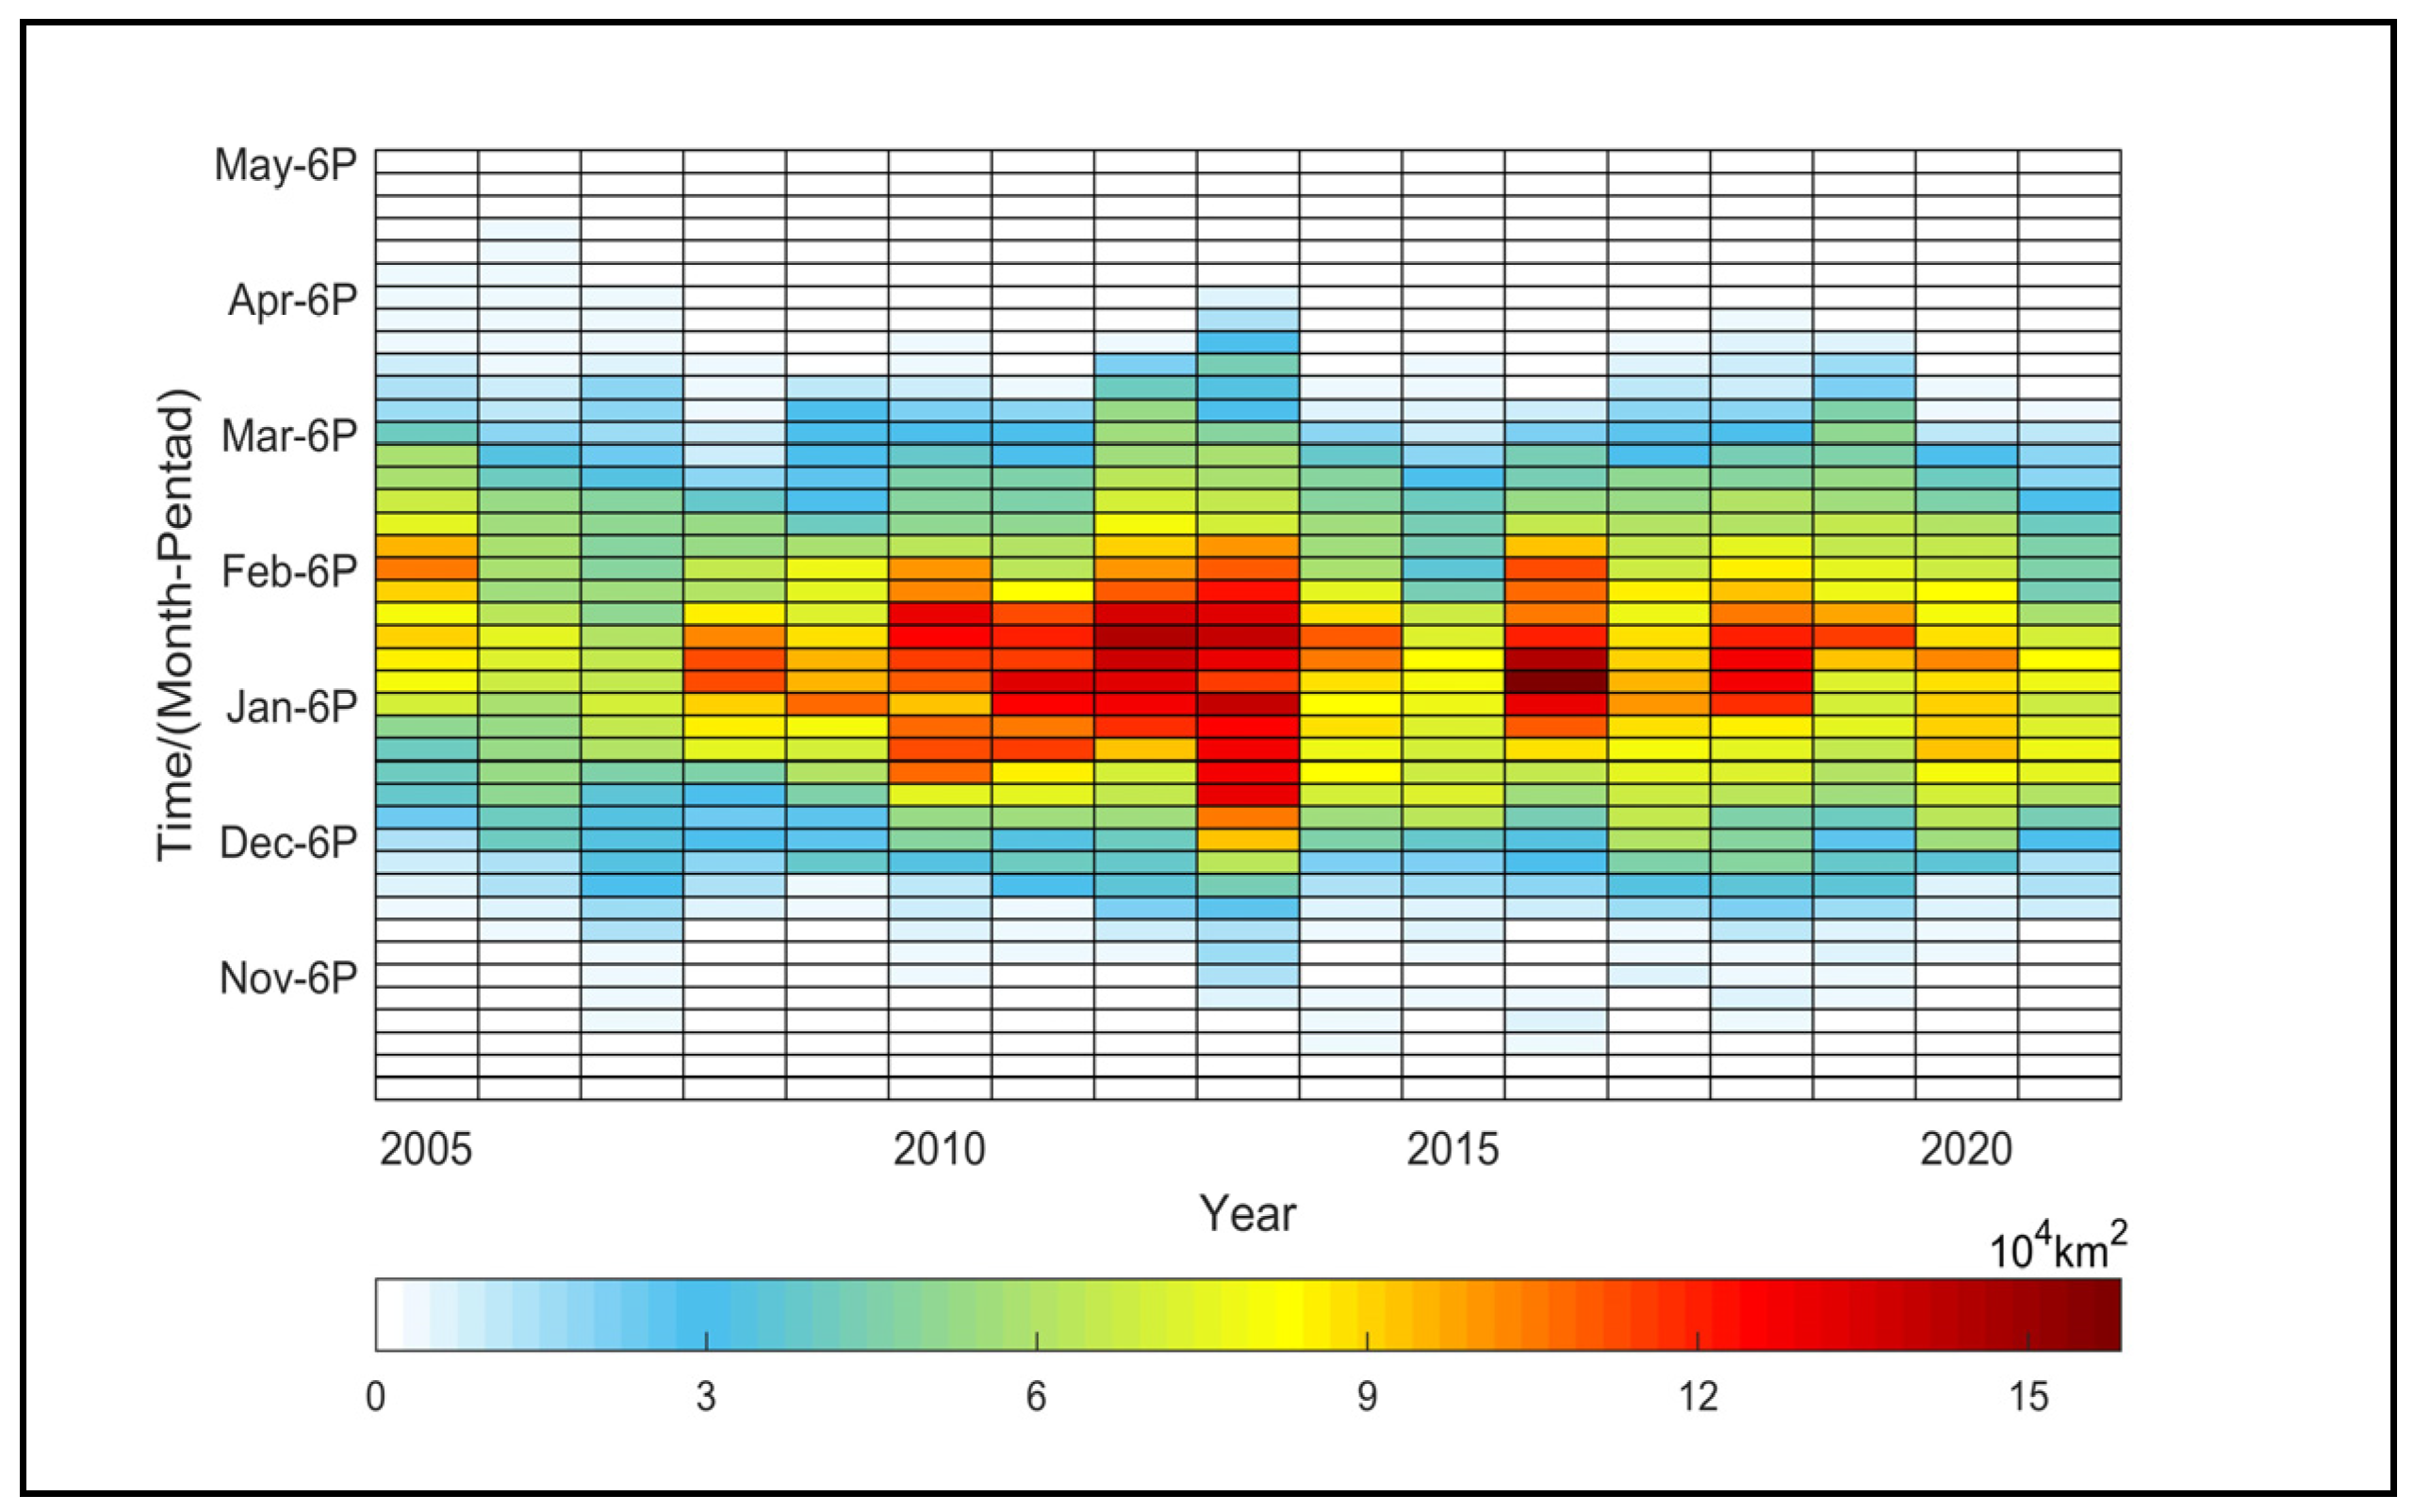
3.2. Spatial Characteristics of Sea Ice Extent

Figure 2 shows the spatial distribution of the annual average duration of sea ice cover in the marginal seas of East Asia from 2005 to 2021. The area with the longest duration of sea ice cover was the northern Sea of Japan. The annual average duration of the sea ice cover was more than 100 days in most of the Sea of Japan. The areas with the shortest duration of sea ice cover were Laizhou Bay and Bohai Bay. The annual average duration of the sea ice cover was approximately 20 days in most of Laizhou Bay and Bohai Bay. The duration of the sea ice cover reached 60 days in most of Liaodong Bay and Korea Bay. The duration of the sea ice cover in the nearshore waters was significantly longer than that in the open sea, and it gradually decreased from the coast to the open sea. The main reasons for the spatial differences of the sea ice were that the latitude of the northern Sea of Japan is higher, and the temperature is lower in winter, while the latitude of the Bohai Sea and Yellow Sea is lower, and the temperature is relatively higher in winter.
Large-scale sea ice appeared in 2013, and this year was selected as the typical year to analyze the intraseasonal variation characteristics of the sea ice in the whole marginal seas of East Asia (Figure 3). In the starting stage (Figure 3a), the sea ice first appeared in the northern Sea of Japan. In the increasing stage (Figure 3b), the sea ice appeared in the Bohai Sea, Yellow Sea and Peter the Great Bay, and the sea ice extent in the northern Sea of Japan continued to increase. In the peak stage (Figure 3c), the northwest coast of the Sea of Japan was covered by long and narrow sea ice, and there was a large amount of sea ice in Peter the Great Bay and on the coast of the Bohai Sea and northern Yellow Sea. In the decreasing stage (Figure 3d), the sea ice in the Yellow Sea and the Bohai Sea was mainly concentrated in Liaodong Bay and Korea Bay, and the sea ice in the Sea of Japan was distributed in the northern Sea of Japan and Peter the Great Bay. In the disappearing stage (Figure 3e), the extent of the sea ice in the areas with sea ice continuously decreased, and this was mainly limited to the northern Sea of Japan.

3.3. Variation Characteristics of Sea Ice Extent

Figure 4 shows the intraseasonal variation of the daily mean sea ice extent in the Bohai Sea, Yellow Sea, Peter the Great Bay and the northern Sea of Japan from 2005 to 2021. The maximum sea ice extent occurred from late January to mid-February, when the sea ice extent in the seas reached the maximum value in one year. The melting speed of the sea ice was significantly faster than the freezing speed, resulting in the asymmetry of the daily sea ice extent variations in the Bohai Sea and Yellow Sea (Figure 4a). The freezing and melting times of the sea ice were similar the Peter the Great Bay and the northern Sea of Japan. The ice period in the northern Sea of Japan was significantly longer than that of the Bohai Sea, Yellow Sea and Peter the Great Bay.
Figure 5a shows the interannual fluctuations of the MSIE in the marginal seas of East Asia from 2005 to 2021. The interannual fluctuations of the MSIE were large, with a maximum value of 17.4 × 10⁴ km2 in 2016 and a minimum value of 7.6 × 10⁴ km2 in 2007. Figure 5b shows the changes in the total sea ice extent of the marginal seas of East Asia over the past 17 years. The maximum value of 11.7 × 10⁶ km2 occurred in 2013, and the minimum value of 5.42 × 10⁶ km2 occurred in 2006 and 2007. In the past 17 years, the minimum value was less than half of the maximum value.
From 2005 to 2021, the trends in the MSIE (Figure 5a) and the total sea ice extent (Figure 5b) in the marginal seas of East Asia were not significant, but there were significant differences in the trends in each of the 9 years before and after 2013. This shows the change characteristic of increasing first and then decreasing over the past 17 years. From 2005 to 2013, the MSIE (Figure 5a) and the total sea ice extent (Figure 5b) both showed increasing trends, which were 0.912 × 10⁵ km2/10 yr and 0.722 × 10⁷ km2/10 yr, respectively, and both passed the significance test at the 0.05 level. From 2013 to 2021, the MSIE (Figure 5a) and the total sea ice extent (Figure 5b) both showed decreasing trends of −0.409 × 10⁵ km2/10 yr and −0.370 × 10⁷ km2/10 yr, respectively, but neither passed the significance test at the 0.05 level. From Table 2, it can be seen that the total sea ice extent for each month from 2005 to 2013 showed an increasing trend, and the increase was most obvious in January and February, with the trends of 0.286 × 10⁷ km2/10 yr and 0.221 × 10⁷ km2/10 yr, both of which passed the significance test at the 0.05 level. The total sea ice extent in each month from 2013 to 2021 showed a decreasing trend, with the most obvious decrease in January at −0.124 × 10⁷ km2/10 yr, which passed the significance test at the 0.1 level.
Figure 6 shows the annual-pentad profile of the sea ice extent in the marginal seas of East Asia from 2005 to 2021. The years 2008, 2012, 2016 and 2018 can be classified as the unimodal type, with the peaks appearing from the 1st pentad in February to the 3rd pentad in February. There were two relatively obvious peaks in 2010, which were characterized by the sea ice extent increasing first, then slightly decreasing, and then increasing once again, with peaks appearing on the 4th pentad in January and the 3rd and 4th pentads in February, respectively. There was no obvious peak in the sea ice extent in 2006 and 2007. The sea ice extent of the marginal seas of East Asia was always relatively large from the 6th pentad in January to the 1st pentad in March, resulting in the total sea ice extent in 2013 being the maximum over the past 17 years.

4. Discussion

The research shows that the longest duration of sea ice cover in the marginal seas of East Asia was in the northern coast of the Sea of Japan, and the duration of the sea ice cover in the coastal waters of all regions was significantly longer than that in the open sea. The phenomenon that the duration of the sea ice decreased from the seashore to the deep sea in Liaodong Bay was also pointed out by Wang et al. [12] and Baoleerqimuge [30]. The trend in the sea ice extent in the Bohai Sea and Yellow Sea showed to increase first and then decrease from 2005 to 2021. Liu et al. [15] found that the sea ice extent increased at first and then reduced in the Yellow Sea and Bohai Sea in 2007–2018. The results are similar to previous studies [12,15,30].
The different studies used different kinds of data in determining the first and last ice dates of the sea ice in the marginal seas of East Asia. Due to the differences in resolution, temporal and spatial coverage, cloud cover and data processing methods among the different studies, the results of the first and last ice dates in the different studies are, to a certain extent, different [12,24,26,31].
Influenced by atmospheric and marine environments, ice conditions have obvious interannual and interdecadal variabilities in the marginal seas of East Asia [32]. The interannual variability of sea ice in this area is obviously related to atmospheric factors, such as the intensity of the East Asia winter monsoon and the atmospheric circulation at 500 hPa [33]. The formation and evolution of the sea ice are not only affected by atmospheric conditions but also restricted by factors such as ocean circulation conditions, sea temperature and salinity structure [6]. The marginal seas of East Asia are relatively closed, and the changes in the sea ice are also controlled by local climatic factors [16].
The long-term change in the sea ice extent in the marginal seas of East Asia may be related to the overall trend of climate warming in East Asia and North China [34]. However, the time scale of the data in this study was short, and climate warming in Northeast Asia slowed down during the analysis period [35], which may be the main reason for the insignificant long-term trends of some sea ice indicators. Obtaining a longer series of high-resolution sea ice extent data and discussing the response mechanism of the long-term changes and variations in the sea ice extent in the marginal seas of East Asia to climate warming and natural climate variability are work that needs to be strengthened in the future.

5. Conclusions

Using high-resolution IMS multisource sea ice fusion data, the climatological characteristics and the trends in the sea ice cover in the marginal seas of East Asia were analyzed from 2005 to 2021, and the following conclusions were obtained.
(1) There were obvious differences in the first and last ice dates of the sea ice in the different sea areas of the marginal seas of East Asia, but the date of the maximum sea ice extent was relatively concentrated from 2005 to 2021. As the latitude of the northern Sea of Japan is the highest, the earliest freezing time, the latest melting time and the longest ice period were in this area. Laizhou Bay and Bohai Bay had the latest freezing time, the earliest melting time and the shortest ice period. The occurrence time of the largest sea ice extent was relatively stable in the marginal seas of East Asia and mostly concentrated in late January to mid-February.
(2) There were obvious spatial differences in the duration of the sea ice cover in the marginal seas of East Asia. The duration of the sea ice cover gradually decreased from the high latitudes to low latitudes and from near-shore waters to open seas in the marginal seas of East Asia over the past 17 years. The area with the longest duration of sea ice cover was the northern Sea of Japan. The areas with the shortest duration of sea ice cover were Laizhou Bay and Bohai Bay. The annual average duration of the sea ice cover was more than 100 days in most of the Sea of Japan and approximately 20 days in most of Laizhou Bay and Bohai Bay, reaching 60 days in most of Liaodong Bay and Korea Bay. The duration of the sea ice cover in the coastal waters was significantly longer than that in the open seas, and there were high-value bands of duration of sea ice cover along the coastline.
(3) The melting speed was significantly faster than the freezing speed in Bohai Sea and Yellow Sea, resulting in the asymmetric changes in the daily sea ice extent in the Bohai Sea and Yellow Sea. According to the number of occurrences of sea ice extent peaks, the style of the sea ice extents could be divided into single peak, double peak and stable.
(4) Over the past 17 years, the maximum sea ice extent in the marginal seas of East Asia reached a maximum value of 17.4 × 10⁴ km2 in 2016 and a minimum value of 7.6 × 10⁴ km2 in 2007. The sea ice extent of the marginal seas of East Asia from the 6th pentad in January to the 1st pentad in March was relatively large, resulting in the maximum of the total sea ice extent in 2013. The maximum sea ice extent and the total sea ice extent over the past 17 years had obvious differences in the change trend for the first and second halves of the period, and they all showed the change characteristics of first increasing and then decreasing. From 2005 to 2013, the trends in the maximum sea ice extent and the total sea ice extent were, respectively, 0.912 × 10⁵ km2/10 yr and 0.722 × 10⁷ km2/10 yr, which passed the significance test at the 0.05 level.

Author Contributions

L.Z. analyzed the data, made the figures and wrote the paper; G.R., M.X., F.M., R.L. and D.L. provided scientific advice and helped improve the paper; M.W. and D.J. revised the language and figures. All authors have read and agreed to the published version of the manuscript.

Funding

This study was funded by the Collaborative Innovation Project of Meteorological Science and Technology in the Bohai Rim (QYXM202101), Research on Key Technologies of Sea Visibility Grid Prediction Based on Multisource Fusion and Machine Learning in the Yellow Sea and Bohai Sea (CXFZ2022J028), the National Key Research and Development Program (2018YFA0605603) and the Transverse Item-Research Project of the Chinese Academy of Meteorological Sciences (Grant No. IN_JS_2022031).

Institutional Review Board Statement

Not applicable.

Informed Consent Statement

Not applicable.

Data Availability Statement

The data used in this study are publicly available via the National Snow and Ice Data Center https://nsidc.org/data/g02156 (Recently accessed date: 30 March 2022).

Acknowledgments

The authors acknowledge, with deep gratitude, the contribution of the anonymous reviewers whose time and effort in providing comments has improved this paper substantially.

Conflicts of Interest

The authors declare that there are no conflict of interest regarding the publication of this paper.

References

  1. Wang, X.Y.; Yuan, B.K.; Shang, J.; Ge, L. Disaster of sea ice and defense Countermeasures in the Bohai Sea and the Yellow Sea. Coast. Eng. 2011, 30, 46–55. [Google Scholar]
  2. Gu, W.; Liu, C.Y.; Yuan, S.; Li, N.; Chao, J.L.; Li, L.T.; Xu, Y. Spatial distribution characteristics of sea-ice-hazard risk in Bohai, China. Ann. Glaciol. 2013, 54, 73–79. [Google Scholar] [CrossRef] [Green Version]
  3. Zhang, D.Y.; Xu, N.; Yue, Q.J.; Liu, D. Sea Ice Problems in Bohai Bay Oil and Gas Exploitation. J. Coastal. Res. 2015, 73, 676–680. [Google Scholar] [CrossRef]
  4. IPCC. Summary for policymakers. In Climate Change 2021: The Physical Science Basis; Masson-Delmotte, V., Zhai, P., Pirani, A., Connors, S.L., Eds.; Working Group I Contribution to the Sixth Assessment Report of the Intergovernmental Panel on Climate Change; Cambridge University Press: Cambridge, UK, 2021; pp. 1–31. [Google Scholar]
  5. Park, K.A.; Kim, K.; Cornillon, P.C.; Chung, J.Y. Relationship between satellite-observed cold water along the Primorye coast and sea ice in the East Sea (the Sea of Japan). Geophys. Res. Lett. 2006, 33, L10602. [Google Scholar] [CrossRef]
  6. Liu, Y.; Liu, Q.Z.; Sui, J.P.; Song, J.X.; Bai, S. The respond of ice for the Bohai Sea and the Huanghai Sea with the general circulation and the climate change in winters. Acta Oceanol. Sin. 2013, 35, 18–27. [Google Scholar]
  7. Nihashi, S.; Ohshima, K.I.; Saitoh, S.I. Sea-ice production in the northern Japan Sea. Deep. Sea Res. 2017, 127, 65–76. [Google Scholar] [CrossRef]
  8. Yuan, S.; Liu, C.Y.; Liu, X.Q.; Chen, Y.; Zhang, Y.J. Research advances in remote sensing monitoring of sea ice in the Bohai Sea. Earth Sci. Inform. 2021, 14, 1729–1743. [Google Scholar] [CrossRef]
  9. Zhang, L.; Xu, B.; Liao, Z.H.; Shi, C.X.; Xu, M.; Sun, M.L. Development experiment of a global multi-source sea ice concentration fusion dataset. Acta Meteorol. Sin. 2021, 79, 703–715. [Google Scholar]
  10. Matveeva, T.A.; Semenov, V.A. Regional Features of the Arctic Sea Ice Area Changes in 2000–2019 versus 1979–1999 Periods. Atmosphere 2022, 13, 1434. [Google Scholar] [CrossRef]
  11. Jiao, Y.; Zhang, Y.Q.; Hu, P. Can Arctic Sea Ice Influence the Extremely Cold Days and Nights in Winter over the Tibetan Plateau. Atmosphere 2022, 13, 246. [Google Scholar] [CrossRef]
  12. Wang, M.; Wu, S.L.; Zheng, W.; Zhao, C.H.; Liu, C. Temporal-Spatial Distribution of Bohai Sea Sea Ice in Long-Time Series and Its Correlation with Air Temperature. Meteor. Mon. 2016, 42, 1237–1244. [Google Scholar]
  13. Ouyang, L.X.; Hui, F.M.; Zhu, L.X.; Cheng, X.; Cheng, B.; Shokr, M.; Zhao, J.C.; Ding, M.H.; Zeng, T. The spatiotemporal patterns of sea ice in the Bohai Sea during the winter seasons of 2000–2016. Int. J. Digit. Earth. 2019, 12, 893–909. [Google Scholar] [CrossRef]
  14. Yan, Y.; Uotila, P.; Huang, K.Y.; Gu, W. Variability of sea ice area in the Bohai Sea from 1958 to 2015. Sci. Total. Environ. 2020, 709, 136164. [Google Scholar] [CrossRef] [PubMed]
  15. Liu, C.; Cao, X.C.; Yin, Z.H.; Geng, D.P. Climatic characteristics of sea ice extent and its response to meteorological factors in the Yellow Sea and the Bohai Sea during 2007–2018. Mar. Sci. Bull. 2019, 38, 173–178. [Google Scholar]
  16. Ken, I.; Takuya, I. Millennial-scale fluctuations in seasonal sea-ice and deep-water formation in the Japan Sea during the late Quaternary. Palaeogeogr. Palaeoclimatol. Palaeoecol. 2007, 247, 131–143. [Google Scholar]
  17. Wang, R.F.; Huang, D.; Zhang, X.; Wei, P. Combined pattern matching and feature tracking for Bohai Sea ice drift detection using Gaofen-4 imagery. Int. J. Remote Sens. 2020, 41, 7486–7508. [Google Scholar] [CrossRef]
  18. Lee, H.S.; Lee, K.S. Capability of geostationary satellite imagery for sea ice monitoring in the Bohai and Yellow seas. J. Mar. Sci. Technol. 2016, 24, 1129–1135. [Google Scholar]
  19. Shi, W.; Wang, M.H. Sea ice properties in the Bohai Sea measured by MODIS-Aqua: 2. Study of sea ice seasonal and interannual variability. J. Mar. Syst. 2012, 95, 32–40. [Google Scholar] [CrossRef]
  20. Comiso, J.C.; Nishio, F. Trends in the sea ice cover using enhanced and compatible AMSR-E, SSM/I, and SMMR data. J. Geophys. Res. 2008, 113, C02S07. [Google Scholar] [CrossRef] [Green Version]
  21. Cavalieri, D.J.; Parkinson, C.L. Arctic sea ice variability and trends, 1979–2010. Cryosphere 2012, 6, 881–889. [Google Scholar] [CrossRef] [Green Version]
  22. Lavergne, T.; Sørensen, A.M.; Kern, S.; Tonboe, R.; Notz, D.; Aaboe, S.; Bell, L.; Dybkjær, G.; Eastwood, S.; Gabarro, C.; et al. Version 2 of the EUMETSAT OSI SAF and ESA CCI sea-ice concentration climate data records. Cryosphere 2019, 13, 49–78. [Google Scholar] [CrossRef] [Green Version]
  23. Su, H.; Ji, B.W.; Wang, Y.P. Sea Ice Extent Detection in the Bohai Sea Using Sentinel-3 OLCI Data. Remote Sens. 2019, 11, 2436. [Google Scholar] [CrossRef] [Green Version]
  24. Xie, Y.; Koch, S.; Mcginley, J.; Albers, S.; Bieringer, P.E.; Wolfson, M.; Chan, M. A space-time multiscale analysis system: A sequential variational analysis approach. Mon. Weather. Rev. 2011, 139, 1224–1240. [Google Scholar] [CrossRef]
  25. Shen, Y.; Zhao, P.; Pan, Y.; Yu, J.J. A high spatiotemporal gauge-satellite merged precipitation analysis over China. J. Geophys. Res. Atmos. 2014, 119, 3063–3075. [Google Scholar] [CrossRef]
  26. Shi, C.X.; Pan, Y.; Gu, J.X.; Xu, B.; Han, S.; Zhu, Z.; Zhang, L.; Sun, S.; Jiang, Z.J. A review of multi-source meteorological data fusion products. Acta. Meteor. Sin. 2019, 77, 774–783. [Google Scholar]
  27. Ramsay, B.H. The interactive multisensor snow and ice mapping system. Hydrol. Process. 1998, 12, 1537–1546. [Google Scholar] [CrossRef]
  28. Helfrich, S.; McNamara, D.; Ramsay, B.; Baldwin, T.; Kasheta, T. Enhancements to, and forthcoming developments in the interactive multisensor snow and ice mapping system (IMS). Hydrol. Process. 2007, 21, 1576–1586. [Google Scholar] [CrossRef]
  29. Meier, W.N.; Fetterer, F.; Stewart, J.S.; Helfrich, S. How do sea-ice concentrations from operational data compare with passive microwave estimates? Implications for improved model evaluations and forecasting. Ann. Glaciol. 2015, 56, 332–340. [Google Scholar] [CrossRef]
  30. Baoleerqimuge. The Long Term Change Characteristics of China Offshore Sea Surface Temperature and Its Effect on Coastal Climate; Chinese Academy of Meteorological Sciences: Beijing, China, 2014; pp. 1–99. [Google Scholar]
  31. Liu, Y.; Wu, H.D. Sea ice in the Bohai sea and the northern yellow sea. Mar. Forecast 2017, 34, 94–101. [Google Scholar]
  32. Xiao, W.X. Characteristics of Sea Ice in Northeast Asia and its Reasons; Chinese Academy of Meteorological Sciences: Beijing, China, 2017; pp. 1–69. [Google Scholar]
  33. Tang, M.N.; Hong, J.L.; Liu, Y.; Sui, J.P.; Zhao, Q. Statistical Analysis of Climatic factors impacting on the Bohai Sea ice. Mar. Sci. Bull. 2015, 34, 152–157. [Google Scholar]
  34. Wen, K.M.; Ren, G.Y.; Li, J.; Zhang, A.Y.; Ren, Y.Y.; Sun, X.B.; Zhou, Y.Q. Recent surface air temperature change over mainland China based on an urbanization-bias adjusted dataset. J. Clim. 2019, 32, 2691–2705. [Google Scholar] [CrossRef]
  35. Sun, X.B.; Ren, G.Y.; Ren, Y.Y.; Fang, Y.H.; Liu, Y.L.; Xue, X.Y.; Zhang, P.F. A remarkable climate warming hiatus over Northeast China since 1998. Theor. Appl. Climatol. 2018, 133, 579–594. [Google Scholar] [CrossRef]
Figure 1. The study region.
Atmosphere 14 00207 g001
Figure 2. Annual average duration of sea ice cover in the marginal seas of East Asia from 2005 to 2021.
Atmosphere 14 00207 g002
Figure 3. Spatial distribution of sea ice extents in the different stages of a start (a), increase (b), peak (c), decrease (d) and disappearance (e) in the marginal seas of East Asia.
Atmosphere 14 00207 g003
Figure 4. Daily mean sea ice extent (black, solid line) and standard deviation (blue area) in the Bohai Sea and Yellow Sea (a), Peter the Great Bay (b) and the northern Sea of Japan (c) from 2005 to 2021.
Atmosphere 14 00207 g004
Figure 5. Annual maximum sea ice extent (a) and total sea ice extent (b) in the marginal seas of East Asia from 2005 to 2021.
Atmosphere 14 00207 g005
Figure 6. Sea ice extent of the marginal seas of East Asia in 2005–2021 (unit: 104 km2).
Atmosphere 14 00207 g006
Table 1. The statistics for the first ice date, last ice date, the date of the MSIE and the ice period in the different regions of the marginal seas of East Asia from 2005 to 2021.
RegionFirst Ice DateLast Ice DateThe Date of MSIEIce Period and Standard Deviation (Days)
Liaodong Bay8 December12 March8 February94 ± 19
Bohai Bay19 December6 March29 January77 ± 30
Laizhou Bay25 December2 March28 January67 ± 34
Korea Bay10 December10 March9 February90 ± 20
Peter the Great Bay9 December11 April13 February123 ± 27
Northern Sea of Japan13 November16 May10 February184 ± 7
MSIE: maximum sea ice extent.
Table 2. Trends in the total sea ice extent in the marginal seas of East Asia (unit: 107 km2/10 yr).
DecJanFebMarAprYear
2005–20210.0150.0390.012−0.005−0.002−0.058
2005–20130.098 **0.286 **0.221 **0.0580.056 **0.722 **
2013–2021−0.049−0.124 *−0.101−0.058−0.032−0.370 *
* Passed the significance test at the 0.1 level; ** passed the significance test at the 0.05 level.
Disclaimer/Publisher’s Note: The statements, opinions and data contained in all publications are solely those of the individual author(s) and contributor(s) and not of MDPI and/or the editor(s). MDPI and/or the editor(s) disclaim responsibility for any injury to people or property resulting from any ideas, methods, instructions or products referred to in the content.

