Article

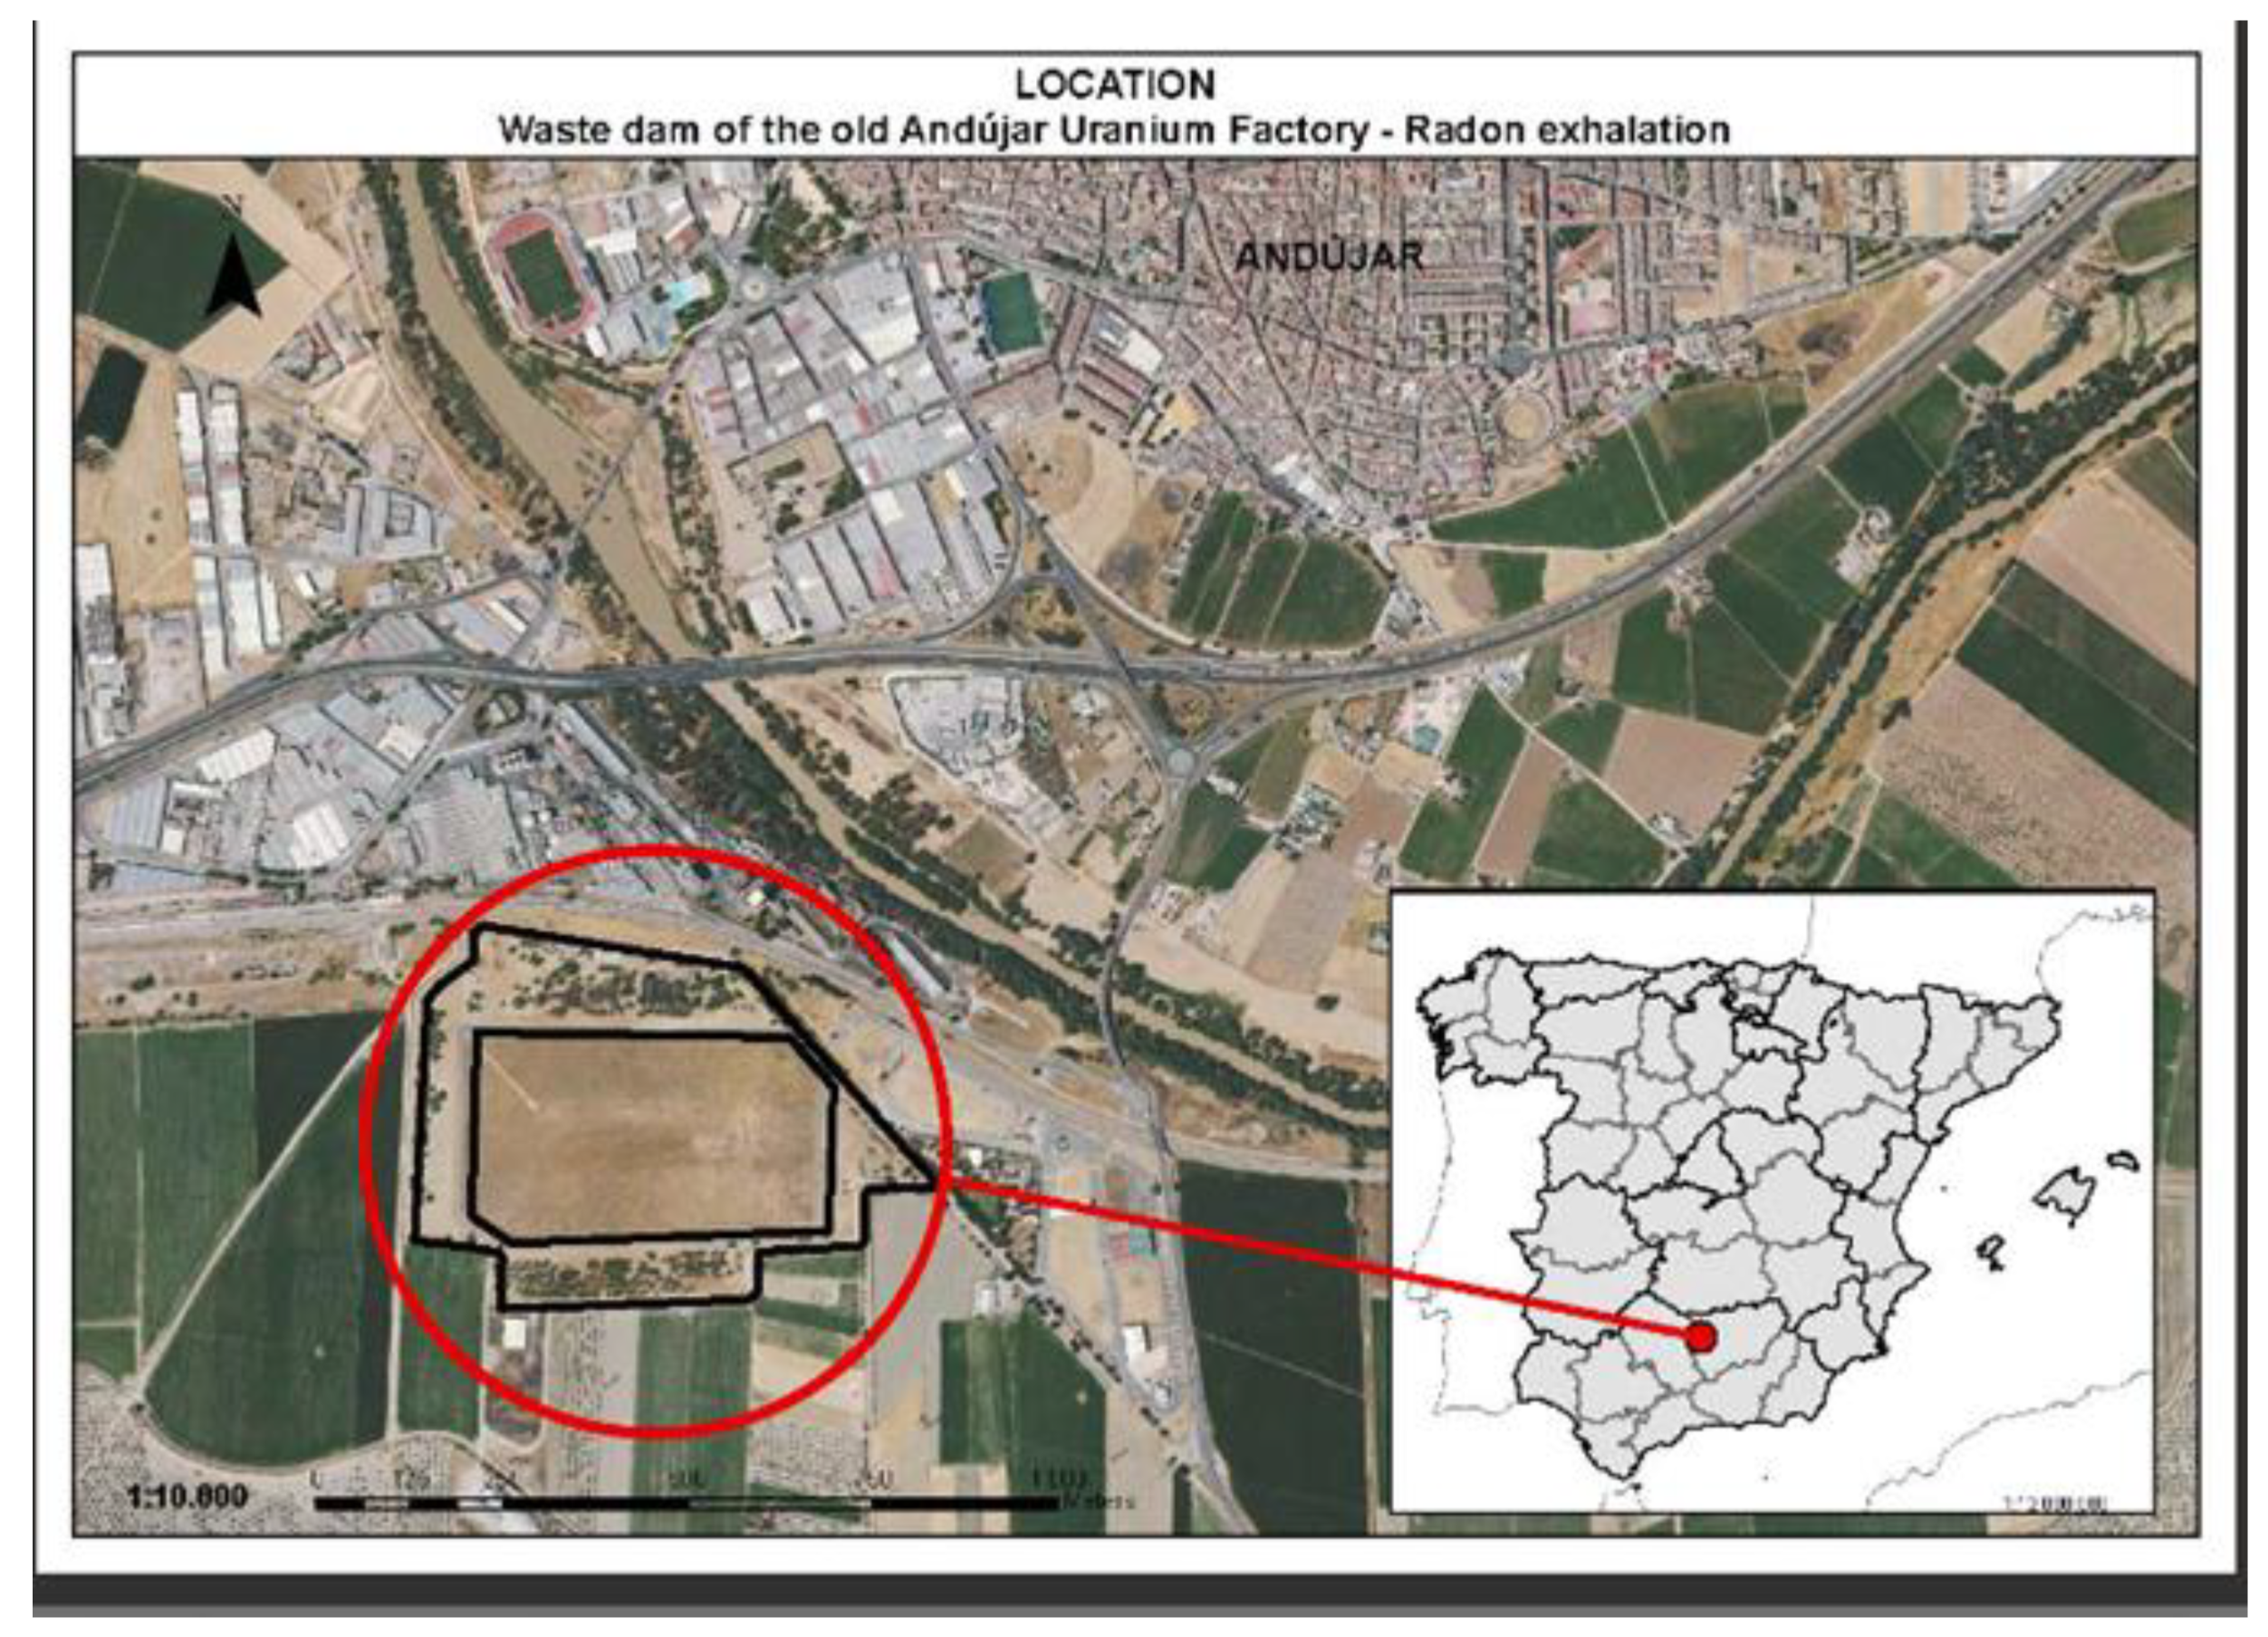
Control of Radon Flux of an Inactive Uranium Mill Facility in Spain

1
Radon Group, University of Cantabria, 39011 Santander, Spain
2
Siglo XXI, Oleiros, 15172 A Coruña, Spain
*
Author to whom correspondence should be addressed.
Atmosphere 2023, 14(10), 1536; https://doi.org/10.3390/atmos14101536
Submission received: 14 August 2023 / Revised: 29 September 2023 / Accepted: 3 October 2023 / Published: 8 October 2023

Abstract

:
As part of a contract with ENRESA (National Radioactive Waste Company S.A. is a Spanish public company responsible for the management of radioactive waste), after the closure of the uranium mill factory in Andújar, Spain, continuous measurements of the radon flux have been carried out on an annual basis using activated carbon detectors following a methodology established in our laboratory (ISO 11665-7, 2012). The results obtained and their usefulness are presented from the point of view of control of the closure conditions established by the competent authority in order to minimize the impact of the site on the environment.

1. Introduction

Radon flux from naturally occurring porous materials, like soil and rocks, as well as man-made materials like mining subproducts and building materials has been the subject of research activities for several decades [1,2,3]. It has also been used to plan, monitor, and evaluate the remediation of uranium mine and mill sites. In the USA, regulations require that the radon flux from active uranium mill tailing should not exceed 2666 Bqm−2 h−1 (EPA-520/5-85-029, 1986 [4]). The IAEA (International Atomic Energy Agency) published the report Technical series nº 474 [5] related to the measurement and calculation of radon releases from NORM (naturally occurring radioactive materials) residues in 2013. Sahu, P. [6], in 2014, performed a review of the sources of radon and its measurement techniques in underground uranium mines. Lopez Coto et al. [7] established that radon flux measurements are also of interest for phosphogypsum piles and their remediation due to their high radium content. Hassan et al. [8] concluded that the release of radon atoms from the material grains to pore spaces is caused by processes such as recoil and diffusion.
The Uranium Mill Factory in Andújar is located in the province of Jaén, Andalucía, at 1.5 km south from the urban center of Andújar (Figure 1). The site is a flat area of approximately 175,000 m2. A very low permeability shale on alluvial clays and gravel underlies the site. The Andújar facility was designed for processing low-grade uranium ore and produced 80% concentrate of U3O8 in the form of sodium and ammonium uranate at a rate of 60–80 thousand kg per year. The plant was in operation from November 1959 until July 1981. All the solid wastes generated during the plant’s operations, approximately 1200 million kg, are contained in the tailing pile, which covers 94,000 m2 and has a volume of 980,000 m3 with a total activity of 4500 Ci [9]. In 1986, the facility was transferred to the Spanish National Company of Radioactive Wastes (ENRESA) for the long-term conditioning of tailings and later the closure of the facility.
In 1991, the Ministry of Industry established the criteria related to the execution of activities to dismantle and restore the site of the Andújar Uranium Factory for its closure (BOE 5 February 1991 [10]). In 1999, the sealing of the mines and the storage under a mound of 400 cages with radioactive waste was considered the end of the task of dismantling the Andújar mine, although the dismantling and recovery of spaces does not mean that the environmental problems have ended. The Nuclear Safety Council (CSN; competent body in Spain in matters of nuclear safety and radiological protection) must carry out an annual inspection to find out the levels of groundwater contamination, which are still higher than those established within the factory site. The radiological protection objective and design criteria that govern the dismantling and site restoration activities have been established by the CSN, taking into account the recommendations of international organizations (ICRP—International Commission on Radiological Protection; IAEA; and OCDE/NEA—Nuclear Energy Agency). The program reduces the radon flux over the surface of the final pile to an average release rate of less than 2664 Bq m−2 h−1.
In this paper, we present the monitoring results, from 2001 to the present, of the value of the radon flux through the restored surface.

2. Materials and Methods

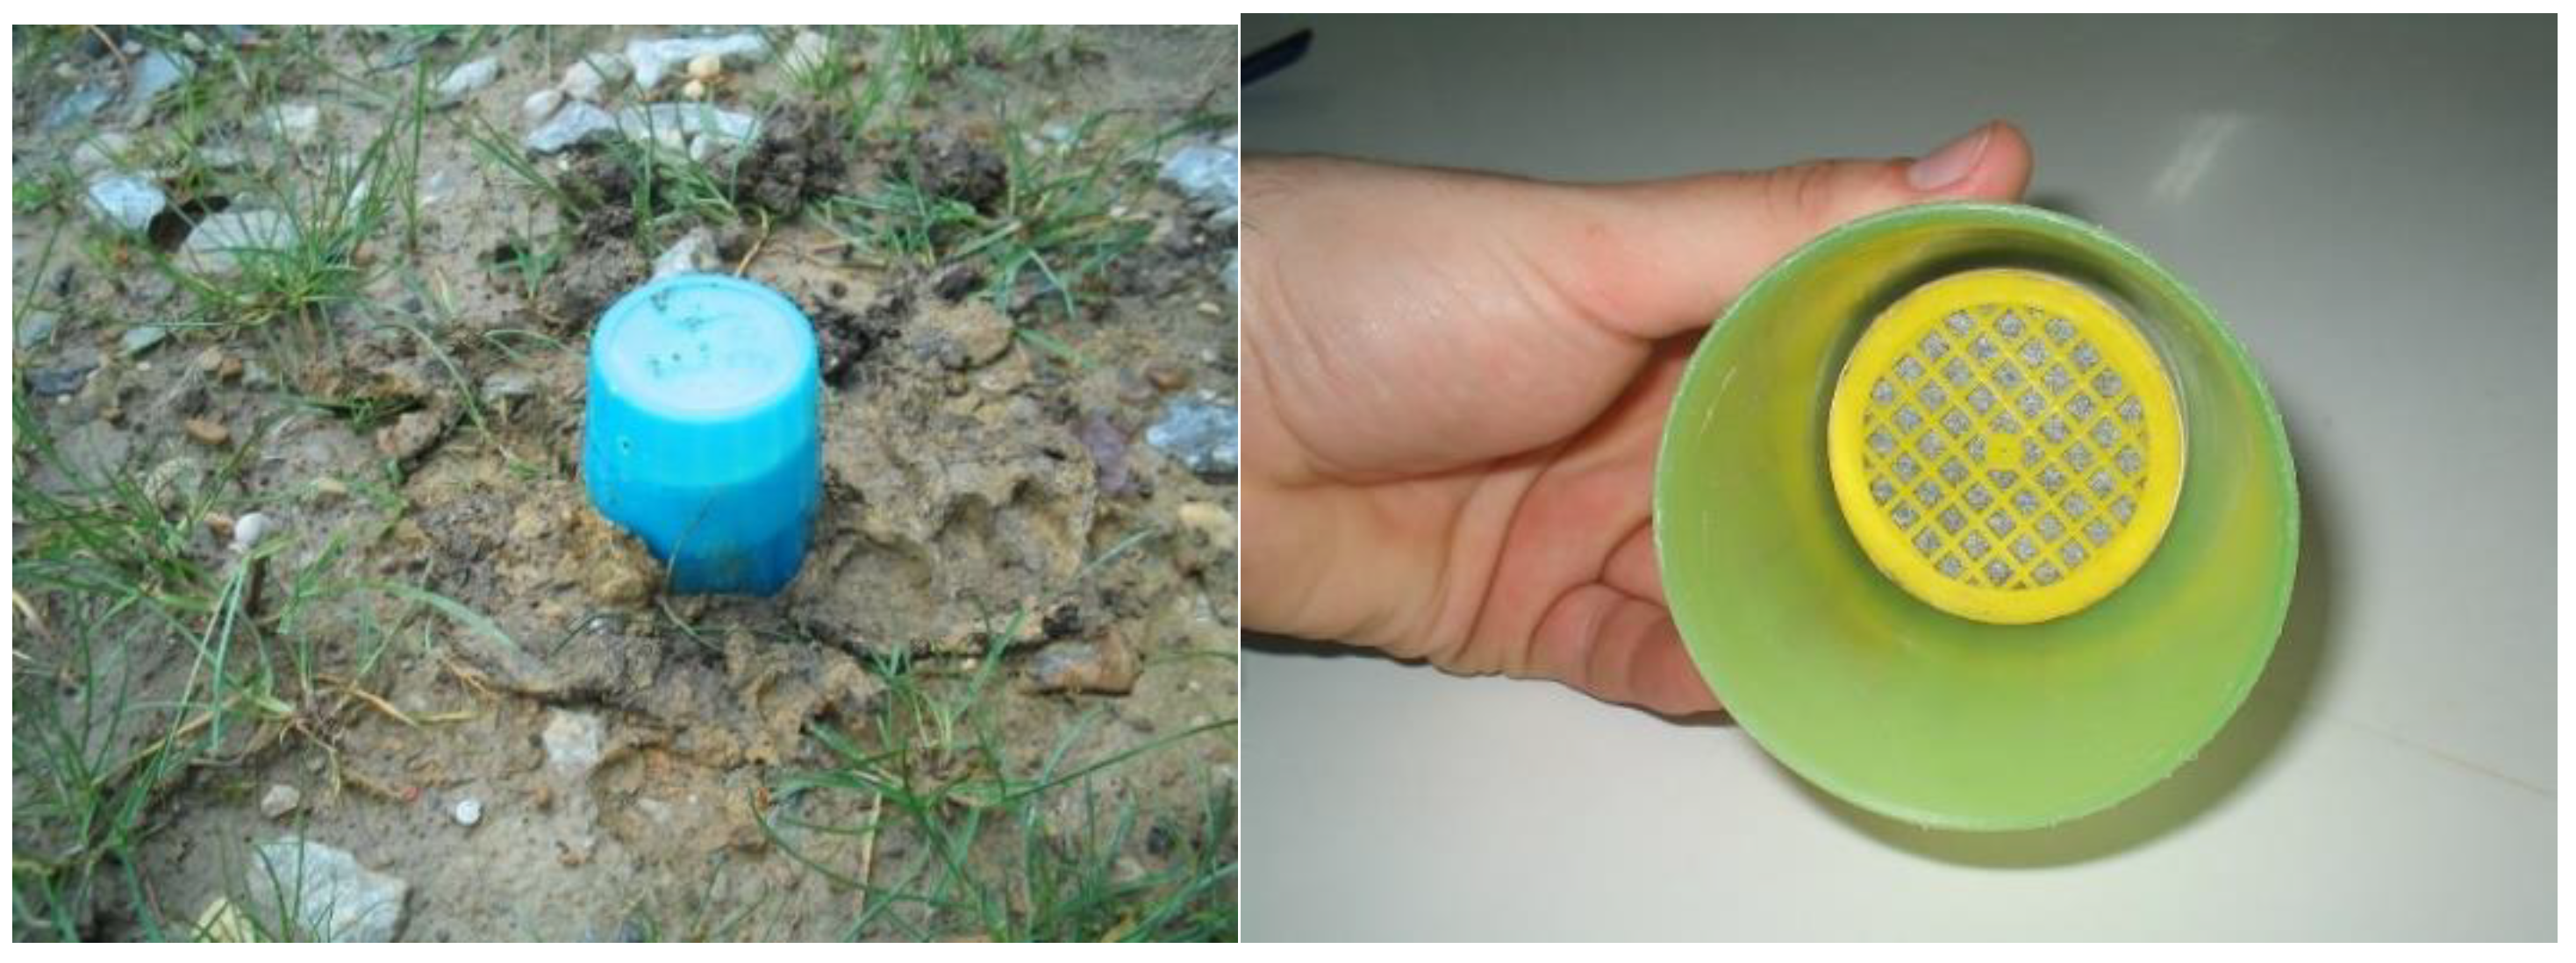
2.1. Radon Flux Measurement Used in Large Area Collectors

The method used to perform the radon flux measurements involves absorption of radon into activated charcoal in a large area collector. This method has been used extensively since the publication by Wilkening et al. [11], with many different collector geometries. The radon collector is placed on the surface of the material to be measured and it is allowed to collect radon for a time period more than 24 h. The accumulated radon in the charcoal is then measured by gamma spectroscopy.
The activated charcoal method is more appropriate in this case than other published methods (ISO 11665-7, [12]) because a very large area has to be measured. The charcoal canisters allow for the placement of many detectors that can be disseminated on a wide extension at the same time, making the cost of numerous measurements very cheap when compared with other methods. The 0.0038 m2 collector is inside a cap or PVC capsule as shown in Figure 2. Approximately 70 g of activated charcoal is spread onto the distribution grid. The top is very rugged, and therefore ideal for field use. A small hole on top of the cap is necessary to equalize the pressure and to prevent the disturbance of the normal radon flux from the soil.
The collectors are deployed by twisting the cap firmly on the surface of the material to be measured. The deployment situation and time are recorded in a notebook. After 24 h of exposure, the collectors are picked up and the time is recorded. The charcoal canister is extracted from the cap and sealed with aluminum tape to avoid radon leakages. The radon trapped in the charcoal is kept in equilibrium for 3 h before counting, to allow ingrowth of the radon daughters.
The amount of radon adsorbed in activated charcoal is determined by gamma spectroscopy. The gamma spectroscopy system used in this study consists of a NaI(Tl) crystal, a photomultiplier tube, an amplifier, and a pulse counter. The peaks of Pb-214 (242, 295 and 352 keV) and Bi-214 (669 keV) are used.
A basic National Bureau of Standards (NBS) for Ra-226 adsorbed in charcoal is measured at least once daily to determine the efficiency count in cpm Bq−1. An unexposed container of charcoal is also counted each day to determine the background. The radon flux is calculated from the net counts, collector area, exposure time, and system efficiency count. A detailed procedure for preparing and deploying collectors and calculating the radon flux is presented in a previous publication [13].
This radon flux measurement method includes two basic assumptions. First, it is assumed that charcoal is 100% effective in collecting radon. For short time periods (<36 h), this assumption is considered valid [14]. Charcoal may not be 100% effective, however, if longer exposure times are used. The main factors affecting the effectiveness of charcoal for radon collection are temperature and humidity. Figure 3 shows the correction factor for this last parameter. Longer exposure times can be used in the winter than in the summer. Twenty-four hours is a conservative estimate of a valid exposure time during any time of the year. The second assumption is that the measured radon flux is constant over the exposure period. Although this condition is known to be rarely, if ever, encountered, the introduced errors are relatively small.

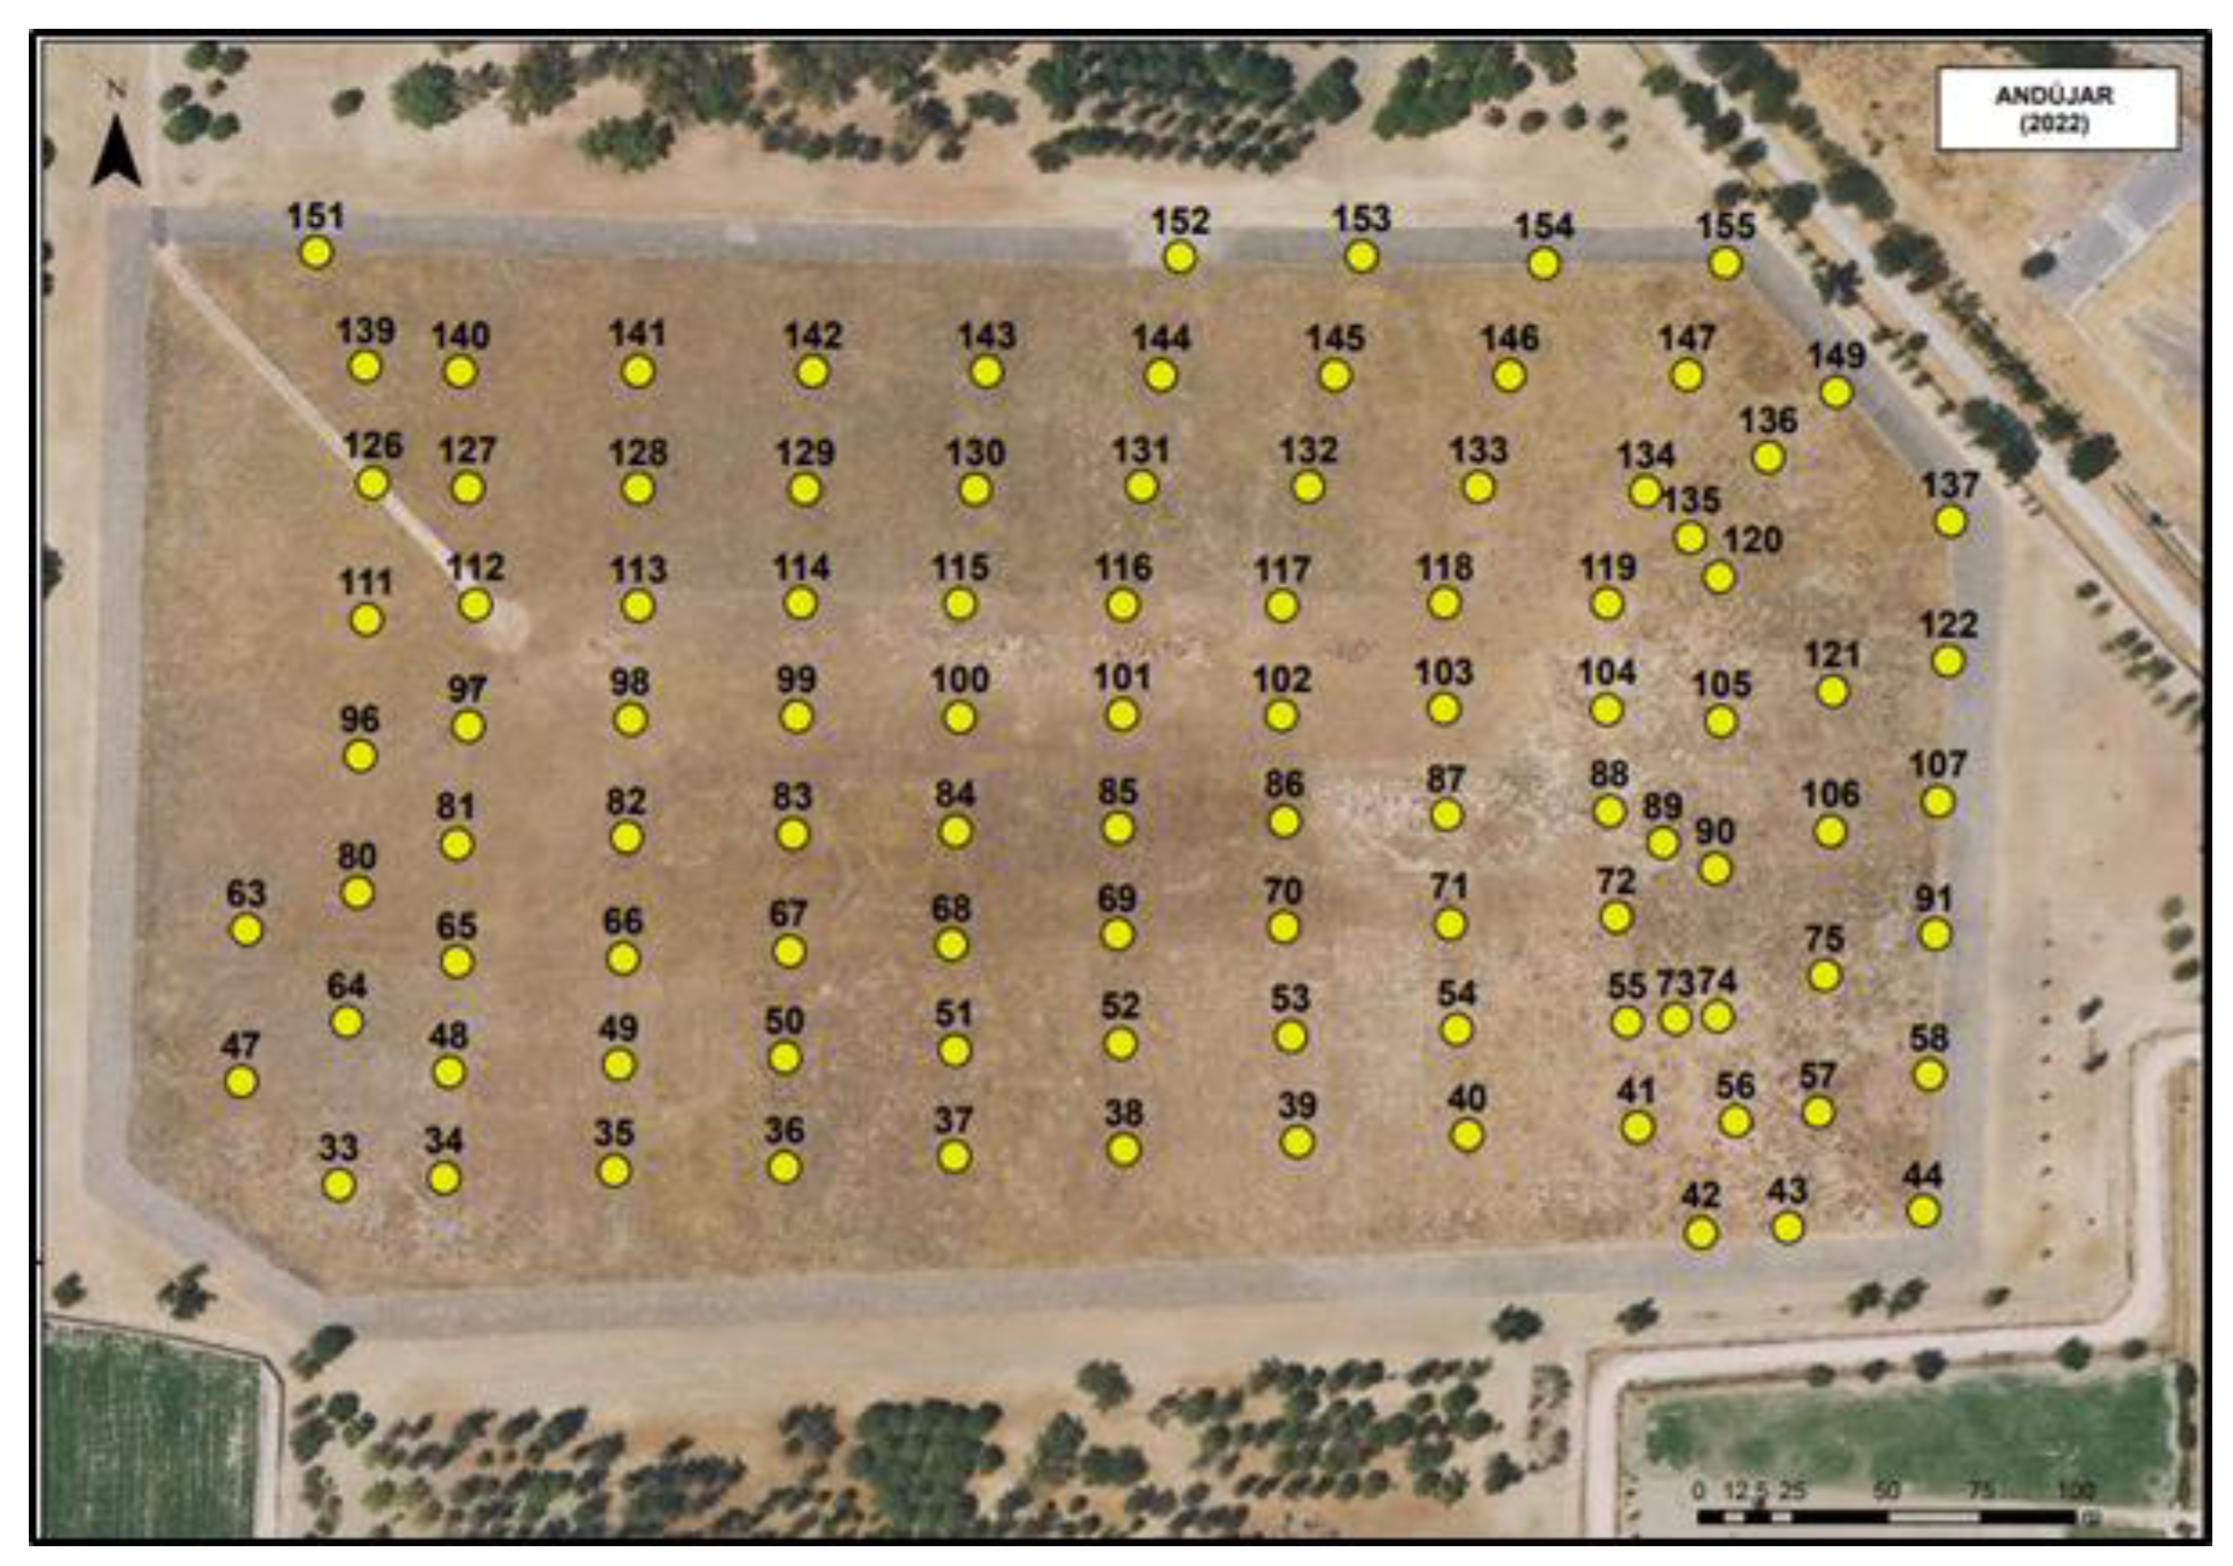
2.2. Determination of the Number of Points to Test

To estimate a valid annual statistical average radon flux for a site, an appropriate number of locations in the mound must be measured. The number of measurements needed to define the average annual flow depends on the homogeneity of the pile and the desired precision of the estimation. A homogeneous heap requires fewer samples than an inhomogeneous heap. Standard statistical techniques [16] have been used to estimate the number of samples needed for the average for a given error limit, uncertainty, and also taking into account the economic cost. Taking these factors into account, the optimal number of measurements was considered to be 101 points; this value is significantly higher than that used in other similar studies [17,18]. For each point, five detectors were placed and the value assigned to the point was the average of the five measurements.

2.3. Quality Control

The surface radon flux can be calculated by solving the radon diffusion equation [14], taking into account the physical and radiological properties of the soil being measured.
Radon Flux:
E = R ŋ ρ λ D   tgh   ( λ / D · T )
where R = 226Ra concentration in soil, Bq/kg;
ŋ = emanating power of soil;
ρ = density of soil;
λ = radon decay constant 7.59 × 10³ h−1;
D = diffusion coefficient, m2/s;
T = thickness of the tailing, m.
If the thickness is less than the diffusion length, the equation became
E = RŋρλT
Using different soil samples in our laboratory, it is possible to evaluate the radon flux by previously characterizing the parameters that appear in the expression (Rábago, D. et al., [19]).
The measurement of radon exhalation in our laboratory (LaRUC), Natural Radioactivity Laboratory of the University of Cantabria, is accredited (ISO/IEC 17025:2017) by ENAC (National Certification Agency). The reference code laboratory is 1204/LE2219 [20], and technical information about this testing are shown.

2.4. Evaluation of Radon Flux Using Activated Charcoal
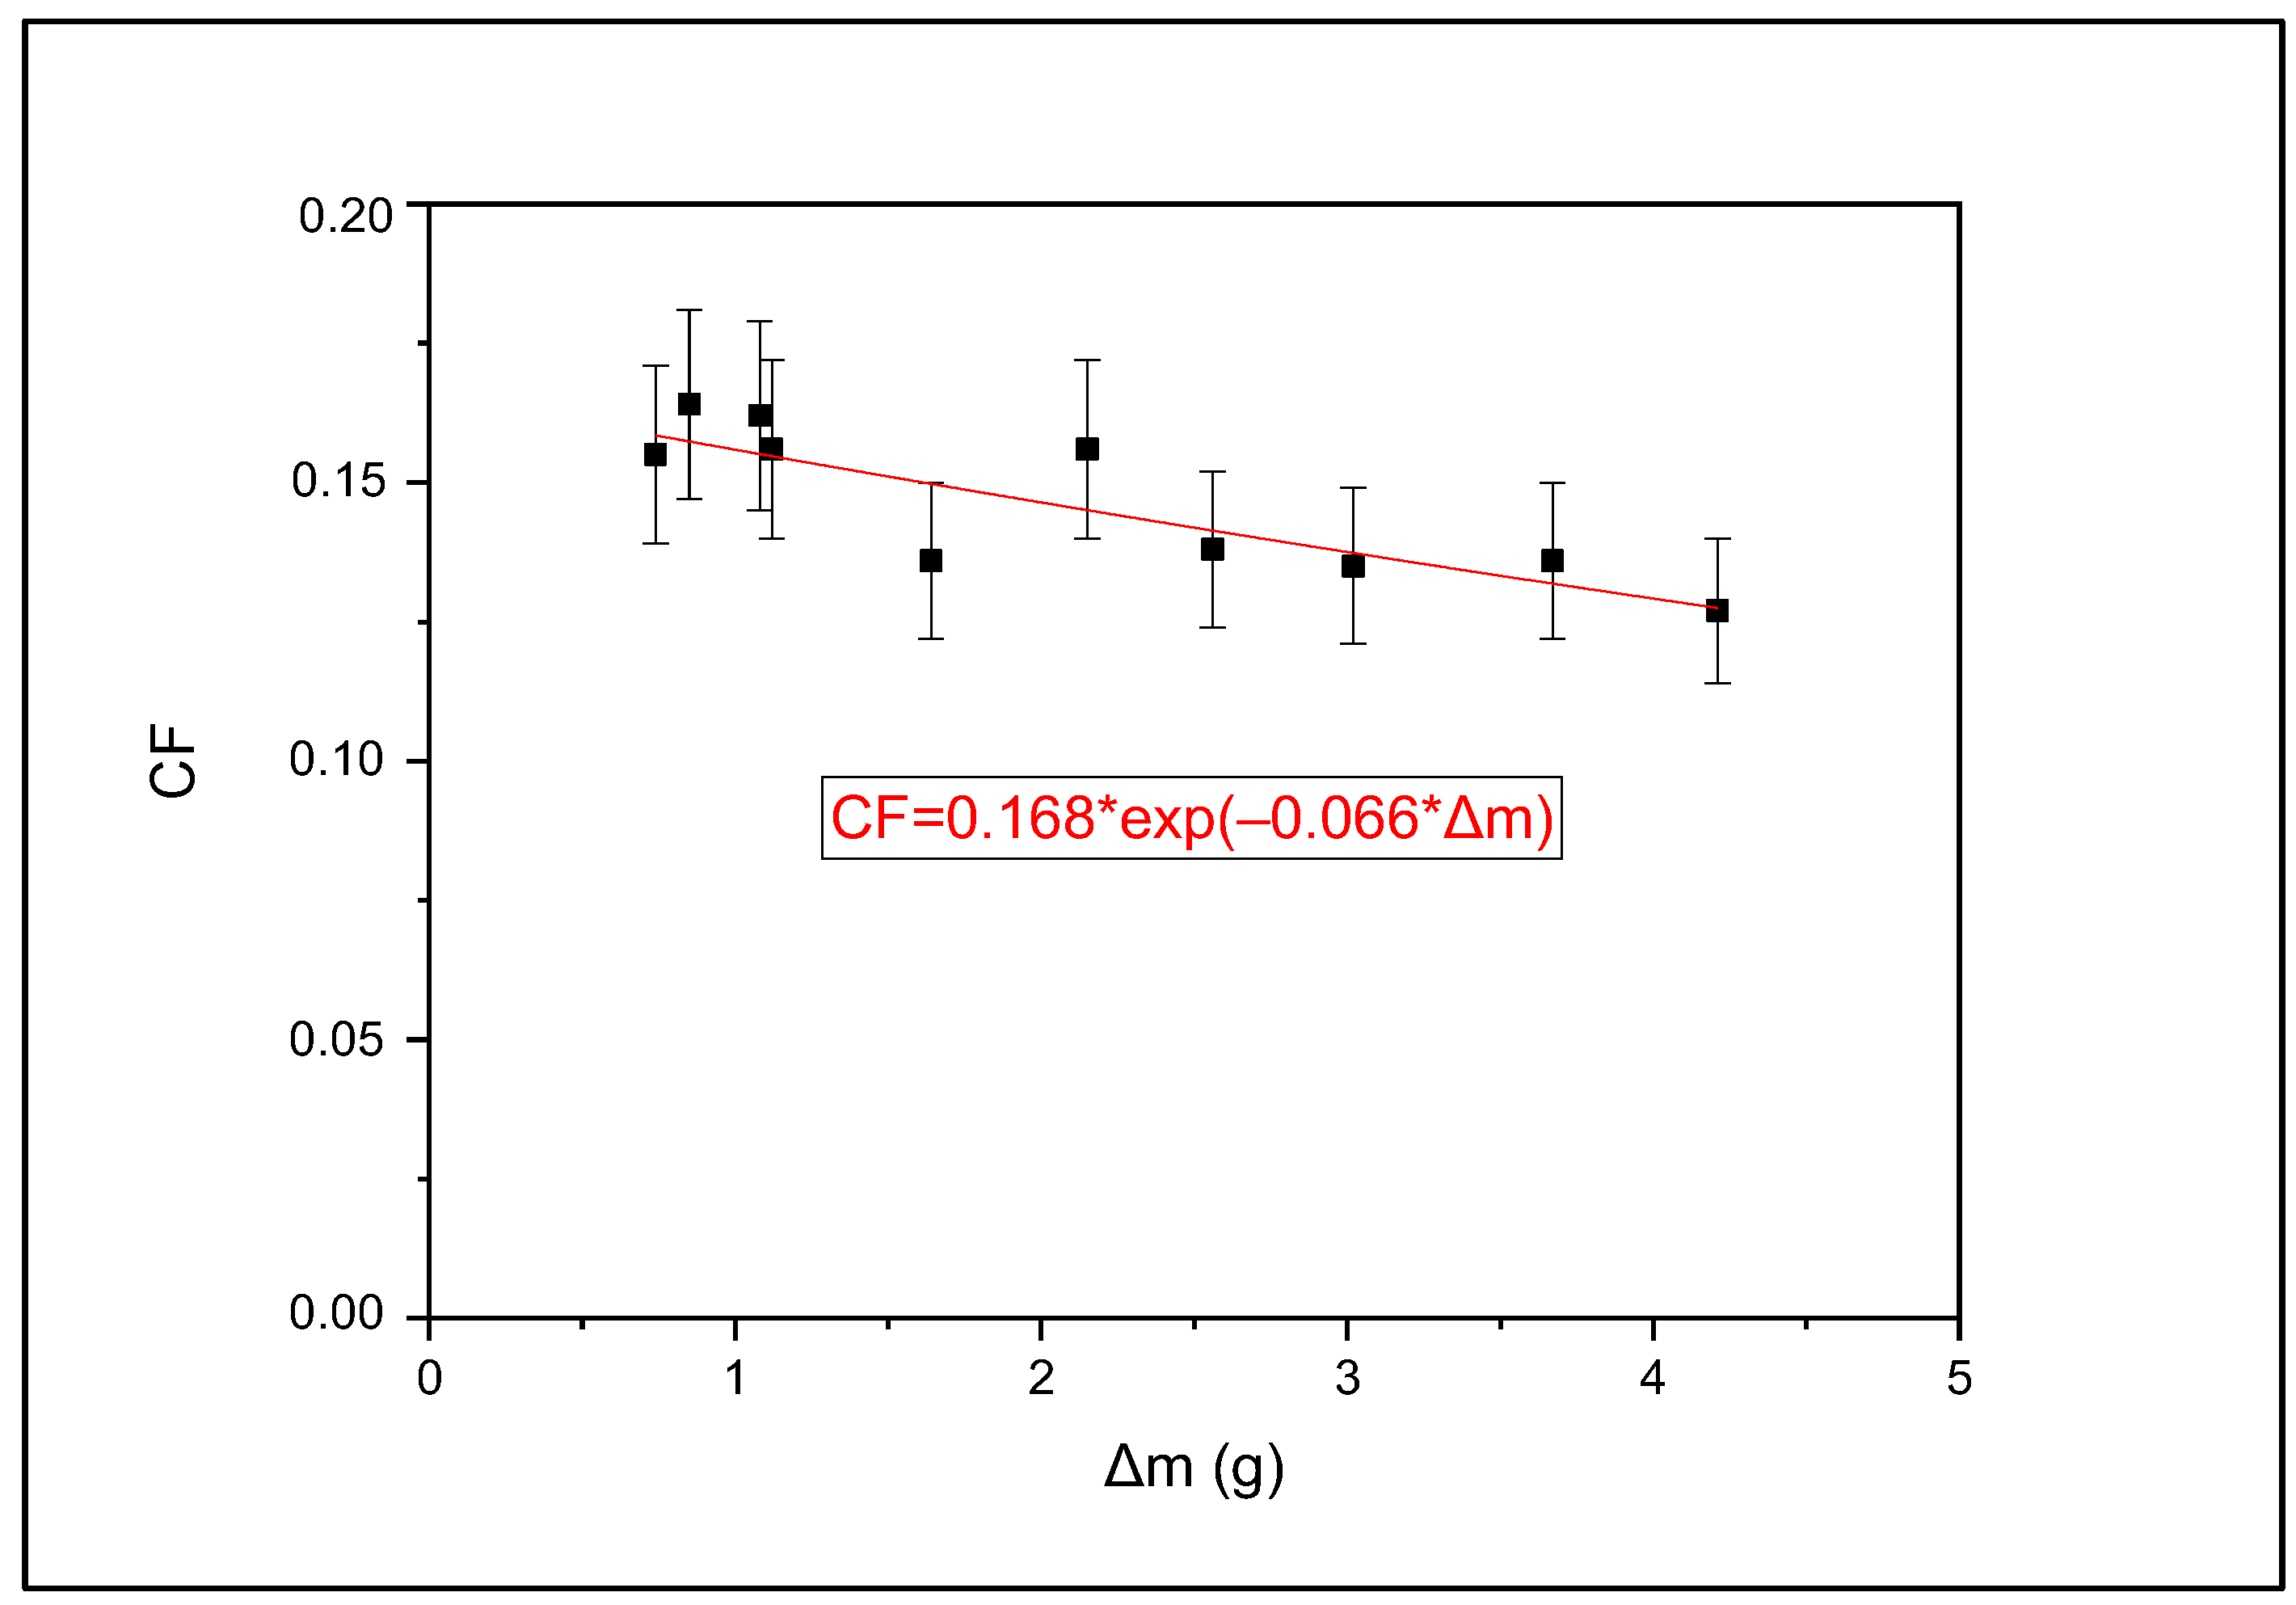
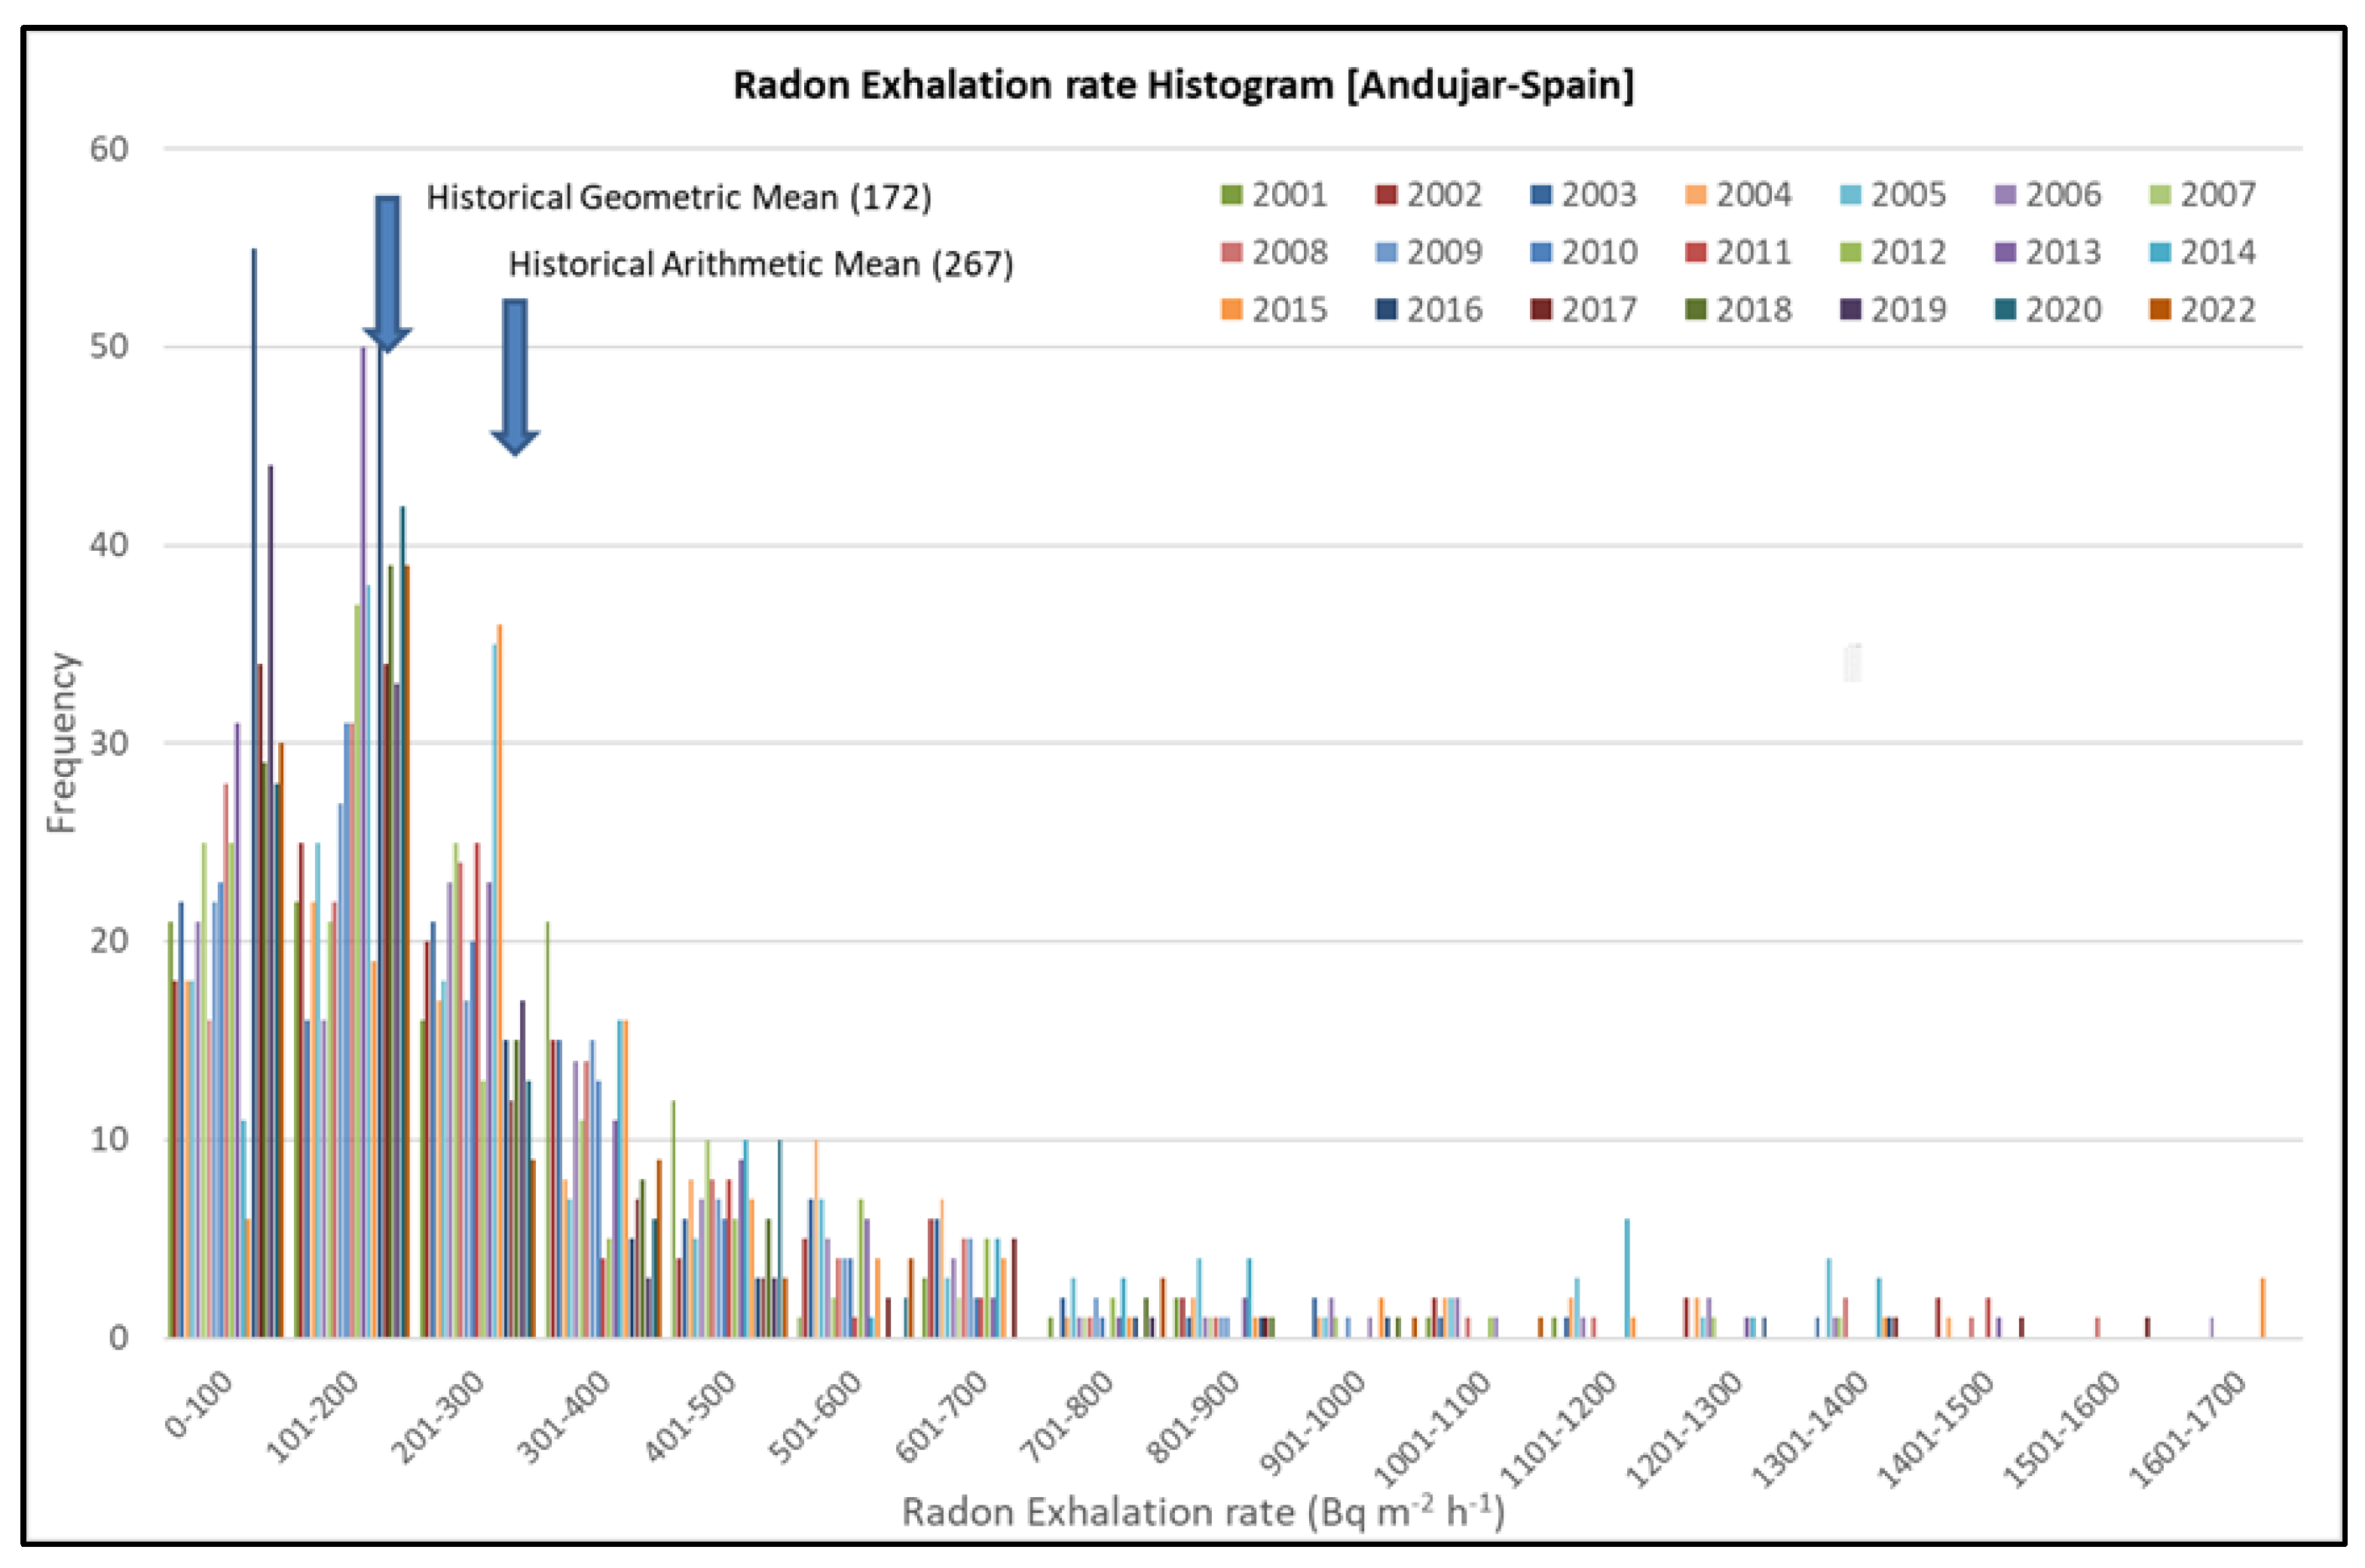
The radon flux is calculated from net counts, collector area, exposure interval, efficiency count, and others factors related with the process such as humidity or temperature [21,22].
E = λ 2 N e λ t d ε S ( 1 e λ t c ) C F
where
λ = radon decay constant 7.59 × 10³ h−1;
N = T F where T is the total count measured in the cartridge and F is the background count;
t d is the time elapsed from the middle of the cartridge exposure to the start of the count expressed in minutes;
ε is the efficiency in cpm Bq-1 corresponding to the area shown in Figure 2;
S = π R 2 = 3.20 · 10 3   m 2 is the surface of the canister;
t c = 10   min is the counting time;
C F is the correction factor derived from the accumulation of water in the charcoal.
Including all of these values into expression (3), we found a new expression for the radon flux in Bq m−2 h−1:
E = 0.236 N e λ t d ε C F
The associated uncertainty (k = 2):
u ( E ) = 0.236 e λ t d ε C F u ( N ) 2 + 0.236 N e λ t d ε 2 C F u ( ε ) 2 + 0.236 N e λ t d ε C F 2 u ( C F ) 2
where
u N is the uncertainty of the total counts T including the contribution of the background F u N = T + F ;
u ε is the uncertainty of the efficiency;
u(CF) is the uncertainty of CF correction factor by humidity.
For the evaluation of the exhalation detection limit (LDE), since this depends on the background measured under the peaks studied in the gamma spectrometry equipment, it will be necessary to know the detection limit in counts per minute with a degree of significance 3σ (LDC), which is given by the following expression:
L D C = 3 σ F
where σF =√F is the uncertainty in the background.
Once the LDC is obtained, the corresponding LDE is calculated as:
L D E = 0.236 L D C e λ t d ε C F
The exhalation detection limit for the radon content adsorbed in the activated carbon at the end of 24 h of exposure is 5.3 Bq for an average delay time between the end of its exposure and its subsequent measurement at 26 h. This value corresponds to a detection limit for the radon flux of 40 Bq/m2h for an average content of moisture adsorbed in the carbon during the 24 h of exposure of 0.3 g [23].

3. Results

The radon flux measurements in the Andújar tailings have been carried out since 2001 at the 100 points indicated in Figure 4. These points were selected following the statistical criteria referred to in a previous paragraph. Measurements are only taken at the same time of the year for budgetary reasons and because the regulatory body, Nuclear Safety Council (CSN), establishes that it is carried out in this way. Under these conditions, always during the months of June and July, the measurements were taken.
The value of radon exhalation in the Andujar surrounding area is low due to the geological characteristics of the terrain. Therefore, the limitation of the authorities is stricter in this area than in others, such as in the vicinity of uranium mines. However, the radiological impact in the area, due to measurements of the concentration of radon gas both outside and inside the nearby homes, is very limited, with values below 50 Bq/m3 found in the latter and below 20 Bq/m3 in the outside air.
In order to minimize the effects due to temperature and rainfall on the measurement of the radon flux, all the measurements have been carried out in the same period of the year (June or July).
For all years, the evolution of the averages, arithmetic and geometric values, along with their corresponding standard deviations are shown in Figure 5, showing a typical log of normal distribution. As can be seen, in no case has the average value, established by the Nuclear Safety Council, of 2666 Bq m−2 h−1 been exceeded, which confirms the good design of the cover layers. The pile was covered with a multilayer system to minimize the effects of erosion, infiltration, and radon control. From top to bottom, the multilayer system consists of an erosion barrier of mixed gravel and soil (50 mm); vegetation growths and desiccation protection (500 mm); filter of clean sand (250 mm); coarse rock (300 mm); and silty clay as an infiltration barrier and radon control (600 mm).
In Table 1, we include the radon flux values year by year. During the first eight years, the average radon flux was 322 Bq m−2 h−1. Over the next five years, this value was reduced to 227 Bq m−2 h−1 by optimization of the mill conditions. Unfortunately, a surge in the population of rabbits in the mill, around 2014, led to an increase in holes and as a consequence, the radon flux rose to its highest value, around 360 Bq m−2 h−1. After removing the holes, the radon flux was reduced again to approximately 200 Bq m−2 h−1.
In order to obtain data related to the radon flux in undisturbed soils around the facility, we carried out an annual sampling in its vicinity using the same procedure. The average value referred to 20 years of measurements and was 42 Bq m−2 h−1 with a standard deviation of 10 Bq m−2 h−1.

4. Discussion and Conclusions

Finally, we can conclude that the inclusion of the systematic measurement of the radon flux in restored areas with a high radium content, especially uranium mines, becomes a control parameter of the goodness of the design of the different coverage layers as well as of their temporal stability. This affirmation will be correct as long as the number of measurements is representative of the land surface to be controlled; this aspect has not always been taken into account in the development of similar studies [24,25]. These measurements also allow us to take corrective measures to keep the radon exhalation within the legal limits established in the restoration file. In our case of Andújar, the average values found are on average seven times lower than the legal limit, showing the optimization carried out in the drafting of the project. Additionally, as occurred in the first years of closure (2001–2007), the measurements allowed corrective measures to be taken to optimize the radon exhalation and therefore the last layer of coverage was increased with respect to the initial design until stabilization was achieved.

Author Contributions

Conceptualization, L.Q. and C.S.; methodology, L.Q., I.F. and S.C.; formal analysis, C.S., I.F. and D.R.; investigation, I.F., S.C., I.G., D.R. and R.R.; writing—original draft preparation, I.F., L.Q., S.C. and I.G.; writing—review and editing, L.Q., C.S., I.F., S.C., D.R., I.G., A.F. and R.R.; visualization, S.C.; supervision, I.F. and S.C. All authors have read and agreed to the published version of the manuscript.

Funding

This research received no external funding.

Institutional Review Board Statement

Not applicable.

Informed Consent Statement

Not applicable.

Data Availability Statement

Not applicable.

Conflicts of Interest

The authors declare no conflict of interest.

References

  1. Obersteds, S.; Vanmarccke, H. A radon exhalation monitor. Radiat. Prot. Dosim. 1996, 63, 69–72. [Google Scholar] [CrossRef]
  2. Keller, G.; Schutz, M. Radon exhalation from the soil. Radiat. Prot. Dosim. 1988, 24, 43–46. [Google Scholar] [CrossRef]
  3. Jonassen, N. The determination of radon exhalation rates. Health Phys. 1983, 45, 369–376. [Google Scholar] [CrossRef] [PubMed]
  4. EPA 520/5-85-029; U.S. Environmental Protection Agency. Radon Flux Measurements on Gardinier and Royster Phosphogysum Piles near Tampa and Mulberry, Florida. Pacific Northwest Lab.: Richland, WA, USA, 1986. [Google Scholar]
  5. International Atomic Energy Agency. Measurement and Calculation of Radon Releases from NORM Residues; Technical Reports series no. 474; IAEA: Vienna, Austria, 2013; ISBN 978-92-0-142610-9. [Google Scholar]
  6. Sahu, P.; Panigrahi, D.C.; Misha, D.P. Sources of radon and its measurement techniques in underground uranium mines-An overview. J. Sustain. Min. 2014, 13, 11–18. [Google Scholar] [CrossRef]
  7. Lopez Coto, I.; Mas, J.L.; Bolivar, J.P. A short time method to f porous materials. Appl. Radiat. Isot. 2009, 676, 133–138. [Google Scholar] [CrossRef] [PubMed]
  8. Hassan, N.M.; Ishikawa, T.; Hosoda, M.; Iwaoka, K.; Sorimachi, A.; Sahoo, S.K.; Janik, M.; Kranrod, C.; Yonehara, H.; Fukushi, M.; et al. The effect of water content on the radon emanation coefficient for some building materials used in Japan. Radiat. Meas. 2011, 46, 232–237. [Google Scholar] [CrossRef]
  9. Pérez Estévez, C.; Sanchez Delgado, M. Decommissioning Plan for Andújar Uranium Mill Facilities; No. IAEA-TECDOC-865 (V. 2); IAEA: Vienna, Austria, 1996. [Google Scholar]
  10. Boletín Oficial del Estado núm. 31, de 5 de Febrero de 1991, Páginas 3962 a 3967. Orden de 1 de Febrero de 1991 por la que se Otorga a la Empresa Nacional de Residuos Radiactivos, Sociedad Anónima (ENRESA), Autorización Para la Ejecución de Desmantelamiento y Restauración del Emplazamiento de la Fábrica de Concentrados de Uranio de Andújar (Jaén), Tendentes a la Clausura de la Misma. Available online: https://www.boe.es/diario_boe/txt.php?id=BOE-A-1991-3181 (accessed on 6 October 2023).
  11. Wilkening, M.H.; Clements, W.E.; Stanley, D. Radon-222 Flux Measurements in Widely Separated Regions. Natural Radiation Environment II. In Proceedings of the Conference on Natural Radiation Environment, Houston, TX, USA, 7 August 1972. [Google Scholar]
  12. ISO 11665-7:2012; Measurement of Radioactivity in Environment-Air: Rn222. Part 7: Accumulation Method for Estimating Surface Exhalation Rate. ISO: Geneva, Switzerland, 2012.
  13. Quindos, L.S.; Fernandez, P.L.; Bordonoba, M.L.; Gomez Arozamena, J.; Sainz, C.; Arteche, J. Medida de la exhalación de radón del suelo. Nucleus 2002, 32, 10–15. [Google Scholar]
  14. Hartley, J.N.; Gee, G.W.; Freeman, H.D. Radon Barrier Field Test at Grand Junction Uranium Mill Tailings Pile; Pacífico el Laboratorio Noroeste: Richland, WA, USA, 1983. [Google Scholar]
  15. Lastra, M.F.; Poncela, L.S.Q. Research about Different Measurement Techniques of Radon Exhalation in Soils. Master´s Final Project of Master in Physics, Instrumentation and Environment of University of Cantabria. September 2016. Available online: https://repositorio.unican.es/xmlui/bitstream/handle/10902/9385/Fuente%20Lastra%20Marta.pdf?sequence=1&isAllowed=y (accessed on 6 October 2023).
  16. International Atomic Energy Agency. Measurement and Calculation of Radon Releases from Uranium Mill Tailings; Technical Reports series no. 333; IAEA: Vienna, Austria, 1992; ISBN 92-0-101092-3. [Google Scholar]
  17. Krizman, M.J.; Rocj, J.; Jovanovic, P. Radon levels after restoration of the U-mine disposal site. Nukleonika 2010, 55, 523–527. [Google Scholar]
  18. Ishimori, Y.; Maruo, Y. Radon exhalation rate monitoring in/around the closed uranium mine sites in Japan. Int. Congr. Ser. 2005, 1276, 291–292. [Google Scholar] [CrossRef]
  19. Rabago, D.; Vargas, A.; Sainz, C.; Radulescu, I.; Mihall-Rauzan, I.; Cardellini, F.; Capogni, M.; Rizzo, F.; Celaya, S.; Fuente, I.; et al. Intercomparison of radon flux monitors at low and high radium content areas under field conditions. Int. J. Environ. Res. Public Health 2022, 19, 4213. [Google Scholar] [CrossRef] [PubMed]
  20. Natural Radioactivity Laboratory of the University of Cantabria (LaRUC). Available online: https://www.enac.es/documents/7020/b260017a-a0cc-4c17-aaae-77ec13f7b5a3 (accessed on 6 August 2023).
  21. Alharbi, S.H.; Akber, R.A. Radon-222 activity flux measurement using activated charcoal canisters: Revisiting the methodology. J. Environ. Radioact. 2014, 129, 94–99. [Google Scholar] [CrossRef] [PubMed]
  22. Spehr, W.; Johnston, A. The measurement of radon emanation rates using activated charcoal. In Proceedings of the Annual Conference of the Australian Radiation Protection Society, Canberra, Australia, 2–4 August 1982; Volume 1. [Google Scholar]
  23. Vargas, A.; Ortega, X.; Serrano, I. Response of a radon charcoal canister to climatic and radon variations in the INTE radon chamber. In Proceedings of the 11th International Congress of the International Radiation Protection Association IRPA, Madrid, Spain, 23–28 May 2004. [Google Scholar]
  24. Liza, R.; Pereyra, P.; Rau, J.; Guzman, M.; Sajo-Bohus, L.; Palacios, D. Assessment of Natural Radioactivity and Radon Exhalation in Peruvian Gold Mine Tailings to Produce a Geopolymer Cement. Atmosphere 2023, 14, 588. [Google Scholar] [CrossRef]
  25. Miklyaev, P.S.; Petrova, T.B. Study of Abnormal seasonal Variations in the Radon Exhalation Rate in a fault Zone. Geochem. Int. 2021, 59, 435–447. [Google Scholar] [CrossRef]
Figure 1. Localization of Uranium Mill Factory in Andújar (Spain).
Atmosphere 14 01536 g001
Figure 2. Activated charcoal canisters and PVC capsule used.
Atmosphere 14 01536 g002
Figure 3. Correction factor CF related to the humidity adsorbed (expressed as increase in mass, Δm, in grams) in the charcoal [15].
Atmosphere 14 01536 g003
Figure 4. Location and distribution of measuring points.
Atmosphere 14 01536 g004
Figure 5. Results of the exhalation from 2001 to 2022.
Atmosphere 14 01536 g005
Table 1. Results of minimum value, maximum value, averages (arithmetic and geometric), and their standard deviations (SD) from 2001 to 2022.
YearMinimum
Value
Bq∙m−2∙h−1
Maximum
Value
Bq∙m−2∙h−1
Arithmetic
Average
Bq∙m−2∙h−1
SD
Bq∙m−2∙h−1
Geometric
Average
Bq∙m−2∙h−1
SD
Bq∙m−2∙h−1
20014311573374431823.2
20024514863547241433.9
20034213613768311183.7
20044314222883701432.8
20054913953534612162.7
20064116202904201682.7
20074413482553061513.0
20084715553252742262.5
2009499972492411612.6
2010438832211671622.1
20114314752322311782.1
20124610932281981662.2
2013491448205901951.6
20144313603442942612.1
20154516123713512782.1
20164613321721931282.1
20174615142562901782.2
2018429901991681472.2
2019427651511161192.0
2020445941831271462.0
20224510372152081492.4
Disclaimer/Publisher’s Note: The statements, opinions and data contained in all publications are solely those of the individual author(s) and contributor(s) and not of MDPI and/or the editor(s). MDPI and/or the editor(s) disclaim responsibility for any injury to people or property resulting from any ideas, methods, instructions or products referred to in the content.

