Article

The Role of Industrial Structure Upgrading in Moderating the Impact of Environmental Regulation on Air Pollution: Evidence from China

1
Wuhan Institute of Technology, College of Management, Wuhan 430205, China
2
Wuhan Institute of Technology, Law and Business School, Wuhan 430205, China
*
Author to whom correspondence should be addressed.
Atmosphere 2023, 14(10), 1537; https://doi.org/10.3390/atmos14101537
Submission received: 7 July 2023 / Revised: 10 September 2023 / Accepted: 26 September 2023 / Published: 8 October 2023
(This article belongs to the Special Issue Air Pollution Exposure and Health Impact Assessment)

Abstract

:
Air pollution is an important factor affecting human health and daily life. The Chinese government is making vigorous efforts to control air pollution. The upgrading of the industrial structure is a problem-solving tool in the environment and economic growth cases. This paper aims to explore the relationships among environmental regulation, the upgrading of the industrial structure and air pollution. The PVAR (Panel Vector Auto Regression) model and moderating effect model are used to conduct empirical analysis based on panel data of 30 provinces in China from 2004 to 2020. The analysis of the results provides the following findings. Firstly, environmental regulations can significantly reduce emissions, but the deterioration of air quality does not have a significant impact on the improvement of environmental regulations. Secondly, industrial structure upgrading can reduce air pollution, but the worsening of the air quality will hinder the upgrading of industrial structures. Thirdly, environmental regulation can promote industrial structure upgrading. Lastly, industrial structure upgrading is a moderating variable and can positively moderate the impact of environmental regulations on air pollution.

1. Introduction

According to the Global Environmental Performance Index (EPI) in 2020, the ranking of China’s air quality is 137th among 180 countries. Since launching its open-door policy and economic reform, China has experienced spectacular economic growth. However, the conventional path of economic growth has caused unprecedented environmental pollution and health risks [1,2]. The traditional economic growth model has caused resource exhaustion and makes sustainable development difficult [3]. Frequent air pollution has a significant impact on human health [4,5]. It has been shown that air pollution has a serious impact on the general public and has become a major bottleneck for China’s sustainable development [6]. In recent years, China’s government has attached great importance to increasing environmental investment and promoting the upgrading of the industrial structure. As the largest developing country, China’s environmental pollution problem is universal and representative of the process of economic development and construction. Recently, the discussion on the relationships among environmental regulation, the upgrading of the industrial structure and air pollution in the academic field has been getting heated.
There are three viewpoints concerning the impact of environmental regulation on air pollution according to the previous literature. Firstly, environmental regulation is helpful for reducing air pollution. Using the province-level [7] and prefecture-level [8] panel data, some studies found that environmental regulation can suppress air pollution [9]. By constructing difference-in-difference models, Zhang et al. found that the establishment of pilot zones for green finance reform and innovation (PZGRI) can reduce industrial energy consumption and emissions [10]. Secondly, environmental regulation will cause the deterioration of air pollution [11]. Hao et al. [12] used the first difference GMM (generalized method of moments) method to explore the relationship and found that current environmental regulation has not achieved the goal of controlling pollution. Thirdly, there is a non-linear relationship between environmental regulation and air pollution [13]. In addition, air pollution is an important consideration in the development of environmental regulation. Baumol suggested that the predetermined environmental tax needs to be adjusted in accordance with the pollution situation [14]. Theoretically, the optimal rate of environmental tax on a particular activity is equal to the marginal social damage it generates [15].
The literature on environmental regulation and industrial structure upgrading mainly focuses on three aspects. To begin with, the “following costs” hypothesis posits that environmental regulation can increase the additional costs of enterprises, squeeze out profits and inhibit the upgrading of the industrial structure [16]. Then, Porter’s hypothesis finds that environmental regulation can stimulate the vitality of innovation and promote the upgrading of the industrial structure. However, some of the literature holds that there is a non-linear U-shaped relationship between them [17,18].
A number of research studies have been conducted on the connection between industrial structure upgrading and air pollution. However, the influence mechanism of industrial structure upgrading on air pollution is still unclear [19]. Through the construction of static and dynamic spatial econometric models, Ma et al. [20] found that the optimization and rationalization of industrial structures can significantly improve air quality. By constructing a spatial econometric model, Yang et al. [21] concluded that industrial structure upgrading can reduce carbon emissions by improving green total factor productivity. However, Feng et al. [22] obtained the opposite conclusion. Feng tried to explore the effect of industrial structure upgrading on carbon emissions in China, using the traditional OLS (Ordinary Least Square) model and the dynamic SYS-GMM (System Generalized Method of Moments) model. In addition, air pollution negatively impacts the fixed investment and innovation activities of enterprises [23] and then affects the upgrading of the industrial structure [24].
According to the previous literature, there is considerable interest in the relationships between environmental regulation, the upgrading of the industrial structure and air pollution. However, few scholars systematically analyze the mechanism among them. This study systematically explores the internal mechanisms underlying the relationship between environmental regulation, industrial structure upgrading and air pollution by taking them into the same analytical framework. The first major contribution is that the study uses the PVAR model to explore the short-term and long-term interaction relationships between environmental regulation, the upgrading of the industrial structure and air pollution. The second major contribution is that this study uses the moderating model to explore the possible moderating effect of industrial structure upgrading on the relationship between environmental regulation and air pollution.

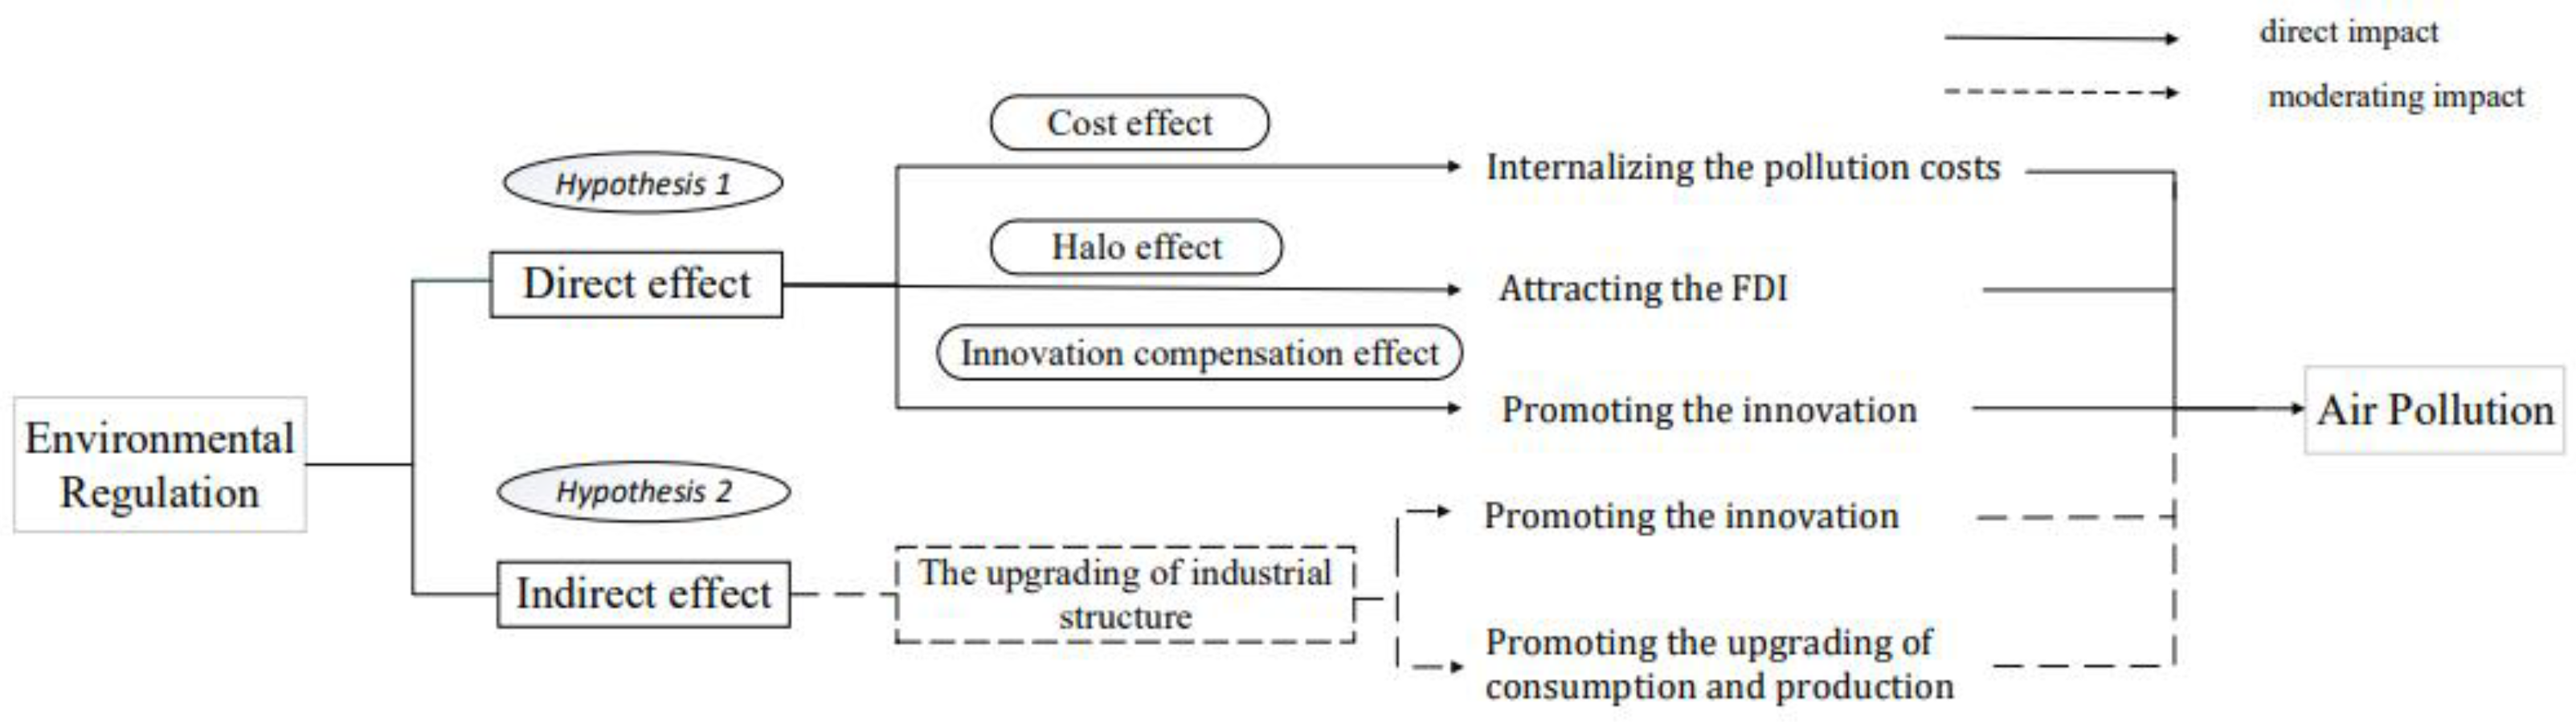
2. Theoretical Analysis and Research Hypothesis

This section explores the direct effect of environmental regulations on air pollution and the moderating effect of industrial structure upgrading, as shown in Figure 1.
The negative externalities of environmental problems and unclear environmental property rights lead to market failure in pollution control [25], which makes air pollution control more dependent on the government. Environmental regulation is an effective way for governments to control air pollution. Environmental regulation can directly affect air pollution [7]. Environmental regulation will increase the costs of enterprises and induce innovations, thus reducing air pollution [26,27]. Environmental regulation can indirectly affect air pollution through foreign direct investment (FDI) [7]. Improving environmental regulation can attract multinational companies with advanced technologies. Foreign companies can introduce more clean technologies and abundant capital to the host country, resulting in the “pollution halo effect”, thus reducing air pollution.
The first hypothesis is proposed based on the above analysis.
H1: 
The improvement of environmental regulation can effectively promote the reduction in air pollution.
Previous studies have explored the relationship between environmental regulation, industrial structure upgrading and air pollution. When exploring the relationship between environmental regulation and air pollution, some studies consider industrial structure upgrading as a control variable and have found that it can reduce air pollution [28]. Du and Chen [29] take industrial concentration as a mediating variable and find that environmental regulation can reduce the density of air pollution through promoting industrial concentration. Industrial structure upgrading may act as a moderating variable and can positively moderate the impact of environmental regulation on air pollution.
Industrial structure upgrading can enhance the impact of environmental regulation on air pollution. Through promoting technological innovation [30], driving the transformation of production and promoting the upgrading of consumption [31], industrial structure upgrading can lead enterprises to develop in a green way.
Based on the above analysis, this study proposes the second research hypothesis:
H2: 
The upgrading of the industrial structure can positively moderate the effect of environmental regulation on air pollution.

3. Methods

3.1. Model Specifications

The time-series vector autoregression (VAR) model was regarded as an alternative to multivariate simultaneous equation models initially [32]. All variables in a VAR model are treated as endogenous, which can effectively show the relationship among the variables. Newey et al. introduced VAR in a panel-data setting and the panel VAR model has been used in multiple applications across fields [33]. Further developed by Love and Zicchino [34], the PVAR model has been widely used in the fields of economy, policy and industrial structure. The PVAR model analyzes the dynamic relationships between variables through generalized matrix estimation (GMM) and impulse response function (IRF). Monte Carlo is a part of the impulse response function, which is used to generate the 5% error bands.
The PVAR model is used to analyze the dynamic relationships between environmental regulation, industrial structure upgrading and air pollution from an independent perspective. This study uses the moderating effect model to explore the underlying mechanisms of environmental regulation, industrial structure upgrading and air pollution from a linkage perspective.
M o d e l 1 : Y i t = α 0 + n = 1 p β n Y i t n + γ i + σ t + μ i t
In Model 1, Y i t is a three-variable vector [ Polltion i t   Regulation i t   T S i t ] of section individual i at timepoint t . Y i t n is the n-order lag term of Y i t . P o l l u t i o n i t denotes the emissions of S O 2 , R e g u l a t i o n i t denotes the tax of S O 2 , and T S i t represents the upgrading of the industrial structure. α 0 is the intercept vector,  i represents different provinces,  t represents different years,  p is the lag order, β n is the coefficient matrix of the lagging variable, γ i is the individual effect, σ t is the time effect, and μ i t is the random perturbation term.
M o d e l 2 : ln p o l l u t i o n i t = α 0 + β 1 ln c o n t r o l i t + β 2 ln r e g u l a t i o n i t + ε i t
M o d e l 3 : ln p o l l u t i o n i t = α 0 + β 1 ln c o n t r o l i t + β 2 ln r e g u l a t i o n i t + β 3 ln T S i t + ε i t
M o d e l 4 : ln p o l l u t i o n i t = α 0 + β 1 ln c o n t r o l i t + β 2 ln r e g u l a t i o n i t + β 3 ln T S i t + β 4 ln r e g u l a t i o n i t ln T S i t + ε i t
In Models 2–4, P o l l u t i o n i t is the dependent variable, denoting the emissions of S O 2 in the j province of the i year. R e g u l a t i o n i t is the key explanatory variable, denoting the tax of S O 2 in the j province of the i year. T S i t represents the upgrading of the industrial structure in the j province of the i year. C o n t r o l i t is a vector composed of the control variables [7,8,35], and it mainly includes the control variables such as development, innovation, urban, open, invest and energy. α 0 is the intercept term. β is the regression coefficient of the equations. ε i t is the random error term.

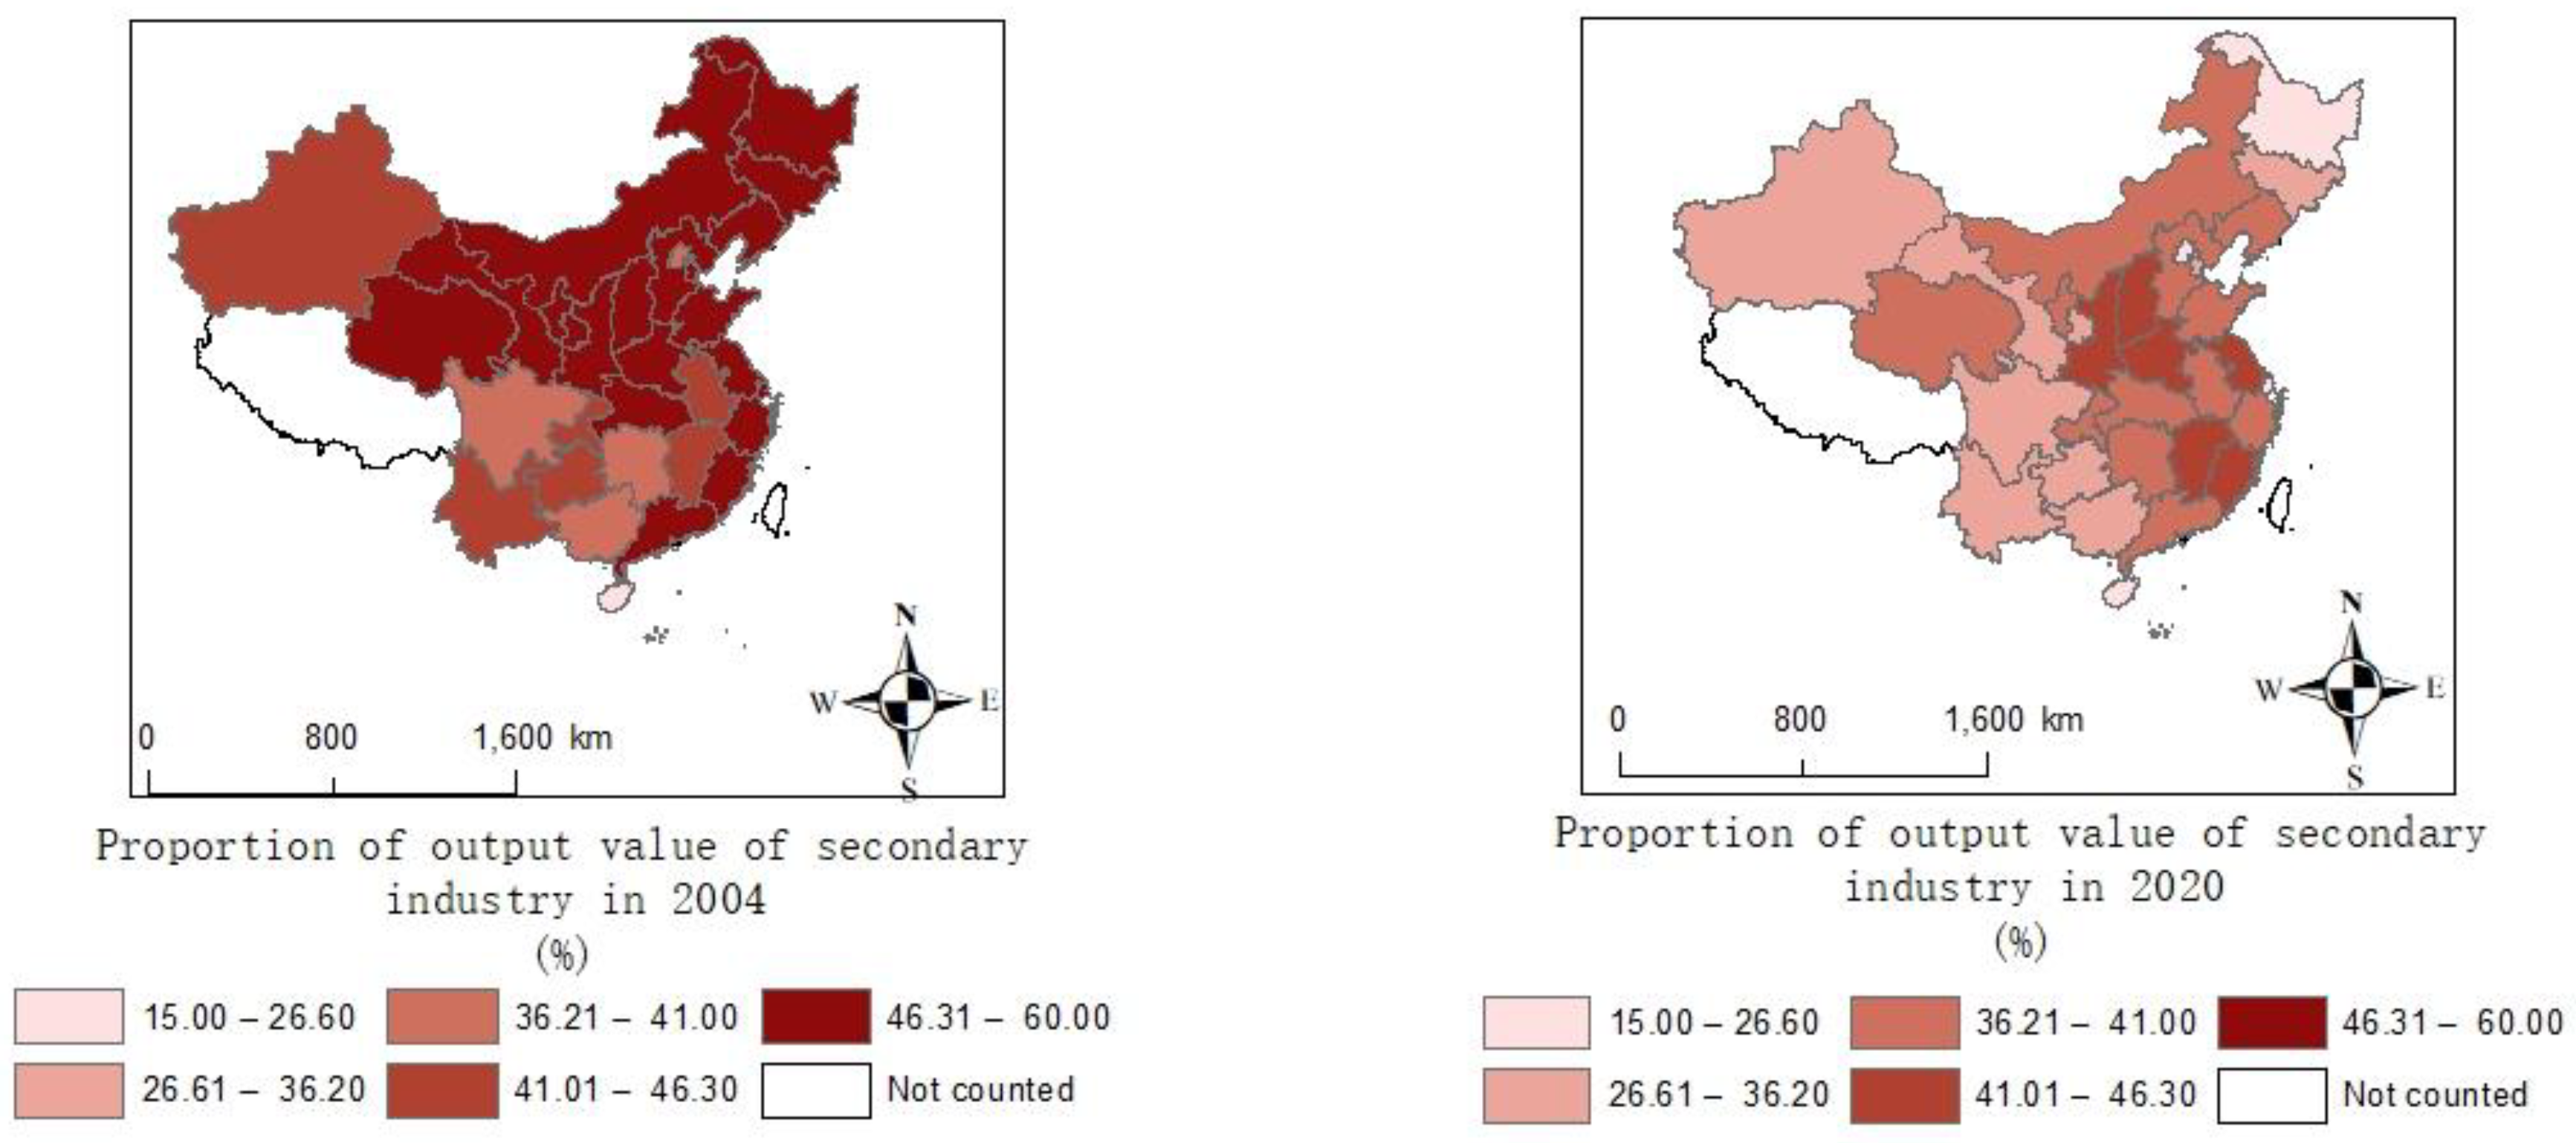
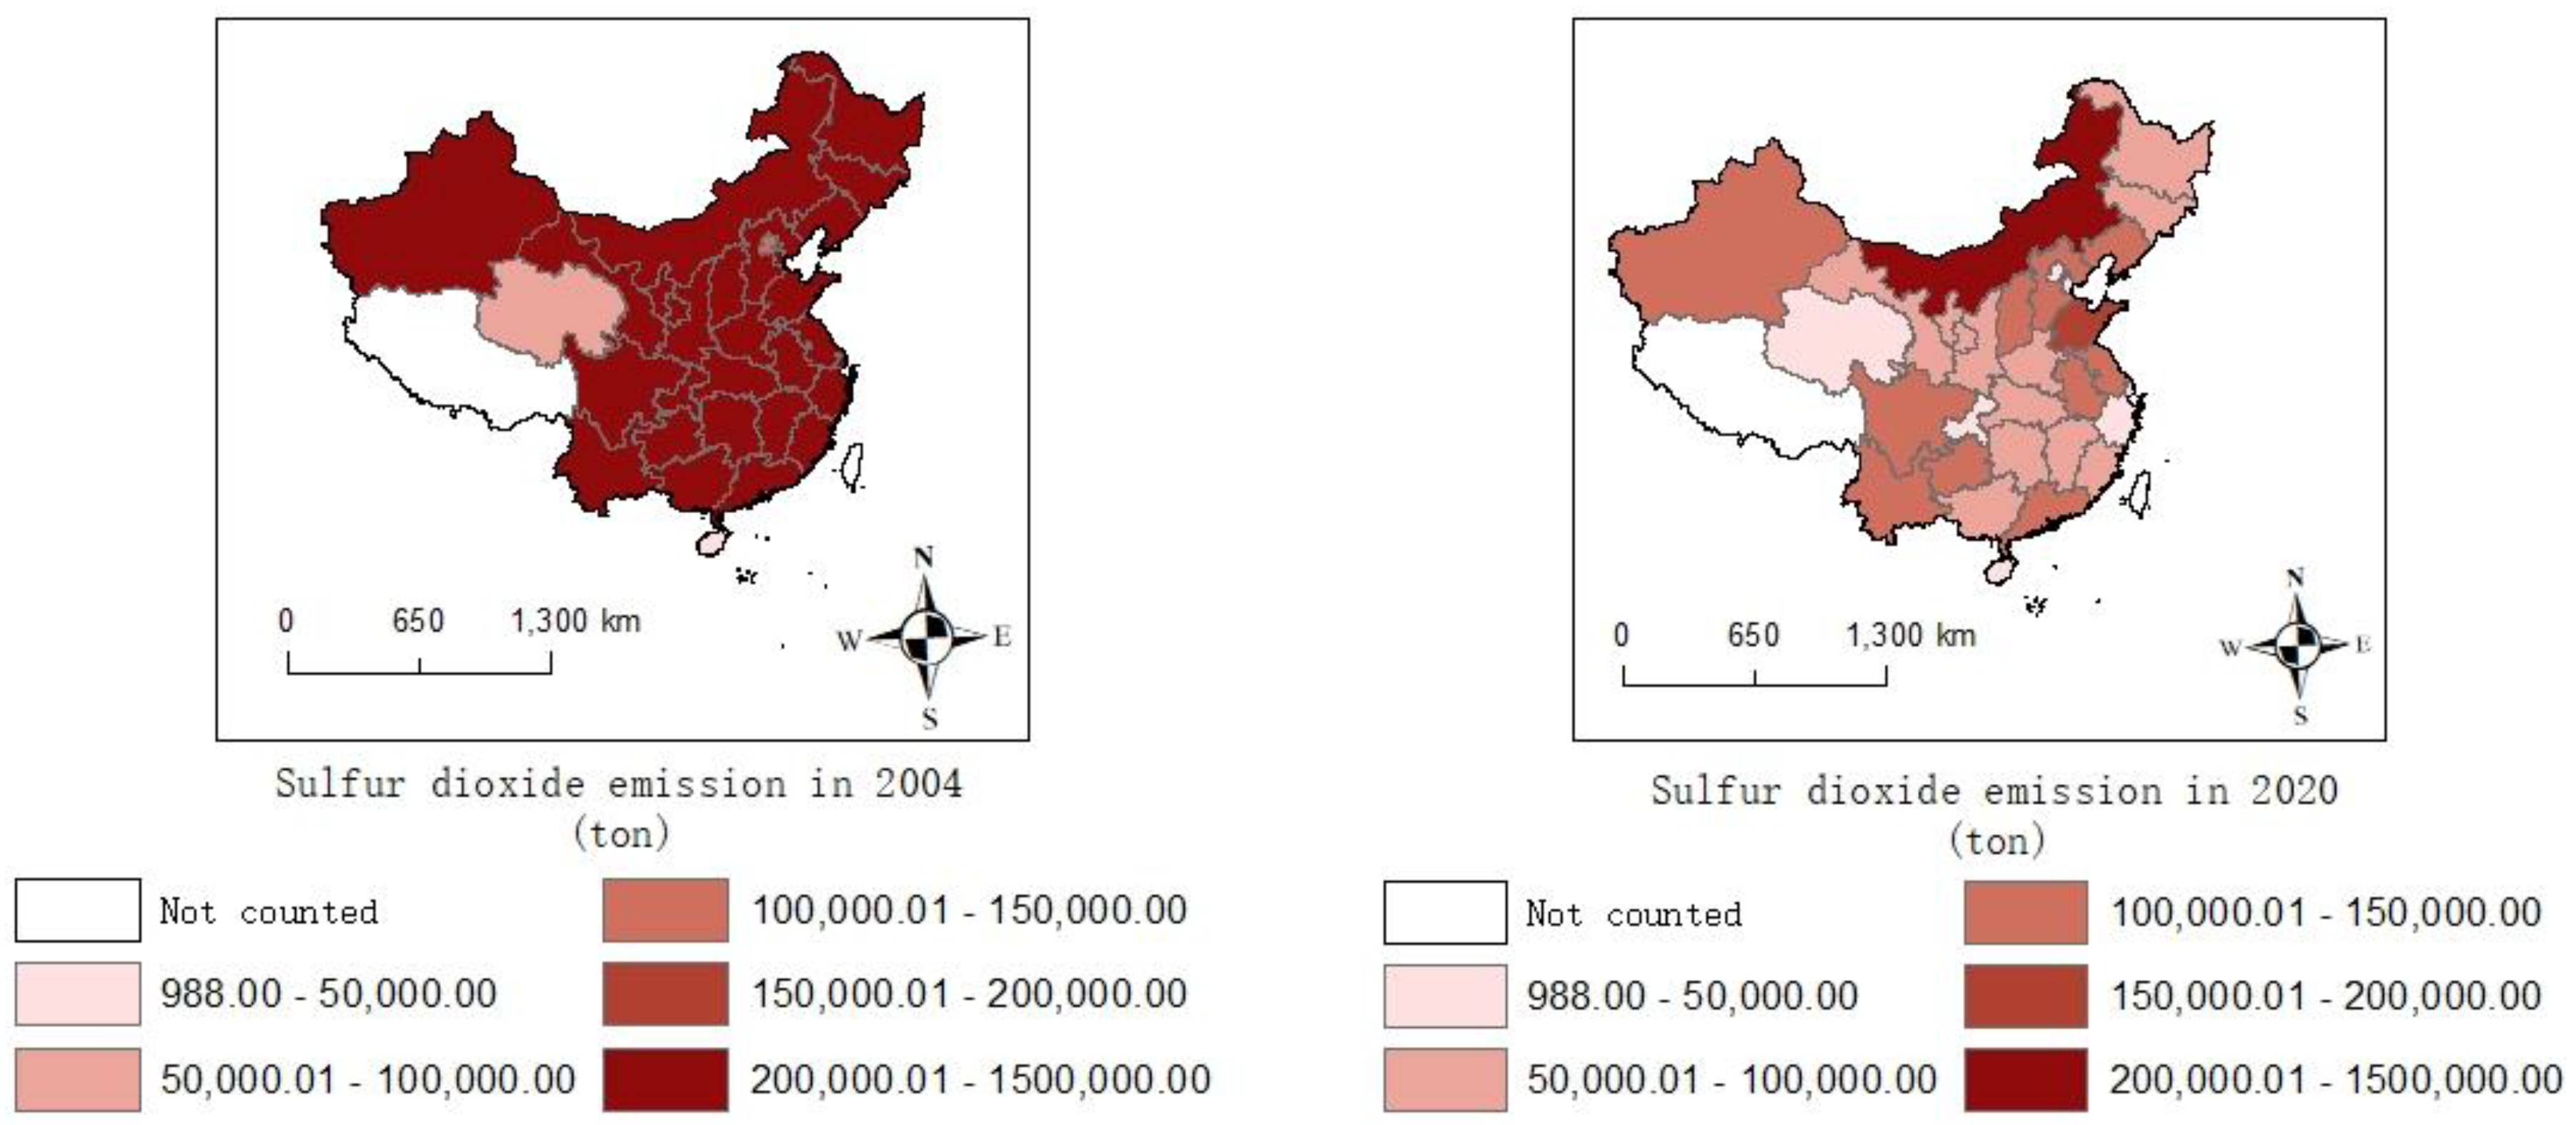
3.2. Dependent Variables

In previous studies, scholars chose different indicators to measure air pollution, including P M 2.5 [36,37], C O 2 [38], and S O 2 [39]. S O 2 has a significantly negative effect on human health, leading to various adverse health problems such as breathing difficulty, pulmonary edema, eye irritation, asthma attacks, cardiopulmonary diseases and increased mortality rates [40,41]. Additionally, S O 2 is a primary focus of environmental regulation. Zhang et al. [4] utilized the Grossman Health Production Function to examine the impact of S O 2 on public health and found that there was a positive correlation between them. In consideration of data availability, this study selected S O 2 emissions as the dependent variable to measure pollution. The data of S O 2 emissions came from the China Statistical Yearbook, including 30 provinces in China from 2004 to 2020. These data represented the emissions of industrial S O 2 . The data were calculated and reported by each province. The methods for measuring S O 2 emissions in various provinces included detection data methods, material measurement methods and emission coefficient methods, which are different for different industries.

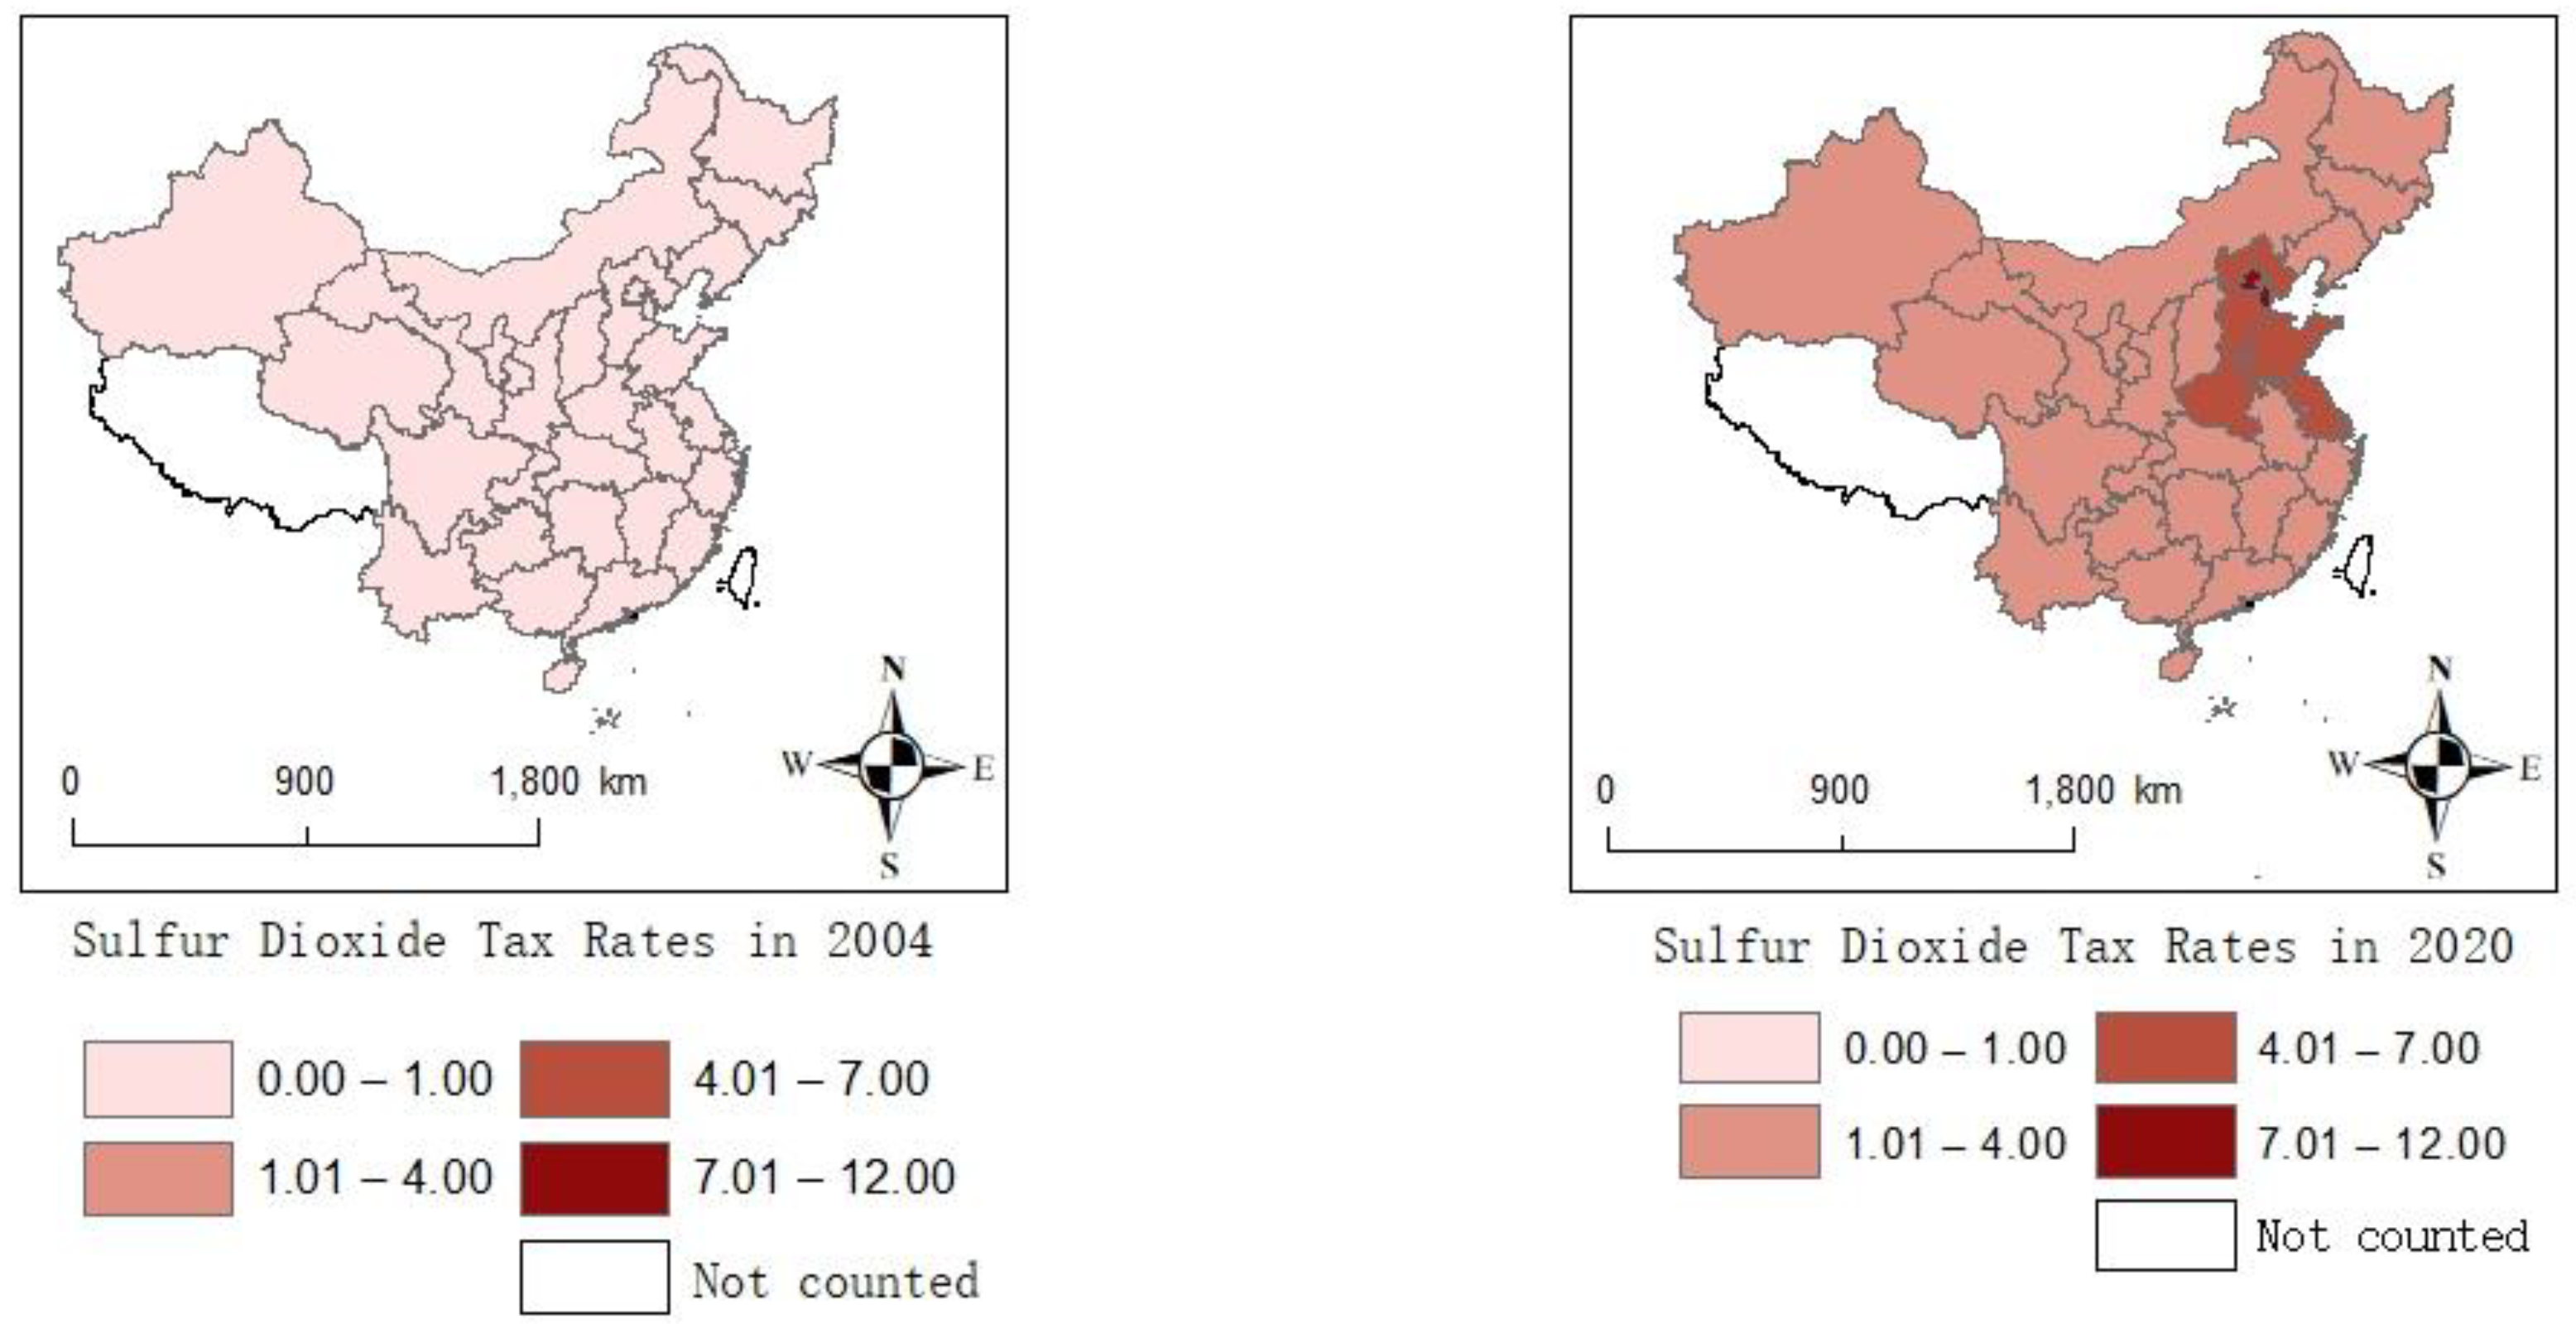
3.3. Independent Variables

Previous studies have selected indicators such as the number of environmental protection laws and the proportion of pollution control investment to the total industrial output value and GDP [42] to measure the degree of environmental regulation. However, the effectiveness of laws is contingent upon their enforcement. Additionally, the proportion of investment in pollution treatment cannot reflect the regulation of every specific pollutant. As one of the most important environmental regulations, environmental tax can overcome the above shortcomings. This study selected the environmental tax of S O 2 as a key indicator to measure environmental regulation.

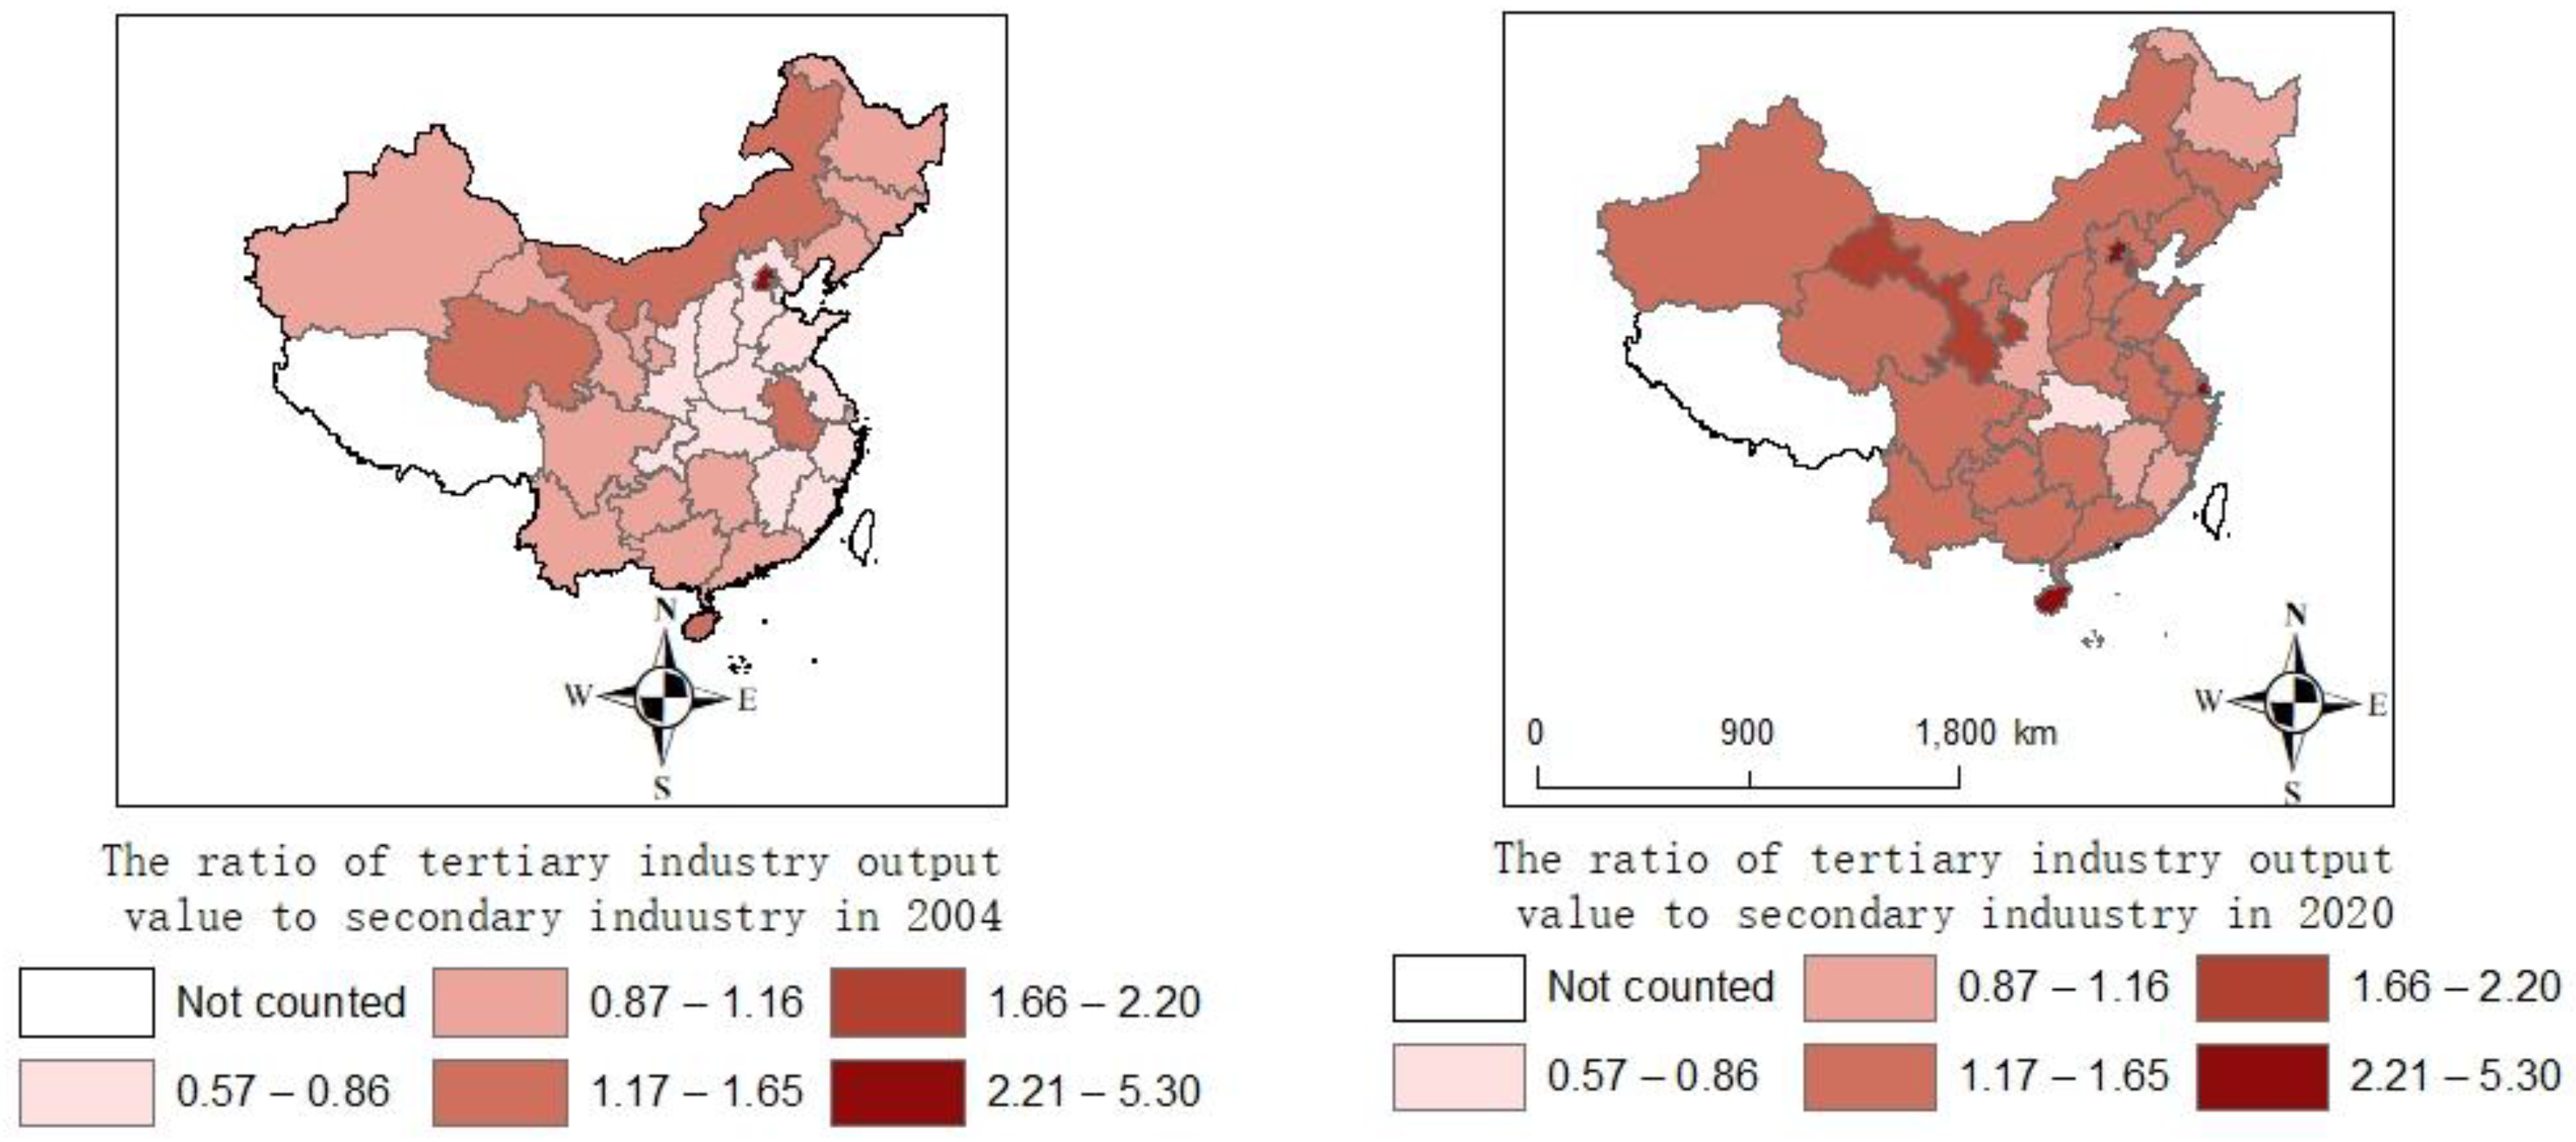
3.4. Moderate Variables

According to theoretical mechanism analysis, air pollution is highly correlated with environmental regulation. Industrial structure upgrading may play a moderating role in this relationship. Industrial structure upgrading refers to the process of establishing and achieving a more efficient industrial structure. According to Clark’s Law, some studies employ the proportion of non-agricultural output value as a measure of industrial structure upgrading. Since the 1970s, the information technology revolution has had a great impact on industrial structures. It formed a trend of “economic service”. Especially after the reform and opening up, this trend has accelerated. The traditional indicator cannot reflect the upgrading of the industrial structure in China. This study took the ratio of tertiary industry output value to secondary industry output value to measure the upgrading of the industrial structure ( T S ) [43]. The increase in this ratio indicates that industrial structures have been upgraded.

3.5. Control Variables

A range of factors that can affect air pollution are controlled. The previous studies [7,8,35] have shown the level of economic (development), the level of innovation (innovation), the level of urbanization (urban), the openness to trade (open), the investment scale (invest) and energy efficiency (energy) are closely related to air pollution. Therefore, this study chose the above variables as control variables.

3.6. Data Resource

Before 2018, China used pollutant discharge fees to control air pollution. China did not implement environmental taxes, until Environmental Protection Tax Law of the People’s Republic of China was officially implemented in 2018. There is no significant difference in the object of collection, the scope of collection and the standard of collection between pollutant discharge fees and environmental taxes. Therefore, this study uses the pollutant discharge fees to measure environmental regulation before 2018. The environmental tax burden can be measured through changes in the pollutant change fee [44]. As shown in Figure 2, the overall level remains stable and only eight provinces have a significant change. The tax rates for each pollutant are roughly the same as the former pollutant discharge fees. The tax rate for each pollutant before 2018 can be replaced by pollutant discharge fees. On 1 July 2003, the government promulgated the Regulations on the Administration of the Charging and Use of Pollutant Discharge Fees. This had a huge impact on pollutant discharge fees for a long time. Therefore, this study chose panel data from 2004. The data of pollutant discharge fees from 2004 to 2018 were collected from the documents of the Ministry of Finance and the Price Bureau. After 2018, the data of environmental tax were collected from provincial tax bureaus. The data of other variables were mainly collected from 2004 to 2020 of the China Statistical Yearbook on Environment and the China Statistical Yearbook. The panel data consisted of 30 provinces in China from 2004 to 2020, while Tibet, Taiwan, Hong Kong and Macau were not included due to data availability. The data of fixed investment in 2020 were missing. This study used the moving average method to supplement the missing individual data.

4. Results

4.1. Descriptive Analyses
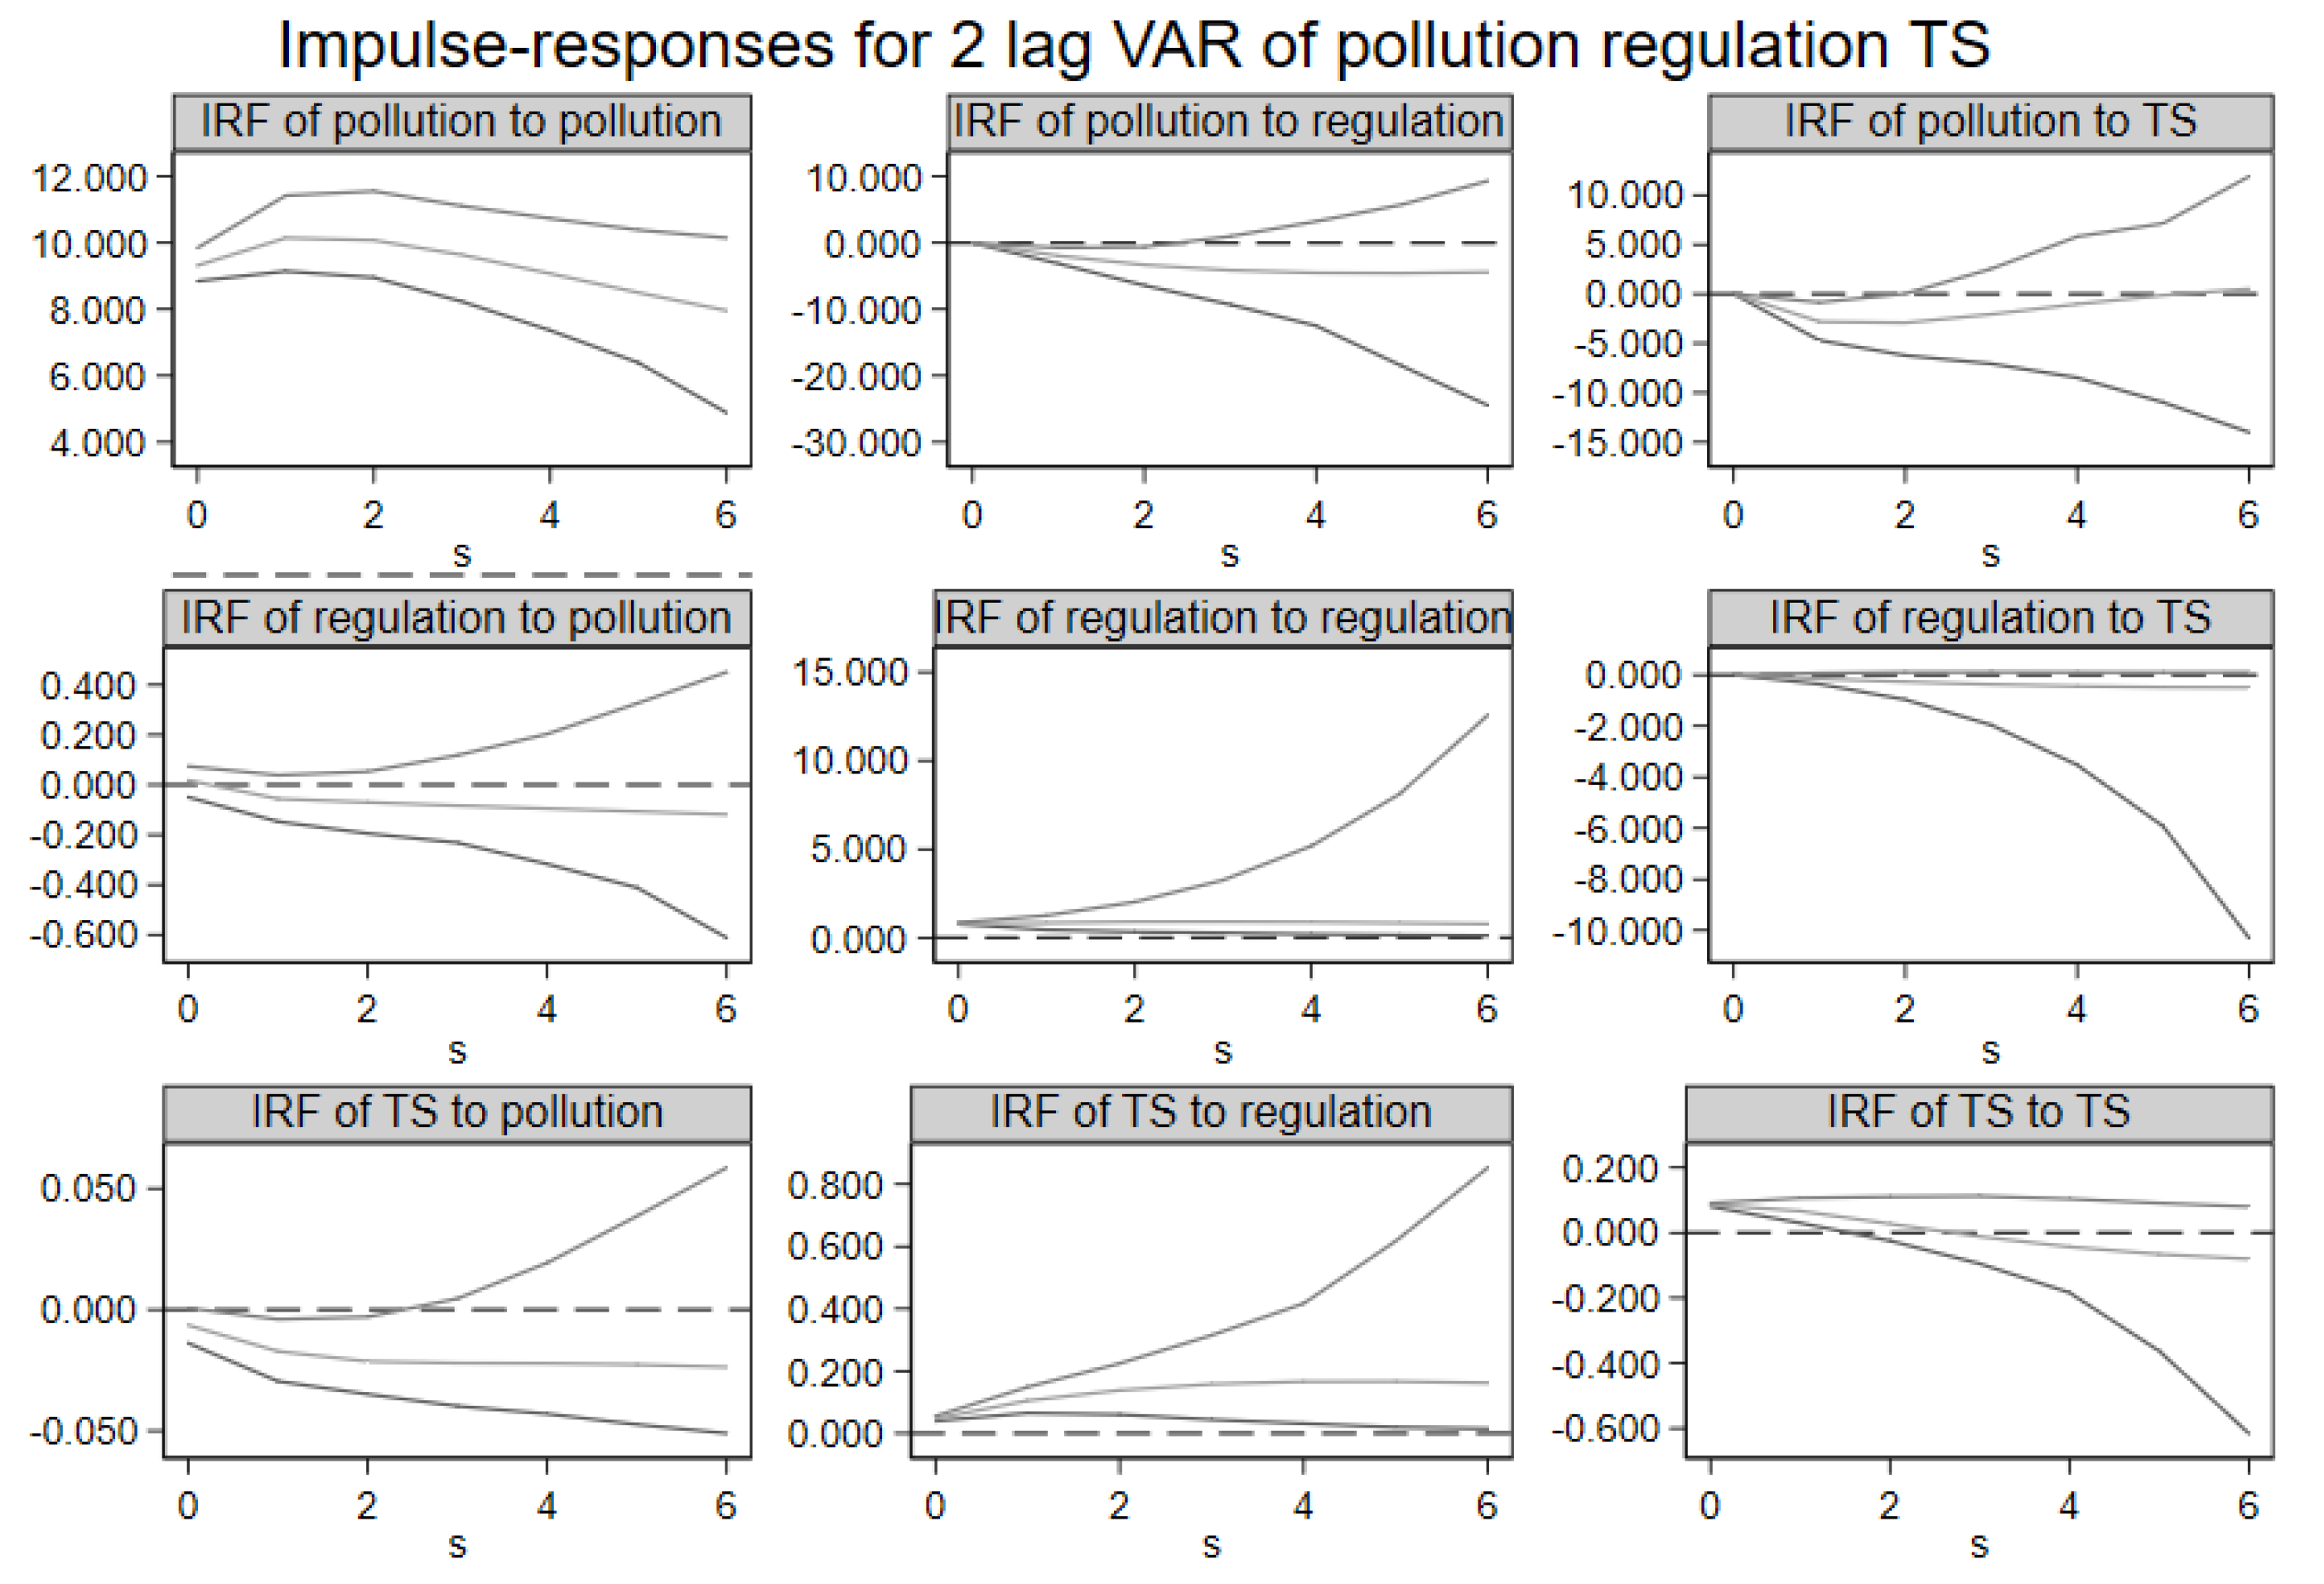
For S O 2 , this study collected data consisting of 30 provinces in China from 2004 to 2020, while Tibet, Taiwan, Hong Kong and Macau are not included due to data availability. The data include S O 2 emissions from industry sources, domestic sources and centralized pollution control facilities. The S O 2 emissions of various industries are shown in Figure 3. In 2020, the top five provinces for S O 2 emissions were Inner Mongolia, Liaoning, Shandong, Guizhou and Yunnan. The total emissions of the five provinces are 1.027 million tons, accounting for 32.3% of the country’s S O 2 emissions. Figure 4 shows the sources of S O 2 . The top three sources of S O 2 emissions are the production of electricity and heat power, smelting and pressing of metals, and manufacturing of non-metallic mineral products. The total S O 2 emissions from the three sources are 2.07 million tons, accounting for 79% of the S O 2 emissions. S O 2 mainly comes from the burning of fossil fuels such as coal and crude oil [45], which is the energy source of the secondary industry. The secondary industry refers to production and processing manufacturing, including the production of electricity and heat power, smelting and pressing of metals and automobile manufacturing, amongst others. As is shown in Figure 5, the proportion of the output value of the secondary industry in the total output value shows a downward trend. As is shown in Figure 6, S O 2 also shows a downward trend. The tertiary industry, also known as the service industry, mainly includes transportation, communications, commerce and others. The tertiary industry is less dependent on fossil fuels than the secondary industry. Promoting the development of the tertiary industry is conducive to reducing pollution. As is shown in Figure 7, the ratio of the tertiary industry output value to secondary industry shows an upward trend across the country. As is shown in Figure 8, the tax rate of S O 2 showed an upward trend.
The average emissions of S O 2 are 506,600 tons per year. The average regional GDP (gross domestic product) per capita is CNY 42,600 per year, and the average number of patents granted in the region is 37,800 patents per year. The average level of urbanization is 54.0% per year. For trade openness, the ratio of total imports and exports to total local GDP can reach a maximum of 1.7. For the investment scale, the ratio of total fixed asset investment output to local GDP reaches a maximum of 0.09. For energy efficiency, for every CNY 10,000 increase in regional GDP, the mean consumption is 0.99 tons per year. The ratio of tertiary industry output value to secondary output value reaches a maximum of 5.3. The average tax charge per pollutant equivalent is CNY 1.36 (Table 1). The descriptive statistics of the main variables are shown in Table 1.

4.2. PVAR Results

STATA software is used to run Model 1. GMM (Generalized Method of Moment) and the impulse response function are performed to test the short-term and long-term interaction between air pollution, industrial structure upgrading and environmental regulation. The regression results are displayed in Table 2 and Figure 2. In Figure 9, the area between the first and third lines forms a 95% confidence interval. The second line represents the impulse response value. All variables in the VAR model are treated as endogenous. According to the literature review in the introduction, there may exist a bidirectional causal relationship between environmental regulation and air pollution as well as between the upgrading of the industrial structure and air pollution. In addition, there is a one-way causal relationship between environmental regulation and industrial structure upgrading.
For S O 2 , the results of GMM are reported in column 2 of Table 2. In particular the first lag of environmental regulation and the industrial structure upgrading negatively determines the current level of S O 2 (p < 0.1). The first line of Figure 2 reports the IRF of S O 2 . The results show that the effect of one standard deviation shock of environmental regulation and industrial structure upgrading on S O 2 is negative. This implies that environmental regulation and industrial structure upgrading are beneficial for pollution reduction in the short and long term, which is consistent with our hypothesis H1.
For the tax rate of S O 2 , the results of GMM are reported in column 3 of Table 2. The coefficient of S O 2 emissions is −0.009 (p < 0.1), and the coefficient of the industrial structure upgrading is insignificant. The second line of Figure 9 reports the IRF of environmental regulation. The effect of one standard deviation shock of S O 2 on environmental regulation is negative. This shows that the deterioration of air quality does not have a significant impact on the improvement of environmental regulation. For the upgrading of the industrial structure, the results of GMM are reported in column 3 of Table 2. The coefficient of the S O 2 tax rate is 0.083 in lag 1 (p < 0.1) and the coefficient of S O 2 is −0.001 (p < 0.1). The third line of Figure 9 reports the IRF of industrial structure upgrading. The upgrading of the industrial structure responds positively to the regulation, which indicates that the improvement of environmental regulation can promote the upgrading of the industrial structure.

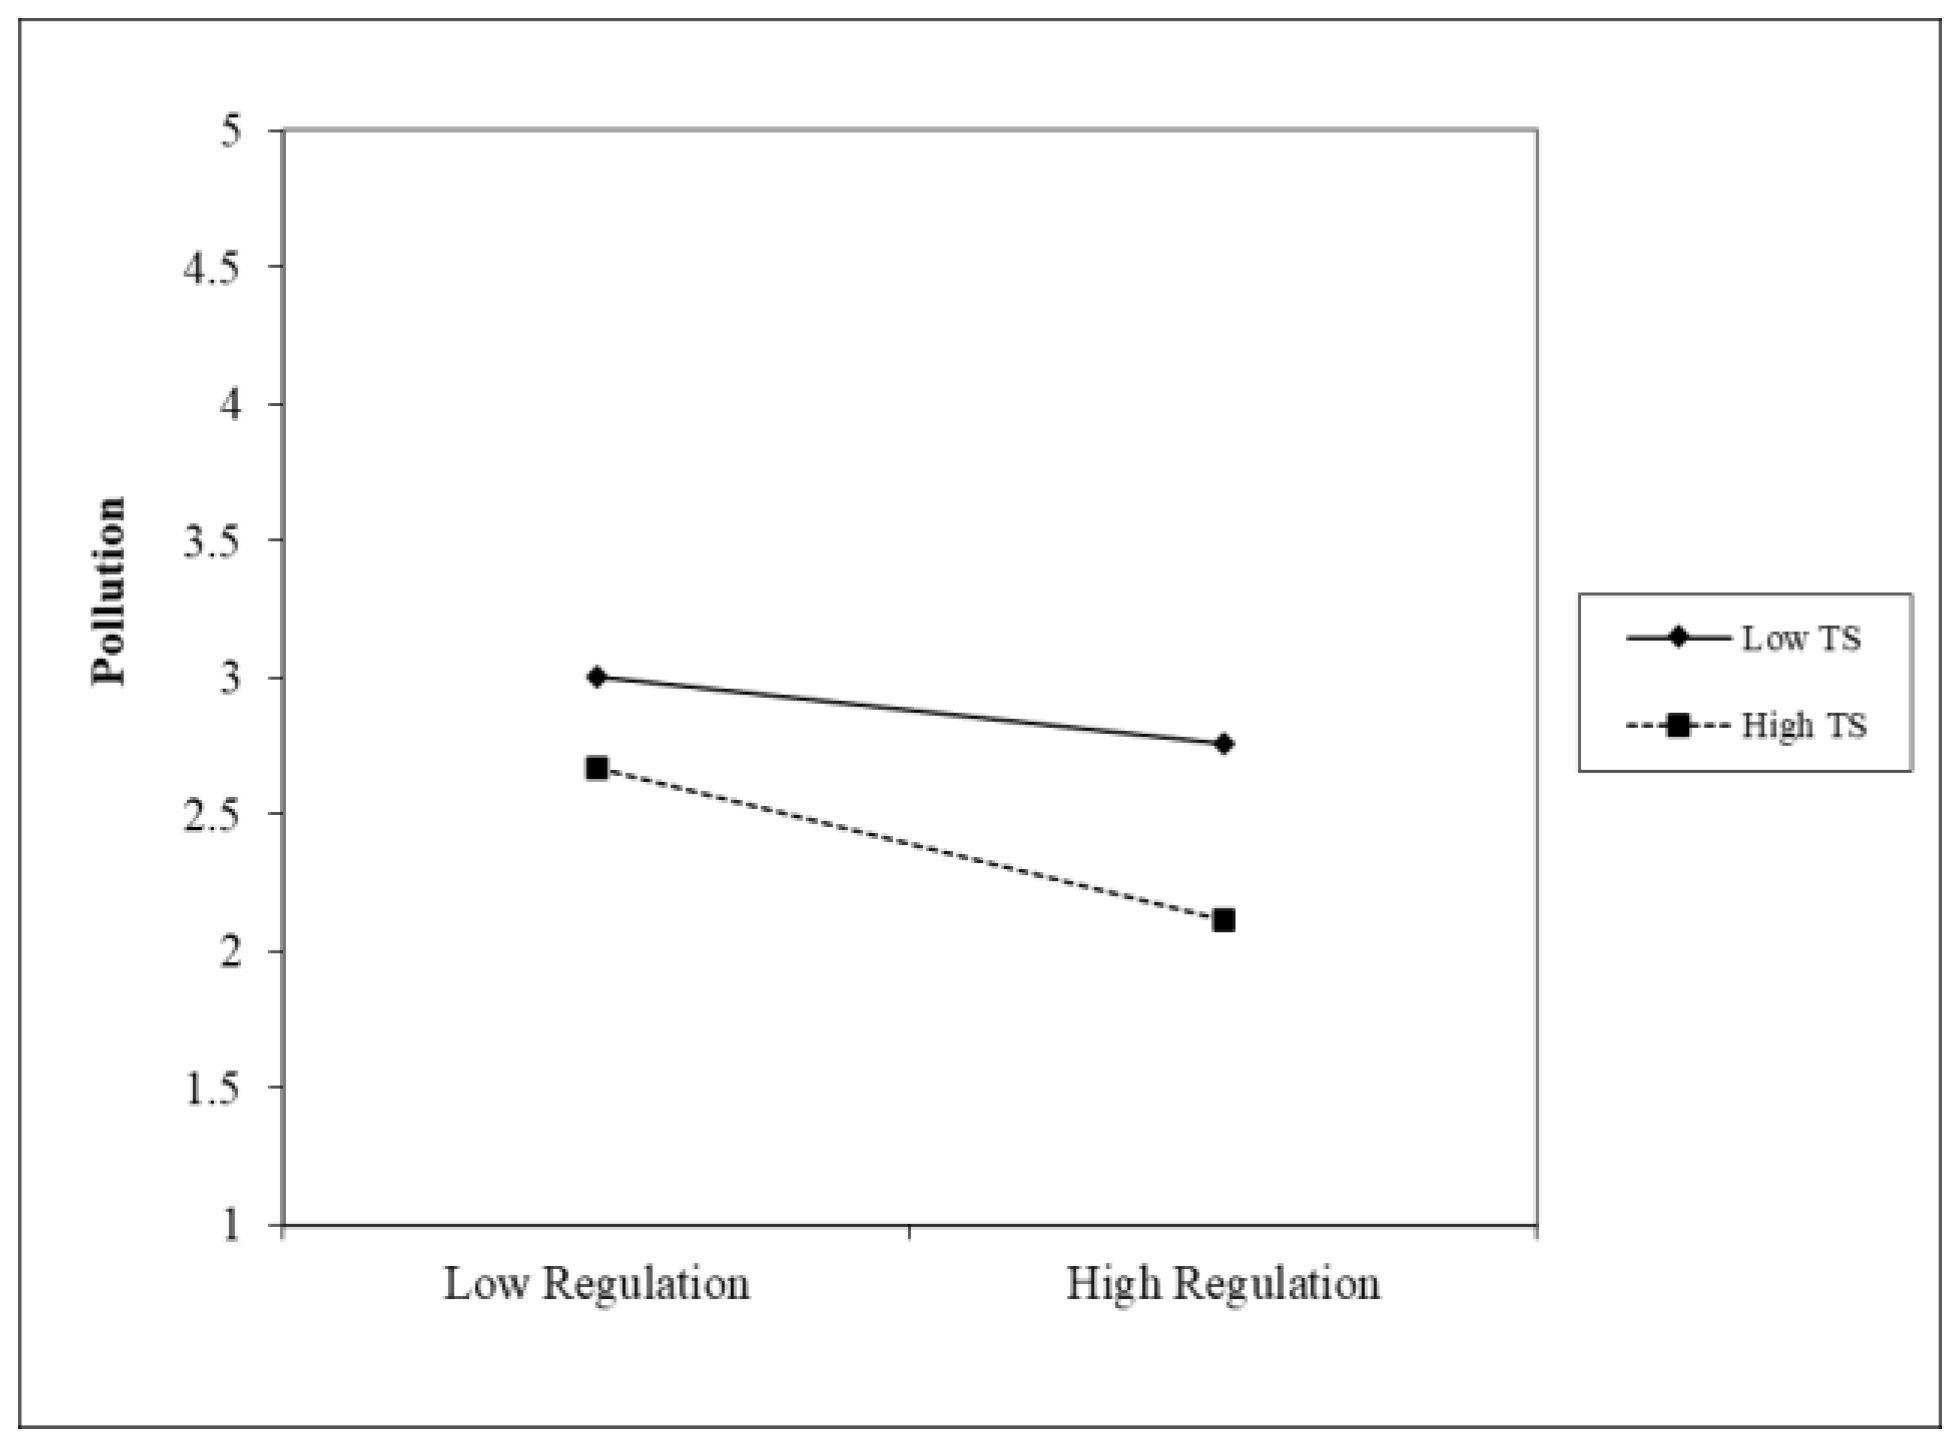
4.3. Moderating Results

The STATA software is used to operate Models 2–4, and the regression results are displayed in Table 3. In Model 2, the coefficient of air pollution is −0.520 (p < 0.1), indicating that environmental regulation can significantly reduce air pollution. This further confirms our H1 hypothesis. The upgrading of the industrial structure is added in Model 3. The coefficient of industrial structure upgrading is −0.363, indicating that the upgrading of the industrial structure can reduce air pollution. The cross term of environmental regulation and industrial structure upgrading (C_regulation*C_TS) is added in Model 4. The coefficient of the cross term is −0.349 (p < 0.1), indicating that the moderating effect is significant. The upgrading of the industrial structure can positively strengthen the reduction effect of environmental regulation on air pollution, which is consistent with H2. To visualize the moderating effect, an interaction diagram of the moderating effect is presented in Figure 10.

5. Discussion

This study aims to explore the relationship between environmental regulation, the upgrading of the industrial structure and air pollution and examine whether the upgrading of the industrial structure can positively moderate the impact of the environmental regulation on air pollution.
Environmental regulation can significantly reduce emissions, but the deterioration of air quality does not have a significant impact on the improvement of environmental regulation. This study finds that environmental regulations can reduce emissions, which is consistent with previous research [3,4,5]. Vikas et al. observed a significant decrease in S O 2 emission in India from 2010 to 2020, attributing this improvement to the implementation of stringent environmental regulations [46]. Teng Wang et al. [28] also found that environmental regulation had a significant negative effect on air pollution and the coefficient was −0.123 based on panel data of 248 Chinese cities from 2003 to 2016. The coefficient in our study is −0.52. It is proved that the impact of environmental regulation on air pollution has been strengthened in the last 5 years. Zhang et al. also found that seasonal environmental regulation policies can significantly improve air quality in the short term [9]. Firstly, environmental regulation could increase the control costs of enterprises [26,27], thus reducing energy consumption and curbing environmental pollution [16]. Secondly, improving environmental regulation can attract more foreign direct investment. Foreign companies often bring advanced clean technologies [47,48] and abundant capital to the host country, resulting in the “pollution halo effect”, which aids in reducing air pollution [49]. This study also finds that the worsening of air quality does not have a significant impact on the improvement of environmental regulation. Environmental issues have a highly significant role in economic development. It is a huge challenge for governments to coordinate high-quality economic development and environmental protection. Baumol suggested that the environmental tax should be adjusted to the pollution situation [14]. Presley K pointed out that the setting of pollution tax should be at an economically appropriate level [50]. In order to relieve the financial burden, the current environmental tax is set lower than the cost of governance and the optimal tax rate [51]. Therefore, an inferior air quality does not have a significant impact on the improvement of environmental regulations in China.
The industrial structure upgrading can reduce air pollution, but the worsening of the air quality will hinder the upgrading of the industrial structure. By constructing a spatial econometric model, Yang et al. [20] concluded that industrial structure upgrading could reduce carbon emissions by improving green total factor productivity, which is consistent with our results. There are some reasons to explain the results. The industrial structure upgrading can promote innovations [52], improve resource allocation efficiency and optimize energy consumption structure [43], thereby further reducing emissions. The study also shows that the worsening of the air quality will hinder the upgrading of the industrial structure. The improvement of enterprise total factor productivity (ETFP) has a significant impact on the industrial structure upgrading [24]. However, the deterioration of the air will add extra treatment costs for companies and reduce the ETFP [53]. Specifically, air pollution has a negative impact on the inflow of talent [54], thus hampering innovation. Meanwhile, air pollution has a “capital crowding-out effect”, reduces regional fixed assets investment and hinders economic development. Innovation and fixed investment are two important factors of ETFP, and the negative impact of air pollution on them will inhibit the development of enterprises and prevent the upgrading of the industrial structure [24].
Environmental regulation can promote industrial structure upgrading, which consists of the previous study [54].The underling mechanisms are that innovation is one of the driving forces of industrial structure upgrading. Environmental regulations can enhance the ability of innovation [52], thus promoting industrial structure upgrading.
The most important finding of this study is that industrial structure upgrading is a moderating variable and can positively moderate the impact of environmental regulation on air pollution. Yang Song finds the environmental regulation has a negative effect on air pollution, the coefficient is −0.339. After adding the variable of the upgrading of the industrial structure, the coefficient is −3.53 [28]. The coefficient of the cross term of environmental regulation and industrial structure upgrading in this study is −0.349. All of these demonstrate how the upgrading of the industrial structure can amplify the reduction effects of environmental regulation on air pollution. The underlying mechanisms remain unclear, but could be twofold. The improvement of environmental regulation can promote the industrial structure upgrading [54]. The industrial structure will promote innovations [52], thus further reducing air pollution. Additionally, as environmental regulations have improved, consumer environmental awareness has gradually grown [55]. The consumer demand can lead enterprises to change the product production structure [7]. The upgrading of the industrial structure can improve resource allocation efficiency and optimize energy consumption structure, thereby further reducing emission [43].

6. Conclusions and Implication

Since launching its open-door policy and economic reform, China has experienced spectacular economic growth. Meanwhile, China has caused unprecedented environmental pollution [1,2]. Although China has enacted numerous measures to protect the air, the effects of environmental regulation are not universally agreed upon. To objectively evaluate the effect of these policies and provide empirical evidence for the government, benchmark analysis is performed. Four key conclusions are obtained. Firstly, environmental regulation can significantly reduce emissions, but the deterioration of air quality does not have a significant impact on the improvement of environmental regulation. Secondly, industrial structure upgrading can reduce air pollution, but an inferior air quality will hinder industrial structure upgrading. Thirdly, environmental regulations can promote industrial structure upgrading. Lastly, industrial structure upgrading is a moderating variable and can positively moderate the impact of environmental regulation on air pollution.
The main policy implications of this study are summarized as follows. Firstly, current environmental regulation does not exert its optimal effect. The reason for this may be that due to economic growth, the environmental tax has been set at a very low level for a long time. In order to make full use of the environmental tax, the government should reform the tax rate and ensure that it adapts to the actual pollution situation and economic development. Secondly, industrial structure upgrading can reduce air pollution, according to the experimental results. Therefore, the government should enact a more rational industrial policy to improve resource allocation efficiency and optimize energy consumption structure. Thirdly, from the linkage perspective, environmental regulation can reduce air pollution by means of industrial structure upgrading. The government should promote industrial policy as well as environmental regulation and regard industrial policy as an important supplement to environmental regulation.

7. Limitation

This study still has some limitations. This study only uses the emissions of S O 2 to measure the pollution. In future research, we will add nitrogen oxide data from 30 provinces in China, excluding Tibet, to enhance the validity of the experimental results. For the impact of environmental regulation on the industrial structure, we provide reasonable explanations where possible, but the underlying mechanism remains unclear.

Author Contributions

Y.L. conceptualized the paper and designed the methodology; Z.-S.W. investigated the date and analyzed the date; N.-E.H.R. performed the supervision; C.-N.X. edited the paper; X.-M.L. reviewed and revised the original draft. All authors have read and agreed to the published version of the manuscript.

Funding

This research was funded by the Major Project of Philosophy and Social Science Research in Hubei Colleges and Universities (21ZD063), the Major Project of Philosophy and Social Science Research in Hubei Colleges and Universities (22D055), Human Social Science Foundation Projects of Wuhan Institute of Technology (R202102), 15th Graduate Education Innovation Fund of Wuhan Institute of Technology (CX2022291).

Institutional Review Board Statement

Not applicable.

Informed Consent Statement

Not applicable.

Data Availability Statement

Restrictions apply to the availability of these data. Data were obtained from the China National Bureau of Statistics and are available at http://www.stats.gov.cn/ (accessed on 13 September 2022).

Conflicts of Interest

The authors declare no conflict of interest.

References

  1. Zhang, Z. China is moving away the pattern of “develop first and then treat the pollution”. Energy Policy 2007, 35, 3547–3549. [Google Scholar] [CrossRef]
  2. Zhu, X.W. Have carbon emissions been reduced due to the upgrading of industrial structure? Analysis of the mediating effect based on technological innovation. Environ. Sci. Pollut. Res. 2022, 29, 54890–54901. [Google Scholar] [CrossRef] [PubMed]
  3. Guo, S.; Tang, X.; Meng, T.; Chu, J.; Tang, H. Industrial Structure, R&D Staff, and Green Total Factor Productivity of China: Evidence from the Low-Carbon Pilot Cities. Complexity 2021, 2021, 6690152. [Google Scholar]
  4. Zhang, Z.; Zhang, G.; Li, L. The spatial impact of atmospheric environmental policy on public health based on the mediation effect of air pollution in China. Environ. Sci. Pollut. Res. 2022; ahead of print. [Google Scholar]
  5. Zhang, Z.H.; Zhang, G.X.; Bin, S. The spatial impacts of air pollution and socio-economic status on public health: Empirical evidence from China. Socio-Econ. Plan. Sci. 2022, 83, 11. [Google Scholar]
  6. Li, J.; Hou, L.; Wang, L.; Tang, L. Decoupling Analysis between Economic Growth and Air Pollution in Key Regions of Air Pollution Control in China. Sustainability 2021, 13, 6600. [Google Scholar] [CrossRef]
  7. Song, Y.; Yang, T.T.; Li, Z.R.; Zhang, X.; Zhang, M. Research on the direct and indirect effects of environmental regulation on environmental pollution: Empirical evidence from 253 prefecture-level cities in China. J. Clean. Prod. 2020, 269, 122425. [Google Scholar]
  8. Du, W.; Li, M. Assessing the impact of environmental regulation on pollution abatement and collaborative emissions reduction: Micro-evidence from Chinese industrial enterprises—ScienceDirect. Environ. Impact Assess. Rev. 2020, 82, 106382. [Google Scholar]
  9. Zhang, Z.; Shang, Y.; Zhang, G.; Shao, S.; Fang, J.; Li, P.; Song, S. The pollution control effect of the atmospheric environmental policy in autumn and winter: Evidence from the daily data of Chinese cities. J. Environ. Manag. 2023, 343, 118164. [Google Scholar] [CrossRef]
  10. Zhang, Z.; Wang, J.; Feng, C.; Chen, X. Do pilot zones for green finance reform and innovation promote energy savings? Evidence from China. Energy Econ. 2023, 124, 106763. [Google Scholar]
  11. Sinn, H.-W. Public policies against global warming: A supply side approach. Int. Tax Public Financ. 2008, 15, 360–394. [Google Scholar] [CrossRef]
  12. Hao, Y.; Deng, Y.; Lu, Z.-N.; Chen, H. Is Environmental Regulation Effective in China? Evidence from City-Level Panel Data. J. Clean. Prod. 2018, 188, 966–976. [Google Scholar]
  13. Li, R.Q.; Ramanathan, R. Exploring the relationships between different types of environmental regulations and environmental performance: Evidence from China. J. Clean. Prod. 2018, 196, 1329–1340. [Google Scholar]
  14. Baumol, W.J. On Taxation and the Control of Externalities. Am. Econ. Rev. 1972, 62, 307–322. [Google Scholar]
  15. Baumol, W.; Oates, W. The Use of Standards and Prices for Protection of the Environment. Swed. J. Econ. 1971, 73, 53–65. [Google Scholar] [CrossRef]
  16. Ederington, J.; Minier, J. Is environmental policy a secondary trade barrier? An empirical analysis. Can. J. Econ./Rev. Can. D’économique 2003, 36, 137–154. [Google Scholar] [CrossRef]
  17. Wang, H.; Li, J. Dual effects of environmental regulation on PM2.5 pollution: Evidence from 280 cities in China. Environ. Sci. Pollut. Res. 2021, 28, 47213–47226. [Google Scholar]
  18. Qin, B.T.; Liu, L.; Yang, L.; Ge, L.M. Environmental Regulation and Employment in Resource-Based Cities in China: The Threshold Effect of Industrial Structure Transformation. Front. Environ. Sci. 2022, 10, 13. [Google Scholar] [CrossRef]
  19. Qi, G.; Wang, Z.; Wang, Z.; Wei, L. Has Industrial Upgrading Improved Air Pollution?—Evidence from China’s Digital Economy. Sustainability 2022, 14, 8967. [Google Scholar]
  20. Ma, T.; Cao, X.X. The effect of the industrial structure and haze pollution: Spatial evidence for China. Environ. Sci. Pollut. Res. 2022, 29, 23578–23594. [Google Scholar] [CrossRef]
  21. Yang, Y.Z.; Wei, X.J.; Wei, J.; Gao, X. Industrial Structure Upgrading, Green Total Factor Productivity and Carbon Emissions. Sustainability 2022, 14, 16. [Google Scholar]
  22. Feng, Y.C.; Wu, H.Y. How does industrial structure transformation affect carbon emissions in China: The moderating effect of financial development. Environ. Sci. Pollut. Res. 2022, 29, 13466–13477. [Google Scholar] [CrossRef] [PubMed]
  23. Lin, S.; Xiao, L.; Wang, X. Does air pollution hinder technological innovation in China? A perspective of innovation value chain. J. Clean. Prod. 2021, 278, 123326. [Google Scholar] [CrossRef]
  24. Zhang, F.; Li, Y.; Li, Y.; Xu, Y.; Chen, J. Nexus among air pollution, enterprise development and regional industrial structure upgrading: A China’s country panel analysis based on satellite retrieved data. J. Clean. Prod. 2022, 335, 130328. [Google Scholar] [CrossRef]
  25. McGartland, A.; Revesz, R.; Axelrad, D.A.; Dockins, C.; Sutton, P.; Woodruff, T.J. Estimating the health benefits of environmental regulations. Science 2017, 357, 457–458. [Google Scholar] [CrossRef]
  26. Becker, R.A.; Pasurka, C., Jr.; Shadbegian, R.J. Do environmental regulations disproportionately affect small businesses? Evidence from the Pollution Abatement Costs and Expenditures survey. J. Environ. Econ. Manag. 2013, 66, 523–538. [Google Scholar] [CrossRef]
  27. Shadbegian, R.J.; Gray, W.B. Pollution abatement expenditures and plant-level productivity: A production function approach. Ecol. Econ. 2005, 54, 196–208. [Google Scholar]
  28. Wang, T.; Peng, J.C.; Wu, L. Heterogeneous effects of environmental regulation on air pollution: Evidence from China’s prefecture-level cities. Environ. Sci. Pollut. Res. 2021, 28, 25782–25797. [Google Scholar]
  29. Du, C.W.; Cheng, B. Environmental regulation, industrial concentration ratio and environmental pollution. J. Xi’an Jiaotong Univ. 2021, 41, 69–77. [Google Scholar]
  30. Dinda, S. Environmental Kuznets Curve Hypothesis: A Survey. Ecol. Econ. 2004, 49, 431–455. [Google Scholar]
  31. Yuan, F. The Potential Economic Growth of China with Restraint of Low Carbon Economy. Econ. Res. J. 2010, 45, 79–89. [Google Scholar]
  32. Sims, C.A. Macroeconomics and reality. Econometrica 1980, 48, 1–48. [Google Scholar] [CrossRef]
  33. Abrigo, M.R.M.; Love, I. Estimation of panel vector autoregression in Stata. Stata J. 2016, 16, 778–804. [Google Scholar] [CrossRef]
  34. Love, I.; Zicchino, L. Financial development and dynamic investment behavior: Evidence from panel VAR. Q. Rev. Econ. Financ. 2007, 46, 190–210. [Google Scholar]
  35. Werf, E.; Maria, C.D. Imperfect Environmental Policy and Polluting Emissions: The Green Paradox and Beyond. Int. Rev. Environ. Resour. Econ. 2012, 6, 153–194. [Google Scholar] [CrossRef]
  36. Nagashima, F. Critical structural paths of residential PM2.5 emissions within the Chinese provinces. Energy Econ. 2018, 70, 465–471. [Google Scholar] [CrossRef]
  37. Zhou, Q.; Zhang, X.; Shao, Q.; Wang, X. The non-linear effect of environmental regulation on haze pollution: Empirical evidence for 277 Chinese cities during 2002–2010. J. Environ. Manag. 2019, 248, 109274. [Google Scholar] [CrossRef]
  38. Wang, Y.; Sun, X.H.; Guo, X. Environmental regulation and green productivity growth: Empirical evidence on the Porter Hypothesis from OECD industrial sectors. Energy Policy 2019, 132, 611–619. [Google Scholar] [CrossRef]
  39. Liu, Y.; Zhu, K.; Li, R.L.; Song, Y.; Zhang, Z.J. Air Pollution Impairs Subjective Happiness by Damaging Their Health. Int. J. Environ. Res. Public Health 2021, 18, 9. [Google Scholar]
  40. Lin, C.M.; Li, C.Y.; Yang, G.Y.; Mao, I.F. Association between maternal exposure to elevated ambient sulfur dioxide during pregnancy and term low birth weight. Environ. Res. 2004, 96, 41–50. [Google Scholar] [CrossRef]
  41. Khaniabadi, Y.O.; Polosa, R.; Chuturkova, R.Z.; Daryanoosh, M.; Goudarzi, G.; Borgini, A.; Tittarelli, A.; Basiri, H.; Armin, H.; Nourmoradi, H.; et al. Human health risk assessment due to ambient PM10 and SO2 by an air quality modeling technique. Process Saf. Environ. Prot. 2017, 111, 346–354. [Google Scholar] [CrossRef]
  42. Lanoie, P.; Patry, M.; Lajeunesse, R. Environmental regulation and productivity: Testing the porter hypothesis. J. Product. Anal. 2008, 30, 121–128. [Google Scholar] [CrossRef]
  43. Han, Y.; Shao, Y.S. Impact Mechanisms of Carbon Emissions, Industrial Structure and Environmental Regulations in the Yellow River Basin. Pol. J. Environ. Stud. 2022, 31, 5693–5709. [Google Scholar] [CrossRef]
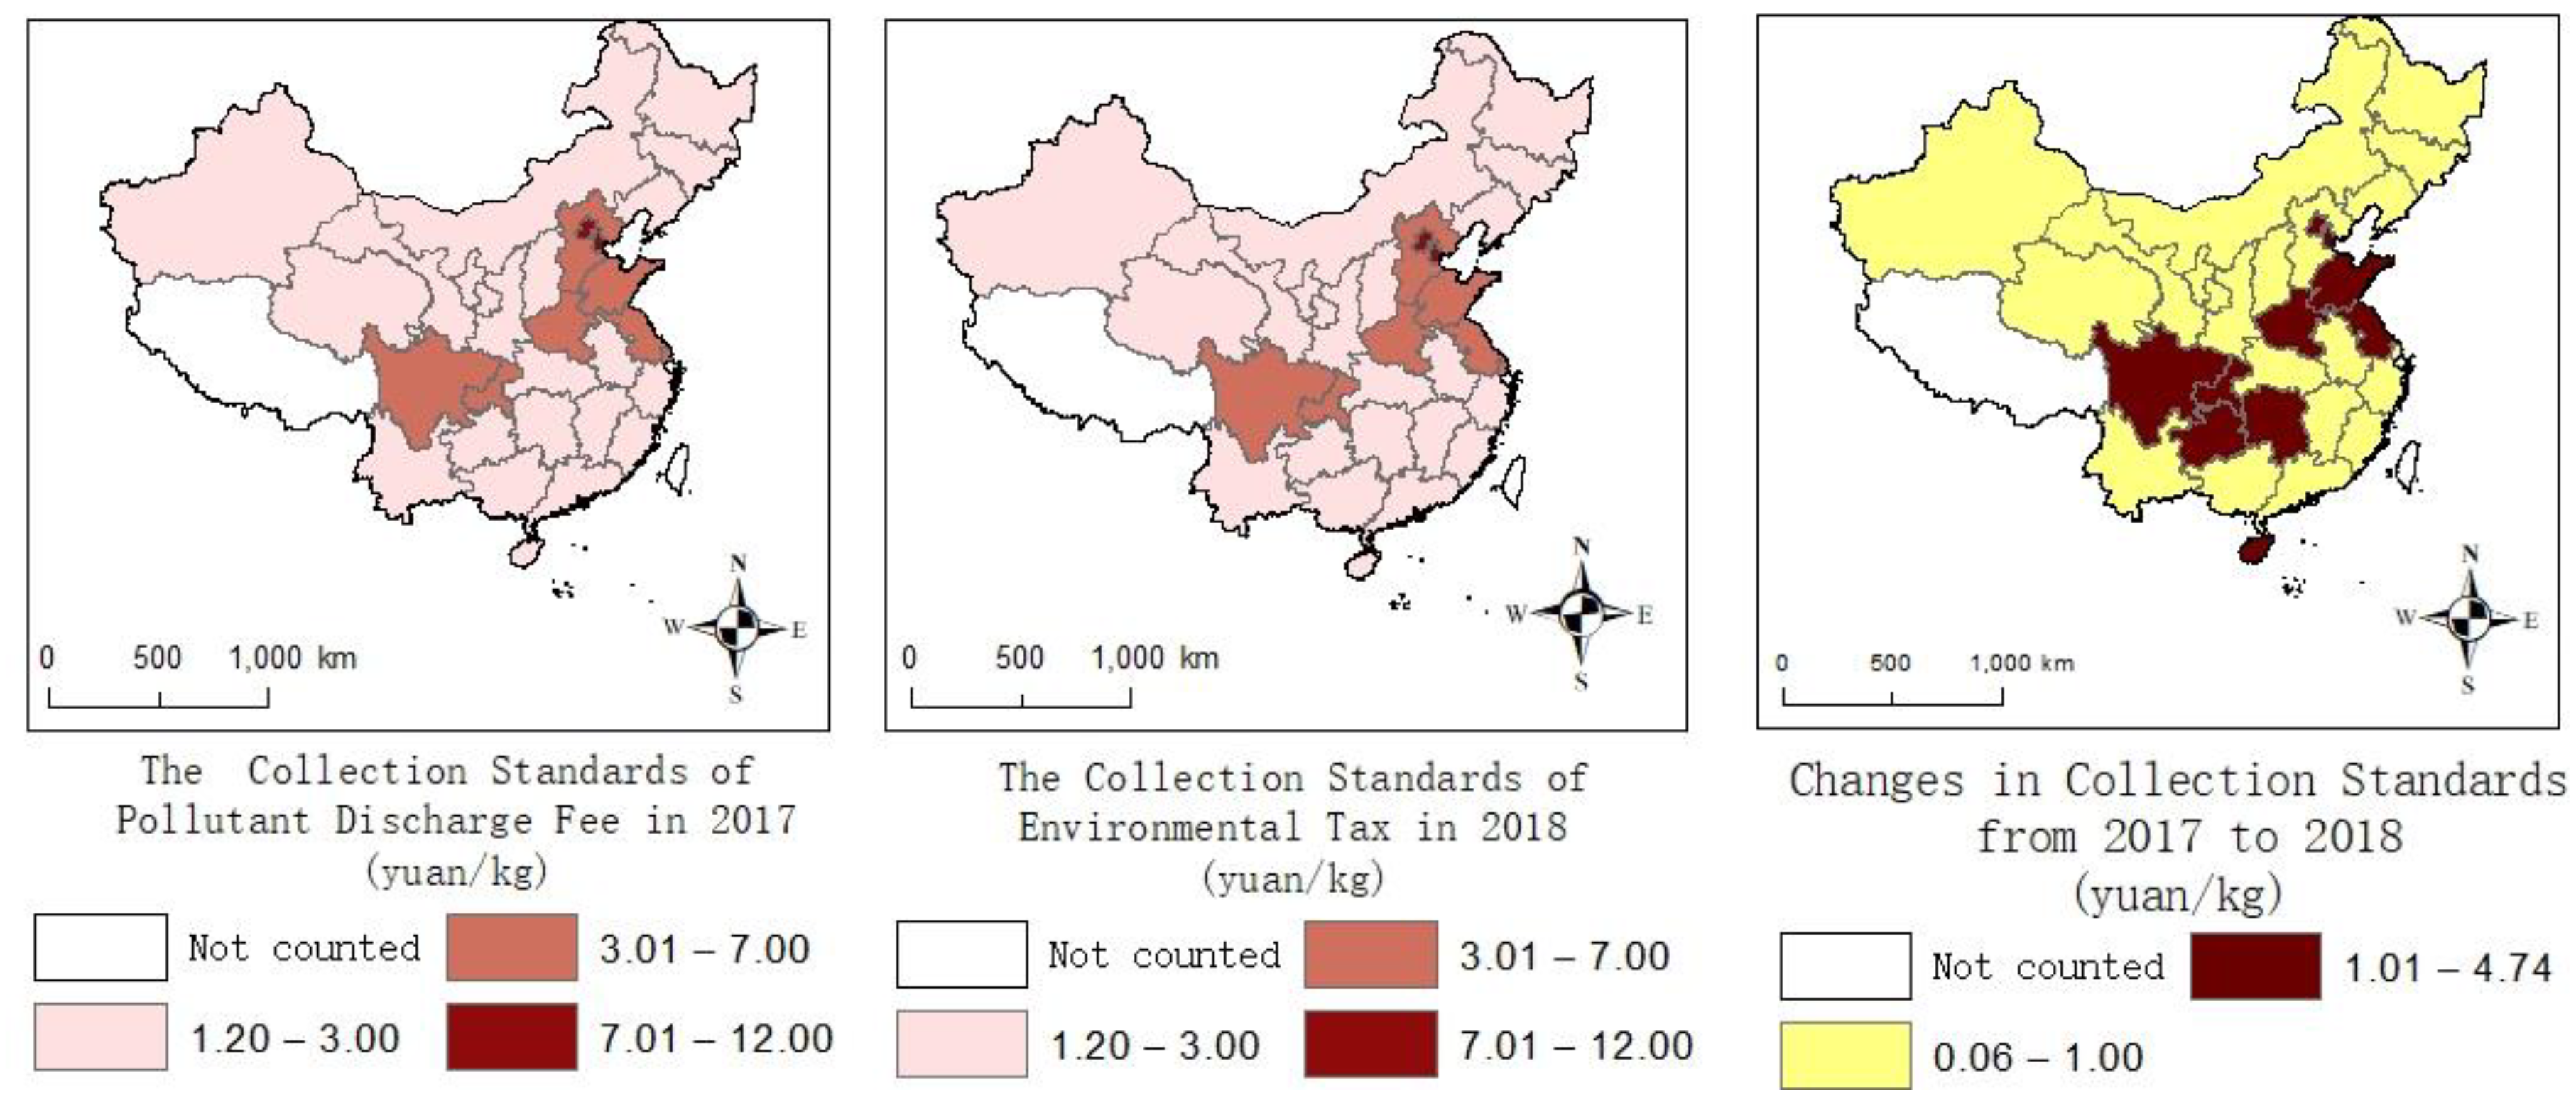
  44. Lu, H.Y.; Liu, Q.M.; Yu, Q. Re-study on the Pollution Reduction Effect of Environmental Tax: Based on the Change of China’s Sewage Charges Collection Standards. J. China Univ. Geosci. (Soc. Sci. Ed.) 2018, 18, 67–82. [Google Scholar]
  45. Zhao, H.; Guo, S.; Zhao, H. Impacts of GDP, Fossil Fuel Energy Consumption, Energy Consumption Intensity, and Economic Structure on SO2 Emissions: A Multi-Variate Panel Data Model Analysis on Selected Chinese Provinces. Sustainability 2018, 10, 657. [Google Scholar] [CrossRef]
  46. Kuttippurath, J.; Patel, V.K.; Pathak, M.; Singh, A. Improvements in SO2 pollution in India: Role of technology and environmental regulations. Environ. Sci. Pollut. Res. 2022, 29, 78649. [Google Scholar]
  47. Albornoz, F.; Cole, M.A.; Elliott, R.J.R.; Ercolani, M.G. In Search of Environmental Spillovers. World Econ. 2009, 32, 136–163. [Google Scholar] [CrossRef]
  48. Dardati, E.; Saygili, M. Multinationals and environmental regulation: Are foreign firms harmful? Environ. Dev. Econ. 2012, 17, 163–186. [Google Scholar] [CrossRef]
  49. Wang, H.; Dong, C.; Liu, Y. Beijing direct investment to its neighbors: A pollution haven or pollution halo effect? J. Clean. Prod. 2019, 239, 118062. [Google Scholar] [CrossRef]
  50. Wesseh, P.K., Jr.; Lin, B. Optimal emission taxes for full internalization of environmental externalities. J. Clean. Prod. 2016, 137, 871–877. [Google Scholar] [CrossRef]
  51. Wang, Y.; Yu, L. Can the current environmental tax rate promote green technology innovation? Evidence from China’s resource-based industries. J. Clean. Prod. 2021, 278, 123443. [Google Scholar] [CrossRef]
  52. Qiu, L.D.; Zhou, M.; Wei, X. Regulation, innovation, and firm selection: The porter hypothesis under monopolistic competition. J. Environ. Econ. Manag. 2018, 92, 638–658. [Google Scholar] [CrossRef]
  53. Fang, D.; Wang, Q.G.; Li, H.; Yu, Y.; Lu, Y.; Qian, X. Mortality effects assessment of ambient PM2.5 pollution in the 74 leading cities of China. Sci. Total Environ. 2016, 569–570, 1545–1552. [Google Scholar] [CrossRef] [PubMed]
  54. Rubashkina, Y.; Galeotti, M.; Verdolini, E. Environmental regulation and competitiveness: Empirical evidence on the Porter Hypothesis from European manufacturing sectors. Energy Policy 2015, 83, 288–300. [Google Scholar] [CrossRef]
  55. Ghosh, D.; Shah, J.; Swami, S. Product greening and pricing strategies of firms under green sensitive consumer demand and environmental regulations. Environ. Sci. Pollut. Res. 2020, 290, 520. [Google Scholar] [CrossRef]
Figure 1. The impact paths of environmental regulation on air pollution.
Atmosphere 14 01537 g001
Figure 2. The changes between pollutant discharge fees and environmental taxes.
Atmosphere 14 01537 g002
Figure 3. The emission of S O 2 in 2020.
Atmosphere 14 01537 g003
Figure 4. The emission of S O 2 in 2020.
Atmosphere 14 01537 g004
Figure 5. The trend of the proportion of output value of secondary industry.
Atmosphere 14 01537 g005
Figure 6. The trend of S O 2 emissions.
Atmosphere 14 01537 g006
Figure 7. The trend of the ratio of the tertiary industry output value to secondary industry.
Atmosphere 14 01537 g007
Figure 8. The trend of the tax rates of S O 2 .
Atmosphere 14 01537 g008
Figure 9. Long-term interaction among environmental regulation, the upgrading of the industrial structure and air pollution.
Atmosphere 14 01537 g009
Figure 10. The effect of moderating.
Atmosphere 14 01537 g010
Table 1. Descriptive statistics.
VariableMeasureUnitMeanStandard
Deviation
MinMax
Dependent
variable
PollutionSO2 emissions
(ten thousand tons)
Ten thousand tons50.0639.680.09171.50
Independent
variable
RegulationThe tax of SO2 Yuan/kg1.3601.7400.42012.00
Control
variable
DevelopmentGDP per capitaTen thousand yuan4.2652.8400.42216.48
InnovationThe number of patents grantedTen thousand piece3.7827.2740.00770.97
UrbanThe proportion of urban resident population in the total permanent resident population%54.0014.0025.0098.00
OpenThe ratio of the total value of imports and exports to local GDP%30.0.36.001.00170.00
InvestThe ratio of total fixed asset investment to local GDP-0.01000.010000.0900
EnergyThe ratio of actual energy use to local GDPTons of standard coal per ten thousand yuan0.9900.6500.1904.190
Moderating
variable
TSThe ratio of tertiary industry output value to secondary industry output value-1.1500.6000.5305.300
Table 2. Short-term interaction among environmental regulation, the upgrading of the industrial structure and air pollution.
VariablesPollutionRegulationTS
Coefficient95% CIp > |z|Coefficient95% CIp > |z|Coefficient95% CIp > |z|
L.h_pollution1.067(0.944, 1.190)0.000−0.009(−0.020, 0.001)0.100−0.001(−0.003, 0.000)0.078
L2.h_pollution−0.129(−0.253, −0.006)0.0390.005(−0.007, 0.018)0.3890.001(−0.000, 0.002)0.143
L.h_regulation−0.498(−3.193, 2.196)0.0761.126(0.408, 1.844)0.0020.083(−0.004, 0.171)0.062
L2.h_regulation1.721(−0.177, 3.619)0.0600.151(−0.063, 0.366)0.168−0.009(−0.040, 0.022)0.571
L.h_TS−32.527(−58.82, −6.226)0.015−1.725(−4.757, 1.306)0.2650.778(0.236, 1.319)0.005
L2.h_TS25.345(11.63, 39.05)0.000−0.147(−1.185, 0.890)0.781−0.190(−0.312, −0.068)0.002
Observations420420420
Table 3. The moderating effect test results.
Model 2Model 3Model 4
Dependent
Variable
Pollution95% CIp ValuePollution95% CIp ValuePollution95% CIp Value
Independent
variable
regulation−0.520−0.733,
−0.308
0.000−0.479−0.683,
−0.275
0.000−0.246−0.440,
−0.051
0.013
Control variabledevelopment−0.058−0.293,
0.175
0.612 −0.041−0.274,
0.190
0.7150.027−0.119,
0.173
0.718
Innovation−0.040−0.097, 0.0160.156−0.038−0.096
0.018
0.179−0.005−0.048,
0.037
0.803
Urban0.369−0.542, 1.2810.4140.319−0.095,
2.911
0.476−0.039−0.440,
0.650
0.706
open−0.035−0.114,
0.044
0.371−0.028−0.110,
−0.053
0.488−0.039−0.108,
−0.028
0.257
invest0.1270.012, 0.2430.0320.1230.006,
0.239
0.0390.1580.028,
0.287
0.372
energy0.285−0.180, 0.7520.2210.3250.179,
0.830
0.1980.297−0.093,
0.688
0.136
Moderating variableTS −0.363−0.826,
0.100
0.120−0.4680−0.929,
0.007
0.142
C_regulation*C_TS −0.349−0.493,
−0.205
0.000
_cons14.2044.789,
16.098
0.00110.6934.827,
16.558
0.0019.508−3.303,
−1.264
0.000
N510510510
r2_a0.9070.9070.913
Prob > F0.00.00.0
Disclaimer/Publisher’s Note: The statements, opinions and data contained in all publications are solely those of the individual author(s) and contributor(s) and not of MDPI and/or the editor(s). MDPI and/or the editor(s) disclaim responsibility for any injury to people or property resulting from any ideas, methods, instructions or products referred to in the content.

