1. Introduction
The Earth’s climate is changing; this is primarily associated with anthropogenic emissions of greenhouse gases and driven by population increases and the necessity of sustaining economic growth [
1]. Changes in solar radiation, temperature, precipitation, and the humidity or frequency of extreme events associated with climate change have a direct and potentially worsening impact on the economy, air quality, and human health [
2]. Although studies focused on the inter-relationships between natural and human systems are a relatively new topic, the global evidence about climate change impacts on human health has grown over the last few decades, and results show that potential direct and indirect health risks are related to heatwaves, droughts, storms, as well as air and water pollution [
3]. According to Patz et al., 2003 was the most evident example of direct human health impact of climate change in Europe, with the hottest summer in over 500 years, with average temperatures 3.5 °C above normal and approximately 22,000 to 45,000 heat-related deaths [
4]. Climate change and air pollution are intrinsically inter-related as temperature changes alter the atmospheric circulation system and modify the near-surface components of the atmosphere, limiting the influx of sunlight; the latter leads to the formation of photochemical smog and changes the distribution of air pollutants due to the reduced air circulation [
5,
6]. Several analyses show that increasing concentrations of air pollutants affect human health by exacerbating pre-existing conditions such as lung diseases, influencing the occurrence of respiratory and cardiovascular diseases, and increasing the mortality rate [
7,
8]. Over recent decades, increasing attention has been paid to the impact of PM pollution on public health. PM is a complex combination of tiny solid and liquid particles from natural and anthropogenic sources released directly into the air because of activities such as diesel fuel use, road and agricultural dust, and industrial processes. According to their aerodynamic diameter, they can be classified as PM10 (<10 μm, inhalable particulate matter), PM2.5 (<2.5 μm, fine particulate matter), or PM0.1 (<0.1 μm, ultrafine particulate matter). Their harm to human health can vary depending on their mass, size, and surface area. Among them, PM2.5 is considered the most harmful one due to its ability to adsorb various toxic and harmful compounds such as heavy metals and polycyclic aromatic hydrocarbons [
9]. Although the underlying mechanisms of action that generate adverse health effects are still elusive, it is known that the small diameters of particulate matter allow them to reach the alveolar compartment of the lungs, where they can cause more adverse effects on health than coarse particles [
10,
11]. Many updated scientific epidemiological studies suggest a positive correlation between exposure to PM2.5 and increased incidence (and mortality) of type 2 diabetes, reproductive system diseases, and neurological effects. Results reported by Chauhan and Johnston in 2003 suggested that long-term exposure to PM2.5 may involve multiple organs in the body and even cause systemic adverse effects [
12].
In 2004, the World Bank and the World Health Organization (WHO) initiated the first comprehensive analysis of ambient air pollution in the Global Burden of Disease (GBD) study [
13]. Since then, much progress has been made to evaluate the effects of PM2.5. For instance, the GBD project and similar assessments have pointed out that PM2.5 is the fifth leading risk factor for death, with exposure to the particles causing about 8.7% of deaths globally in 2017 [
14]. According to the Air Quality Life Index (AQLI), sustained exposure to an additional 10 μg/m
3 of PM2.5 reduces life expectancy by about one year. In addition, an increase of 10 μg/m
3 per day in PM2.5 concentration increases 0.29% of overall non-accidental mortality and 0.22% of respiratory disease mortalities [
15]. In the regional context, the WHO has estimated that approximately 58,000 deaths per year are attributable to ambient air pollution and 80,000 to household air pollution in Latin America and the Caribbean [
16]. In Argentina, more than 14,000 deaths were attributable to air pollution linked to PM2.5 [
17]. In percentages, PM2.5 is believed to cause 8% of stroke deaths, 12% of diabetes deaths, 9% of myocardial infarction deaths, 12% of CPOD deaths, 10% of lung cancer deaths, 7% of respiratory infections deaths, and 4% of neonatal deaths. However, the burden of these environmental exposures is not equally distributed across populations, and the severity of health outcomes associated with exposure to ambient air pollution is often greater for individuals and groups that are more susceptible or more exposed, or, in other words, more vulnerable for any reason. From a climate change perspective, the concept of vulnerability primarily focuses on the degree to which a system can react adversely during a hazardous event. White and Haas expanded the idea by considering that the notion of hazard should consider human factors, such as economic, social, and political aspects, because these factors also influence vulnerability [
18]. Since then and to date, a plethora of studies have addressed vulnerability from different fields of knowledge, and there is a consensus that vulnerability is a multidimensional concept that must include social, economic, and political structures as well as an environmental background [
19]. In this sense, several studies addressed climate change’s impact on vulnerability using different composite indicators, including social, economic, ecological, and health components. However, they are still very limited in Latin America, particularly in Argentina.
This study aimed to further explore the concept of health vulnerability in Argentina, including the aspect of environmental pollution, for the year 2010. To this end, we have developed a geo-referenced database of PM2.5 concentrations and emissions data from the national emissions inventory to analyze possible correlations with the demographic, activity, education, and health data from the 2010 national census. In addition, to provide a more complete picture of health vulnerability in Argentina, an extended index (SVI + PM2.5) was constructed and mapped including PM concentration. To the best of our knowledge, this is the first attempt to provide this type of information in Argentina.
2. Materials and Methods
2.1. Sample and Data
In this analysis, we performed a national-scale analysis. The official information and dataset about the country can be found at
https://www.datos.gob.ar/ (Accessed on 6 August 2023). Still, briefly, Argentina is located in the southern part of South America and covers an area of 2,780,400 km
2 of continental and insular territory. According to the 2010 census [
20], the country had a population of just over 40 million inhabitants with a population density of about 15 people per square kilometer of land. The population growth rate in 2010 was around 1.03 percent per year, with a birth rate of 17.7 live births per 1000 inhabitants and a death rate of 7.4 deaths per 1000 inhabitants. The country is divided into 23 provinces and an autonomous city, Buenos Aires. The provinces are further organized into municipalities totaling 537 districts: of the latter, 48% have less than 25,000 inhabitants, representing 7% of the total population; 37% have between 25,000 and 150,000 inhabitants (29% of the total population); and the remaining 15% have 150,000, representing 64% of the total population [
21]. In 2012, the gross domestic product (GDP) was 470 million USD, with an annual GDP/capita of 11,500 USD. Since emissions are strongly linked to economic activity, it is worth noting that the country’s productive sector is composed of high agricultural production, based mainly on livestock and cereal crops, and it is a major producer and exporter of products derived from soya and sugar cane to produce biofuels. In addition, Argentina is the fourth-largest producer of natural gas in Latin America and has the world’s third-largest shale gas reserves and fourth-largest lithium reserves.
As the present analysis is focused on assessing the impact of PM emissions and concentrations on health vulnerability, the Sanitary Vulnerability Index (SVI) built by Rosatti et al. was used as a baseline [
22]. The SVI was constructed from the available public data with national coverage and high spatial resolution and is essentially based on two main dimensions: data with the addresses of public health facilities throughout Argentina from municipal, provincial, and national listings and socioeconomic status with information containing such relevant variables as education level and poverty indicators from 2010 census data. These two dimensions were combined into a georeferenced Sanitary Vulnerability Index projected onto the national territory as a Sanitary Vulnerability Map.
The index thus constructed was designed to identify areas where the local population’s access to health services lies below a selected minimum threshold. For the present study, it is important to mention that the index was designed using dimensionality reduction techniques to survey information grouped into basic units of analysis called census blocks, which are the smallest statistical unit in Argentina for which census tabulations are publicly available. However, it should be noted that a census block in urban areas can be as small as a single city block, while in rural settings, each basic unit may cover several square kilometers. Finally, the results of this index are expressed as SVI values on a scale from 0 to 1, with higher values denoting more health risk. There are no “normality” values available.
2.2. Measures of Variables
Regarding PM2.5 emissions, a high-resolution seasonal and decadal inventory of anthropogenic gas-phase and particle emissions for Argentina (GEEA-AEIv3.0M) was used. All the details can be found in Puliafito et al. [
23]. Still, in short, the inventory contains information about the activities performed on the continental territory and close coastal maritime area of the country (53–73° W and 21–55° S) [
23]. The data were organized as a gridded map with a resolution of 0.025 × 0.025° and produced for each sector of activity considered an emission source. The analysis results were shown as a single three-dimensional map derived from applying specific emission factors for each source and activity included. Only monthly mean data for the year 2010 and all emission sources cited in the inventory are considered in the present analysis, i.e., power and heat production; fuel production; road transportation; domestic aviation; railroad and navigation; residual, commercial, and public office combustion; fuel use in agriculture; production of minerals, chemicals, and metals; agricultural and livestock feeding; and fire and burning [
23].
PM2.5 monthly mean concentration data for Argentina were obtained from the Atmospheric Composition Analysis Group (V5.GL.03 dataset), Surface PMlas 2.5 (
https://sites.wustl.edu/acag/datasets/surface-pm2-5/#V5.GL.03) (Accessed on 13 March 2023) [
24]. The estimated values of fine particulate matter at ground level were obtained by combining Aerosol Optical Depth (AOD) retrievals from NASA MODIS, MISR, and SeaWiFS instruments with the GEOS-Chem chemical transport model and calibrated with global ground observations using Geographically Weighted Regression (GWR). The data are provided in NetCDF files, with 0.01 × 0.01° resolution and expressed in µg/m
3. In this study, only monthly mean values for 2010 were computed.
Finally, we selected census variables comprehensively related to population density, presence of paved roads, number of homes, educational level of the head of household, home overcrowding, and presence of industrial zones [
20].
2.3. Data Analysis Procedure
To build an integrated overview of all the variables involved, PM emissions and concentrations data required spatial adjustment to achieve compatibilization with census and SVI index values. To this end, annual mean values of PM emissions and concentrations were constructed from monthly data, regrouped into a new grid with pixels of 1 × 1° resolution, and rescaled between 0 and 1 to match the SVI reference scale.
Each pixel’s mean and maximum values were combined with the census data and the SVI index using the nearest-neighbor procedure.
It should be noted that PM2.5 concentrations were considered acceptable when annual mean values were less than or equal to 10 µg/m
3, and in all cases, missing data were not imputed [
18].
Furthermore, Spearman’s correlation coefficient r was calculated between the census data, the SVI index, and annual mean PM2.5 emission and concentration values to assess the possible linkages between all the census variables. This coefficient establishes a relationship between the correlated, non-normally distributed variables through a monotonic function. Meaningless values were defined as those that would explain less than 5% of the observed variable’s variance.
Finally, a new integrated index was constructed to extend the previously existing concept of health vulnerability with the SVI index, combining SVI values and particulate matter concentrations for each census radius and 2010. The values of this new index retain the same scale as the SVI index, varying between 0 and 1, but now with 0 being the value corresponding to absolute zero PM concentration and 1 the value assigned to concentrations greater or equal to 26 µg/m3.
Mathematically, this new index named SVI + PM2.5 can be expressed as follows:
As Equation (1) expresses, the standardization of both components and the weighting procedure used assure equal weighing for SVI + PM2.5 index factor values, and thus, in theory, one value is equally as influential as another in the total SVI. When a multivariable index or composite indicator is built, there is a comprehensive selection of systems for weighting factors. Weighing of indicators may be based on statistical techniques like principal components analysis (PCA) or factor analysis (FA), analytical hierarchical process (AHP), conjoint analysis (CA), or correlation analysis, among many others. Several weighing procedures have been developed focused on specific fields of research or disciplines. For example, three different types of weighing techniques, simple averaging, random weighted averaging, and component averaging, were used in the estimation of the drought vulnerability index for Africa [
25]. Moreover, some authors use no weighing factors to avoid subjectivity introduced by different weighing techniques. Sahoo and colleagues adopted such an approach [
26] for pre-processing indicators for aggregation into a social and economic vulnerability index. Undeniably, the selection of weights might significantly affect the units ranked, but far from reaching a consensus [
26], the recent literature contains analyses performed with several approaches. As Greco et al. (2016) pointed out, no weighting system is above criticism, and there is no clear winning system or a kind of “one-size-fits-all” solution [
27]. Given the similarities in the common schemes appearing in the development of composite indicators mentioned above [
28,
29], we decided to define the new index as the SVI + PM2.5 index with equal weighting for both factors.
3. Results
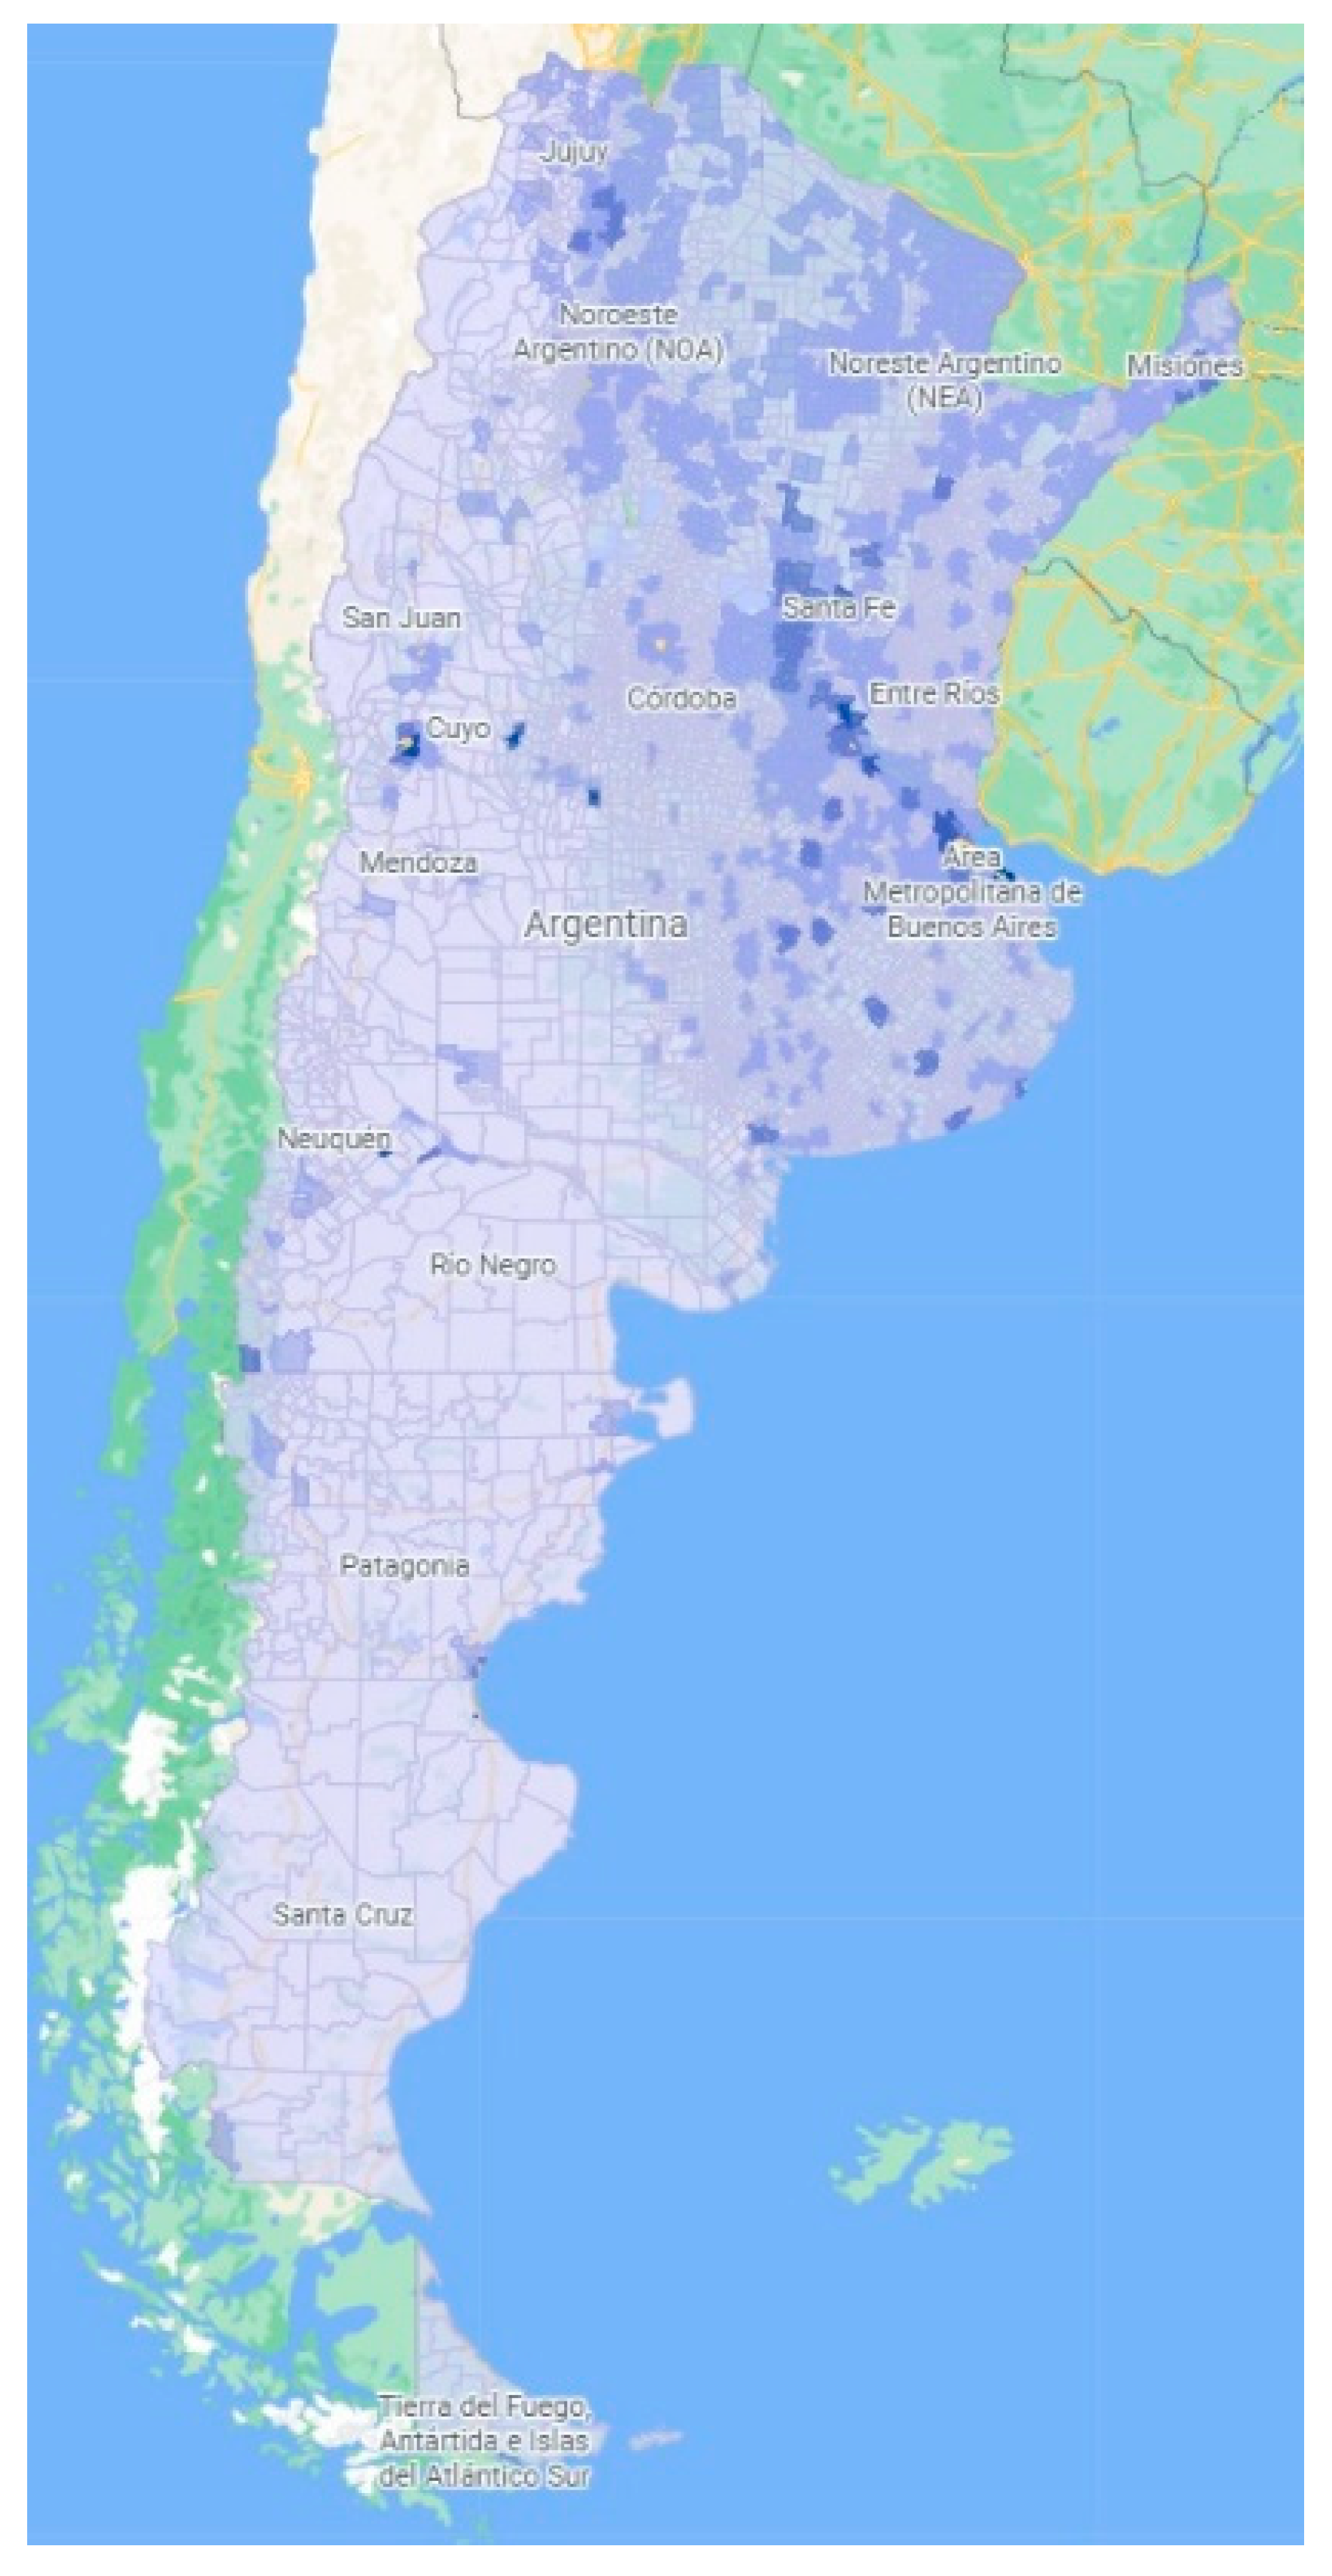
From the monthly average values of the national inventory, a PM2.5 emissions map per census block was constructed for 2010 (
Figure 1), with a scale broken down into five ranges of values, ranging from light blue with PM2.5 emissions below 0.1 Tons/Month to dark blue with PM2.5 emissions above 10 Tons/Month. Overall, high emissions can be found in the central and north parts of the country, including the so-called Pampean region (platense prairie), the region of Cuyo near the Andes Mountains, and further north, the Mesopotamia region. The same extensive area that extends from the country’s center to Paraguay and Brazil and is adjacent to Uruguay is also where the largest number of active railway lines and main ports are located. In addition, the area has the highest vehicular traffic density and, therefore, the highest concentration of fuel sales. According to Puliafito et al., these areas are also where PM10 and NOx emissions are concentrated [
23]. The climate in this region is mixed, but it has the highest average monthly rainfall and annual mean temperature in the country and the highest amount of productive farming areas. Throughout the northeast of the country, from Misiones to the north of Buenos Aires, winds come mainly from the northeast and have an annual average display velocity of up to 18 km/h.
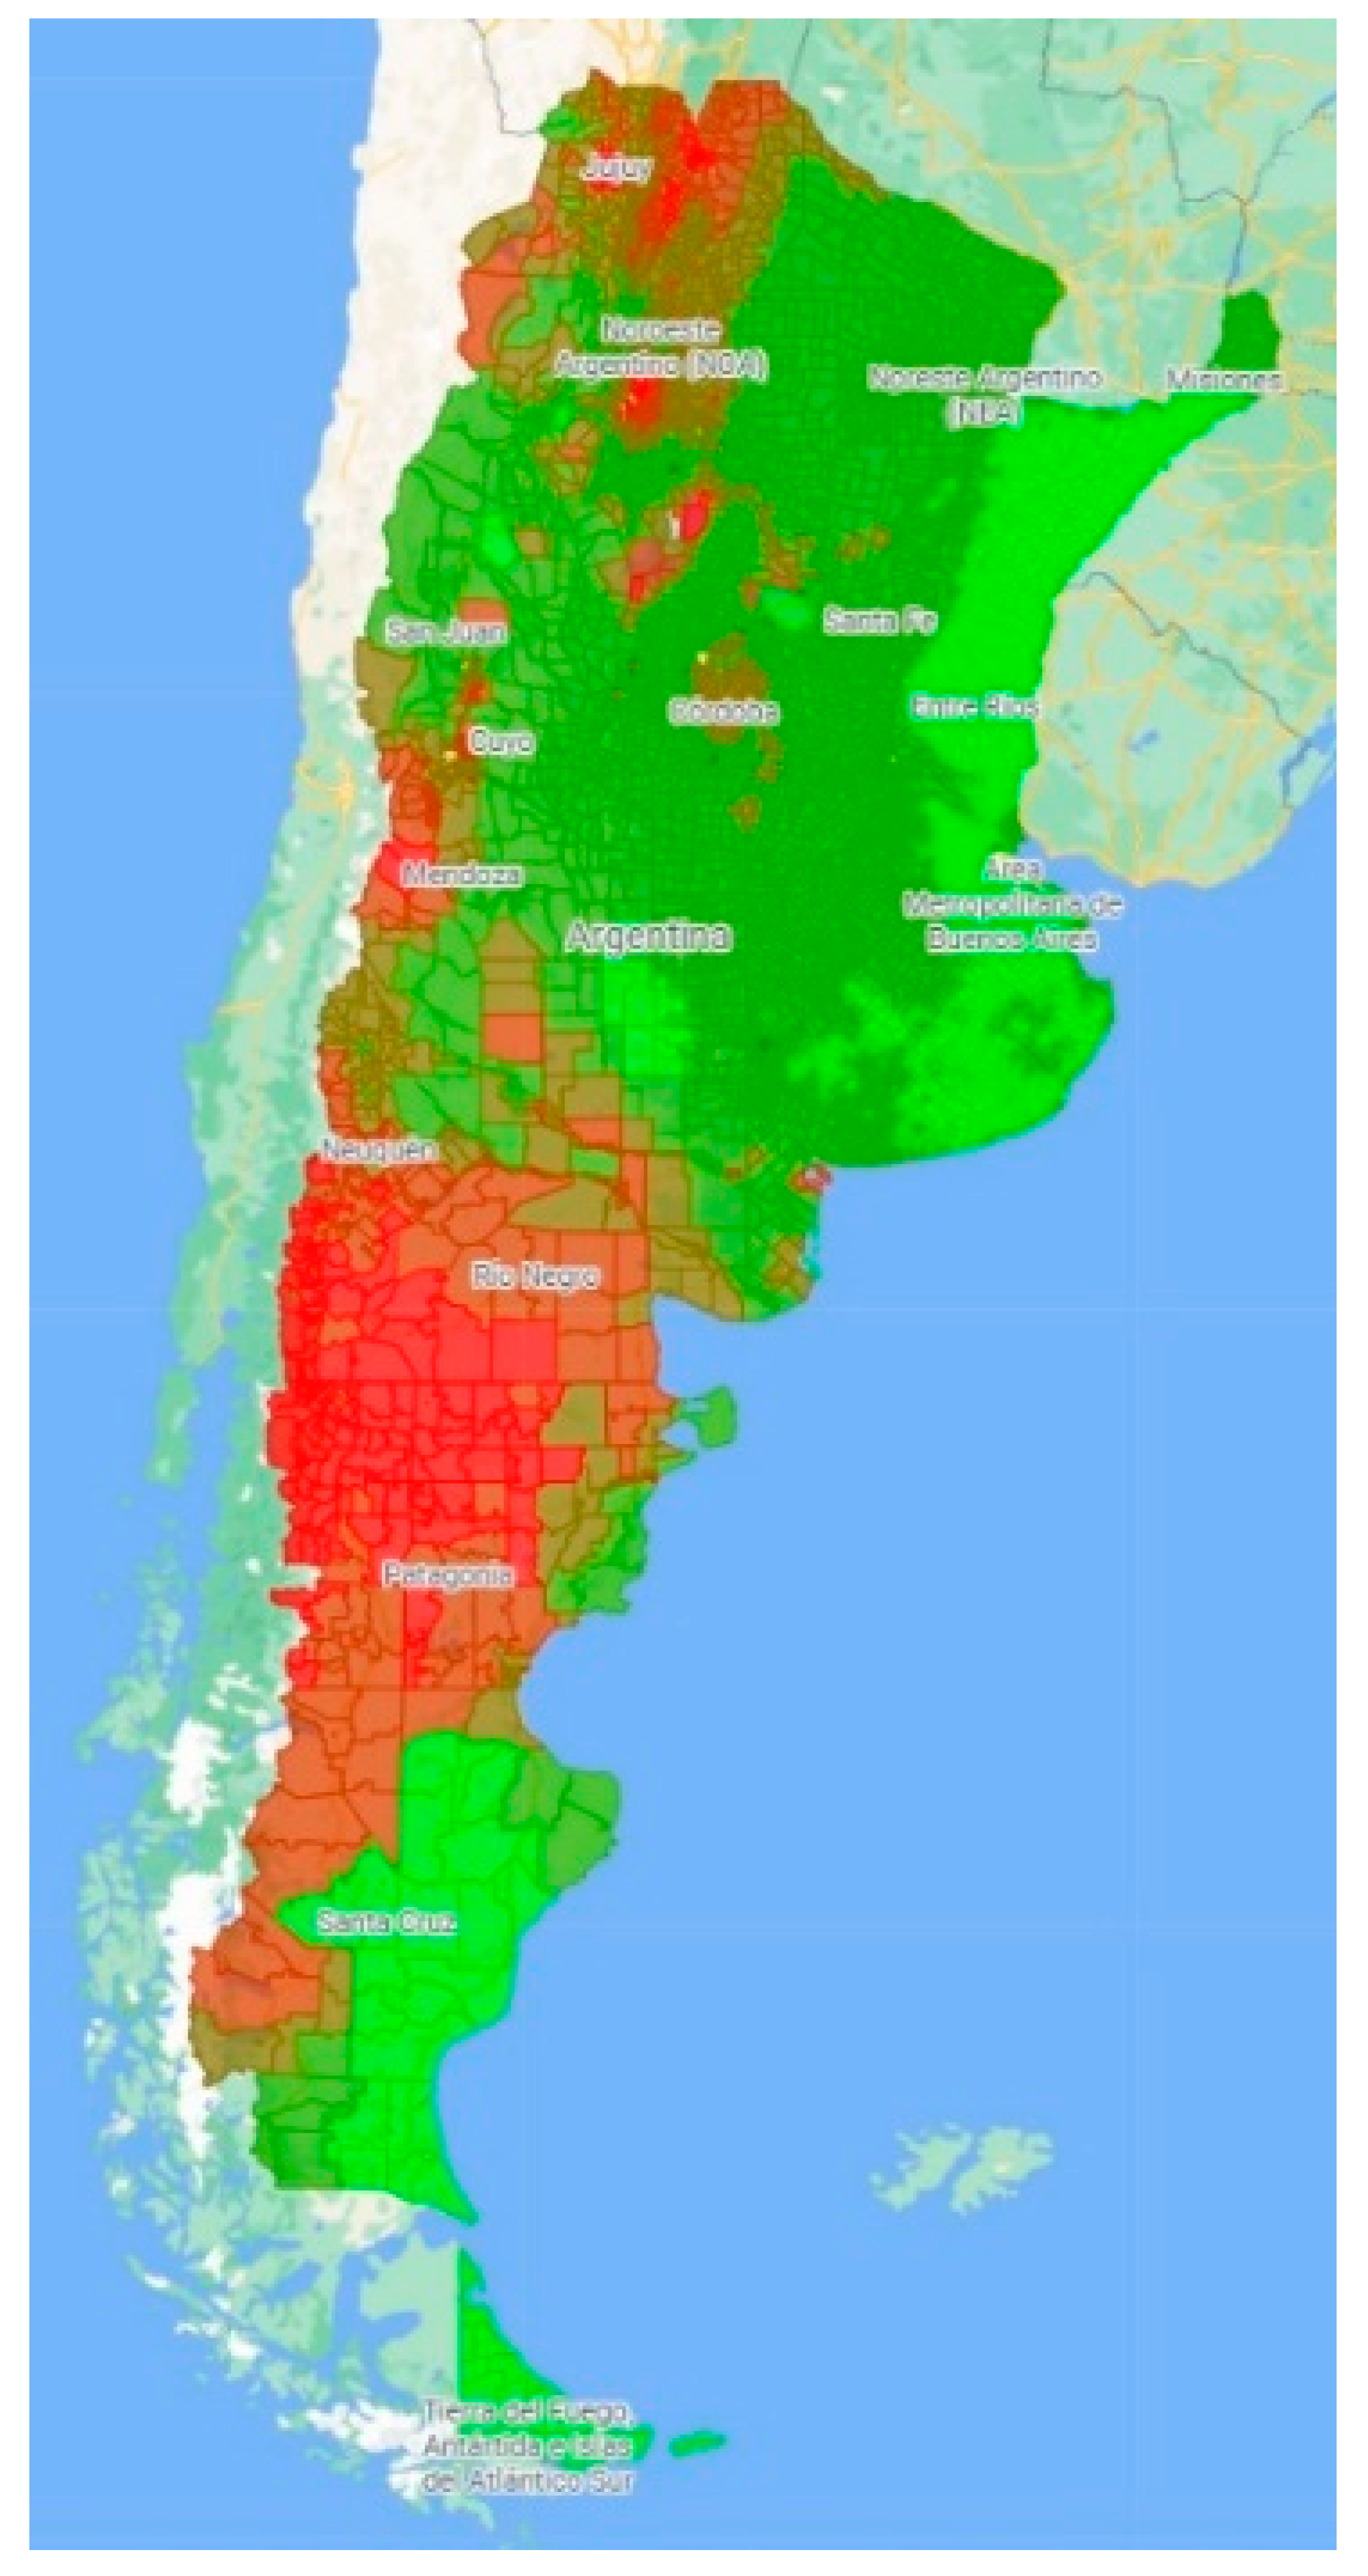
Using the same criteria, maps of annual mean and maximum PM2.5 concentration values were constructed for the same period (
Figure 2 and
Figure 3, respectively). For simplicity, the scale was developed considering values ranging from PM2.5 ≤ 10 µg/m
3 to PM2.5 > 26 µg/m
3.
The annual mean map shows that concentrations are highest in the country’s south, in Patagonia; in the central part of the mountainous belt of the Andes, particularly in the wine-making Mendoza province; and in the extreme northwest of the country (
Figure 2). Percentage values of the annual mean concentration are given in
Table 1. The results show that, according to the scale used, more than 60% of the national territory had intermediate values of annual PM concentration in 2010, but only 15% of the territory had acceptable PM2.5 concentrations equal to or below 10 µg/m
3.
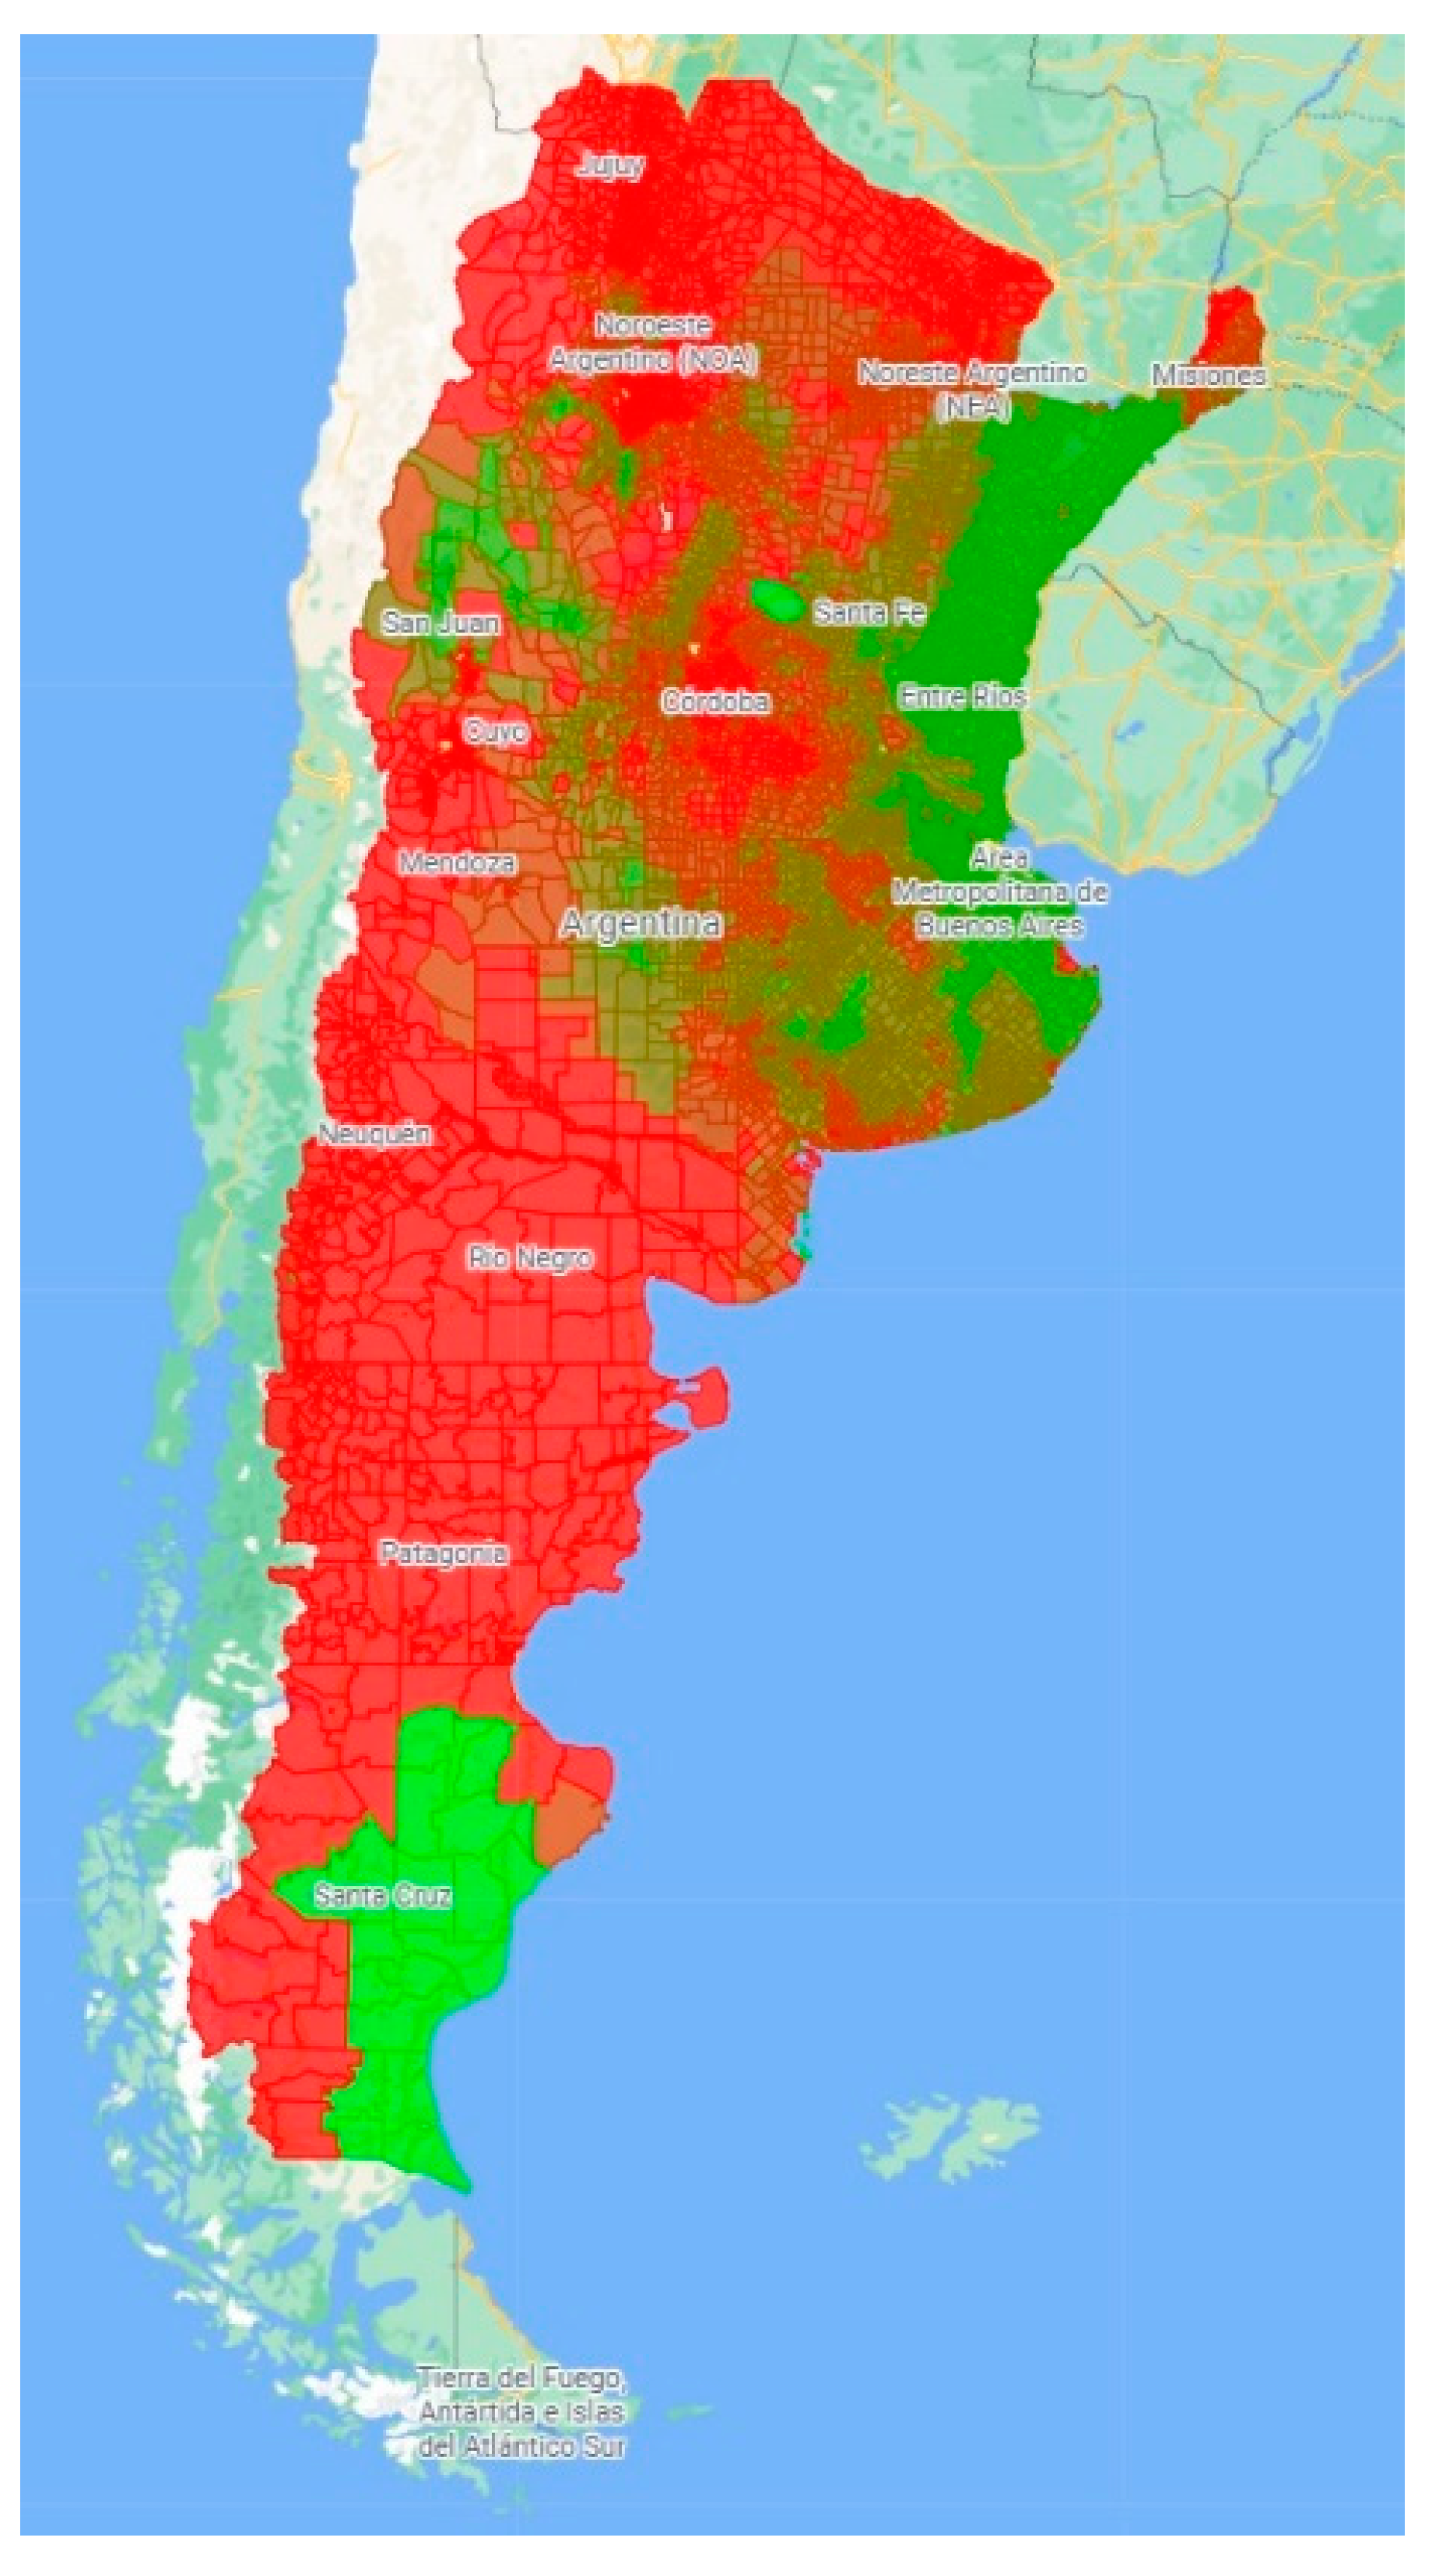
If maximum values for each census radius of PM2.5 concentration are considered (
Figure 3), the map shows that except for the center and part of the northeast of Argentina, the other regions have high concentrations with a spatial gradation pattern varying from low (10.83 μg/m
3) to high (34.43 μg/m
3) PM2.5 concentration. It is worth mentioning that in Patagonia, where the index appears high, the climate is mainly arid, with strong winds moving from west to east. These winds tend to be more intense in summer and weaker in winter, when the highest fuel consumption for heating occurs due to low temperatures. These winds usually appear very early in the morning, while the weather is calm in the evening and at night, which may favor the deposition of pollutants. In addition, the area is the core of the country’s oil industries and has experienced increasing desertification in recent decades.
Comparing
Figure 2 and
Figure 3, it is possible to observe that emissions and concentrations seem to be detected at opposite locations.
Spearman’s correlation was used to analyze further the potential linkages between the emission and concentration of particle matter and selected census data across the country. It should be noted that the census variables considered in the correlation correspond to features with numerical values such as population density, extent of paved roads, the number of garbage dumps in each census radius, level of education in each family, and number of households with the corresponding number of members.
The results are shown in
Table 2. As expected, the results suggest that there is no clear correlation between the habitat conditions or education of the population and the level of particulate matter concentrations since concentrations are strongly dependent on climatic conditions rather than on the habits and customs of the people. However, when emissions are considered, it is possible to observe that there are significant correlations with the extent of paved roads per census block (r = 0.48), the number of households per census block (r = 0.36), and the number of households with a head of household with completed secondary education per census block (r = 0.39).
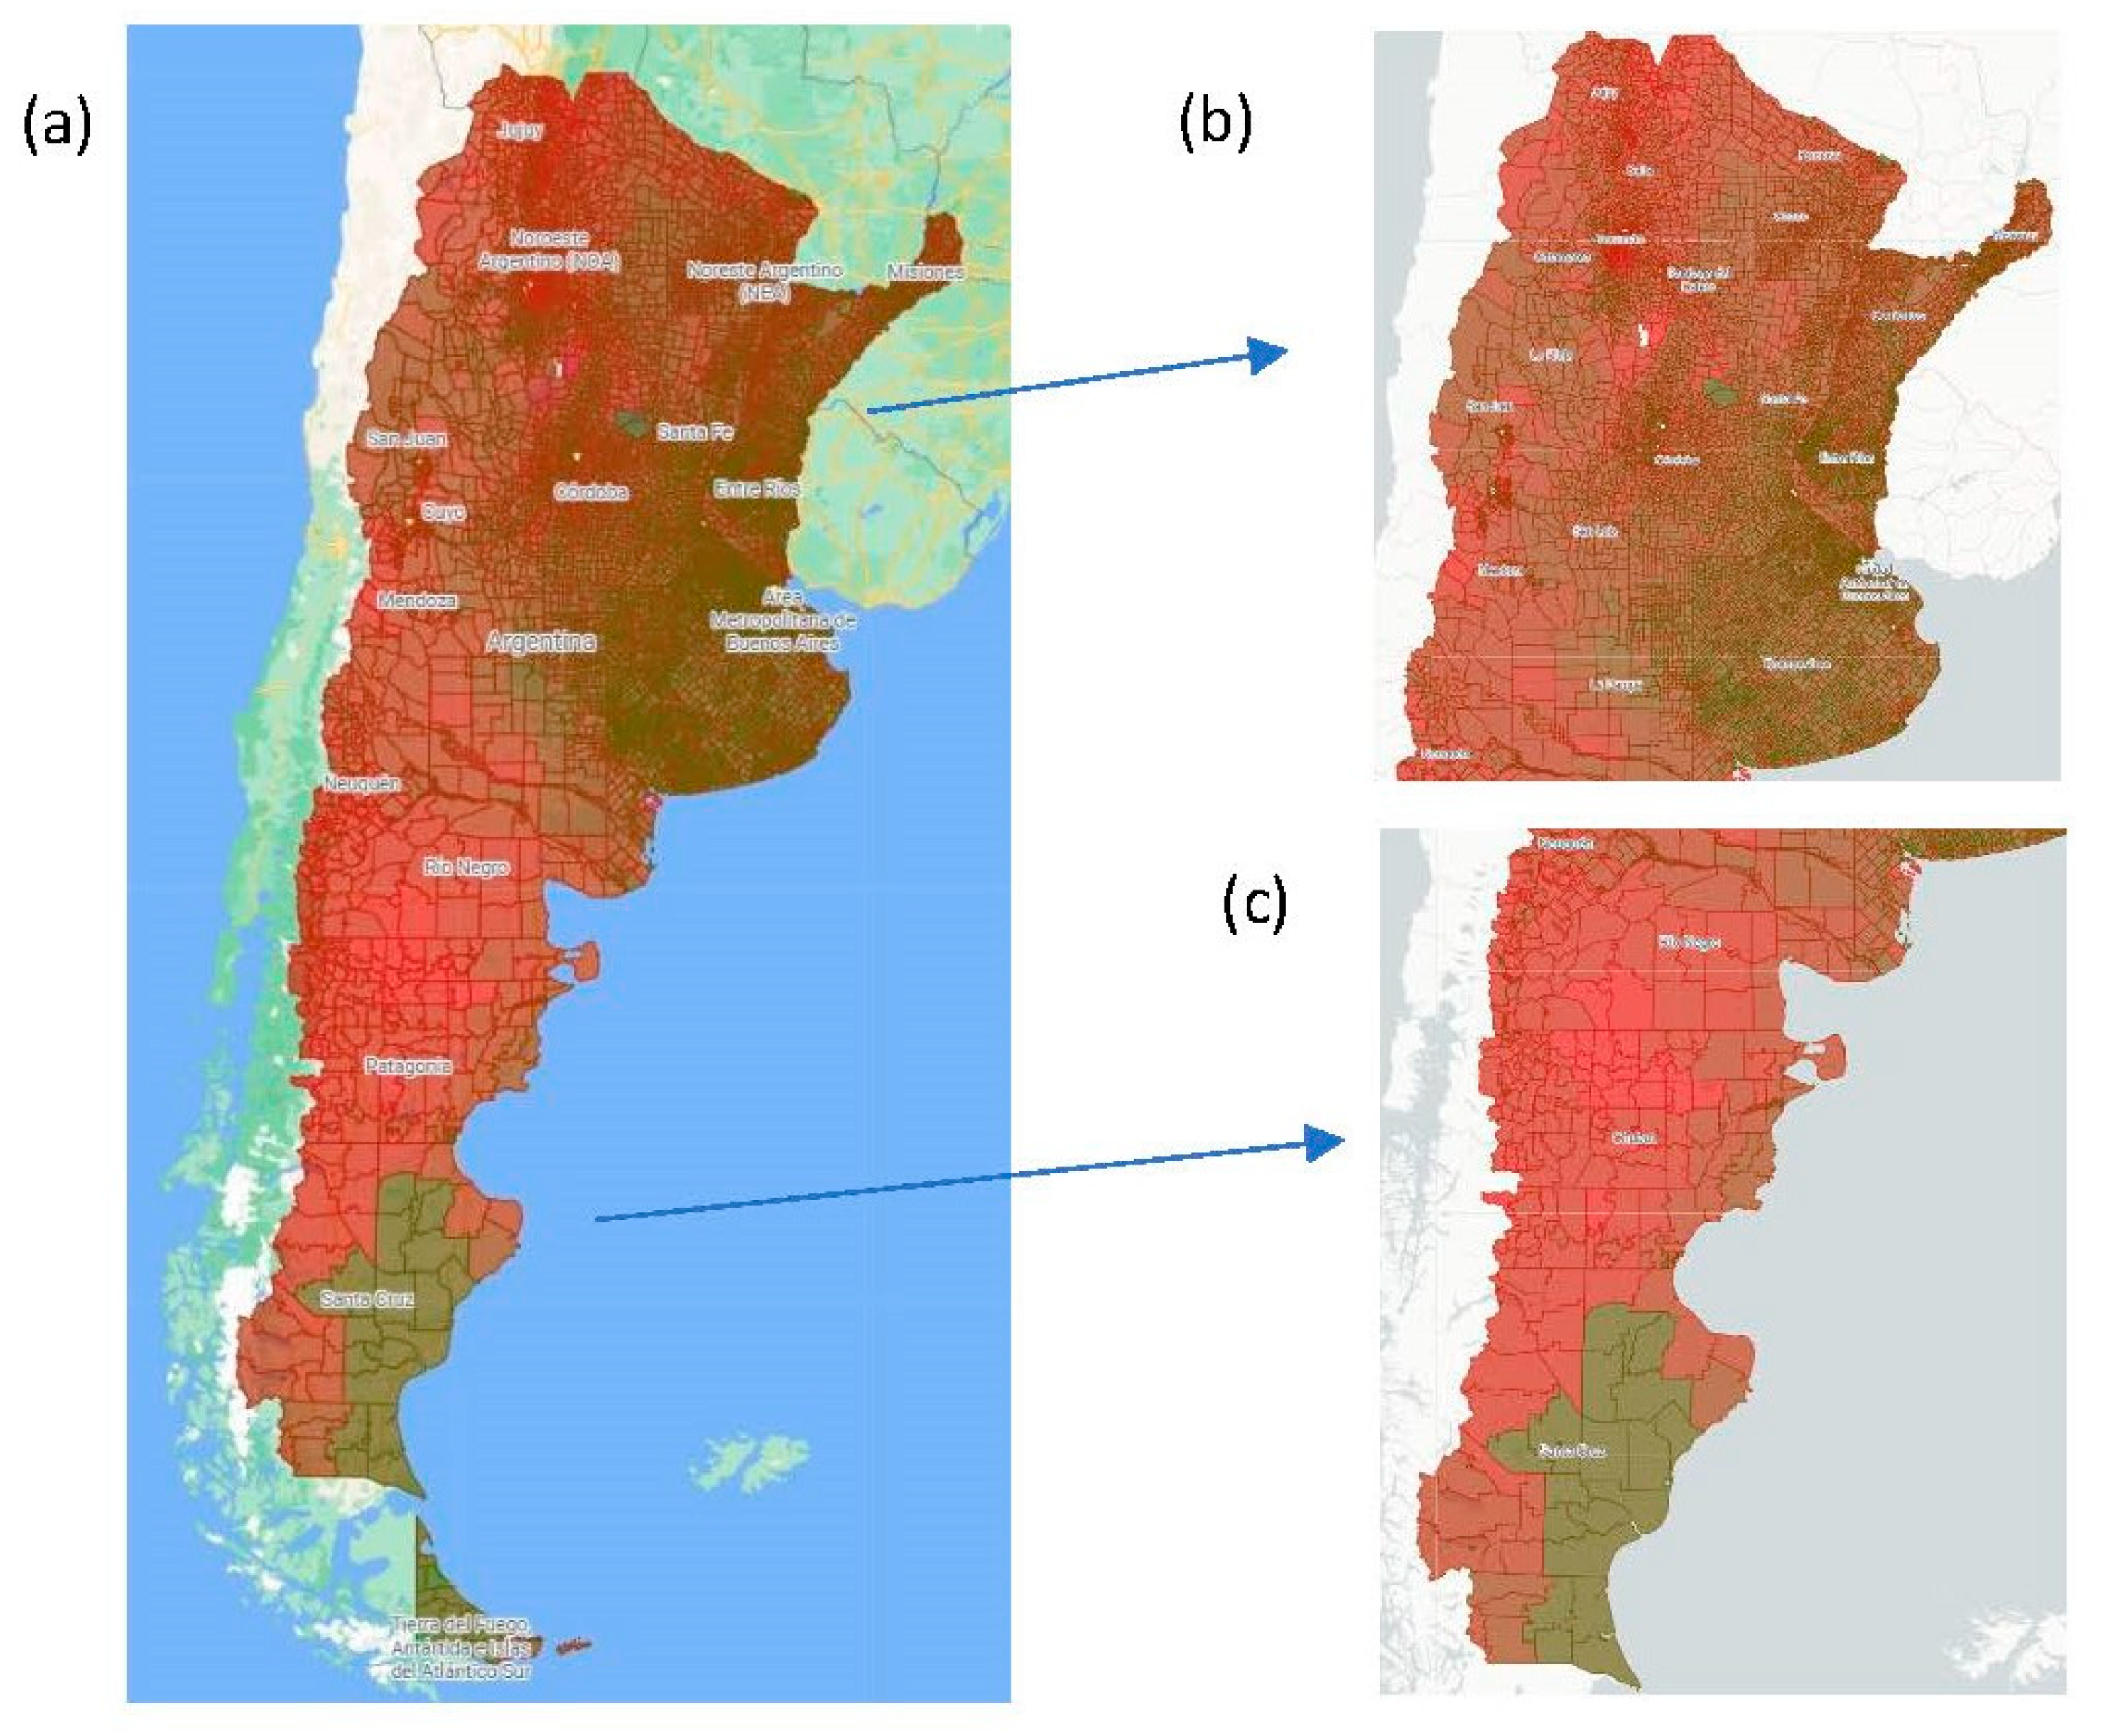
The SVI + PM2.5 index implementation resulted in a new map of health vulnerability combined with PM concentration (
Figure 4a). The results show that exposure to particulate material significantly increases the vulnerability shown by SVI in almost all census blocks. Using both indices (SVI and SVI + PM2.5), the central–east area of Argentina, including the Buenos Aires province, Mesopotamia, and a few areas in the northwest, remains with values closer to the lower end of the scale (
Figure 4b). The south of the country, on the other hand, shows a more homogeneous pattern with higher values of the new index, including areas previously considered with low vulnerability under the SVI classification (
Figure 4c).
In percentage terms,
Table 3 shows that more than 50% of the national territory displayed intermediate index values between 0.4 and 0.7, while 46% had values higher than 0.7 and less than 1% had values below 0.4.
4. Discussion and Conclusions
We present the first health vulnerability index combined with PM2.5 concentrations in Argentina. Correlations between the Rosati SVI index, census data, and PM emissions and concentrations were evaluated at a county level. A national spatial pattern of health vulnerability was developed.
The results showed that the emissions collected by Puliafito et al. in 2010 [
23] were mainly located in the northern part of the country, while the concentrations spread homogeneously over most of the national territory, except for some areas in the southeast and northeast of the country, where the values were at the lower end of the scale.
The relationship between 2010 census variables at each census block and PM2.5 concentrations and emissions was evaluated using Spearman’s correlation. The results show a significant connection between education, road pavement, availability of residential garbage collection, and particulate matter emissions. On the other hand, and since the pollutant concentrations are mainly sensitive to local hourly meteorological conditions, the relationship between the same census data and PM concentrations is not meaningful. However, some interesting insights can be observed. The northern part of the country, surrounded mainly by continental territory, was, in 2010, the one presenting the best performance with annual mean index values lower than 21 µg/m3, while the southern part, surrounded mainly by maritime platform, had annual mean concentration indices even higher than 26 µg/m3. Overall, areas with the lowest concentration were broadly coincident with those indicated by the SVI with the best sanitary health index. Including the concentration in the new index, SVI + PM2.5 led to an increased vulnerability range in areas that already showed more vulnerable populations. In percentage terms, the new index reveals that more than 50% of the country shows a medium degree of vulnerability with values between 0.4 and 0.7, 46% indicates a high index (values above 0.7), and the remaining 1% displays a low vulnerability index with values below 0.4. The results obtained, including air pollution, at least with PM2.5, expand the percentage of the population who are potentially vulnerable.
However, it must be noted that these conclusions must be understood within certain limitations. First, the new SVI + PM2.5 index uses data from the Argentina census from 2010. In the Argentinian Statistical System, the national census is the only source that can be disaggregated to such granular spatial resolution. Although a new national census was conducted in 2022, the final numbers are unavailable. On the other hand, values for PM2.5 concentrations are included in the analysis as an annual average. It is well known that, depending on meteorological conditions, the concentration can vary from hour to hour, and this fluctuation vanishes when only the average of the day is considered, much more so if the monthly or annual average is used. The correlation between variables used and PM concentrations could be found more relevant if the study were conducted with daily data. However, direct monitoring of PM2.5 is still rare in most parts of the world, including Argentina. Therefore, these data should be considered as the first attempt to develop a more comprehensive general indication of air quality’s impact on the country’s health vulnerability due to particulate matter pollution.


 ,
, 
 , 0.1–2.5 Tons/Month
  , 2.5–5 Tons/Month
  , 5–7.5 Tons/Month
  , 7.5–10 Tons/Month
  , >10 Tons/Month
  . Source: https://mapa.poblaciones.org/map/142301/#/@-37.231225,-60.149513,5z/l=312801!v0!w0 (Accessed on 6 August 2023).

 , 11–17 µg/m3
  , 17–21 µg/m3
  , 21–26 µg/m3
  , >26 µg/m3
  . Source: https://mapa.poblaciones.org/map/142301/#/@-37.231225,-60.149513,5z/l=312801!v0!w0 (Accessed on 6 August 2023).


 . 1. (a) Map of Argentina, (b) central and northern regions of the country, (c) southern regions of the country. Source: https://mapa.poblaciones.org/map/142301/#/@-37.231225,-60.149513,5z/l=312801!v0!w0 (Accessed on 6 August 2023).

