Article

Preliminary Survey of Exposure to Indoor Radon in al-Farabi Kazakh National University, Kazakhstan

National Nanotechnology Laboratory of Open Type (NNLOT), al-Farabi Kazakh National University, Almaty 054000, Kazakhstan
*
Author to whom correspondence should be addressed.
Atmosphere 2023, 14(10), 1584; https://doi.org/10.3390/atmos14101584
Submission received: 9 September 2023 / Revised: 4 October 2023 / Accepted: 17 October 2023 / Published: 19 October 2023

Abstract

:
Radon is a major source of naturally occurring radioactivity, and its measurement is considered extremely important in radiation protection, given its association with lung cancer. This pilot study aimed to estimate the annual effective dose received by students and staff based on monitoring data on the concentration of radon in the buildings of al-Farabi Kazakh National University (Almaty, Republic of Kazakhstan), based on the distance to the tectonic fault. The measurements were recorded daily from February 2021 to September 2022 using a RAMON-02 radiometer (SOLO LLP, Almaty, Kazakhstan). All measurements were taken from the basement to the top floor under normal conditions of use. The average accumulated concentrations of radon in the studied buildings ranged from 16.34 to 78.33 Bq/m3, which is below the maximum level of 100 Bq/m3 established by the World Health Organization (WHO) and the legislation of the Republic of Kazakhstan (200 Bq/m3). Relatively high values were recorded in the basement of the Faculty of Physics and Technology building (282.0 Bq/m3 in winter, 1742.0 Bq/m3 in spring, 547.7 Bq/m3 in summer, and 550.7 Bq/m3 in autumn), which is located closest to the tectonic fault and poorly ventilated. In almost all rooms (94%), radon levels were within the WHO-recommended reference level. The averaged results show the influence of the distance to the fault on the average indoor radon levels. The annual effective dose of radon for university students and staff ranged from 1.09 mSv/year to 1.53 mSv/year. The excess lifetime risk of developing cancer ranged from 0.44% to 0.61%.

1. Introduction

Among its 17 Sustainable Development Goals, the United Nations has called for additional indoor radon measurements to assess the health effects of this radioactive gas [1]. Radon, ubiquitous in the biosphere, the soil, and building materials, is a product of the alpha decay of radium, which is born from two chemical elements—uranium and thorium. This gas is released into indoor air from the soil by two physical processes: diffusion and advection. Diffusion can be molecular (Fick’s law), gaseous (Darcy’s law), or a combination of both mechanisms. It thus penetrates the foundations of houses [2]. It tends to concentrate in confined spaces, such as underground mines, workplaces, and homes. The half-life (3.82 days) of radon is long enough for the gas to spread from the source and accumulate in enclosed spaces, presenting a potential health hazard [3,4]. The main risk of radon comes from inhalation of the gas and its highly radioactive solid decay products (polonium, lead, and bismuth), which tend to accumulate in airborne dust. After inhalation, they settle in the human lungs and damage the mucous membranes [5,6]. In this regard, it is essential to consider the volume of air inhaled in the room and the process of its decay inside the lungs.
According to the International Commission on Radiological Protection (ICRP, publications No. 50 and No. 65), the largest proportion of oncological diseases of the lungs and bronchi is caused precisely by radon isotopes and, in particular, by their decay products [7,8]. From this point on, radon measurements became important [9,10,11,12,13]. Studies in Europe, North America, and China have confirmed that low radon levels, such as home levels, pose health risks and contribute significantly to lung cancer worldwide [14,15]. Radon is classified by the World Health Organization and the International Agency for Research on Cancer as a Group I carcinogen [16,17]. A recent epidemiological review of residential radon exposure and its impact on lung cancer risk found that although tobacco is a significant risk factor for lung cancer, it is the first cause in never-smokers and second in those who have ever smoked [18,19,20]. According to CLOBOCAN [21], in 2020, more than 2.2 million new cases of lung cancer and more than 1.7 deaths from it were recorded worldwide. In Kazakhstan, lung cancer over the past 25 years ranks first in mortality from oncological diseases (16.3%), followed by gastric cancer (12%) and colon cancer (10.6%). Approximately 6–7 Kazakhs die of lung cancer every day [22].
An analysis of worldwide studies showed that there are studies on how indoor radon concentrations correlate with the occurrence of lung cancer [23,24,25]. Wichmann carried out one of the largest studies and included a pooled analysis of 2963 cases and 4232 controls (aged 24 to 75) obtained from a West German study from 1990 to 1996 and an East German study between 1990 and 1997 [26]. The subjects were divided into four groups: a control group and three groups exposed to radon-specific activity in a room of 50, 80, and 140 Bq/m3, respectively. Studies have shown a linear dose–response relationship between radon exposure and lung cancer, which is more evident in smokers than in never-smokers.
Outdoor radon concentrations do not pose a risk to human health, as they rapidly drop to negligible levels upon contact with air. Indoors, radon does not dissipate as quickly as it does outdoors; when accumulated indoors, it can pose a danger to human health [27,28]. Indoor radon concentrations can vary depending on natural and anthropogenic factors, such as meteorological factors, building technology, and available ventilation methods. Variations in radon emanation also depend on the localization of tectonic faults in the Earth’s crust, the soil’s porosity, the presence of near-surface groundwater, and other geological properties [29]. Radon concentrations vary greatly within small geographical areas and range from 10 Bq/m3 to 50,000 Bq/m3 [30,31,32].
The problem of radiation safety in dwellings has intensified in recent years based on radon studies in many countries [33,34,35,36]. This is due to the fact that modern trends in construction are based on increasing the energy efficiency of buildings. However, existing studies have shown that energy retrofits of homes can lead to greater airtightness and more than doubling of radon levels [33,34,35]. In ref. [36], the distribution of radon levels was modeled by increasing the airtightness of housing (due to increasing energy efficiency of housing), which, according to the results obtained, will lead to an increase in the average concentration of radon in premises by approximately 56.6%, and, consequently, will increase the associated risk lung cancer. Most people are exposed to radon in homes and workplaces [14,15]. In Canada, it is estimated [14] that 16% of lung cancer cases are due to indoor radon exposure, and more than three thousand deaths from radon lung cancer are expected annually. Measures to reduce radon levels in homes that exceed 200 Bq/m3 will potentially help prevent 28% of the expected cases of lung cancer caused by radon. In ref. [15], the authors studied the risk factors contributing to the high incidence of lung cancer in tin miners in Yunnan Province, and radon exposure was identified as one of the significant factors. Based on the results of this study, it was found that the key to combating lung cancer among miners is reducing the concentration of radon and arsenic in the working environment through ventilation, controlling bad habits, such as smoking, and minimizing the possibility of occupational contamination. Among all sources of radioactivity that have a significant dose load on the human respiratory tract, inhaled isotopes of radon and its decay products are predominant. 222Rn gives approximately 50–55% of the radiation dose each inhabitant of the Earth receives annually from natural radionuclides, and 220Rn adds another ~5–10% to this. In 2014, the ICRP updated the recommendations on radon [27], which states that it is necessary to set a national reference level as low as reasonably achievable, in the range of 100–300 Bq/m3. International Organizations for Radiation Protection [37] recommends measuring the radon level in all homes, workplaces, and other buildings with a high level of employment, highlighting the importance of this problem and the corresponding measurements. A correct assessment of indoor radon exposure is based on measuring indoor radon concentrations and considering its changes over time.
In Almaty, from 1990 to 1993, preliminary measurements of the radon levels in public buildings and kindergartens were carried out. Several places with radon levels from 380 to 532 Bq/m3 have been identified [38]. In 2006, “Ecoservice S” LLP conducted studies on the radon hazard in the territory of the Republic of Kazakhstan and the relationship between the incidence of the population and radon manifestations. The collection and analysis of materials on the incidence of the population with radiation-induced diseases in Kazakhstan, the zoning of Kazakhstan according to geological features, and radon hazards in various regions of the Republic have been carried out. According to the data obtained [39], almost the entire part of Kazakhstan east of the Kostanay–Shymkent line is potentially hazardous due to radon to some degree. At the same time, areas with varying degrees of radon hazard could be distinguished in this territory. At the same time, it must be said that the knowledge of the radon hazard of Kazakhstan is low, which is explained by the insufficient volume of measurements and the generally low reliability of the radon concentration measurements. In 2008–2011, within the framework of studies on radon activity in the indoor air of the Almaty region, an excess of the standard was found in 22.1% of the studied premises [40]. However, the problem of the harmful effects of radon on the population of Kazakhstan has yet to be sufficiently studied, although there are regions in the country with a high content of radon [41]. Due to the absence of a state program in the Republic, comprehensive studies on the impact of radon on public health have yet to be carried out.
This work aimed to estimate the annual effective dose of radiation based on monitoring measurements of radon concentrations with the identification of the specific influence of tectonic faults in Almaty.

2. Materials and Methods

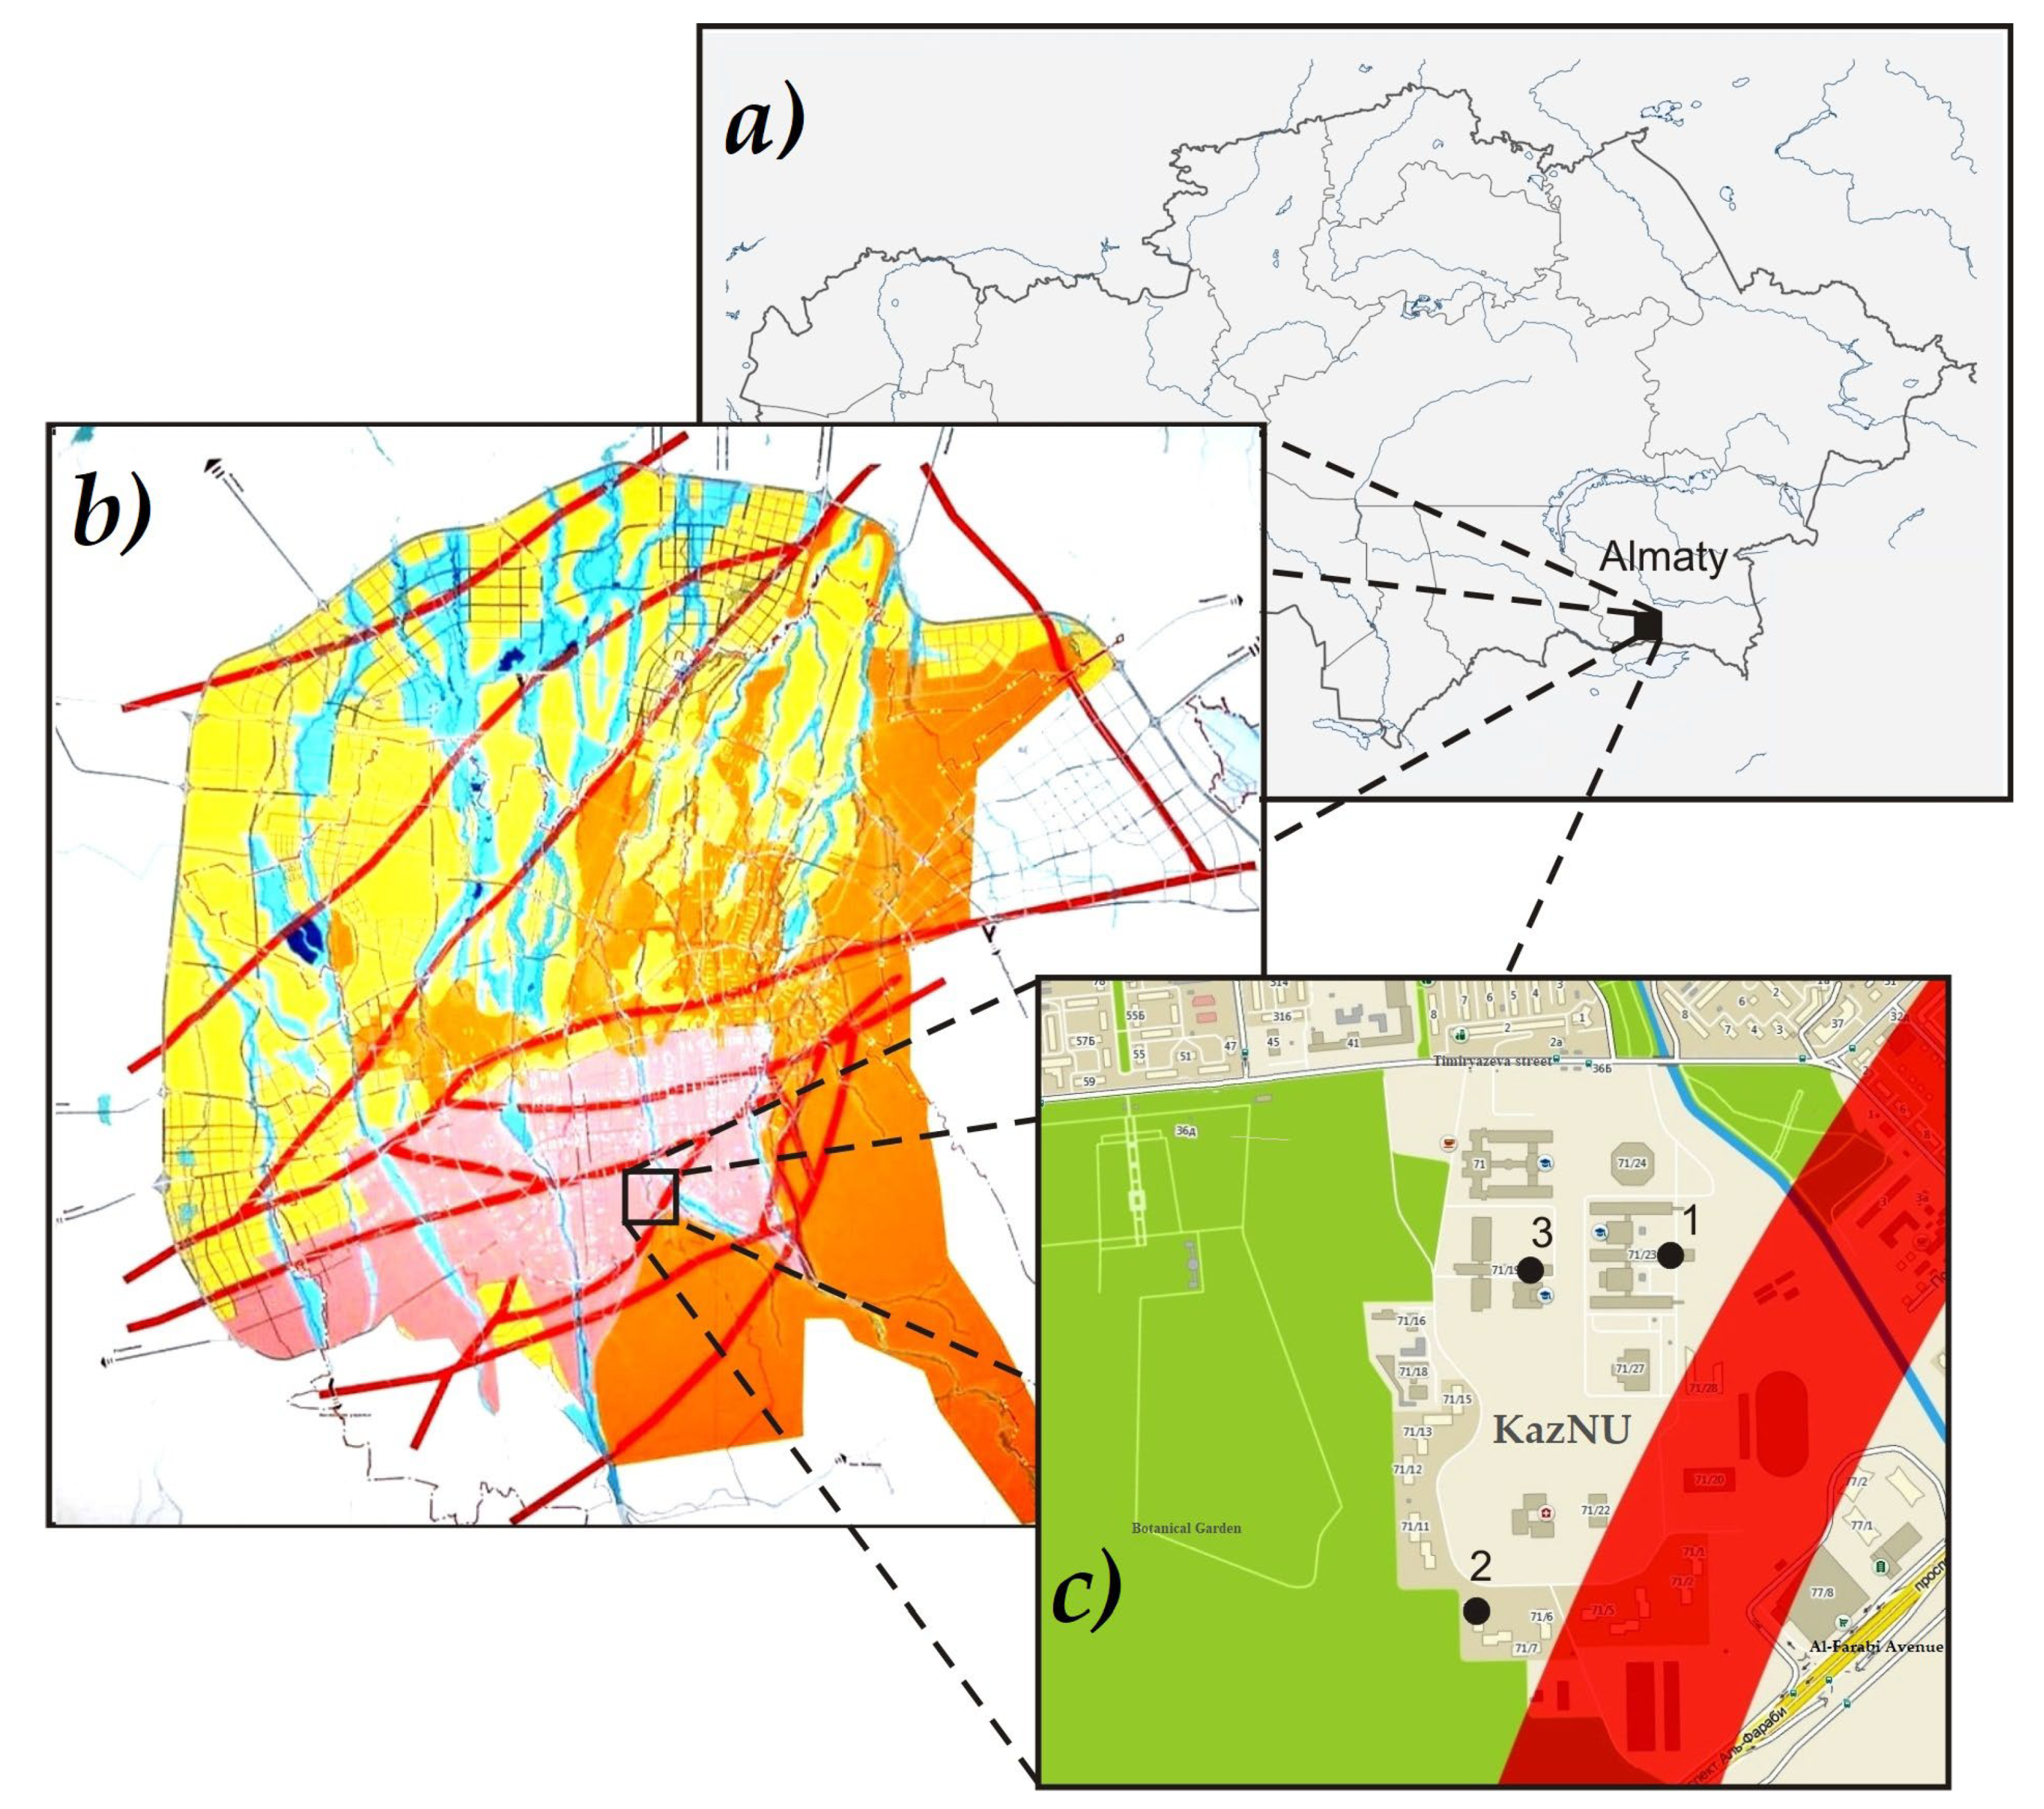
2.1. Location of the Study Area and Investigated Buildings

For this study, we selected buildings located in the city of Almaty in the southeastern part of the Republic of Kazakhstan in the foothill zone of the Zailiysky Alatau. The soil of this area contains granite rocks with a high content of natural radionuclides—K-40, U-238, and Th-232—and their decay products, including radium and radon [42,43]. In ref. [43], it was found that the lead content in the soil in the city of Almaty (46.5 mg/kg) was 1.45 times higher than the maximum permissible concentration (32.0 mg/kg [44]). The radiation background is, on average, 0.18 μSv/h [45], which exceeds the average value for the Republic (0.13 μSv/h). The region is characterized by a continental climate and the influence of mountain–valley circulation with an average temperature of 10 °C. It has about 2 million inhabitants [46]. The surface area of the city’s land starts declining from the south to the north, with the surface elevation varying between 1529 m and 650 m above sea level.
The city has many strike zones of tectonic faults with a width of 300 to 580 m, and they cross various significant streets such as Tole Bi, Karasai Batyra, Bukhar Zhyrau, the Eastern bypass, part of Ryskulov, and Al-Farabi. Twenty-seven tectonic faults pass through the city; more than (60%) in the mountains. During previous research work [47] on the profile sounding of the volumetric activity of soil radon in the territory of Almaty, the activity of seven significant faults was confirmed, the absence of action of two faults was established, and three new active fault zones were identified (Figure 1).
The most significant seismic hazard for the city is the Zailiysky Fault (red diagonal, Figure 1c), passing along Al-Farabi Street, through the antenna field, Republic Square, the intersection of Abay and Kunaev Streets, along Kazybek-Bi Street, through the Park of Culture to the east. The northwestern fault runs along the city’s western border through Kok-Kainar, Ozhet, and Karasu villages and further to the northeast. The active Chile-Kemin series of deep faults run parallel south of the Trans-Ili fault. According to global studies, the concentration of radon in the atmosphere of houses above such zones can reach high values [48,49].
The researched university is in the zone of the Zailiysky Fault (red diagonal, Figure 1c). The university campus is divided into two main areas: academic and student-residential areas. The first object of study (No. 1) was the building of the Faculty of Physics and Technology (43°13′25.8″ N 76°55′29″ E), located near the tectonic fault zone (Figure 1) at a distance of 235 m. The faculty was built in 2011 and consists of a five-story building with a basement with a natural supply of airflow and exhaust ventilation and periodic short-term window openings in warm weather. On the first and second floors, there are mainly laboratory rooms; on the third floor, there are management offices and classrooms, and on the fourth and fifth floors, there are lecture and auditorium rooms. The basement has a canteen, production facilities, heating distributors, and research laboratories. The second object (No. 2) was a five-story dormitory with a basement (43°13′06″ N 76°55′14″ E) built in 1982 at a distance of 274 m from the fault (Figure 1). The next object (No. 3) was the building of the Faculty of Biology (43°13′25″ N, 76°55′15″ E) with a basement built in 1972, located at a distance of 465 m from the fault.

2.2. Measurement of Indoor Radon

Radon monitoring measurements were taken from February 2021 to September 2022. The buildings were further stratified into floor levels (basement, third, and fifth) with equal sampling from each floor level.
The measurements of radon and its daughter decay products were carried out using a “RAMON-02” radiometer developed and manufactured in the Republic of Kazakhstan. With a stationary location in any room or a specially installed radioecological observation point, it is designed to monitor the content of the equivalent equilibrium volumetric activity of radon Rn-222 in the air of residential and industrial premises, as well as in the atmospheric air. Radon measurement involves sampling aerosols of daughter decay products onto aerosol filters with subsequent measurement of the activity of alpha emitters 218Po and 214Pb. Aerosol samples are taken using a filter belt with a pumping speed of 15 L/min. A semiconductor surface barrier detector is used to register alpha radiation. The operating temperature ranges from +1 °C to +40 °C. This device measures radon from 4 to 5 × 10⁵ Bq/m3. The device is calibrated against reference instruments in an accredited laboratory and certified by the National Center for Expertise and Certification.
The measurements were carried out indoors with closed windows to understand the highest potential exposure level since a room with an open window has a lower radon level, and a closed room demonstrates a higher concentration of radon [17]. This is because outdoor radon levels are typically low due to atmospheric dispersion and dilution. However, geology, building materials, ventilation rates, and meteorological parameters are the predominant factors influencing indoor radon levels [50,51,52]. All measurements were taken in the center of the room when the device was placed 1 m above the floor level in a place not affected by air currents or other types of interference. The measurement exposure was 120 s. At least three measurements were taken daily in each position. The data were collected and converted to daily geometric averages by floor and measured building.

2.3. Calculation of Committed Annual Effective Dose and Lifetime Cancer Risk

Based on the data, the expected effective doses from radon and its decay products received by students, teachers, and residents of the buildings under study were estimated. The dose was calculated using the following formula:
H L L R D = F × h L L R D × R D × I T ,
where H L L R D is the annual effective dose (mSv); F is the equilibrium coefficient between radon and its decay products (taken to be equal to 0.4) [53], h L L R D   is the dose conversion factor for radon decay products adopted by ICRP 9 × 10⁻⁶ mSv/h/Bq·m3 [54,55]—F·14.1 mSv/(MBq·h·m−3), RD is the average radon concentration (in Bq·m−3), and IT is the occupancy time (h y−1) in the premises.
The time spent inside buildings No. 1 and No. 3 was calculated considering the maximum volume of the weekly teaching load of students and teachers [56,57,58] and according to the calendar of holidays and weekends of the Republic of Kazakhstan for 2021 and 2022. It averaged 1702 h for students, and for teachers, it averaged 1974 h. For building No. 2, considering that a person stays indoors for more than 80% of the time [59], minus the time spent in building No. 1 (or No. 3), the time spent in the building averaged 5170 h per year.
To calculate the excess lifetime cancer risk, the following Equation was used [60,61]:
E L C R   =   A E D   ×   D L   ×   R F ,
where AED is the annual effective dose in mSv, DL = average lifespan (years) = 70.1 years [62], and RF is the fatal cancer risk per Sievert, risk factor (Sv−1) = 5.7 × 10⁻² Sv−1 [62].

3. Results and Discussion

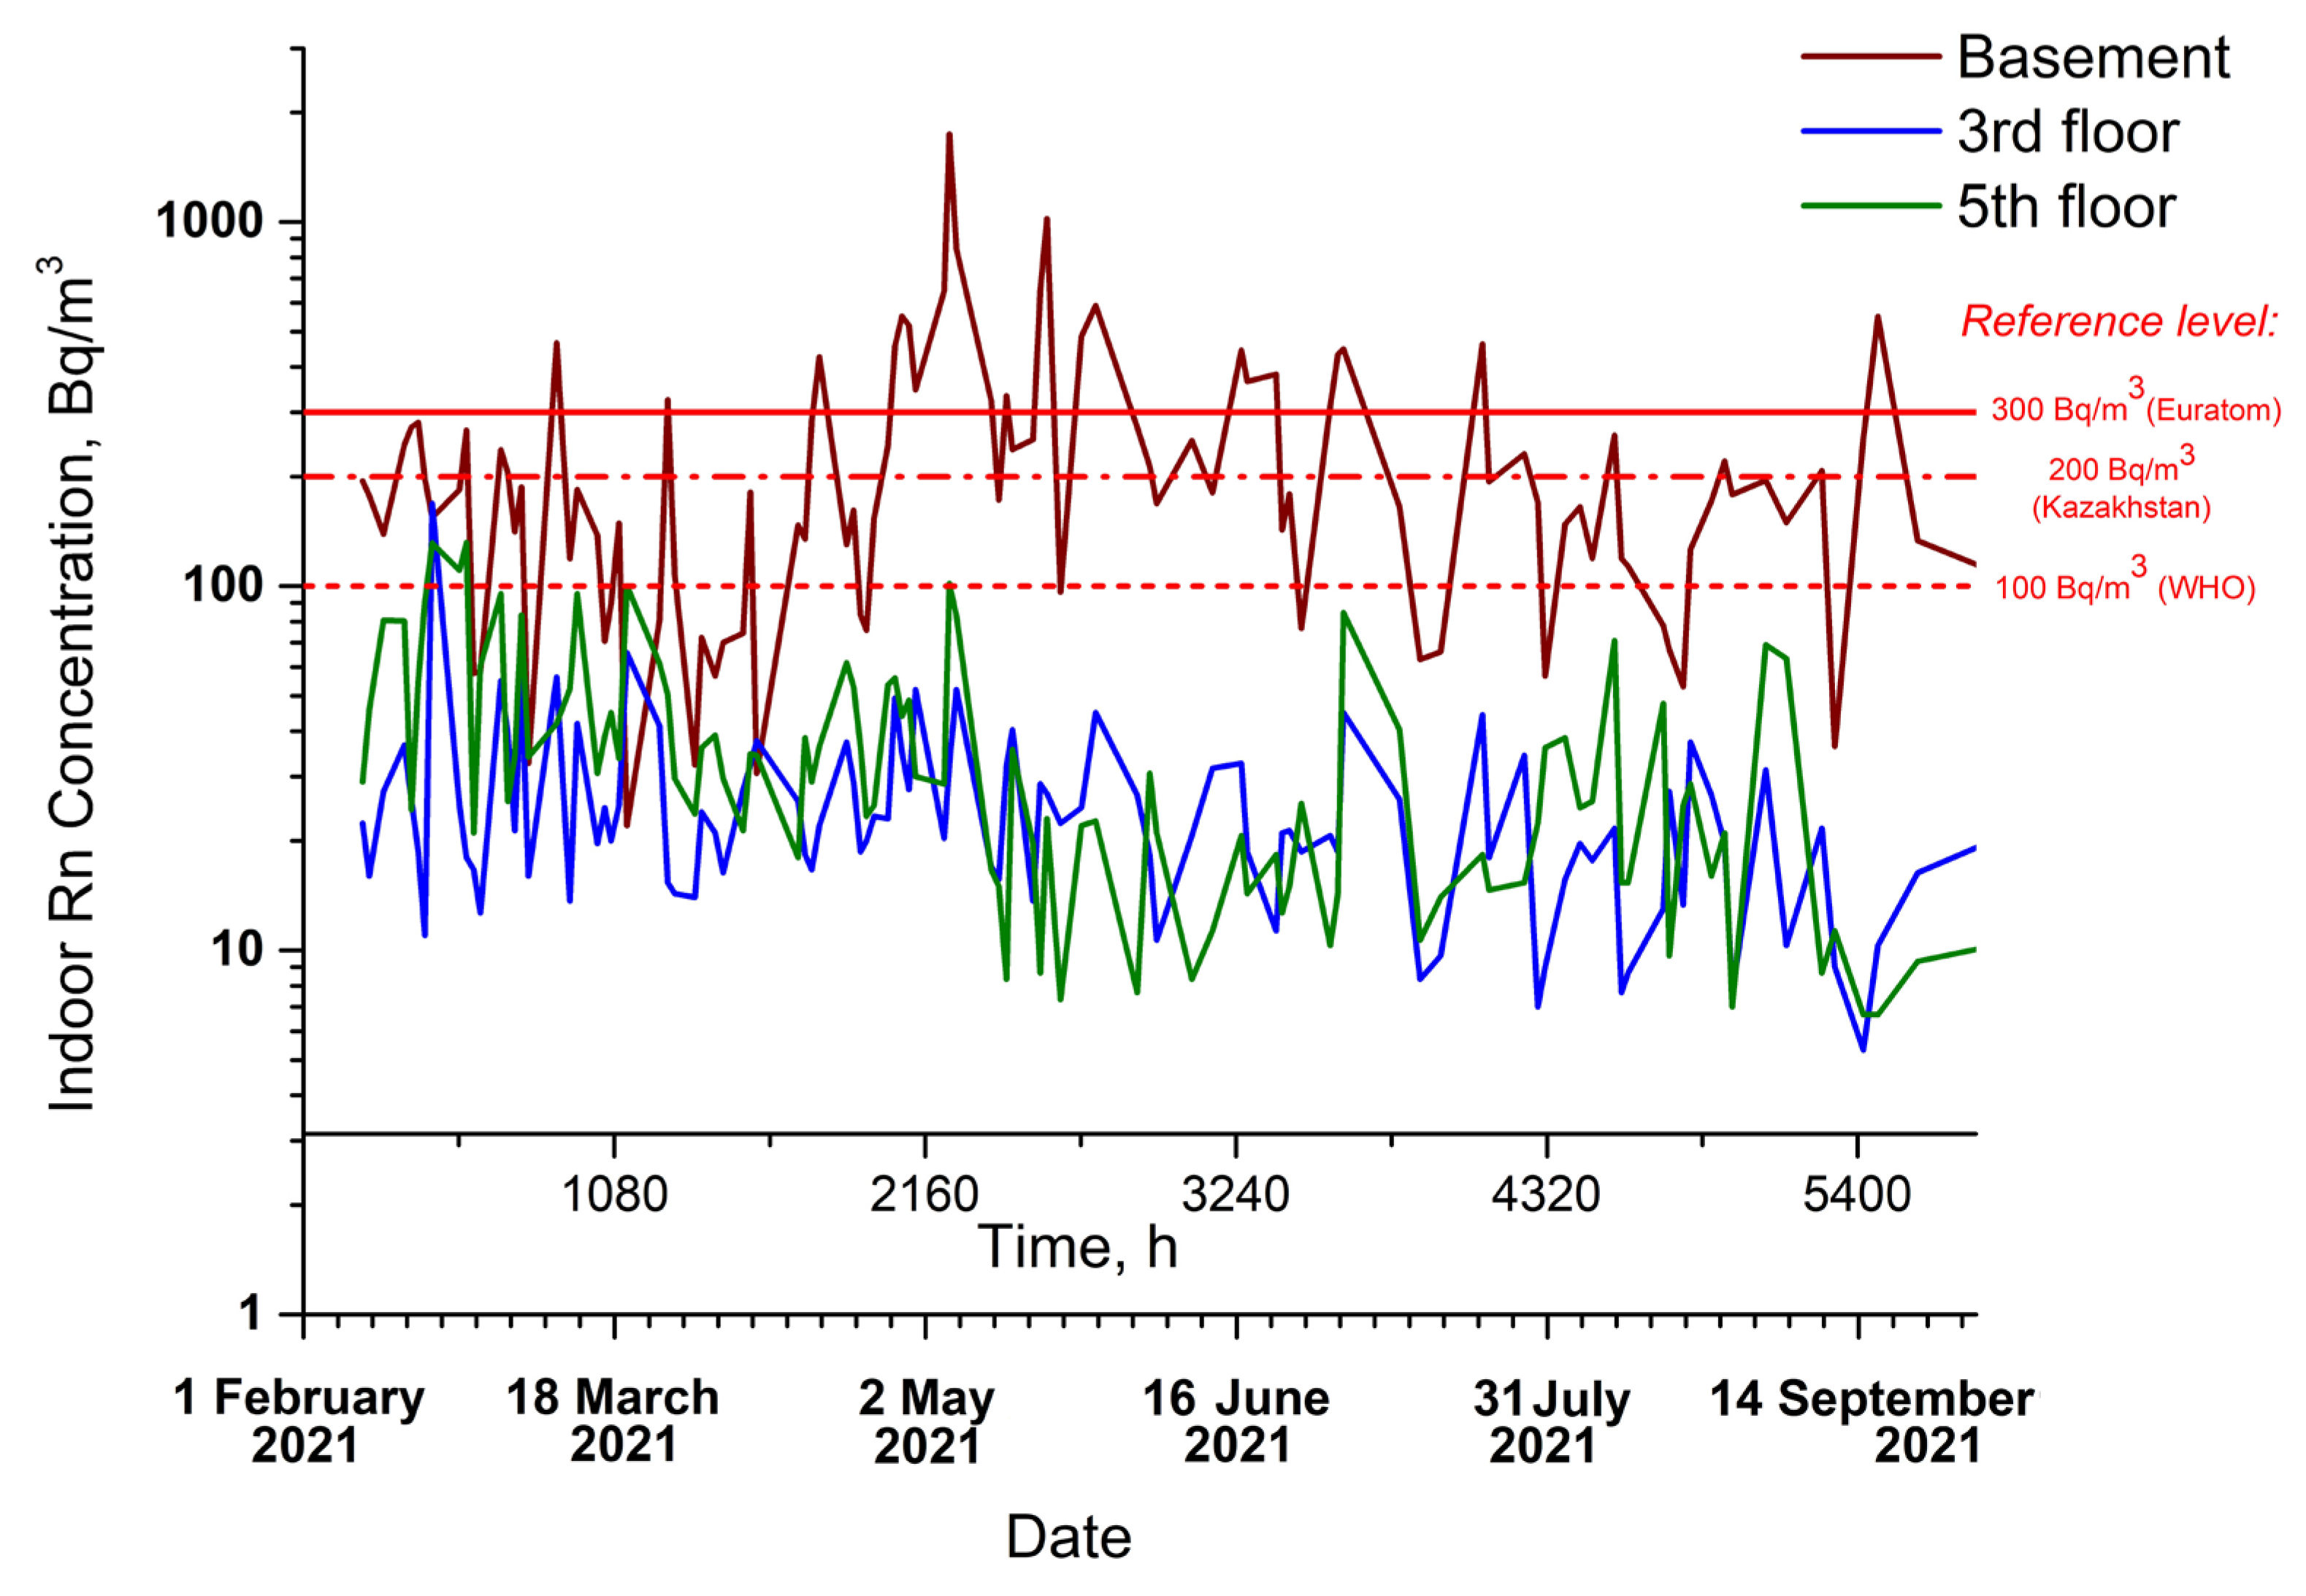
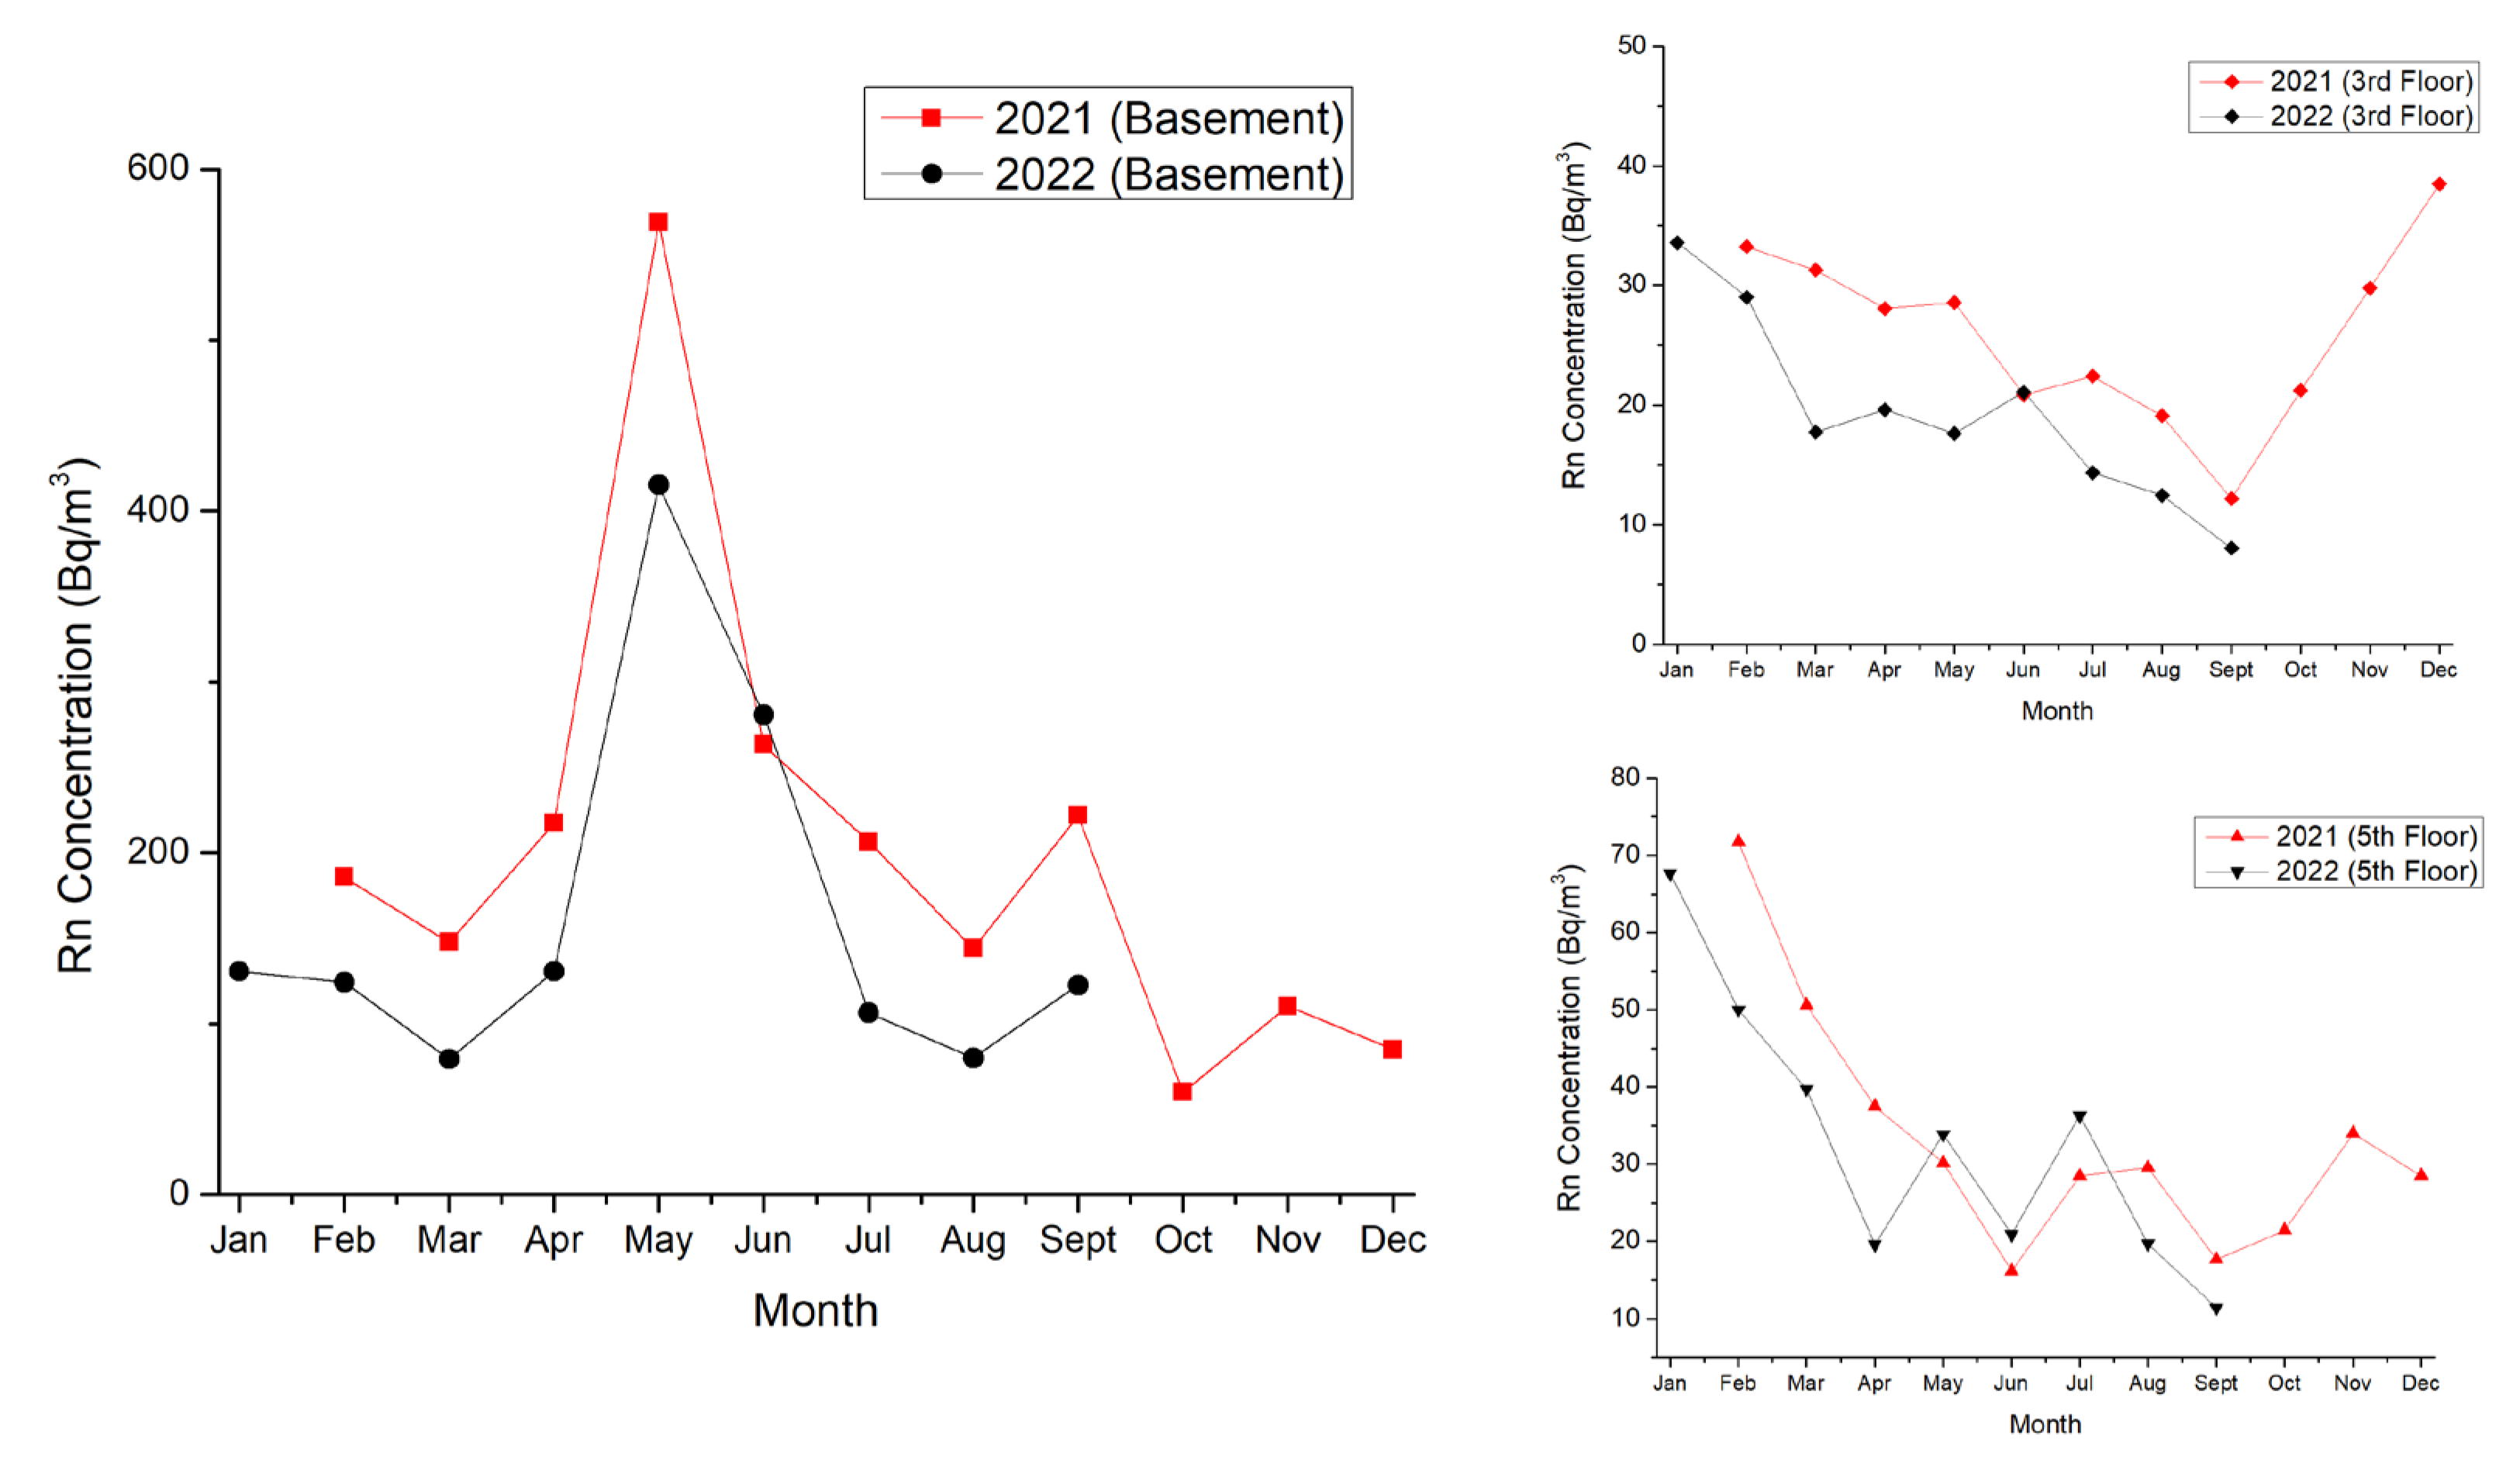
3.1. Average Radon Concentration

A few studies have been carried out on indoor radon concentrations in Almaty, Republic of Kazakhstan. Data on the concentration of radon in the territory of the university are not available, which prompted a pilot study in three different buildings of the institution (two academic buildings and a dormitory). The geometric mean value of radon concentration for the entire measurement period was 183.96 ± 55.19 Bq/m3 for the basement of the building located at a distance of 235 m from the tectonic fault; 111.69 ± 33.51 Bq/m3 at a distance of 274 m from the tectonic fault; and 28.68 ± 8.60 Bq/m3—465 m.
In the Faculty of Physics and Technology (building No. 1 in picture 1), measurements were carried out in the basement and on the third and fifth floors. Figure 2 shows the results obtained for the indoor Rn concentrations (the radon value is averaged per day) between 9 February 2021 and 1 October 2021.
There were fluctuations in the radon concentrations inside the basements, ranging from 57.7 to 282.0 Bq/m3 in winter, from 22.0 to 1742.0 Bq/m3 in spring, from 17.0 to 547.7 Bq/m3 in summer, and from 36.3 to 550.7 Bq/m3 in autumn. It was found that the maximum radon value for the third and fifth floors was reached in the winter season, while in the basement, it was in the spring. There were fluctuations in the average value of radon concentrations by month, ranging from 59.9 to 568.9 Bq/m3 for the basement, from 8.0 to 33.3 Bq/m3 for the third floor, and from 11.4 to 71. 8 Bq/m3 for the fifth floor. At the same time, at least five rooms were measured on each floor with the doors and windows closed. The average values of the radon concentrations by month and floor in building No. 1 are given in Table 1. From the results obtained, it can be seen that the average concentrations of radon in the basement were 8.8 and 5.8 times higher than those on the third and fifth floors, respectively.
The coefficient of monthly correlation with previous annual measurements was “0.94” for basements, “0.80” for the third floor, and “0.81” for the fifth floor, which also showed stable variations in radon concentration (Figure 3).
The radon concentrations in the dormitory (building No. 2) averaged 111.69 Bq/m3 for the basement, 11.94 Bq/m3 for the third floor, and 36.19 Bq/m3 for the fifth floor; for building No. 3, the average radon concentration was 28.68 Bq/m3 for the basement, 11.33 Bq/m3 for the third floor, and 9.00 Bq/m3 for the fifth floor. Figure 4 shows the average radon concentrations for the three buildings based on the distance to the tectonic fault. From the results obtained, it is seen that the radon concentration decreases with increasing distance from the fault.
The average accumulated radon concentrations in the studied premises were in the range of 16.34 to 78.33 Bq/m3, which is below the maximum level established by the WHO (100 Bq/m3) and the legislation of the Republic of Kazakhstan (100 Bq/m3 for new buildings and 200 Bq/m3 for existing buildings [63]). The highest indoor radon values were observed in rooms on the lower floors (No. 1—1742 Bq/m3, obtained on 5 May 2021; No. 2—427 Bq/m3, obtained on 16 April 2021; and No.3—73 Bq/m3, obtained on 25 September 2021), regardless of the distance to the fault, with a decreasing trend in radon concentration with height, probably due to increased airflow and ventilation. This is consistent with the literature, which shows that the higher the building height, the lower the radon level [64], and higher radon concentrations are in the basement and first floors of buildings. This is due to the mechanisms of radon entry into buildings: firstly, for the first floor, the main contribution is from the soil of the Earth’s surface, as UNSCEAR concluded [65]. All of the buildings studied were built directly on concrete-covered soil, which allows more radon to penetrate indoors due to the higher porosity of the materials used. Secondly, the ventilation of the upper floors is better than the basements and first floors. However, in the studied building No. 1 on the fifth floor, the radon concentration exceeded the average value on the third floor by 1.5 times (Figure 3). This observation may have several explanations: (1) soil is no longer the only major source of indoor radon concentrations, and, therefore, radon can be introduced indoors by the building materials [66]; (2) the effects of the chimney, as well as poor air exchange on this floor [67]; and (3) good sealing of windows, which, according to the study by Jiranek and Kaczmarikova [68], can lead to an increase in radon concentration by 3.4 times, while Yang et al. [69] reported a 4–8-fold increase.
The highest radon concentrations were found in building No. 1 (Figure 1), located closest to a large tectonic fault. This is consistent with the conclusions from [70] about the influence of the distance to the fault on the radon level. The maximum concentration recorded in the measurement interval was 1742 Bq/m3, obtained on 5 May 2021 at 10:55 in the basement of building No. 1 (Figure 2). The lowest concentration value was 5.33 Bq/m3, obtained on 14 September 2021 at 16:44 (Figure 2).

3.2. Annual Effective Dose and Excess Lifetime Cancer Risk

The data for each building in different seasons were used to calculate the dose load per person. The potential influencing factors not considered in this pilot study include atmospheric conditions that can affect radon release from the ground, which is a significant source of radon for basements.
In ref. [71], a more than two-fold increase in the risk of developing lung cancer was found at levels of radon exposure above 37 Bq/m3. The International Commission on Radiological Protection and the UN Scientific Committee on the Effects of Atomic Radiation described an increase in excess relative risk of 0.16 per 100 Bq/m3 [72]. The WHO identified levels above 100 Bq/m3 [17] as requiring action.
According to the sanitary rules “Sanitary and epidemiological requirements for ensuring radiation safety” [73], the relative degree of radiation safety of the population is characterized by the following values of effective doses from natural sources of radiation: less than 2 mSv/year—exposure does not exceed the average values of doses for the population; from 2 to 5 mSv/year—increased exposure; and more than 5 mSv/year—high exposure. Kazakhstan’s average natural background radiation is 3.1 mSv/year [74]. In this study, using Equations (1) and (2), the average annual effective dose from radon and its decay products received by university students and staff (taking into account the maximum volume of the weekly study load, provided that they live in building No. 2 and stay in indoors 80% of the time) varied: it was from 2.7 mSv/year to 3.8 mSv/year when they were on the lower floors, and 0.7 mSv/year to 0.9 mSv/year if they were located on the upper floors. Moreover, the average value for the specified period, considering the uniform distribution of residence time on all floors, ranged from 1.09 mSv/year to 1.53 mSv/year. This exceeds the average value for the Republic by almost two-fold (assuming that radon contributes to 50–55% of the annual radiation dose). The ELCR calculation, according to Equation (2), ranged from 0.44% to 0.61%, assuming that the average life expectancy is estimated to be 70.1 years and the fatal risk of cancer is 5.7 × 10⁻² Sv−1. However, it must be noted that for lower floors, the ELCR ranged from 1.08% to 1.52%, and for upper floors it ranged from 0.28% to 0.36%. In this study, the annual effective dose due to radon exposure was higher than the annual effective dose limit of 1 mSv/year for the public recommended by ICRP 2010 [75]. If we compare the obtained data with the results of studies [76,77,78], the annual effective dose in the academic building (No. 1) and dormitory (No. 2) exceeds the values obtained at an Iranian university by more than two times and in a Turkish university by more than four times. At the same time, the annual effective dose received in academic building No. 3 (located farthest from the fault) is within the same levels as those measured at other universities.

4. Conclusions

A WHO survey in 36 countries found that almost all countries set reference levels for acceptable radon concentrations for existing housing between 200 Bq/m3 and 400 Bq/m3. Some countries have developed different reference levels for new and existing buildings, with lower values set for new homes [13]. A national reference level of 100 Bq/m3 is recommended to limit the individual risk. Where this is impossible, the selected level should be 300 Bq/m3 at most. In the Republic of Kazakhstan, it is essential to develop a National Radon Plan, and it is necessary to inform the population about the health risks associated with exposure to radon and its possible accumulation on the premises, with a description of the factors affecting its concentration. In the present study, the proximity of a tectonic fault is an essential factor. Based on the results of this study, the average concentration of radon in a building decreases with increasing distance from the tectonic fault. However, to answer the question of how far this pattern extends and what type of relationship it has, it is recommended to conduct additional research to understand how widespread the risk of radon is in Almaty. The lack of such studies threatens to underestimate radon exposure, which may remain an undiscovered health hazard for a long time. It has been established that the values of annual effective doses during inhalation of radon by students and teachers ranged from 1.09 mSv/year to 1.53 mSv/year. These results are higher than the 1 mSv/year recommended by the ICRP (1990). The average concentrations for the studied buildings were 28.68 to 183.96 Bq/m3 in the basement, from 11.33 to 21.00 Bq/m3 on the third floor, and from 9.00 to 36.19 Bq/m3 on the fifth floor. The average accumulated radon concentrations in the studied buildings found during this study were 78.33 Bq/m3 (No. 1), 53.27 Bq/m3 (No. 2), and 16.34 Bq/m3 (No. 3). These results clearly show the influence of the distance to the fault on the average values of radon concentration in buildings.
In the context of our study, the average radon concentration values in the studied premises are below the limit of 300 Bq/m3. However, 17.9% of the concentration values obtained in the basement of building No. 1 were well above the 300 Bq/m3 limit. Since they average twice the maximum concentration recommended by the Euratom Directive 2013, they should be considered harmful to the health of the occupants in the buildings under study.

Author Contributions

Conceptualization, Y.Z. and V.D.; methodology, T.G. and A.Y.; software, M.B. and V.D.; formal analysis, Y.Z. and A.Y.; investigation, Y.Z. and T.G.; resources, V.D. and M.B.; data curation, Y.Z.; writing—original draft preparation, review and editing, Y.Z., A.Y. and V.D.; visualization, M.B.; supervision, Y.Z.; funding acquisition, Y.Z. All authors have read and agreed to the published version of the manuscript.

Funding

This research was funded by the Science Committee of the Ministry of Education and Science of the Republic of Kazakhstan (Grant No. AP09058404).

Institutional Review Board Statement

Not applicable.

Informed Consent Statement

Not applicable.

Data Availability Statement

Data associated with this research are available and can be obtained by contacting the corresponding author upon reasonable request. The data are not publicly available due to restriction.

Conflicts of Interest

The authors declare no conflict of interest.

References

  1. Sustainable Development Goals (SDGs). Available online: https://www.undp.org/sustainable-development-goals?gclid=EAIaIQobChMIvZCkqIq7gAMVD4RoCR1EBQXjEAAYASAAEgKy6fD_BwE (accessed on 25 August 2023).
  2. Etiope, G.; Martinelli, G. Migration of carrier and trace gases in the geosphere: An overview. Phys. Earth Planet Inter. 2002, 129, 185–204. [Google Scholar] [CrossRef]
  3. Kurnaz, A.; Küçükömeroğlu, B.; Çevik, U.; Çelebi, N. Radon level and indoor gamma doses in dwellings of Trabzon, Turkey. Appl. Radiat. Isot. 2011, 69, 1554–1559. [Google Scholar] [CrossRef]
  4. Lee, C.M.; Kwon, M.H.; Kang, D.R.; Park, T.H.; Park, S.H.; Kwak, J.E. Distribution of radon concentrations in child-care facilities in South Korea. J. Environ. Radioact. 2017, 167, 80–85. [Google Scholar] [CrossRef] [PubMed]
  5. Darby, S.; Hill, D.; Doll, R. Radon: A likely carcinogen at all exposures. Ann. Oncol. 2001, 12, 1341–1351. [Google Scholar] [CrossRef] [PubMed]
  6. Mc Laughlin, J. An historical overview of radon and its progeny: Applications and health effects. Radiat. Prot. Dosim. 2012, 152, 2–8. [Google Scholar] [CrossRef] [PubMed]
  7. ICRP Publication 50. Lung Cancer Risk from Exposures to Radon Daughters; Pergamon Press: Oxford, UK, 1987; 60p. [Google Scholar]
  8. ICRP Publication 65. Protection Against Radon-222 at Home and at Work; Pergamon Press: Oxford, UK, 1993; 45p. [Google Scholar]
  9. Medici, F.; Rybach, L. Measurements of indoor radon concentrations and assessment of radiation exposure. J. Appl. Geophys. 1994, 31, 153–163. [Google Scholar] [CrossRef]
  10. Shakir Khan, M.; Zubair, M.; Verma, D.; Naqvi, A.; Azam, A.; Bhardwaj, M. The study of indoor radon in the urban dwellings using plastic track detectors. Environ. Earth Sci. 2011, 63, 279–282. [Google Scholar] [CrossRef]
  11. Espinosa, G.; Golzarri, J.; Chavarria, A.; Castaño, V. Indoor radon measurement via Nuclear Track Methodology: A comparative study. Radiat. Meas. 2013, 50, 127–129. [Google Scholar] [CrossRef]
  12. Tollefsen, T.; Cinelli, G.; Bossew, P.; Gruber, V.; De Cort, M. From the European indoor radon map towards an atlas of natural radiation. Radiat. Prot. Dosim. 2014, 162, 129–134. [Google Scholar] [CrossRef]
  13. Mbembe, B.A.; Manga, A.; Mbembe, S.M.; Abiama, P.E.; Saidou; Meye, P. O.; Kofane, T.C.; Ben-Bolie, G.H. Indoor Radon (222Rn) measurements and estimation of annual effective dose in Mvangan localoty, South Cameroon. Radiat. Prot. Dosim. 2022, 198, 1565–1574. [Google Scholar] [CrossRef]
  14. Chen, J.; Moir, D.; Whyte, J. Canadian population risk of radon induced lung cancer: Are-assessment based on the recent cross-Canada radon survey. Radiat. Prot. Dosim. 2012, 152, 9–13. [Google Scholar] [CrossRef]
  15. Liu, X.; Fan, Y.; Jiang, Y.; Xiang, J.; Wang, J.; Sun, Z.; Ren, G.; Yao, S.; Chang, R.; Zhao, Y.; et al. A cohort study on risk factors of lung cancer in Yunnan tin miners. Zhongguo Fei Ai Za Zhi. 2013, 16, 184–190. [Google Scholar]
  16. World Health Organization. IARC Monographs on the Evaluation of Carcinogenic Risks to Humans; International Agency for Research on Cancer: Lyon, France, 2012; 341p. [Google Scholar]
  17. World Health Organization. WHO Handbook on Indoor Radon: A Public Health Perspective; World Health Organization: Geneva, Switzerland, 2009; Available online: https://apps.who.int/iris/bitstream/handle/10665/44149/9789241547673_eng.pdf (accessed on 25 August 2023).
  18. Lorenzo-González, M.; Torres-Durán, M.; Barbosa-Lorenzo, R.; Provencio-Pulla, M.; Barros-Dios, J.M.; Ruano-Ravina, A. Radon exposure: A major cause of lung cancer. Expert Rev. Respir. Med. 2019, 13, 839–850. [Google Scholar] [CrossRef] [PubMed]
  19. ATSDR. Toxicological Profile for Radon: Agency for Toxic Substances and Disease Registry (ATSDR); ATSDR: Atlanta, GA, USA, 2012. Available online: https://www.atsdr.cdc.gov/toxprofiles/tp145.pdf (accessed on 25 August 2023).
  20. Gaskin, J.; Coyle, D.; Whyte, J.; Krewksi, D. Global Estimate of Lung Cancer Mortality Attributable to Residential Radon. Environ. Health Perspect. 2018, 126, 057009. [Google Scholar] [CrossRef] [PubMed]
  21. Global Cancer Observatory. Available online: https://gco.iarc.fr/ (accessed on 25 August 2023).
  22. Kaidarova, D.R.; Shatkovskaya, O.V.; Zholdybay, Z.Z.; Zhylkaidarova, A.Z.; Panina, A.S. Lung cancer in Kazakhstan: Age-gender features. Oncol. Radiol. Kazakhstan 2020, 55, 3–8. [Google Scholar] [CrossRef]
  23. Schoenberg, J.B.; Klotz, J.B.; Wilcox, H.B.; Nicholls, G.P.; Gil-del-Real, M.T.; Stemhagen, A. Case–control study of residential radon and lung cancer among New Jersey women. Cancer Res. 1990, 50, 6520–6524. [Google Scholar] [PubMed]
  24. Darby, S.; Hill, D.; Auvinen, A.; Barros-Dios, J.M.; Baysson, H.; Bochicchio, F.; Deo, H.; Falk, R.; Forastiere, F.; Hakama, M.; et al. Radon in homes and risk of lung cancer: Collaborative analysis of individual data from 13 European case-control studies. BMJ 2004, 330, 223–226. [Google Scholar] [CrossRef] [PubMed]
  25. Coretchi, L.; Ene, A.; Ababii, A. Control of the Health Risk of Radon Exposure in the Republic of Moldova. Atmosphere 2021, 12, 1302. [Google Scholar] [CrossRef]
  26. Wichmann, H.E.; Rosario, A.S.; Heid, I.M.; Kreuzer, M.; Heinrich, J.; Kreienbrock, L. Increased lung cancer risk due to residential radon in a pooled and extended analysis of studies in Germany. Health Phys. 2005, 88, 71–79. [Google Scholar] [CrossRef] [PubMed]
  27. ICRP Publication 126. Radiological Protection against Radon Exposure. Ann. ICRP 2014, 43, 5–73. [Google Scholar] [CrossRef] [PubMed]
  28. World Health Organization. World Health Statistics 2012; World Health Organization: Geneva, Switzerland, 2012; Available online: https://apps.who.int/iris/bitstream/handle/10665/44844/9789241564441_eng.pdf?sequence=1&isAllowed=y (accessed on 25 August 2023).
  29. Orlando, P.; Trenta, R.; Bruno, M.; Orlando, C.; Ratti, A.; Ferrari, S. A Study about remedial measures to reduce 222 Rn Concentration in an experimental building. J. Environ. Radioact. 2004, 73, 257–266. [Google Scholar] [CrossRef] [PubMed]
  30. Watson, R.J.; Smethurst, M.A.; Ganerod, G.V.; Finne, I.; Rudjord, A.L. The use of mapped geology as a predictor of radon potential in Norway. J. Environ. Radioact. 2017, 166, 341–354. [Google Scholar] [CrossRef] [PubMed]
  31. Lubin, J.H.; Wang, Z.Y.; Boice, J.D.; Xu, Z.Y.; Blot, W.J.; De Wang, L.; Kleinerman, R.A. Risk of lung cancer and residential radon in China: Pooled results of two studies. Int. J. Canc. 2004, 109, 132–137. [Google Scholar] [CrossRef]
  32. Brauner, E.V.; Rasmussen, T.V.; Gunnarsen, L. Variation in residential radon levels in new Danish homes. Indoor Air 2013, 23, 311–317. [Google Scholar] [CrossRef] [PubMed]
  33. Fojtikova, I.; Rovenska, K.N. Influence of energy-saving measures on the radon concentration in some kindergartens in the Czech Republic. Radiat. Protect. Dosim. 2014, 160, 149–153. [Google Scholar] [CrossRef]
  34. Meyer, W. Impact of constructional energy-saving measures on radon levels indoors. Indoor Air 2019, 29, 680–685. [Google Scholar] [CrossRef]
  35. Broderick, A.; Byrne, M.; Armstrong, S.; Sheahan, J.; Coggins, A.M. A pre and post evaluation of indoor air quality, ventilation, and thermal comfort in retrofitted co-operative social housing. Build. Environ. 2017, 122, 126–133. [Google Scholar] [CrossRef]
  36. Milner, J.; Shrubsole, C.; Das, P.; Jones, B.; Ridley, I.; Chalabi, Z.; Hamilton, I.; Armstrong, B.; Davies, M.; Wilkinson, P. Home energy efficiency and radon related risk of lung cancer: Modelling study. BMJ 2014, 348, f7493. [Google Scholar] [CrossRef]
  37. Norwegian Radiation Protection Authority. Measurement Protocol for Radon in Dwellings; NRPA: Oslo, Norway, 2013; 17p. [Google Scholar]
  38. Kobal, I.; Vaupotič, J.; Gregorič, A.; Uralbekov, B. Comparison of Approaches in Slovenia and Kazakhstan in Managing Exposure to Radon; Springer International Publishing: Cham, Switzerland, 2015; pp. 689–698. [Google Scholar]
  39. Fedorov, G.V. Study of Radon Hazard in the Territory of the Republic of Kazakhstan; ECOSERVICE-C: Almaty, Kazahstan, 2007. [Google Scholar]
  40. Fedorov, G.V.; Kayukov, P.G.; Bensman, V.A. Actual issues of studying the radon hazard of the territory of the Republic of Kazakhstan. J. Ecol. Dev. Soc. 2012, 2, 73–79. [Google Scholar]
  41. Sevostyanov, V.N. Radon Problem in Kazakhstan; Kazgosinti: Almaty, Kazahstan, 2004; 212p. [Google Scholar]
  42. Sokolov, S.I.; Assing, I.A.; Kurmangaliev, A.B.; Serpikov, S.K. Soils of Kazazh SSR. Issue 4, Alma-Ata Region; Academy of Sciences of the KazSSR: Almaty, Kazahstan, 1962; 422p. [Google Scholar]
  43. Matveyeva, I.V.; Ponomarenko, O.I.; Soltangaziyev, N.B.; Nursapina, N.A.; Nazarkulova, S.N.; Gurin, A.N. Heavy metals in soils of Almaty region (Kazakhstan). Chem. J. Kazakhstan 2019, 2, 62–68. [Google Scholar]
  44. On Approval of Hygienic Standards for the Safety of the Living Environment. Order of the Minister of Health of the Republic of Kazakhstan Dated 21 April 2021 No. KR DSM -32. Available online: https://adilet.zan.kz/rus/docs/V2100022595#z6 (accessed on 1 August 2023).
  45. National Hydrometeorological Service of Kazakhstan. Available online: https://kazhydromet.kz/ru (accessed on 21 July 2023).
  46. Bureau of National Statistics. Agency for Strategic Planning and Reforms of the Republic of Kazakhstan. Available online: https://stat.gov.kz/en/ (accessed on 1 August 2023).
  47. Abdullaev, A.; Lagutin, E.; Tukeshova, G.; Zhunisbekov, T.; Veselkina, I.; Suslova, T.; Mukhamadiev, A.; Menbayev, S.; Koblanov, Z. The first results of the geochemical sensing tectonic faults on the basis of profile measurements of soil radon volume activity in the territory of Almaty metropolis. News Natl. Acad. Sci. RK. Ser. Geol. Tech. Sci. 2016, 5, 79–91. [Google Scholar]
  48. Miklyaev, P.S.; Petrova, T.B.; Shchitov, D.V.; Sidyakin, P.A.; Murzabekov, M.A.; Marennyy, A.M.; Nefedov, N.A.; Sapozhnikov, Y.A. The results of long-term simultaneous measurements of radon exhalation rate, radon concentrations in soil gas and groundwater in the fault zone. Appl. Radiat. Isot. 2021, 167, 109460. [Google Scholar] [CrossRef]
  49. Drolet, J.P.; Martel, R. Distance to faults as a proxy for radon gas concentration in dwellings. J. Environ. Radioact. 2016, 152, 8–15. [Google Scholar] [CrossRef] [PubMed]
  50. Borgoni, R.; De Francesco, D.; De Bartolo, D.; Tzavidis, N. Hierarchical modeling of indoor radon concentration: How much do geology and building factors matter? J. Environ. Radioact. 2014, 138, 227–237. [Google Scholar] [CrossRef] [PubMed]
  51. Chao, C.; Tung, T.; Burnett, J. Influence of Ventilation on Indoor Radon Level. Build. Environ. 1997, 32, 527–534. [Google Scholar] [CrossRef]
  52. Miles, J.C.H.; Howarth, C.B.; Hunter, N. Seasonal variation of radon concentrations in UK homes. J. Radiol. Prot. 2012, 32, 275–287. [Google Scholar] [CrossRef] [PubMed]
  53. UNSCEAR 2006. Report Volume II: Sources-to-Effects Assessment for Radon in Homes and Workplaces; UNSCEAR, United Nations: New York, NY, USA, 2006; pp. 201–313. [Google Scholar]
  54. UNSCEAR 2019. Report Sources, Effects and Risks of Ionizing Radiation; UNSCEAR, United Nations: New York, NY, USA, 2020; 291p. [Google Scholar]
  55. German Commission on Radiological Protection. Radon Dose Coefficients. In Proceedings of the 290th Meeting of the German Commission on Radiological Protection, Bonn, Germany, 5–6 December 2017. [Google Scholar]
  56. On the Approval of State Compulsory Educational Standards for Higher and Postgraduate Education. Order of the Minister of Science and Higher Education of the Republic of Kazakhstan dated 20 July 2022 No. 2. Registered with the Ministry of Justice of the Republic of Kazakhstan on 27 July 2022 No. 28916. Available online: https://adilet.zan.kz/rus/docs/V2200028916 (accessed on 21 August 2023).
  57. Labor Code of the Republic of Kazakhstan. Code of the Republic of Kazakhstan dated 23 November 2015 no. 414-V. Available online: https://adilet.zan.kz/rus/docs/K1500000414 (accessed on 21 August 2023).
  58. On the Approval of the Rules for Determining the Features of the Regime of Working Time and Rest Time of a Teacher. Order of the Minister of Education and Science of the Republic of Kazakhstan dated 21 April 2020 No. 153. Registered with the Ministry of Justice of the Republic of Kazakhstan on 22 April 2020 No. 20449. Available online: https://adilet.zan.kz/rus/docs/V2000020449 (accessed on 21 August 2023).
  59. ASHRAE 2010. Guideline 10P, Interactions Affecting the Achievement of Acceptable Indoor Environments, Second Public Review; ASHRAE: Atlanta, GA, USA, 2010. [Google Scholar]
  60. Mirdoraghi, M.; Masoumi, S.; Einor, D. Data on assessment excess lifetime cancer risk and risk of lung cancer from inhalation of Radon 222 in radiotherapy centers in Tehran, Iran-6. Data Brief 2018, 20, 1367–1370. [Google Scholar] [CrossRef] [PubMed]
  61. Loan, T.T.H.; Ba, V.N.; Bang, N.V.T.; Thy, T.H.N.; Hong, H.T.Y.; Huy, N.Q. Natural radioactivity and radiological health hazard assessment of chemical fertilizers in Viet Nam. J. Radioanal. Nucl. Chem. 2018, 316, 111–117. [Google Scholar] [CrossRef]
  62. International Commission on Radiological Protection. ICRP Publication 103: The 2007 Recommendations of the International Commission on Radiological Protection. Ann. ICRP 2007, 37, 1–332. [Google Scholar]
  63. On Approval of Hygienic Standards to Ensure Radiation Safety. Order of the Minister of Health of the Republic of Kazakhstan Dated 2 August 2022 No. KR DSM-71. Available online: https://adilet.zan.kz/rus/docs/V2200029012 (accessed on 25 August 2023).
  64. Shirav, M.; Vulkan, V. Mapping radon-prone areas: A geophysical approach. Environ. Geol. 1997, 31, 167–173. [Google Scholar]
  65. UNSCEAR 2000. Sources and Effects of Ionizing Radiation; UNSCEAR, United Nations: New York, NY, USA, 2000; 657p. [Google Scholar]
  66. Amin, R.M. A study of radon emitted from building materials using solid state nuclear track detectors. J. Radiat. Res. Appl. Sci. 2015, 8, 516–522. [Google Scholar] [CrossRef]
  67. Juhasova-Senitkova, I.; Kraus, M. Seasonal and Floor Variations of Indoor Radon Concentration. IOP Conf. Ser. Earth Environ. Sci. 2019, 221, 012127. [Google Scholar] [CrossRef]
  68. Jiránek, M.; Kačmaříková, V. Dealing with the increased radon concentration in thermally retrofitted buildings. Radiat. Prot. Dosim. 2014, 160, 43–47. [Google Scholar] [CrossRef] [PubMed]
  69. Yang, S.; Goyette Pernot, J.; Hager Jörin, C.; Niculita-Hirzel, H.; Perret, V.; Licina, D. Radon investigation in 650 energy efficient dwellings in Western Switzerland: Impact of energy renovation and building characteristics. Atmosphere 2019, 10, 777. [Google Scholar] [CrossRef]
  70. Font, L.; Baixeras, C.; Moreno, V.; Bach, J. Soil radon levels across the Amer fault. Radiat. Meas. 2008, 43, S319–S323. [Google Scholar] [CrossRef]
  71. Barros-Dios, J.M.; Ruano-Raviña, A.; Gastelu-Iturri, J.; Figueiras, A. Factors underlying residential radon concentration: Results from Galicia, Spain. Environ. Res. 2007, 103, 185–190. [Google Scholar] [CrossRef]
  72. Beck, T.R. Risks and radiation doses due to residential radon in Germany. Radiat. Prot. Dosim. 2017, 175, 466–472. [Google Scholar] [CrossRef]
  73. On Approval of the Sanitary Rules “Sanitary and Epidemiological Requirements for Ensuring Radiation Safety”. Order of the Minister of Health of the Republic of Kazakhstan dated 15 December 2020 No. KR DSM-275/2020. Available online: https://adilet.zan.kz/rus/docs/V2000021822 (accessed on 25 August 2023).
  74. Bersimbaev, R.I.; Bulgakova, O. The health effects of radon and uranium on the population of Kazakhstan. Genes Environ. 2015, 37, 18. [Google Scholar] [CrossRef]
  75. Tirmarche, M.; Harrison, J.; Laurier, D.; Paquet, F.; Blanchardon, E.; Marsh, J.W. Lung cancer risk from radon and progeny and statement on radon. Ann. ICRP 2010, 40, 1–64. [Google Scholar]
  76. Günay, O.; Aközcan, S.; Kulalı, F. Measurement of indoor radon concentration and annual effective dose estimation for a university campus in Istanbul. Arab. J. Geosci. 2019, 12, 171. [Google Scholar] [CrossRef]
  77. Kulalı, F.; Günay, O.; Aközcan, S. Determination of indoor radon levels at campuses of Üsküdar and Okan Universities. Int. J. Environ. Sci. Technol. 2019, 16, 5281–5284. [Google Scholar] [CrossRef]
  78. Teiri, H.; Nazmara, S.; Abdolahnejad, A.; Hajizadeh, Y.; Mehdi Amin, M. Indoor radon measurement in buildings of a university campus in central Iran and estimation of its effective dose and health risk assessment. J. Environ. Health Sci. Eng. 2021, 19, 1643–1652. [Google Scholar] [CrossRef]
Figure 1. (a) Kazakhstan map and location of Almaty city; (b) schematic map showing the study area with active fault zones (red lines) in Almaty; (c) al-Farabi Kazakh National University near the Zailiysky Fault (red line) and the distribution of measurement positions (black points).
Atmosphere 14 01584 g001
Figure 2. Evolution of the indoor Rn concentrations between 9 February 2021 and 1 October 2021.
Atmosphere 14 01584 g002
Figure 3. Mean indoor air radon concentrations at al-Farabi Kazakh National University (Almaty, Kazakhstan).
Atmosphere 14 01584 g003
Figure 4. Mean radon concentration in indoor air versus the distance to the fault.
Atmosphere 14 01584 g004
Table 1. Monthly mean radon concentrations.
No.Month, YearRadon Con. (Bq/m3)
Basement Floor3rd Floor5th Floor
1February 2021185.81 ± 55.7433.25 ± 9.9871.78 ± 21.53
2March 2021147.67 ± 44.3031.30 ± 9.3950.65 ± 15.20
3April 2021217.16 ± 65.1528.05 ± 8.4237.49 ± 11.25
4May 2021568.87 ± 170.6628.56 ± 8.5730.18 ± 9.05
5June 2021263.28 ± 78.9820.85 ± 6.2616.15 ± 4.85
6July 2021206.19 ± 61.8622.41 ± 6.7228.48 ± 8.54
7August 2021143.88 ± 43.16419.20 ± 5.7629.60 ± 8.88
8September 2021221.89 ± 66.5712.17 ± 3.6517.67 ± 5.30
9October 202159.89 ± 17.9721.22 ± 6.3721.44 ± 6.43
10November 2021110.11 ± 33.0329.78 ± 8.9334.00 ± 10.20
11December 202185.00 ± 25.5038.50 ± 11.5528.50 ± 8.55
12January 2022130.67 ± 39.2033.56 ± 10.0767.67 ± 20.30
13February 2022124.25 ± 37.2829.00 ± 8.7050.00 ± 15.00
14March 202279.25 ± 23.7817.75 ± 5.3339.75 ± 11.93
15April 2022130.60 ± 39.1819.60 ± 5.8819.60 ± 5.88
16May 2022415.17 ± 124.5517.63 ± 5.2933.88 ± 10.16
17June 2022280.73 ± 84.2221.07 ± 6.3220.93 ± 6.28
18July 2022106.33 ± 31.9014.33 ± 4.3036.33 ± 10.90
19August 202279.90 ± 23.9712.43 ± 3.7319.70 ± 5.91
20September 2022122.58 ± 36.778.04 ± 2.4111.42 ± 3.43
Average indoor radon concentration183.96 ± 55.1921.00 ± 6.3031.84 ± 9.55
Disclaimer/Publisher’s Note: The statements, opinions and data contained in all publications are solely those of the individual author(s) and contributor(s) and not of MDPI and/or the editor(s). MDPI and/or the editor(s) disclaim responsibility for any injury to people or property resulting from any ideas, methods, instructions or products referred to in the content.

