Article

Evaluation of Soil Moisture-Based Satellite Precipitation Products over Semi-Arid Climatic Region

1
Climate, Energy and Water Research Institute, National Agriculture Research Center, Islamabad 44000, Pakistan
2
Department of Land and Water Conservation Engineering, Faculty of Agricultural Engineering and Technology, PMAS-Arid Agriculture University, Rawalpindi 46000, Pakistan
3
China-Pakistan Joint Research Center on Earth Sciences, CAS-HEC, Islamabad 45320, Pakistan
4
State Key Laboratory of Desert and Oasis Ecology, Xinjiang Institute of Ecology and Geography, Chinese Academy of Sciences, Urumqi 830011, China
5
Department of Civil Engineering, University of Tokyo, Tokyo 113-8654, Japan
6
Key Laboratory of GIS & RS Application Xinjiang Uygur Autonomous Region, Urumqi 830011, China
*
Authors to whom correspondence should be addressed.
Atmosphere 2023, 14(1), 8; https://doi.org/10.3390/atmos14010008
Submission received: 16 November 2022 / Revised: 16 December 2022 / Accepted: 17 December 2022 / Published: 20 December 2022

Abstract

:
The ground validation of satellite-based precipitation products (SPPs) is very important for their hydroclimatic application. This study evaluated the performance assessment of four soil moisture-based SPPs (SM2Rain, SM2Rain- ASCAT, SM2Rain-CCI, and GPM-SM2Rain). All data of SPPs were compared with 64 weather stations in Pakistan from January 2005 to December 2020. All SPPs estimations were evaluated on daily, monthly, seasonal, and yearly scales, over the whole spatial domain, and at point-to-pixel scale. Widely used evaluation indices (root mean square error (RMSE), correlation coefficient (CC), bias, and relative bias (rBias)) along with categorical indices (false alarm ratio (FAR), probability of detection (POD), success ratio (SR), and critical success index (CSI) were evaluated for performance analysis. The results of our study signposted that: (1) On a monthly scale, all SPPs estimations were in better agreement with gauge estimations as compared to daily scales. Moreover, SM2Rain and GPM-SM2Rain products accurately traced the spatio-temporal variability with CC >0.7 and rBIAS within the acceptable range (±10) of the whole country. (2) On a seasonal scale (spring, summer, winter, and autumn), GPM-SM2Rain performed more satisfactorily as compared to all other SPPs. (3) All SPPs performed better at capturing light precipitation events, as indicated by the Probability Density Function (PDF); however, in the summer season, all SPPs displayed considerable over/underestimates with respect to PDF (%). Moreover, GPM-SM2RAIN beat all other SPPs in terms of probability of detection. Consequently, we suggest the daily and monthly use of GPM-SM2Rain and SM2Rain for hydro climate applications in a semi-arid climate zone (Pakistan).

1. Introduction

To keep the atmosphere in equilibrium, precipitation plays a crucial role. It is a fundamental part of the hydrological cycle on earth [1], which transports water from the atmosphere to the surface of the earth [1,2,3,4]. Precipitation is an integral part of many studies such as the study of climate trends, management of water resources, prediction of flood and drought, hydrological modeling, crop water requirement, and climate change [2]. For precipitation studies, the most authentic source of precipitation data is weather radar and rain gauge [3,4]. However, it is almost impossible to get reliable or accurate data in developing regions of the world because of uneven distribution and a weak relationship between precipitation intensity and topography [5,6]. Various satellite-based precipitation products (SPPs) at different spatiotemporal scales have been developed in recent decades to overcome the problem of precipitation sparseness. Furthermore, several reanalysis data sets have also been introduced for studies in order to improve the accuracy of climate variable measurement [7,8].
Precipitation data is important for reliable prediction to form hydro climatological studies. Therefore, validating SPPs accuracy is necessary before using them effectively in a variety of hydro-climatological analyses [9]. On the other hand, SPPs can deliver constant information on precise spatial and temporal scales [10]. It is very difficult to get accurate precipitation data on a fine spatiotemporal scale in the developing world because of uneven distribution of rain gauge networks [11]. Currently, SPPs are using an advance precipitation estimation algorithm to provide consistent data on a fine spatiotemporal scale using signals from infrared (IR) and microwave (MW) sensors [12]. Because of the continuous involvement of science and technology, the SPPs were formed by using many techniques such as meteorological modeling, remote sensing, and ground measurement, to enhance the accuracy of the products. For instance, several products rely on satellite-based soil moisture [13,14]. These products were obtained from satellite soil moisture data through SM2Rain algorithm [15]. It is observed that regional topography and climatology have a significant impact on SPPs product performance [16]. Therefore, this study’s goal is to describe, examine, and evaluate the efficiency of the most recent precipitation products (SM2Rain-CCI, SM2Rain-ASCAT, GPM-SM2Rain, and SM2Rain) across a range of topography and metrological regimes in the semi-arid climatic zone of Pakistan.
Many SPPs along with reanalysis precipitation products are freely available for evaluation and their applications [13,14,15,16]. Moreover, some SPPs use a combination of sensors that measures the top characteristics of a cloud to provide precipitation estimations, and some other SPPs are directly linked to ground observation. However, considering the SM2Rain (Soil Moisture to Rain) products, the SM2RAIN-ASCAT was used to produce this product from satellite measurements of soil moisture [17,18,19,20]. The GPM-SM2RAIN precipitation dataset is based on the integration of the Global Precipitation Measurement Mission (GPM) with SM2RAIN-based precipitation estimates derived from ASCAT H113 H-SAF, SMOS L3, and SMAP L3 soil moisture products. Moreover, through the development of in-situ networks of remote sensing sensors and advanced and powerful retrieval algorithms, SM monitoring has advanced significantly in the last 20 years. Typically, SM data sets are used with hydrological and meteorological models to enhance the simulation of their internal state by using data assimilation techniques. In contrast, precipitation observations serve as the primary input data required for SM modelling. The salient features of all selected soil moisture-based satellite precipitation are given in Table 1. All the SPPs data has been accessed on 25 September 2022.
In recent times, many satellite-based precipitation products were introduced to obtain reliable precipitation [9,21,22,23]. Most of the precipitation satellites were assessed in the upper Indus region and some were evaluated in the mountainous region of Pakistan [5,22,24]. However, the evaluation of soil moisture-based products over the whole country has not been carried out yet. Although satellite-based precipitation products can provide accurate and reliable information on suitable spatial and temporal scales, at the same time, the accuracy of SPPs is not reliable over the different topographical and climatic regions of Pakistan [25]. Recently, the record-breaking monsoon precipitation led to severe floods in two main provinces of Pakistan (Baluchistan and Sindh). One of the main reasons for floods is the inadequate in-situ hydro climatic study presentations caused by the uneven distribution of metrological stations [26,27,28]. Therefore, we need to explore and evaluate the different sources of precipitation data such as satellite-based precipitation data before their direct application. The performance evaluation of recent soil moisture-based precipitation over various topographical and climatic circumstances in Pakistan has not been conducted. Moreover, the issue of the lack of precipitation data is anticipated to be solved by SPPs. Therefore, this enforces us to evaluate the uncertainty analysis of the latest soil moisture-based products (SM2RAIN-ASCAT, SM2RAIN-CCI, and GPM-SM2RAIN). The accuracy and reliability of these products are still unidentified because this will be the first time. Moreover, the government of Pakistan is planning to develop multiple multipurpose hydrological structures. Therefore, the significance of an assessment of satellite-based precipitation products will lead to improvements enormously. The results of this research will be very beneficial to SPPs’ data users, meteorologists, hydrologists, water conservation practices, and policymakers in Pakistan.

2. Materials and Methods
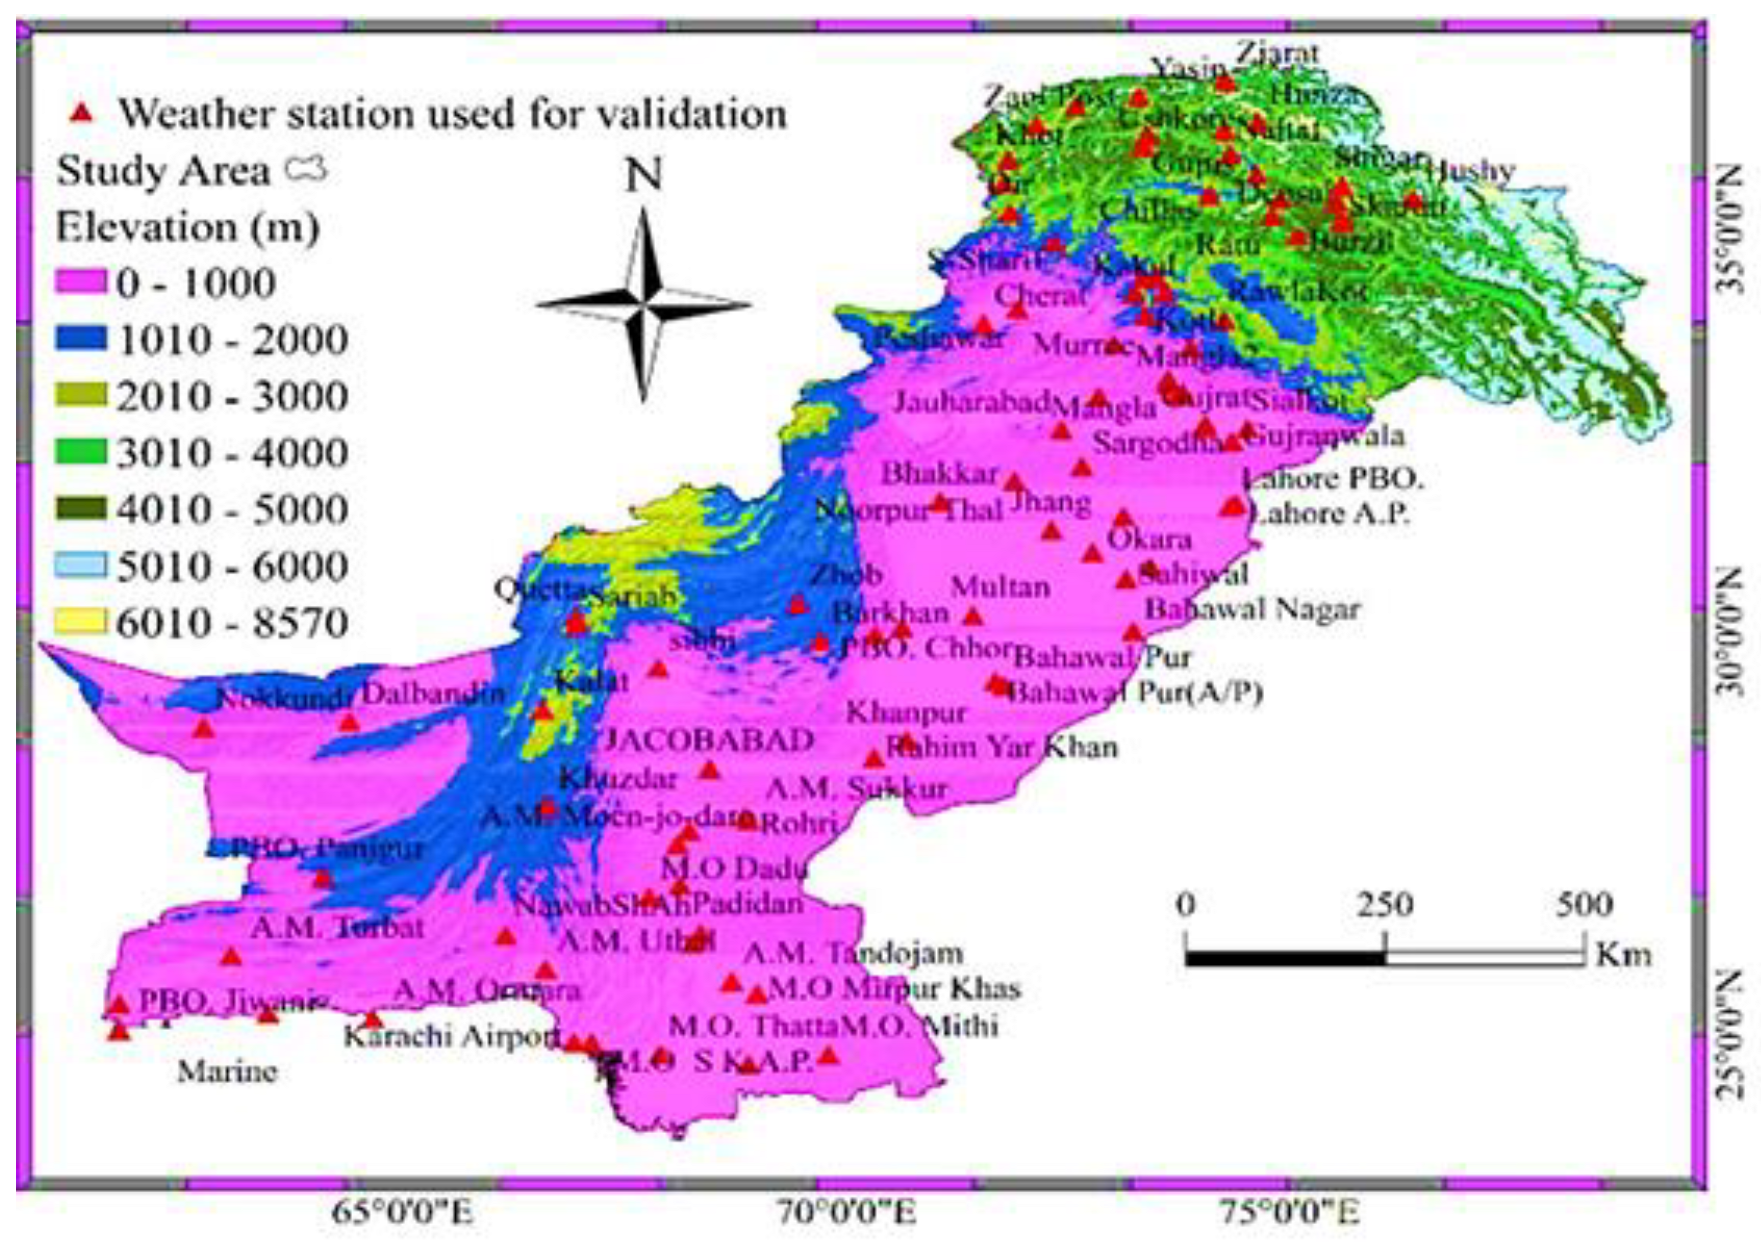
2.1. Study Area

Pakistan is graphically situated in the western region of South Asia between 24° N and 37° N and 62° E and 75° E. It reaches the Hindu Kush Mountains in the north and extends from the Pamir to the Arabian Sea. The precipitation varies greatly in Pakistan, and Baluchistan and Khyber Pakhtunkhwa (northern mountains) provinces receive maximum precipitation from December to March (900–1100 precipitation mm/year), whereas Punjab and Sindh receive 50–75% of the precipitation during monsoon season (June to August) (500–700 precipitation mm/year) [29]. The lowest precipitation (100–300 mm/year) is found in the plain areas of Sindh and Baluchistan (Hyderabad, Sibi, Badin, etc.) The distribution of precipitation in Pakistan can be divided into two seasons, summer or monsoon precipitation (enters from the east and northeast during July to September) and winter precipitation (mainly received from western disturbances from December to March). The water received from the snow melt in the northern areas of Kashmir and northern Baluchistan play an important role in the agricultural and socioeconomic activities of the country [29]. The main cause of recent floods in Pakistan is climate change; because of the temperature rises, the glaciers in Pakistan’s northern Gilgit-Baltistan and Khyber Pakhtunkhwa regions are melting rapidly. This is primary reason for the recent floods in Sindh and Baluchistan provinces of Pakistan [30]. The Digital elevation model (DEM) and available meteorological stations of study area is shown in Figure 1.

2.2. Datasets

In semi-arid climatic regions, 126 Pakistan Metrological Department (PMD) weather stations collected precipitation datasets on a daily basis. However, a gauge-based metrological dataset is very limited and rarely maintained by PMD. However, this study assesses the daily performance of 64 metrological stations that were considered to be appropriate because of significant missing values (greater than 20%) in other datasets. The evaluation of the moisture-based satellite products was limited from 2005 to 2020 because of uncertainties about the dependability and consistency of the daily datasets from available meteorological stations. The most important highlights of metrological stations are shown in Appendix A Table A1.
The data for all precipitation products can be accessed from their official website. The details (spatial/temporal resolution, time coverage, and data source link) of soil moisture- based satellite precipitation data are shown in Table 1. The SM2RAIN algorithm was used to produce this product from satellite measurements of soil moisture [31]. This precipitation dataset (mm/day) was provided over a regular grid at 0.1-degree sampling (3600 × 1801) on a global scale. The SM2RAIN-CCI [19,32] collects data by comparing the two precipitation satellite products, such as Tropical Measurement Mission Multi-Satellite precipitation analysis 3B42 real-time product (TMPA 3B42RT) and the Climate Prediction Center Morphing Technique (CMORPH). Among the other products, the SM2RAIN-CCI is only product that does not use rain gauge observations [10].

2.3. Methods

The evaluation of soil moisture products (SM2Rain, SM2Rain- ASCAT, SM2Rain-CCI, and GPM-SM2Rain) was assessed using in-situ ground observations. In the validation process, the methodology of previously published studies [3,22] was used. We only considered SPP grids with at least one benchmark measuring station. The uncertainties in the SPP estimations within the inquiry were evaluated and contrasted on various spatial and temporal scales. On periods ranging from daily to annual, errors in the products are assessed by grid and pixel size across the full spatial domain. The spatial distribution map of the recorded precipitation was produced using the Kriging spatial interpolation technique. This geographical approach is suggested for locations where the reference data are not homogeneous.
Firstly, the ability of each soil moisture product was estimated on multiple spatio-temporal scales. The Thiessen polygon method is used for the calculation of aerial precipitation. Then, for validation, each soil moisture product was evaluated against the 64 ground weather stations. For this purpose, previously recommended statistical indices were considered. The details of statistical indices and their acceptable ranges as indicated by previously published studies [22,24] used for the evaluation assessment of soil moisture-based satellite products are shown in Table 2. The Probability Density Function (PDF) of the daily and seasonal estimations of in-situ gauging stations was examined at different thresholds for a more accurate assessment of the soil moisture-based products. To examine the PDFs, a previous study [3] was employed as a framework. The World Meteorological Organization (WMO)’s protocol was followed for defining the thresholds for daily precipitation rates. Moreover, the ability of all examined precipitation products in Pakistan is visualized in terms of probability of detection (POD). Roebber [24] used classified indices to develop the performance diagram for evaluating the results of the categorical indices.
Figure 2 illustrates the Thiessen polygon method to calculate the aerial precipitation of the whole country. Firstly, the gauge weight is calculated for each meteorological station by using the Thiessen polygon method in ArcGIS10.7.1. The gauge weight of every single station is multiplied by its precipitation to estimate aerial precipitation. The Thiessen polygon method supposes that each pixel will capture the precipitation value in a specific area (A). The precipitation amount measured at pixel I is therefore only relevant to that region. Every pixel’s weight is determined by the region it belongs to in the Thiessen polygon.

3. Results

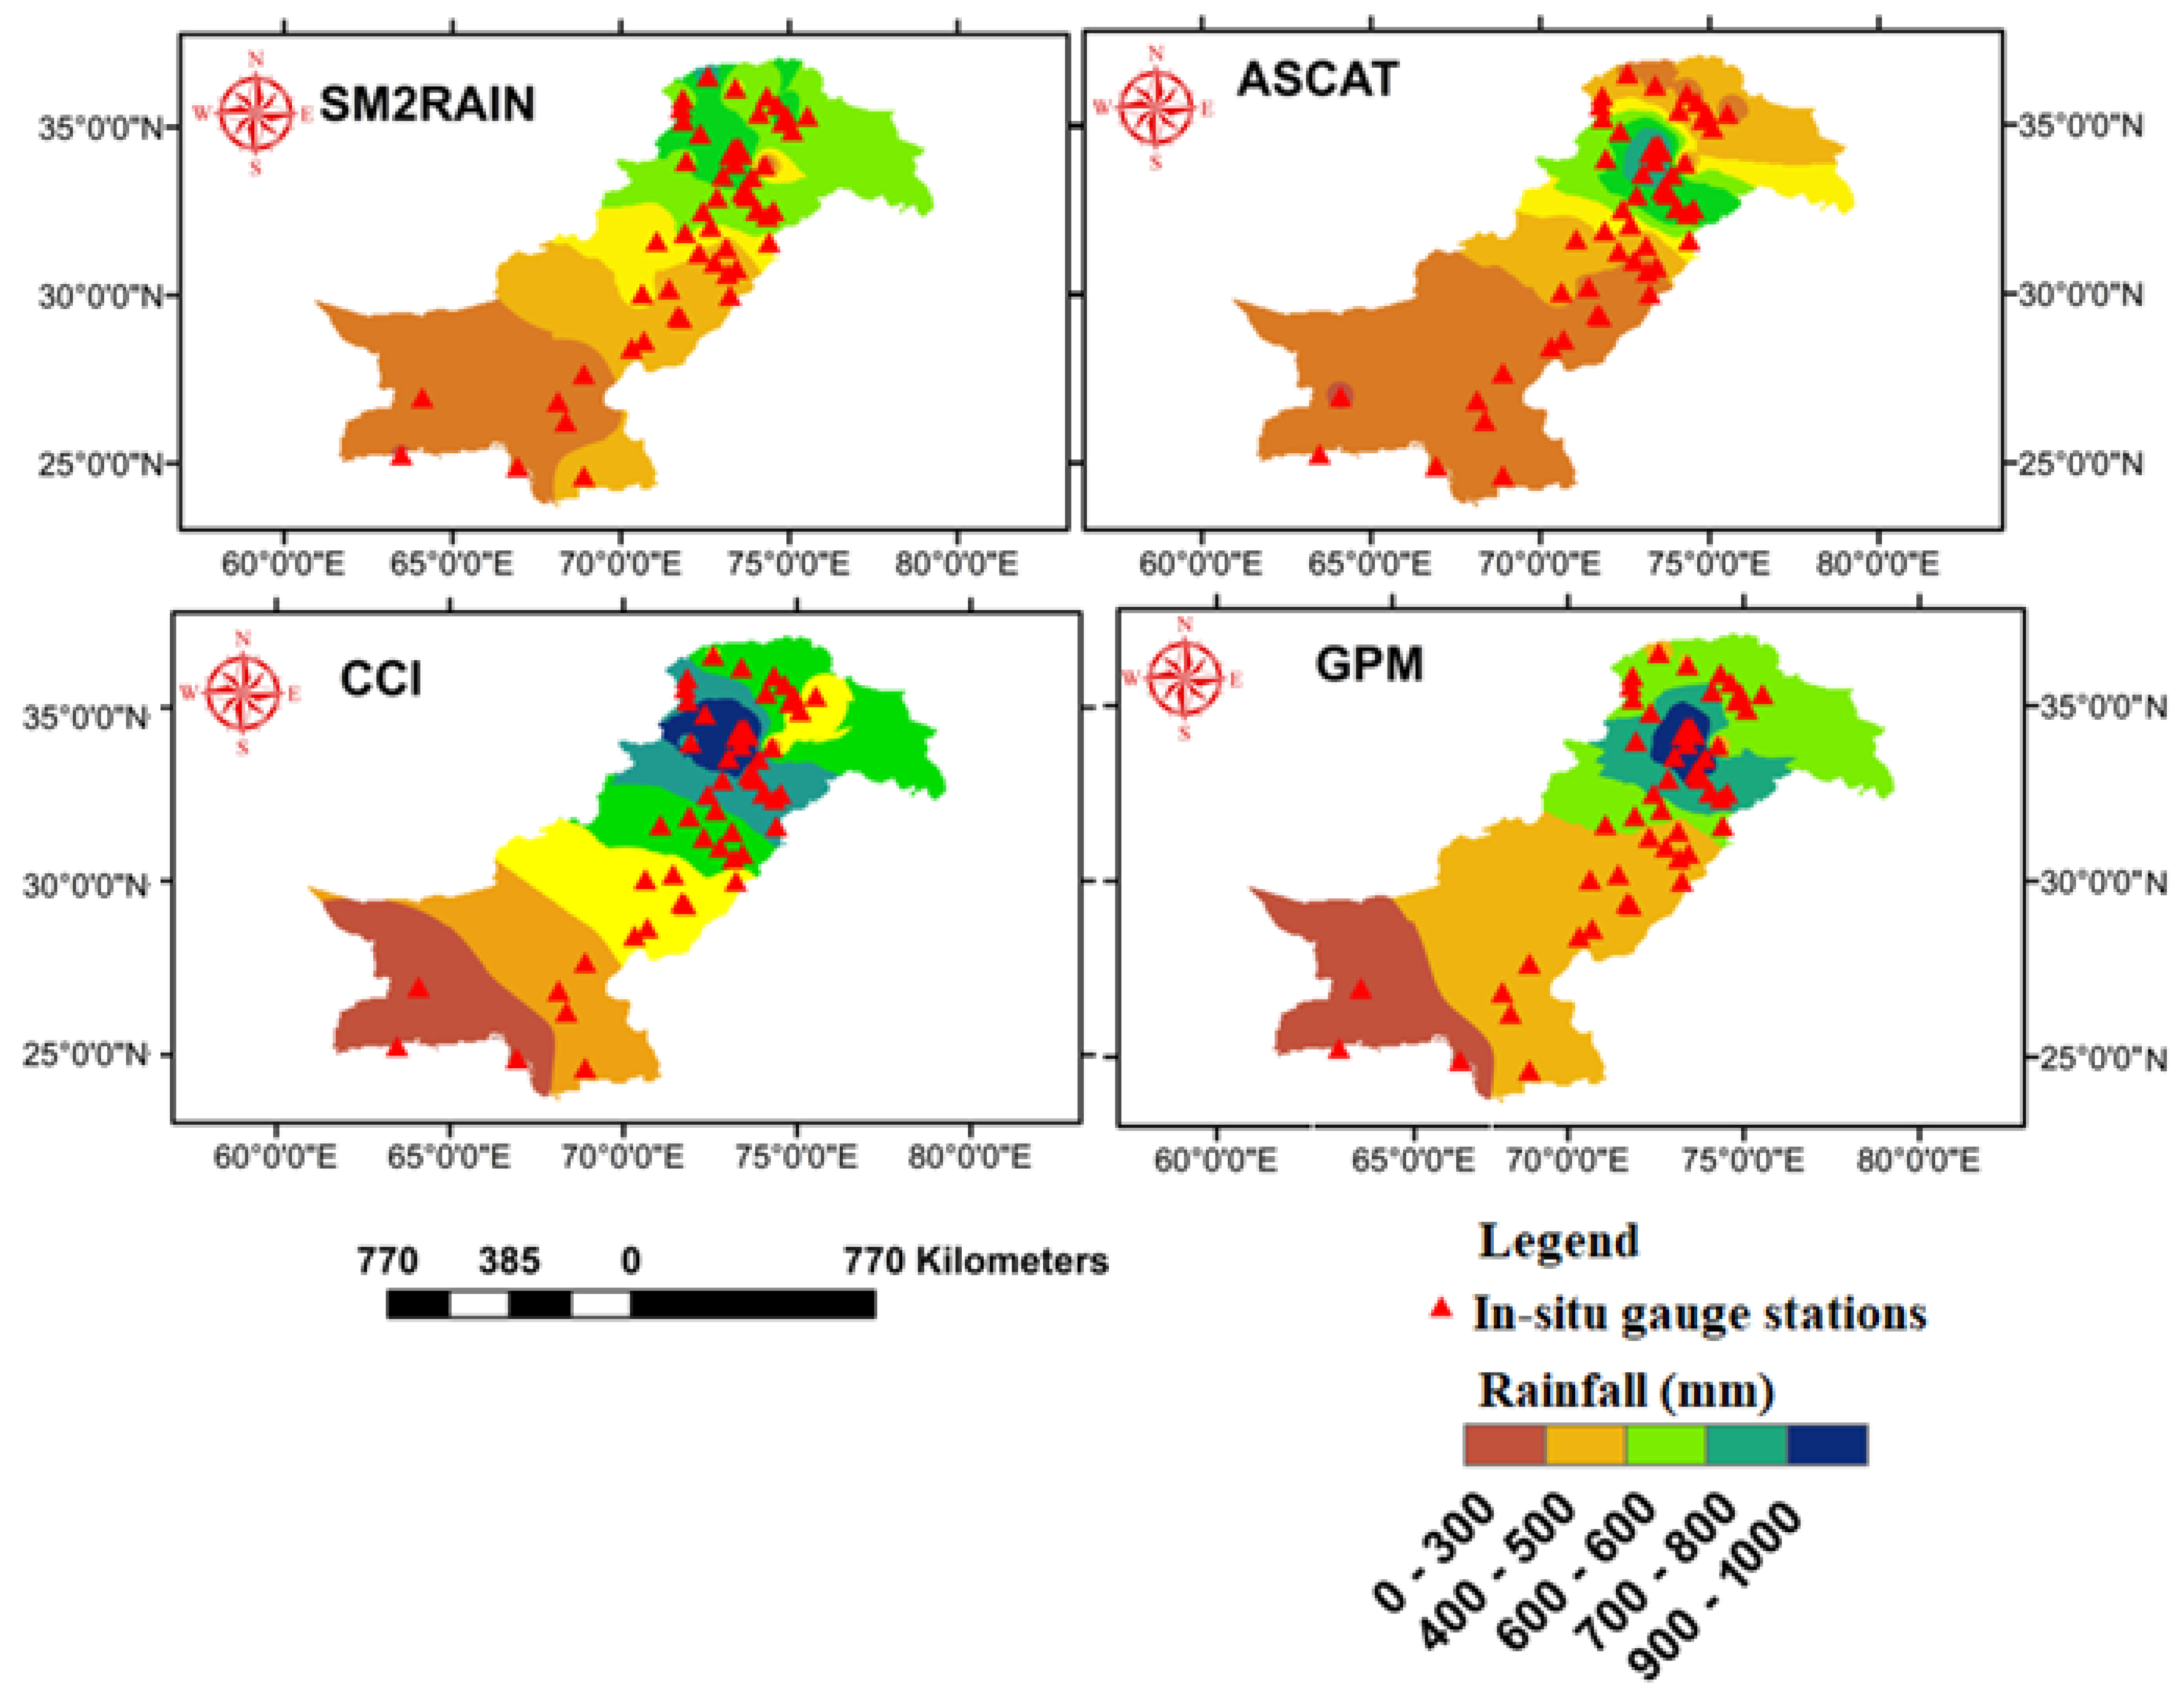
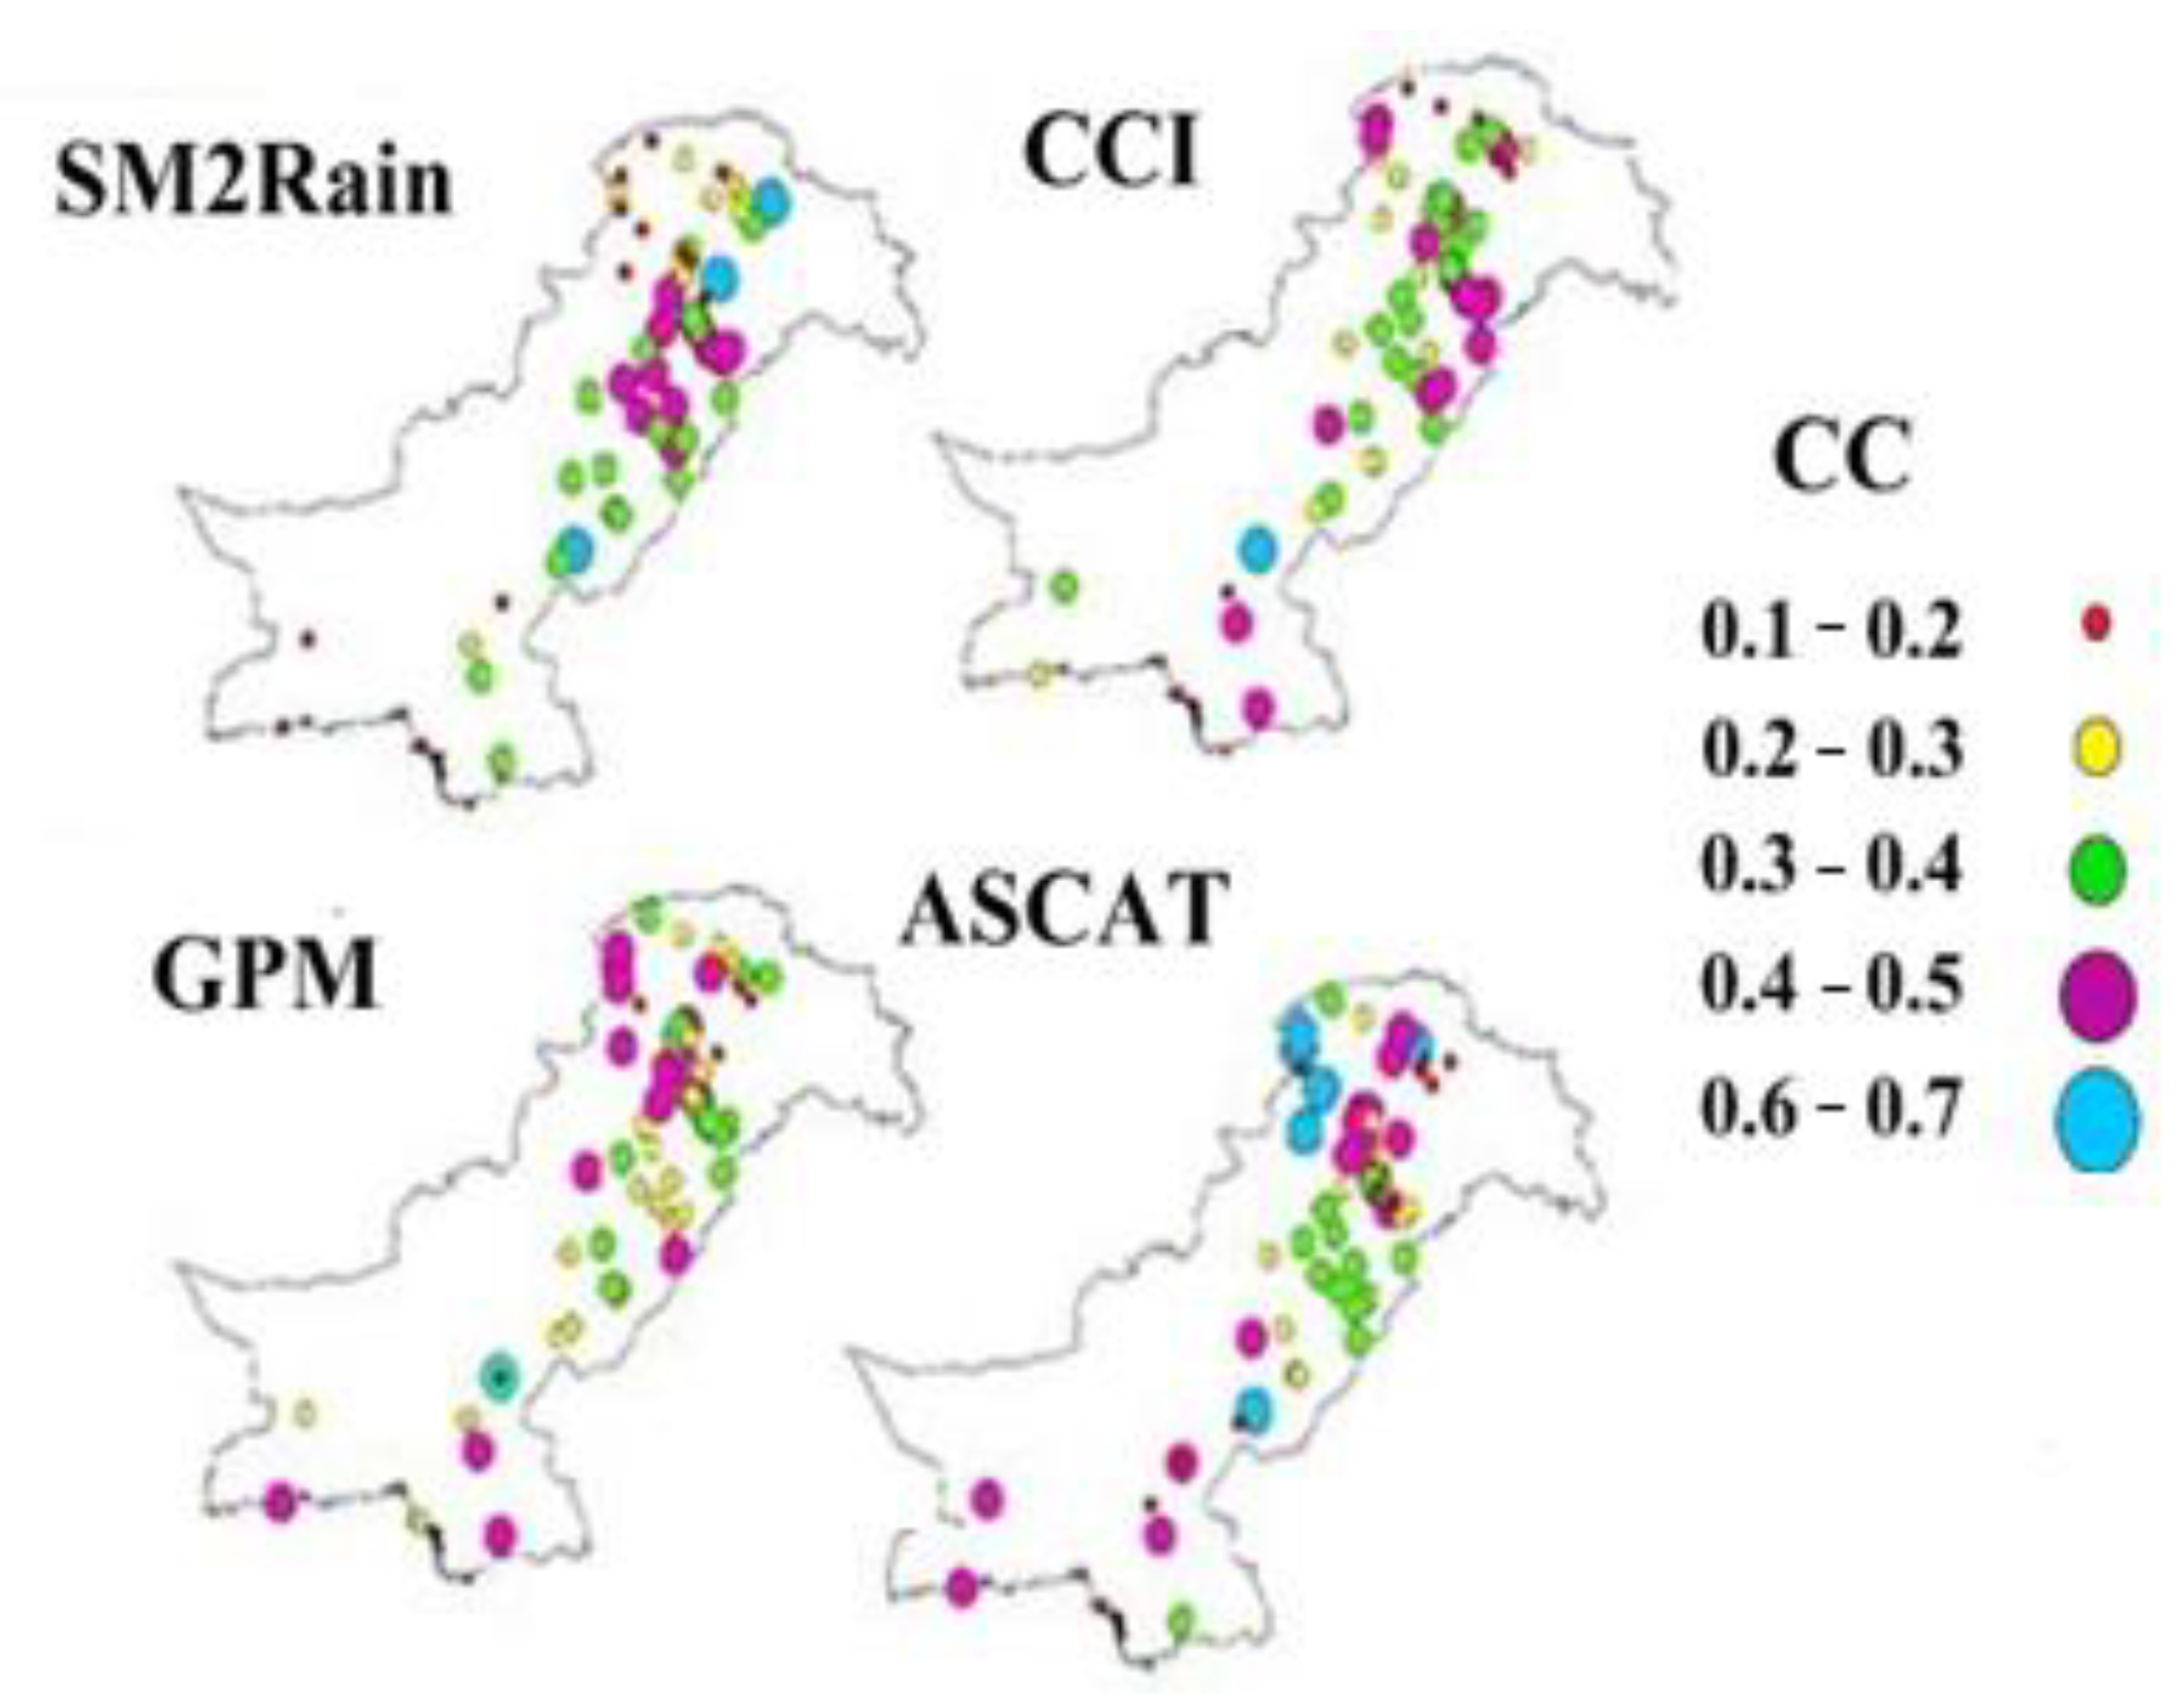
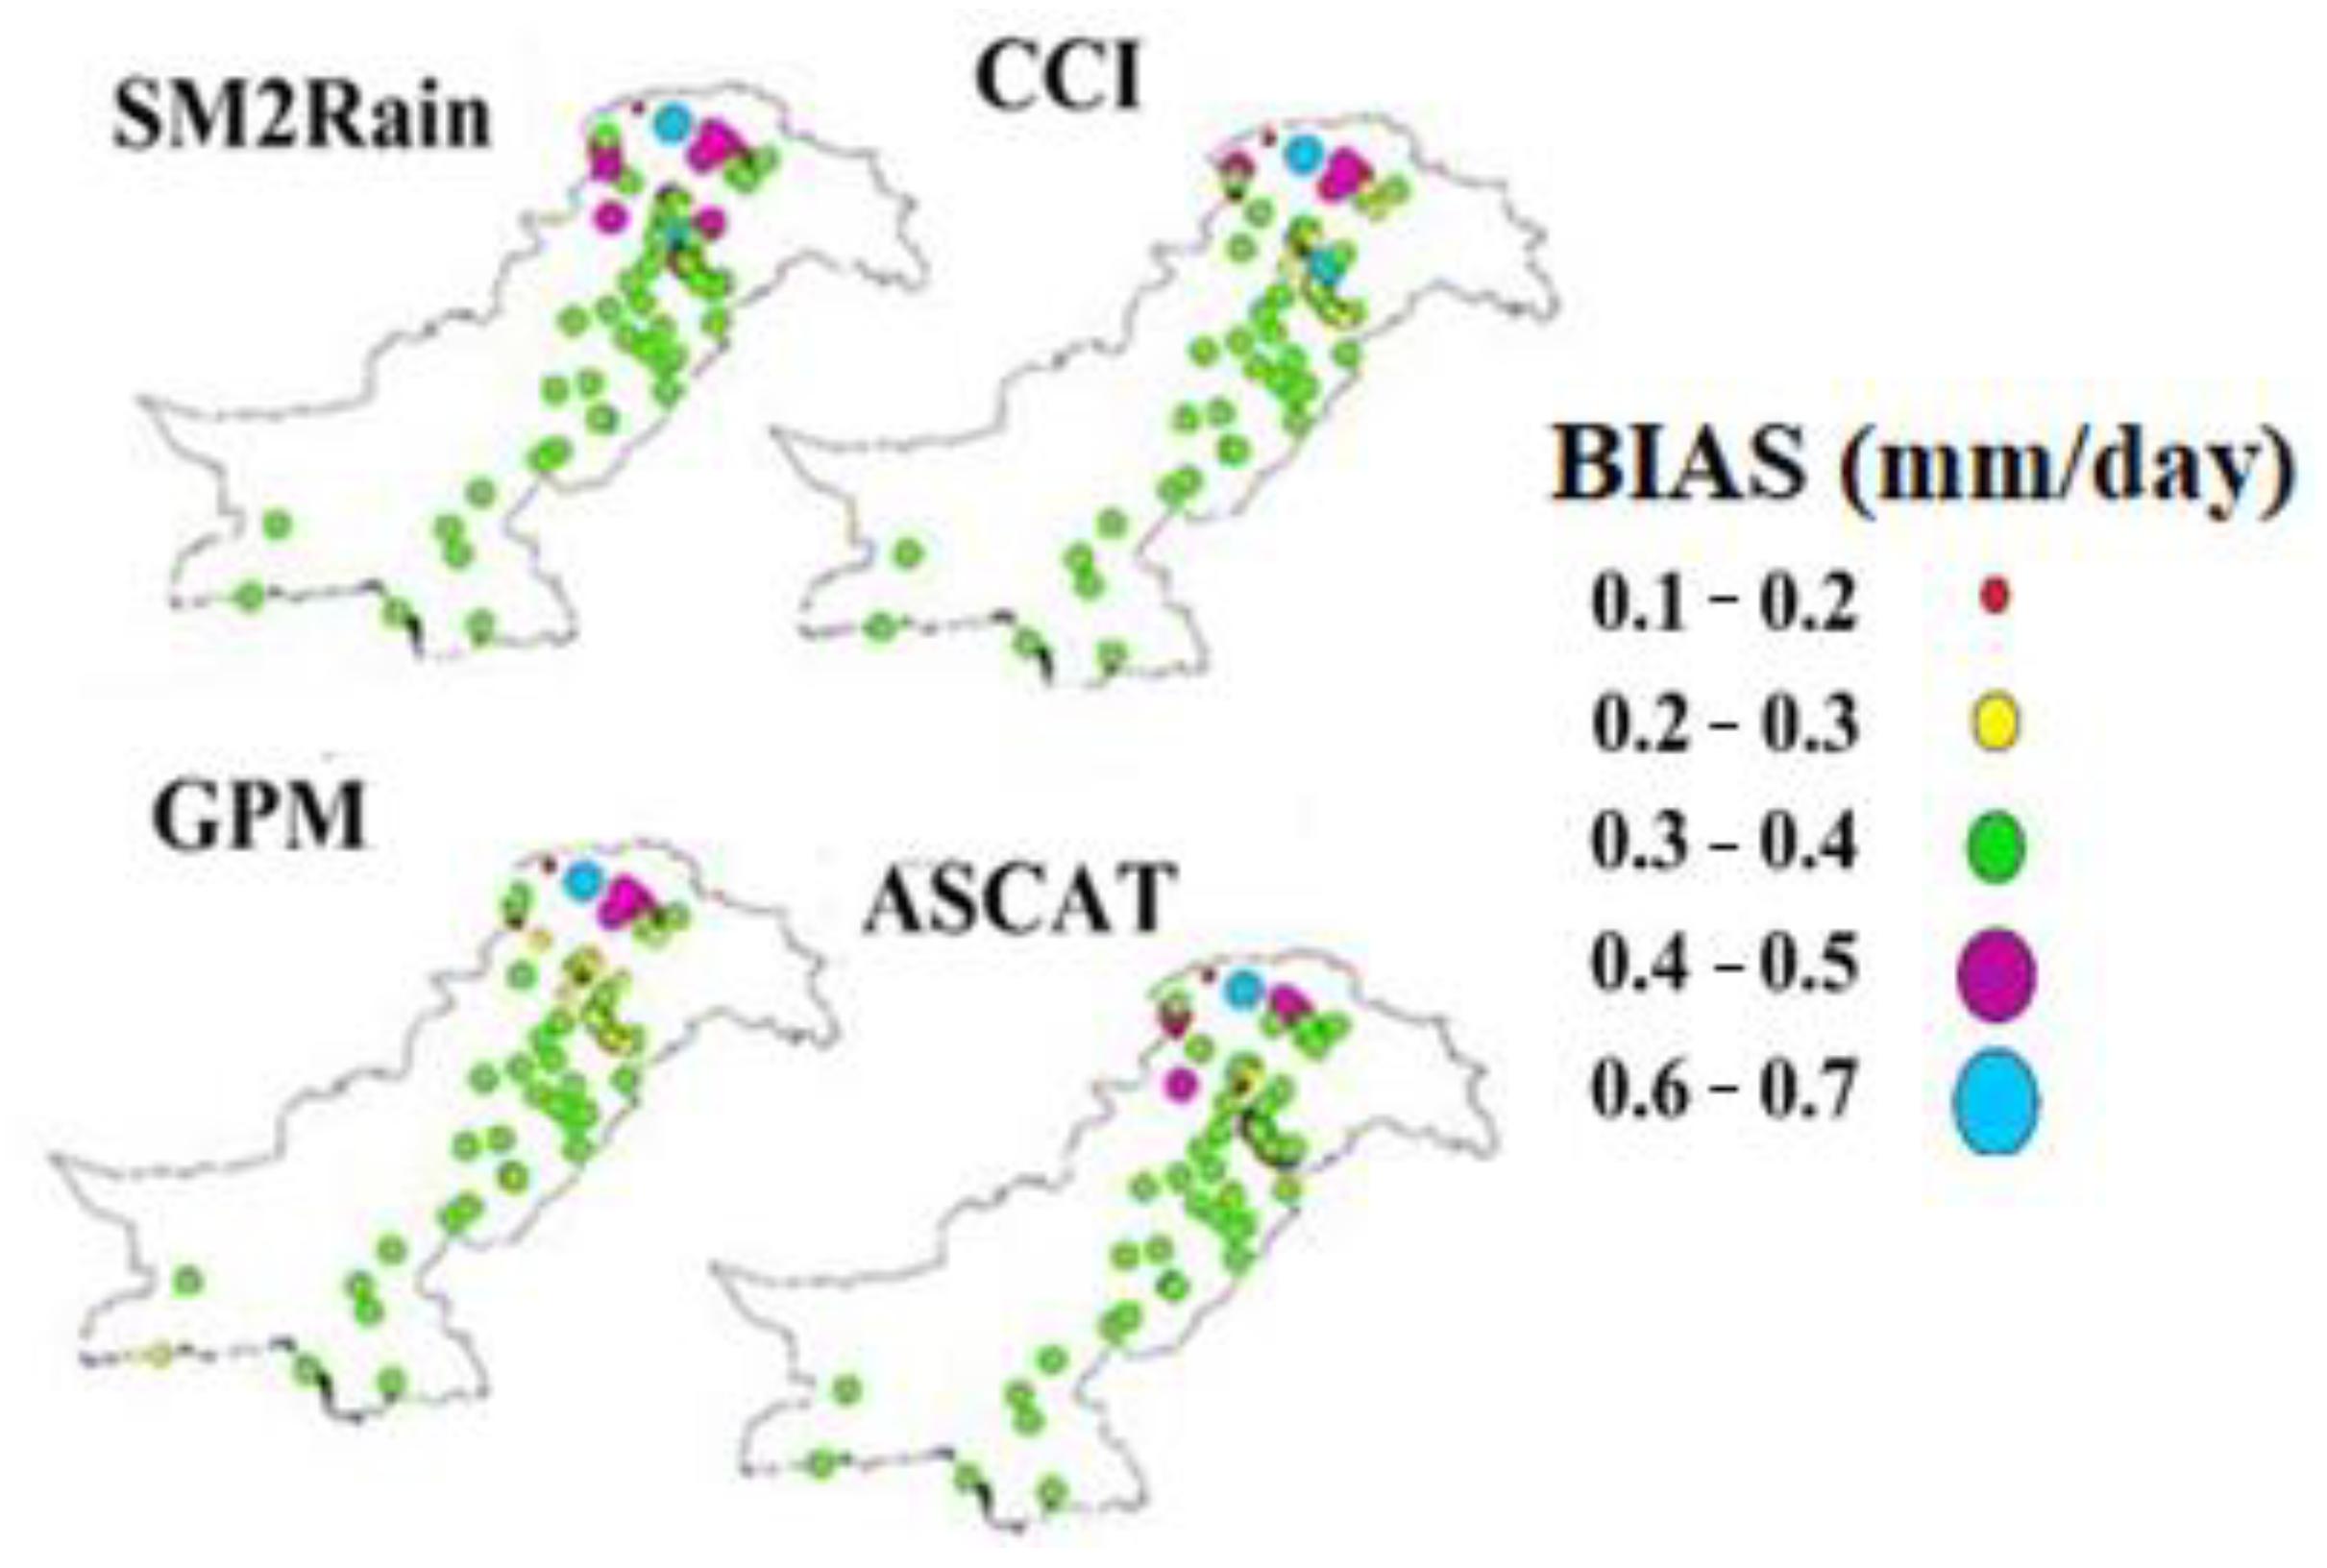
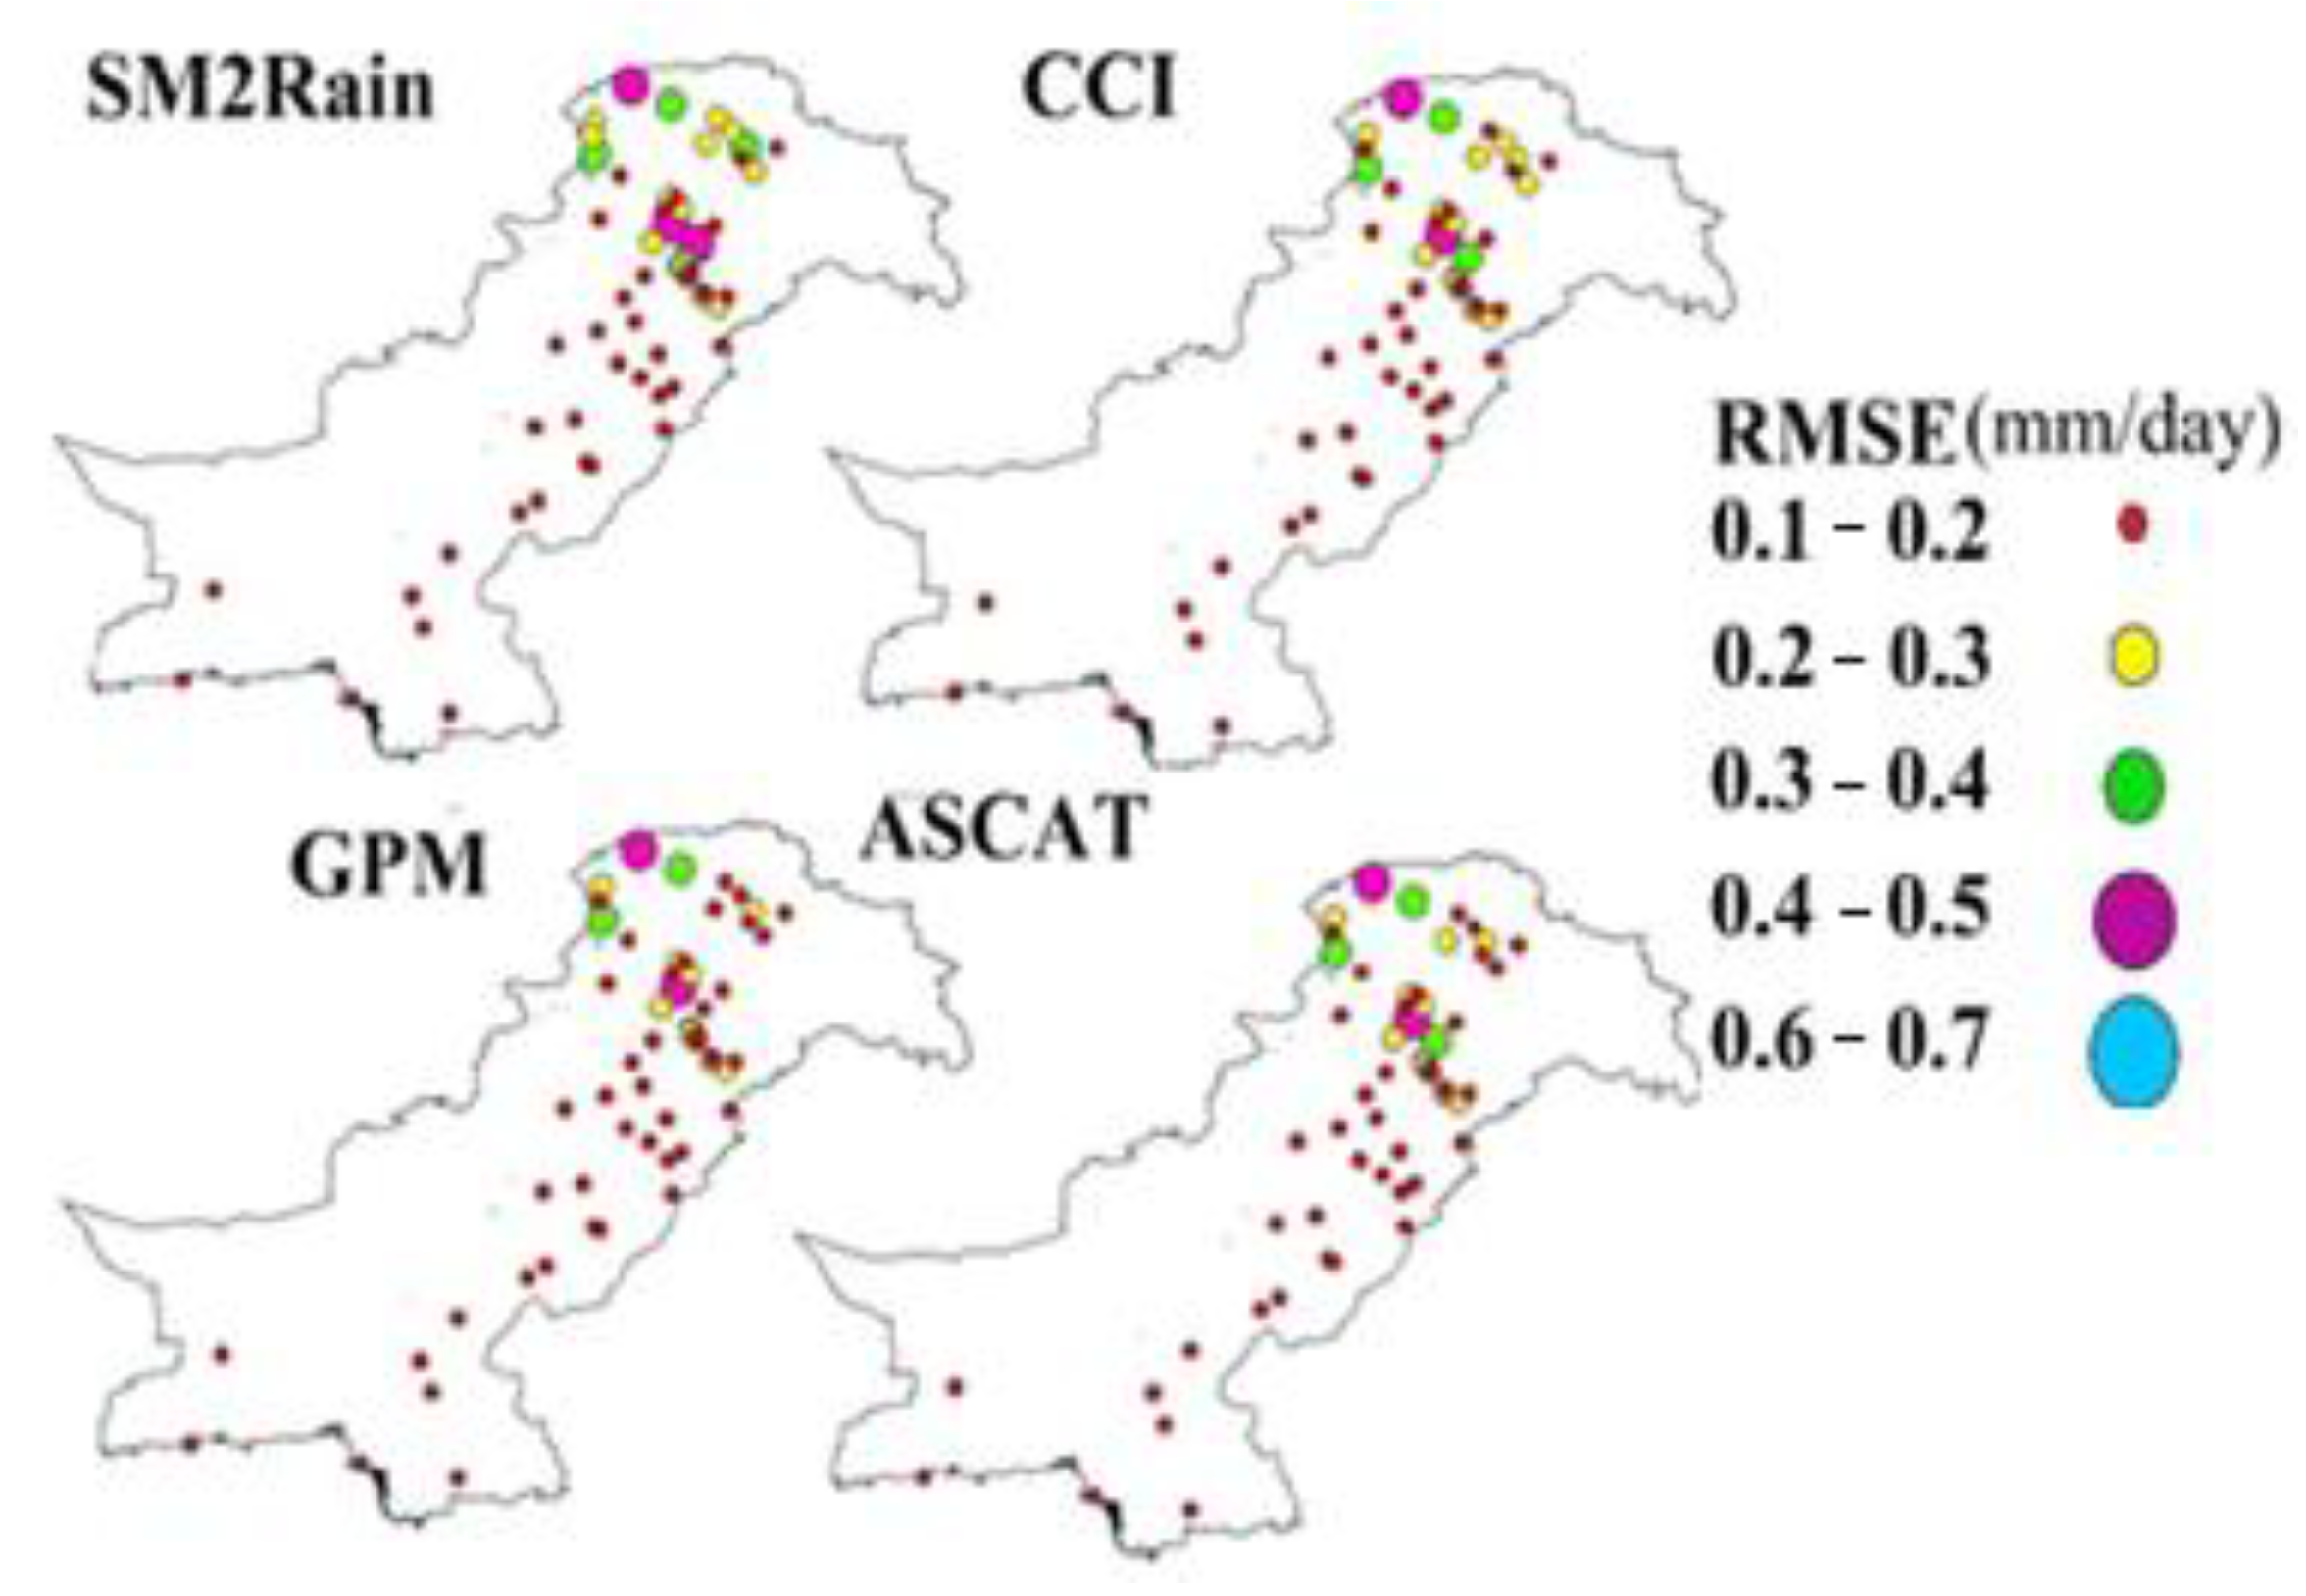
3.1. The Performance of Selected SPPs to Monitor Precipitation Spatial and Temporal Variability

Figure 3 defines the comparison of performance of spatial variability annual average precipitation of four precipitation products presented in this diagram. A significant portion of the nation’s annual precipitation was found to fall in the northern regions throughout the winter, whereas the Punjab Province experienced between 50–70% of its total precipitation during the summer. According to gauge information, SM2Rain completely captured the spatial distribution in arid and semi-arid regions. The precipitation values vary between 0–500 (mm). The SM2Rain data shows over-validation in arid and semi-arid regions, and poor validation in humid regions. On the other hand, the ASCAT data shows that the data captured completely resembles the gauge data in arid regions. The value of precipitation in that region is 0–300 (mm). However, we can see that ASCAT shows good validation in arid regions and poor validation in semi-arid and humid regions. The spatial distribution captured by CCI and GPM data has been completely compared with gauge data in humid regions. The precipitation varies in this region between 600–1100 (mm). The validation of CCI and GPM data is reliable in humid regions and poor in semi and semi-arid regions.
Figure 4 illustrates the comparison of temporal variability and annual average precipitation of CCI. As demonstrated here, the in-situ gauge data often exhibit two peaks in the precipitation time series data. Both the peak precipitation interval and the gauge average indicated an overestimation of the amount of precipitation (Feb- March and August-Sep.). While tracking the variability of recorded precipitation during the peak precipitation period, SM2Rain CCI displays good performance (Feb-March and July-August). The comparison of temporal variability and annual average precipitation of GPM is presented. When compared to Gauge Moving Average, Gauge Average exhibited an overestimation of the amount of precipitation during both peak precipitation periods (February-March and August-September). GPM-SM2Rain Average, meanwhile, showed substandard performance when compared to the temporal variability of observed precipitation throughout both the peak precipitation period and the entire period (March-April and June-July). The comparison of temporal variability annual average precipitation of ASCAT is presented. When evaluated to Gauge Moving Average, Gauge Average demonstrated an overestimation of the amount of precipitation during both peak precipitation periods (February-March and August-September). Furthermore, the SM2Rain-ASCAT Average indicates that the capacity to monitor the temporal variability of observed precipitation during both peak precipitation periods and the rest of the time is unsatisfactory (February-March and July-August). The comparison of temporal variability of annual average precipitation of SM2Rain is presented. Gauge Average shows an overestimation of the capability to monitor temporal variability in both the peak precipitation period and the observed precipitation (February-March and August-September), whereas, SM2Rain showed an overestimation in one peak precipitation period (March–April) and showed poor performance in other peak precipitation periods (June–July).

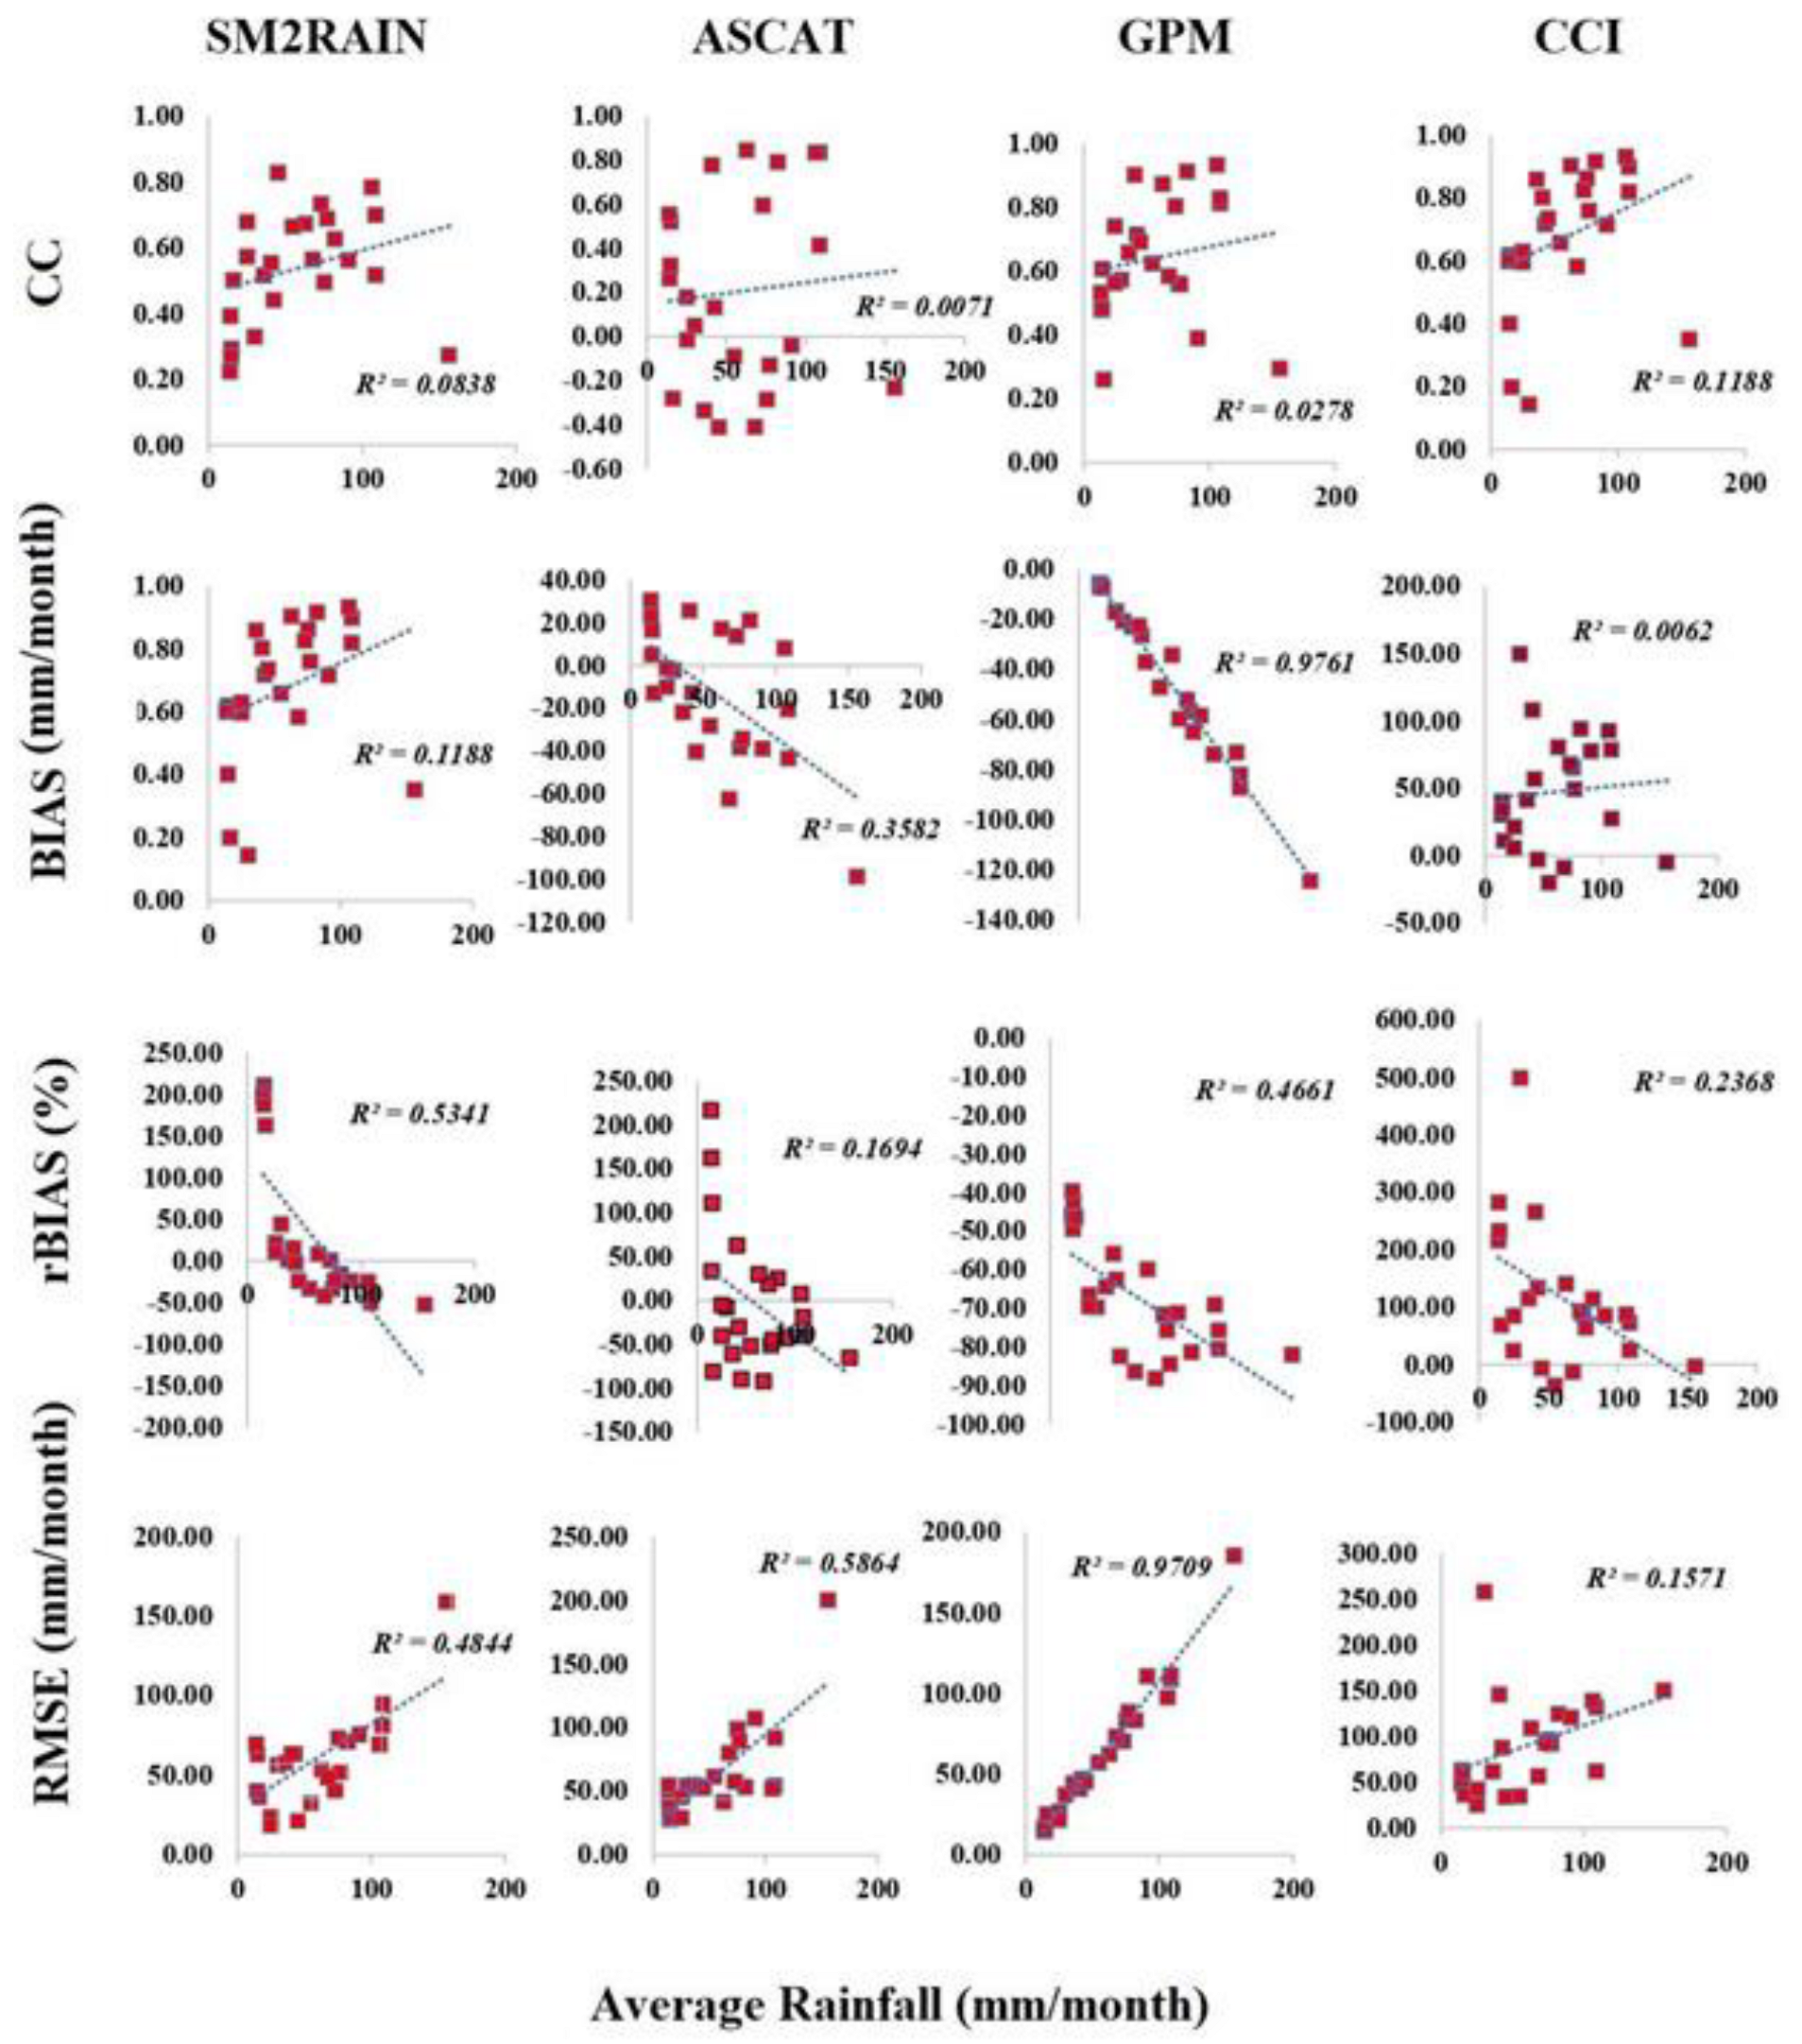
3.2. Uncertainty Analysis of SPPs on Monthly Scale

The projected CC, BIAS, RMSE, and rBIAS values for four precipitation products on a monthly scale varied, as shown in Table 3. By looking at the box plot of CC, the products of GPM showed better performance as compared to other precipitation products. In the case of a plot box of BIAS (mm), as compared to other precipitation products, the output of GPM and SM2Rain shows comparatively good performance. The box plot of RMSE highlighted that the SM2Rain-ASCAT products performed relatively poorly when compared to other precipitation products (mm). When considering the box plot of rBIAS (%), the product of SM2Rain displayed relatively good performance as compared to other precipitation products.
Figure 5 evaluates the impact of aerial average precipitation (mm/month) of all SPPs (CCI, GPM, ASCAT, and SM2Rain) on evaluation indices. In general, the CC values of all items taken into consideration were directly proportional to the precipitation intensity, whereas the RMSE (mm/month) and BIAS (mm/month) values of all considered products decreased with the increase in intensity of precipitation. The value of R2 = 0.9709 is higher in GPM at RMSE (mm/month).

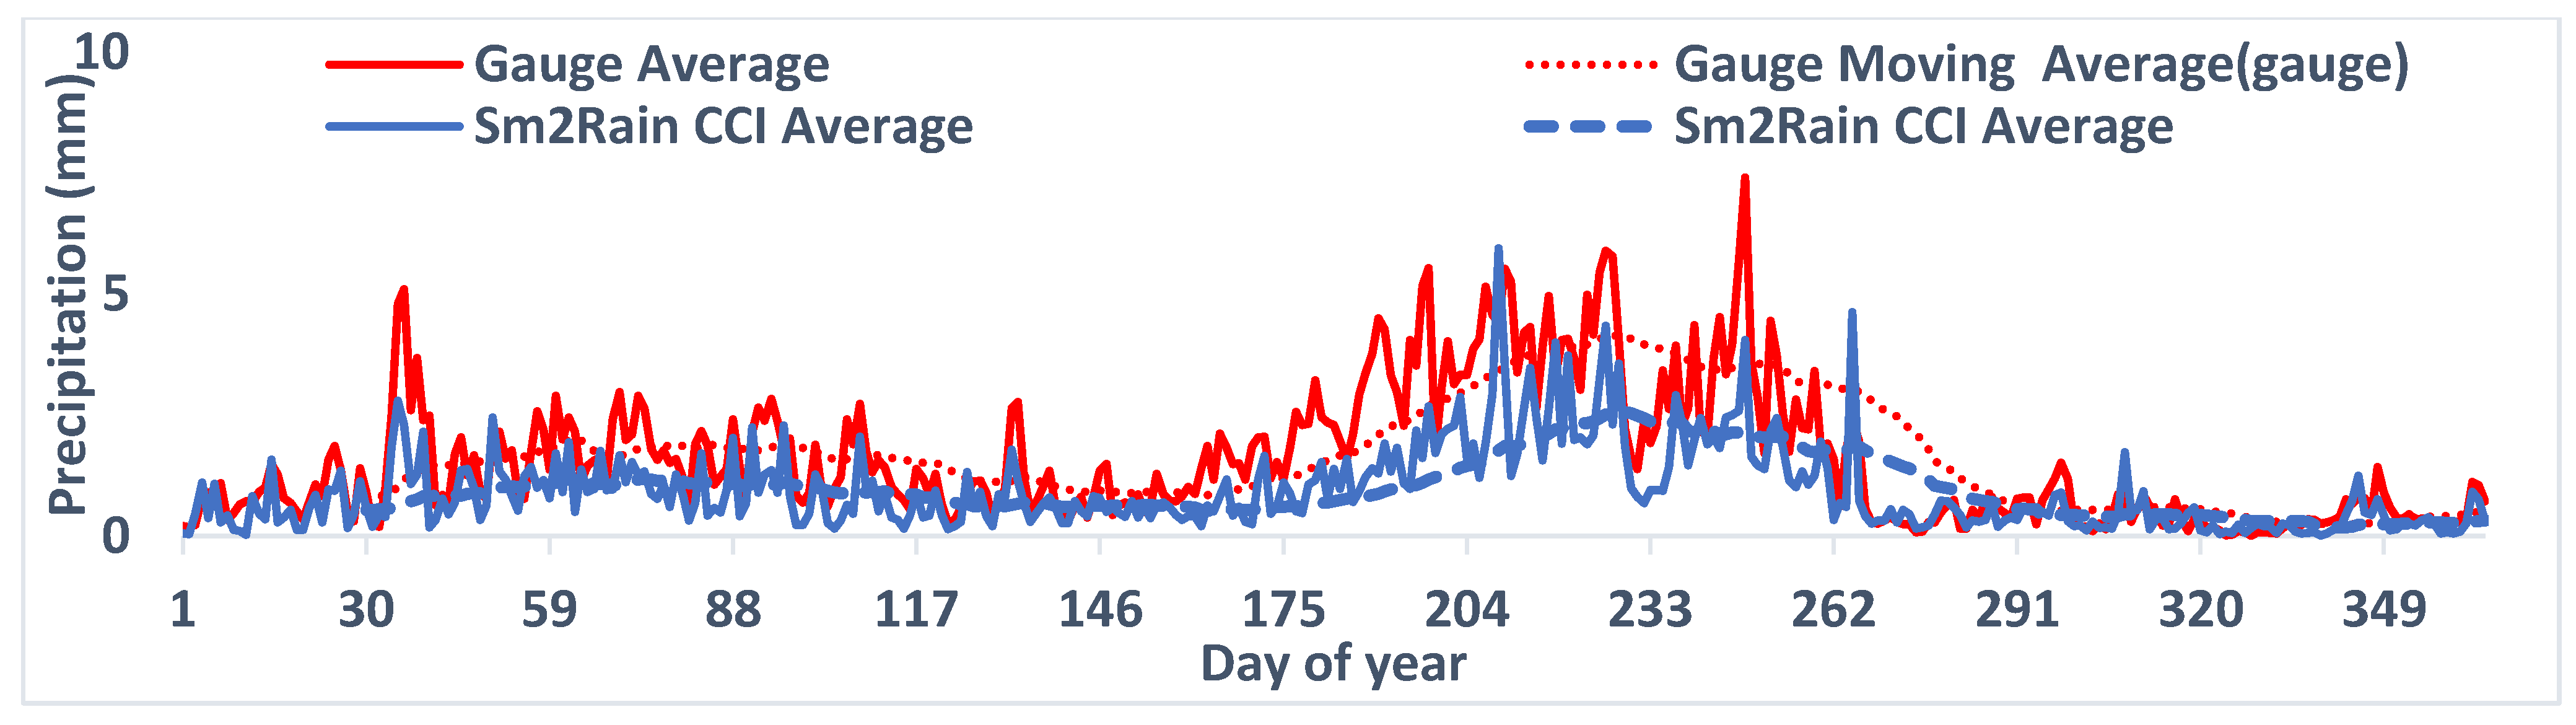
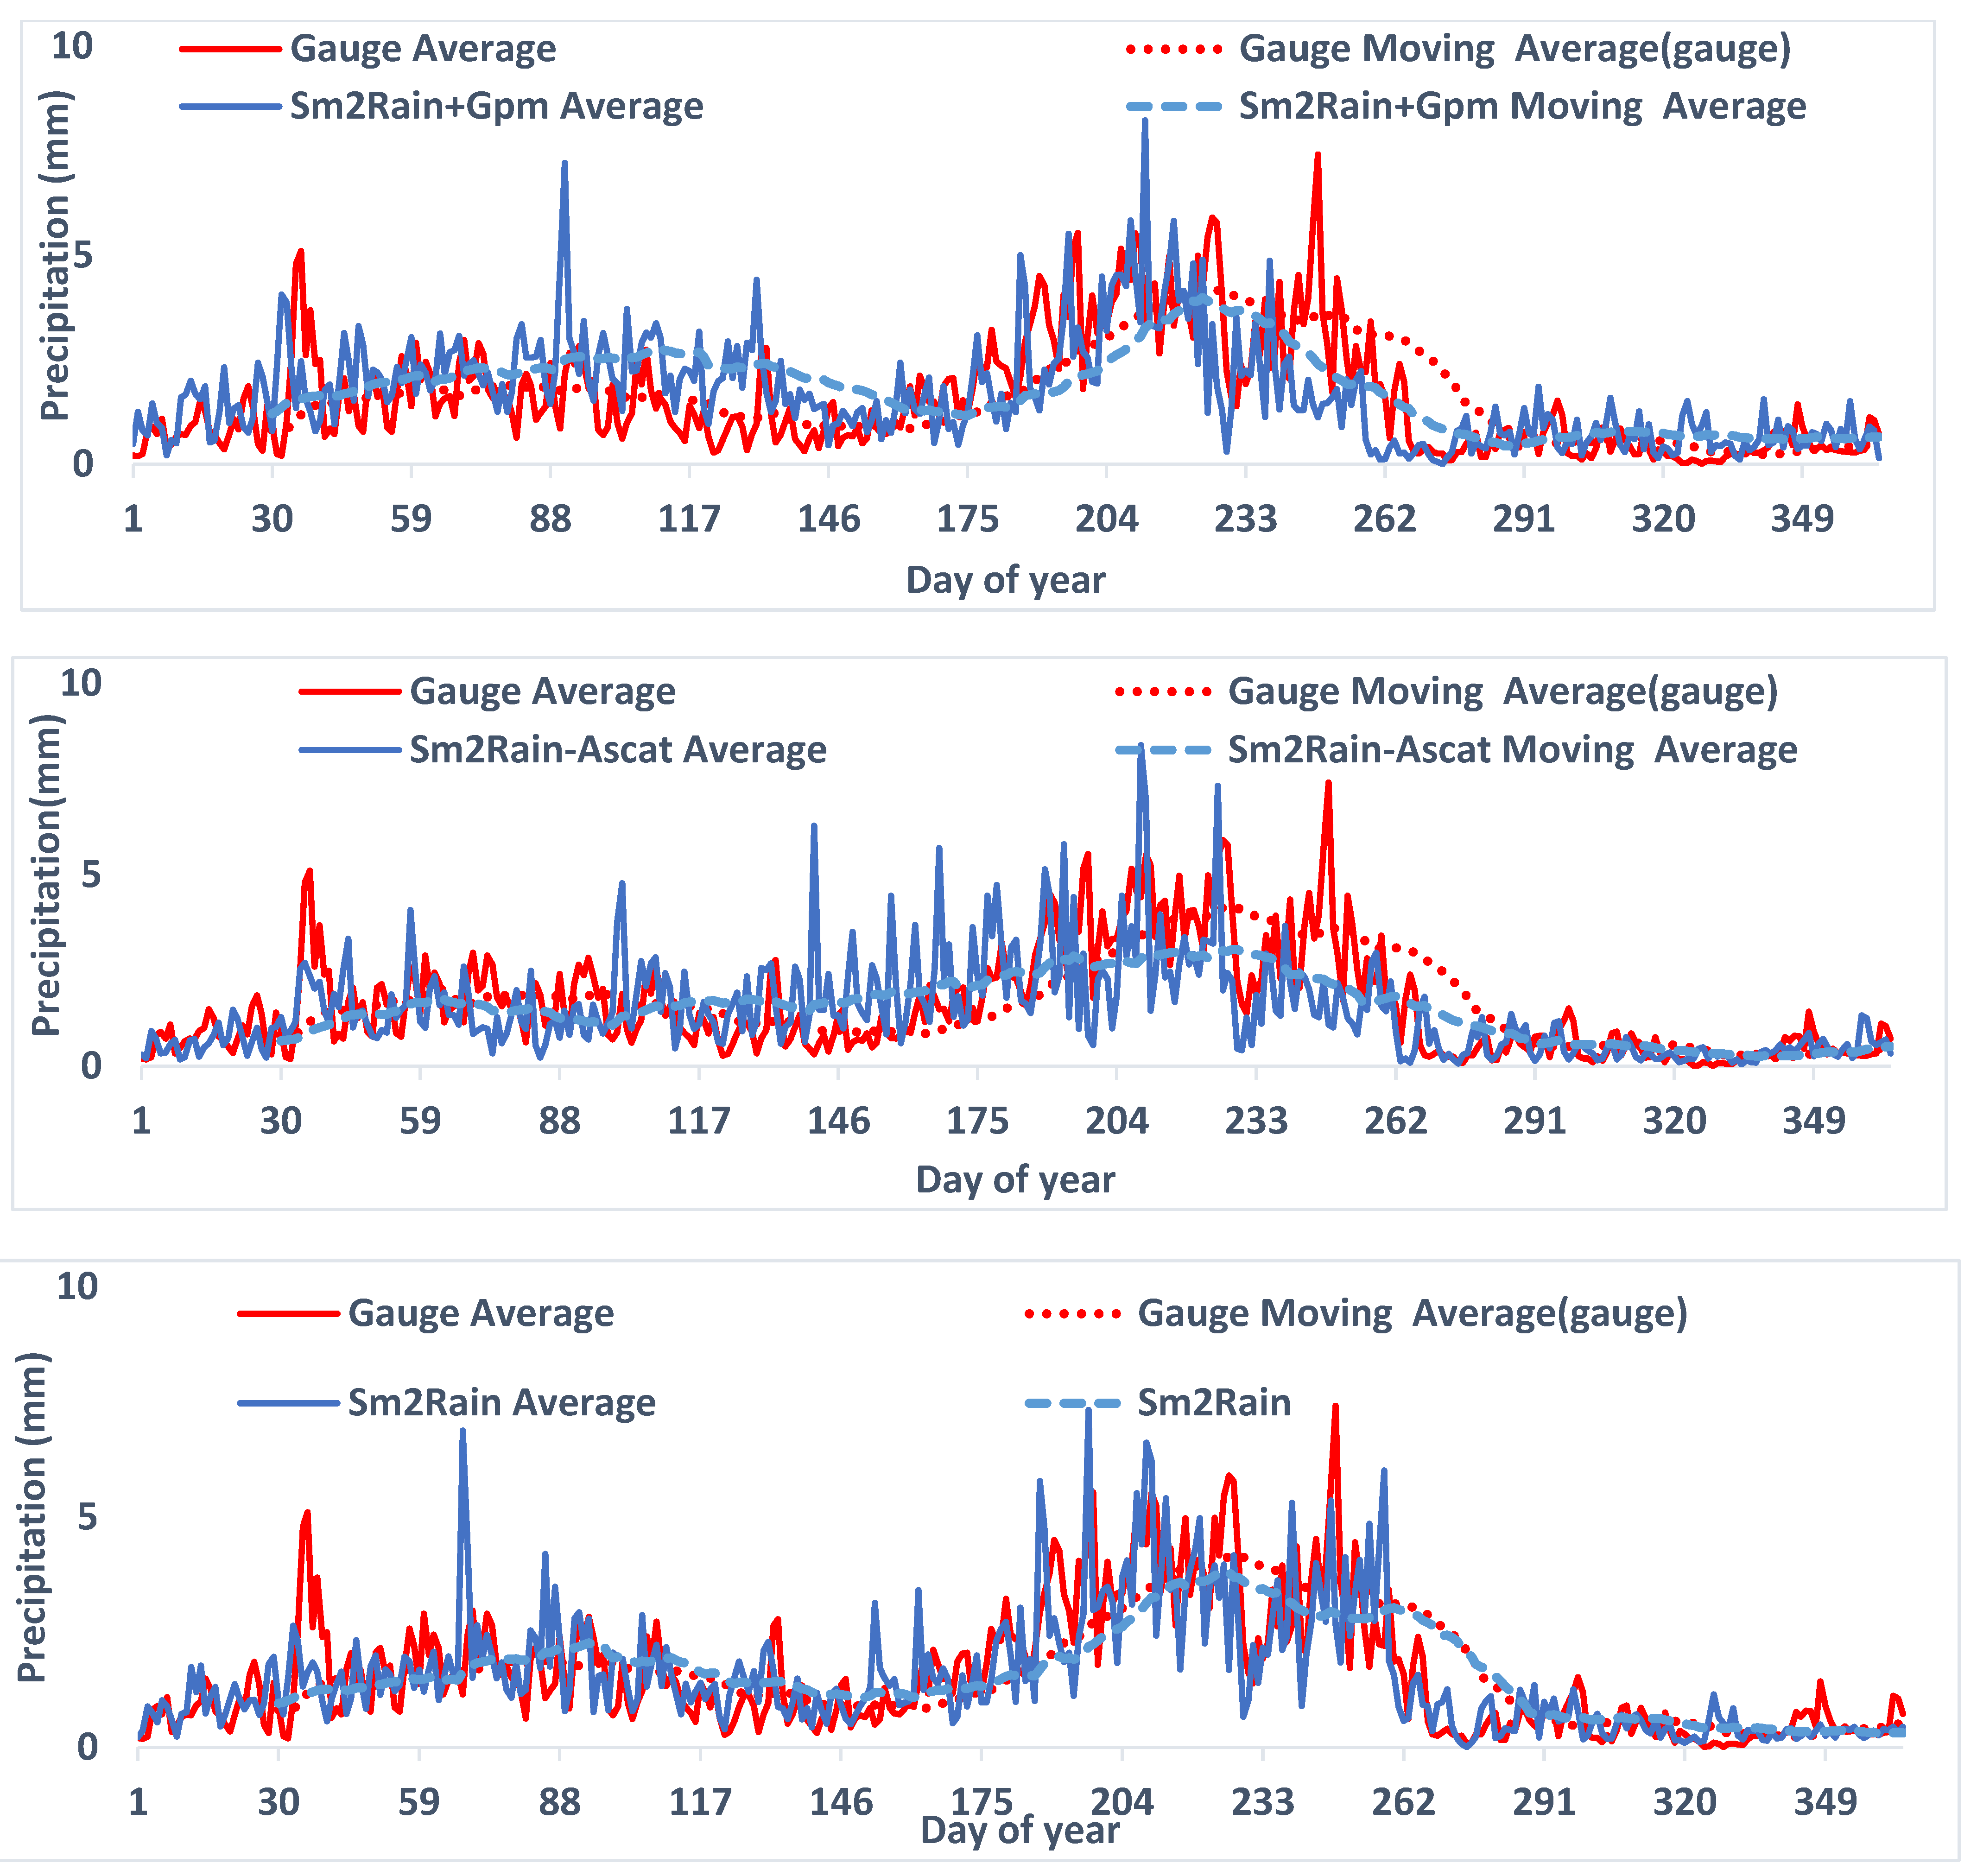
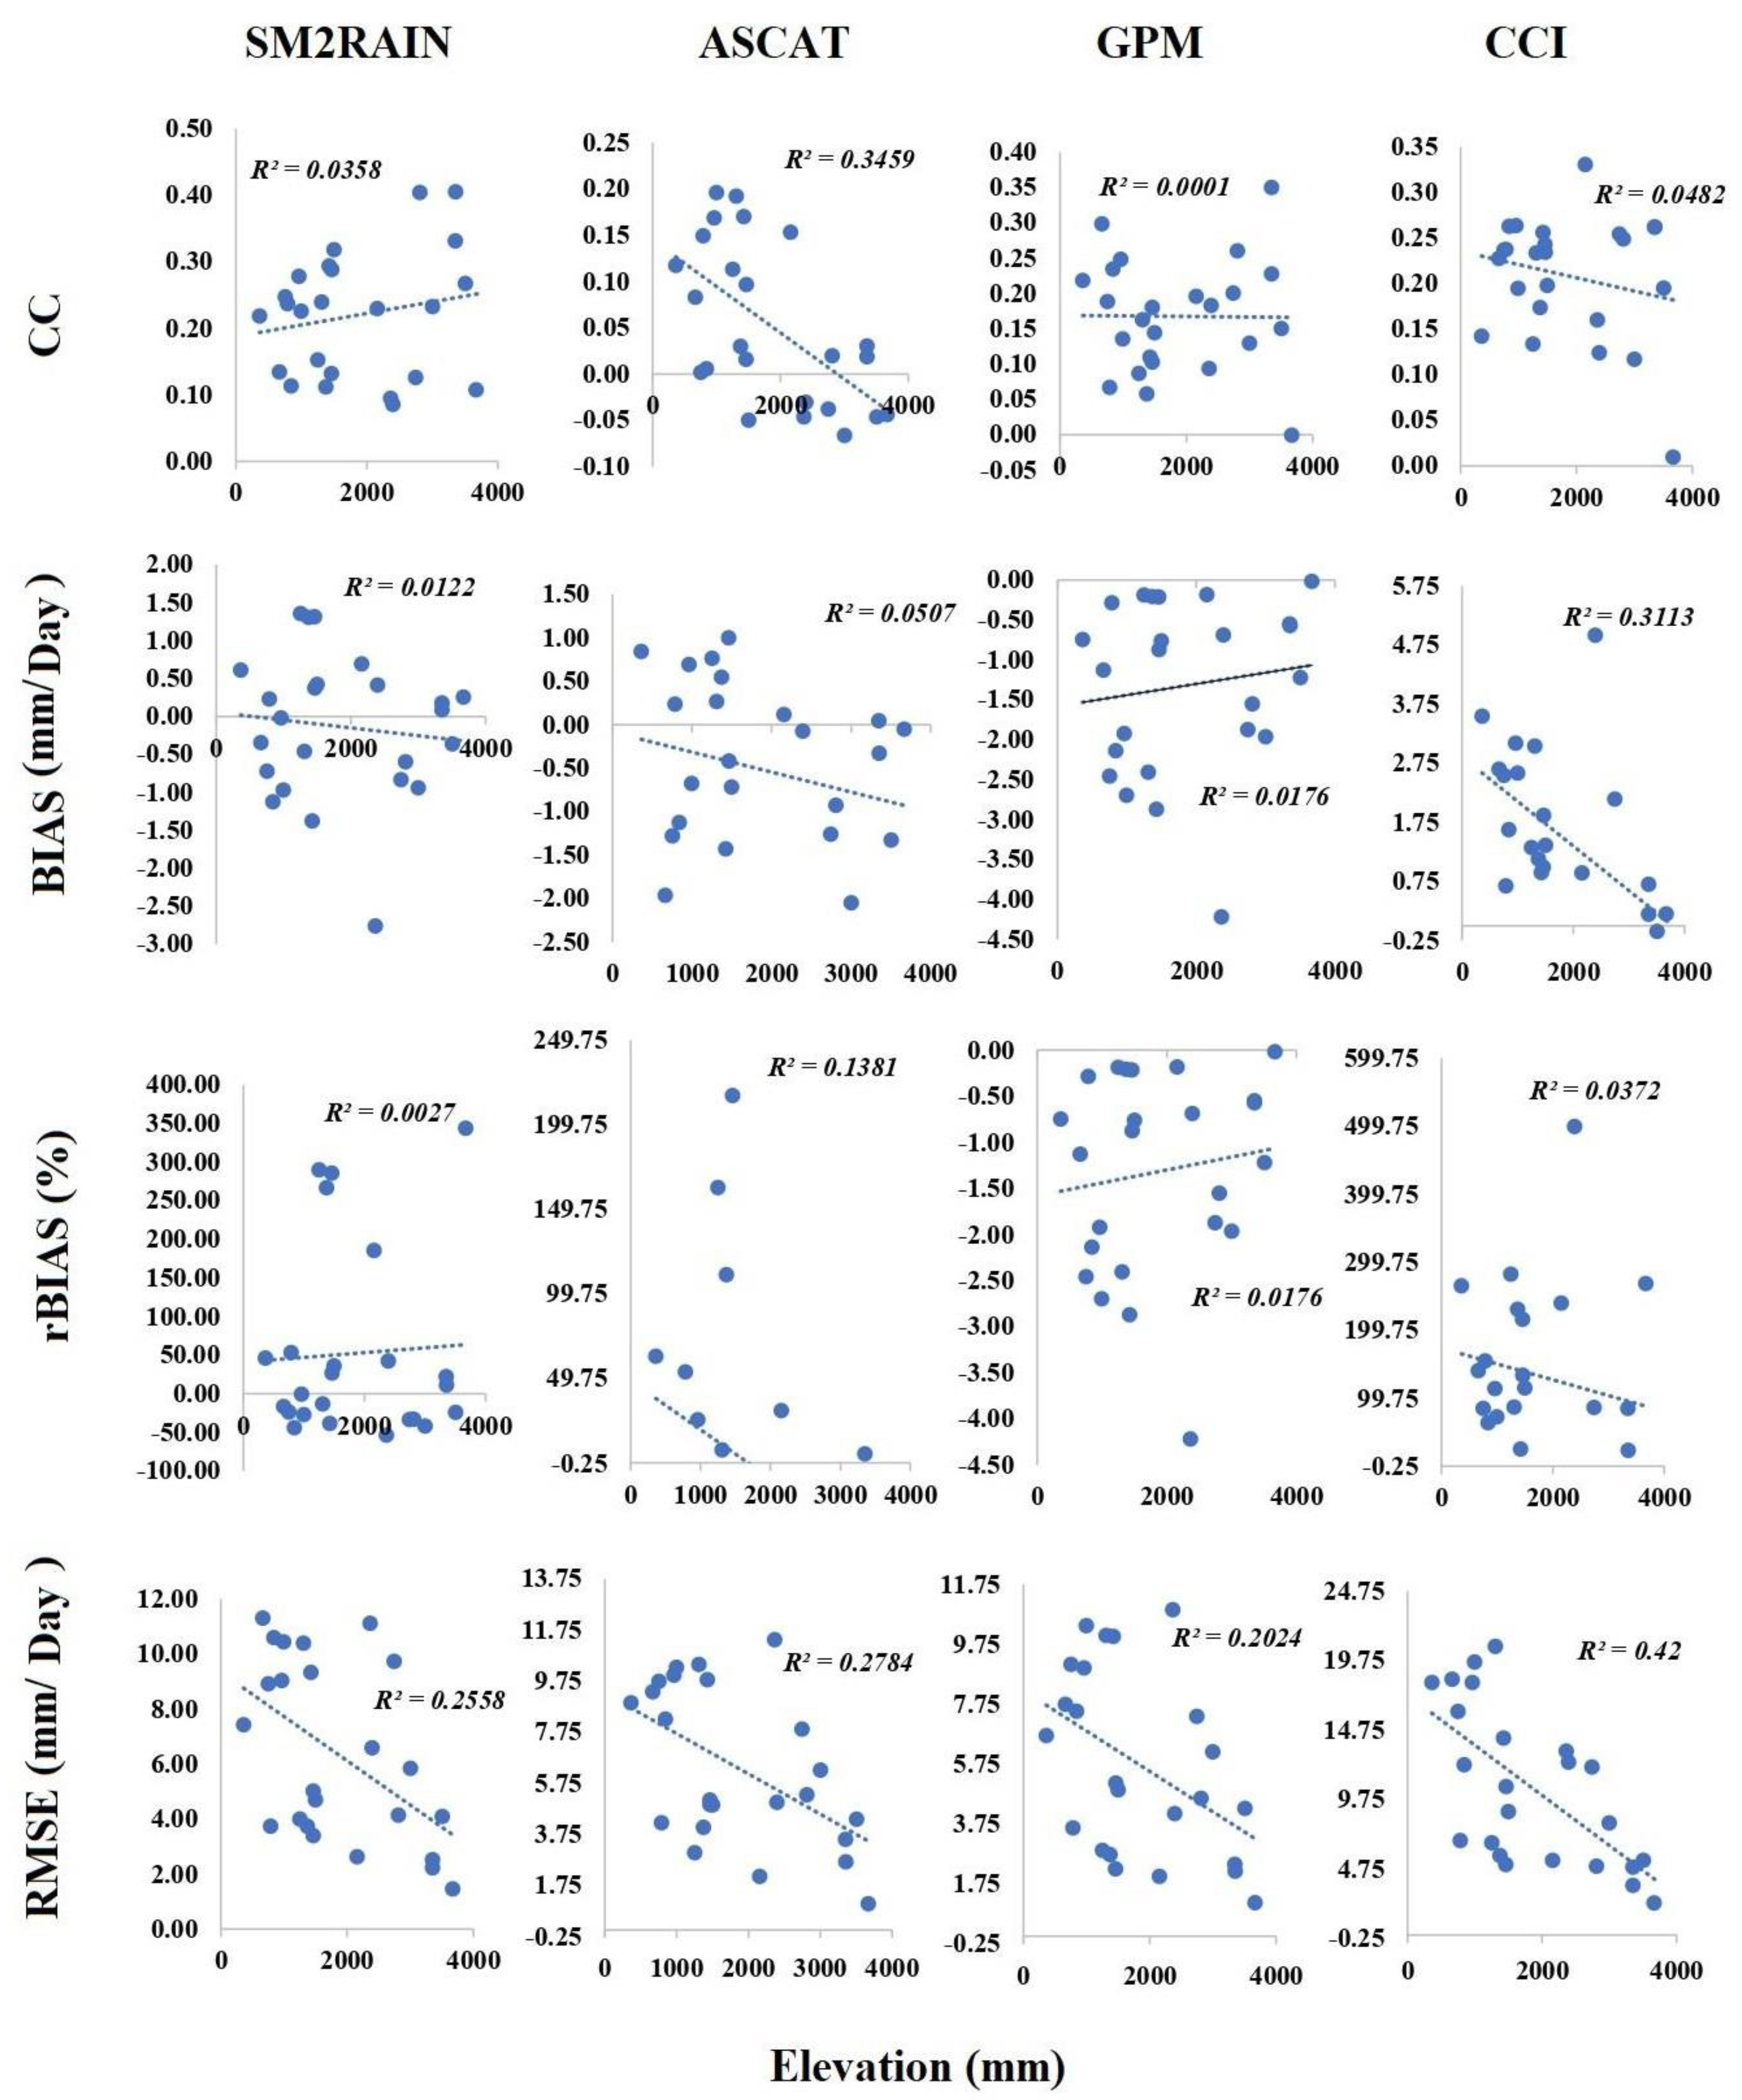
3.3. Uncertainty Analysis of SPPs on Daily Scale

The variation in the estimated CC, BIAS, RMSE, and rBIAS values for four precipitation products on the daily scale is illustrated in Table 4. The GPM products performed better than other precipitation products, as shown by the box plot of CC. By reviewing the BIAS (mm/day) box plot, the products of GPM and ASCAT indicate relatively good performance as compared to other precipitation products. When compared to other precipitation products, the ASCAT product performed fairly well in the plot box of RMSE (mm/day). Taking into account the plot box of rBIAS (%), the ASCAT product performed better than other precipitation products.
Figure 6 evaluates the impact of elevation (mm) of all SPPs (CCI, GPM, ASCAT, and SM2Rain) on a daily basis. However, the CC value of every product taken into consideration was inversely related to elevation. This highlights how poorly precipitation products perform at higher altitudes. The elevation change (mm) typically shows no influence on the value of BIAS (mm/day). Additionally, it was noted that as elevation increased, the error in all product predictions grew. That could occur as a result of the challenging topography at higher altitudes. The value of 𝑅2 = 0.42 is higher in CCI at RMSE (mm/day).
Figure 7 shows the spatial distribution of CC for all SPPs products (SM2Rain, GPM, CCI, and ASCAT). Throughout the entire study zone, the elevation indices have witnessed a wide range of variations. There were significantly fewer variations in the CC values across the full spatial domain for all SM2Rain products, based on the spatial variation of CC. Compared to other items, the CCI and GPM’s CC values fluctuated more drastically. The higher value of CC represents the region of the country that has higher precipitation rates. The product of ASCAT indicates a better performance than the other products, as demonstrated by the higher value of CC.
Figure 8 shows the spatial distribution of BIAS (mm/day) for all SPPs products (SM2Rain, GPM, CCI, and ASCAT). Throughout the entire study region, the elevation indicators have experienced a wide range of variations. All products in the CCI family exhibited much lower fluctuations in their BIAS values across the entire spatial domain, according to the spatial variation of BIAS. Compared to other products, the ASCAT and GPM had a wider range of BIAS values. The product of SM2Rain indicates a better performance than the other products, as demonstrated by the higher value of BIAS (mm/day).
Figure 9 shows the RMSE (mm/day) geographical distribution for all SPPs products (SM2Rain, GPM, CCI, and ASCAT). All across the entire study zone, the elevation indicators witnessed a wide range of variations. All GPM family products’ spatial RMSE fluctuation displayed considerably less variation in their RMSE values throughout the entire spatial domain. The product of SM2Rain indicates a better performance than the other products, as demonstrated by the higher value of RMSE (mm/day). The RMSE value varied more widely in the CCI and ASCAT as compared with other products.

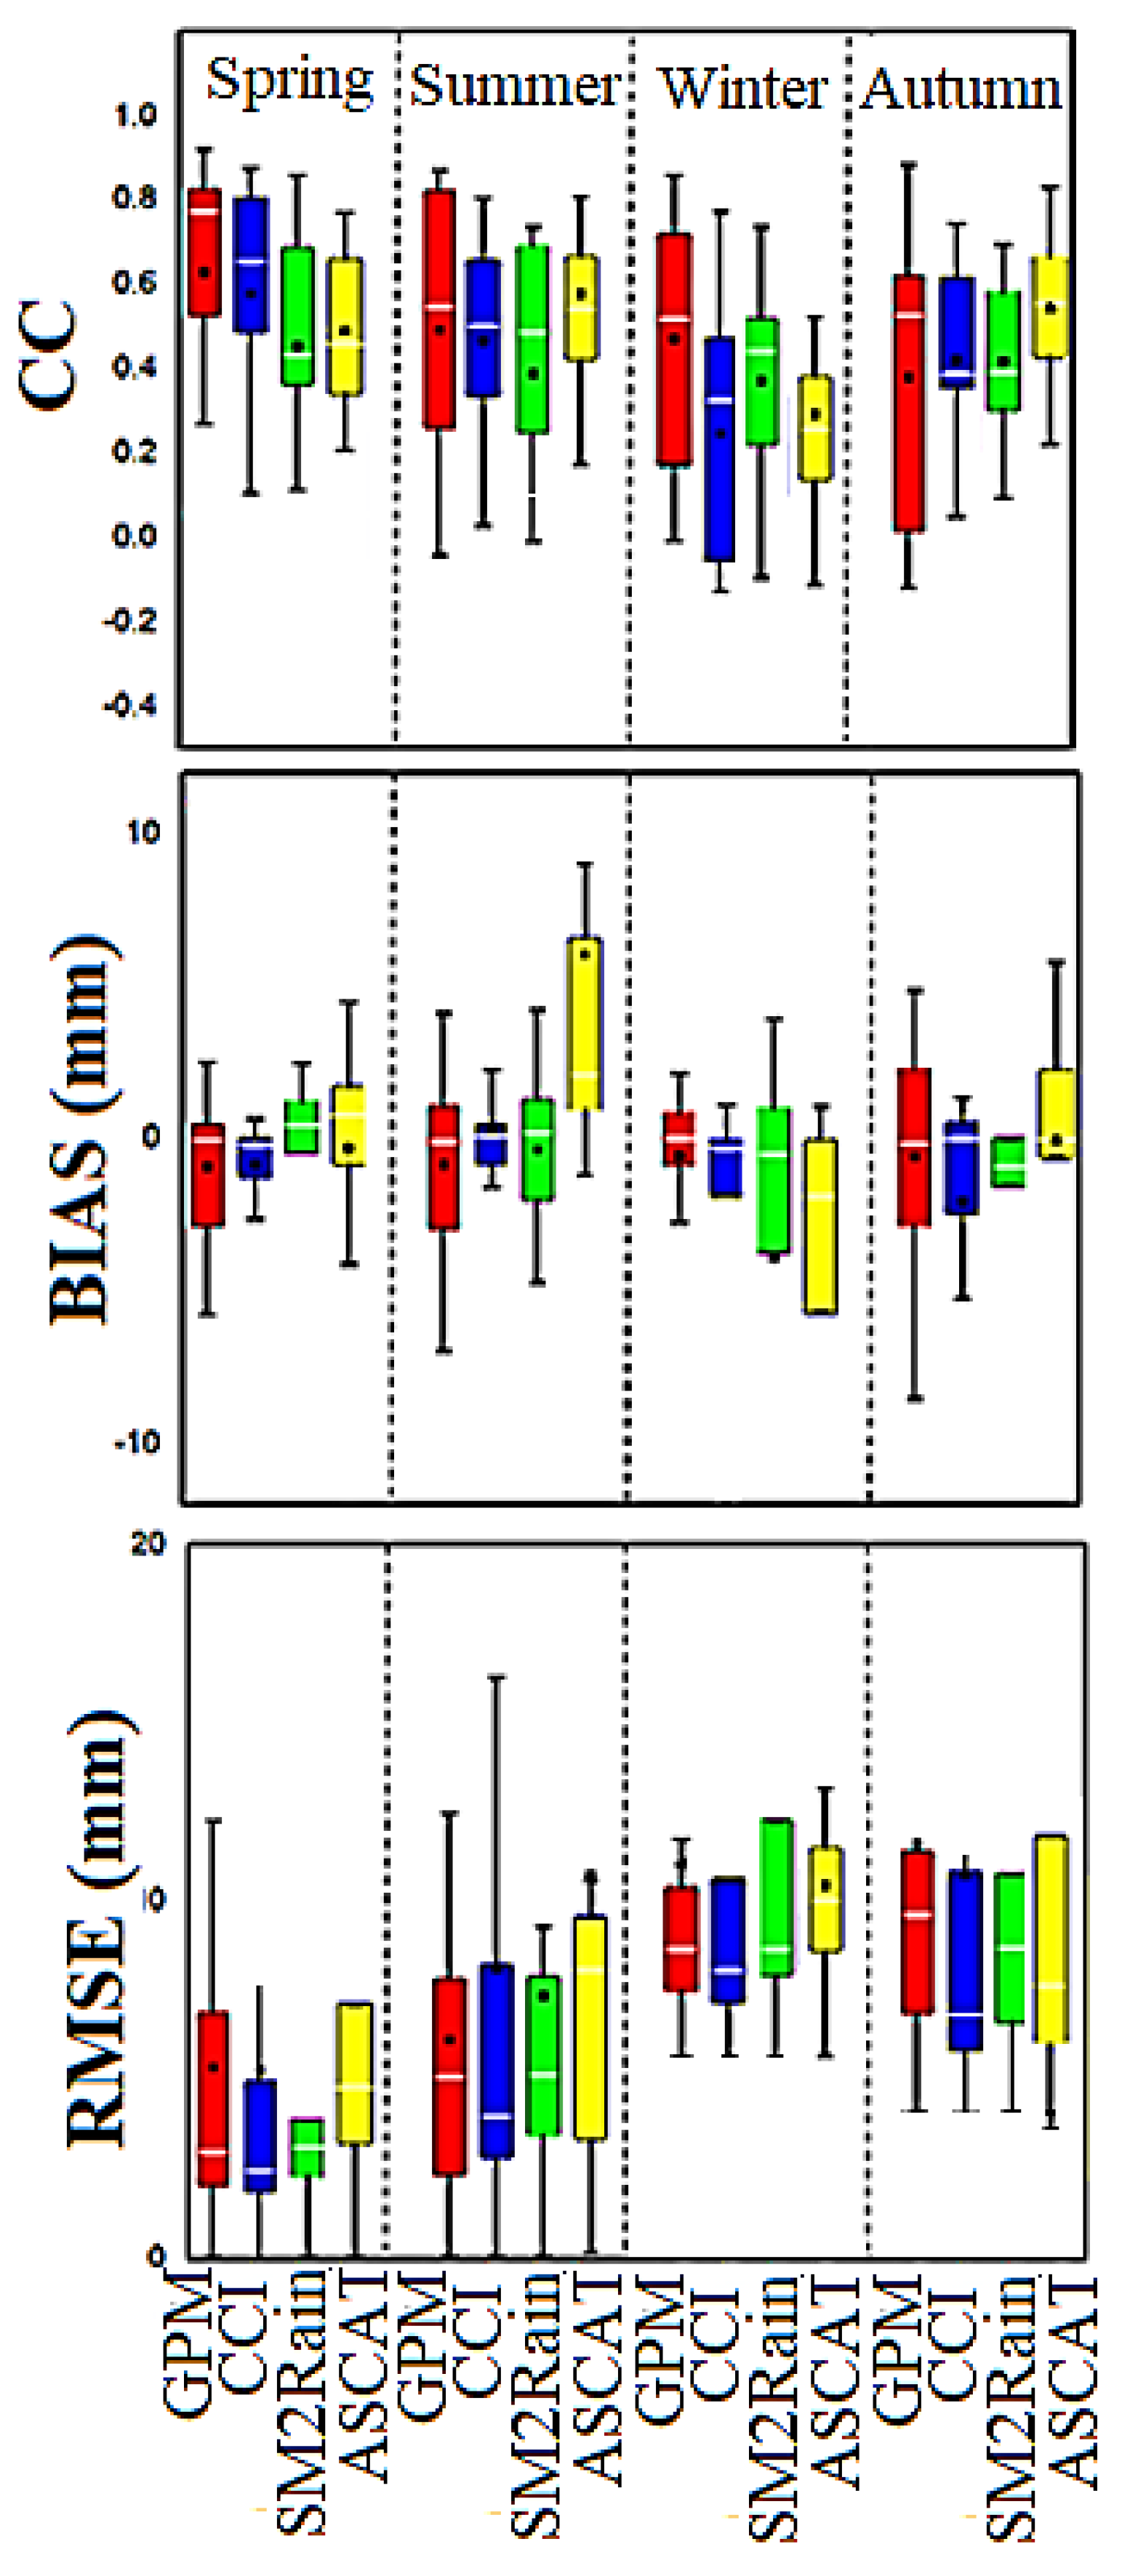
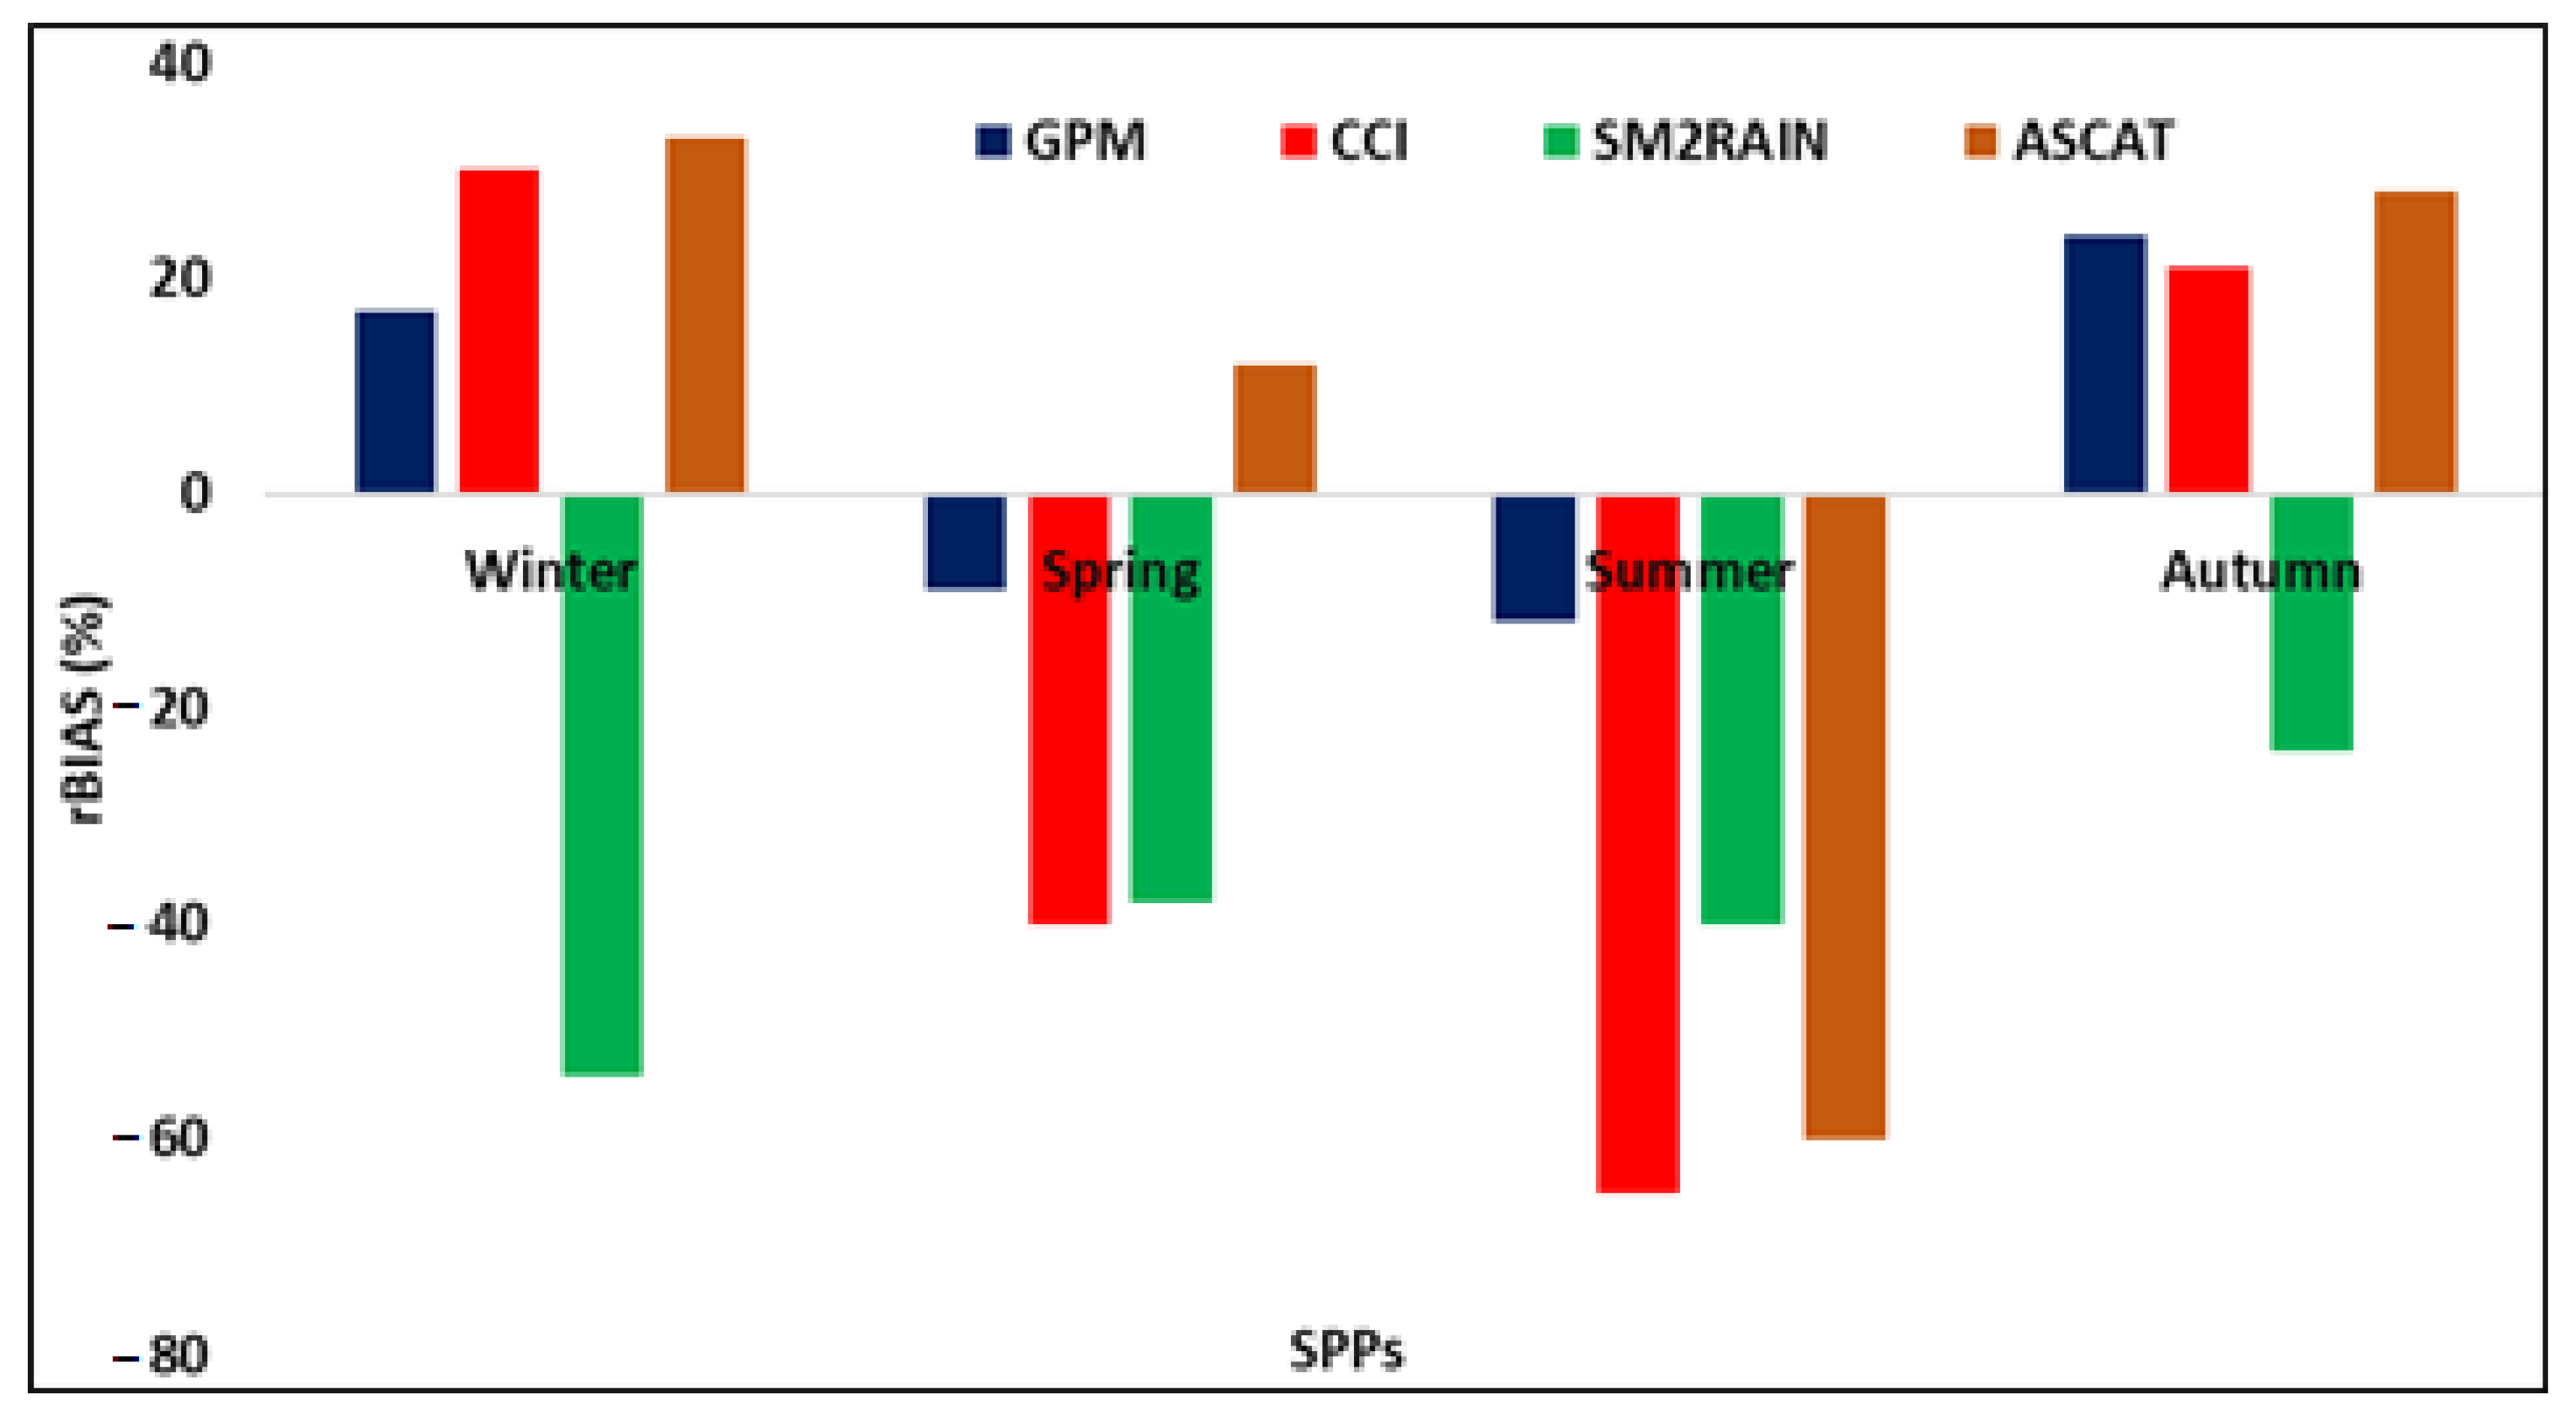
3.4. Uncertainty Analysis of SPPs at Seasonal Scale

Figure 10 indicates the box scheme of all evaluation indices at seasonal scale. When compared with other products in all seasons, the CCI product showed good performance in the box scheme of CC. As compared to similar products, the ASCAT product displayed good performance throughout the spring season and relatively low performance during the summer, according to the box scheme of BIAS (mm). In comparison to other datasets, the GPM product showed considerably better performance during the summer, whereas the CCI product showed poor performance during the autumn.
The seasonal variations of rBias (%) determined for all SPPs (GPM, CCI, ASCAT, and SM2Rain) are shown in Figure 11. The SM2Rain products demonstrated the best performance over the winter, as evidenced by the lowest value of rBias. Moreover, the ASCAT reveals that performance is at its lowest during the winter and autumn seasons, with overestimation values exceeding 30% (rBias). All precipitation products for the summer season indicated a precipitation amount underestimation. Only the GPM product revealed rBias values that were within accepted limits (10%) during this season. All seasons’ precipitation amounts were underestimated according to SM2Rain, with the winter season scoring the worst (underestimation >55%). All seasons, barring summer, show overestimation according to the ASCAT product, with rBias values that are generally acceptable (>10%).

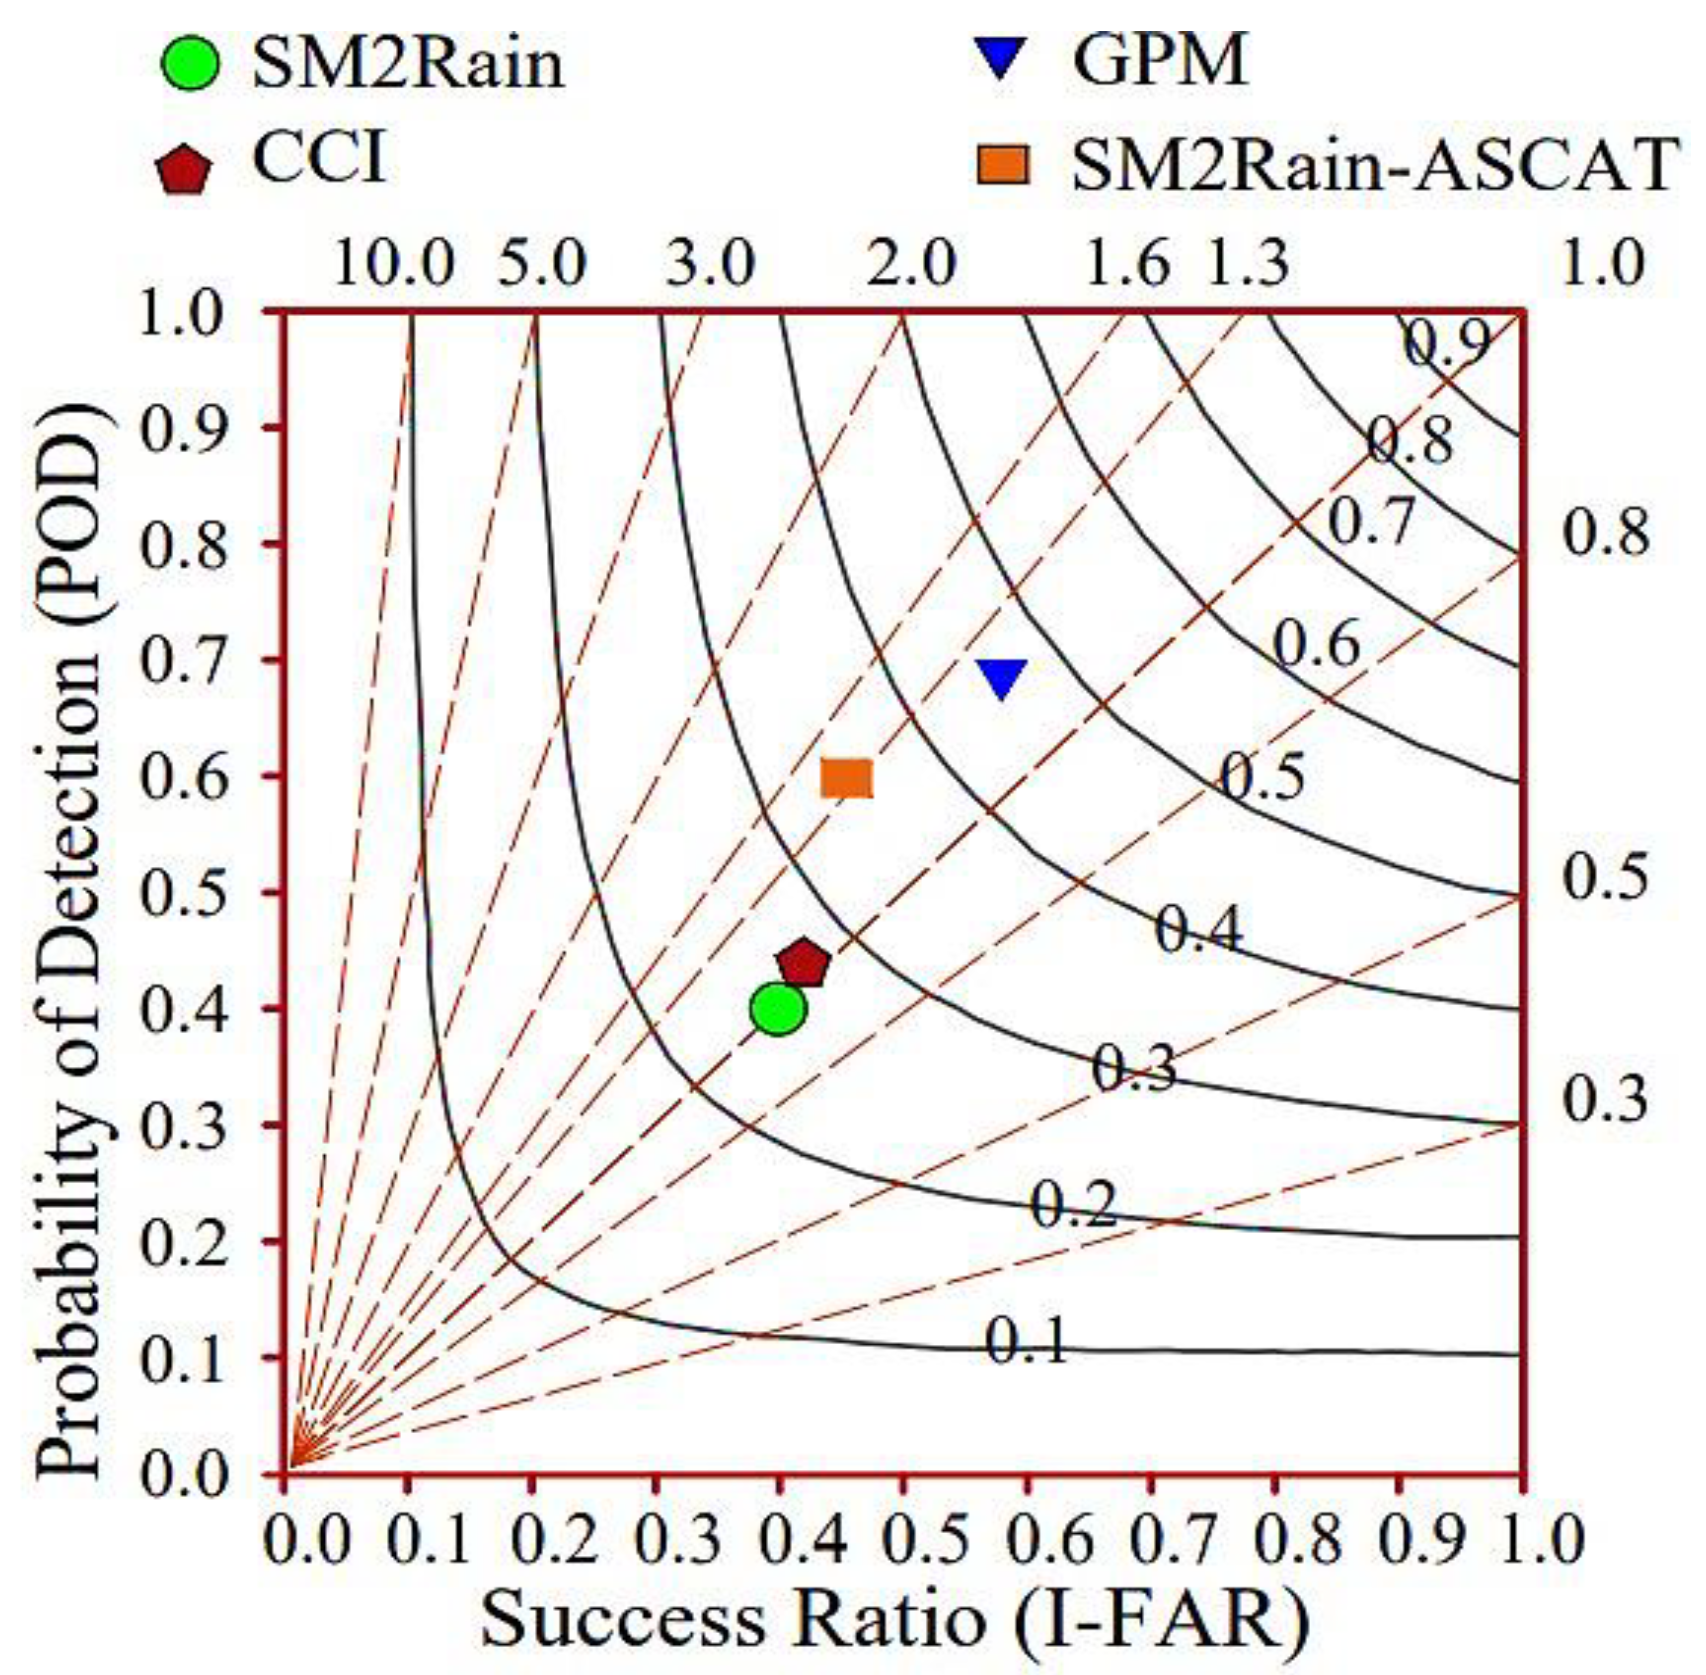
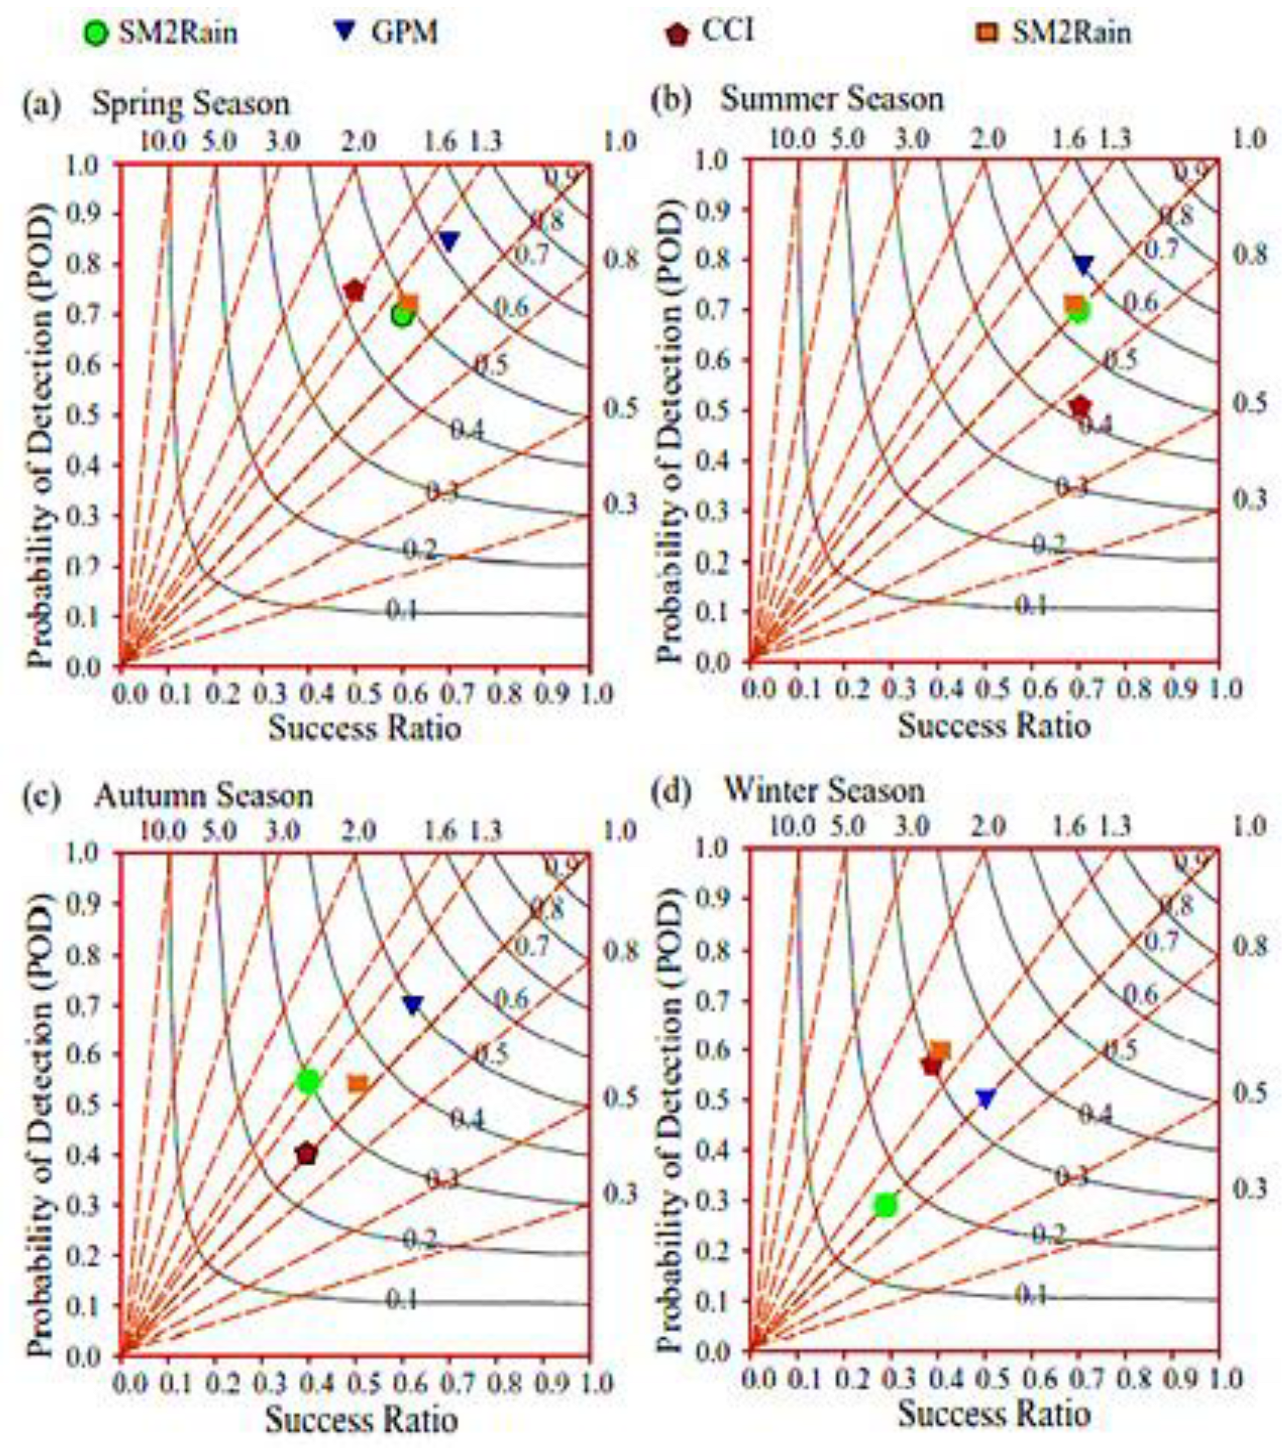
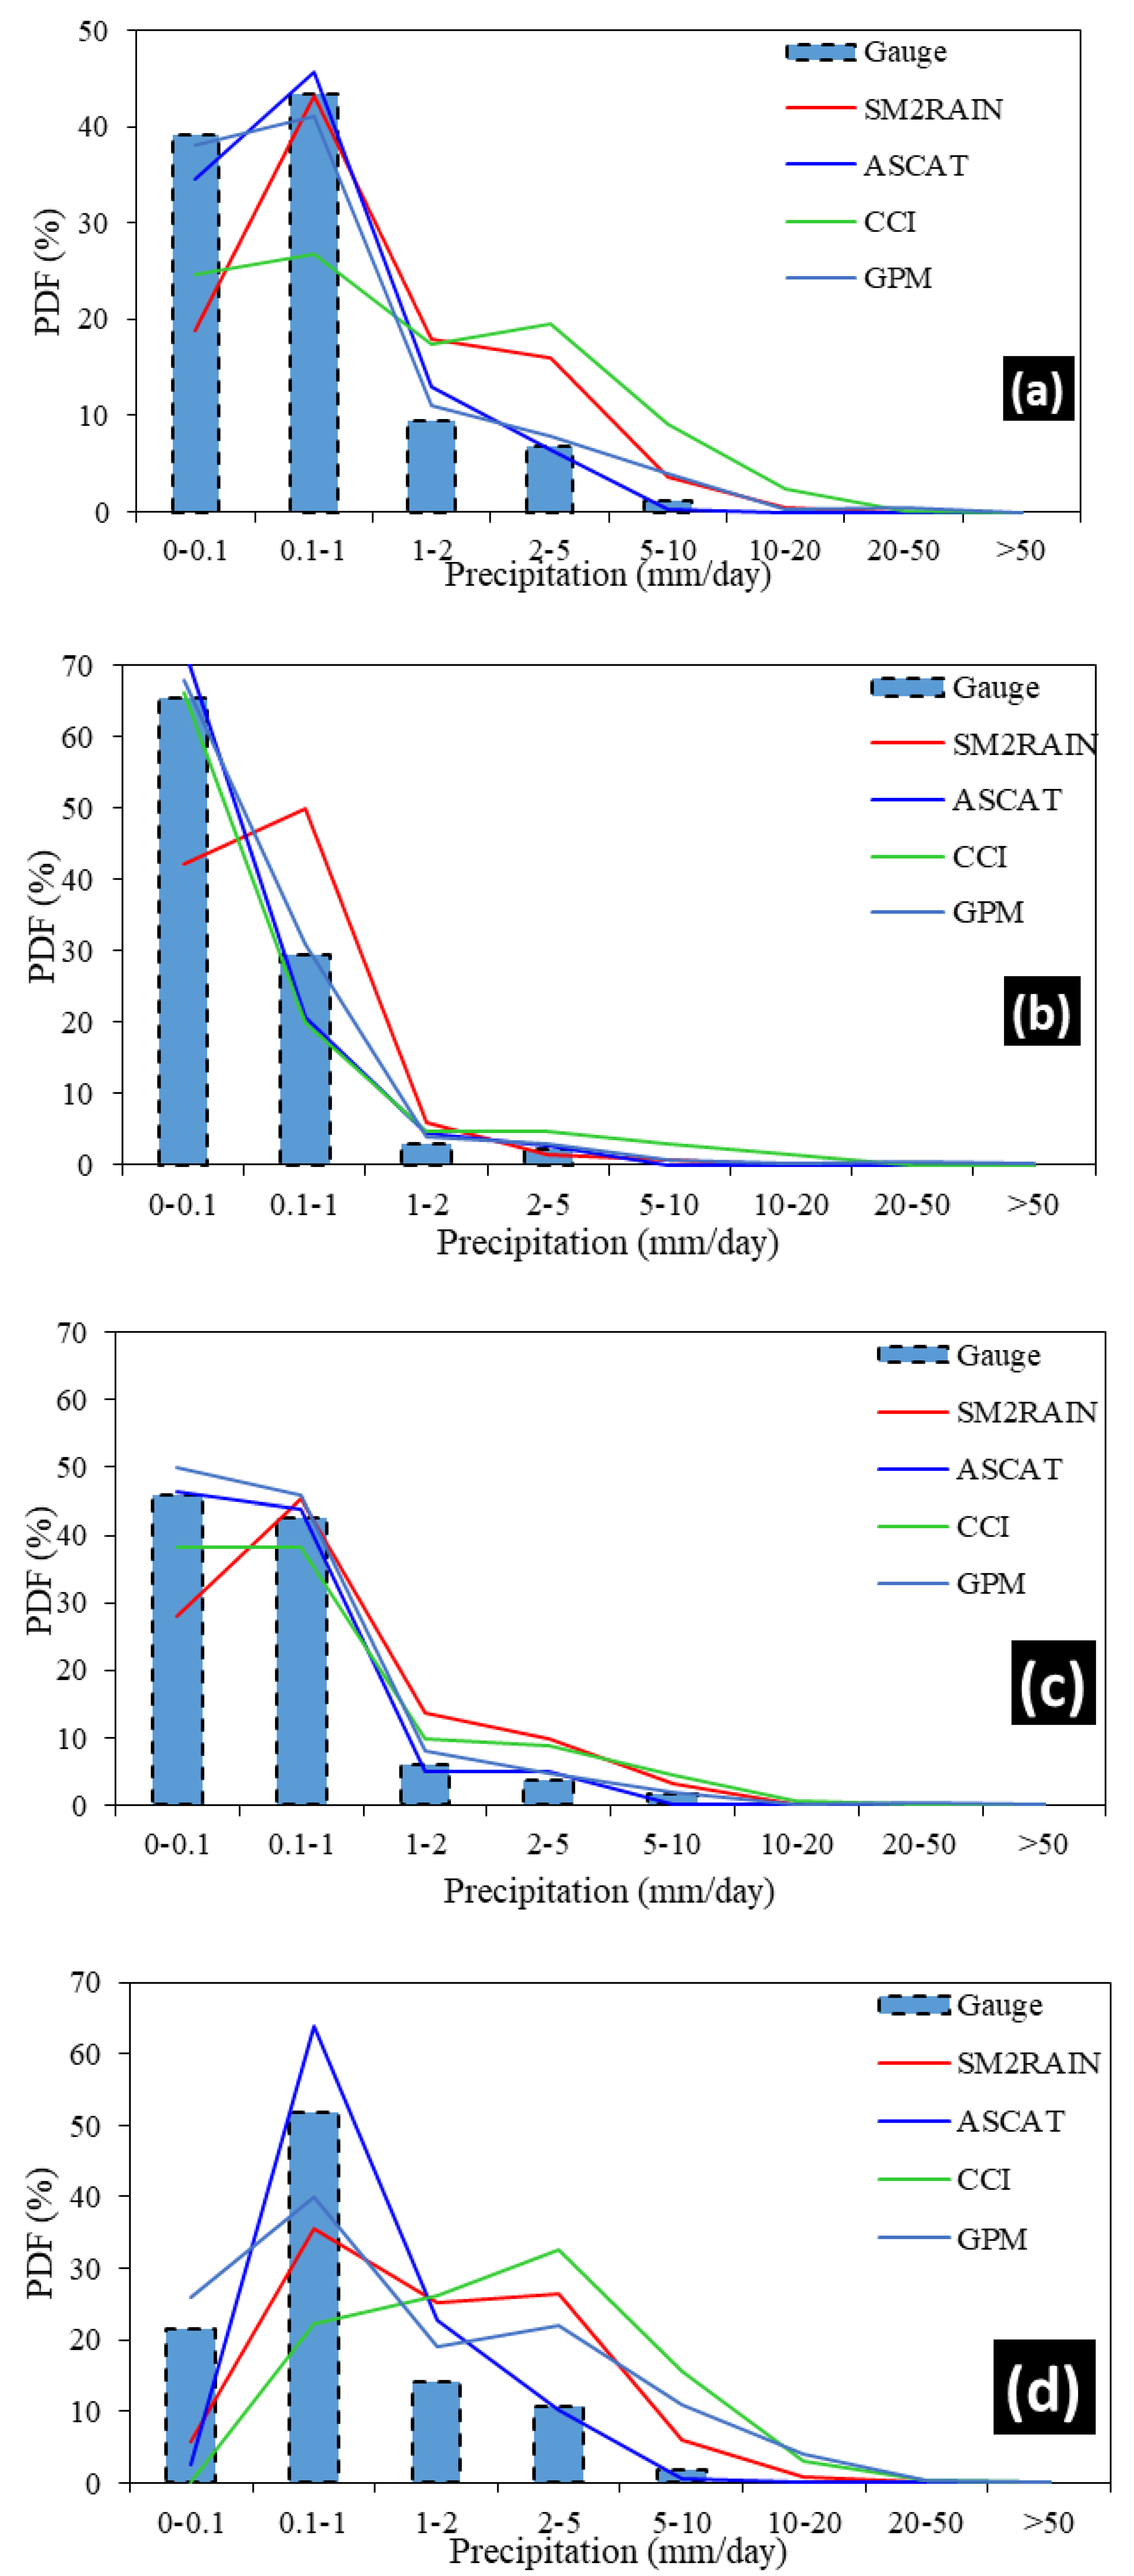
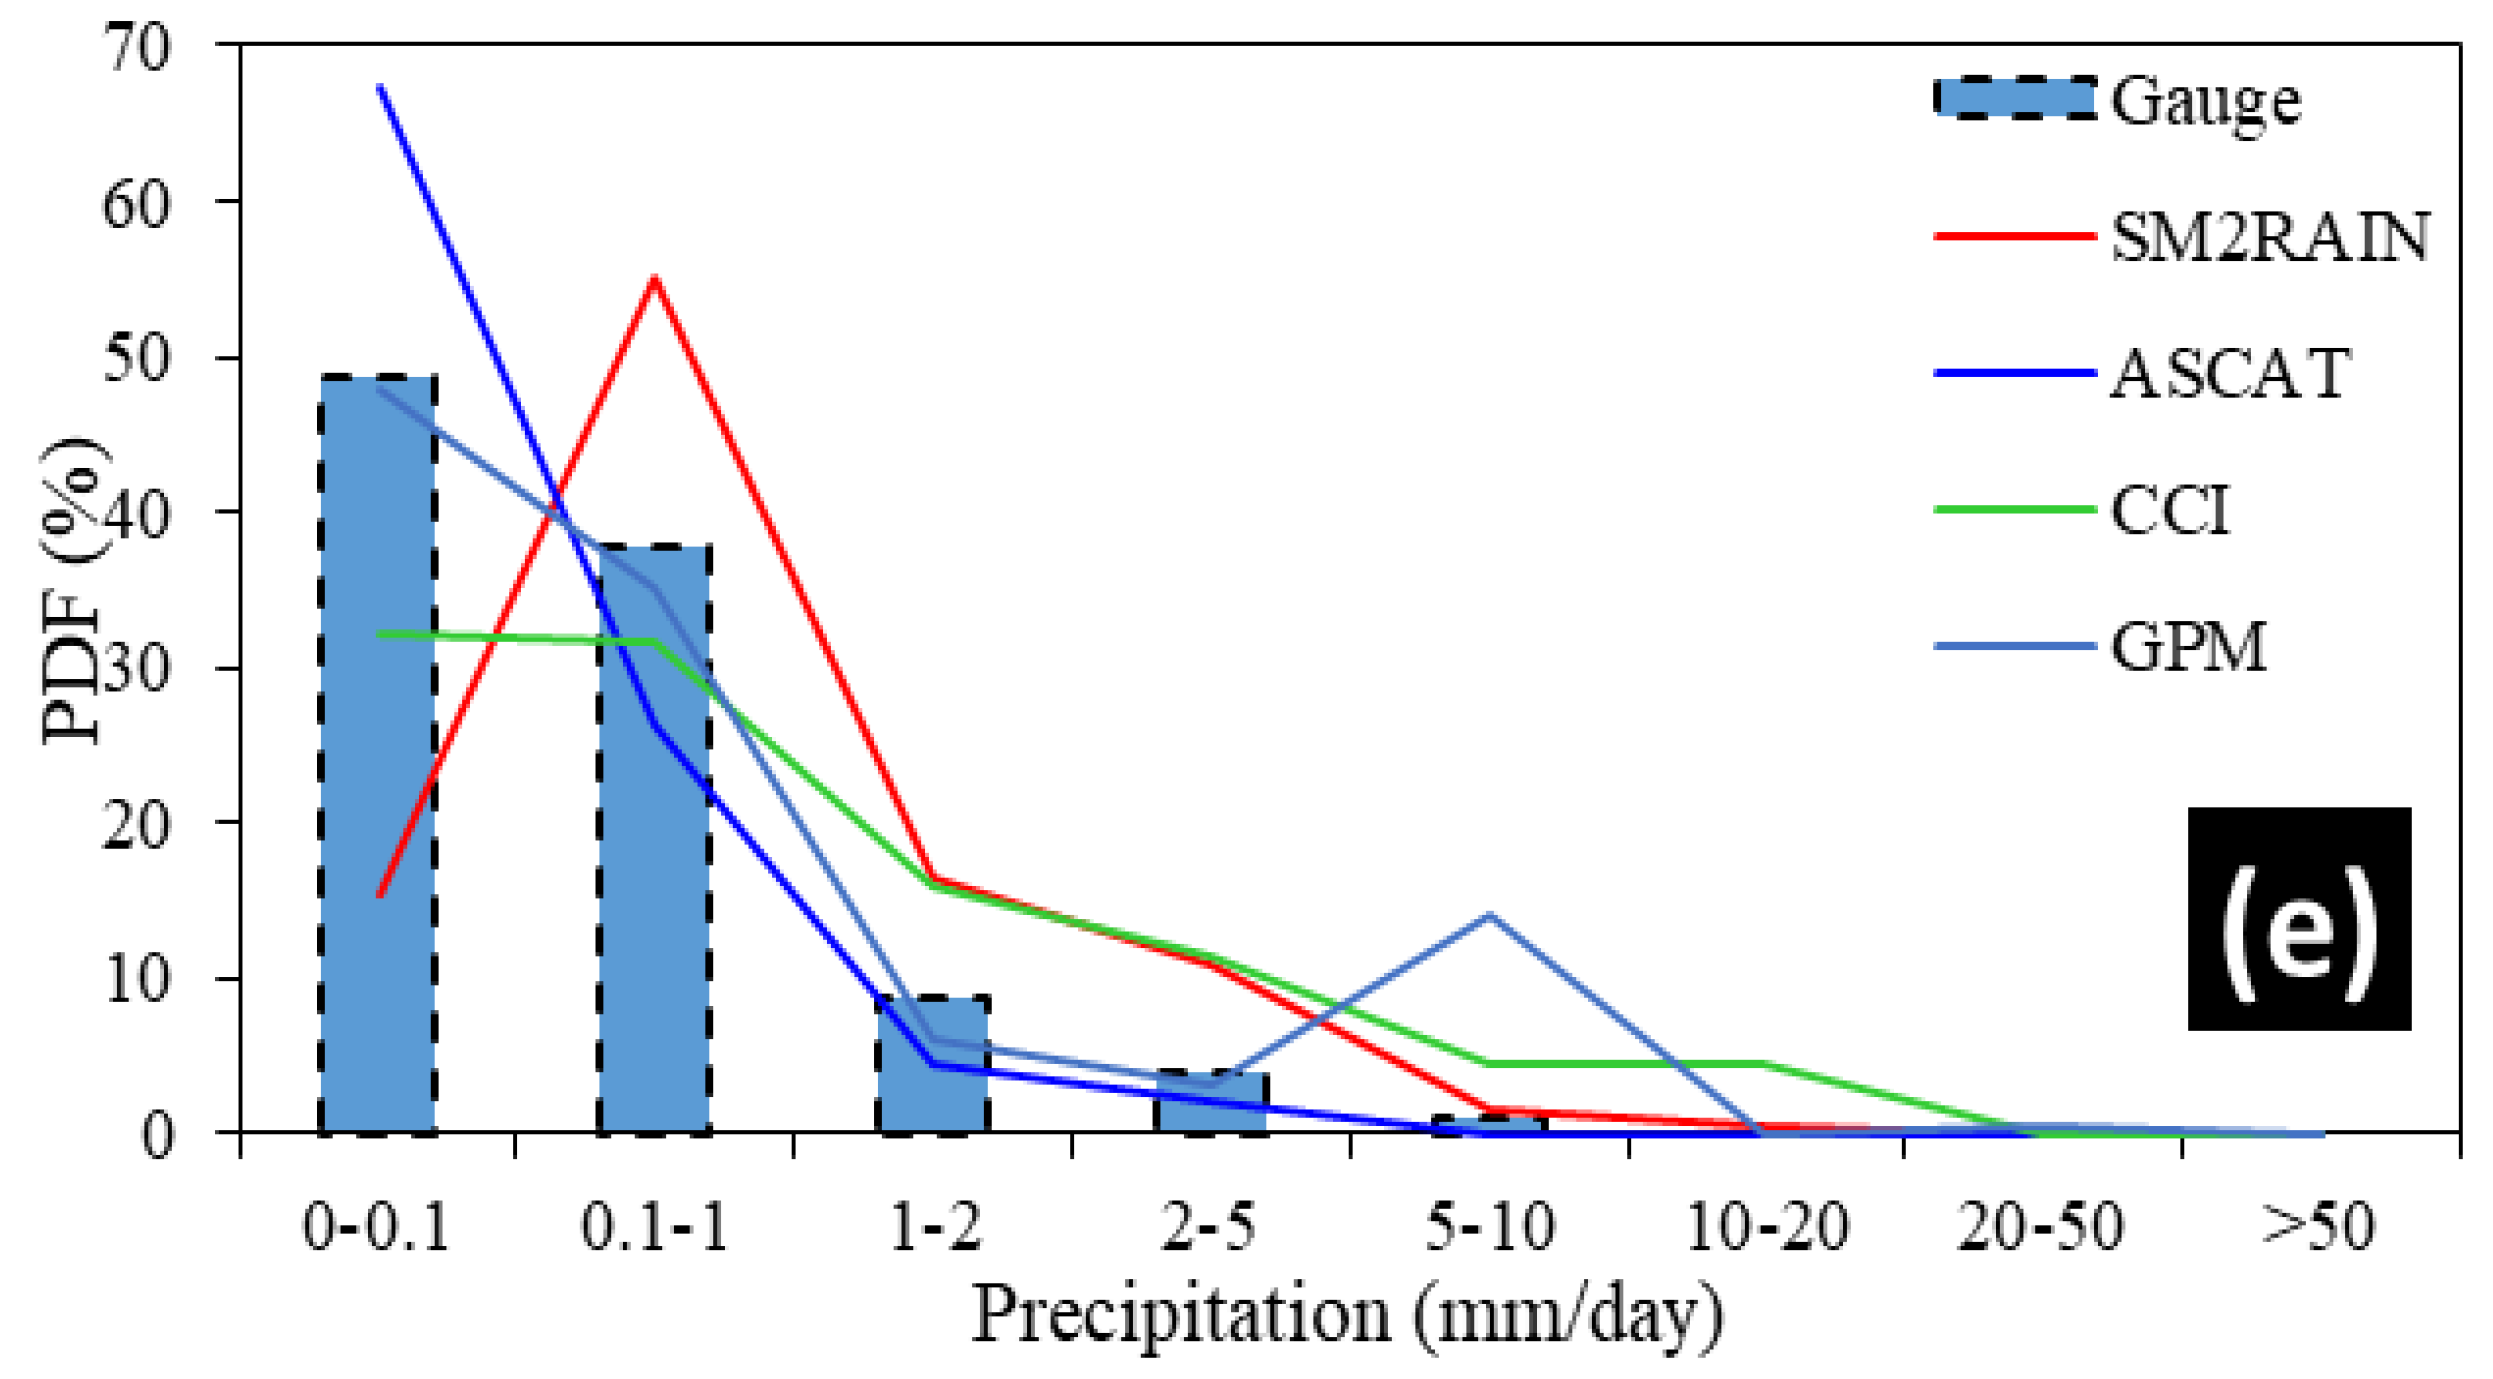
3.5. Probability Density Function (PDF) and Performance Diagram of All SPPs to Track Precipitation Events

The ability of all examined precipitation products in Pakistan is visualized in Figure 12 in terms of probability of detection (POD). Roebber used classified indices to develop the performance diagram for evaluating the results of the categorical indices. This illustrates the spatial relationship among reference gauges and SPPs. The statistics graphic illustrates how various precipitation products behaved under various topographical and climatic environments. The calculated POD value for SM2Rain, GPM, CCI, and SM2Rain- ASCAT was 0.41, 0.68, 0.43, and 0.61, respectively. The GPM shows the maximum POD, demonstrating that the product showed good capacity to recognize the existence of precipitation. SM2Rain and SM2Rain-ASCAT products seemed to have the lowest probability of detection (POD) when compared to the other products, but they efficiently depicted the observed precipitation with a high rate of success.
Figure 13 shows capability of all SPPs (SM2Rain, CCI, GPM, and SM2Rain-ASCAT) to accurately detect the seasonal precipitation. GPM outperformed the competition in all seasons aside from winter in terms of its capacity to detect the presence of precipitation (POD values of 0.82 in spring, 0.79 in summer, and 0.69 in autumn). The spring and summer seasons both had good Probability of Detection POD values for SM2Rain-ASCAT (POD = 0.71 and 0.69, respectively). In the winter season, SM2Rain’s performance was mediocre (POD = 0.29). Both the spring (POD = 0.73) and the winter season (POD = 0.58) witnessed good POD for CCI.
Figure 14 illustrates the probability density function (PDF) of the recorded daily precipitation data of precipitation products (obtained from the gauging stations) (SM2Rain, ASCAT, and CCI). SM2Rain products indicate underestimation of light precipitation (0–1 mm/day) events but overestimated the moderate and heavy precipitation (1–20 mm/day) events. The ASCAT products show underestimation at light precipitation (0–0.1 mm/day) events and indicate overestimation at moderate and heavy precipitation (0.1–15 mm/day) events. The CCI product indicates underestimation at light precipitation (0–1 mm/day) events and shows overestimation at moderate and heavy precipitation occurrences (1–50 mm/day).
Figure 14 evaluates the Probability Density Function of SPPs (SM2Rain, ASCAT, and CCI) estimated for different intensities of (a) winter, (b) spring, (c) summer, and (d) autumn precipitation in Pakistan. In winter season, the SM2Rain products showed the underestimation of light precipitation events. Conversely, the ASCAT product showed overestimation at light precipitation events. In terms of its effectiveness during this season for detecting the occurrence of precipitation events in Pakistan, the CCI product surpassed all other products. The performance of ASCAT products is superior to alternative products during the spring season. In particular, neither of the other products correctly described the mild to moderate precipitation events during this season. The CCI product completely failed to depict the occurrences of light-to-heavy precipitation events during the summer. The IMERG product was competent at analyzing the occurrences of light-to-heavy precipitation events during the autumn season.

4. Discussion

All SPPs estimations were evaluated against the in-situ gauge data on daily, monthly, seasonal, and yearly scales, over the whole spatial domain, and on the point-to-pixel scale. The uncertainty analysis of selected SPPs showed that their accuracy completely depends upon the in-situ topographical and environmental conditions. Previously, numerous researchers assessed the accuracies of many SPPs (SM2Rain, GPM-SM2Rain, CCI, ASCAT, and IMERG) over different parts of the earth [10,17,18]. The results of previous studies also indicated that the performance of SPPs was strongly influenced by the topography and climatic conditions of the study area [32,33,34]. For instance, Nadeem et al. [22] assessed the variety of SPPs over diverse topographic and climatic conditions. The findings of their study also documented that the accuracy of satellite precipitation products showed significant variation with respect to in-situ topography and climatic conditions. Hamza et al. [24] compared the multi satellites along with SM2Rain-ASCAT over the mountainous domain of the semi-arid zone. All products were completely influenced by local topography. The evaluation indices (CC, BIAS, rBIAS, RMSE) also showed significant variability caused by local topographic and climatic conditions [35].
The satellite-based precipitation products GPM-SM2Rain and SM2Rain were proficient in assessing the spatial variability of precipitation over the Pakistan range. This might be caused by the better morphing retrieval algorithm of these products. Moreover, through the development of in-situ networks of remote sensing sensors and advanced and powerful retrieval algorithms, SM monitoring has advanced significantly in the last 20 years [36]. Typically, SM data sets are used with hydrological and meteorological models to enhance the simulation of their internal state by using data assimilation techniques. In contrast, precipitation observations serve as the primary input data required for SM modeling. However, all other products were inappropriate with respect to spatial and temporal variation of precipitation over the study area, with similar outcomes found in the previous findings of certain studies [37,38,39]. The temporal estimations of SM2Rain were in better agreement with gauge estimation, which is consistent with the findings of a particular study [10,24]. On a monthly scale, All SPPs estimations were in better agreement with gauge estimations as compared to the daily scale, which is comparable with previously documented studies [22,40,41]. All SPPs performed better on capturing light precipitation events as indicated by Probability Density Function but in the summer season, all SPPs showed a significant amount of over/under estimation with respect to PDF(%) [24]. During the summer season, all SPPs showed underestimation. Nadeem et al. [42] concluded that the correlation coefficient increased with increase in precipitation intensity. On the other hand, the error values dropped with the increase in precipitation intensity, which exactly mirrored the outcome of our new research.
Although the performance of the selected soil moisture-based precipitation is better on the monthly scale and can be employed for hydro-climatic applications, the daily estimations were very poor against the gauge-daily estimations. Therefore, the algorithm retrievals of SPPs should be enhanced by applying advanced techniques and models [9,43,44] (data-driven approaches such as machine learning/deep learning, downscaling of precipitation products, bias correction of SPPs) for more efficient utilization of satellite data. Moreover, sub-daily data were not available in the research, and the lowest temporal scale used in this study to examine the performances of four SPPs was daily resolution. The sub-daily resolution in previously published papers [13,30,45] demonstrated considerable differences in the performance of precipitation products. Therefore, the findings of comparing four SPPs on the sub-daily scale, as well as the findings obtained from those assessments, may be quite different from those obtained on the daily scale.

5. Conclusions

The uncertainty analysis of soil moisture-based precipitation products (SM2Rain, GPM-SM2Rain, SM2Rain-CCI, and SM2Rain-ASCAT) was evaluated on multistate temporal (daily, monthly, seasonal, yearly) and spatial (point to pixel) scales, using 64 in-situ meteorological stations in semi-arid zones (Pakistan). All soil moisture-based satellite products were evaluated from January 2005 to December 2020. The major conclusions of our study are as follows:
  • GPM-SM2Rain was proficient in assessing the spatial variability of precipitation over Pakistan. However, all other products were inappropriate with respect to spatial variation of precipitation over the study area, whereas the performance of SM2Rain-CCI is reasonable.
  • The overall assessment of all selected SPPs was better on a monthly scale as compared to daily scales.
  • The GPM-SM2Rain outperformed all other SPPs in terms of probability of detection on daily and seasonal scales.
  • GPM-SM2Rain had good capturing capacities in all seasons, whereas the performance of all other SPPs is unsatisfactory in all seasons.
  • In humid climatic regions, the SM2Rain performed most reliably with a value of CC >0.7.
  • All SPPs performed better in capturing light precipitation events as indicated by the Probability Density Function.
  • Based on the outcomes of the evaluation indices, the in-situ topographical and climatic conditions substantially influence the performance of SPPs.
The findings of this study showed that GPM-SM2Rain outperformed all others selected SPPs products in the Pakistan region. The correlation coefficient (CC) for GPM-SM2Rainis (>0.70) in both daily and monthly scales was noted. In addition, rBIAS was likewise within the acceptable range (±10). As a result, we recommend the use of both daily and monthly evaluations as a model for hydro-climatic applications in the Pakistan range. Additionally, we advocate that algorithm retrievals of SPPs be improved by the use of deep learning/machine learning methodologies and advanced models for more appropriate applications. The findings of this study will be very useful for hydrologists, meteorologists, SPPs data users, water conservation practices, and policymakers in Pakistan.

Author Contributions

Conceptualization, M.U.N. and M.N.A. methodology, M.A., M.U.N. and B.A.; software, M.H. and G.M.; validation, M.A. and B.A.; formal analysis, M.U.N. investigation, M.U. and M.U.N. resources, M.U.N.; data curation, M.M.J. and M.U.N.; writing—original draft preparation, M.H. and M.U.N.; writing—review and editing, M.U.N. visualization M.U.N.; supervision M.N.A. and T.L.; project administration, M.H.; funding acquisition, T.L. All authors have read and agreed to the published version of the manuscript.

Funding

This study was supported by the Strategic Priority Research Program of the Chinese Academy of Sciences, K.C. Wong Education Foundation (Grant No. GJTD-2020-14), the Third Xinjiang Scientific Expedition Program (Grant No. 2021xjkk1400), Pan-Third Pole Environment Study for a Green Silk Road (Grant No. XDA20060303), the CAS Interdisciplinary Innovation Team (Grant No. JCTD-2019-20), the CAS Research Center for Ecology and Environment of Central Asia (Grant No. Y934031), the Regional Collaborative Innovation Project of Xinjiang Uygur Autonomous Regions (Grant No. 2020E01010) and the Third Xinjiang Scientific Expedition Program (Grant No. 2021xjkk1400). A special acknowledgement should be expressed to the China–Pakistan Joint Research Center on Earth Sciences that supported the implementation of this study.

Institutional Review Board Statement

Not available.

Informed Consent Statement

Not available.

Data Availability Statement

Not available.

Acknowledgments

This work is financially and technically supported by the Pakistan Agriculture Research Council (PARC) under the Research and Skill development component of the PSDP Mega Project for enhancing a command area of small and mini dams in the Barani area of Pakistan (Grant No. PSDP-9112). The Pakistan meteorological department (PMD) and water and power development authority (WAPDA) are also acknowledged for providing precipitation gauge data.

Conflicts of Interest

There is no conflict of interest to discuss.

Appendix A

Table A1. Salient features of meteorological stations.
Sr. No.StationLatLongEle. (m)
1Astore35.3774.902168.0
2Balakot34.3873.35981.0
3Bunji35.6774.631470.0
4Burzil34.9175.094030.0
5Chillas35.4274.101251.0
6Cherat33.8271.551372.0
7Chitral35.8571.831500.0
8Deosai35.1075.603910.0
9Dir35.2071.851370.0
10Drosh35.5771.781465.0
11G-Dopata34.2073.60813.5
12Gilgit35.9274.331457.2
13G-Khan33.2573.62457.0
14Gupis36.1773.402156.0
15Jhelum32.9373.73287.2
16Hunza36.3274.652374.0
17Hushy35.3776.403010.0
18Kakul34.1873.251309.0
19Kallar33.4273.37518.0
20Khot36.5272.583505.0
21Khunjrab36.8575.404730.0
22Kotli33.5273.89614.0
23Mangla33.1373.63305.0
24Murree33.9273.382127.0
25Muzaffarabad34.4073.50702.0
26Naltar36.2274.272810.0
27Naran34.9073.652363.0
28Peshawar34.0071.93327
29Plandri33.7073.701402.0
30Rama35.3674.813040.0
31Ratu35.1574.812920.0
32RawlaKot33.8774.271677.0
33Shigar35.5375.592470.0
34Skardu35.3475.542316.5
35S-Sharif34.8272.35970.0
36Ushkore36.0273.363353.0
37Yasin36.6373.303353.0
38Zani Post36.2872.153000.0
39Ziarat36.8374.283669.0
40PBO. Chhor29.8869.715
41PBO. Hyderabad25.3861.828
42PBO. Jiwani25.0661.856
43PBO. Jacobabad28.368.4655
44M.O S K.A.P.24.967.1322
45PBO. Nawabshah26.2568.3637
46PBO. Panjgur26.9664.1968
47PBO. Pasni25.2663.489
48M.O. Badin24.6368.99
49M.O. Gwadar25.1362.3329.86
50M.O. Larkana27.5368.2352.7
51M.O. Lasbella26.2366.1687
52M.O. Padidan26.8568.1346
53M.O. Rohri27.6668.966
54A.M. Moen-jo-daro27.3668.151.8
55A.M. Ormara25.264.662
56A.M. Turbat25.9863.06155
57A.M. Sukkur27.768.8668.5
58P.B.O/AER Karachi24.966.9322
59Marine Met. Kiamari. Karachi24.966.9322
60M.O. Mithi24.7569.830
61A.M. Tandojam25.6668.7119.5
62M.O Dadu26.7167.7838
63M.O Mirpur Khas25.516915
64M.O. Thatta24.7567.9
65A.M. Uthal25.8166.6140
66A.M. Sakrand26.1368.2645
67Bahawal Nagar3073.24
68Bahawal Pur29.3371.783
69Bahawal Pur(A/P)29.38371.683
70Bhakkar31.61671.06
71Noorpur Thal31.86671.9
72Jauharabad32.572.43
73Faisalabad31.4373.13
74Jhelum32.9373.73
75Khanpur28.6570.683
76Lahore A.P.31.58374.4
77Lahore PBO.31.5574.33
78Multan30.271.43
79Mandi Bahauddin32.9673.8
80Sialkot32.51674.53
81Sialkot Airport32.5374.03
82Sargodha32.0572.66
83Toba Tek Singh30.98372.783
84D.G. Khan30.0570.63
85D.G. Khan (Aeromet)29.9670.33
86Jhang31.2672.316
87Mangla33.0673.63
88Sahiwal30.6573.16
89Chakwal32.91672.85
90Gujranwala32.3674.35
91Okara30.873.43
92Rahim Yar Khan28.4370.316
93Gujrat32.5674.06
94MCC Lahore31.58374.4
95Rawalpindi33.5673.02

References

  1. Li, S.; Jiang, C.; Ma, Y.; Long, Y.; Wu, R.; Zhu, Q.; Li, D.; Li, C.; Ning, Z. Adaptation Analysis in IMERG Precipitation Estimation for the Dongting Lake Basin, China. Atmosphere 2022, 13, 1735. [Google Scholar] [CrossRef]
  2. Nadeem, M.U.; Waheed, Z.; Ghaffar, A.M.; Javaid, M.M.; Hamza, A.; Ayub, Z.; Nawaz, M.A.; Waseem, W.; Hameed, M.F.; Zeeshan, A.; et al. Application of HEC-HMS for Flood Forecasting in Hazara Catchment Pakistan, South Asia. Int. J. Hydrol. 2022, 6, 7–12. [Google Scholar] [CrossRef]
  3. Anjum, M.N.; Irfan, M.; Waseem, M.; Leta, M.K.; Niazi, U.M.; Rahman, S.; Ghanim, A.; Mukhtar, M.A.; Nadeem, M.U. Assessment of PERSIANN-CCS, PERSIANN-CDR, SM2Rain-ASCAT, and CHIRPS-2.0 Precipitation Products over a Semi-Arid Subtropical Climatic Region. Water 2022, 14, 147. [Google Scholar] [CrossRef]
  4. Thaler, S.; Brocca, L.; Ciabatta, L.; Eitzinger, J.; Hahn, S.; Wagner, W. Effects of Different Spatial Precipitation Input Data on Crop Model Outputs under a Central European Climate. Atmosphere 2018, 9, 290. [Google Scholar] [CrossRef] [Green Version]
  5. Cheema, M.J.M.; Bastiaanssen, W.G.M. Local Calibration of Remotely Sensed Precipitation from the TRMM Satellite for Different Periods and Spatial Scales in the Indus Basin. Int. J. Remote Sens. 2012, 33, 2603–2627. [Google Scholar] [CrossRef]
  6. Palharini, R.; Vila, D.; Rodrigues, D.; Palharini, R.; Mattos, E.; Undurraga, E. Analysis of Extreme Precipitation and Natural Disasters Events Using Satellite Precipitation Products in Different Regions of Brazil. Atmosphere 2022, 13, 1680. [Google Scholar] [CrossRef]
  7. Pedreira, A.L.; Biudes, M.S.; Machado, N.G.; Vourlitis, G.L.; Geli, H.M.E.; Dos Santos, L.O.F.; Querino, C.A.S.; Ivo, I.O.; Neto, N.L. Assessment of Remote Sensing and Re-Analysis Estimates of Regional Precipitation over Mato Grosso, Brazil. Water 2021, 13, 333. [Google Scholar] [CrossRef]
  8. Bagtasa, G. Assessment of Tropical Cyclone Precipitation from GSMaP and GPM Products and Their Application to Analog Forecasting in the Philippines. Atmosphere 2022, 13, 1398. [Google Scholar] [CrossRef]
  9. Gebremichael, M.; Yue, H.; Nourani, V.; Damoah, R. The Skills of Medium-Range Precipitation Forecasts in the Senegal River Basin. Sustainability 2022, 14, 3349. [Google Scholar] [CrossRef]
  10. Abebe, S.A.; Qin, T.; Yan, D.; Gelaw, E.B.; Workneh, H.T.; Kun, W.; Shanshan, L.; Biqiong, D. Spatial and Temporal Evaluation of the Latest High-Resolution Precipitation Products over the Upper Blue Nile River Basin, Ethiopia. Water 2020, 12, 3072. [Google Scholar] [CrossRef]
  11. Cheema, M.J.M.; Bastiaanssen, W.G.M.; Rutten, M.M. Validation of Surface Soil Moisture from AMSR-E Using Auxiliary Spatial Data in the Transboundary Indus Basin. J. Hydrol. 2011, 405, 137–149. [Google Scholar] [CrossRef]
  12. Products, P. Quantitative Characteristics of the Current Multi-Source. Water 2021, 13, 334. [Google Scholar]
  13. Nwachukwu, P.N.; Satge, F.; El Yacoubi, S.; Pinel, S.; Bonnet, M.P. From Trmm to GPM: How Reliable Are Satellite-Based Precipitation Data across Nigeria? Remote Sens. 2020, 12, 3964. [Google Scholar] [CrossRef]
  14. Cattani, E.; Ferguglia, O. Precipitation Products’ Inter–Comparison over East And Southern Africa 1983–2017. Remote Sens. 2021, 13, 4419. [Google Scholar] [CrossRef]
  15. Bilal, H.; Govindan, R.; Al-Ansari, T. Investigation of Groundwater Depletion in the State of Qatar and Its Implication to Energy Water and Food Nexus. Water 2021, 13, 2464. [Google Scholar] [CrossRef]
  16. Amir, S.; Saqib, Z.; Khan, A.; Khan, M.I.; Khan, M.A.; Majid, A. Land Cover Mapping and Crop Phenology of Potohar Region, Punjab, Pakistan. Pakistan J. Agric. Sci. 2019, 56, 187–196. [Google Scholar] [CrossRef]
  17. Beck, H.E.; Vergopolan, N.; Pan, M.; Levizzani, V.; van Dijk, A.I.J.M.; Weedon, G.P.; Brocca, L.; Pappenberger, F.; Huffman, G.J.; Wood, E.F. Global-Scale Evaluation of 22 Precipitation Datasets Using Gauge Observations and Hydrological Modeling. Hydrol. Earth Syst. Sci. 2017, 21, 6201–6217. [Google Scholar] [CrossRef] [Green Version]
  18. Sharifi, E.; Eitzinger, J.; Dorigo, W. Performance of the State-of-the-Art Gridded Precipitation Products over Mountainous TerRain: A Regional Study over Austria. Remote Sens. 2019, 11, 2018. [Google Scholar] [CrossRef] [Green Version]
  19. Paredes-Trejo, F.; Barbosa, H.; dos Santos, C.A.C. Evaluation of the Performance of SM2Rain-Derived Precipitation Products over Brazil. Remote Sens. 2019, 11, 1113. [Google Scholar] [CrossRef] [Green Version]
  20. Wild, A.; Chua, Z.W.; Kuleshov, Y. Evaluation of Satellite Precipitation Estimates over the South West Pacific Region. Remote Sens. 2021, 13, 3929. [Google Scholar] [CrossRef]
  21. Hashim, M.; Reba, N.M.; Nadzri, M.I.; Pour, A.B.; Mahmud, M.R.; Yusoff, A.M.R.M.; Ali, M.I.; Jaw, S.W.; Hossain, M.S. Satellite-Based Run-Offmodel for Monitoring Drought in Peninsular Malaysia. Remote Sens. 2016, 8, 633. [Google Scholar] [CrossRef]
  22. Nadeem, M.U.; Anjum, M.N.; Afzal, A.; Azam, M.; Hussain, F.; Usman, M.; Javaid, M.M.; Mukhtar, M.A.; Majeed, F. Assessment of Multi-Satellite Precipitation Products over the Himalayan Mountains of Pakistan, South Asia. Sustainability 2022, 14, 8490. [Google Scholar] [CrossRef]
  23. Mu, N.; Rasool, G.; Ma, N.; Am, G.; Mm, J.; Hamza, A.; Aurangzaib, M.; Waheed, Z. Runoff Estimations by Using Satellite-Based Precipitation Products (SRPs) and Then Identifying Its Relation with Other Gauge Data Over Potohar Plateau, Pakistan. Int. J. Water Res. 2022, 4, 126. [Google Scholar]
  24. Hamza, A.; Anjum, M.N.; Cheema, M.J.M.; Chen, X.; Afzal, A.; Azam, M.; Shafi, M.K.; Gulakhmadov, A. Assessment of IMERG-V06, TRMM-3B42V7, SM2Rain-ASCAT, and PERSIANN-CDR Precipitation Products over the Hindu Kush Mountains of Pakistan, South Asia. Remote Sens. 2020, 12, 3871. [Google Scholar] [CrossRef]
  25. Masiza, W.; Chirima, J.G.; Hamandawana, H.; Kalumba, A.M.; Magagula, H.B. Do Satellite Data Correlate with In Situ Precipitation and Smallholder Crop Yields? Implications for Crop Insurance. Sustainability 2022, 14, 1670. [Google Scholar] [CrossRef]
  26. Al Abdouli, K.; Hussein, K.; Ghebreyesus, D.; Sharif, H.O. Coastal Runoff in the United Arab Emirates-the Hazard and Opportunity. Sustainability 2019, 11, 5406. [Google Scholar] [CrossRef] [Green Version]
  27. Zhang, H.L.; Wang, Y.J.; Wang, Y.Q.; Li, D.X.; Wang, X.K. Quantitative Comparison of Semi- and Fully-Distributed Hydrologic Models in Simulating Flood Hydrographs on a Mountain Watershed in Southwest China. J. Hydrodyn. 2013, 25, 877–885. [Google Scholar] [CrossRef]
  28. Oyerinde, G.T.; Fademi, I.O.; Denton, O.A. Modeling Runoff with Satellite-Based Precipitation Estimates in the Niger Basin. Cogent Food Agric. 2017, 3, 377–425. [Google Scholar] [CrossRef]
  29. Ahmad, M.J.; Iqbal, M.A.; Choi, K.S. Climate-Driven ConstRaints in Sustaining Future Wheat Yield and Water Productivity. Agric. Water Manag. 2020, 231, 105991. [Google Scholar] [CrossRef]
  30. Liu, Y.; Huang, Y.; Liu, Y.; Li, K.; Li, M. The Impact of Precipitation Movement Direction on Urban Runoff Cannot Be Ignored in Urban Hydrologic Management. Water 2021, 13, 2923. [Google Scholar] [CrossRef]
  31. Lu, X.; Tang, G.; Liu, X.; Wang, X.; Liu, Y.; Wei, M. The Potential and Uncertainty of Triple Collocation in Assessing Satellite Precipitation Products in Central Asia. Atmos. Res. 2021, 252, 105452. [Google Scholar] [CrossRef]
  32. Rahman, K.U.; Shang, S.; Shahid, M.; Wen, Y. Performance Assessment of SM2Rain-CCI and SM2Rain-ASCAT Precipitation Products over Pakistan. Remote Sens. 2019, 11, 2040. [Google Scholar] [CrossRef]
  33. Li, G.; Yu, Z.; Wang, W.; Ju, Q.; Chen, X. Analysis of the Spatial Distribution of Precipitation and Topography with GPM Data in the Tibetan Plateau. Atmos. Res. 2021, 247, 105259. [Google Scholar] [CrossRef]
  34. Ren, P.; Li, J.; Feng, P.; Guo, Y.; Ma, Q. Evaluation of Multiple Satellite Precipitation Products and Their Use in Hydrological Modelling over the Luanhe River Basin, China. Water 2018, 10, 677. [Google Scholar] [CrossRef] [Green Version]
  35. Anjum, M.N.; Ding, Y.; Shangguan, D.; Ahmad, I.; Ijaz, M.W.; Farid, H.U.; Yagoub, Y.E.; Zaman, M.; Adnan, M. Performance Evaluation of Latest Integrated Multi-Satellite Retrievals for Global Precipitation Measurement (IMERG) over the Northern Highlands of Pakistan. Atmos. Res. 2018, 205, 134–146. [Google Scholar] [CrossRef]
  36. Brocca, L.; Moramarco, T.; Melone, F.; Wagner, W. A New Method for Precipitation Estimation through Soil Moisture Observations. Geophys. Res. Lett. 2013, 40, 853–858. [Google Scholar] [CrossRef]
  37. Talchabhadel, R.; Nakagawa, H.; Kawaike, K.; Yamanoi, K.; Musumari, H.; Adhikari, T.R.; Prajapati, R. Appraising the Potential of Using Satellite-Based Precipitation Estimates for Evaluating Extreme Precipitation: A Case Study of August 2014 Event Across the West Rapti River Basin, Nepal. Earth Sp. Sci. 2021, 8, 1–15. [Google Scholar] [CrossRef]
  38. Li, L.; Hong, Y.; Wang, J.; Adler, R.F.; Policelli, F.S.; Habib, S.; Irwn, D.; Korme, T.; Okello, L. Evaluation of the Real-Time TRMM-Based Multi-Satellite Precipitation Analysis for an Operational Flood Prediction System in Nzoia Basin, Lake Victoria, Africa. Nat. Hazards 2009, 50, 109–123. [Google Scholar] [CrossRef]
  39. Andries, A.; Morse, S.; Murphy, R.J.; Lynch, J.; Woolliams, E.R. Assessing Education from Space: Using Satellite Earth Observation to Quantify Overcrowding in Primary Schools in Rural Areas of Nigeria. Sustainability 2022, 14, 1408. [Google Scholar] [CrossRef]
  40. Abd Elhamid, A.M.I.; Eltahan, A.M.H.; Mohamed, L.M.E.; Hamouda, I.A. Assessment of the Two Satellite-Based Precipitation Products TRMM and RFE Precipitation Records Using Ground Based Measurements. Alexandria Eng. J. 2020, 59, 1049–1058. [Google Scholar] [CrossRef]
  41. Bhati, D.S.; Dubey, S.K.; Sharma, D. Application of Satellite-Based and Observed Precipitation Datasets for Hydrological Simulation in the Upper Mahi River Basin of Rajasthan, India. Sustainability 2021, 13, 7560. [Google Scholar] [CrossRef]
  42. Nadeem, M.U.; Ghanim, A.A.J.; Anjum, M.N.; Shangguan, D.; Rasool, G.; Irfan, M.; Niazi, U.M.; Hassan, S. Multiscale Ground Validation of Satellite and Reanalysis Precipitation Products over Diverse Climatic and Topographic Conditions. Remote Sens. 2022, 14, 4680. [Google Scholar] [CrossRef]
  43. Habib, E.; Haile, A.T.; Sazib, N.; Zhang, Y.; Rientjes, T. Effect of Bias Correction of Satellite-Precipitation Estimates on Runoff Simulations at the Source of the Upper Blue Nile. Remote Sens. 2014, 6, 6688–6708. [Google Scholar] [CrossRef] [Green Version]
  44. Li, Z.; Wen, Y.; Schreier, M.; Behrangi, A.; Hong, Y.; Lambrigtsen, B. Advancing Satellite Precipitation Retrievals With Data Driven Approaches: Is Black Box Model Explainable? Earth Sp. Sci. 2021, 8, 1–15. [Google Scholar] [CrossRef]
  45. Huang, W.; Liu, P.; Chang, Y.; Liu, C. Evaluation and Application of Satellite Precipitation Products in Studying the Summer Precipitation Variations over Taiwan. Remote. Sens. 2020, 12, 347. [Google Scholar] [CrossRef]
Figure 1. Digital elevation model (DEM) and available meteorological stations of study area.
Atmosphere 14 00008 g001
Figure 2. Thiessen polygon to calculate aerial precipitation of study area.
Atmosphere 14 00008 g002
Figure 3. Comparison of spatial variability annual average precipitation of all SPPs.
Atmosphere 14 00008 g003
Figure 4. Temporal variability annual average precipitation of soil moisture-based products.
Atmosphere 14 00008 g004aAtmosphere 14 00008 g004b
Figure 5. Impact of aerial average precipitation on evaluation indices of all SPPs.
Atmosphere 14 00008 g005
Figure 6. Impact of elevation on all evaluation indices on daily scale.
Atmosphere 14 00008 g006
Figure 7. CC’s spatial distribution of all SPPs.
Atmosphere 14 00008 g007
Figure 8. BIAS’s spatial distribution of all SPPs.
Atmosphere 14 00008 g008
Figure 9. RMSE’s spatial distribution of all SPPs.
Atmosphere 14 00008 g009
Figure 10. Box schemes of all evaluation indices on seasonal scale.
Atmosphere 14 00008 g010
Figure 11. rBIAS (%) all SPPs on seasonal scale.
Atmosphere 14 00008 g011
Figure 12. Performance diagram of all SPPs on daily scale.
Atmosphere 14 00008 g012
Figure 13. Performance diagram of all SPPs on seasonal scale.
Atmosphere 14 00008 g013
Figure 14. PDF (%) of all SPPs on daily and seasonal scales. (a) daily, (b) winter season, (c) spring season, (d) summer season, and (e) autumn season observation over Pakistan.
Atmosphere 14 00008 g014aAtmosphere 14 00008 g014b
Table 1. Salient features of soil-moisture based satellite precipitation data.
Satellite DatasetsSpatial/Temporal ResolutionTime CoverageData Source
SM2Rain-ASCAT10 km\1-dayJanuary 2007 to December 2021https://doi.org/10.5281/zenodo.2591214
GPM-SM2Rain0.25-degree\1-dayJanuary 2007 to December 2018https://doi.org/10.5281/zenodo.3854817
SM2Rain-CCI0.25-degree\1-dayJanuary 1998 to December 2015https://doi.org/10.5281/zenodo.1305021
SM2Rain0.25 degree/dailyJanuary 1998 to December 2020https://explorer.adamplatform.eu/
Table 2. Statistical analysis equations with their acceptable ranges.
Statistical AnalysisDetailsAcceptable Range
c c = i = 1 n ( G i G ) ( E i E ) i = 1 n ( G i G ) 2 × i = 1 n ( E i E ) 2 CC = Correlation Coefficient1
Gi = data of reference gauges
G = average of the gauge data
Ei = estimates of satellite/reanalysis product
E = mean of the estimates of satellite/reanalysis product
n = total number of datasets
B I A S = i = 1 n ( E i G i ) n Ei = estimates of satellite/reanalysis product0
Gi = data of reference gauges
n = total number of datasets
r b i a s = i = 1 n ( E i G i ) I = 1 n G i × 100 rbias = Bias, relative Bias±10
Ei = estimates of satellite/reanalysis product
Gi = data of reference gauges
n = total number of datasets
R M S E = 1 n I = 1 n ( E i G i ) 2 RMSE = Root Mean Square Error0
Ei = estimates of satellite/reanalysis product
Gi = data of reference gauges
n = total number of datasets
P O D = A A + B POD = Probability of Detection A = number of precipitation events that the SPPs/reanalysis products actually reported1
B = number of precipitation events that the reference gauging stations observed but that the SPPs/reanalysis products missed
F A R = C A + C FAR = False Alarm Ratio0
C = number of precipitation events that the SPPs/reanalysis products misrepresented
A = number of precipitation events that the SPPs/reanalysis products actually reported
C S I = A A + B + C CSI = Critical Success Index1
A = Amount of precipitation events that were really reported by SPPs and reanalysis products
B = Amount of precipitation events missed by SPPs/reanalysis products while being observed by reference gauging stations
C = Amount of precipitation events that were inaccurately represented by SPPs and reanalysis products
Table 3. The results of all evaluation indices on monthly scale.
SPPsCCBIAS (mm)RMSE (mm)rBIAS
GPM-SM2Rain0.91510.13150
SM2Rain-CCI0.75−0.39.45180
SM2Rain0.8148.75200
SM2Rain-ASCAT0.823.88−0.4−100
Table 4. Results of all evaluation indices on daily scales.
SPPsCCBIAS (mm)RMSE (mm)rBIAS
GPM-SM2Rain0.39−0.27100
SM2Rain-CCI0.21−0.118.75−80
SM2Rain0.350.234.98110
SM2Rain-ASCAT0.220.413.24140
Disclaimer/Publisher’s Note: The statements, opinions and data contained in all publications are solely those of the individual author(s) and contributor(s) and not of MDPI and/or the editor(s). MDPI and/or the editor(s) disclaim responsibility for any injury to people or property resulting from any ideas, methods, instructions or products referred to in the content.

