
Spatial-Temporal Dynamics of Diurnal Temperature Range: Russian Far East as a Case Study


Institute for Complex Analysis of Regional Problems Far Eastern Branch Russian Academy of Sciences (ICARP FEB RAS), Birobidzhan 679016, Russia
Atmosphere 2023, 14(1), 41; https://doi.org/10.3390/atmos14010041
Submission received: 2 December 2022
/
Revised: 19 December 2022
/
Accepted: 22 December 2022
/
Published: 26 December 2022
(This article belongs to the Special Issue Development and Application of Indices for Assessing the Potential Impacts of Climate Change)
Abstract
:Short-term fluctuations in air temperature, called the daily temperature range (DTR), or its daily amplitude, have a strong impact on ecosystems, as well as on the health and well-being of people. The pronounced effect of DTR on mortality from all causes and especially on cardiovascular mortality is well documented in the scientific literature, but little is known about spatial, inter-annual, and inter-seasonal fluctuations of DTR in the Russian Far East (RFE), an area with high annual dynamics of air temperature. Data from 99 weather stations for the period from 2000 to 2019 was used to evaluate spatial and temporal DTR patterns at the RFE. A higher DTR, up to 16 °C in Toko on the border with Sakha (Yakutia) as a mean for the entire period, is typical for continental areas further to the north. Lower values are observed at continental weather stations in the south and in coastal climates (4.7 °C in Mys Alevina, Magadan Region). In general, a distinct seasonal change in DTR was found for continental locations with a significant difference from month to month throughout the year. On the annual cycle, the maximum DTR at the continental northern stations is observed in April and June–July, and at the continental southern areas in February; the minimum DTR is shown in November and December. The DTR ranges as much as from 6 °C in December to 17 °C in April in the continental Korkodon in the far north. Locations with a marine climate are characterized by a smoothed seasonal change in DTR, with obvious peaks in February–March and October, and a minimum in July–August. The downward trend in DTR for the period from 2000 to 2019, up to −0.7 °C in coastal Bolsheretsk, is based on a faster increase in the minimum daily temperature compared to the maximum, which is typical for most weather stations at the RFE and is known worldwide as a diurnal asymmetry of global warming. At the same time, an increase in the daily amplitude of air temperature (up to +0.6 °C in continental Dolinovka) was found for some localities, associated with a higher positive trend of maximum temperatures, which contradicts global patterns.
1. Introduction
Climate change includes two main types of fluctuations that negatively affect human health, as follows: both general progressive warming and increased variability and, accordingly, unpredictability in weather conditions, provoking excessive mortality and morbidity [1,2,3,4]. In recent years, many papers have appeared indicating that sudden changes in air temperature during the day negatively affect human health in general, and vulnerable groups in the population in particular [4,5,6,7]. Among other types of fluctuations, the daily dynamics of air temperature play an important role in the formation of and changes in health and, thus, understanding how quickly and sharply air temperature varies during the day, and how it affects the shifts in the human body’s organs and systems, primarily cardiovascular and respiratory [4,6,8,9,10].
First, not only do the dynamics of minimum, mean, and maximum air temperatures, but also their amplitude, or difference between maximum and minimum values of one day, reflects the degree of the climate thermal comfort, and affect ecosystems as a whole, including human society [4,11,12,13,14,15]. The change in air temperature over the course of a day is called the diurnal temperature range (DTR) and, based on findings from epidemiological studies, is harmful for humans, as the higher DTR, the more often adverse health effects are detected. It is well known that the impact of DTR on mortality, morbidity, or emergency department visits depends on many factors. First, there is the value of the temperature range by itself [16,17], with an effect depending on a geographical location and varying across climatic zones [6,17,18,19,20]. It is shown that an increase in DTR of 10 °C leads to a growth in mortality risk of 3.1%, and up to 6% in countries with warmer climates, which is very harmful to people [17]. Second, seasonality is found to be important for DTR, which means the change in the DTR influence on humans from season to season [20,21]. e.g., seasonal effect in Virginia, USA, is expressed in both DTR and emergency room admissions, with their higher correlation during the cold season in comparison with warm [8], which is consistent with other finding for cardiovascular outcomes for mortality [22] and emergency visits [23] in China.
As a first step before estimating the effect of short-term temperature changes on human health and well-being, we need to learn more about them and their temporal fluctuations and trends, both seasonally and in a long-term perspective, based on past and future data. Many papers are devoted to regional and global patterns in dynamics of DTR [13,16,24,25,26,27,28,29,30,31,32] and their associations with surface temperature variability [25,28,32,33]. Currently, it is well documented that the reflection of changes in mean air temperature alone is not enough when discussing the impact of temperature variability and variations on living systems on a global and regional scale. That is why DTR has been given a significant focus in many regions all around the globe, considered as a vitally important climatic parameter [34,35]. These findings are based on data from surface [24,25,26,30,32,33] and satellite [28,31] observations, providing insights at the extremes and into the ongoing changes. The highest DTR of 71 °C, depending on the season, was observed in the Lut desert in Iran; the highest record of 81.8 °C was shown for a desert environment in China, which both are considered the hottest places on Earth [28,31].
While both minimum (Tmin) and maximum (Tmax) daily temperatures are shown to become higher in conjunction with a global warming trend, asymmetry in their patterns is found for most areas worldwide, indicating a more rapid increase in Tmin rather than Tmax [4,12,13,24,25,26,32]. In turn, the faster nighttime warming effect leads to overall decreasing trends in DTR [12,13,24,26,27,32,34].
Despite the huge amount of evidence of the recent dynamics in short-term changes in air temperature globally, little is known about these variations in Russia as a whole, and its regional aspects, in particular [36,37,38,39]. The Russian Far East (RFE) is a region with a monsoon influence located in the temperate to sub-arctic climates, and is known for its abrupt weather changes, especially in the maritime coastal line close to the seas and ocean. Among them, Khabarovsk and Vladivostok are regional capitals at the RFE, and are the two largest cities with populations of more than 600 thousand people each. The purpose of the current research is to study the spatial and temporal patterns of DTR as a short-term variation in air temperature in the Russian Far East as a case study. The main research questions are as follows: Are there any differences in DTR between maritime and coastal climates, located in the south or north of the study area? What are the seasonal fluctuations in DTR? How and why does DTR change during the study period, taking into account the trends of Tmin and Tmax? In Section 2, materials and methods are described. Section 3 provides the results of the calculations, with separate subsections, as follows: Section 3.1 is devoted to the spatial patterns of DTR; Section 3.2 goes deeply into the intra-annual variations of DTR; temporal changes in Tmin, Tmax, and DTR through the study period are shown in Section 3.3. Section 4, Discussion, highlights the progress of the results, looks closely on the reasons for temporary changes in DTR (Section 4.1), underlines regional patterns of DTR at the RFE and possible causes of asymmetrical changes in DTR, emphasizes the importance of comparing DTR with day-to-day short-term fluctuations in air temperature (Section 4.3), and discusses the limitations of the current study and plans for future research. Concluding comments with main findings are given in Section 5, Conclusions.
2. Materials and Methods
2.1. Study Area and Data
The Russian Far East (RFE) is a vast area at the far-eastern edge of Russia bordering at the south with China, which is climatically influenced by both the Asian continent and the Pacific Ocean and the adjacent seas. It is washed by the Arctic Ocean at the north. Due to this location, the RFE has a monsoon climate with obvious seasonal changes in prevailing winds and precipitation extremes, according to Alisov climatic classification [40,41,42]. During winter monsoons, the prevailing dry and cold winds blow from north-west; reversely, during summer, very wet and moist winds are directed mainly from the south-east, dropping up to 80% of yearly precipitation [38,39]. The study region is situated in temperate to subarctic and arctic latitudes and has warm summer continental to subarctic and arctic climates according to the Köppen–Geiger climatic classification [43,44].
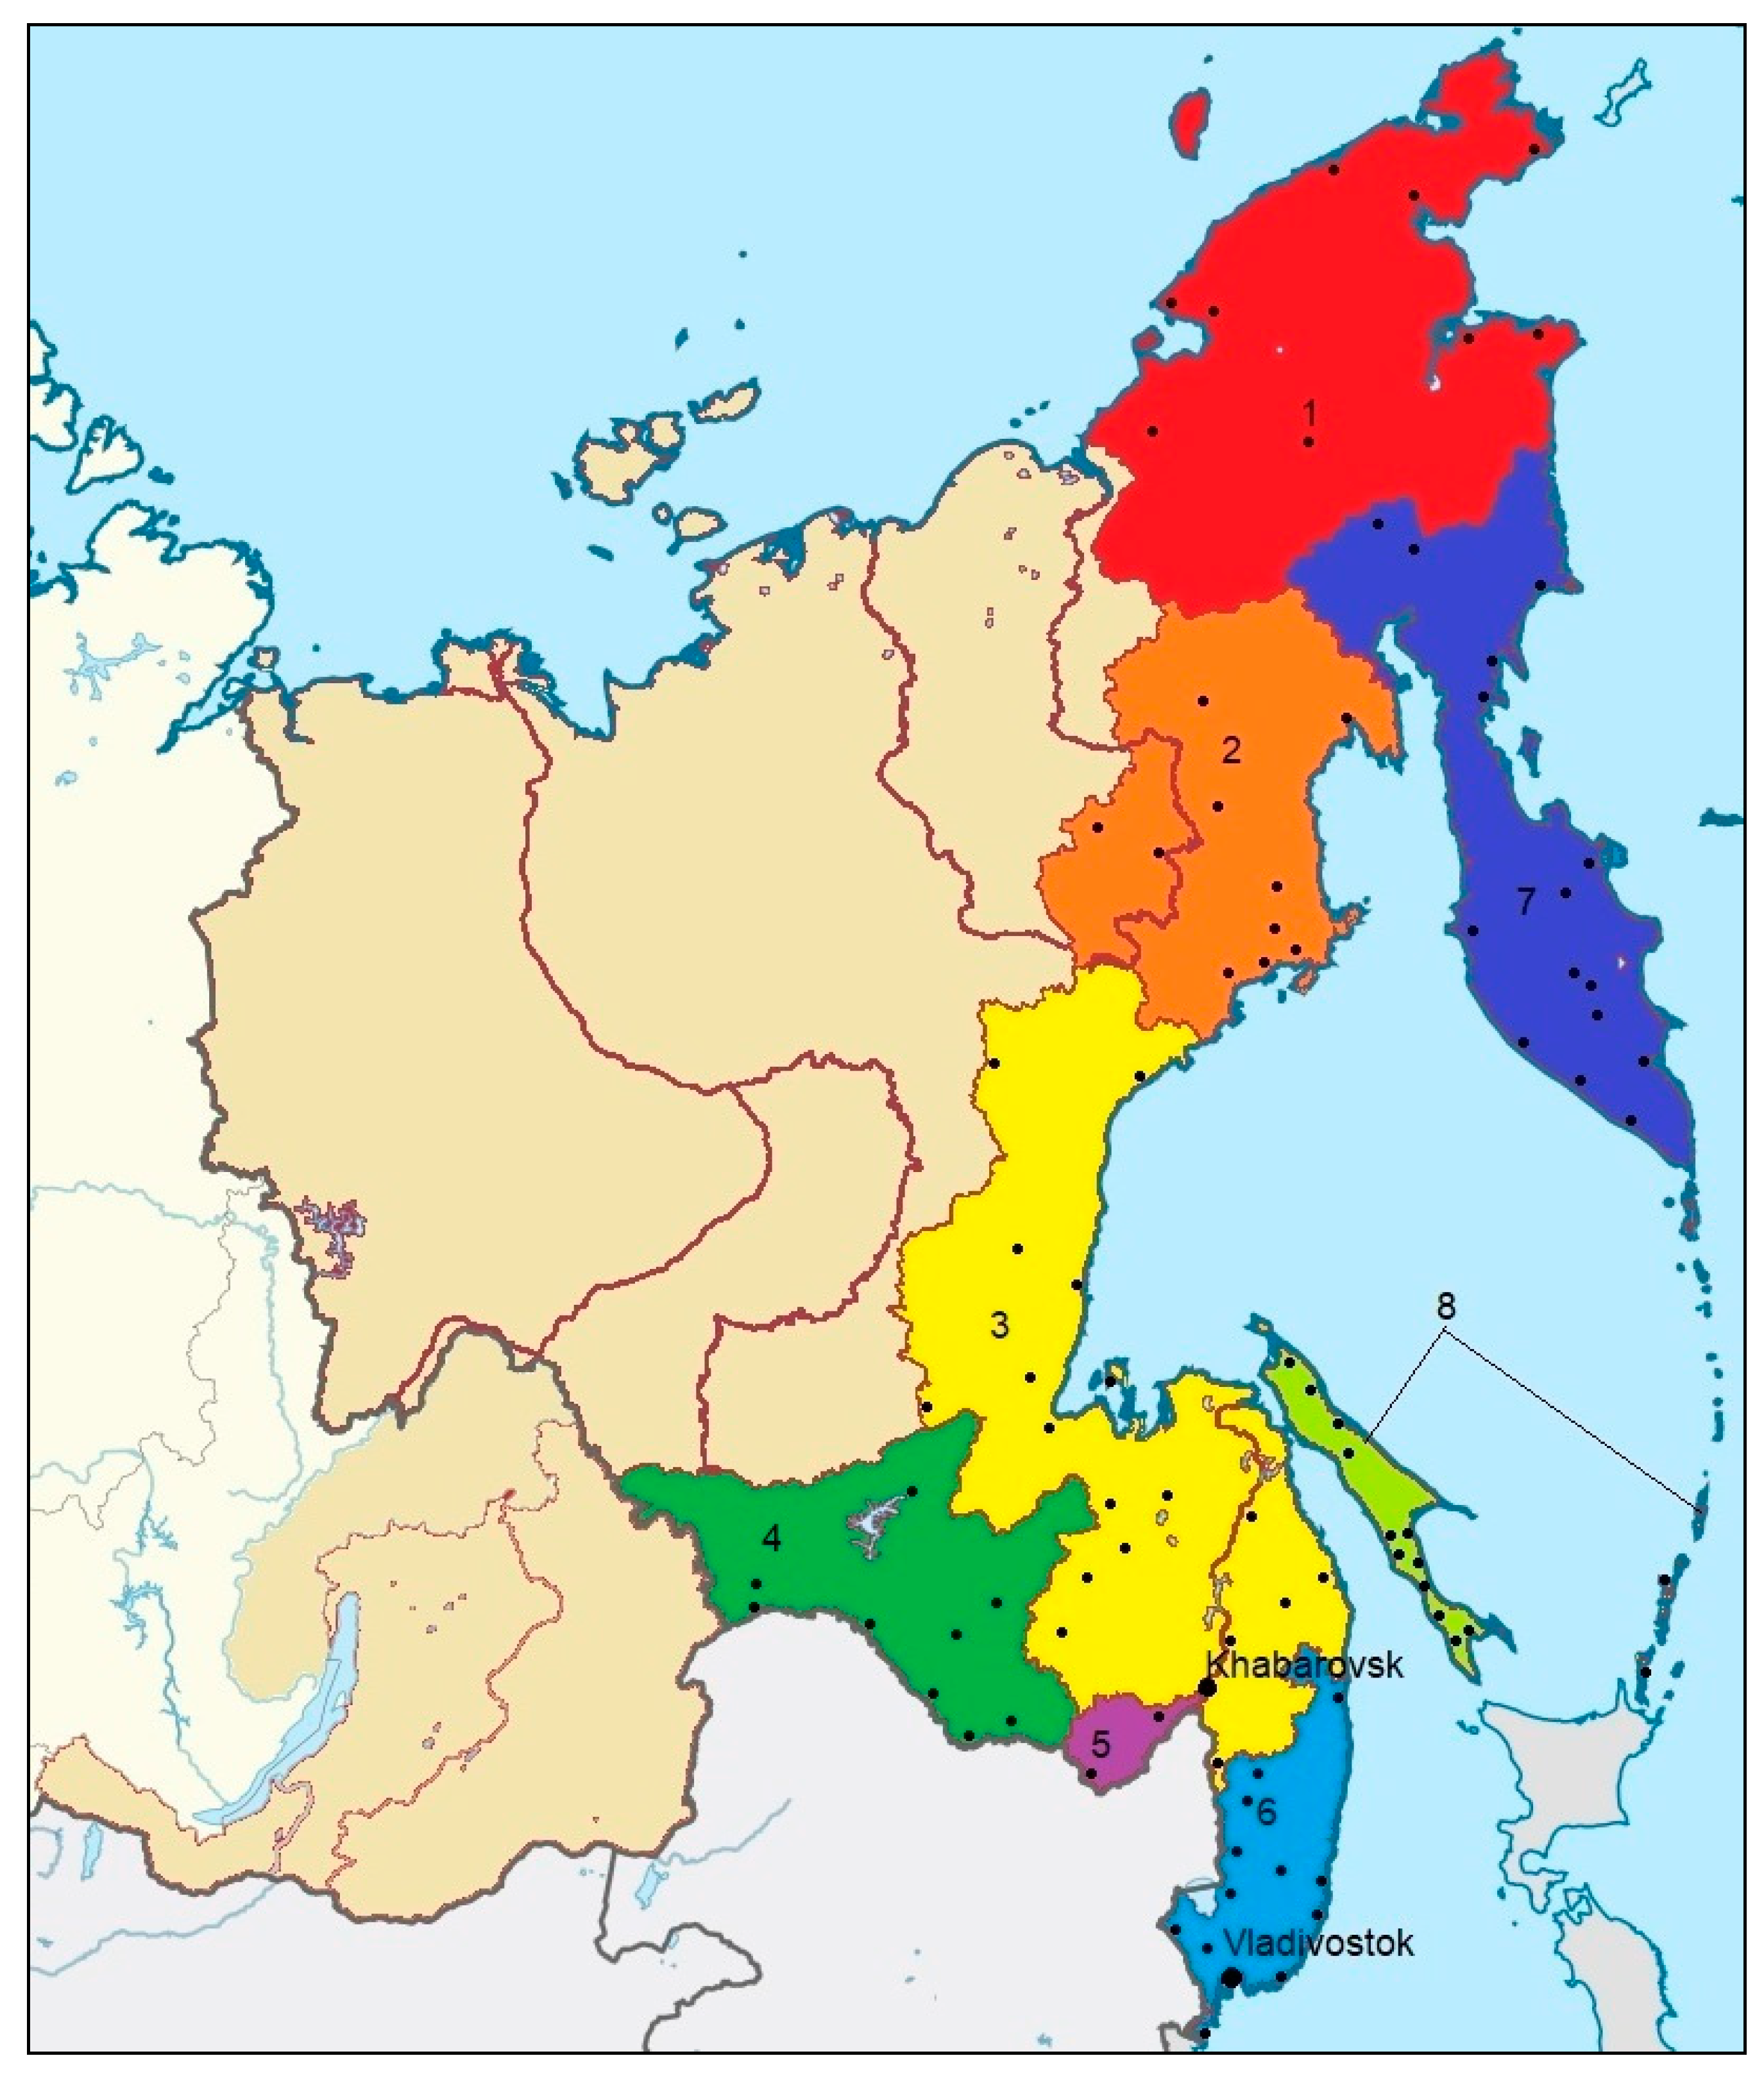
The study area at the RFE includes eight regions of the Far Eastern Federal District (FEFD) of Russia, shown in Figure 1. The regions are as follows: Amur, Jewish Autonomous, Magadan and Sakhalin Regions; Primorsky, Khabarovsky, and Kamchatsky Krai; and Chukotsky Autonomous Okrug (Chukotka). The Republic Sakha (Yakutia), Republic of Buryatia, and Zabaikalsky Krai, which are three more regions of the FEFD further west, have a different climate and are excluded from our research. As a whole, this sparsely populated area has nearly 3.2 million people. The main cities and towns are located at the southern outskirts near the border with China, as well as at the shorelines and at the banks of the large rivers. Khabarovsk and Vladivostok are the largest cities in the southern part of the RFE (Figure 1) and capital cities of the FEFD. Khabarovsk is the capital of Khabarovsky Krai, with a population of 613,000 people (1 January 2022). Vladivostok is the capital of Primorsky Krai, with a population of nearly 600,000 people (1 January 2022).
Daily weather data are minimum (Tmin), mean (Tmean), and maximum (Tmax) air temperature for 99 weather stations at the RFE for the 20 year period from 1 January 2000 to 31 December 2019 from the website of the World Data Center in Obninsk [45] were used. This temporal period was taken as coinciding with the period of available health data, as a future research step. Mean daily temperature for each weather station is calculated as average of eight 3 h observations in a day; the minimum and maximum temperatures are defined at weather stations using special thermometers.
2.2. Methods
The DTR, or the amplitude of daily air temperature as the difference between maximum and minimum temperatures at each day (DTR = Tmax − Tmin), and their spatial and temporal intra- and inter-annual aspects and dynamics were studied. The data are processed statistically to derive period means, standard deviations, extremes, and trends. Monthly values were calculated by averaging daily data for each month, and annual means were obtained through yearly average of monthly values. To test the significance of correlations and trends, the Mann–Kendall nonparametric method was used with a threshold probability (P) for statistical significance equal to 0.05 [46,47].
3. Results
3.1. Tmin, Tmean, Tmax and Diurnal Temperature Range: Spatial Differences
While mean annual air temperature ranges from −10.4 °C at the north in Omolon, the lowest mean annual value at the study area is +6.8 °C in the southernmost Posyet; the highest mean annual air temperature counts as +2.8 °C in Khabarovsk and +5.2 °C in Vladivostok. In January temperatures are much more diverse, as follows: −37.1 °C, −8.5 °C, −19.2 °C and −11.9 °C in Omolon, Posyet, Khabarovsk, and Vladivostok, respectively. The summer temperature regime is more homogenous, with monthly values of +15.2 °C in Omolon, +22.4 °C in Posyet, +21.4 °C in Khabarovsk, and +20.0 °C in Vladivostok, but shifting the highest temperature from July in continental Omolon and Khabarovsk to August in the maritime climates of Posyet and Vladivostok. The yearly statistics based on data for a period from 2000 to 2019, with daily minimum, mean, and maximum air temperature and DTR, are shown in Table 1.
The influence of latitude, as well as of both the Asian continent and the large water bodies, namely the East Siberian and Chukchi Seas of the Arctic Ocean, and the Bering, Okhotsk, and Japanese Seas of the Pacific Ocean, are obviously expressed in all air temperatures; maximum daily temperatures are much hotter, and minimum daily temperatures are much colder in the continental climates of Omolon and Khabarovsk in comparison to maritime Vladivostok and Posyet, located further to the south. As expected, mean DTR and its maximum values are higher in Omolon (11.0 and 40.6 °C, respectively) and Khabarovsk (9.3 and 23.9 °C, respectively) in comparison to Vladivostok (6.9 and 19.3 °C, respectively). The highest DTR is calculated for Toko (16.2 °C), located at the border with Sakha (Yakutia); the lowest is found in Mys Alevina (4.7 °C), Magadan Region. As a whole, the mean DTR for continental locations at the RFE is 13.8 °C, and for coastal weather stations it is 8.2 °C.
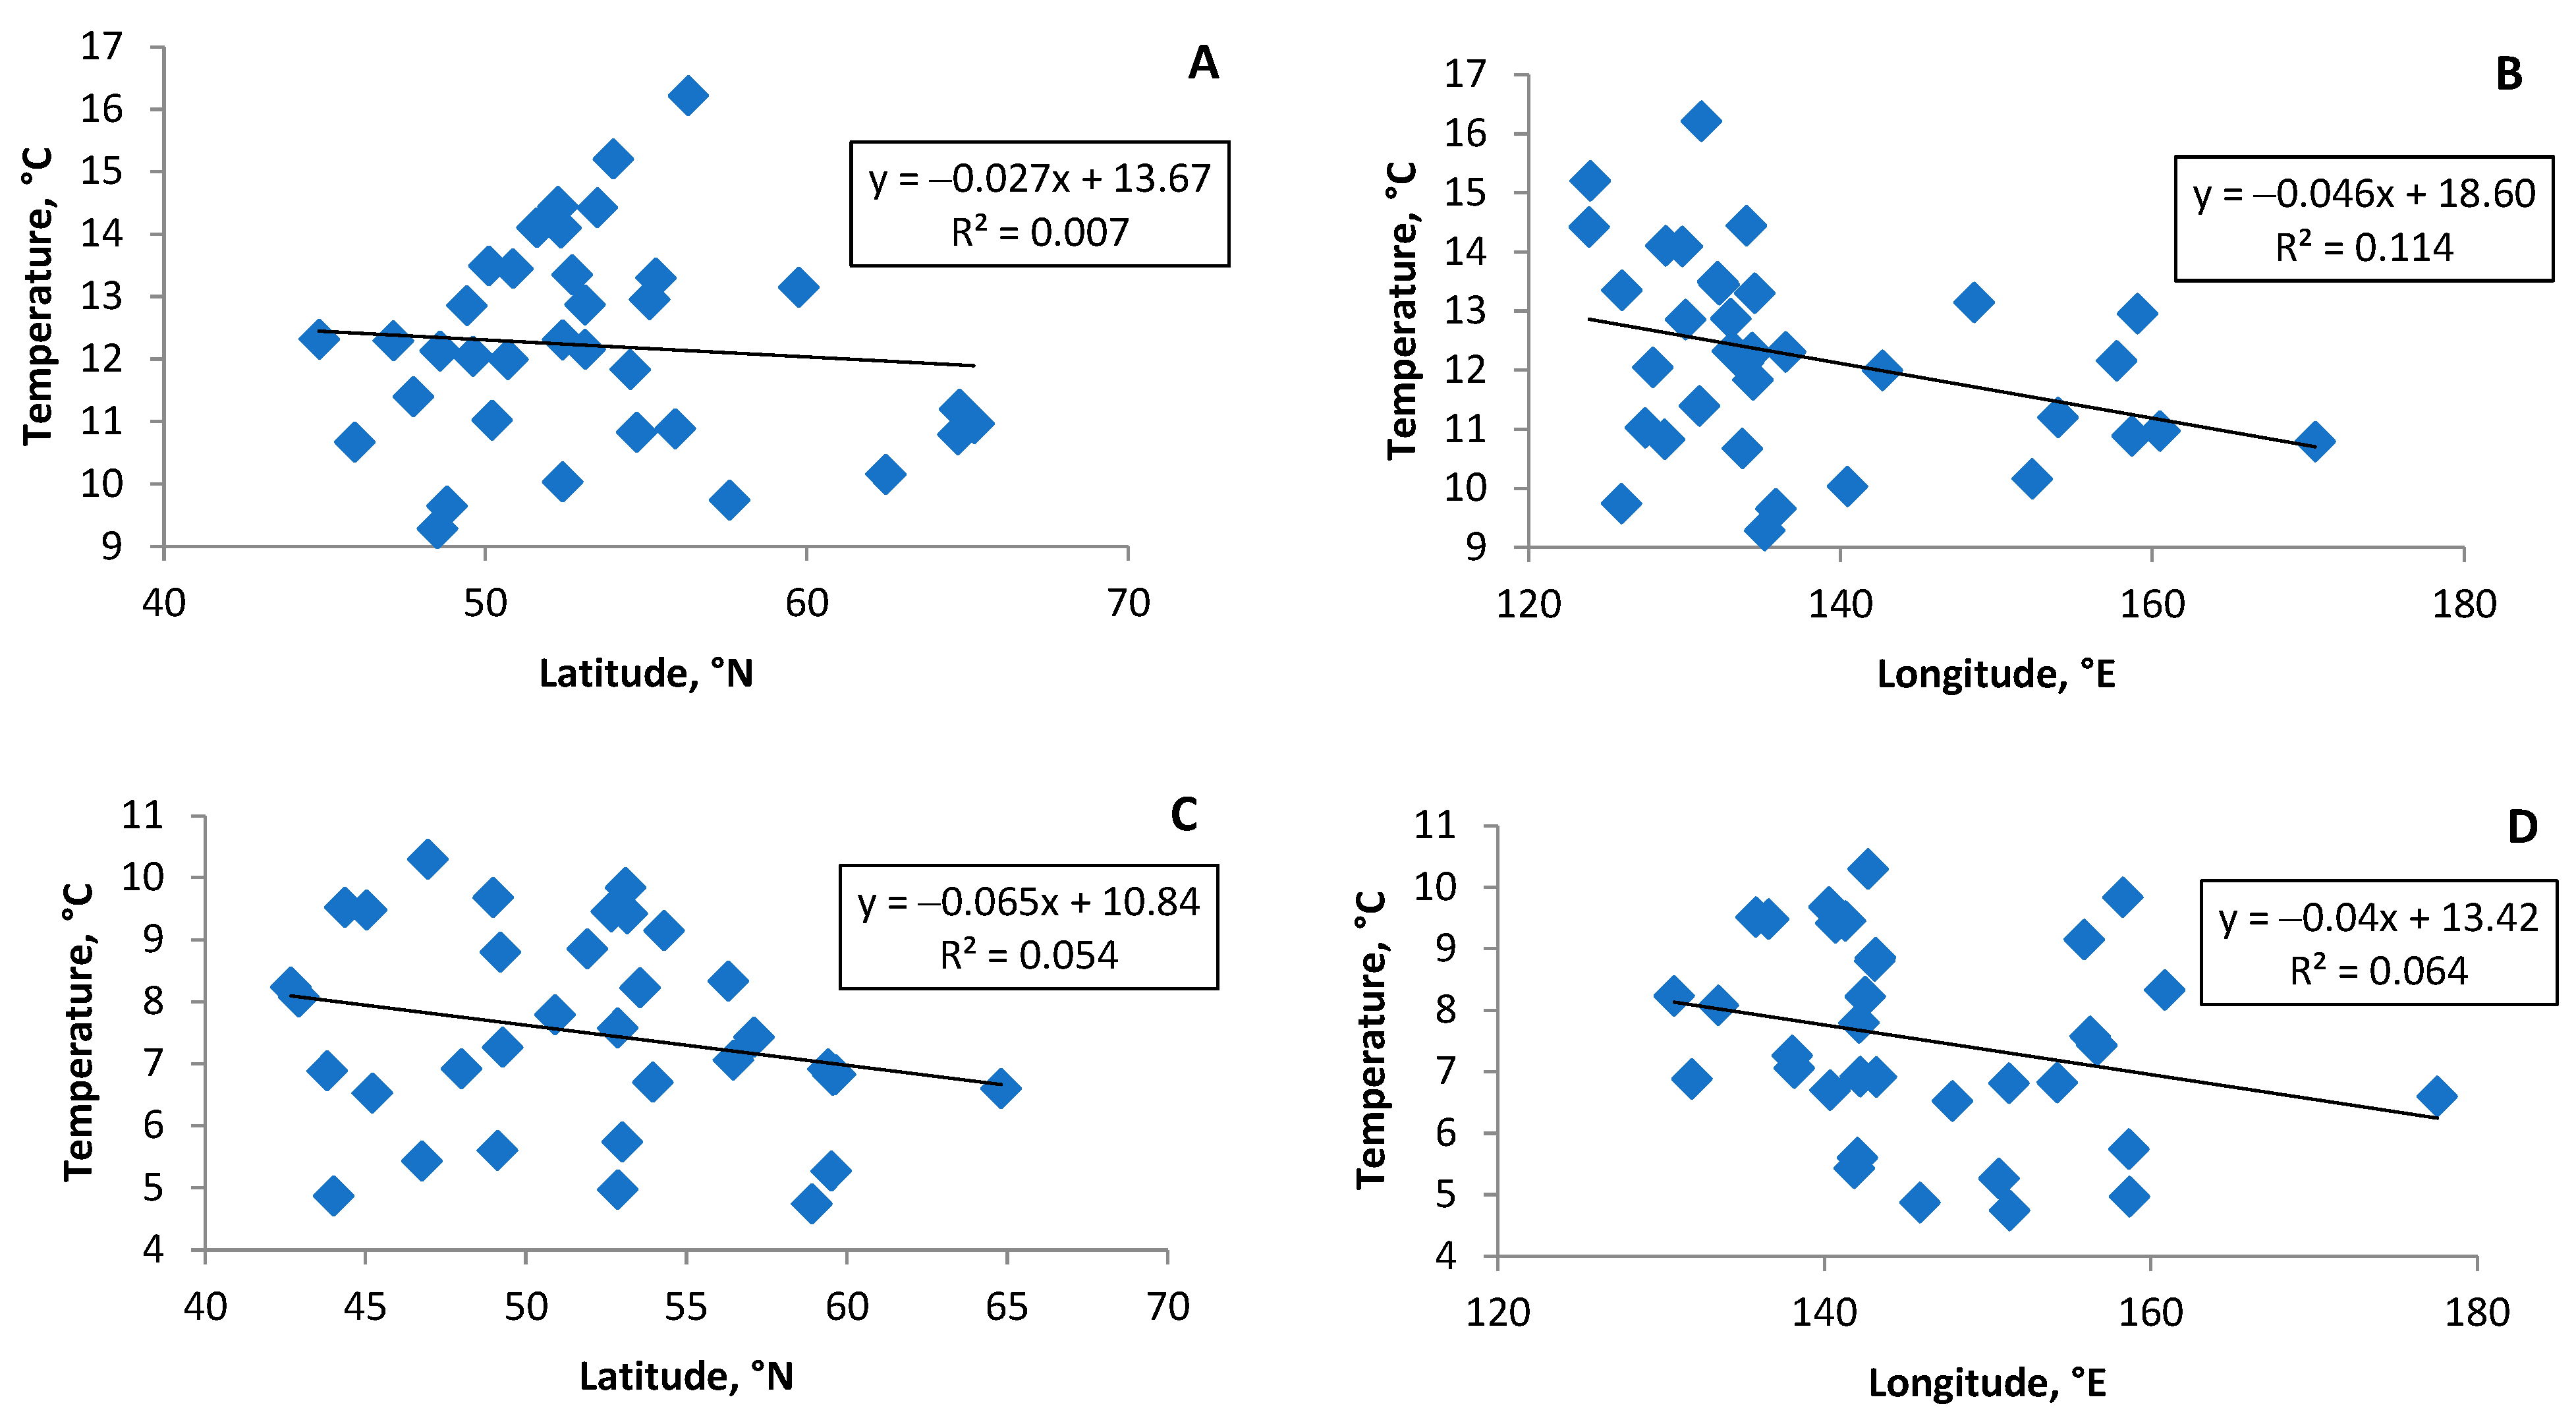
Figure 2 provides details of the relationship between DTR and both latitude and longitude, separately for continental and maritime weather stations. While DTR ranges from 9 to 16 °C at continental weather stations (Figure 2A,B), it has much lower values at the coastal locations, varying from 4 to 11 °C (Figure 2C,D). No obvious dependence of DTR from latitude and longitude was found, which is confirmed by a low coefficient of regression and an almost complete absence of the slope of the black solid lines. Figure 3 shows this relationship for the southern part of the RFE, and here the dependence is higher in comparison to the entire study area, both for continental and maritime zones; thus, the further north, or deeper into the continent and further from the coastline, the stronger the relationship of DTR with latitude (Figure 3A,C) and longitude (Figure 3B,D). The highest dependence is shown for the relationship between DTR and longitude at locations with maritime climates (Figure 3D); since in this part of the RFE the coastline runs from southwest to northeast, an increase in longitude along the seashore means rapid DTR growth from south to north.
3.2. Intra-Annual Temporal Dynamics of DTR
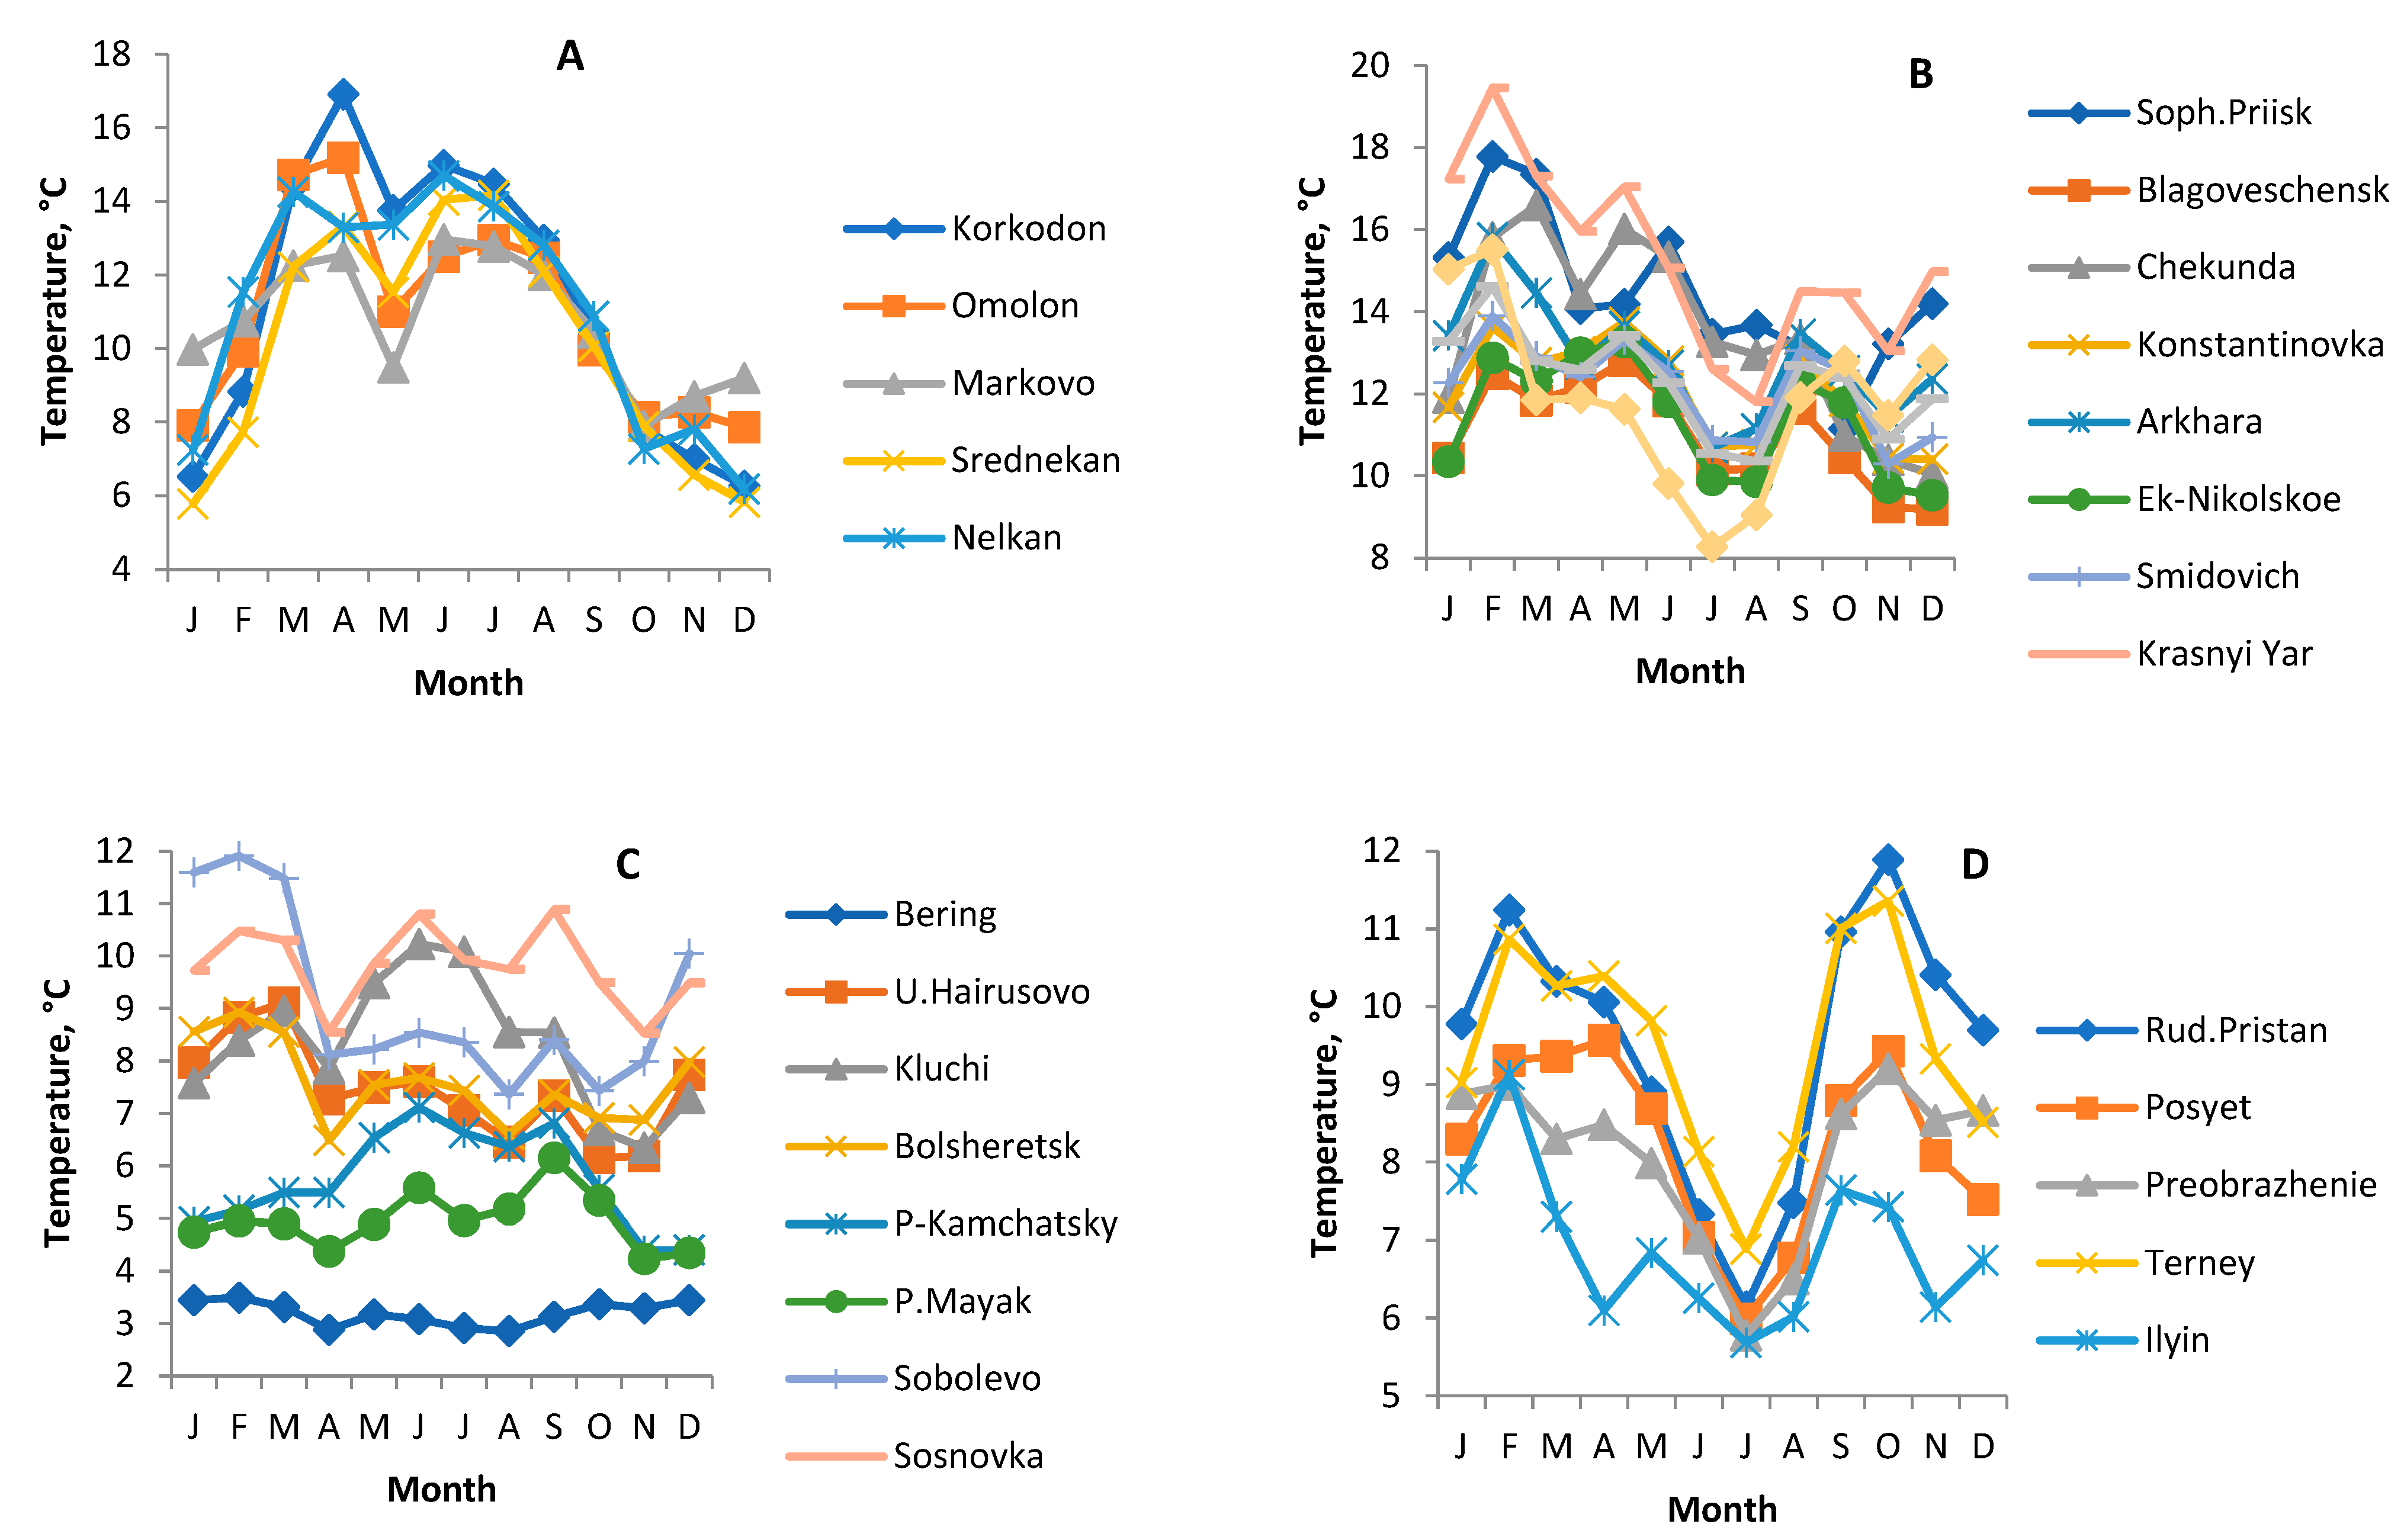
The intra-annual changes in DTR have a large variety, with differences between maximum and minimum monthly DTR during the year ranging from 0.6 °C in Bering Island to 10.4 °C in Korkodon, both located further to the north in maritime and continental climates, respectively. As a whole, the difference is higher for continental locales in comparison to those near the shoreline. In the course of the year, the maximum DTR is detected in February–March for many continental weather stations, switching to April–May for some locations in the north, and with the second peak in September–October. Minimum values are found in both January, for almost all locations, and in July–August at southern weather stations. The coastal area in the south shows an obvious annual course with the minimum in July and two peaks in February and October. Figure 4 gives a thorough picture for several locations at the RFE, showing monthly changes in DTR at continental weather stations vs. coastal, and northern locations vs. southern. The DTR peak in April for continental locations in the north (Figure 4A) is probably due to the rapid spring increase in daytime temperature (Tmax) compared to nighttime temperature (Tmin), which is very obvious at the continent, and cannot be detected near the sea line (Figure 4C). The DTR drop in May (Figure 4A) may be caused by the continued seasonal warming and an increase in both Tmax and Tmin.
Figure 5 shows the details for Khabarovsk vs. Vladivostok, as follows: in continental Khabarovsk, DTR ranges from 7.0 to 11.7 °C, in comparison to coastal Vladivostok, where DTR seasonally changes from 5.5 to 8.0 °C. At both weather stations, maximums are found in spring, specifically in May, but with a much higher value in Khabarovsk; minimum DTR are recorded in December–January for Khabarovsk and in summer for Vladivostok. The second peak in DTR in a yearly course is observed in autumn, in September for Khabarovsk (10.2 °C) and in October for Vladivostok (7.1 °C). These patterns can be explained by the different effects of monsoons throughout the year in continental and coastal areas [38,39]. The cold and relatively stable weather caused by winter monsoons changes in spring. The higher variations in DTR are found in May, due to the transfer of the monsoon from the winter stage to the summer. The summer monsoon behaves differently in two locations; during all summer months, DTR is relatively low in coastal Vladivostok in comparison to continental Khabarovsk. In Vladivostok, cool and changeable weather in June is replaced by very stable warm and hot temperatures in the period from July to August (Figure 5). In autumn, the monsoon moves again from the summer stage to the winter, but with a delay in Vladivostok due to the influence of the Pacific Ocean; the October peak for DTR in Vladivostok is comparable to September in Khabarovsk [40]. Figure 5 shows details of intra-annual DTR changes for the capital cities of Khabarovsk and Vladivostok. Not only the monthly DTR, but also its day-to-day variations are the highest in spring–early summer; the values of the standard deviation reach a maximum in the period from April to June in Khabarovsk, and in June in Vladivostok.
3.3. Tmin, Tmax and DTR: Results for Inter-Annual Temporal Dynamics
Temporal dynamics of all daily temperatures, including minimum, mean, and maximum, as well as DTR, for the weather stations at the RFE during the study period from 2000 to 2019 demonstrate different trends. Mean daily temperatures, Tmean, show a decreasing trend where slope changes from near zero at the south up to 1.25 °C per 10 years in the northern coastal Anadyr in Chukotka (Figure 6). A high positive trend is shown for Tmin for Anadyr, with a slope of 1.35 °C per 10 years, and in continental northern Nelkan (1.13 °C per 10 years). The Tmax trend can be as high as 1.14 °C per 10 years for Anadyr and 0.97 °C per 10 years for continental Markovo in Chukotka (Figure 6). As a whole, higher dynamics are demonstrated for the northern areas.
While all temperatures are rising with spatial and temporal variations, DTR trends are found as being positive, negative, or near zero. The DTR decrease is found for those weather stations, where minimum temperature increase goes quicker than for maximum, and vice versa; a positive trend for DTR dynamics is shown at weather stations where the maximum daily temperature warms faster than the minimum. The highest rate is found for continental Nelkan with a slope of −0.47 °C per 10 years (Figure 6) and coastal Bolshoy Shantar (–0.30 °C per 10 years) in Khabarovsky Krai, and coastal Bolsheretsk (–0.36 °C per 10 years) in Kamchatka. Continentally located Dolinovka in Kamchatka demonstrates the DTR with the highest positive trend of 0.30 °C per 10 years (Figure 6).
Table 2 provides details for dynamics at some weather stations, where trends are significant according to the Mann–Kendall test at the 0.05 level [46,47]. One exception is shown in Table 1, with a non-significant trend for the southern coastal weather station of Rudnaya Pristan in Primorsky Krai, where Tmax shows a decreasing trend with a slope of −0.12 °C per 10 years. The reasons behind should be addressed additionally, emphasizing the fact that all temperature changes have their regionally specific spatial patterns, which can differ from the global trends.
Figure 7 shows the dynamics of all temperatures, including DTR, in Khabarovsk and Vladivostok in the cause of the study period. Despite variations in temperatures due to climatic differences between the two cities (continental vs. maritime), as shown in Table 1, their temporal dynamics are very similar, expressing that their locations are under the same influence of global trends. All temperatures are rising with slightly different speeds. In Vladivostok, a decrease in DTR by 0.17 °C in 10 years is caused by a higher warming trend (0.37 °C in 10 years) of night (minimum) temperatures in comparison to the daytime (maximum) values (0.19 °C in 10 years).
4. Discussion
The short-term fluctuation of air temperature named as diurnal temperature range (DTR) is an important driver for many natural processes, including the health of humans and environment as a whole. The current study attempts to investigate the character of DTR in the Russian Far East, an area known for its large temperature extremes [48], and recent changes in the DTR on an intra- and inter-annual scale, using data from 99 weather stations for the period from 2000 to 2019. The DTR ranges from 8.2 °C at maritime locations to 13.1 °C at continental climates, with extremely high DTR in Toko (16.2 °C) located at the border with Sakha (Yakutia), and the lowest DTR in Mys Alevina (4.7 °C), in the coastal part of the Magadan Region. Our results are consistent with findings for continental locations in the USA, where DTR was shown to be near 13.5 °C [24], and with those who defined smaller DTR in coastal locations in comparison to continental locations [32,49,50]. Our study shows the dependence of DTR from both latitude and longitude, which is expressed more evidently at the southern part of the RFE; the further from the water bodies inside the continent, or the further from the south to the east, the higher the DTR.
The DTR changes significantly from month to month, with a high variability across the study area; the lowest intra-annual dynamics were found to be 0.6 °C in Bering Island, and the highest change of 10.4 °C was found in continental Korkodon. Two regions with more or less clearly homogeneous patterns are found. At the continental far-north weather stations, DTR is at its maximum in May, a period of the most expressed changes in the incoming solar radiation and, consequently, daily variability of air temperature; DTR lowers down to December with extremely cold temperatures throughout the whole day. At the coastal far-south locations, temperature range within the day is lowest in summer in July, and peaks at both ends of winter, namely the beginning of spring in February–March, and in autumn in October. The minimum summertime DTR was also found at the southern continental locations. Low DTR in summer in southern areas of the RFE can lead to problems for people and their health, minimizing the possibility of night cooling relief during heat waves [38].
The DTR as a range of air temperature during the day is extremely sensible to minor fluctuations in both Tmin and Tmax. Our study shows the decreasing trend for DTR during the study period due to the higher increasing rate of minimum daily temperatures in comparison with maximum values, which is consistent with the findings of many researchers for other regions worldwide, where an almost twice higher increasing rate was found for Tmin vs. Tmax [27,32,51,52,53,54]. At the same time, several locations in our study demonstrate the increase in DTR due to the faster increase in the afternoon (Tmax) daily temperatures over the night (Tmin) data. Meanwhile, we found some studies conducted on a regional scale for the tropics and subtropics with the same DTR increasing trends [30,55,56]. Further research is needed to discover any regularity in these spatial patterns.
Some limitations of our research should be mentioned. We were restricted by the meteorological data availability, which was obtained from fixed weather stations to represent the correct exposure on local level. Unfortunately, the vast area of the Russian Far East is rarely covered by the meteorological network, and much data needs intensive corrections and, therefore, cannot be used. Other considerations can also be highlighted with regard to DTR, as follows: the main drivers of temporal changes in diurnal temperature range, both intra- and interannual, must be determined, and it must be determined if it is connected with other short-term fluctuations in air temperature.
4.1. DTR Temporal Dynamics: Reasons behind
Although the intra- and inter-annual changes in diurnal temperature range are easy to calculate, it is not simple to understand the physical reasons behind this phenomenon. The DTR variations are found to be influenced by different natural and anthropogenic factors with geographic and atmospheric natures, such cloud cover, soil moisture, precipitation, greenhouse gases, duration of sunshine, and solar radiation [51,53]. Some researchers show that the main reasons or drivers of DTR change can be low clouds and fog, which moderate the diurnal temperature range through radiative effects [14]. On a seasonal scale, DTR demonstrates a significant negative correlation with cloudiness and precipitation [29]. A negative correlation between the DTR and total cloud cover indicates that the decrease in DTR can be caused by an increase in cloud cover [32].
Cloud cover and precipitation modulate surface energy and hydrological balance, causing DTR reduction [27,51,53]. Contrariwise, precipitation can reduce Tmax and, hence, DTR, due to daytime evaporative cooling [57]. Seasonal variation in global radiation could be attributed to the changes in humidity, air pressure, air temperature, etc. [Ismail 2022]; for example, its decrease in daytime may be caused by a long rainy season with heavy clouds [58,59]. Indeed, these findings indicate a close relationship between the trends in DTR and a preset feedback path for specific seasons and/or geographical locations [57,60].
4.2. Asymmetric Changes in Diurnal Temperature Range: Causes and Challenges
It is well documented that the global warming trend expresses itself in both Tmin and Tmax increases. Asymmetry in their structure is found for most areas around the world, highlighting a faster increase in Tmin compared to Tmax [4,12,13,24,25,26,32], which leads to general trends of DTR decrease [12,13,24,26,27,32,34]. Our research shows the same tendencies for most of the locations, with an up to −0.36 °C per 10 year decreasing trend in coastal Bolsheretsk, located in Kamchatka, as the highest value. Doan and coauthors [61] emphasized that the future warmer climate may be responsible for an increase in daytime clouds, which, in turn leads to a decrease in incoming shortwave radiation and daily ‘underwarming’ and, finally, to a decrease in DTR by about 0.5 °C in mid-latitudes [61]. This asymmetric warming caused by variations in precipitation [62,63,64] and solar radiation [61,62] has a different effect on the greenness of vegetation, which has been shown in temperate China [62]. However, our results demonstrate positive DTR trends at many weather stations, both continental and coastal, with higher maximum daily temperature ranges compared to daily minimum temperature change. For example, DTR trend is positive in Talon (+0.28 °C), Ekaterino-Nikolskoe (+0.24 °C), which are in the continental north and south, respectively, in Dolinovka (+0.30 °C) in continental Kamchatka, or in coastal Magadan in the north (+0.20 °C). A literature review indicates that the same patterns in Tmin, Tmax, and DTR increase for Lafia, Nasarawa State, in Nigeria [65]. Further research with more intensive study is needed to find the reasons for such a diversity in regional trends at the RFE.
4.3. Diurnal Temperature Range vs. Temperature Change between Neighboring Days or Both: Which Is More Dangerous for Human Health?
We know a lot about the influence of sharp short-term air temperature fluctuations in air temperature during the day on the health and well-being of humans and the environment as a whole. At the same time, a crucial effect is shown by many researchers for the relationship between day-to-day dynamics of air temperature and human health [5,7,66,67,68,69,70,71]. The effect of temperature change between neighboring days (TCN) on human health depends on the sign of the change (temperature rise or drop) and can be modified by seasonal variations, which was shown, as an example, for emergency room visits associated with cardiovascular disease in Beijing, China [72]. Furthermore, only a few studies were found evaluating and comparing the effect of two types of short-term temperature change metrics on human health, both DTR and TCN, where young, female, and elderly patients are the most vulnerable groups of the population [73,74,75,76,77]. Wang et al. [23] demonstrated for China that not only an increased risk of emergency room visits but also their high seasonal variations are associated with exposure to a higher DTR and TCN. Furthermore, DTR and TCN were found to have a statistically significant positive correlation with an increased risk of non-accidental mortality in Shenzhen, with greater susceptibility in cold seasons [78]. Some researchers highlighted the higher effect of DTR, e.g., on asthma-related emergency department visits in Seoul, Korea [74] or at cardiac arrest in Hokkaido, Japan [76] while others showed a better correlation of TCN with the health outcomes, e.g., with tuberculosis incidence in Hefei, China [77]. The exact mechanism underlying these processes remains unclear. Some evidence suggests that exposure to a higher DTR as difference between daytime and nighttime air temperature leads to an increase in heart rate, blood pressure, and oxygen uptake, exacerbating stress on the heart and lower respiratory tract [76]. Confounding factors, such as professional and socioeconomic status, may distort the true links between short-term temperature change and human health [77]. More research is needed to find out if these two temperature metrics, DTR and TCN, are interconnected, and which of these two short-term changes in air temperature, or both together with a synergistic effect, is more dangerous for people and their health. Future studies should focus on factors affecting the individual level and examine specific patterns of the impact of temperature changes on human health. In particular, the effect of short-term fluctuations of air temperature on non-accidental and cause-specific mortality can be the next step in our estimations, in order to identify vulnerable populations that mainly suffer from short-term fluctuations in air temperature and, ultimately, to provide a theoretical basis for governments to develop early warning programs with correct and timely protective procedures.
5. Conclusions
The diurnal temperature range (DTR) for different weather stations over the study area in the Russian Far East differs not just in value but also in rate, both decreasing and increasing, as well as in intra-annual changes. Continental weather stations show different patterns depending on northern or southern locations; they all have higher DTR and intra- and inter-annual dynamics in comparison with coastal areas but differ from month to month. The highest DTR in northern continental areas is shown for April and June–July, steadily decreasing to autumn, with the minimum in winter during the period from November until January, and in May. In all southern locations, both continental and coastal, DTR is high in February and low in summer, but have a second peak in autumn in maritime climates. While the time series of maximum and minimum air temperature can help to comprehend the trends in DTR, additional analysis is necessary in upcoming research to assess in detail the various reasons behind the spatial and temporal variations of the DTR trend, as well as their effect on human health in the periods with high DTR, especially in shoulder seasons of spring and autumn. A subsequent joined analysis of both daily temperature amplitude and day-to-day dynamics of weather on the one hand, and the public health indicators, on the other, is necessary to recognize patterns of such a relationship. Further research is needed to identify vulnerable populations that mainly suffer from short-term fluctuations in air temperature to provide a theoretical basis for local governments to develop early warning programs with proper and timely protective procedures.
Funding
This research was funded within the framework of the State Task of ICARP FEB RAS No. 075-00668-23-00 PR.
Institutional Review Board Statement
Not applicable.
Informed Consent Statement
Not applicable.
Data Availability Statement
Not applicable.
Conflicts of Interest
The authors declare no conflict of interest.
References
- McMichael, A.J.; Lindgren, E. Climate change: Present and future risks to health, and necessary responses. J. Int. Med. 2011, 270, 401–413. [Google Scholar] [CrossRef] [PubMed]
- Joshi, M.; Goraya, H.; Joshi, A.; Bartter, T. Climate change and respiratory diseases. Curr. Opinion Pul. Med. 2020, 26, 119–127. [Google Scholar] [CrossRef] [PubMed]
- Lee, W.; Kim, Y.; Sera, F.; Gasparrini, A.; Park, R.; Choi, H.M.; Prifti, K.; Bell, M.L.; Abrutzky, R.; Guo, Y.; et al. Projections of excess mortality related to diurnal temperature range under climate change scenarios: A multi-country modelling study. Lancet Planet. Health 2020, 4, e512–e521. [Google Scholar] [CrossRef]
- Guo, F.; Do, V.; Cooper, R.; Huang, Y.; Zhang, P.; Ran, J.; Zhang, Q.; Tian, L.; Fu, Z. Trends of temperature variability: Which variability and what health implications? Sci. Total Environ. 2021, 768, 144487. [Google Scholar] [CrossRef]
- Lin, H.; Zhang, Y.; Xu, Y.; Xu, X.; Liu, T.; Luo, Y.; Xiao, J.; Wu, W.; Ma, W. Temperature Changes between Neighboring Days and Mortality in Summer: A Distributed Lag Non-Linear Time Series Analysis. PLoS ONE 2013, 8, e66403. [Google Scholar] [CrossRef] [PubMed]
- Cheng, J.; Xu, Z.; Zhu, R.; Wang, X.; Jin, L.; Song, J.; Su, H. Impact of diurnal temperature range on human health: A systematic review. Int. J. Biometeorol. 2014, 58, 2011–2024. [Google Scholar] [CrossRef] [PubMed]
- Ding, Z.; Guo, P.; Xie, F.; Chu, H.; Li, K.; Pu, J.; Pang, S.; Dong, H.; Liu, Y.; Pi, F.; et al. Impact of diurnal temperature range on mortality in a high plateau area in southwest China: A time series analysis. Sci. Total Environ. 2015, 526, 358–365. [Google Scholar] [CrossRef]
- Davis, R.E.; Hondula, D.M.; Sharif, H. Examining the diurnal temperature range enigma: Why is human health related to the daily change in temperature? Int. J. Biometeorol. 2020, 64, 397–407. [Google Scholar] [CrossRef]
- Ponjoan, A.; Blanch, J.; Alves-Cabratosa, L.; Lluch, R.M.; Comas-Cufí, M.; Parramon, D.; García-Gil, M.M.; Ramos, R.; Petersen, I. Extreme diurnal temperature range and cardiovascular emergency hospitalisations in a Mediterranean region. Occup. Environ. Med. 2021, 78, 62–68. [Google Scholar] [CrossRef]
- Zha, Q.; Chai, G.; Zhang, Z.G.; Sha, Y.; Su, Y. Effects of diurnal temperature range on cardiovascular disease hospital admissions in farmers in China’s Western suburbs. Environ. Sci. Pollut. Res. 2021, 28, 64693–64705. [Google Scholar] [CrossRef]
- Braganza, K.; Karoly, D.J.; Arblaster, J.M. Diurnal temperature range as an index of global climate change during the twentieth century. Geophys. Res. Lett. 2004, 31, L13217. [Google Scholar] [CrossRef]
- Sunoj, V.J.; Shroyer, K.J.; Jagadish, S.K.; Prasad, P.V. Diurnal temperature amplitude alters physiological and growth response of maize (Zea mays L.) during the vegetative stage. Environ. Exp. Bot. 2016, 130, 113–121. [Google Scholar] [CrossRef]
- Ehbrecht, M.; Schall, P.; Ammer, C.; Fischer, M.; Seidel, D. Effects of structural heterogeneity on the diurnal temperature range in temperate forest ecosystems. For. Ecol. Manag. 2019, 432, 860–867. [Google Scholar] [CrossRef]
- Jang, Y.-S.; Shen, S.-F.; Juang, J.-Y.; Huang, C.-Y.; Lo, M.-H. Discontinuity of diurnal temperature range along elevated regions. Geophys. Res. Lett. 2022, 49, e2021GL097551. [Google Scholar] [CrossRef]
- Xie, W.; Wang, S.; Yan, X. Evaluation and Projection of Diurnal Temperature Range in Maize Cultivation Areas in China Based on CMIP6 Models. Sustainability 2022, 14, 1660. [Google Scholar] [CrossRef]
- Lim, Y.H.; Reid, C.E.; Mann, J.K.; Jerrett, M.; Kim, H. Diurnal temperature range and short-term mortality in large US communities. Int. J. Biometeorol. 2015, 59, 1311–1319. [Google Scholar] [CrossRef]
- Lee, W.; Bell, M.L.; Gasparrini, A.; Armstrong, B.G.; Sera, F.; Hwang, S.; Lavigne, E.; Zanobetti, A.; Coelho, M.D.S.Z.S.; Saldiva, P.H.N.; et al. Mortality burden of diurnal temperature range and its temporal changes: A multi-country study. Environ. Int. 2018, 110, 123–130. [Google Scholar] [CrossRef]
- Lim, Y.H.; Hong, Y.C.; Kim, H. Effects of diurnal temperature range on cardiovascular and respiratory hospital admissions in Korea. Sci. Total Environ. 2012, 417, 55–60. [Google Scholar] [CrossRef]
- Lim, Y.H.; Park, A.K.; Kim, H. Modifiers of diurnal temperature range and mortality association in six Korean cities. Int. J. Biometeorol. 2012, 56, 33–42. [Google Scholar] [CrossRef]
- Guo, Y.; Gasparrini, A.; Armstrong, B.G.; Tawatsupa, B.; Tobias, A.; Lavigne, E.; Coelho, M.S.; Pan, X.; Kim, H.; Hashizume, M.; et al. Temperature variability and mortality: A multi-country study. Environ. Health Perspect. 2016, 124, 1554–1559. [Google Scholar] [CrossRef]
- Wang, M.Z.; Zheng, S.; He, S.L.; Li, B.; Teng, H.J.; Wang, S.G.; Yin, L.; Shang, K.-Z.; Li, T.-S. The association between diurnal temperature range and emergency room admissions for cardiovascular, respiratory, digestive and genitourinary disease among the elderly: A time series study. Sci. Total Environ. 2013, 456, 370–375. [Google Scholar] [CrossRef] [PubMed]
- Zhang, Y.; Yu, C.; Yang, J.; Zhang, L.; Cui, F. Diurnal Temperature Range in Relation to Daily Mortality and Years of Life Lost in Wuhan, China. Int. J. Environ. Res. Public Health 2017, 14, 891. [Google Scholar] [CrossRef] [PubMed]
- Wang, Y.; Ye, D.; Cheng, Y.; Liu, Y.; Li, N.; Wang, Y.; Bi, P.; Tong, S.; Li, Y.; Yao, X. Seasonal variation in association between temperature change and emergency department visits: A multi-site study in China. Environ. Res. 2022, 214, 113963. [Google Scholar] [CrossRef]
- Qu, M.; Wan, J.; Hao, X. Analysis of diurnal air temperature range change in the continental United States. Weather. Clim. Extrem. 2014, 4, 86–95. [Google Scholar] [CrossRef] [Green Version]
- Davy, R.; Esau, I.; Chernokulsky, A.; Outten, S.; Zilitinkevich, S. Diurnal asymmetry to the observed global warming. Int. J. Climatol. 2017, 37, 79–93. [Google Scholar] [CrossRef] [Green Version]
- Vinnarasi, R.; Dhanya, C.T.; Chakravorty, A.; AghaKouchak, A. Unravelling Diurnal Asymmetry of Surface Temperature in Different Climate Zones. Sci. Rep. 2017, 7, 7350. [Google Scholar] [CrossRef] [Green Version]
- Sun, X.; Ren, G.; You, Q.; Ren, Y.; Xu, W.; Xue, X.; Zhan, Y.; Zhang, S.; Zhang, P. Global diurnal temperature range (DTR) changes since 1901. Clim. Dyn. 2019, 52, 3343–3356. [Google Scholar] [CrossRef]
- Azarderakhsh, M.; Prakash, S.; Zhao, Y.; AghaKouchak, A. Satellite-Based Analysis of Extreme Land Surface Temperatures and Diurnal Variability Across the Hottest Place on Earth. IEEE Geosci. Remote Sens. Lett. 2020, 17, 2025–2029. [Google Scholar] [CrossRef]
- Hamal, K.; Sharma, S.; Talchabhadel, R.; Ali, M.; Dhital, Y.P.; Xu, T.; Dawadi, B. Trends in the Diurnal Temperature Range over the Southern Slope of Central Himalaya: Retrospective and Prospective Evaluation. Atmosphere 2021, 12, 1683. [Google Scholar] [CrossRef]
- Ongoma, V.; Rahman, M.A.; Ayugi, B.; Nisha, F.; Galvin, S.; Shilenje, Z.W.; Ogwang, B.A. Variability of diurnal temperature range over Pacific Island countries, a case study of Fiji. Meteorol. Atmos. Phys. 2021, 133, 85–95. [Google Scholar] [CrossRef]
- Zhao, Y.; Norouzi, H.; Azarderakhsh, M.; AghaKouchak, A. Global Patterns of Hottest, Coldest, and Extreme Diurnal Variability on Earth. Bull. Amer. Meteorol. Soc. 2021, 102, E1672–E1681. [Google Scholar] [CrossRef]
- Shelton, S.; Pushpawela, B.; Liyanage, G. The long-term trend in the diurnal temperature range over Sri Lanka from 1985 to 2017 and its association with total cloud cover and rainfall. J. Atm. Sol.-Terr. Phys. 2022, 227, 105810. [Google Scholar] [CrossRef]
- Song, S.; Yan, X. Evaluation of events of extreme temperature change between neighboring days in CMIP6 models over China. Theor. Appl. Climatol. 2022, 150, 53–72. [Google Scholar] [CrossRef]
- Guan, X.; Cao, C.; Zeng, X.; Sun, W. Evidence of decreasing diurnal temperature range in eastern Northern Hemisphere. Environ. Res. Commun. 2022, 4, 031004. [Google Scholar] [CrossRef]
- Shree, S.; Kumar, M.; Singh, A. Exploring spatial and temporal trends of diurnal temperature range in the region of the Subarnarekha river basin India. Spat. Inf. Res. 2021, 29, 149–162. [Google Scholar] [CrossRef]
- Babina, E.D.; Semenov, V.A. Intramonthly Variability of Daily Surface Air Temperature in Russia in 1970–2015. Russ. Meteorol. Hydrol. 2019, 44, 513–522. [Google Scholar] [CrossRef]
- Semenov, V.A. Modern Arctic Climate Research: Progress, Change of Concepts, and Urgent Problems. Izv. Atmos. Ocean. Phys. 2021, 57, 18–28. [Google Scholar] [CrossRef]
- Grigorieva, E.A. Spatio-temporal dynamics in changes of the air temperature daily amplitude at the Russian Far East. Reg. Probl. 2022, 25, 19–21. [Google Scholar] [CrossRef]
- Vyshkvarkova, E.; Sukhonos, O. Compound Extremes of Air Temperature and Precipitation in Eastern Europe. Climate 2022, 10, 133. [Google Scholar] [CrossRef]
- Alisov, B.P. Climate of the USSR; Vyisshaya Shkola: Moscow, Russia, 1956. (In Russian) [Google Scholar]
- Grigorieva, E.A.; de Freitas, C.R. Temporal dynamics of precipitation in an extreme mid-latitude monsoonal climate. Theor. Appl. Climatol. 2014, 116, 1–9. [Google Scholar] [CrossRef]
- Grigorieva, E.A. Evaluating the Sensitivity of Growing Degree Days as an Agro-Climatic Indicator of the Climate Change Impact: A Case Study of the Russian Far East. Atmosphere 2020, 11, 404. [Google Scholar] [CrossRef] [Green Version]
- Peel, M.C.; Finlayson, B.L.; Mcmahon, T.A. Updated world map of the Köppen-Geiger climate classification. Hydrol. Earth Syst. Sci. 2007, 11, 1633–1644. [Google Scholar] [CrossRef] [Green Version]
- Beck, H.E.; Zimmermann, N.E.; McVicar, T.R.; Vergopolan, N.; Berg, A.; Wood, E.F. Present and future Köppen-Geiger climate classification maps at 1-km resolution. Sci. Data 2018, 5, 180214. [Google Scholar] [CrossRef] [PubMed] [Green Version]
- World Data Center in Obninsk. Available online: http://meteo.ru/data (accessed on 30 July 2022).
- Mann, H.B. Nonparametric tests against trend. Econometrica 1945, 13, 245–259. [Google Scholar] [CrossRef]
- Kendall, M.G. Rank Correlation Methods; Griffin: London, UK, 1975. [Google Scholar]
- Grigorieva, E.A.; Matzarakis, A.; de Freitas, C.R. Analysis of growing degree-days as a climate impact indicator in a region with extreme annual air temperature amplitude. Clim. Res. 2010, 42, 143–154. [Google Scholar] [CrossRef] [Green Version]
- Mikolaskova, K. Continental and oceanic precipitation regime in Europe. Cent. Eur. J. Geosci. 2009, 1, 176–182. [Google Scholar] [CrossRef]
- Scheitlin, K. The maritime influence on diurnal temperature range in the Chesapeake Bay area. Earth Interact. 2013, 17, 1–14. [Google Scholar] [CrossRef]
- Dai, A.; Trenberth, K.E.; Karl, T.R. Effects of clouds, soil moisture, precipitation, and water vapor on diurnal temperature range. J. Clim. 1999, 12, 2451–2473. [Google Scholar] [CrossRef]
- New, M.; Hulme, M.; Jones, P. Representing twentieth-century space–time climatevariability. Part II: Development of 1901–96 monthly grids of terrestrial surface climate. J. Clim. 2000, 13, 2217–2238. [Google Scholar] [CrossRef]
- Stone, D.A.; Weaver, A.J. Daily maximum and minimum temperature trends in a climate model. Geophys. Res. Lett. 2002, 29, 9. [Google Scholar] [CrossRef]
- Alexander, L.V.; Zhang, X.; Peterson, T.C.; Caesar, J.; Gleason, B.; Klein Tank, A.M.G.; Haylock, M.; Collins, D.; Trewin, B.; Rahimzadeh, F.; et al. Global observed changes in daily climate extremes of temperature and precipitation. J. Geophys. Res. Atmosphere 2006, 111, 1042–1063. [Google Scholar] [CrossRef] [Green Version]
- Peralta-Hernandez, A.R.; Balling, R.C., Jr.; Barba-Martinez, L.R. Analysis of near-surface diurnal temperature variations and trends in southern Mexico. Int. J. Climatol. 2009, 29, 205–209. [Google Scholar] [CrossRef]
- Shahid, S.; Harun, S.B.; Katimon, A. Changes in diurnal temperature range in Bangladesh during the time period 1961–2008. Atmos. Res. 2012, 118, 260–270. [Google Scholar] [CrossRef]
- Zhou, L.; Dai, A.; Dai, Y.; Vose, R.S.; Zou, C.-Z.; Tian, Y.; Chen, H. Spatial dependence of diurnal temperature range trends on precipitation from 1950 to 2004. Clim. Dynam. 2009, 32, 429–440. [Google Scholar] [CrossRef]
- Onyango, A.O.; Ongoma, V. Estimation of mean monthly global solar radiation using sunshine hours for Nairobi City, Kenya. J. Renew. Sustain. Energy 2015, 7, 053105. [Google Scholar] [CrossRef]
- Ismail, A.H. Prediction of global solar radiation from sunrise duration using regression functions. Kuwait J. Sci. 2022, 49, 1–8. [Google Scholar] [CrossRef]
- Sun, D.; Pinker, R. Factors contributing to the spatial variability of satellite estimates of diurnal temperature range in the United States. Geosci. Rem. Sens. Lett. IEEE 2014, 11, 1524–1528. [Google Scholar] [CrossRef]
- Doan, Q.V.; Chen, F.; Asano, Y.; Gu, Y.; Nishi, A.; Kusaka, H.; Niyogi, D. Causes for Asymmetric Warming of Sub-Diurnal Temperature Responding to Global Warming. Geophys. Res. Lett. 2022, 49, e2022GL100029. [Google Scholar] [CrossRef]
- Du, Z.; Zhao, J.; Liu, X.; Wu, Z.; Zhang, H. Recent asymmetric warming trends of daytime versus nighttime and their linkages with vegetation greenness in temperate China. Environ. Sci. Pollut. Res. Int. 2019, 26, 35717–35727. [Google Scholar] [CrossRef]
- Sun, X.; Wang, C.; Ren, G. Changes in the diurnal temperature range over East Asia from 1901 to 2018 and its relationship with precipitation. Clim. Chang. 2021, 166, 44. [Google Scholar] [CrossRef]
- Liu, L.; Dong, Z.; Gong, H.; Wang, L.; Chen, W.; Wu, R. Climatology and trends of wintertime diurnal temperature range over East Asia in CMIP6 models: Evaluation and attribution. Atm. Res. 2022, 280, 106438. [Google Scholar] [CrossRef]
- Agidi, V.A.; Ogah, H.; Ulor, C.; Baleri, G.T. Diurnal Temperature Range as Index of Climate Change in Lafia, Nasarawa State, Nigeria. J. Appl. Sci. Environ. Manag. 2022, 26, 233–236. [Google Scholar] [CrossRef]
- Grigorieva, E.A.; Kiryantseva, L.P. Weather conditions as a risk factor for the development of respiratory diseases of the population and measures for their prevention on the example of student youth. Bull. Physiol. Pathol. Respirat. 2014, 51, 62–68. [Google Scholar]
- Grigorieva, E.A.; Kiryantseva, L.P. Cardiorespiratory morbidity caused by seasonal weather changes and measures for its prevention. Newsl. Public Health Habitat 2016, 2, 7–10. [Google Scholar]
- Zhan, Z.; Zhao, Y.; Pang, S.; Zhong, X.; Wu, C.; Ding, Z. Temperature change between neighboring days and mortality in United States: A nationwide study. Sci. Total Environ. 2017, 584, 1152–1161. [Google Scholar] [CrossRef] [PubMed]
- Grigorieva, E.A. Day-to-day changes in air temperature in the southern part of the Russian Far East. Reg. Probl. 2021, 24, 11–18. [Google Scholar] [CrossRef]
- Grigorieva, E.A.; Glagolev, V.A. Intra-annual dynamics of mortality rates in cities in the southern part of the Russian Far East. Reg. Probl. 2021, 24, 19–24. [Google Scholar] [CrossRef]
- Zhou, C.-L.; Lv, L.-S.; Jin, D.-H.; Xie, Y.-J.; Ma, W.-J.; Hu, J.-X.; Wang, C.-E.; Xu, Y.-Q.; Zhang, X.-E.; Lu, C. Temperature Change between Neighboring Days Contributes to Years of Life Lost per Death from Respiratory Disease: A Multicounty Analysis in Central China. Int. J. Environ. Res. Public Health 2022, 19, 5871. [Google Scholar] [CrossRef]
- Ma, P.; Zhang, Y.; Wang, X. Effect of diurnal temperature change on cardiovascular risks differed under opposite temperature trends. Environ. Sci. Pollut. Res. 2021, 28, 39882–39891. [Google Scholar] [CrossRef]
- Guo, Y.; Barnett, A.G.; Yu, W.; Pan, X.; Ye, X.; Huang, C.; Tong, S. A large change in temperature between neighbouring days increases the risk of mortality. PLoS ONE 2011, 6, e16511. [Google Scholar] [CrossRef] [Green Version]
- Kim, J.; Lim, Y.; Kim, H. Outdoor temperature changes and emergency department visits for asthma in Seoul, Korea: A time-series study. Environ. Res. 2014, 135, 15–20. [Google Scholar] [CrossRef] [PubMed]
- Xu, J.; Zhao, D.; Su, H.; Xie, M.; Cheng, J.; Wang, X.; Li, K.; Yang, H.; Wen, L.; Wang, B. Impact of temperature variability on childhood hand, foot and mouth disease in Huainan, China. Public Health 2015, 134, 86–94. [Google Scholar] [CrossRef] [PubMed]
- Onozuka, D.; Hagihara, A. Associations of day-to-day temperature change and diurnal temperature range with out-of-hospital cardiac arrest. Eur. J. Prev. Cardiol. 2017, 24, 204–212. [Google Scholar] [CrossRef]
- Huang, K.; Yang, X.J.; Hu, C.Y.; Ding, K.; Jiang, W.; Hua, X.G.; Liu, J.; Cao, J.-Y.; Sun, C.-Y.; Zhang, T.; et al. Short-term effect of ambient temperature change on the risk of tuberculosis admissions: Assessments of two exposure metrics. Environ. Res. 2020, 189, 109900. [Google Scholar] [CrossRef]
- Xiao, Y.; Meng, C.; Huang, S.; Duan, Y.; Liu, G.; Yu, S.; Peng, J.; Cheng, J.; Yin, P. Short-Term Effect of Temperature Change on Non-Accidental Mortality in Shenzhen, China. Int. J. Environ. Res. Public Health 2021, 18, 8760. [Google Scholar] [CrossRef] [PubMed]
Figure 1.
The Far Eastern Federal District (FEFD) of Russia, showing all regions of the study area, as follows: 1—Chukotsky Autonomous Okrug (Chukotka); 2—Magadan Region; 3—Khabarovsky Krai; 4—Amur Region; 5—Jewish Autonomous Region; 6—Primorsky Krai; 7—Kamchatsky Krai; 8—Sakhalin Region. The capital cities of the FEFD are as follows: Khabarovsk (2002–2018) and Vladivostok (2018–present). Black dots show the location of weather stations.

Figure 2.
Scatterplots of diurnal temperature range (DTR) vs. latitude (A,C) and longitude (B,D) for locations in the Russian Far East for the period 2000–2019; (A,B) continental weather stations, (C,D) maritime weather stations. Black solid line is plotted as the least-square linear regression.
Figure 2.
Scatterplots of diurnal temperature range (DTR) vs. latitude (A,C) and longitude (B,D) for locations in the Russian Far East for the period 2000–2019; (A,B) continental weather stations, (C,D) maritime weather stations. Black solid line is plotted as the least-square linear regression.

Figure 3.
Scatterplots of diurnal temperature range (DTR) vs. latitude (A,C) and longitude (B,D) for locations at the southern part of the Russian Far East for the period 2000–2019; (A,B) continental weather stations, (C,D) maritime weather stations. Black solid line is plotted as the least-square linear regression.

Figure 4.
Intra-annual fluctuations of DTR from January to December in several locations in the RFE; continental (A,B), coastal (C,D); northern (A,C), southern (B,D).
Figure 4.
Intra-annual fluctuations of DTR from January to December in several locations in the RFE; continental (A,B), coastal (C,D); northern (A,C), southern (B,D).

Figure 5.
Intra-annual fluctuations of DTR from January to December in Khabarovsk and Vladivostok. Black bars show standard deviations.
Figure 5.
Intra-annual fluctuations of DTR from January to December in Khabarovsk and Vladivostok. Black bars show standard deviations.

Figure 6.
Temporal dynamics of minimum, mean, maximum air temperatures, and DTR, for several weather stations at the RFE during the study period from 2000 to 2019. Black solid lines show the linear trend of the correspondent series.
Figure 6.
Temporal dynamics of minimum, mean, maximum air temperatures, and DTR, for several weather stations at the RFE during the study period from 2000 to 2019. Black solid lines show the linear trend of the correspondent series.

Figure 7.
Temporal dynamics of minimum, mean, maximum air temperatures, and DTR, in capital cities of the RFE: Khabarovsk (A) and Vladivostok (B), during the study period from 2000 to 2019. Black solid lines show the linear trend of the correspondent series.
Figure 7.
Temporal dynamics of minimum, mean, maximum air temperatures, and DTR, in capital cities of the RFE: Khabarovsk (A) and Vladivostok (B), during the study period from 2000 to 2019. Black solid lines show the linear trend of the correspondent series.


Table 1.
Yearly statistics of minimum (Tmin), mean (Tmean), and maximum (Tmax) air temperature, and diurnal temperature range (DTR), °C, for the locales at the Russian Far East, 2000–2019.
Table 1.
Yearly statistics of minimum (Tmin), mean (Tmean), and maximum (Tmax) air temperature, and diurnal temperature range (DTR), °C, for the locales at the Russian Far East, 2000–2019.
| Tmin | Tmean | Tmax | DTR | |
|---|---|---|---|---|
| Omolon (65°14′ N, 160°33′ E) | ||||
| Mean 1 | −16.0 | −10.4 | −5.0 | 11.0 |
| Min | −61.1 | −57.5 | −53.2 | 0.8 |
| Max | 17.5 | 25.1 | 34.0 | 40.6 |
| SD | 17.50 | 17.68 | 17.92 | 4.57 |
| Posyet (42°40′ N, 130°48′ E) | ||||
| Mean | 3.5 | 6.8 | 11.7 | 8.2 |
| Min | −23.9 | −21.2 | −18.1 | 0.6 |
| Max | 25.0 | 28.7 | 35.3 | 26.7 |
| SD | 9.78 | 9.54 | 9.66 | 2.66 |
| Khabarovsk (48°31′ N, 135°10′ E) | ||||
| Mean | −1.2 | +2.8 | +7.7 | 9.3 |
| Min | −40.0 | −34.4 | −27.5 | 1.0 |
| Max | +25.9 | +30.6 | +36.4 | 23.9 |
| SD | 12.98 | 13.39 | 14.10 | 2.80 |
| Vladivostok (43°80′ N, 131°90′ E) | ||||
| Mean | +2.4 | +5.2 | +9.3 | 6.9 |
| Min | −27.2 | −24.5 | −21.8 | 0.7 |
| Max | +23.4 | +26.8 | +32.8 | 19.3 |
| SD | 10.13 | 10.01 | 10.12 | 2.23 |
1 Mean, Min, and Max indicate mean, minimum, and maximum daily values for the whole period, respectively; SD is standard deviation.
Table 2.
Temporal trends (°C per 10 years) of daily temperatures for some continental and coastal locations at the Russian Far East, where trends are significant according to the Mann–Kendall test at the 0.05 level, 2000–2019.
Table 2.
Temporal trends (°C per 10 years) of daily temperatures for some continental and coastal locations at the Russian Far East, where trends are significant according to the Mann–Kendall test at the 0.05 level, 2000–2019.
| Weather Station/Trend | Tmin | Tmean | Tmax | DTR |
|---|---|---|---|---|
| Continental | ||||
| Korcodon | 0.76 | 0.85 | 0.80 | 0.11 |
| Omolon | 0.68 | 0.83 | 0.82 | 0.14 |
| Markovo | 0.77 | 0.94 | 0.97 | 0.19 |
| Nelkan | 1.13 | 0.86 | 0.67 | −0.47 |
| Norsk | 0.66 | 0.66 | 0.62 | −0.04 |
| Bogorodskoye | 0.43 | 0.38 | 0.39 | −0.06 |
| Nizhnetambovskoe | 0.72 | 0.54 | 0.33 | −0.28 |
| Bomnak | 0.20 | 0.24 | 0.15 | −0.05 |
| Skovorodino | 0.66 | 0.54 | 0.84 | 0.15 |
| Dzhalina | 0.33 | 0.38 | 0.46 | 0.13 |
| Talon | 0.39 | 0.54 | 0.67 | 0.28 |
| Blagoveshchensk | 0.18 | 0.28 | 0.18 | 0.00 |
| Arkhara | 0.06 | 0.08 | 0.26 | 0.20 |
| Ekaterino-Nickolskoye | 0.05 | 0.25 | 0.29 | 0.24 |
| Khabarovsk | 0.38 | 0.34 | 0.19 | −0.20 |
| Lermontovka | 0.37 | 0.34 | 0.22 | −0.17 |
| Esso | 0.31 | 0.43 | 0.49 | 0.15 |
| Kluchi | 0.57 | 0.68 | 0.70 | 0.11 |
| Dolinovka | 0.17 | 0.37 | 0.48 | 0.30 |
| Nachiki | 0.44 | 0.48 | 0.43 | −0.04 |
| Sosnovka | 0.26 | 0.26 | 0.41 | 0.13 |
| Pogranichnyi | 0.20 | 0.27 | 0.17 | −0.03 |
| Sviyagino | 0.23 | 0.42 | 0.30 | −0.06 |
| Timiryazevo | 0.62 | 0.53 | 0.41 | −0.21 |
| Tymovskoye | 0.67 | 0.68 | 0.68 | 0.01 |
| Coastal | ||||
| Bering Island | 0.38 | 0.43 | 0.48 | 0.11 |
| Ust-Khairusovo | 0.40 | 0.55 | 0.58 | 0.17 |
| Bolsheretsk | 0.55 | 0.41 | 0.20 | −0.36 |
| Petrpavlovsk-Kamchatsky | 0.70 | 0.77 | 0.94 | 0.24 |
| Petropavlovsky Mayak | 0.25 | 0.32 | 0.38 | 0.12 |
| Anadyr | 1.35 | 1.25 | 1.14 | −0.19 |
| Ola | 0.64 | 0.73 | 0.62 | −0.02 |
| Alevino | 0.77 | 0.78 | 0.70 | −0.08 |
| Magadan | 0.62 | 0.71 | 0.82 | 0.20 |
| Okhotsk | 0.57 | 0.53 | 0.51 | −0.04 |
| Ayan | 0.34 | 0.35 | 0.31 | −0.04 |
| Bolshoy Shantar | 0.36 | 0.60 | 0.65 | −0.30 |
| Dzhana | 0.34 | 0.31 | 0.21 | −0.12 |
| Nickolaevsk-on-Amur | 0.25 | 0.49 | 0.46 | 0.19 |
| Dzhaore | 0.65 | 0.57 | 0.40 | −0.25 |
| Rudnaya Pristan | 0.16 | 0.07 | −0.12 | −0.28 |
| Vladivostok | 0.37 | 0.31 | 0.19 | −0.17 |
| Moskalvo | 0.30 | 0.45 | 0.49 | 0.18 |
| Nogliki | 0.41 | 0.45 | 0.56 | 0.16 |
| Aleksandrovsk-Sakhalinskyi | 0.55 | 0.50 | 0.41 | −0.14 |
| Uglegorsk | 0.25 | 0.25 | 0.26 | 0.00 |
| Poronaysk | 0.27 | 0.37 | 0.43 | 0.16 |
| Ilyinskoe | 0.30 | 0.20 | 0.19 | −0.12 |
| Nevelsk | 0.41 | 0.26 | 0.21 | −0.20 |
| Yuzhno-Sakhalinsk | 0.32 | 0.41 | 0.37 | −0.05 |
| Yuzhno-Kurilsk | 0.40 | 0.36 | 0.31 | −0.08 |
| Kurilsk | 0.53 | 0.39 | 0.29 | −0.22 |
Disclaimer/Publisher’s Note: The statements, opinions and data contained in all publications are solely those of the individual author(s) and contributor(s) and not of MDPI and/or the editor(s). MDPI and/or the editor(s) disclaim responsibility for any injury to people or property resulting from any ideas, methods, instructions or products referred to in the content. |
© 2022 by the author. Licensee MDPI, Basel, Switzerland. This article is an open access article distributed under the terms and conditions of the Creative Commons Attribution (CC BY) license (https://creativecommons.org/licenses/by/4.0/).
Share and Cite
MDPI and ACS Style
Grigorieva, E. Spatial-Temporal Dynamics of Diurnal Temperature Range: Russian Far East as a Case Study. Atmosphere 2023, 14, 41. https://doi.org/10.3390/atmos14010041
AMA Style
Grigorieva E. Spatial-Temporal Dynamics of Diurnal Temperature Range: Russian Far East as a Case Study. Atmosphere. 2023; 14(1):41. https://doi.org/10.3390/atmos14010041
Chicago/Turabian StyleGrigorieva, Elena. 2023. "Spatial-Temporal Dynamics of Diurnal Temperature Range: Russian Far East as a Case Study" Atmosphere 14, no. 1: 41. https://doi.org/10.3390/atmos14010041
Note that from the first issue of 2016, this journal uses article numbers instead of page numbers. See further details here.