Article

Resilience of Pinus durangensis Martínez in Extreme Drought Periods: Vertical and Horizontal Response of Tree Rings

by
Citlalli Cabral-Alemán
1,
José Villanueva-Díaz
2,*,
Gerónimo Quiñonez-Barraza
3 and
Armando Gómez-Guerrero
4
1
Unidad Regional Universitaria de Zonas Áridas, Universidad Autónoma Chapingo, Carretera Gómez Palacio—Ciudad Juárez, km 40, Bermejillo 35230, Durango, Mexico
2
Centro Nacional de Investigación Disciplinaria Relación Agua-Suelo-Planta Atmósfera (INIFAP-CENID-RASPA), Instituto Nacional de Investigaciones Forestales Agrícolas y Pecuarias, Margen Derecha del Canal Sacramento km 6.5, Gómez Palacio 35140, Durango, Mexico
3
Instituto Nacional de Investigaciones Forestales Agrícolas y Pecuarias, Campo Experimental Valle del Guadiana (INIFAP-CEVAG), km 4.5 Carretera Durango-Mezquital, Durango 34170, Durango, Mexico
4
Posgrado en Ciencias Forestales, Colegio de Postgraduados, km 36.5 Carretera México-Texcoco, Texcoco 56230, Estado de México, Mexico
*
Author to whom correspondence should be addressed.
Atmosphere 2023, 14(1), 43; https://doi.org/10.3390/atmos14010043
Submission received: 6 December 2022 / Revised: 21 December 2022 / Accepted: 23 December 2022 / Published: 26 December 2022
(This article belongs to the Special Issue Climate Change Impact on the Forest Hydrological Cycle)

Abstract

:
Extreme drought events reduce the productivity of forest ecosystems. One approach for estimating the effects of drought on forests is by assessing their resilience. The objective of this study was to estimate resilience rates at different heights along the tree stem of Pinus durangensis Martínez. The radial growth of 200 cross sections extracted at four heights of tree stems (0.07–0.15, 1.3, 6.3, and 11.0–12.0 m) was analyzed and subsequently transformed into ring-width indices (RWI). These indices were correlated with the Standardized Precipitation-Evapotranspiration Index on a six-month time scale (accumulated drought of six months in the period February–May; SPEI06FM). Seven extreme drought events were identified (1890, 1902, 1956, 1974, 1999, 2006, 2011), and radial growth before, during, and after each event was determined. Based on ring-width index values, resistance, recovery, and resilience indices were calculated. The results indicated a significant correlation (p ≤ 0.05) between annual radial increment and climate indices along the stem (0.56 to 0.80). Climatic sensitivity was higher in the lower part of the stem, with mean sensitivity (MS) and expressed population signal (EPS) values of 0.38 and 0.97, respectively. Resistance index values ranged from 0.44 to 0.76 and were better expressed in higher sections of the stem. Resilience indices changed over time. Regardless of the height of the tree stem, the latest extreme drought events (1999, 2006, and 2011) have led to a lower resilience of trees, indicating that their recovery capacity has decreased. Therefore, forestry practices in the study area may consider managing tree density as a strategy to regulate the stress in competition and to increase the tolerance of trees to drought.

1. Introduction

Forest ecosystems have been seriously affected by frequent climate variations in recent decades [1,2,3,4]. The intensity of drought events is one of the main drivers of disturbance, leading to a reduction in tree growth [5], and on occasion to the dieback of trees [6,7,8]. However, the growth recovery of forest ecosystems after a disturbance event varies with the local climate and species [9]. Another factor that also influences this behavior is forest structure, which regulates resource supply, uptake, and use efficiency [10].
In terms of species, it has been reported that those belonging to the Pinaceae family (mainly pines) are less resilient than those belonging to the Fagaceae family (mainly oaks) in the face of extreme drought events [9]. This finding may be relevant to the prevailing conditions of the Sierra Madre Occidental (SMO) of Mexico [11], which presents the greatest diversity of associations of pines and oaks worldwide [12]. This places Mexico as a secondary center of diversity of the genus Pinus, having about 42% of the species and a high percentage of endemism (>55%) [13]. Among these species, Pinus durangensis Martínez is one of the most important due to its distribution area (143,000 km2), wood quality, commercial value, and for being a key component for the conservation of the SMO’s biodiversity [14,15]. However, its extensive logging has reduced the abundance of large trees in many areas, placing it on the International Union for Conservation of Nature’s Red List of Threatened Species as Near Threatened [16]. In addition, the susceptibility of P. durangensis to extreme drought events has been reflected in radial growth rates [17,18], which may compromise its resilience [19].
In view of concerns about the increasing frequency of extreme drought events in recent years, research efforts have focused on understanding the response of forests to extreme drought [20,21,22,23,24]. Significantly, the analysis of pre- and post-disturbance growth has led to the development of indices, such as quantifiable resilience components [25].
The indices proposed by Lloret et al. [26] have been widely used for quantifying tree resilience. These indices include resistance (Rt), defined as the capacity of the tree to sustain growth under disturbing conditions, and recovery (Rc), representing the ability of the tree to return to its original condition after disturbance. In forest terms, resilience (Rs) refers to the ability of the forest to maintain its original functions under extreme disturbance [27].
Currently, indices for quantifying resilience in forest ecosystems have been addressed using two main approaches: dendrochronology [28,29,30] and satellite imagery [31,32]. Ring-width chronologies, however, provide information on the growth response to drought at the individual tree level [7] and allow estimating resilience indices on scales ranging from decades to hundreds of years.
Although there is increasing use of resilience indices to analyze the response of trees to extreme drought events around the world, studies involving this approach are scarce in Mexico. In addition, studies based on analyzes of resilience indices through tree rings have been based on radial increases at breast height (1.30 m), which may provide an adequate estimate of radial growth during drought along the stem; however, different results may be obtained in terms of resistance and recovery [33]. In this regard, obtaining information about the response of trees to drought requires the use of growth data at different stem heights in tree species [25].
Based on the above, the objective of this study was to estimate the resilience indices at different stem heights of P. durangensis trees in a site in northern Mexico. Particularly, we explored the consistency in resilience indices along the stem of P. durangensis trees and whether the resilience of P. durangensis has decreased in recent decades. To this end, two main hypotheses were considered: (1) resilience indices estimated for extreme drought events differ along the stem height, and (2) the increase in the frequency and intensity of droughts in recent decades has reduced the resilience of P. durangensis to drought. These results contribute to a better understanding of the effects of extreme weather conditions on the growth of P. durangensis, a species of great ecological and logging importance in temperate forests in Mexico.

2. Materials and Methods
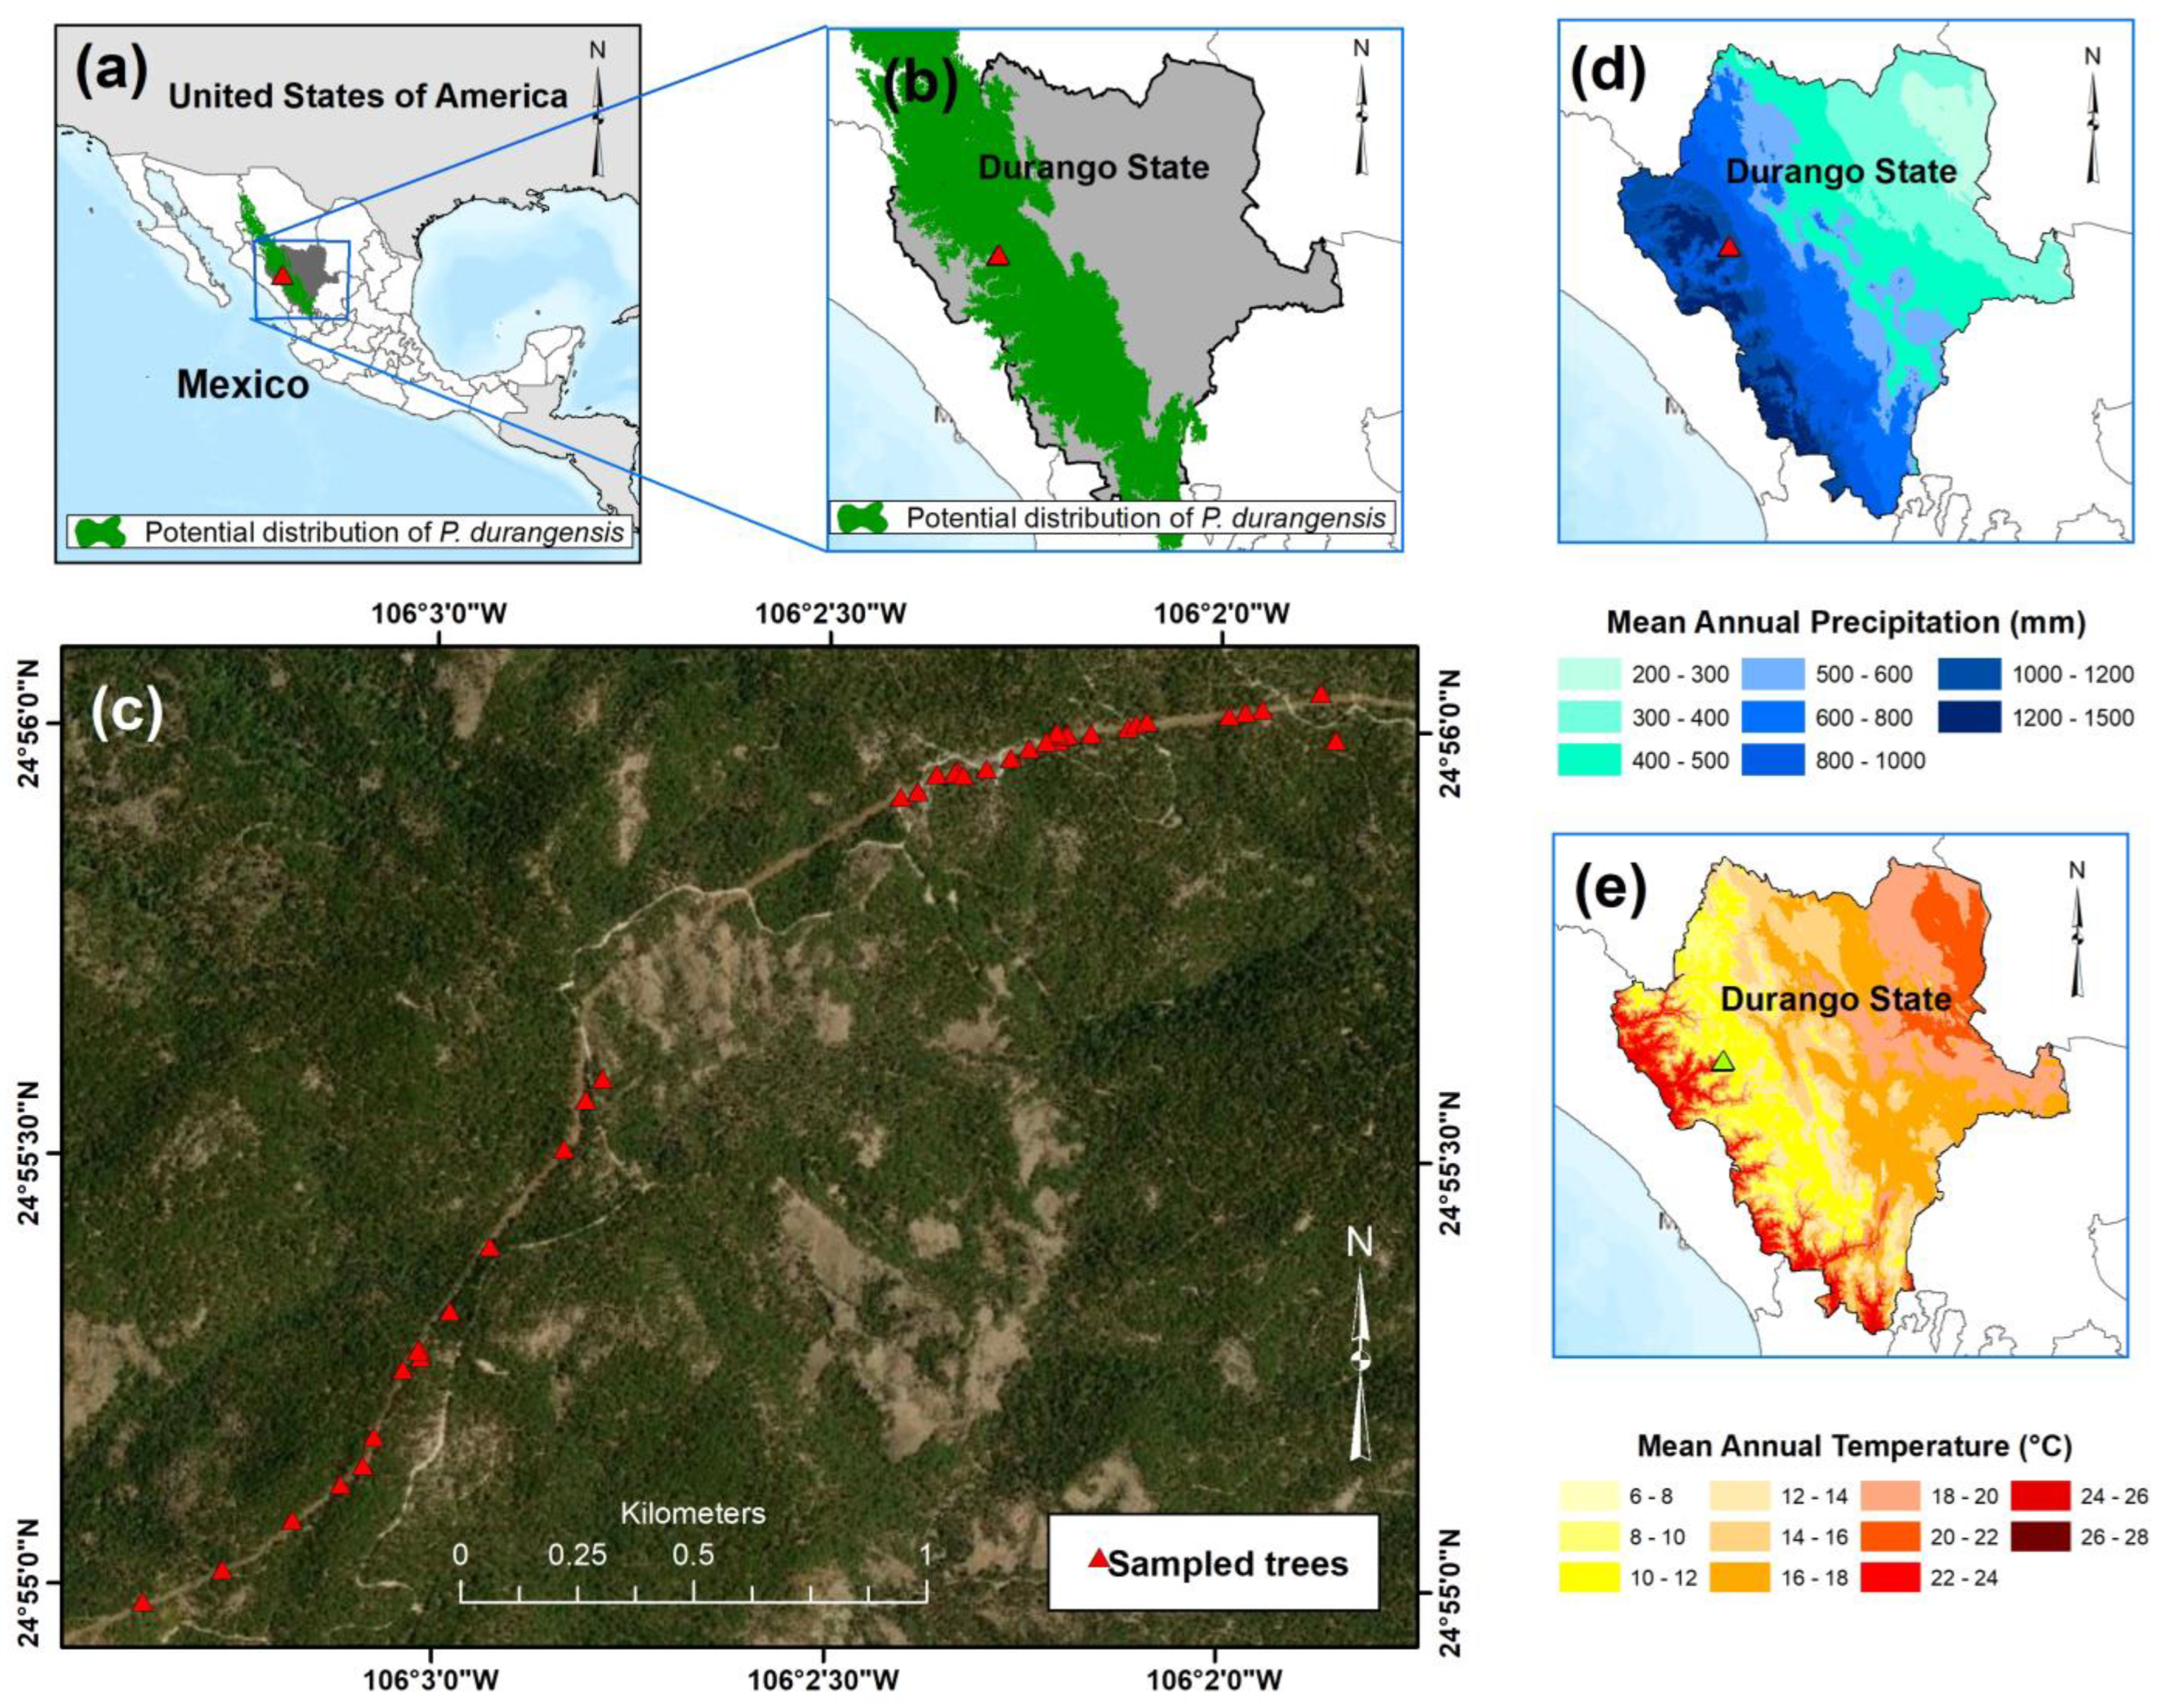
2.1. Study Area

The sampling site is located in the Sierra Madre Occidental (SMO), northwest of the Durango state (Figure 1a). The site is characterized by uneven-aged vegetation, represented by the genera Pinus, Quercus, Juniperus, Cupressus, Pseudotsuga, Arbutus, and Alnus [34]. The sampled trees of P. durangensis were obtained in an altitudinal gradient of 2573–2829 m a.s.l., which is its optimal distribution (Figure 1b). The predominant aspect was southwest and had an average slope of 12%. The geographical coordinates are 24°48′16.98″–25°12′38.91″ N and 106°12′37.63″–106°12′25.58″ W (Figure 1c). The main soil types are Leptosol, Cambisol, Luvisol, and Phaeozem [35]. The prevailing climate is cold-temperate, with a mean annual precipitation of 850 mm (Figure 1d) and a mean annual temperature of 10 °C (Figure 1e) [36].

2.2. Dendrochronological Information

Fifty P. durangensis trees were analyzed, which were selected through directed sampling. Those healthy trees with straight stems and no signs of mechanical damage were chosen. Four cross-sections were extracted from each tree at different heights of the stem. The first section was set between 0.07 m and 0.15 m, the second one at 1.3 m, the third one at 6.3 m, and the last one between 11.0 m and 12.0 m in the height of the stem.
The cross sections were polished and dated based on standard dendrochronological techniques [38]. For each section, the total ring width of two representative radii was measured to an accuracy of 0.001 mm using a Velmex measuring system. Quality in the dating of the ring-width series was checked using COFECHA software [39].
To eliminate biological and geometric trends unrelated to climate, the series were standardized by fitting negative exponential functions. Standardization was carried out using the dplR library [40] in R software [41]. This procedure allowed estimating ring-width indices (RWI) for the different heights of the stem. RWI1 is the ring-width index for the first section (0.07 m and 0.15 m), RWI2 for the second section (1.3 m), RWI3 for the third section (6.3 m), and RWI4 for the last section (11.0 to 12.0 m). Those RWI are characterized by being dimensionless, with a mean close to 1.0 and homogeneous variance, but preserving a high portion of the climatic signal [42].
The quality and reliability of chronologies were verified through the mean, standard deviation (SD), mean sensitivity (MS), intercorrelation between series (SI), mean correlation between series (Rbar), first-order autocorrelation (AC1), expressed population signal (EPS) [43,44], and subsample signal strength (SSS) [45]. EPS and SSS are statistics that measure the degree of representativeness of a chronology relative to a theoretical population with an unlimited number of samples. However, the theoretical population is infinitely replicated for EPS, while replication is finite for SSS [46]. In this study, an SSS > 0.85 was used to determine the best replicated period [43].

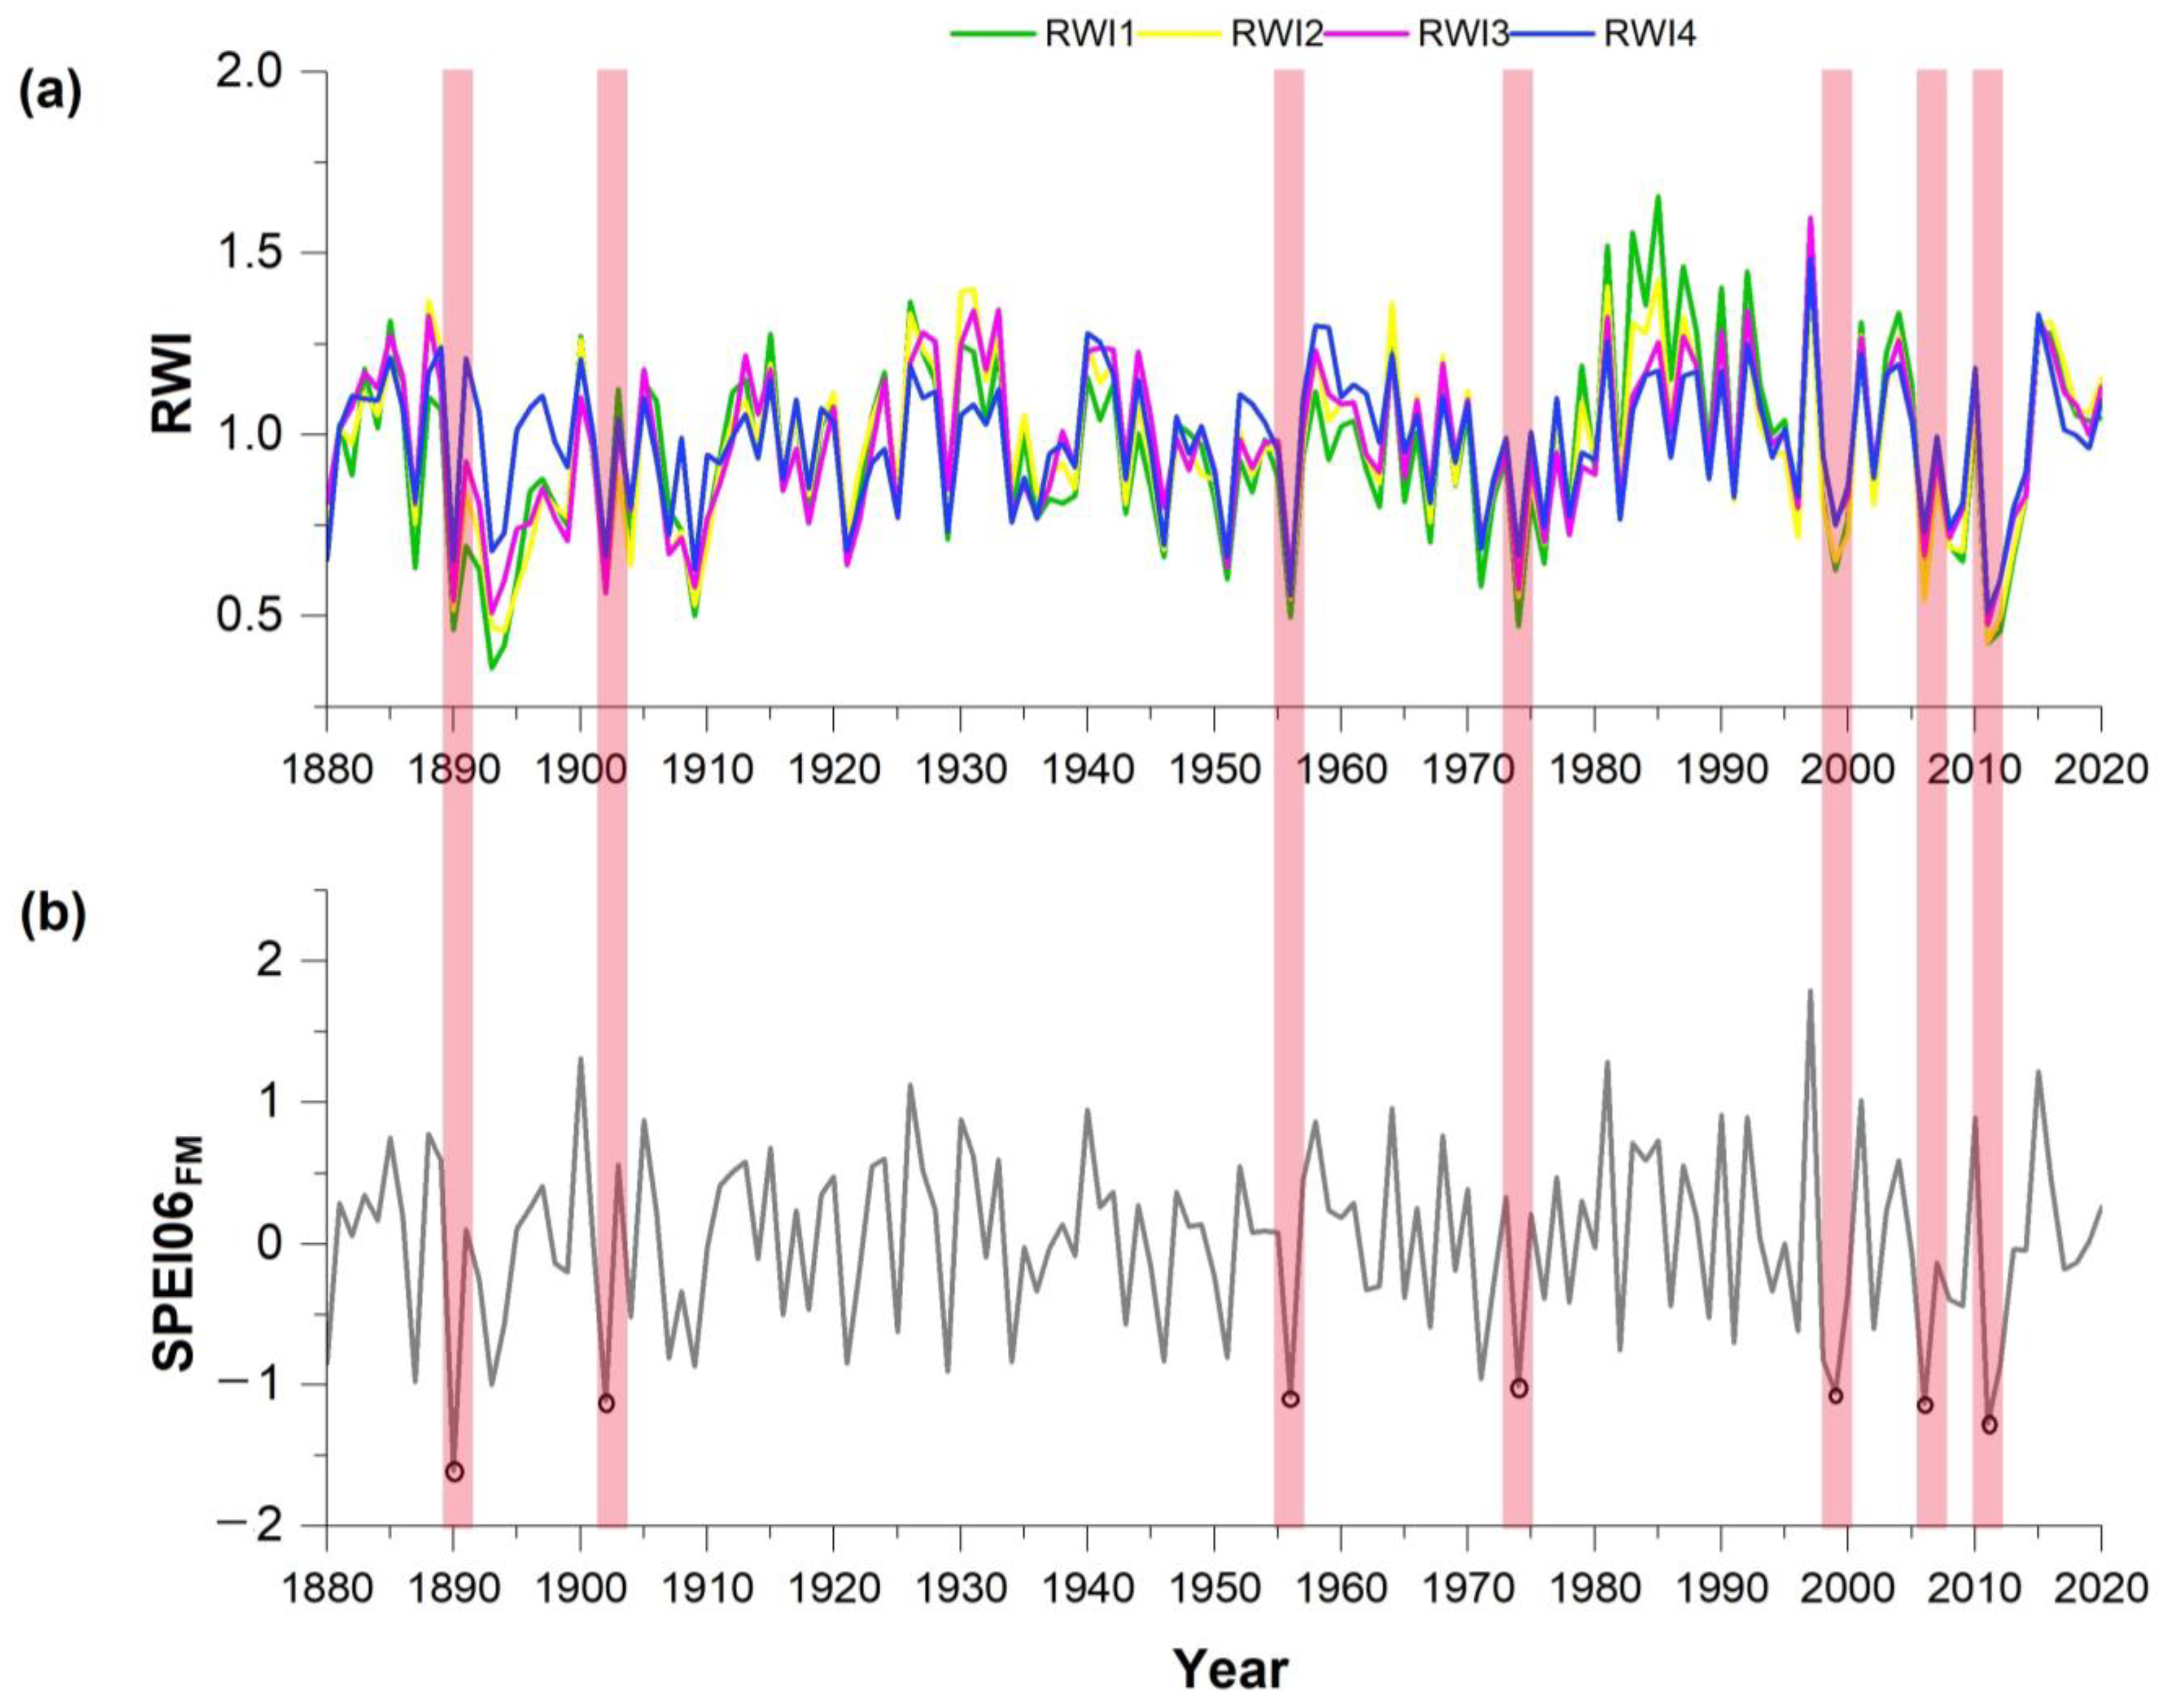
2.3. Identification of Extreme Droughts

According to Cabral-Alemán et al. [47], the radial growth of P. durangensis in the study area is influenced by dominant winter-spring climatic conditions and reported reconstruction of the Standardized Precipitation-Evapotranspiration Index (SPEI) at a 6-month scale (cumulative drought from six months) of February-May (SPEI06FM), in the period 1725–2020. In this study, we used the data of SPEI06FM in the period 1880–2020. Based on a statistical criterion, drought events were selected, with extreme droughts defined as the years in which the SPEI06FM values fell out in the lowest fifth percentile [24].
Additionally, the association between the chronologies at different stem heights and the SPEI06FM was calculated with the Pearson correlation analysis using the Minitab 19 software.

2.4. Resilience of Pinus durangensis to Drought

In ecology, the term resilience refers to the ability of natural systems to recover or return to pre-disturbance levels [48]. To optimize the characterization of the response of P. durangensis to drought, three resilience components were calculated at different tree stem heights.
The resistance (Rt), recovery (Rc), and resilience (Rs) of a tree to drought events were calculated from the total ring-width index (RWI) based on the formula of Lloret et al. [26], with the pointRes library [49] in R software [41]. Rt values close to 1.0 denote a high resistance to drought, and Rc values less than 1.0 indicate a drop in growth after the drought event. Values of Rs equal to or greater than 1.0 indicate the ability to achieve the level of performance before the disturbance. Rt, Rc, and Rs were calculated using Equations (1)–(3). Rt, Rc, and Rs are calculated with Equations (1)–(3).
R t = G d G p r e v
R c = G p o s t G d
R s = G p o s t G p r e v
where G d represents radial tree growth (RWI) during drought, G p r e v is pre-drought growth (mean RWI of four years prior to the drought year), and G p o s t is post-drought growth (mean RWI of four years after the drought year).
The proportion of trees showing high Rt and high Rc was also calculated. The observed relationship between Rt and Rc was compared with the hypothetical relationship when full resilience is achieved, and the line of full resilience was calculated using Equation (4) [25].
R c h =   1 R t
where R c h is recovery assuming a hypothetical full resilience = 1.0

3. Results

3.1. Development of Chronologies

The chronologies estimated for different tree stem heights of P. durangensis showed variability in dendrochronology statistics. RWI4 showed peak Rbar and SI values, while the four chronologies greatly exceeded the minimum acceptable EPS value (0.85). RWI1 had the highest MS and AC1 values. SSS values > 0.85 for the four chronologies determined the common period for evaluation, which was 1880–2020 (140 years). Chronology data are shown in Table 1.

3.2. Relationship between Growth and SPEI

The correlation values between growth data represented by RWI chronologies at different stem heights and drought events represented by SPEI06FM values showed high and significant correlations (p ≤ 0.05). However, RWI1 and RWI3 were more strongly associated with this index (Table 2).

3.3. Identification of Extreme Droughts

The analysis of the variation of SPEI06FM during the period 1880–2020 (140 years) revealed seven years (1890, 1902, 1956, 1974, 1999, 2006, and 2011) with values below the fifth percentile of the distribution. The years resulting from this analysis were classified as extreme drought years. Figure 2a shows the RWI and its graphic relationship with extreme drought events indicated by the SPEI06FM (Figure 2b). The seven years identified as the most severe droughts coincided with variations in radial growth represented by the four chronologies.

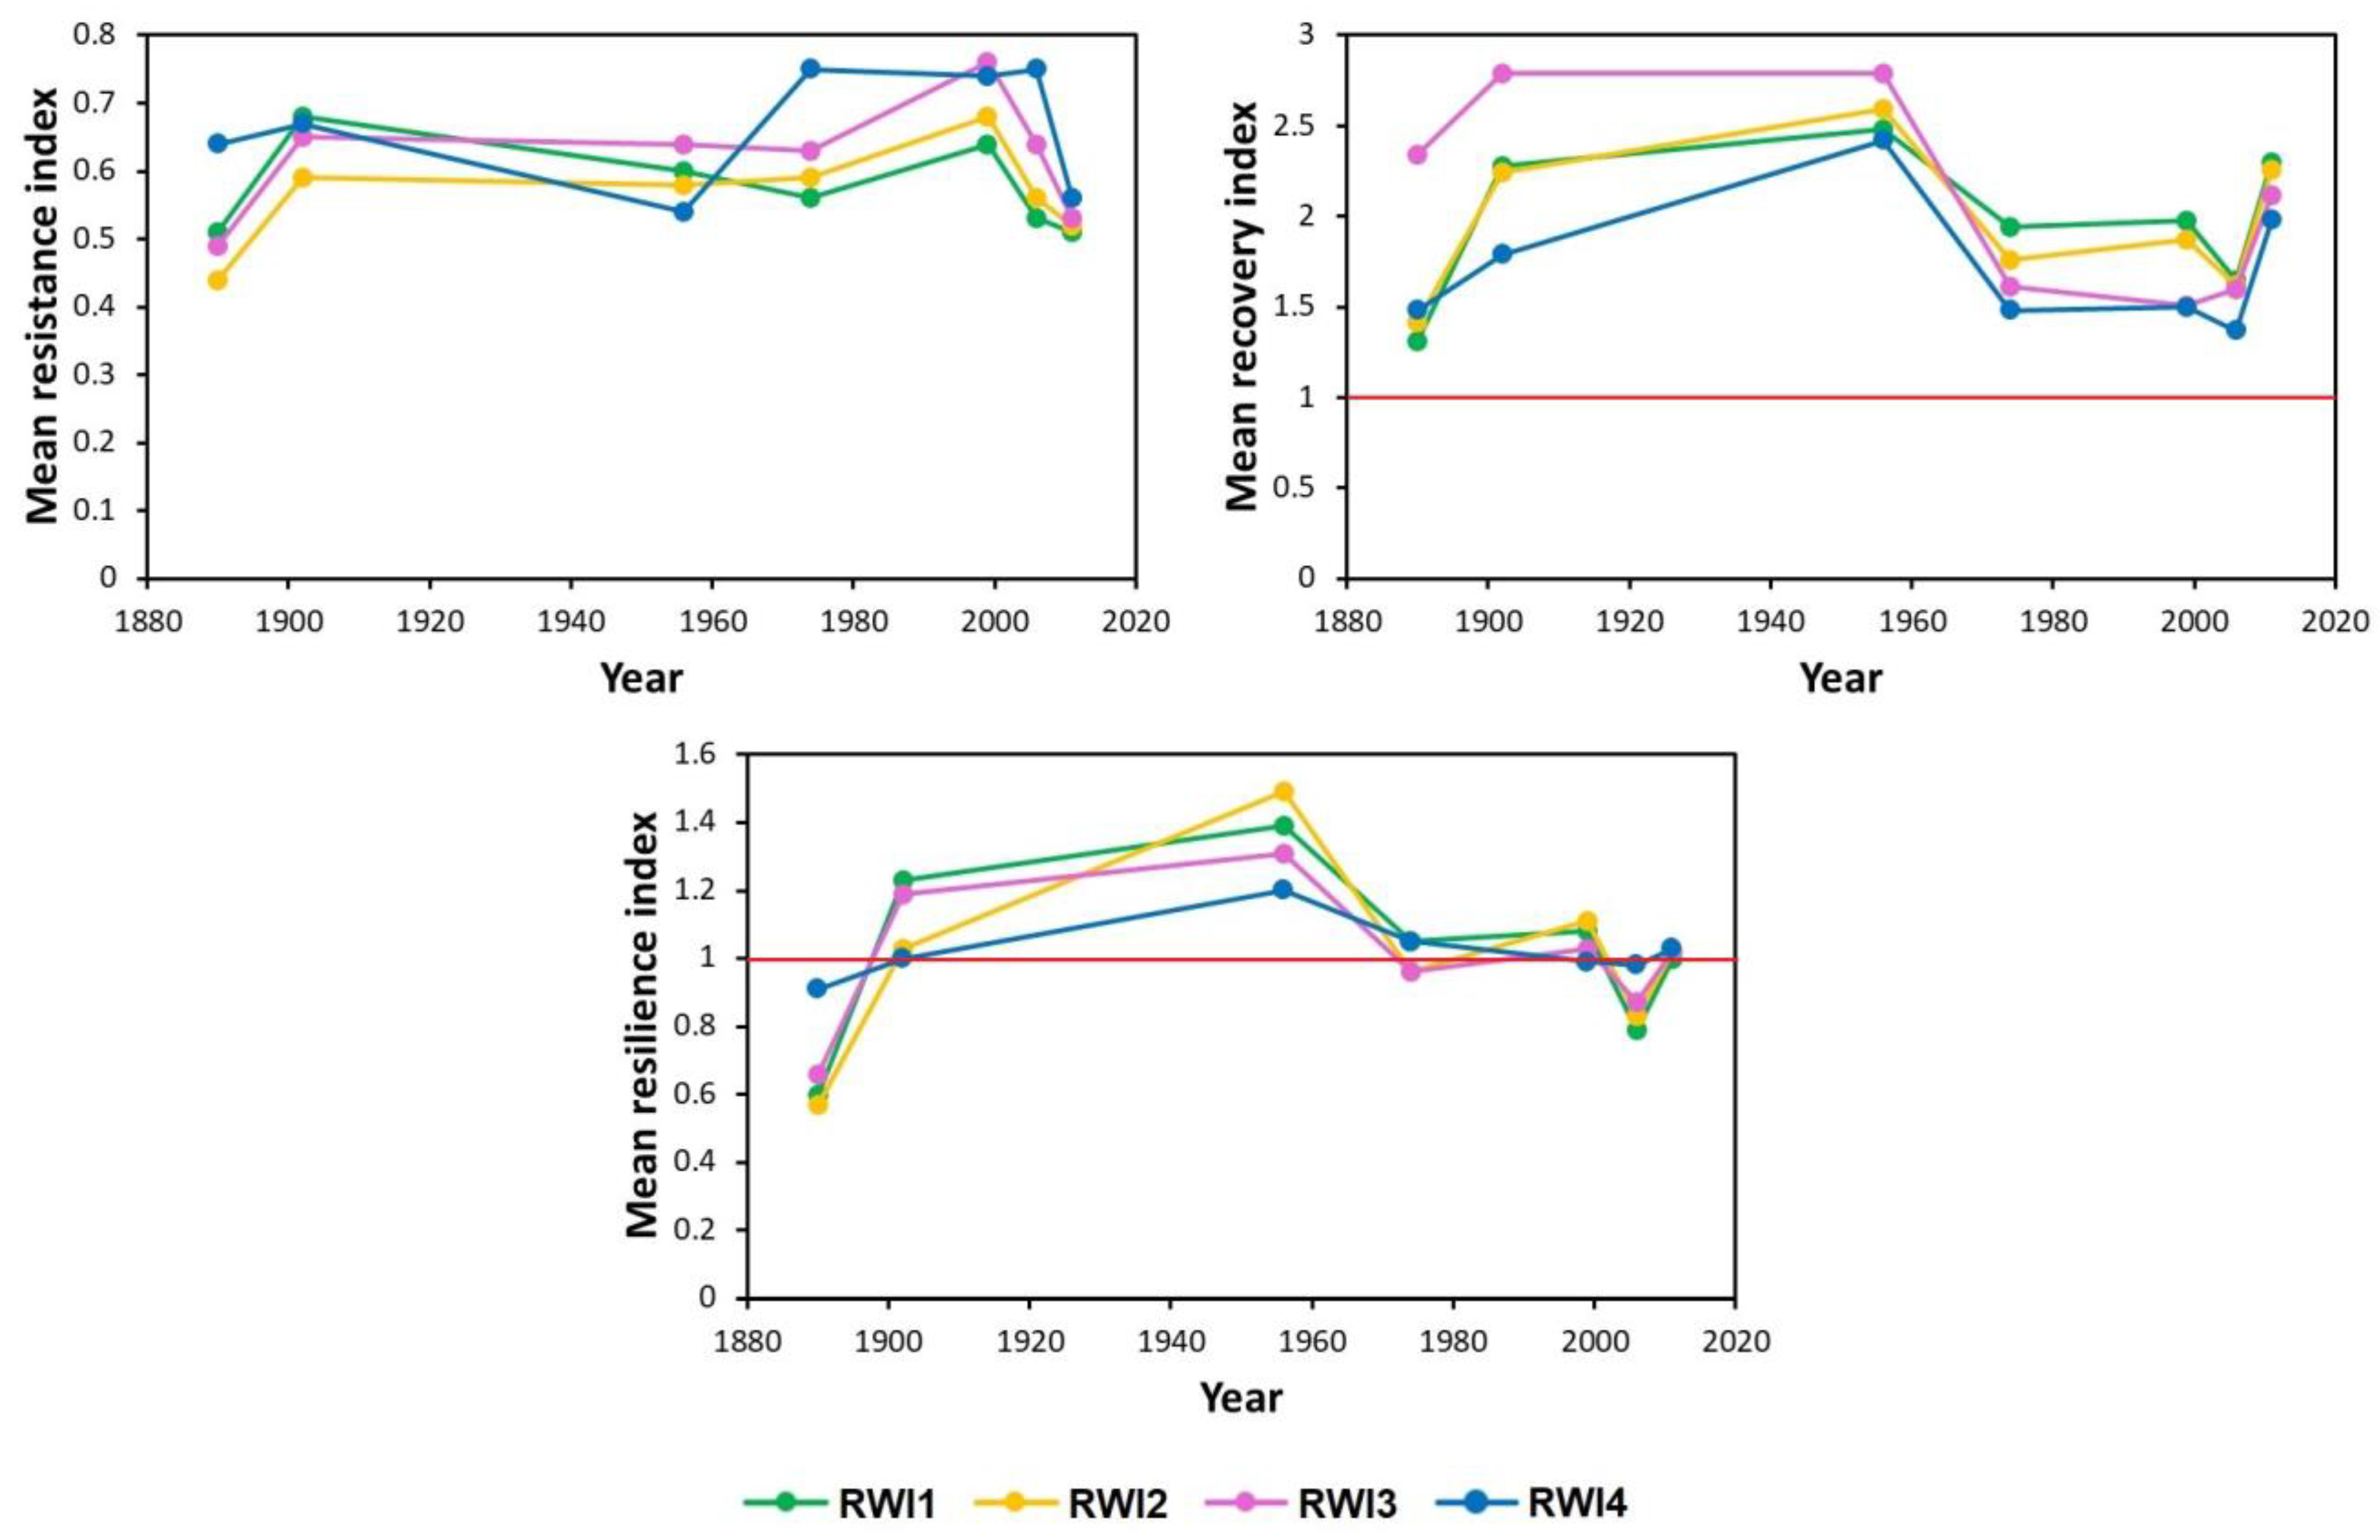
3.4. Resilience Components

The values of the drought resilience components (Rt, Rc, and Rs) of P. durangensis calculated for tree growth (RWI) showed variations between tree stem sections for each extreme drought year. Regarding Rt, peak values were found in samples collected for RWI4 (11.0–12.0 m) in the droughts of 1974, 1999, and 2001, with a marked decrease in the 2011 drought. The lowest Rt values were observed for RWI2 (1.3 m) and RWI3 (6.3 m) in the 1890 drought (the most severe drought event according to the SPEI06FM reconstruction). Even though an uneven decrease in RWI values was detected for the four stem sections in 1893, corresponding to a low SPEI value, this was not as extreme as the other drought periods and was not selected for further analysis. The Rc values increased from 1890 to 1956, then decreased from 1974 to 2006, and increased again in 2011. The four stem sections presented the highest Rs values in the 1956 drought, while the lowest values occurred in 1890 (Table 3).
The Rt values of the four sections did not reach the reference value (1.0) in any of the drought events, while the Rc values were greater than 1.0 in the four sections of all the drought events analyzed. The Rs values of the four sections did not reach the reference value (1.0) in the drought events of 1890 and 2006; in 1974, only RWI1 and RWI4 exceeded the value of 1.0; while in 2011, only RWI1 did not reach the value of 1.0 (Figure 3).

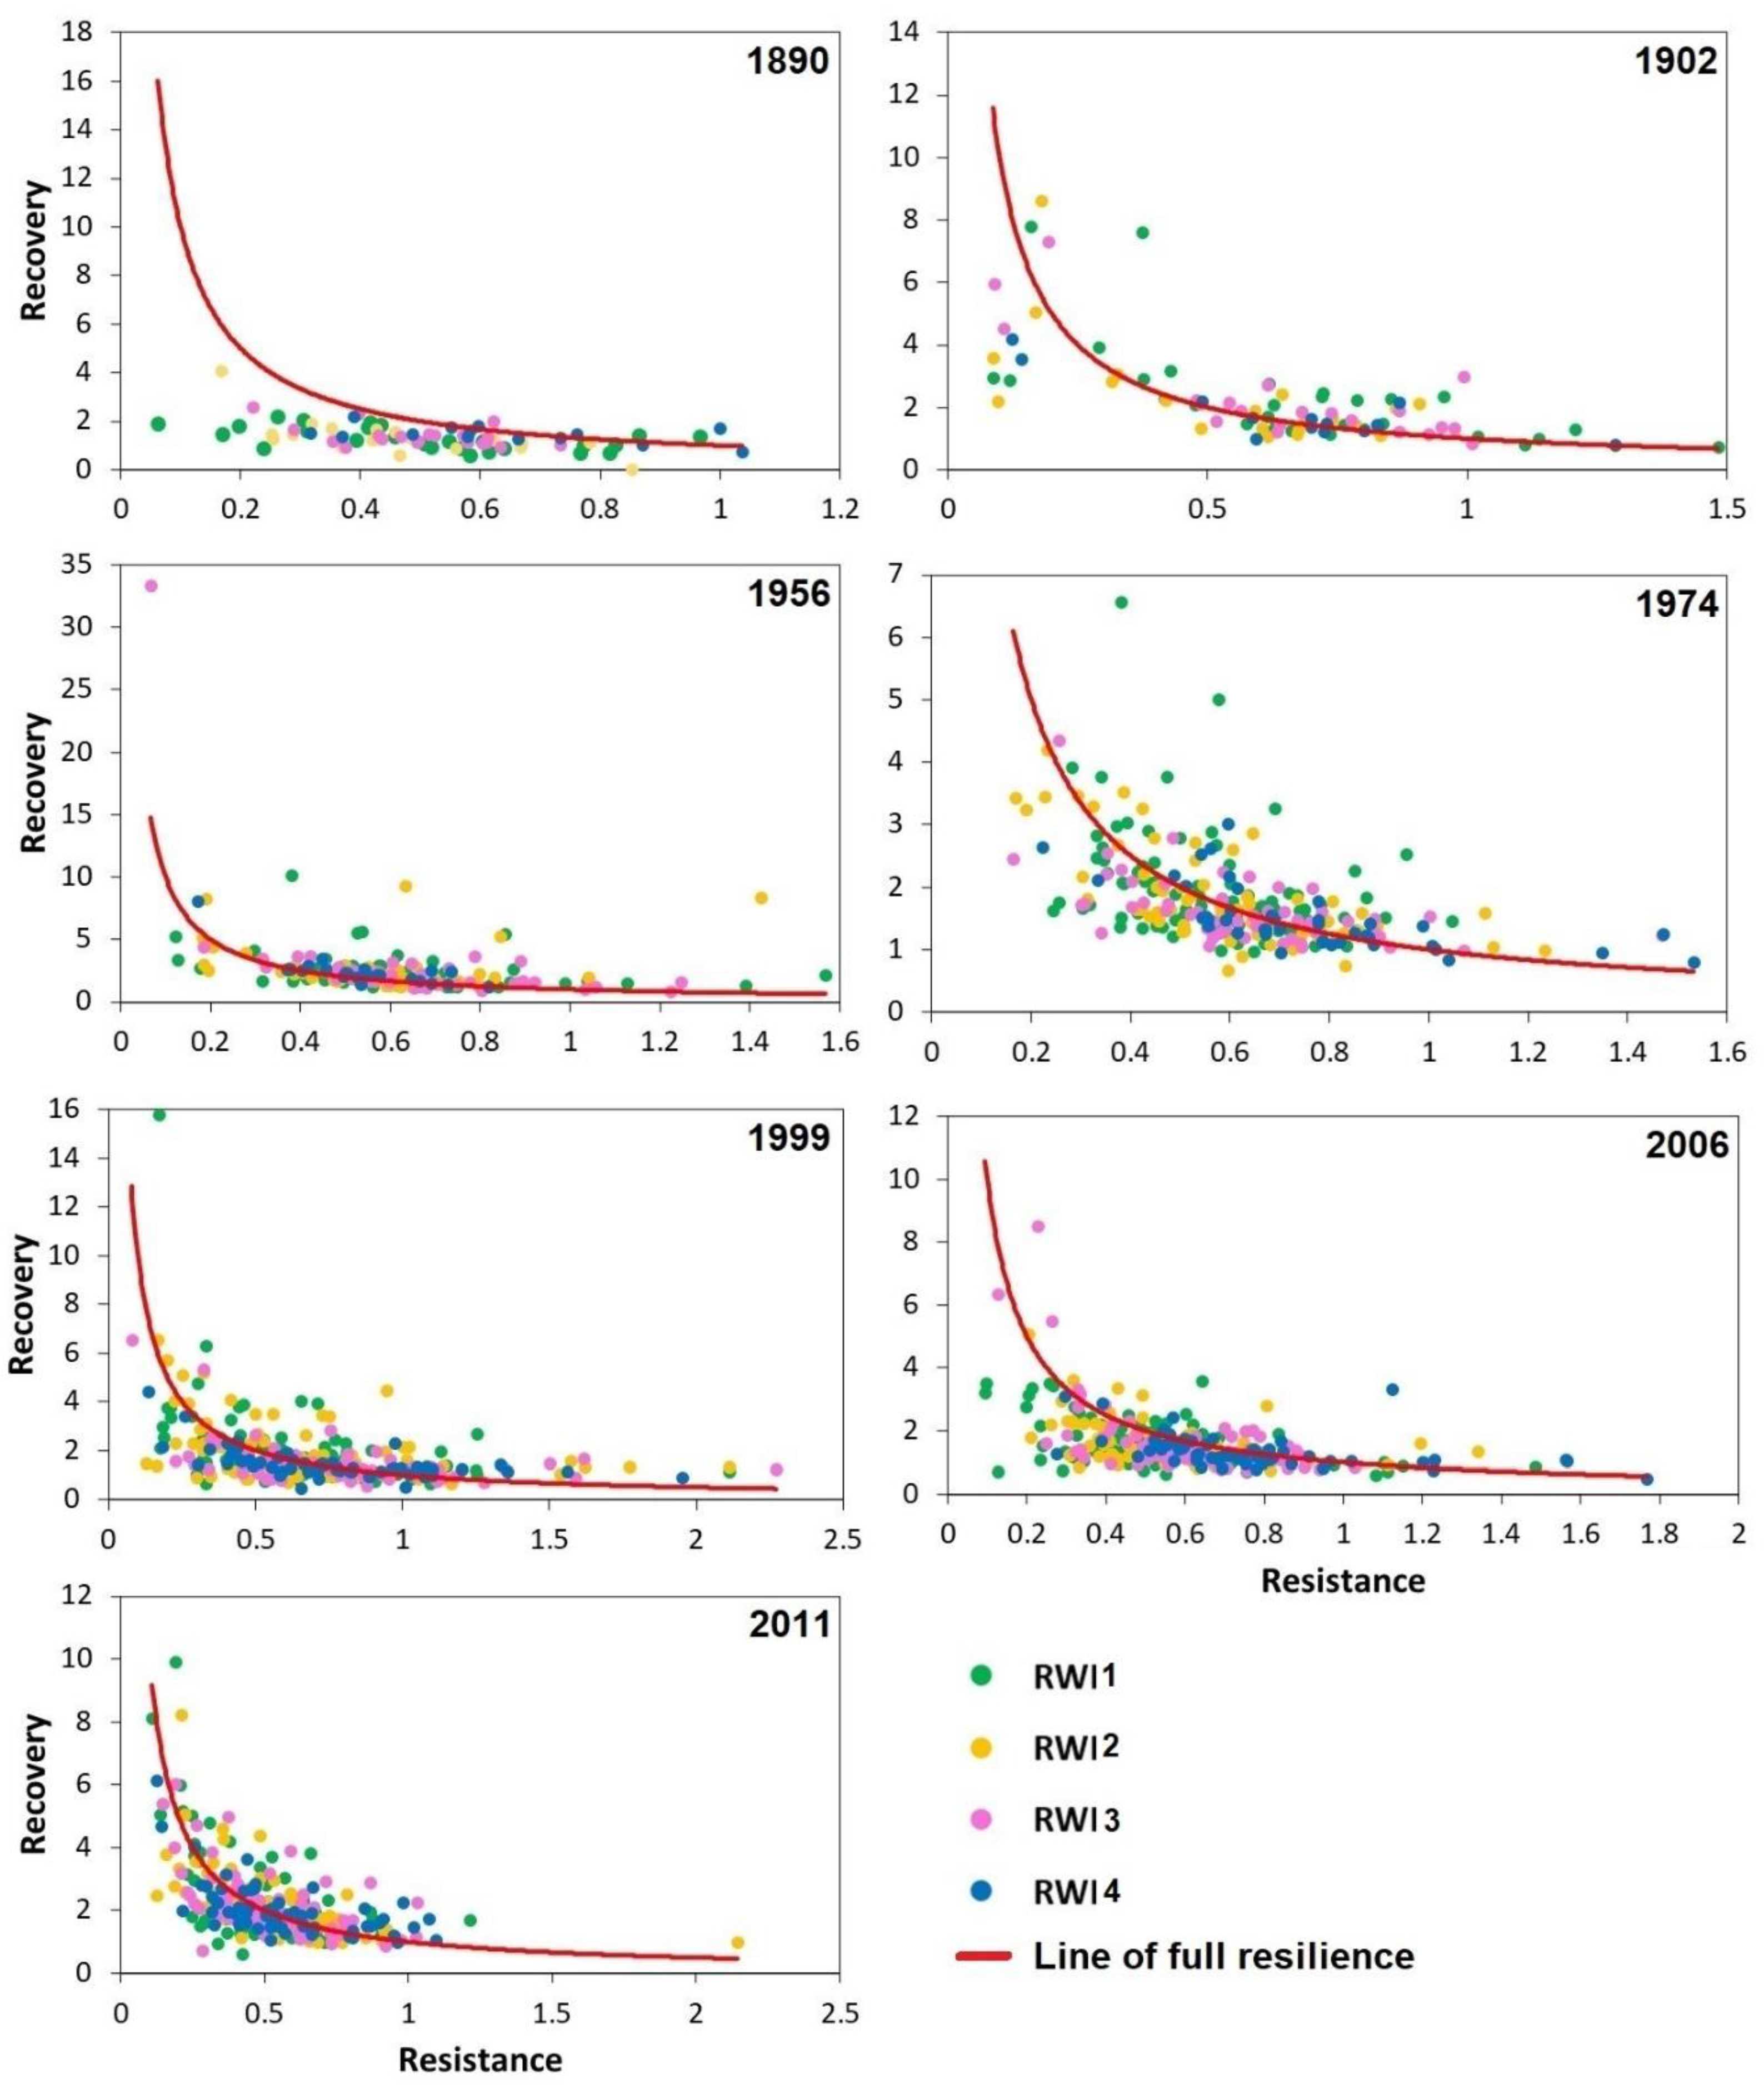
3.5. Line of Full Resilience

The observed values of Rt of the 50 trees represent the average for each height in each drought event. The mean values of Rt allowed obtaining the values of Rch, assuming the line of total resilience (Rs = 1.0). During the 1890 drought, the fewest number of trees that reached the line of full resilience occurred. In the 1902 drought, an increase was observed in the proportion of trees that reached the line of full resilience. On the other hand, in the 1956, 1974, and 1999 droughts, RWI1 and RWI2 had the highest number of trees that exceeded the full resilience line. However, in the 2006 drought, a marked drop in tree number was observed, increasing again for the 2011 drought. RWI1 (green dots) generally showed the lowest Rt values, which coincided with the highest Rc values (Figure 4).

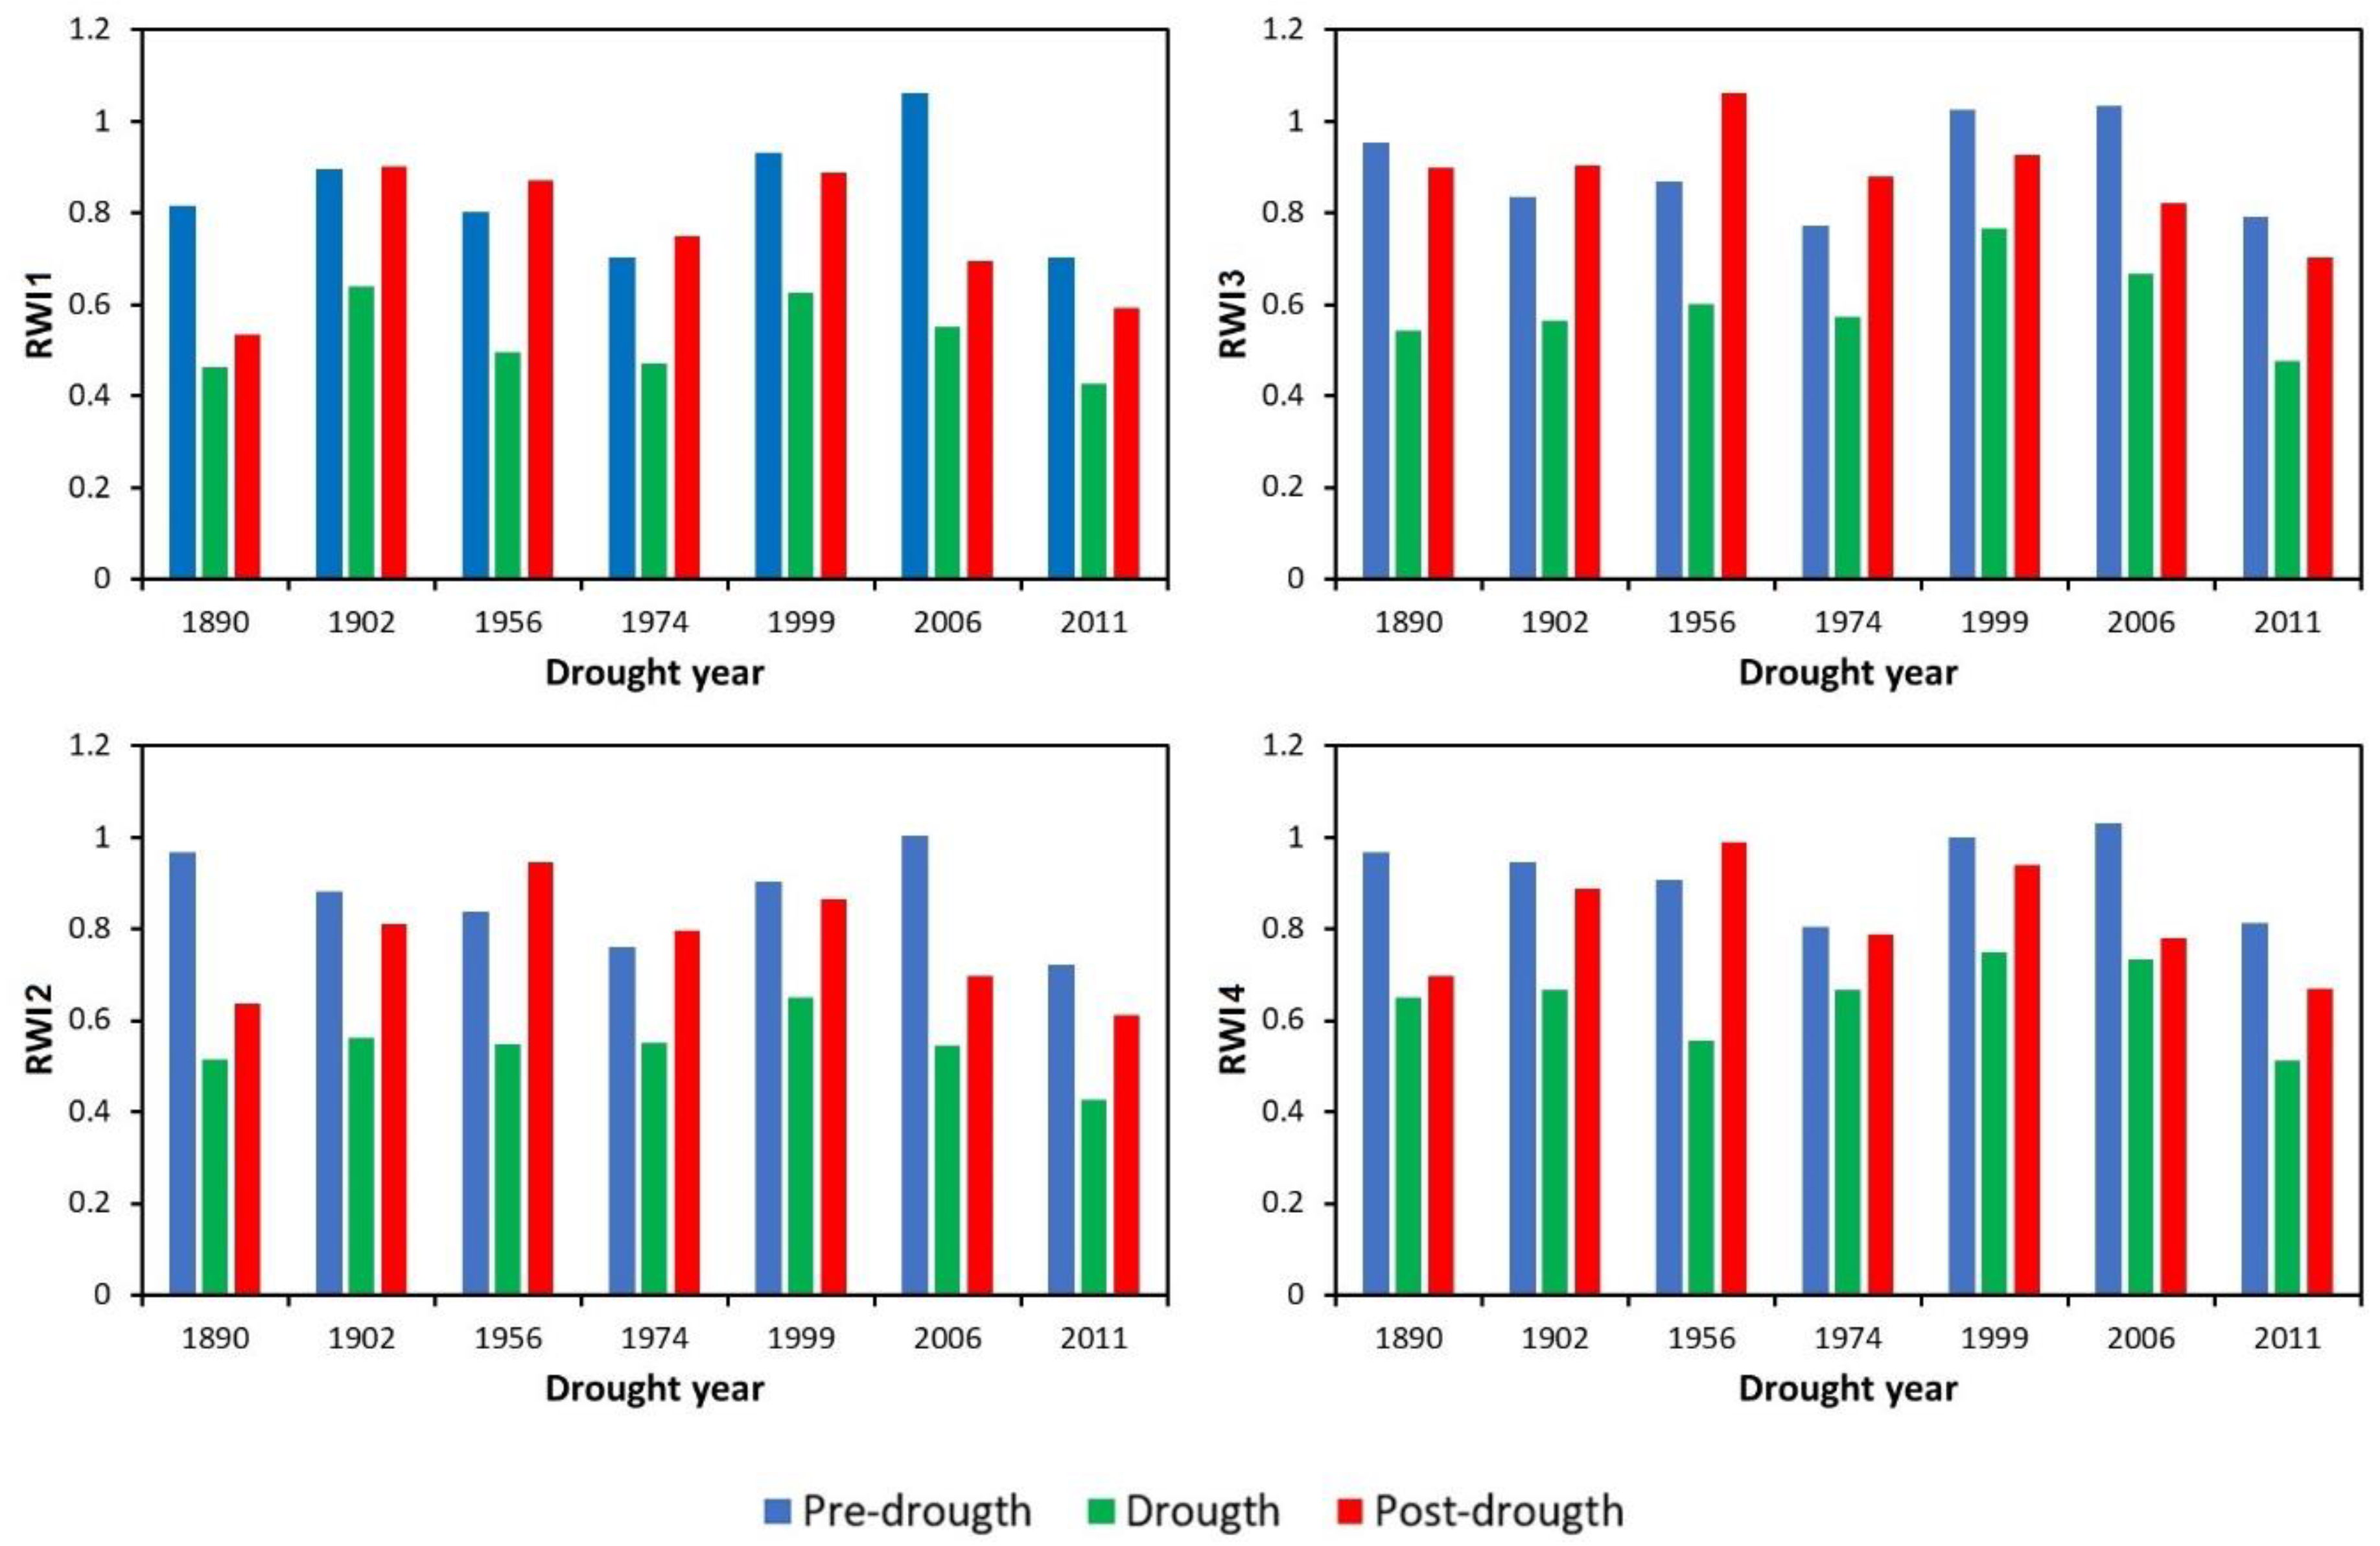
3.6. Growth Response of P. durangensis to Drought

A marked reduction in growth was found in all four RWI in the 1890, 2006, and 2011 drought events, while the 1956 drought was associated with a slight increase in growth in all four RWI. In the 1902 drought event, an increase in the growth of RWI1 and RWI3 and a growth decrease in RWI2 and RWI4 was found. In the 1974 drought, there was a slight increase in growth for RWI1, RWI2, and RWI3, respectively (Figure 5).

4. Discussion

The results of this study represent the first research of its kind in Mexico. Although these studies generally require destructive sampling and subsequent processing of samples (cross-sections), which is time-consuming and expensive [50,51], they are needed to improve our understanding of the response of tree growth to climate, specifically to extreme droughts. Besides, these elements can be useful for implementing climate change adaptation measures. More importantly, this type of information can be generated more easily in managed forests.

4.1. Dendrochronological Statistics

The dendrochronological statistics indicated high climatic sensitivity in the four series, confirming the potential of this species in the analysis of climatic signals from tree rings. SI values for series collected at different tree stem heights ranged from 0.60 to 0.65 and increased along the stem height. In general, these values suggest an adequate common response between chronologies [52] and are consistent with the report for this species by Villanueva-Diaz et al. [17], who documented an SI of 0.68. In addition, our results coincide with those reported by Martínez-Sifuentes et al. [53], who found an SI of 0.54. MS values ranged from 0.30 to 0.38, reflecting a lower sensitivity as stem height increases. These findings are consistent with data reported from similar studies [54,55].
EPS values for the four series greatly exceeded the minimum acceptable limit of 0.85 and are higher than those reported for coexisting species [56,57]. The assessment period was selected using SSS, considered a more appropriate statistic for determining the common period in chronologies with an intensity threshold of 0.85 [43,46].

4.2. Growth-Climate Relationship along the Stem

Pinus durangensis showed a positive and significant association with SPEI06FM for the four-growth series, with values from 0.56 to 0.80. These results demonstrate the growth response of the species at short time scales, consistent with observations for other conifer species inhabiting temperate zones of northern Mexico [58,59]. The lowest association with SPEI06FM was observed in RWI1 and RWI4, in line with the findings reported by Bouriaud et al. [54], who recorded a lower impact of drought in the upper part of the tree stem. An explanation for the low relationship at this stem height may be related to the proximity of RWI4 to the tree canopy, which is one of the principal carbon (C) sinks. In this portion of the tree, sugars are delivered earlier than in other portions. During drought, C assimilation rates are reduced, and transport is affected, both of which have a greater impact on the lower portion of the stem [33,60].
On the other hand, the highest relationship between growth and climate was observed in the RWI1 and RWI3 sections of the stem, which are considered more sensitive to weather variations than section RWI2, i.e., diameter at breast height (DBH). This indicates that considering only growth at breast height may lead to underestimating the influence of climate on P. durangensis growth and, therefore, the impact of climate change on productivity—a process associated with carbon dioxide capture and the adaptation of this species to global warming [61].

4.3. Resilience Indices along the Stem

The seven extreme drought events identified (1890, 1902, 1956, 1974, 1999, 2006, and 2011) coincided with drought periods previously documented for northern Mexico [62]. The response of the four ring-width series in the driest years was similar and consistent with the findings reported for forests of northern Mexico [63].
The result of the analysis of Rs indices suggests that the response of P. durangensis trees is largely driven by drought intensity, as shown for other species in previous studies [64,65]. The severity of drought events was quantified based on the variability of pre- and post-drought growth, which has been shown to be the main driver of the response of trees to drought [66]. Our results suggest the possibility of a cumulative effect on P. durangensis Rt to the 1999, 2006, and 2011 droughts in three (RWI1, RWI2, and RWI3) of the four ring-width series studied. This effect was also evident with a similar variation in Rc and Rs, with a marked decrease from the 1956 drought in the four-chronology series studied. This may be due to the higher recurrence and intensity of dry periods in northern and central Mexico in recent decades [56,62,67].
The average Rt at different stem heights indicated variations from 0.44 to 0.76 (Table 3), indicating that mean radial growth decreased between 56.0% and 24.0% in extreme droughts. This finding is consistent with the one reported by Castrruita-Esparza et al. [68] for Pseudotsuga menziesii (Mirb.) Franco, with radial growth reductions of more than 50% under extreme drought. The mean Rc by stem height showed values above 1.0 (1.31 to 2.79), indicating that once the drought ended, radial growth increased by 31.0% to 179.0% relative to the growth recorded in the drought year. These results are consistent with those reported for other tree species, such as Araucaria araucana (Molina) K. Koch in Argentina [24] and Pinus ponderosa Douglas ex C. Lawson in the United States [26]. However, post-drought growth shows a significant decrease relative to pre-drought growth in most cases (Figure 5). This trend may be due to the inherited effects on the long-term post-drought recovery capacity, which may lead to lower productivity as a consequence of reduced radial growth [21].
At the event scale (horizontal averages, Table 3), the 1999 drought resulted in a reduction of up to 76.0% in radial growth. The most remarkable Rc response (2.79) occurred after the 1902 drought, while the greatest Rs was related to the 1902 and 1956 events (1.23 and 1.49, respectively) when the trees were young and could recover more rapidly from drought [26,69].
The line of full Rs showed that in 1890, most of the trees sampled could not return to the pre-drought growth rates in any series at the different tree stem heights. This event has been reported in different studies as a severe drought associated with La Niña events that lasted for several years [62,70,71]. Therefore, the trees did not recover the pre-drought growth rates. From 1902 to 1974, we recorded an increase in the number of trees reaching pre-drought growth rates, with higher rates in RWI1. However, from 1999 to 2011, the number of individuals achieving pre-drought growth rates decreased again, confirming the significant impact of recurrent droughts in recent decades. The slow growth rate of P. durangensis, a species inhabiting temperate zones, can favor Rt because slow-growing trees are able to use reserve resources to withstand periods of extreme drought. However, this does not warrant a total post-drought recovery [72,73,74,75].
On the other hand, the analysis carried out in this study using tree-ring series at different stem heights supports the hypothesis that the recovery of growth is not homogeneous along the tree stem [25]. The highest values of Rc were observed in RWI3 in the first three droughts (1890, 1902, and 1956). However, in the four most recent droughts (1974, 1999, 2006, 2011), RWI1 presented the highest values of Rc. In this sense, it has been proposed that under hydric stress, trees may modify their pattern of photosynthate allocation, deriving fewer resources to crown growth and carbon assimilation and a greater allocation to root growth. This strategy captures additional water and, therefore, reduces the growth-limiting effects of this factor [76,77]. However, the practical result of this research indicates that tree-ring sampling at the soil level (0.07–0.15 m) captures the most important information to analyze changes in trees’ resilience.
One aspect to be considered in the recovery of tree growth is ecosystem hysteresis since, in the face of climate change effects, forest ecosystems may show a certain lag in recovery (delayed growth response); in some cases, returning to the historical growth rate is no longer possible [11]. It has been observed that the growth recovery of forest ecosystems after a disturbance event varies with local climate and species, with trees of the family Pinaceae being the most susceptible and least resilient [9]. Our results showed that it took four years on average for trees to recover the pre-drought growth rate, consistent with Anderegg et al. [9], who reported recovery times between one and four years for chronologies obtained in different parts of the world. On the other hand, it is worth mentioning that after the 1890 drought, it took ten years for trees to reach pre-drought growth levels, a period with no extreme drought events. In contrast, in the case of the 2006 extreme drought event, trees had not fully recovered their pre-2006 growth rate when another extreme drought event occurred in 2011. These findings demonstrate that the high frequency of droughts resulting from climate variations, either naturally or attributed to climate change, may compromise the recovery of P. durangensis growth to drought.

4.4. Management Implications

The Rs results observed in the present and other studies highlight the need for actions aiming to increase tree drought tolerance. In this regard, forestry has been mentioned as a valuable tool for this purpose [77]. For instance, the growth-climate association has been found to be weaker or decoupled after forest thinning [30]. By increasing the number of resources available for the remaining trees, greater tolerance to extreme weather conditions would be expected [33]. However, some issues related to the benefits of thinning still need to be explained, including how thinning affects climate sensitivity, dependence on growth in the previous year, and the duration of thinning effects [30]. In line with the findings of the present study, further studies should explore the impact of silvicultural activities on drought stress in trees of P. durangensis and other species growing in mixed forests in the study area.
Finally, since the Rs of trees to extreme drought results from complex interactions acting simultaneously at different spatial and temporal scales [24], future studies should also analyze the resilience of P. durangensis along its distribution gradient and consider the factors affecting site quality and the characteristics at the tree level.

5. Conclusions

The growth response to drought differed according to tree stem height in P. durangensis. Our results showed that the part of the stem closest to the ground (0.07–0.15 m) exhibited better climate sensitivity. Therefore, the remaining stumps in cutting areas would preserve important dendrochronological information. Drought resistance was generally better in the upper part of the stems. Although recovery was better in the upper parts (RWI3) in the first three drought events, the lower part of the tree stem (RWI1) showed the largest recovery in the last four drought events. In terms of resilience, the latest three drought events have been more frequent and severe, undermining the resilience capacity at different tree stem heights in P. durangensis.
The results of the present study refer to P. durangensis in the study region. However, they represent a step forward in understanding the behavior of tree growth along the stem, laying the grounds for future studies on this and other tree species in the Sierra Madre Occidental, Mexico.

Author Contributions

Conceptualization, C.C.-A. and J.V.-D.; data curation, C.C.-A.; formal analysis, C.C.-A.; funding acquisition, J.V.-D. and G.Q.-B.; methodology, C.C.-A. and J.V.-D.; resources, J.V.-D. and G.Q.-B.; writing—original draft, C.C.-A.; writing—review and editing, C.C.-A., J.V.-D., G.Q.-B. and A.G.-G. All authors have read and agreed to the published version of the manuscript.

Funding

This research was funded by the project of the Sectoral Research Fund for Education No. 283134/CB 2016-1 “Red dendrocronológica mexicana: aplicaciones hidroclimáticas y ecológicas”. Gerónimo Quiñonez-Barraza obtained financing for field work.

Institutional Review Board Statement

Not applicable.

Informed Consent Statement

Not applicable.

Data Availability Statement

Not applicable.

Acknowledgments

The first author expresses thanks to CONACYT for her doctoral-awarded scholarship; as well as the project of the Sectoral Research Fund for Education No. 283134/CB 2016-1 “Red dendrocronológica mexicana: aplicaciones hidroclimáticas y ecológicas”. We are thankful to the authorities and technical staff of Ejido San Diego de Tezains for the facilities and support provided in the field sampling.

Conflicts of Interest

The authors declare no conflict of interest.

References

  1. Fritts, H.C.; Swetnam, T.W. Dendroecology: A Tool for Evaluating Variations in Past and Present Forest Environments. Adv. Ecol. Res. 1989, 19, 111–188. [Google Scholar]
  2. Bolte, A.; Ammer, C.; Löf, M.; Madsen, P.; Nabuurs, G.-J.; Schall, P.; Spathelf, P.; Rock, J. Adaptive Forest Management in Central Europe: Climate Change Impacts, Strategies and Integrative Concept. Scand. J. For. Res. 2009, 24, 473–482. [Google Scholar] [CrossRef]
  3. IPCC. Climate Change 2014: Impacts, Adaptation, and Vulnerability. Part A: Global and Sectoral Aspects; IPCC: Cambridge, MA, USA, 2014. [Google Scholar]
  4. Roshani; Sajjad, H.; Kumar, P.; Masroor, M.; Rahaman, M.H.; Rehman, S.; Ahmed, R.; Sahana, M. Forest Vulnerability to Climate Change: A Review for Future Research Framework. Forests 2022, 13, 917. [Google Scholar] [CrossRef]
  5. Doughty, C.E.; Metcalfe, D.B.; Girardin, C.A.J.; Amézquita, F.F.; Cabrera, D.G.; Huasco, W.H.; Silva-Espejo, J.E.; Araujo-Murakami, A.; da Costa, M.C.; Rocha, W.; et al. Drought Impact on Forest Carbon Dynamics and Fluxes in Amazonia. Nature 2015, 519, 78–82. [Google Scholar] [CrossRef] [Green Version]
  6. Allen, C.D.; Macalady, A.K.; Chenchouni, H.; Bachelet, D.; McDowell, N.; Vennetier, M.; Kitzberger, T.; Rigling, A.; Breshears, D.D.; Hogg, E.H. (Ted); et al. A Global Overview of Drought and Heat-Induced Tree Mortality Reveals Emerging Climate Change Risks for Forests. For. Ecol. Manag. 2010, 259, 660–684. [Google Scholar] [CrossRef] [Green Version]
  7. Camarero, J.J.; Gazol, A.; Sangüesa-Barreda, G.; Oliva, J.; Vicente-Serrano, S.M. To Die or Not to Die: Early Warnings of Tree Dieback in Response to a Severe Drought. J. Ecol. 2015, 103, 44–57. [Google Scholar] [CrossRef] [Green Version]
  8. Ruiz-Benito, P.; Ratcliffe, S.; Zavala, M.A.; Martínez-Vilalta, J.; Vilà-Cabrera, A.; Lloret, F.; Madrigal-González, J.; Wirth, C.; Greenwood, S.; Kändler, G.; et al. Climate- and Successional-Related Changes in Functional Composition of European Forests Are Strongly Driven by Tree Mortality. Glob. Chang. Biol. 2017, 23, 4162–4176. [Google Scholar] [CrossRef] [PubMed] [Green Version]
  9. Anderegg, W.R.L.; Schwalm, C.; Biondi, F.; Camarero, J.J.; Koch, G.; Litvak, M.; Ogle, K.; Shaw, J.D.; Shevliakova, E.; Williams, A.P.; et al. Pervasive Drought Legacies in Forest Ecosystems and Their Implications for Carbon Cycle Models. Science 2015, 349, 528–532. [Google Scholar] [CrossRef] [Green Version]
  10. Castagneri, D.; Vacchiano, G.; Hacket-Pain, A.; DeRose, R.J.; Klein, T.; Bottero, A. Meta-Analysis Reveals Different Competition Effects on Tree Growth Resistance and Resilience to Drought. Ecosystems 2022, 25, 30–43. [Google Scholar] [CrossRef]
  11. Gómez-Guerrero, A.; Correa-Díaz, A.; Castruita-Esparza, L.U. Cambio Climático y Dinámica de Los Ecosistemas Forestales. Rev. Fitotec. Mex. 2021, 44, 673. [Google Scholar] [CrossRef]
  12. González-Elizondo, M.S.; González-Elizondo, M.; Tena-Flores, J.A.; Ruacho-González, L.; López-Enríquez, I.L. Vegetación de La Sierra Madre Occidental, México: Una Síntesis. Acta Bot. Mex. 2012, 100, 351–403. [Google Scholar] [CrossRef]
  13. Sánchez-González, A. Una Visión Actual de La Diversidad y Distribución de Los Pinos de México. Madera y Bosques 2008, 14, 107–120. [Google Scholar] [CrossRef] [Green Version]
  14. Graciano-Ávila, G.; Alanís-Rodríguez, E.; Rubio-Camacho, E.A.; Valdecantos-Dema, A.; Aguirre-Calderón, O.A.; González-Tagle, M.A. Composición y Estructura Espacial de Cinco Asociaciones de Bosques de Pinus Durangensis. Madera y Bosques 2020, 26, 1–14. [Google Scholar] [CrossRef]
  15. Monarrez-Gonzalez, J.C.; Gonzalez-Elizondo, M.S.; Marquez-Linares, M.A.; Gutierrez-Yurrita, P.J.; Perez-Verdin, G. Effect of Forest Management on Tree Diversity in Temperate Ecosystem Forests in Northern Mexico. PLoS ONE 2020, 15, e0233292. [Google Scholar] [CrossRef]
  16. Hernández-Velasco, J.; Hernández-Díaz, J.C.; Fladung, M.; Cañadas-López, Á.; Prieto-Ruíz, J.Á.; Wehenkel, C. Spatial Genetic Structure in Four Pinus Species in the Sierra Madre Occidental, Durango, Mexico. Can. J. For. Res. 2016, 47, 73–80. [Google Scholar] [CrossRef]
  17. Villanueva-Díaz, J.; Cerano-Paredes, J.; Rosales-Mata, S.; Arrocena-López, J.C.; Stahle, D.W.; Ruiz-Corral, J.A.; Martínez-Sifuentes, A.R. Hydro-Climatic Variability Reconstructed from Tree Rings for the Upper Watershed of the Mezquital River, Durango. Rev. Mex. Ciencias Agrícolas 2014, 5, 1897–1912. [Google Scholar]
  18. Martínez-Sifuentes, A.R.; Villanueva-Díaz, J.; Estrada-Ávalos, J.; Trucíos-Caciano, R.; Carlón-Allende, T.; Castruita-Esparza, L.U. Two Centuries of Drought History in the Center of Chihuahua, Mexico. Forests 2022, 13, 921. [Google Scholar] [CrossRef]
  19. González-Cásares, M.; Pompa-García, M.; Camarero, J.J. Differences in Climate–Growth Relationship Indicate Diverse Drought Tolerances among Five Pine Species Coexisting in Northwestern Mexico. Trees 2017, 31, 531–544. [Google Scholar] [CrossRef]
  20. Fang, O.; Zhang, Q.-B. Tree Resilience to Drought Increases in the Tibetan Plateau. Glob. Chang. Biol. 2019, 25, 245–253. [Google Scholar] [CrossRef]
  21. Camarero, J.J.; Gazol, A.; Sangüesa-Barreda, G.; Cantero, A.; Sánchez-Salguero, R.; Sánchez-Miranda, A.; Granda, E.; Serra-Maluquer, X.; Ibáñez, R. Forest Growth Responses to Drought at Short- and Long-Term Scales in Spain: Squeezing the Stress Memory from Tree Rings. Front. Ecol. Evol. 2018, 6, 9. [Google Scholar] [CrossRef] [Green Version]
  22. Bottero, A.; Forrester, D.I.; Cailleret, M.; Kohnle, U.; Gessler, A.; Michel, D.; Bose, A.K.; Bauhus, J.; Bugmann, H.; Cuntz, M.; et al. Growth Resistance and Resilience of Mixed Silver Fir and Norway Spruce Forests in Central Europe: Contrasting Responses to Mild and Severe Droughts. Glob. Chang. Biol. 2021, 27, 4403–4419. [Google Scholar] [CrossRef] [PubMed]
  23. Wang, Y.; Zhang, H.; Wang, H.; Guo, J.; Zhang, E.; Wang, J.; Li, X.; Wei, H.; Zhou, C. Tree-Ring-Based Drought Reconstruction in Northern North China over the Past Century. Atmosphere 2022, 13, 482. [Google Scholar] [CrossRef]
  24. Piraino, S.; Molina, J.A.; Hadad, M.A.; Juñent, F.A.R. Resilience Capacity of Araucaria Araucana to Extreme Drought Events. Dendrochronologia 2022, 75, 125996. [Google Scholar] [CrossRef]
  25. Schwarz, J.; Skiadaresis, G.; Kohler, M.; Kunz, J.; Schnabel, F.; Vitali, V.; Bauhus, J. Quantifying Growth Responses of Trees to Drought—A Critique of Commonly Used Resilience Indices and Recommendations for Future Studies. Curr. For. Rep. 2020, 6, 185–200. [Google Scholar] [CrossRef]
  26. Lloret, F.; Keeling, E.G.; Sala, A. Components of Tree Resilience: Effects of Successive Low-Growth Episodes in Old Ponderosa Pine Forests. Oikos 2011, 120, 1909–1920. [Google Scholar] [CrossRef]
  27. Hodgson, D.; McDonald, J.L.; Hosken, D.J. What Do You Mean, ‘Resilient’? Trends Ecol. Evol. 2015, 30, 503–506. [Google Scholar] [CrossRef]
  28. Du, D.; Jiao, L.; Chen, K.; Liu, X.; Qi, C.; Xue, R.; Wu, X. Response Stability of Radial Growth of Chinese Pine to Climate Change at Different Altitudes on the Southern Edge of the Tengger Desert. Glob. Ecol. Conserv. 2022, 35, e02091. [Google Scholar] [CrossRef]
  29. Belokopytova, L.V.; Zhirnova, D.F.; Krutovsky, K.V.; Mapitov, N.B.; Vaganov, E.A.; Babushkina, E.A. Species- and Age-Specific Growth Reactions to Extreme Droughts of the Keystone Tree Species across Forest-Steppe and Sub-Taiga Habitats of South Siberia. Forests 2022, 13, 1027. [Google Scholar] [CrossRef]
  30. Manrique-Alba, À.; Beguería, S.; Camarero, J.J. Long-Term Effects of Forest Management on Post-Drought Growth Resilience: An Analytical Framework. Sci. Total Environ. 2022, 810, 152374. [Google Scholar] [CrossRef]
  31. Gazol, A.; Camarero, J.J.; Anderegg, W.R.L.; Vicente-Serrano, S.M. Impacts of Droughts on the Growth Resilience of Northern Hemisphere Forests. Glob. Ecol. Biogeogr. 2017, 26, 166–176. [Google Scholar] [CrossRef]
  32. Urrutia-Jalabert, R.; Barichivich, J.; Rozas, V.; Lara, A.; Rojas, Y.; Bahamondez, C.; Rojas-Badilla, M.; Gipoulou-Zuñiga, T.; Cuq, E. Climate Response and Drought Resilience of Nothofagus Obliqua Secondary Forests across a Latitudinal Gradient in South-Central Chile. For. Ecol. Manag. 2021, 485, 118962. [Google Scholar] [CrossRef]
  33. Sohn, J.A.; Kohler, M.; Gessler, A.; Bauhus, J. Interactions of Thinning and Stem Height on the Drought Response of Radial Stem Growth and Isotopic Composition of Norway Spruce (Picea Abies). Tree Physiol. 2012, 32, 1199–1213. [Google Scholar] [CrossRef] [PubMed]
  34. Quiñonez-Barraza, G.; Dehai, Z.; De los Santos-Posadas, H.M. Height-Diameter-Age Equation Systems for Pinus Arizonica Engelmann and Pinus Durangensis Martinez in Mixed-Species Stands in Durango, Mexico. Rev. Chapingo Ser. Cienc. For. Ambiente 2020, 26, 221–240. [Google Scholar] [CrossRef]
  35. FAO. World Reference Base for Soil Resources 2014; FAO: Rome, Italy, 2015. [Google Scholar]
  36. García, E. Modificaciones Al Sistema de Clasificación Climática de Kóppen (5.a Ed.). México; Instituto de Geografía, Ed.; Universidad Autónoma Nacional de México: Ciudad de México, México, 2004. [Google Scholar]
  37. Téllez-Valdés, O.; Miguel-Talonia, C.; Suárez-Mota, M.; Álvarez-Espino, R.X.; Hernández-Moreno, M.M. Distribución Potencial de Las Especies Pinaceae (Pinus) y Fagaceae (Quercus) de México; Comisión Nacional para el Conocimiento y Uso de la Biodiversidad (CONABIO): Ciudad de México, Mexico, 2019. [Google Scholar]
  38. Stokes, M.A.; Smiley, T.L. An Introduction to Tree Ring Dating; University of Chicago Press: Chicago, IL, USA, 1968. [Google Scholar]
  39. Holmes, R.L.; Adams, R.K.; Fritts, H.C. Tree-Ring Chronologies of Western North America: California, Eastern Oregon and Northern Great Basin with Procedures Used in the Chronology Development Work Including Users Manuals for Computer Programs COFECHA and ARSTAN; Laboratory of Tree-Ring Research, University of Arizona: Tucson, AZ, USA, 1986. [Google Scholar]
  40. Bunn, A.G. A Dendrochronology Program Library in R (DplR). Dendrochronologia 2008, 26, 115–124. [Google Scholar] [CrossRef]
  41. R Core Team. R: A Language and Environment for Statistical Computing; R Foundation for Statistical Computing: Vienna, Austria, 2020. [Google Scholar]
  42. Fritts, H.C. Tree Rings and Climate; Elsevier: London, UK; New York, NY, USA, 1976. [Google Scholar]
  43. Wigley, T.M.L.; Briffa, K.R.; Jones, P.D. On the Average Value of Correlated Time Series, with Applications in Dendroclimatology and Hydrometeorology. J. Appl. Meteorol. Climatol. 1984, 23, 201–213. [Google Scholar] [CrossRef]
  44. Briffa, K.; Jones, P.D. Basic Chronology Statistics and Assessment. In Methods of Dendrochronology: Applications in the Environmental Sciences; Cook, E.R., Kairiukstis, L.A., Eds.; Kluwer Academic Publishers: Dordrech, The Netherlands, 1990; pp. 137–162. [Google Scholar]
  45. Cook, E.; Briffa, K.; Shiyatov, S.; Mazepa, V.; Jones, P.D. Data Analysis BT. In Methods of Dendrochronology: Applications in the Environmental Sciences; Cook, E.R., Kairiukstis, L.A., Eds.; Springer: Dordrecht, The Netherlands, 1990; pp. 97–162. ISBN 978-94-015-7879-0. [Google Scholar]
  46. Buras, A. A Comment on the Expressed Population Signal. Dendrochronologia 2017, 44, 130–132. [Google Scholar] [CrossRef]
  47. Cabral-Alemán, C.; Villanueva-Díaz, J.; Quiñonez-Barraza, G.; Gómez-Guerrero, A.; Arreola-Ávila, J.G. Reconstruction of the Standardized Precipitation-Evapotranspiration Index for the Western Region of Durango State, Mexico. Forests 2022, 13, 1233. [Google Scholar] [CrossRef]
  48. Sousa, W.P. The Responses of a Community to Disturbance: The Importance of Successional Age and Species’ Life Histories. Oecologia 1980, 45, 72–81. [Google Scholar] [CrossRef]
  49. van der Maaten-Theunissen, M.; van der Maaten, E.; Bouriaud, O. PointRes: An R Package to Analyze Pointer Years and Components of Resilience. Dendrochronologia 2015, 35, 34–38. [Google Scholar] [CrossRef]
  50. LeBlanc, D.C. Relationships between Breast-Height and Whole-Stem Growth Indices for Red Spruce on Whiteface Mountain, New York. Can. J. For. Res. 1990, 20, 1399–1407. [Google Scholar] [CrossRef]
  51. Chhin, S.; Hogg, E.H.; Lieffers, V.J.; Huang, S. Growth–Climate Relationships Vary with Height along the Stem in Lodgepole Pine. Tree Physiol. 2010, 30, 335–345. [Google Scholar] [CrossRef] [PubMed] [Green Version]
  52. Grissino-Mayer, H.D. Evaluating Crossdating Accuracy: A Manual and Tutorial for the Computer Program COFECHA. Tree-Ring Res. 2001, 57, 205–221. [Google Scholar]
  53. Martínez-Sifuentes, A.R.; Villanueva-Díaz, J.; Carlón-Allende, T.; Estrada-Ávalos, J. 243 Years of Reconstructed Streamflow Volume and Identification of Extreme Hydroclimatic Events in the Conchos River Basin, Chihuahua, Mexico. Trees 2020, 34, 1347–1361. [Google Scholar] [CrossRef]
  54. Bouriaud, O.; Leban, J.-M.; Bert, D.; Deleuze, C. Intra-Annual Variations in Climate Influence Growth and Wood Density of Norway Spruce. Tree Physiol. 2005, 25, 651–660. [Google Scholar] [CrossRef] [Green Version]
  55. Latte, N.; Lebourgeois, F.; Claessens, H. Growth Partitioning within Beech Trees (Fagus Sylvatica L.) Varies in Response to Summer Heat Waves and Related Droughts. Trees 2016, 30, 189–201. [Google Scholar] [CrossRef] [Green Version]
  56. Villanueva-Díaz, J.; Martínez-Sifuentes, A.R.; Quiñonez-Barraza, G.; Estrada-Ávalos; Perez-Evangelista, E.R.; del Rocío Reyes-Camarillo, F.; Reyes-Camarillo, R. Annual Radial Growth and Climatic Response of Quercus crassifolia Bonpl. in Northwestern Durango, Mexico. Trees 2021, 35, 783–798. [Google Scholar] [CrossRef]
  57. Martínez-Sifuentes, A.R.; Villanueva-Díaz, J.; Correa-Díaz, A.; Estrada-Ávalos, J.; Trucíos-Caciano, R.; Estrada-Arellano, J.R.; Cardoza-Martínez, G.F.; Garza-Martínez, M.Á. Dendroclimatic Reconstruction of Precipitation and Temperature for the Mayo River Basin in Northwestern Mexico. Trees 2022, 36, 835–847. [Google Scholar] [CrossRef]
  58. Pompa-García, M.; Camarero, J.J. Reconstructing Evaporation From Pine Tree Rings In Northern Mexico. Tree-Ring Res. 2015, 71, 95–105. [Google Scholar] [CrossRef]
  59. Cabral-Alemán, C.; Pompa-García, M.; Acosta-Hernández, A.C.; Zúñiga-Vásquez, J.M.; Camarero, J.J. Earlywood and Latewood Widths of Picea Chihuahuana Show Contrasting Sensitivity to Seasonal Climate. Forests 2017, 8, 173. [Google Scholar] [CrossRef] [Green Version]
  60. Lacointe, A. Carbon Allocation among Tree Organs: A Review of Basic Processes and Representation in Functional-Structural Tree Models. Ann. For. Sci. 2000, 57, 521–533. [Google Scholar] [CrossRef] [Green Version]
  61. Rubio-Cuadrado, A.; Bravo-Oviedo, A.; Mutke, S.; Del Río, M. Climate Effects on Growth Differ According to Height and Diameter along the Stem in Pinus Pinaster Ait. iForest-Biogeosciences For. 2018, 11, 237–242. [Google Scholar] [CrossRef] [Green Version]
  62. Stahle, D.W.; Cook, E.R.; Burnette, D.J.; Villanueva, J.; Cerano, J.; Burns, J.N.; Griffin, D.; Cook, B.I.; Acuña, R.; Torbenson, M.C.A.; et al. The Mexican Drought Atlas: Tree-Ring Reconstructions of the Soil Moisture Balance during the Late Pre-Hispanic, Colonial, and Modern Eras. Quat. Sci. Rev. 2016, 149, 34–60. [Google Scholar] [CrossRef] [Green Version]
  63. Villanueva-Díaz, J.; Castruita-Esparza, L.U.; Martínez-Sifuentes, A.R.; Loera-Chaparro, R.; Estrada-Ávalos, J. Chihuahua Southwestern Hydroclimatic Variability Inferred with Coniferous Growth Rings. Rev. Chapingo Ser. Cienc. For. Ambiente 2020, 26, 373–389. [Google Scholar] [CrossRef]
  64. Greenwood, S.; Ruiz-Benito, P.; Martínez-Vilalta, J.; Lloret, F.; Kitzberger, T.; Allen, C.D.; Fensham, R.; Laughlin, D.C.; Kattge, J.; Bönisch, G.; et al. Tree Mortality across Biomes Is Promoted by Drought Intensity, Lower Wood Density and Higher Specific Leaf Area. Ecol. Lett. 2017, 20, 539–553. [Google Scholar] [CrossRef] [Green Version]
  65. Gazol, A.; Camarero, J.J.; Vicente-Serrano, S.M.; Sánchez-Salguero, R.; Gutiérrez, E.; de Luis, M.; Sangüesa-Barreda, G.; Novak, K.; Rozas, V.; Tíscar, P.A.; et al. Forest Resilience to Drought Varies across Biomes. Glob. Chang. Biol. 2018, 24, 2143–2158. [Google Scholar] [CrossRef] [PubMed]
  66. Zhang, X.; Fan, Z.; Shi, Z.; Pan, L.; Kwon, S.; Yang, X.; Liu, Y. Tree Characteristics and Drought Severity Modulate the Growth Resilience of Natural Mongolian Pine to Extreme Drought Episodes. Sci. Total Environ. 2022, 830, 154742. [Google Scholar] [CrossRef] [PubMed]
  67. Carlón Allende, T.; Villanueva Díaz, J.; Soto Castro, G.; Mendoza, M.E.; Macías, J.L. Tree Rings as Indicators of Climatic Variation in the Trans-Mexican Volcanic Belt, Central Mexico. Ecol. Indic. 2021, 120, 106920. [Google Scholar] [CrossRef]
  68. Castruita-Esparza, L.U.; Silva, L.C.R.; Gómez-Guerrero, A.; Villanueva-Díaz, J.; Correa-Díaz, A.; Horwath, W.R. Coping With Extreme Events: Growth and Water-Use Efficiency of Trees in Western Mexico During the Driest and Wettest Periods of the Past One Hundred Sixty Years. J. Geophys. Res. Biogeosci. 2019, 124, 3419–3431. [Google Scholar] [CrossRef]
  69. Wu, G.; Liu, X.; Chen, T.; Xu, G.; Wang, B.; Kang, H.; Li, C.; Zeng, X. The Positive Contribution of IWUE to the Resilience of Schrenk Spruce (Picea Schrenkiana) to Extreme Drought in the Western Tianshan Mountains, China. Acta Physiol. Plant. 2020, 42, 168. [Google Scholar] [CrossRef]
  70. Milne, B.T.; Moore, D.I.; Betancourt, J.L.; Parks, J.A.; Swetnam, T.W.; Parmenter, R.R.; Pockman, W.T. Multidecadal Drought Cycles in South-Central New Mexico: Patterns and Consequences; Oxford University Press: New York, NY, USA, 2003. [Google Scholar]
  71. Vega-Camarena, J.P.; Brito-Castillo, L.; Farfán, L.M.; Gochis, D.J.; Pineda-Martínez, L.F.; Díaz, S.C. Ocean–Atmosphere Conditions Related to Severe and Persistent Droughts in the Mexican Altiplano. Int. J. Climatol. 2018, 38, 853–866. [Google Scholar] [CrossRef]
  72. Martínez-Vilalta, J.; López, B.C.; Loepfe, L.; Lloret, F. Stand- and Tree-Level Determinants of the Drought Response of Scots Pine Radial Growth. Oecologia 2012, 168, 877–888. [Google Scholar] [CrossRef] [PubMed]
  73. Morán-López, T.; Poyatos, R.; Llorens, P.; Sabaté, S. Effects of Past Growth Trends and Current Water Use Strategies on Scots Pine and Pubescent Oak Drought Sensitivity. Eur. J. For. Res. 2014, 133, 369–382. [Google Scholar] [CrossRef]
  74. Gazol, A.; Camarero, J.J.; Sangüesa-Barreda, G.; Vicente-Serrano, S.M. Post-Drought Resilience After Forest Die-Off: Shifts in Regeneration, Composition, Growth and Productivity. Front. Plant Sci. 2018, 9, 1546. [Google Scholar] [CrossRef] [PubMed]
  75. Bose, A.K.; Gessler, A.; Bolte, A.; Bottero, A.; Buras, A.; Cailleret, M.; Camarero, J.J.; Haeni, M.; Hereş, A.-M.; Hevia, A.; et al. Growth and Resilience Responses of Scots Pine to Extreme Droughts across Europe Depend on Predrought Growth Conditions. Glob. Change Biol. 2020, 26, 4521–4537. [Google Scholar] [CrossRef]
  76. Pretzsch, H. Forest Dynamics, Growth, and Yield BT. In Forest Dynamics, Growth and Yield: From Measurement to Model; Pretzsch, H., Ed.; Springer: Berlin/Heidelberg, Germany, 2009; pp. 1–39. ISBN 978-3-540-88307-4. [Google Scholar]
  77. Rais, A.; van de Kuilen, J.-W.G.; Pretzsch, H. Growth Reaction Patterns of Tree Height, Diameter, and Volume of Douglas-Fir (Pseudotsuga Menziesii [Mirb.] Franco) under Acute Drought Stress in Southern Germany. Eur. J. For. Res. 2014, 133, 1043–1056. [Google Scholar] [CrossRef]
Figure 1. Characteristics of the study area: (a) geographic location of the sampling site; (b) potential distribution of P. durangensis along the Sierra Madre Occidental [37]; (c) location of the sampled trees (n = 50); (d) mean annual precipitation; and (e) mean annual temperature.
Atmosphere 14 00043 g001
Figure 2. (a) Standard version of the ring-width index chronologies at different stem heights in P. durangensis, (b) SPEI reconstructed for the western region of the state of Durango [47]. Vertical shaded red lines and black circles mark regional extreme drought events.
Atmosphere 14 00043 g002
Figure 3. Variation in the resistance, recovery and resilience indices throughout the extreme droughts studied. RWI1 = sampled at 0.07-0.15 m; RWI2 = sampled at 1.3 m; RWI3 = sampled at 1.6 m; RWI4 = sampled at 11.0–12.0 m. The red horizontal lines correspond to mean indices of 1.0 for recovery and resilience, where values over this line imply a full recovery from previous drought conditions, whereas values below 1.0 are indicative that the trees had problems recovering in a four-year period after the dry conditions.
Atmosphere 14 00043 g003
Figure 4. Relationship between the mean Rt and Rc values observed at different tree stem heights in P. durangensis and the hypothetical function representing the line of full resilience at any Rt value for each extreme drought year. The dots represent the samples of RWI1, RWI2, RWI3, and RWI4. RWI1 = sampled at 0.07–0.15 m; RWI2 = sampled at 1.3 m; RWI3 = sampled at 1.6 m; RWI4 = sampled at 11–12 m.
Atmosphere 14 00043 g004
Figure 5. Impacts of seven drought events on forest growth at different stem heights in P. durangensis assessed over an average of four years pre-drought, during the drought year, and four years post-drought.
Atmosphere 14 00043 g005
Table 1. Dendrochronological statistics for the standard version of the ring-width chronology of Pinus durangensis at different tree stem heights.
ChronologyHeight (m) Dendrochronological Statistics
MeanSDRbarEPSSIMSAC1SSS > 0.85
RWI10.07–0.151717–20200.940.350.280.970.600.380.541801–2020
RWI21.31736–20200.950.270.320.980.610.360.361797–2020
RWI36.31797–20200.970.210.330.970.640.320.291831–2020
RWI411.0–12.01819–20201.000.240.340.970.650.300.461880–2020
RWI, ring-width index; SD, standard deviation; Rbar, mean correlation between series; EPS, expressed population signal; SI, series intercorrelation; MS, mean sensitivity; AC1, first-order autocorrelation; SSS, subsample signal strength.
Table 2. Pearson’s correlation analysis between the ring width index (RWI) at different tree stem heights and SPEI06FM.
VariablePearson’s Correlation Coefficientp-Value
RWI10.7380.001
RWI20.5680.001
RWI30.8030.001
RWI40.5670.001
Table 3. Mean and standard deviation of resistance, recovery, and resilience indices for each tree stem section of P. durangensis in seven selected drought events.
Drought Year Resistance (Rt)Recovery (Rc)Resilience (Rs)
RWI1RWI2RWI3RWI4RWI1RWI2RWI3RWI4RWI1RWI2RWI3RWI4
1890Mean0.510.440.490.641.311.422.341.480.600.570.660.91
SD0.230.160.130.220.450.671.650.350.270.170.190.29
1902Mean0.680.590.650.672.282.242.791.791.231.031.191.00
SD0.320.300.280.291.611.652.630.930.520.410.590.34
1956Mean0.600.580.640.542.482.592.792.421.391.491.311.20
SD0.250.220.240.151.401.714.731.290.791.640.490.25
1974Mean0.560.590.630.751.941.761.611.481.050.960.961.05
SD0.170.210.230.260.850.750.570.520.430.280.280.27
1999Mean0.640.680.760.741.981.871.511.501.081.111.030.99
SD0.300.360.360.331.741.160.820.610.560.640.470.36
2006Mean0.530.560.640.751.651.621.601.370.790.830.870.98
SD0.240.200.240.280.700.671.120.510.330.340.290.43
2011Mean0.510.520.530.562.302.262.121.981.001.021.021.03
SD0.200.260.190.231.521.150.980.860.410.350.390.35
RWI1, chronology at 0.07–0.15 m stem height; RWI2, chronology at 1.3 m stem height; RWI3, chronology at 6.3 m stem height; RWI4 chronology at 11.0–12.0 m stem height; SD, standard deviation.
Disclaimer/Publisher’s Note: The statements, opinions and data contained in all publications are solely those of the individual author(s) and contributor(s) and not of MDPI and/or the editor(s). MDPI and/or the editor(s) disclaim responsibility for any injury to people or property resulting from any ideas, methods, instructions or products referred to in the content.

