Article

Analysis of Flow Structures and Global Parameters across a Heated Square Cylinder in Forced and Mixed Convection

Department of Mechanical Engineering, Zakir Husain College of Engineering and Technology, Aligarh Muslim University, Aligarh 202002, India
*
Author to whom correspondence should be addressed.
Atmosphere 2023, 14(1), 22; https://doi.org/10.3390/atmos14010022
Submission received: 27 October 2022 / Revised: 6 December 2022 / Accepted: 19 December 2022 / Published: 23 December 2022
(This article belongs to the Special Issue Advances in Computational Wind Engineering and Wind Energy)

Abstract

:
In the present study, numerical simulations are performed to identify the role of Reynolds number (Re), Richardson number (Ri) and free-stream orientations (α) on flow structures, aerodynamic parameters and heat transfer characteristics for the conditions (20 ≤ Re ≤ 120, 0° ≤ α ≤ 90° and 0 ≤ Ri ≤ 1.6). Prandtl number (Pr) and cylinder orientation (ϕ) are kept fixed at 0.71 and 0°. The Oberbeck–Boussinesq approximation is used to account for buoyancy effects. The governing equations of continuity, momentum and energy are discretized on a colocated body-fitted grid by employing a finite difference method. A viscous implicit pressure correction scheme is employed to advance the discrete solution in time. Contour maps of mean/steady drag coefficient and Nusselt number on (α-Ri) plane are plotted for 20 ≤ Re ≤ 120. From these contour maps, it is possible to identify the ranges of parameters (α, Ri) that can yield a relatively high mean/steady heat transfer rate accompanied by relatively low values of mean/steady drag coefficient. For [70° ≤ α ≤ 90°, 0 ≤ Ri ≤ 1.6], such a scenario is possible for any Re ∈ [20, 120]. The Strouhal number is observed to be maximum for Re = 120 at α = 45° and Ri = 1.2. Mean or steady coefficient of lift for any free-stream orientation (α ≠ 0°) is found to be highest at Re = 20 and Ri = 1.6. Sensitivity of (CD)Ri = 0.0 to α is observed to be minimum for Re = 20 and maximum for Re = 120. Sensitivity of the ratio CD(Ri,α)/CD(0,α) to Re is observed to be lower for unsteady flows than for steady flows, and it decreases with an increase in Re at a fixed value of Ri. Mean Nusselt number (Nu) in the forced flow regime increases significantly with an increase in Re at a fixed α. The Nusselt number is observed to be more sensitive to Ri for steady flows than for unsteady flows. The percentage increase in the ratio Nu(Ri,α)/Nu(0,α) for the entire range of Re is found to be 14.07%, 14.13%, 11.74% and 10.62% at α = 30°, 45°, 60° and 90°. At a fixed Ri, the Nusselt number ratio is found to decrease with an increase in Re for the entire range of α except for α = 90°. It is observed that the rate of heat transfer from the faces of the cylinder increases with an increase in Re for the entire ranges of α and Ri.

1. Introduction

The flow of air past a canonical bluff body similar to a square cylinder is generally studied to understand the basic aspects of flow dynamics, such as wake flow physics, vortex-shedding characteristics, etc. The understanding developed helps in accounting for the flow phenomenon around earth-fixed structures exposed to the atmosphere. For tethering cables of various structures, such as poles, communicating towers and transmission cables, the flow of air around such cables can generate undesirable forces that require control.
Applications of fluid flow and heat transfer in forced/mixed convection across a heated bluff body include cooling of electronic components, integrated circuit chips (IC chips), electronic circuits, uninterruptible power supply (UPS) and central processing units (CPUs), tube banks in heat exchangers, cooling towers, oil and gas pipelines, combustion chambers, extended surfaces, fins, high-rise buildings and bridges. Figure 1 shows the geometry of the proposed problem. The associated forces per unit span in the x and y directions are Fx and Fy, respectively, and FL and FD are the lift and drag forces associated with the free-stream orientation (α). Cylinder orientation, free-stream velocity, edge of square cylinder and gravitational intensity are represented as ϕ, U, d and g, respectively.
The dynamics of flow in two-dimensional forced or mixed convection past a heated square cylinder is modeled via the Oberbeck–Boussinesq approximation and is characterized by five dimensionless parameters, given as follows:
(i)
Re (Reynolds number) = U d ν o ,
(ii)
Ri (Richardson number) = g β ( T s T ) d U 2 ,
(iii)
Pr (Prandtl number) = ν o κ o ,
(iv)
α = Free-stream orientation (with respect to gravity) and
(v)
ϕ = Bluff-body orientation (with respect to the X-axis).
The characteristic length scale of the body, co-efficient of volume expansion of the fluid, uniform bluff-body surface temperature and free-stream fluid temperature in the above-mentioned dimensionless numbers are represented as: d, β , Ts and T. The kinematic viscosity and thermal diffusivity at some reference temperature To (the free-stream fluid temperature T) are denoted as ν o and κ o . The free-stream orientation (α) and geometric orientation (ϕ) do not behave as independent parameters for flows without heat transfer or forced convective flows.
A literature survey of earlier studies on the flow past a square cylinder is presented below.
Turki et al. [1] carried out a numerical study for the flow past a heated square cylinder at blockage ratios (BR) = 1/4 and 1/8, 62 ≤ Re ≤ 200, 0 ≤ Ri ≤ 0.1, Pr = 0.71, ϕ = 0° and α = 90°. They found that the Nusselt number increases with an increase in the Richardson number. Additionally, with an increase in Reynolds number, the Strouhal number varies monotonically and was found to be maximum at Re = 130 and 150 for blockage ratios (BR) of 1/8 and 1/4, respectively. Sharma and Eswaran [2] considered the effects of aiding and opposing buoyancy and neglected the viscous dissipation term in the energy equation. The parameters chosen in the study were Re = 100, α = 0°, ϕ = 0°, −1 ≤ Ri < 1 and Pr = 0.7, respectively. They observed the suppression of vortex-shedding at a critical Richardson number of 0.15. Bhattacharyya and Mahapatra [3] observed that the cylinder experienced a mean downward lift and that the centerline symmetry of the wake was lost when buoyancy effects were considered. They also observed that, for any value of Ri, the suppression of vortex-shedding was not present. Numerical simulations in their study were conducted at α = 90°, 100 ≤ Re ≤ 1400, 0 ≤ Ri ≤ 1 and Pr = 0.72. Sharma and Eswaran [4] considered aiding and opposing buoyancy, and the viscous dissipation term was neglected in the energy equation. They showed that with an increase in blockage ratio, the critical Ri required for the suppression of vortex-shedding decreases up to a certain blockage ratio (=30%), but thereafter increases. The value of Ri at which vortex-shedding is suppressed increases with Re at a constant blockage ratio (=30%).
Singh et al. [5] observed the suppression of vortex-shedding at Ri = 0.122 and Re = 94 and at Ri = 0.157 and Re = 110 for a circular cylinder. For a square cylinder, the critical Ri at which suppression of vortex-shedding was observed were 0.107, 0.121, 0.140, 0.155 and 0.171 at Re = 87, 94, 103, 109 and 118, respectively. Perng and Wu [6] reported in their study that at a Richardson number of −0.25 and −1 for blockage ratios of 50% and 30%, the maximum and minimum time mean Nusselt number were found to be 49.91% and 19.00%, respectively. Dhiman et al. [7] observed that for BR = 0.125, ϕ = 0°, α = 90°, 1 ≤ Re ≤ 30, 0.7 ≤ Pr ≤ 100 and 0 ≤ Ri ≤ 1 that the drag coefficient was less sensitive to the Richardson number in comparison to the lift coefficient. Kakade et al. [8] observed that the shedding of vortices was absent for all Richardson numbers (0.031–0.291) at Re = 56 and α = 0°. They also observed regular vortex-shedding for all incidence angles at Reynolds numbers of 87 and 100 and Ri ≠ 0. The parameters chosen in their study were Re = 56, 87, 100, α = 0°, 0.031 ≤ Ri ≤ 0.291 and 0 ≤ ϕ ≤ 45°. Chatterjee [9] observed that vortex-shedding was induced when buoyancy crosses the threshold value for the conditions (Pr = 0.7, BR = 0.05, α = 90°, 10 ≤ Re ≤ 40, 0 ≤ Ri ≤ 2). It was also observed that the critical Richardson number for the onset of vortex-shedding was always found to be higher for the circular cylinder than for the square cylinder.
Chatterjee and Mondal [10] carried out numerical experiments for α = 0°, Pr = 0.7, 50 ≤ Re ≤ 150, −1 ≤ Ri ≤ 1, BR = 2% and 25%. They found that the Strouhal number increases with an increase in heating and suddenly falls to zero at some critical Richardson number. They also found that for a particular blockage ratio, the critical Richardson number increases with an increase in Reynolds number, and the value of the critical Richardson number decreases with an increase in the blockage ratio. Dhiman et al. [11] found that the onset of flow separation occurred between Re = 2 and 3 or 3 and 4 for BR = 25% and 30% or 50%, irrespective of the magnitude of Ri. They also found that the total drag coefficient decreases with an increase in Re and increases with an increase in Ri and BR. They observed that the surface mean Nusselt number increases with an increase in Re and Ri. Yang and Wu [12] observed the suppression of vortex-shedding at Ri = 0.15 and SR = 1 (SR is the side ratio) for the chosen conditions (α = 0°, 0.5 ≤ SR ≤ 2, −1 ≤ Ri ≤ 1, Re = 100, Pr = 0.7). They also observed that with an increase in the side ratio, the critical Richardson number decreases monotonically. It was found that at a constant side ratio, the Strouhal number increases with an increase in the Richardson number. It was also found that the drag coefficient increases with an increase in aiding or opposing buoyancy, except for SR = 0.5, at which the drag coefficient was found to decrease with an increase in opposing buoyancy. Sivakumar et al. [13] numerically investigated mixed convective heat transfer from a heated square bar at an incidence of 45° in power-law fluids. They observed that for α = 45°, 0 ≤ Ri ≤ 2, 0.7 ≤ Pr ≤ 100, 1 ≤ Re ≤ 40 and 0.2 ≤ n ≤ 1 (n is the power-law index, n < 1 belongs to non-Newtonian fluids and n = 1 Newtonian fluids), the local and surface average values of the Nusselt number increase with an increase in Reynolds number, Prandtl number, and Richardson number at a fixed value of power-law index.
Islam et al. [14] invested numerical uniform flow past a square cylinder in the presence of a detached flat plate for various gap spacing using the multi-relaxation-time lattice Boltzmann method (MRT-LBM). The Reynolds number and gap spacing (g) were 150 and 0–11, respectively. They observed three different flow regimes: (i) extended-body flow regime (0 ≤ g ≤ 1.53); (ii) reattachment flow regime (1.9 ≤ g ≤ 4); and (iii) fully developed flow regime (4.8 ≤ g ≤ 11). Rastan et al. [15] numerically investigated the three-dimensional unsteady flow characteristics around a finite wall-mounted square cylinder with an aspect ratio (AR) of 7 and Reynolds number 40 ≤ Re ≤ 250. They observed the vortex-shedding inception within the range of Reynolds number 75 < Re < 85. They found that the wake flow changes from a dipole to a quadrupole type when the flow changes from a steady to an unsteady flow. Dey and Das [16] studied the numerical consequences of the corner roundness of a square cylinder and nanofluid volume fraction on the warmth transmission and fluid flow phenomenon at Re = 100. The blending percentage was in the range of 0–15% and the corner radius varied from 0.5D (circle) to 0.71D (square). They found that the heat transfer amount was maximum at r = 0.51, and at r = 0.50, the fluid forces were the least for every volume fraction.
Bensedira et al. [17] presented a dynamic study of fluid flow around two circular cylinders placed in a transverse arrangement near a solid wall for Re = 200. The distance between the two cylinders and the distance between the bottom cylinder and wall were represented by L/D and G/D. They observed that the mean drag coefficient of the bottom cylinder was large compared to the top cylinder when L/D was varied. However, for the top cylinder, the mean drag coefficient decreased when G/D increased. The lift coefficient of the bottom cylinder was influenced strongly by G/D ratio. It was also found that the Strouhal number values of the bottom cylinder near the wall varied between 0.03–0.06. Wang [18] presented the numerical solution of flow around a surface-mounted square cylinder at an aspect ratio of 7 for Reynolds numbers 652 and 13041, respectively. They captured a dipole wake at a higher Reynolds number, while a quadrupole wake was captured for a lower Reynolds number. Islam et al. [19] simulated the flow past four identical side-by-side square cylinders using the lattice Boltzmann method. The simulations were conducted at Re = 60, 80, 100, 120 and 140, and the spacing ratio between the cylinders was set at 0, 0.25, 0.5, 0.75, 1, 1.25, 1.5, 1.75, 2, 2.5, 3, 3.5 and 4. They identified seven flow regimes, namely weak interaction flow regime (regime I), flip-flopping flow regime (regime II), base-bleed flow regime (regime III) and two-row vortex street flow regime (regime IV). Regime I was further subdivided into three: (a) inphase–antiphase asynchronous weak interaction flow regime (regime IA), (b) inphase asynchronous weak interaction flow regime (regime IB) and (c) inphase–antiphase synchronized weak interaction flow regime (regime IC). Similarly, regime III was subdivided into two: (a) a weak base-bleed flow regime (regime IIIA) and (b) a strong base-bleed flow regime (regime IIIB).
Alam et al. [20] numerically simulated the laminar flow and heat transfer from a cylinder with varying cross-sections from square to circular at Re = 150, α = 0°–45° and r/R = 0–1.0 (where r is the corner radius and R is the half side width of the cylinder). They observed that vortex formation length was inversely linked to heat transfer and forces. Rashid and Hasan [21] obtained in their study the neutral curves in Ri-α plane to identify the steady and unsteady flow regimes for the conditions (0° ≤ α ≤ 90°, 20 ≤ Re ≤ 120, 0 ≤ Ri ≤ 1.6, ϕ = 0°, Pr = 0.71). Zafar and Alam [22] studied numerically the flow and heat transfer topology of a flow past a circular cylinder with another cylinder in its wake at Re = 100, Pr = 0.7, Ri = 0–2.0 and center-to-center cylinder spacing (L/D) = 1.2–5.0. They observed that at a sufficiently high Ri, the wake was characterized by a P + S (pair and single) vortex street, with the P vortices being hotter than the S vortices. When Ri was increased, downwash and upwash flows were generated before and after the heated cylinder and enhanced the heat transfer from the wake cylinder. Rashid and Anshumaan [23] found steady flows for 1 ≤ Re ≤ 30 and 0 ≤ Ri ≤ 0.50 at α = 0°, 1 ≤ Re ≤ 20 and 0 ≤ Ri ≤ 0.50 at α = 45°, 1 ≤ Re ≤ 10 and 1.0 ≤ Ri ≤ 1.50 at α = 90°. The onset of vortex-shedding was found to occur initially at Re = 30, α = 45°, 0 ≤ Ri ≤ 0.50 and the flow was observed to be unsteady and periodic. They observed that the rate of heat transfer increases with an increase in both the Richardson number and Reynolds number. Abbasi et al. [24] numerically investigated the flow around two inline square cylinders with a flat plate placed in the wake using the lattice Boltzmann method at Re = 150. The gap ratio between both cylinders as well as between the second cylinder and plate varied in the range of 0.5 to 10. They observed three different flow structures by systematically increasing the gap ratio: (i) solo body (L/d = 0.5), (ii) reattachment flow (1  ≤  L/d  <  4) and (iii) binary vortex flow (4  ≤  L/d  ≤  10). A maximum reduction was found to be 19% in average drag force and 100% in Strouhal number due to the presence of a control plate.
Mashhadi et al. [25] conducted numerical simulations on 2D and 3D unconfined flows over rectangular cylinders for AR = 0.25–4.0 and Re = 30–200. They observed that both AR and Re played vital roles in the formation of separation bubbles on the cylinder side surfaces. The detailed flow structures were linked to the mean and fluctuating forces and Strouhal numbers. Arif and Hasan [26] numerically investigated the effects of heating and free-stream inclination on aerodynamic and heat transfer parameters for Re = 100, Pr = 0.71, ϕ = 0°, Fr = 1.0 (Fr is the Froude number), and M = 0.1 (M is the Mach number) in the large-scale heating regime using a fully compressible (non-Boussinesq) model. Free-stream inclination (α) and over-heat ratio (ϵ) were varied in the ranges [0°, 90°] and [0, 1], respectively. They observed that an increase in heating causes a significant increase in the mean drag coefficient for α ≤ 45°, while for α > 45° heating had little effect on the mean drag coefficient. Additionally, the mean lift coefficient (CL) increases with increasing ϵ for any value of α (except α = 0°). The mean Nusselt number exhibited a non-monotonic trend for ϵ ≤ 0.6 with an increase in α, and it attained a maximum value at α ≅ 40°.
The following gaps were identified from the detailed literature survey:
  • Combined effects of fluid inertia, buoyancy forces and free-stream orientations on Strouhal number and on global parameters are not investigated in detail for mixed convective flow past a square cylinder.
  • The associated effects of Reynolds number, buoyancy forces and free-stream orientations on surface pressure, surface vorticity, and local or time mean heat transfer have not been studied in detail in previous studies.
  • The characteristic maps of mean or steady drag coefficient and Nusselt number are not produced to date for a wide range of Re, Ri and α in mixed convective flow past an isolated canonical bluff body of square shape.
The present study focuses on the combined effects of Reynolds number, Richardson number and free-stream orientations within the framework of Boussinesq approximation on global parameters, streamline patterns and contours of vorticity, characteristics of Strouhal number, surface pressure and surface vorticity. Numerical experiments have been carried out at a fixed ϕ = 0° and Pr = 0.71. The Reynolds number and the Richardson number vary in the ranges 20 to120 and 0 to 1.6 in steps of 20 and 0.2, respectively. Free-stream orientations vary from 0°–90° in steps of 10°. As a specific case α = 45° is also considered. The parametric space considered does not exactly fit a specific scenario but has been chosen so as to provide preliminary feasible data within the two-dimensional laminar framework.
The present paper is organized into five sections. In Section 1, an introduction to the problem is considered, along with previous studies related to mixed convective flow past a square cylinder. The mathematical formulation of the problem is presented in Section 2. The numerical scheme and various aspects are discussed in Section 3. The results and their analyses are presented in Section 4. The conclusions drawn from the present study are presented in Section 5.

2. Mathematical Formulation

The flow field around a heated square cylinder within the framework of Oberbeck–Boussinesq approximation (Tritton [27]) is taken to be unconfined, unsteady, two-dimensional, viscous, incompressible and laminar. The variation of fluid properties such as viscosity, thermal diffusivity and specific heat with temperature other than density are ignored completely in Oberbeck–Boussinesq approximation. For small-scale heating, the material derivative of density in the continuity equation is neglected; the density is assumed to be constant in the local and convective terms of the momentum equations. The density is variable only in the gravity term (body force in the vertical momentum equation). The viscous dissipation in the energy equation is also neglected.
The equations of mass, momentum and energy in their dimensionless form in Cartesian coordinates, subjected to Oberbeck–Boussinesq approximation, transformed into generalized body-fitted coordinates are given as follows:
Continuity:
( ξ x ξ + η x η ) u + ( ξ y ξ + η y η ) v = 0 ,
x—Momentum:
u τ + U ξ u ξ + U η u η = ( ξ x p ¯ ξ + η x p ¯ η ) + 1 Re ˜ 2 u ,
y—Momentum:
v τ + U ξ v ξ + U η v η = + Ri θ ( ξ y p ¯ ξ + η y p ¯ η ) + 1 Re ˜ 2 v ,
Energy Equation:
θ τ + U ξ θ ξ + U η θ η = 1 ( Re . Pr ) ˜ 2 θ ,
where u and v are the corresponding dimensionless Cartesian velocity components in the above equations. The dimensionless velocity components are U ξ   and   U η along ξ and η directions. The velocity components U ξ   and   U η are related to the Cartesian components given as,
U ξ = ξ x u + ξ y v ,
U η = η x u + η y v ,
˜ 2 is the transformed Laplacian operator given as,
˜ 2 A ˜ 2 ξ 2 + 2 B ˜ 2 ξ η + C ˜ 2 η 2 + P ˜ ξ + Q ˜ η ,
The above equation involves the metrics in the form of coefficients A ˜ ,   B ˜ ,   C ˜ ,   P ˜ ,   and   Q ˜ , which are given as,
A ˜ = ξ x 2 + ξ y 2 ,
B ˜ = ξ x η x + ξ y η y
C ˜ = η x 2 + η y 2
and
2 ξ = P ˜ , 2 η = Q ˜ ,
where 2 is the Laplacian operator in the Cartesian coordinates given as,
2 2 x 2 + 2 y 2 ,
To convert the basic equations to non-dimensional form, the length, velocity and time scales are chosen as follows,
  • Length scale ≡ ‘ d ’ = the edge of square cylinder.
  • Velocity scale ≡ ‘ U ’ = the free-stream velocity magnitude.
  • Time scale ≡ ‘ d / U ’ = the residence ≡ time spent in the vicinity of the cylinder by the fluid particles.
Velocities and time in their dimensionless form are given as,
u = U/U,
v = V/U and
τ = tU/d.
Changes in fluid temperature and pressure scales are ( T s T ) and ρ o U 2 respectively, and the corresponding dimensionless temperature and pressure are accordingly defined as,
θ = T T T s T , p ¯ = P P ρ U 2 ,
where, ρ o is the density at reference free-stream temperature ( T ).

Boundary Conditions

The boundary conditions at the surface of the square cylinder and infinite distance from the cylinder are given as,
Solid surface of the square cylinder: For the velocity component, no-slip and no-penetration conditions are utilized, and the cylinder is taken to be at a uniform elevated temperature Ts.
The boundary conditions in non-dimensional form are given as,
U = 0 , θ = 1.0 .
For pressure, a normal momentum condition is employed.
Infinite distances from the cylinder: The undisturbed free-stream conditions would exist at infinite distances from the cylinder (Figure 1) given as,
V = U = ( Sin α i ^ + Cos α j ^ )
θ = 0
p ¯ = 0
where, V is the dimensionless fluid velocity vector, U is the uniform velocity of the incoming free-stream, p ¯ is the dimensionless pressure and i ^ ,   j ^ are the unit vectors along x and y directions, respectively.

3. Numerical Scheme and Various Aspects
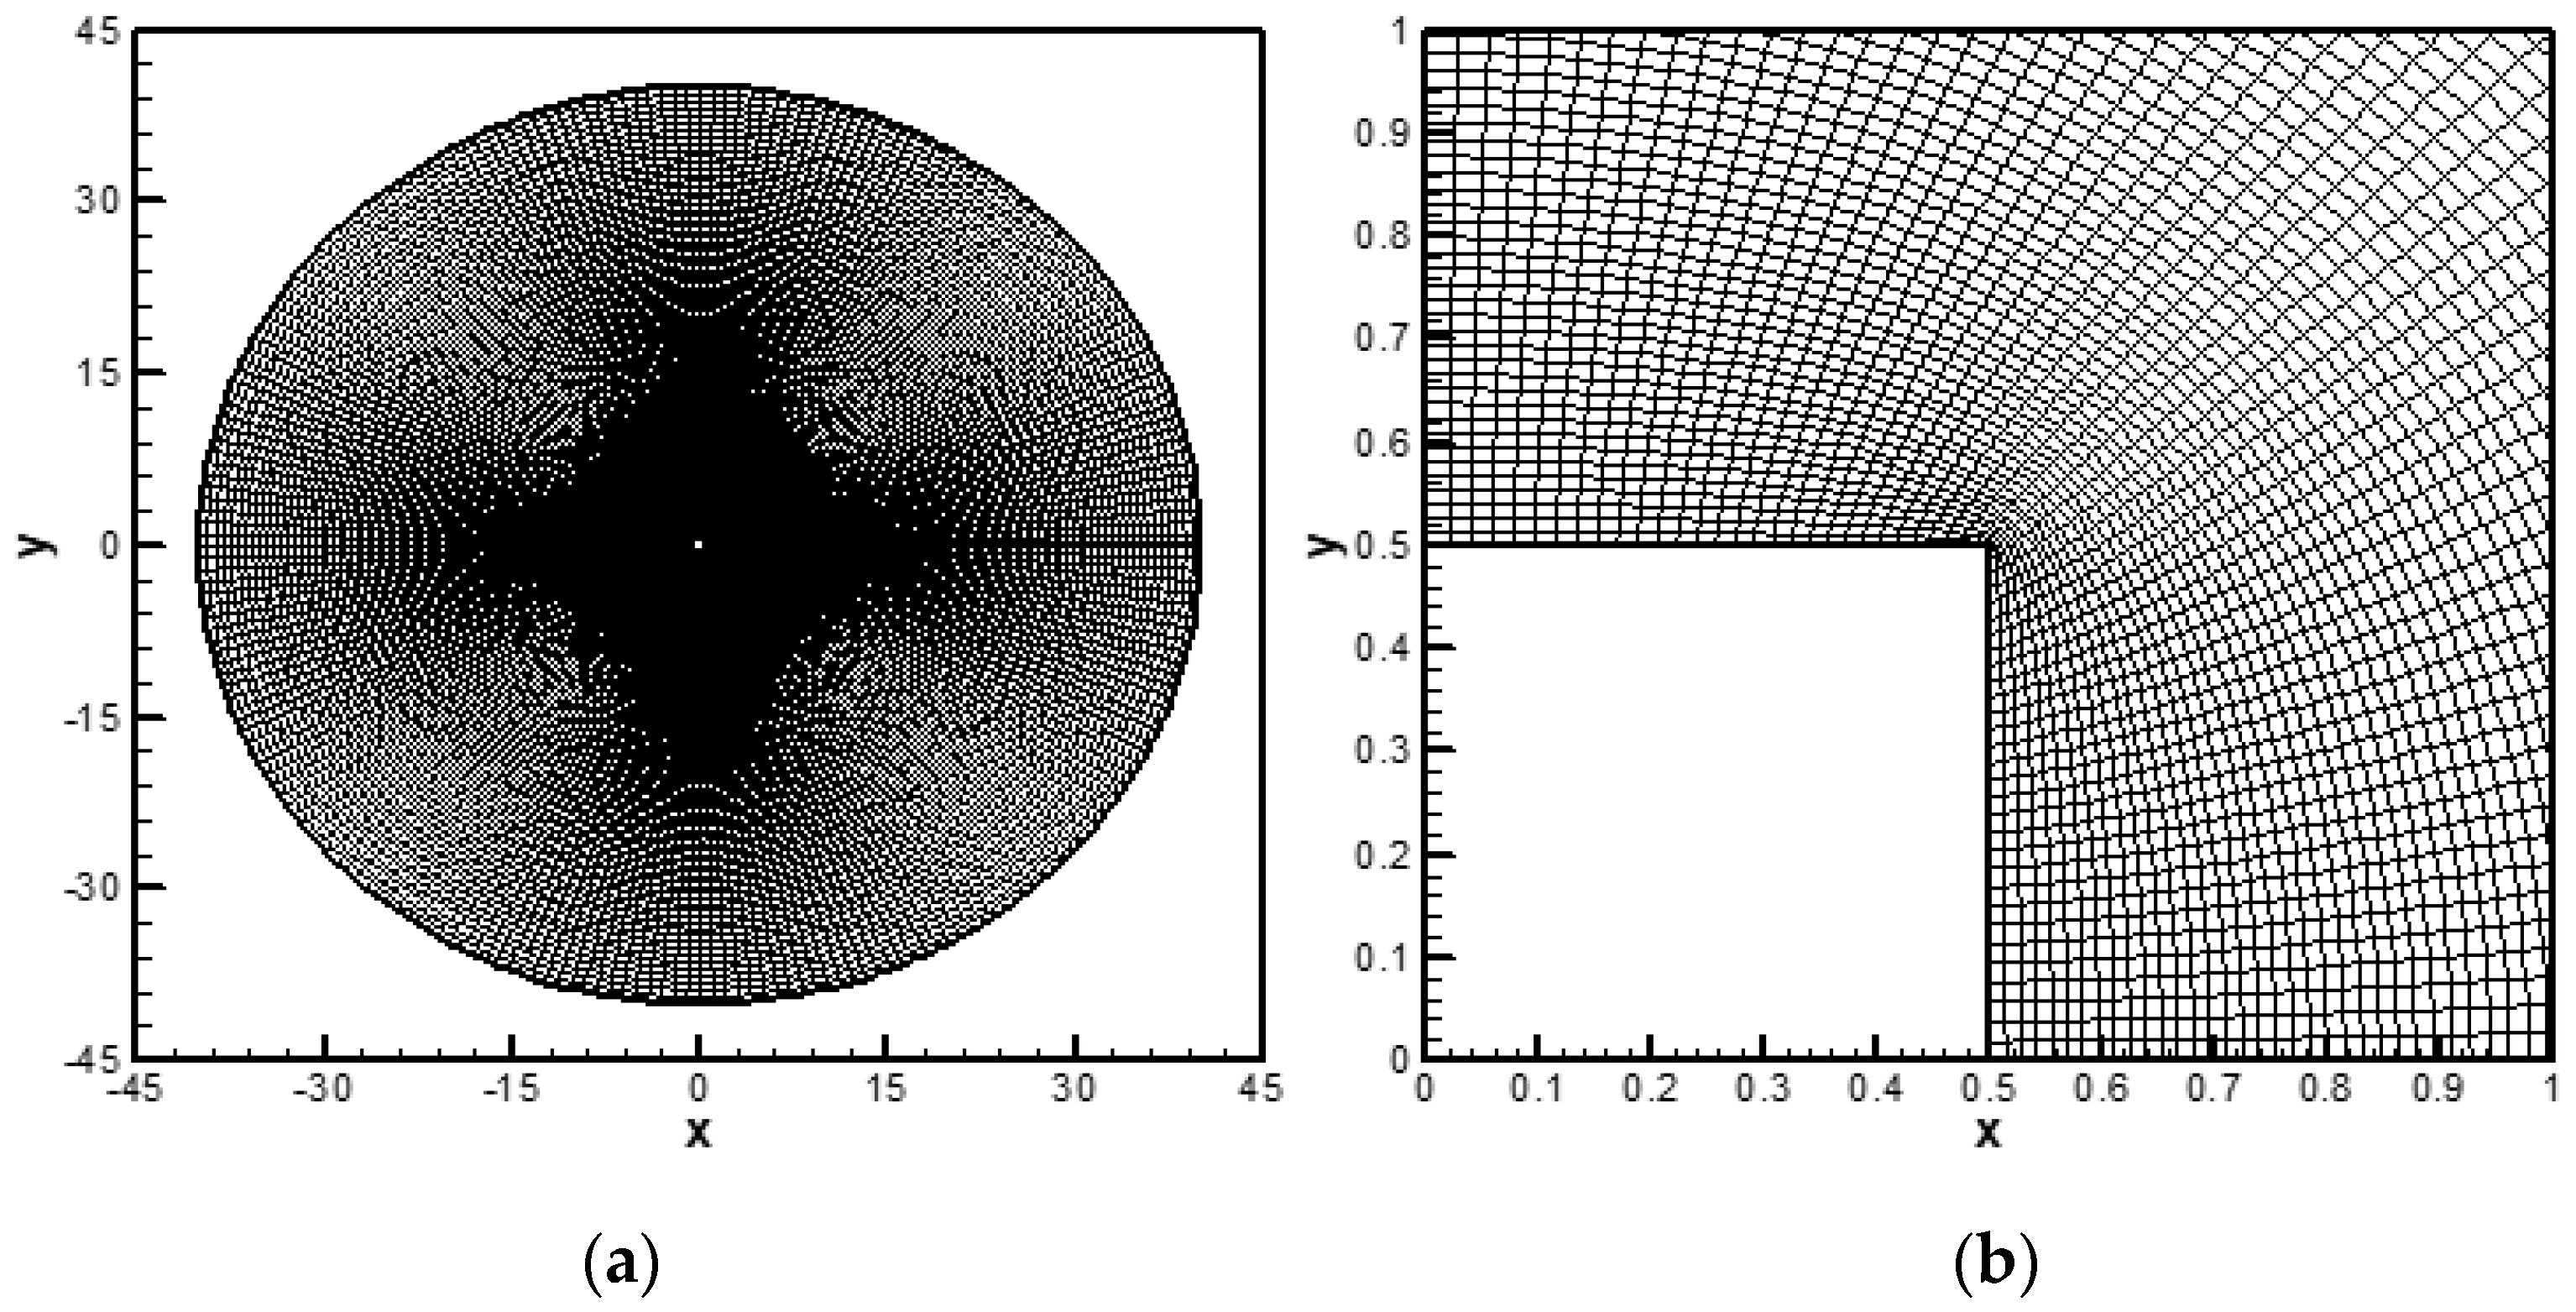
In this section, grid structure, numerical scheme, sensitivity to numerical parameters and validation studies are discussed in detail.

3.1. Grid Structure

The mesh considered is uniform in both ξ and η directions ( Δ ξ     Δ η ) in the mapped computational ξ-η plane. To fix the number of mesh points in ξ and η directions, the mesh spacing chosen are Δ ξ   and   Δ η respectively.
For the mapping of grid points in the physical plane, the body-fitted coordinates ξ ( x , y )   and   η ( x , y ) are chosen to satisfy the Laplacian equations in the physical domain ( P ˜ = Q ˜ = 0 ) given as,
2 ξ = 0 , 2 η = 0 .
Equation (13) can be inverted/mapped to the computational (ξ-η) domain as,
D 2 x ξ 2 2 E 2 x ξ η + F 2 x η 2 = 0 ,
D 2 y ξ 2 2 E 2 y ξ η + F 2 y η 2 = 0 .
D, E and F used in the above equations are given as follows,
D = ( x η ) 2 + ( y η ) 2 ,  
E = ( x ξ ) ( x η ) + ( y ξ ) ( y η )
F = ( x ξ ) 2 + ( y ξ ) 2
To obtain the grid in the physical plane, Equations (14) and (15) are discretized on the ( Δ ξ , Δ η ) uniform grid in the computational plane as depicted in Figure 2. The same number of grid points are placed first on the surface of the cylinder and then on the artificial boundary that matches with the number of mesh points along ξ direction in the computational plane. For the system of elliptic Equations (14) and (15), these known boundary points then serve as Dirichlet boundary conditions. A quasi-linear approach is required for the discrete solution of Equations (14) and (15), as the equations are non-linear for the unknown Cartesian grid point coordinates (x, y). In this approach, the coefficients D, E and F are discretized, employing the previous iterates, while the partial derivatives 2 x ξ 2 , 2 x ξ η , 2 x η 2 , 2 y ξ 2 , 2 y ξ η and 2 y η 2 are discretized employing the current/new iterates via second-order central finite difference schemes. The resulting linear algebraic system of equations is solved using the standard Gauss–Seidel (GS) procedure to obtain the new iterates from the known previous values. One Gauss–Seidel sweep is employed for both discretized Equations (14) and (15) per iteration.

3.2. Numerical Scheme

To capture the unsteady physics of the fluid flow, a viscous implicit pressure correction scheme is employed for advancing the discrete solution in time from a given set of initial conditions. The scheme is similar to that of a simplified marker and cell (SMAC) type of pressure correction scheme. The diffusion terms in the present study are treated in an implicit manner to eliminate the restrictions imposed on the time step due to viscous effects. The concept of momentum interpolation of Rhie and Chow [28] is utilized to avoid grid-scale pressure oscillations that can result in the decoupling of velocity and pressure at a grid point. Amsden and Harlow [29] developed the SMAC scheme originally and later developed by Cheng and Armfield [30]. The present work utilizes the SMAC type of pressure correction scheme, guided by the work of Kim and Benson [31] and Cheng and Armfield [30]. In the present study, the governing equations of mass, momentum and energy (1)–(4) are discretized on a colocated body-fitted grid by employing finite difference types of spatial discretization. Near solid and artificial boundaries, second-order central schemes are employed for both diffusion and convection terms. In the interior, a fourth-order central scheme is employed for diffusion terms, while for convection terms, a hybrid scheme of a fourth-order central and third-order upwind scheme (Kunio Kuwahara [32]) is employed. The scheme is described in detail in the works of Hasan and Sanghi [33] and Hasan et al. [34].
The boundary conditions at the solid surface of the cylinder and the inflow and outflow portions of the artificial boundary are given as follows,
Solid surface of the cylinder: No-slip and no-penetration boundary conditions for velocity components are employed. Equation (11) is utilized for the temperature at the surface of the cylinder. The normal momentum equation (pressure gradient in η direction) for pressure is applied at the cylinder surface given as,
p ¯ η = p ¯ x x η + p ¯ y y η ,
At the cylinder surface, the pressure gradients p ¯ x   and   p ¯ y are obtained through the x and y momentum equations, respectively.
Artificial boundary: In the present study, the artificial boundary is divided into two portions, namely an inflow portion and an outflow portion. The inflow and outflow portions of the artificial boundary are achieved by monitoring the direction of the local normal component of velocity. For an outer surface normal pointing toward the interior of flow domain U . n ^ > 0 indicates inflow while U . n ^ < 0 indicates outflow. At the inflow portion, for velocity and temperature, the undisturbed free-stream conditions given by Equation (12) are imposed. The normal momentum equation is employed to update the pressure. For velocities at the outflow portion, the numerical boundary conditions proposed by Hasan et al. [34] are employed.
For temperature, a second order derivative in η direction is employed given as,
2 θ η 2 = K 2 ,
where, K2 is the magnitude of the second order derivative at an interior point and utilizes the second order backward difference scheme. For pressure, the traction free boundary condition is utilized [30,35]. It is given as,
p ¯ = 1 Re U n n ,
where n is the local normal and U n is the local normal velocity.

3.3. Sensitivity to Numerical Parameters

It is important from the application point of view that the effect of flow past an object or body is measured in terms of some gross quantities, such as forces/moments that are exerted by the fluid on the object and the total rate of heat transfer between the body and the fluid. The problem considered in the present study is in a two-dimensional framework; these global parameters in a non-dimensional form are as follows,
  • Lift coefficient, CL = C y sin α C x cos α ,
  • Drag coefficient, CD = C x sin α + C y cos α ,
  • Moment coefficient C M = 2 M / ρ o U 2 d 2 ,
  • Nusselt number, Nu = Q / [ 4 k o ( T s T ) ] and
  • Strouhal number, St = f d / U .
where, Cx, Cy in the above equations are the force coefficients along x and y directions defined as,
C x = 2 F x ρ o U 2 d   and   C y = 2 F y ρ o U 2 d .
where, Fx and Fy are the forces along x and y directions per unit span of the cylinder (refer to Figure 1). The total moment exerted on the cylinder by the fluid per unit span is M. Q is the total heat transfer rate per unit span of the cylinder, and the thermal conductivity of the fluid at the reference temperature is ko. The frequency of vortex-shedding is represented as ‘f’.
The dimensionless form of force coefficients C x ,   C y   and   C M are given as follows,
C x = 2 0 1 J ¯   p ¯   η ¯ x d ξ + 2 Re 0 1 J ¯   Ω ¯   η ¯ y d ξ ,
C y = 2 0 1 J ¯   p ¯   η ¯ y d ξ 2 Re 0 1 J ¯   Ω ¯   η ¯ x d ξ ,
C M = 2 0 1 J ¯   p ¯ ( x ¯   η ¯ y y ¯   η ¯ x ) d ξ 2 Re 0 1 J ¯   Ω ¯ ( x ¯   η ¯ x + y ¯   η ¯ y ) d ξ .
The Nusselt number N u is defined as,
N u = 1 4 0 1 J ¯ θ η ( η ¯ x 2 + η ¯ y 2 ) d ξ .
Computations have been carried out to find out the appropriate location of artificial boundary, grid size and time step for the flow past a square cylinder at α = 0°, ϕ = 0°, Re = 100, Ri = 0 and Pr = 0.71. It is found from the numerical investigation that a dimensionless distance of 40, a grid size of 241 × 258 and a time step of 0.001 are appropriate for the entire computations (Hasan and Rashid [36]).

3.4. Validation Studies

The code used in the present study is validated in the previous studies of Rashid and Anshumaan [23] and Hasan and Rashid [36]. Validation studies were carried out for the conditions (ϕ = 0°, Re = 100, Pr = 0.71, 0° ≤ α ≤ 45°, 0 ≤ Ri ≤ 1.2) in the forced and mixed convective flow regimes. From numerical investigations, it was found that the present computations were in good agreement with the numerical data of Sohankar et al. [37], Ranjan et al. [38] and Sharma and Eswaran [2]. Rashid and Anshumaan [23] also conducted validation studies and found that the values obtained in their study for coefficient of lift (rms), mean (time mean) drag coefficient, mean (time mean) Nusselt number and Strouhal number were in good agreement with the previous reported numerical and experimental studies.
Table 1 reports the values of CL,r.m.s, time mean CD, time mean Nu and St for the conditions (Ri = 0, Re = 100, α = 0°, Pr = 0.71). It is observed from Table 1 that the present computed values are in good agreement with the previously reported values.

4. Results and Discussion

In this section, the effects of Reynolds number, Richardson number and free-stream orientations on streamline patterns, isotherm patterns, contours of vorticity, characteristics of Strouhal number, surface pressure, surface vorticity, surface Nusselt number and on global parameters (aerodynamic parameters and heat transfer characteristics) are discussed in detail.

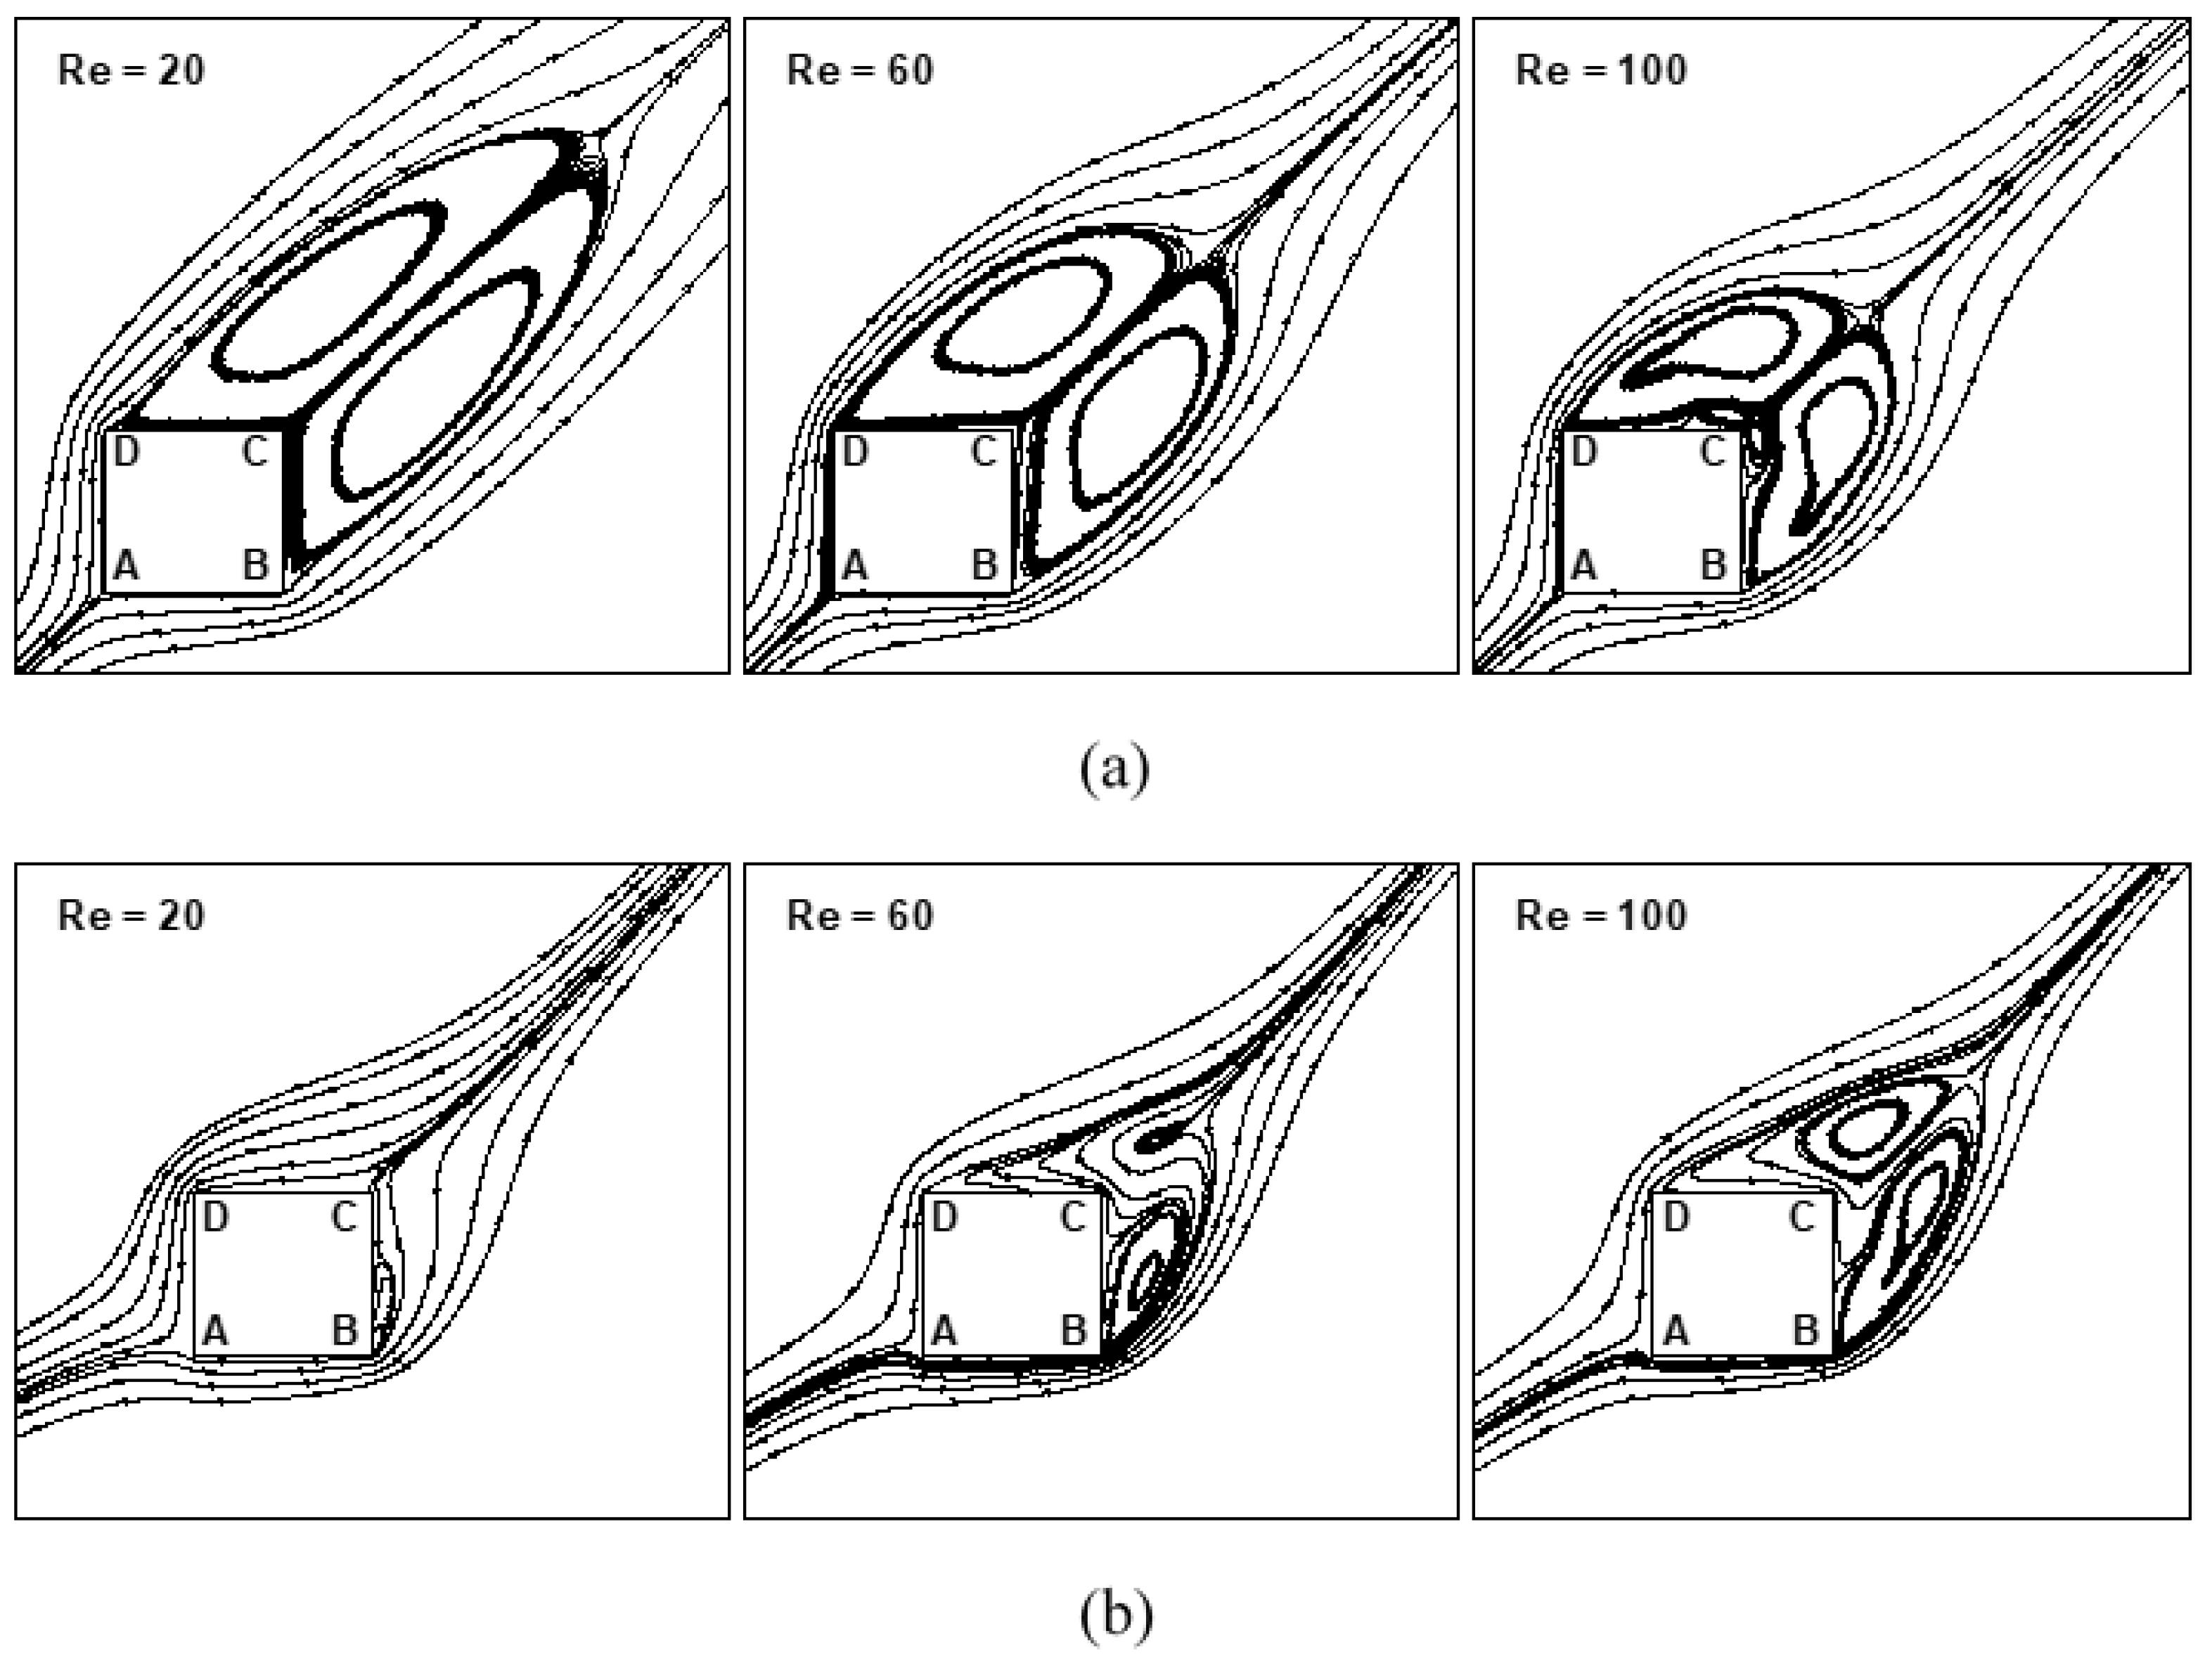
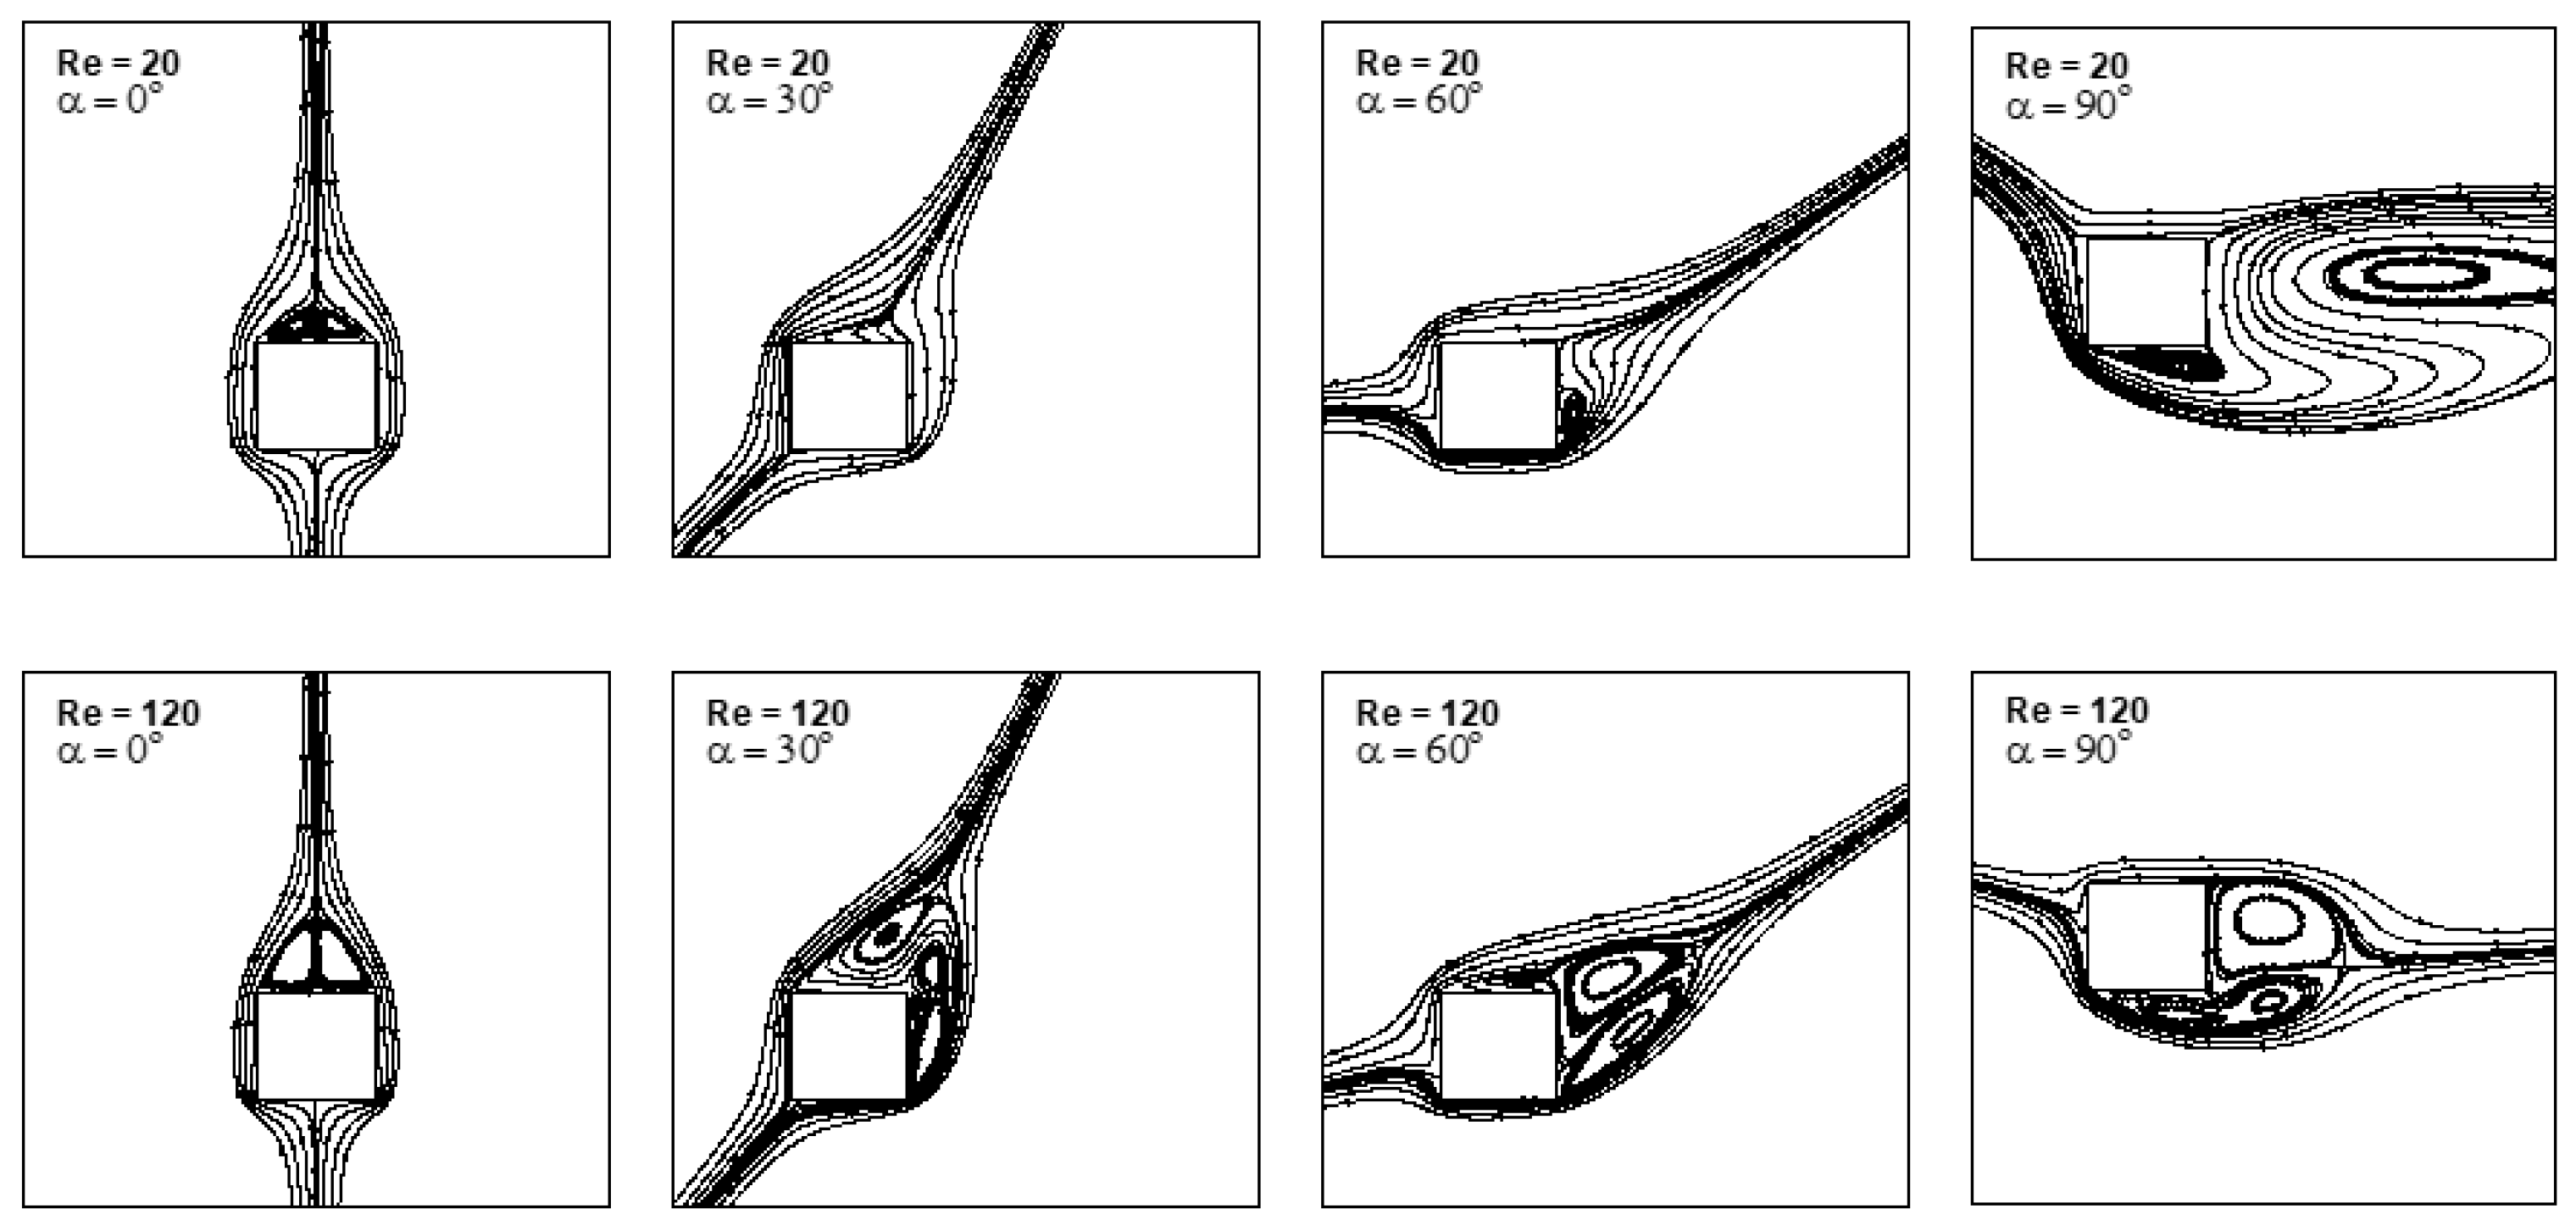
4.1. Streamline Patterns and Contours of Vorticity

To investigate the effects of Reynolds number on flow pattern, the development of wake during one complete vortex-shedding period or cycle in the forced convective flow regime (Ri = 0) for the range of Reynolds numbers 40 ≤ Re ≤ 120 at a fixed free-stream orientation α = 45° is considered. The dimensionless one vortex-shedding period for Reynolds numbers, Re = 40, 60, 80, 100 and 120 is 9.766, 8.362, 7.697, 7.237 and 7.017. Streamline patterns and contours of vorticity are shown in Figure 3 and Figure 4 for five successive moments of time that span the whole period.
The unsteady periodic flow due to the alternate vortex breaking off in the wake from the top and right faces of the cylinder is depicted in Figure 3. It is seen from Figure 3 that the larger vortex on the top face of the cylinder reduces in size as the Reynolds number is increased. The increase in Re weakens the growth rate of vortices by diffusion, while the instability leading to shedding grows at a faster rate as Re increases. The result is the shedding of smaller-sized vortices at a faster rate. The vortices are larger at a lower Reynolds number and smaller at a higher Reynolds number, as depicted in Figure 3 and Figure 4.
Figure 4 shows the contours of vorticity for one complete vortex-shedding period. The negative vortex shown by dotted lines is generated on the top face of the cylinder, grows in size, detaches from the top face and moves toward the downstream side of the cylinder at (1/4)T as depicted in Figure 4. In the same manner, the positive vortex (shown by firm lines) is generated, grows in size and detaches from the right face of cylinder at (3/4)T. The alternate shedding of vortices from the top and right faces of the cylinder on the downstream side forms a well-defined vortex-street known as the von Kármán vortex-street. The shed vortices at a higher Reynolds number are smaller in size.
Instantaneous patterns of streamline and contours of vorticity in the neighborhood of the square cylinder are shown in Figure 5 and Figure 6 in the forced convective flow regime for the conditions (40 ≤ Re ≤ 120, 30° ≤ α ≤ 60° and Ri = 0). The time instants are selected so as to capture the flow pattern in the same phase of the shedding cycle. Numerical simulations have been carried out in the forced convective flow regime to elucidate the role of free-stream orientation and Reynolds number on flow structures.
It is seen from Figure 5 that the large vortex attached to the top face of the square cylinder stretches toward the right face with an increase in free-stream orientation for the entire range of Reynolds number. Stretching of the attached vortex on the top face of the cylinder increases either with an increase in free-stream orientation and/or Reynolds number. An increase in Reynolds number increases fluid inertia, leading to speed-up of the shear layer, resulting in stretching of the attached vortex on the top face of the cylinder toward the right face. A further increase in Reynolds number moves the stretched vortex toward the right face of the cylinder, as can be seen from Figure 5. It is also seen from Figure 5 that the secondary vortex comes into existence as the Reynolds number increases for the entire free-stream orientation range. The size of the secondary vortex is found to be maximal at α = 45° for the selected range of Reynolds number. Figure 6 depicts the instantaneous contours of vorticity for various free-stream orientations and Reynolds numbers for forced flow. It is observed that the vortices attached to the top and right faces of the cylinder (shown by dotted and firm lines) are shed more frequently in the wake on the downstream side of the cylinder as the Reynolds number increases.
Figure 7 and Figure 8 depict the instantaneous streamline patterns and contours of vorticity in the mixed convective flow regime for the cross-flow (α = 90°) past a cylinder. The Reynolds and Richardson numbers are varied in the ranges 0.6 ≤ Ri ≤ 1.4 and 40 ≤ Re ≤ 120, respectively, to explain the role of fluid inertia and buoyancy forces together on flow structures. It is interesting to see that the von Kármán vortex-street in Figure 7 is altered significantly with an increase in the Richardson number for a lower Reynolds number. The wake shows a relatively lower sensitivity to the Richardson number for a higher Reynolds number. It is also interesting to see from Figure 7 that the flow is also influenced slightly on the upstream side with an increase in the Reynolds number for the selected range of the Richardson number. The stagnation point is shifted upward with an increase in the Richardson number for the entire range of the Reynolds number. Contours of vorticity in the mixed convective flow regime for α = 90° are shown in Figure 8. It is observed that the counter-rotating vortices, having negative and positive vorticity, are shed in the wake on the downstream side of the cylinder, either with an increase in the Richardson number or Reynolds number. The size of shed vortices decrease either with an increase in buoyancy forces and/or inertia forces. An increase in buoyancy promotes asymmetry and hence accelerates instability. An increase in Re has a similar effect on instability via an increase in nonlinear effects (inertia effects). As a consequence of the acceleration of instability, the vortices are shed at a faster rate and thereby do not get sufficient time to grow to larger proportions.
Streamline patterns and contours of vorticity in the mixed convective steady flow regime are depicted in Figure 9 and Figure 10 for 20 ≤ Re ≤ 120 and 1.2 ≤ Ri ≤ 1.6 at α = 30°. As the flow is steady, no vortex-shedding is observed for the selected range of parameters. It is interesting to see from Figure 9 that no separated zones on any faces of the cylinder are observed for Reynolds number Re = 20 for the selected range of the Richardson number. At Re = 40, a small separation bubble/zone is observed on the right face of the cylinder. A further increase in the Reynolds number introduces the secondary vortex on the top face of the cylinder for the selected range of the Richardson number. An increase in Reynolds number increases the fluid inertia effects over diffusive effects. It is interesting to see from Figure 9 that the attached vortices on the right and top faces of the cylinder become smaller in size with an increase in the Richardson number. An increase in the Richardson number leads to enhanced baroclinic effects that counter vorticity convection and diffusion in the wake from shear layers. This leads to a reduction in the size of the attached vortices in the steady flow regime.

4.2. Characteristics of the Strouhal Number

Shedding of vortices in the wake on the downstream side of the bluff body is characterized by a dimensionless number or dimensionless frequency known as the Strouhal number (St). It represents a fundamental property associated with periodic flows. The dimensionless frequency or Strouhal number in the present study is obtained from the time history of the lift coefficient, as the shedding frequency is correlated to oscillations in the lift. Variation of Strouhal number with free-stream orientation is shown in Figure 11a for the range of Reynolds number 40 ≤ Re ≤ 120 at Ri = 0.
The Strouhal number shows modest sensitivity to free-stream orientation for the entire range of Reynolds number in the forced flow regime. The magnitude of the Strouhal number for a fixed free-stream orientation increases with an increase in Reynolds number. This is due to the fact that an increase in Reynolds number increases the growth rate of instability and the intensity of circulation in the vortices via shear layer seed-up. Thus, they are shed at a faster rate at a higher Re. The magnitude of Strouhal number is found to be minimal at α = 45° for the range 60 ≤ Re ≤ 120. The percentage decrease in Strouhal number at a free-stream orientation α = 45° is found to be 0.99%, 2.84%, 3.84% and 4.15% for Reynolds number Re = 60, 80, 100 and 120, respectively, relative to the value obtained at a free-stream orientation α = 0°. For Reynolds number Re = 40, the change in Strouhal number with an increase in free-stream orientation in the range 30° ≤ α ≤ 60° is negligible at Ri = 0, as can be seen from Figure 11a. At Re = 20, the flow is always found to be steady for the entire range of free-stream orientation and Richardson number.
Variation of Strouhal number with Richardson number for various Reynolds number in the mixed convective flow regime is depicted in Figure 11b–f for the condition (40 ≤ Re ≤ 120, 0 ≤ Ri ≤ 1.6 and 30° ≤ α ≤ 90°). The values of St for a given Reynolds number are normalized by the corresponding forced flow value (Ri = 0) to highlight the effect of buoyancy. It is seen from the Figure 11 that the Strouhal number increases with an increase in the Richardson number and suddenly falls to zero when the Richardson number crosses the critical value; the trend remains the same for the entire Reynolds number range. The shear layer speeds up or gains momentum with an increase in the Richardson number, resulting in an increase in the circulation build-up rate of vortices. The vortices in this condition do not remain stable for longer time intervals and instead are shed (periodically) more frequently.
As expected, the Strouhal number sensitivity to the Richardson number reduces with an increase in free-stream orientation and is found to be the least at α = 90° for the entire range of Reynolds number, as can be seen from Figure 11. The percentage increase in Strouhal number for cross-flow is found to be 20.59%, 13.84%, 8.62% and 4.69% at Re = 60, 80, 100 and 120, respectively, for an increase in Ri from 0 to 1.6.
In the cross-flow, the speed-up effect of buoyancy on the flow reduces because of the greater misalignment between buoyancy force and fluid inertia in the flow. However, in the mixed flow, the sensitivity to Re is highest at α = 90°. It is seen from Figure 11b–e that for a fixed value of the Richardson number, the magnitude of the Strouhal number decreases with an increase in Reynolds number. At a free-stream orientation α = 90°, the flow is always found to be an unsteady periodic flow. Variation of Strouhal number with Richardson number is depicted in Figure 11f for Re = 40 at α = 90°. The flow is found to be steady for small values of the Richardson number (Ri ˂ 0.6), the onset of vortex-shedding is found to occur at a higher Richardson number (Ri ≥ 0.6). The increase in Ri beyond 0.6 at (Re = 40, α = 90°) causes only a very slight increase in St (20%).

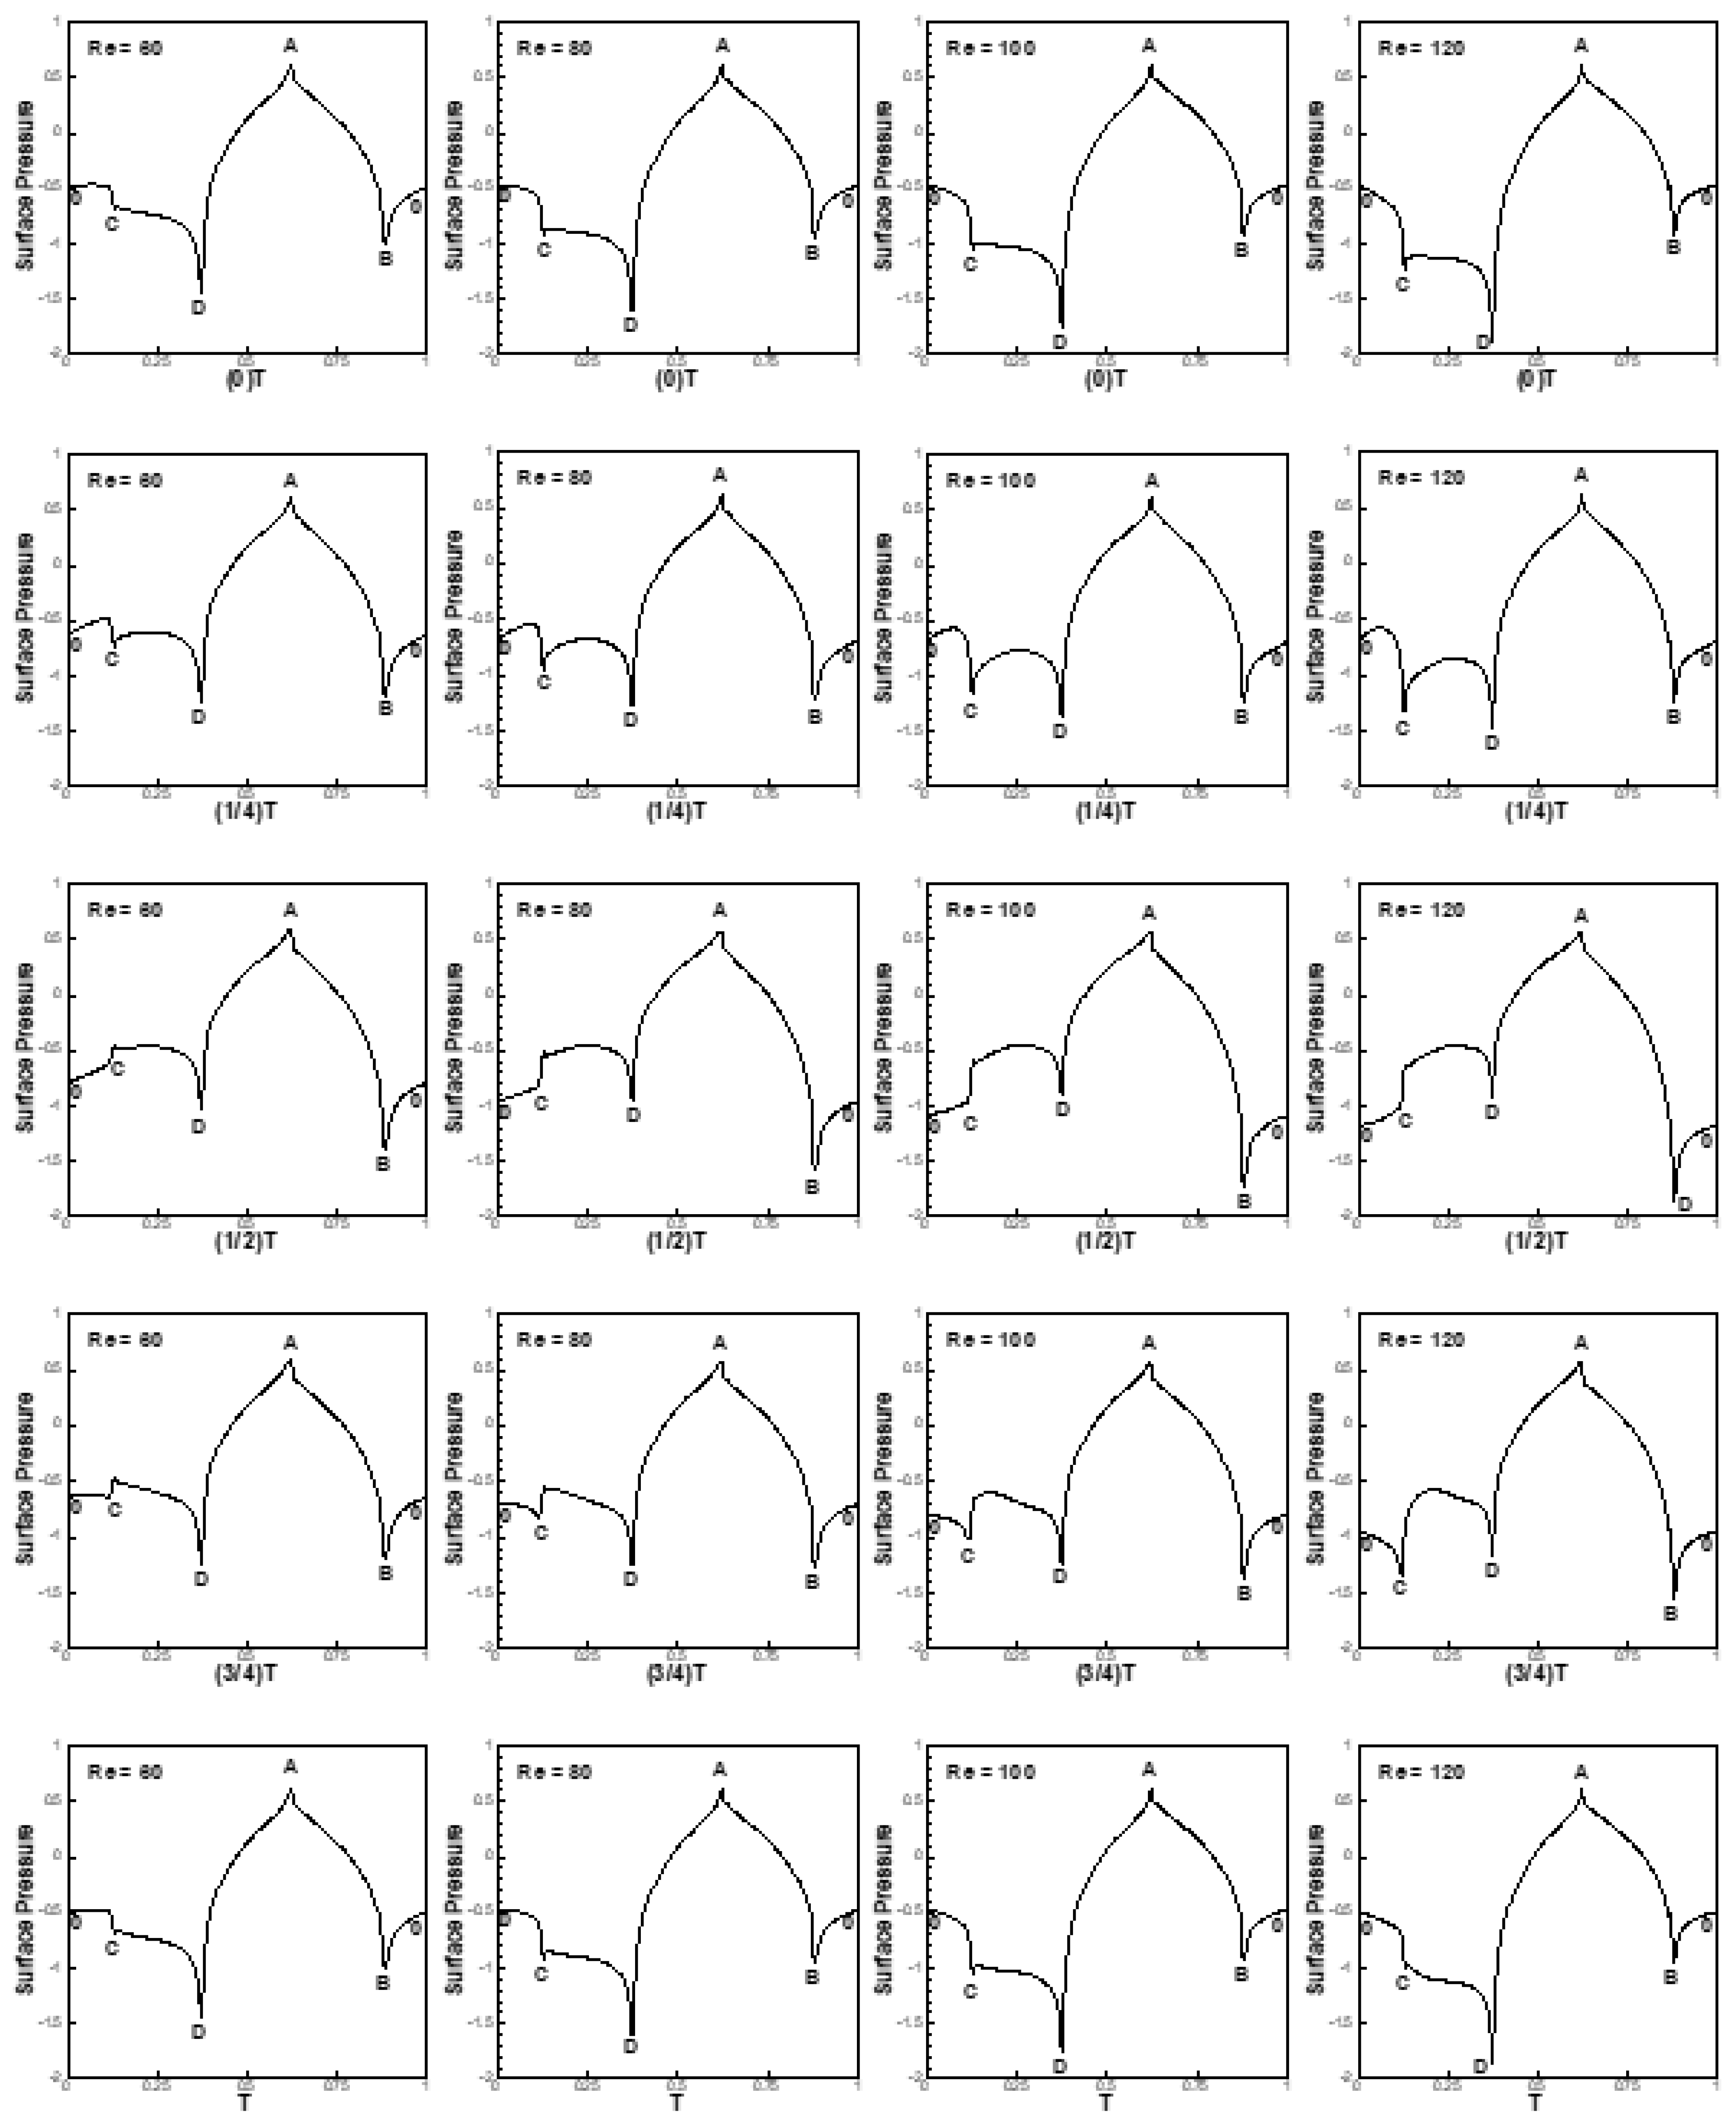
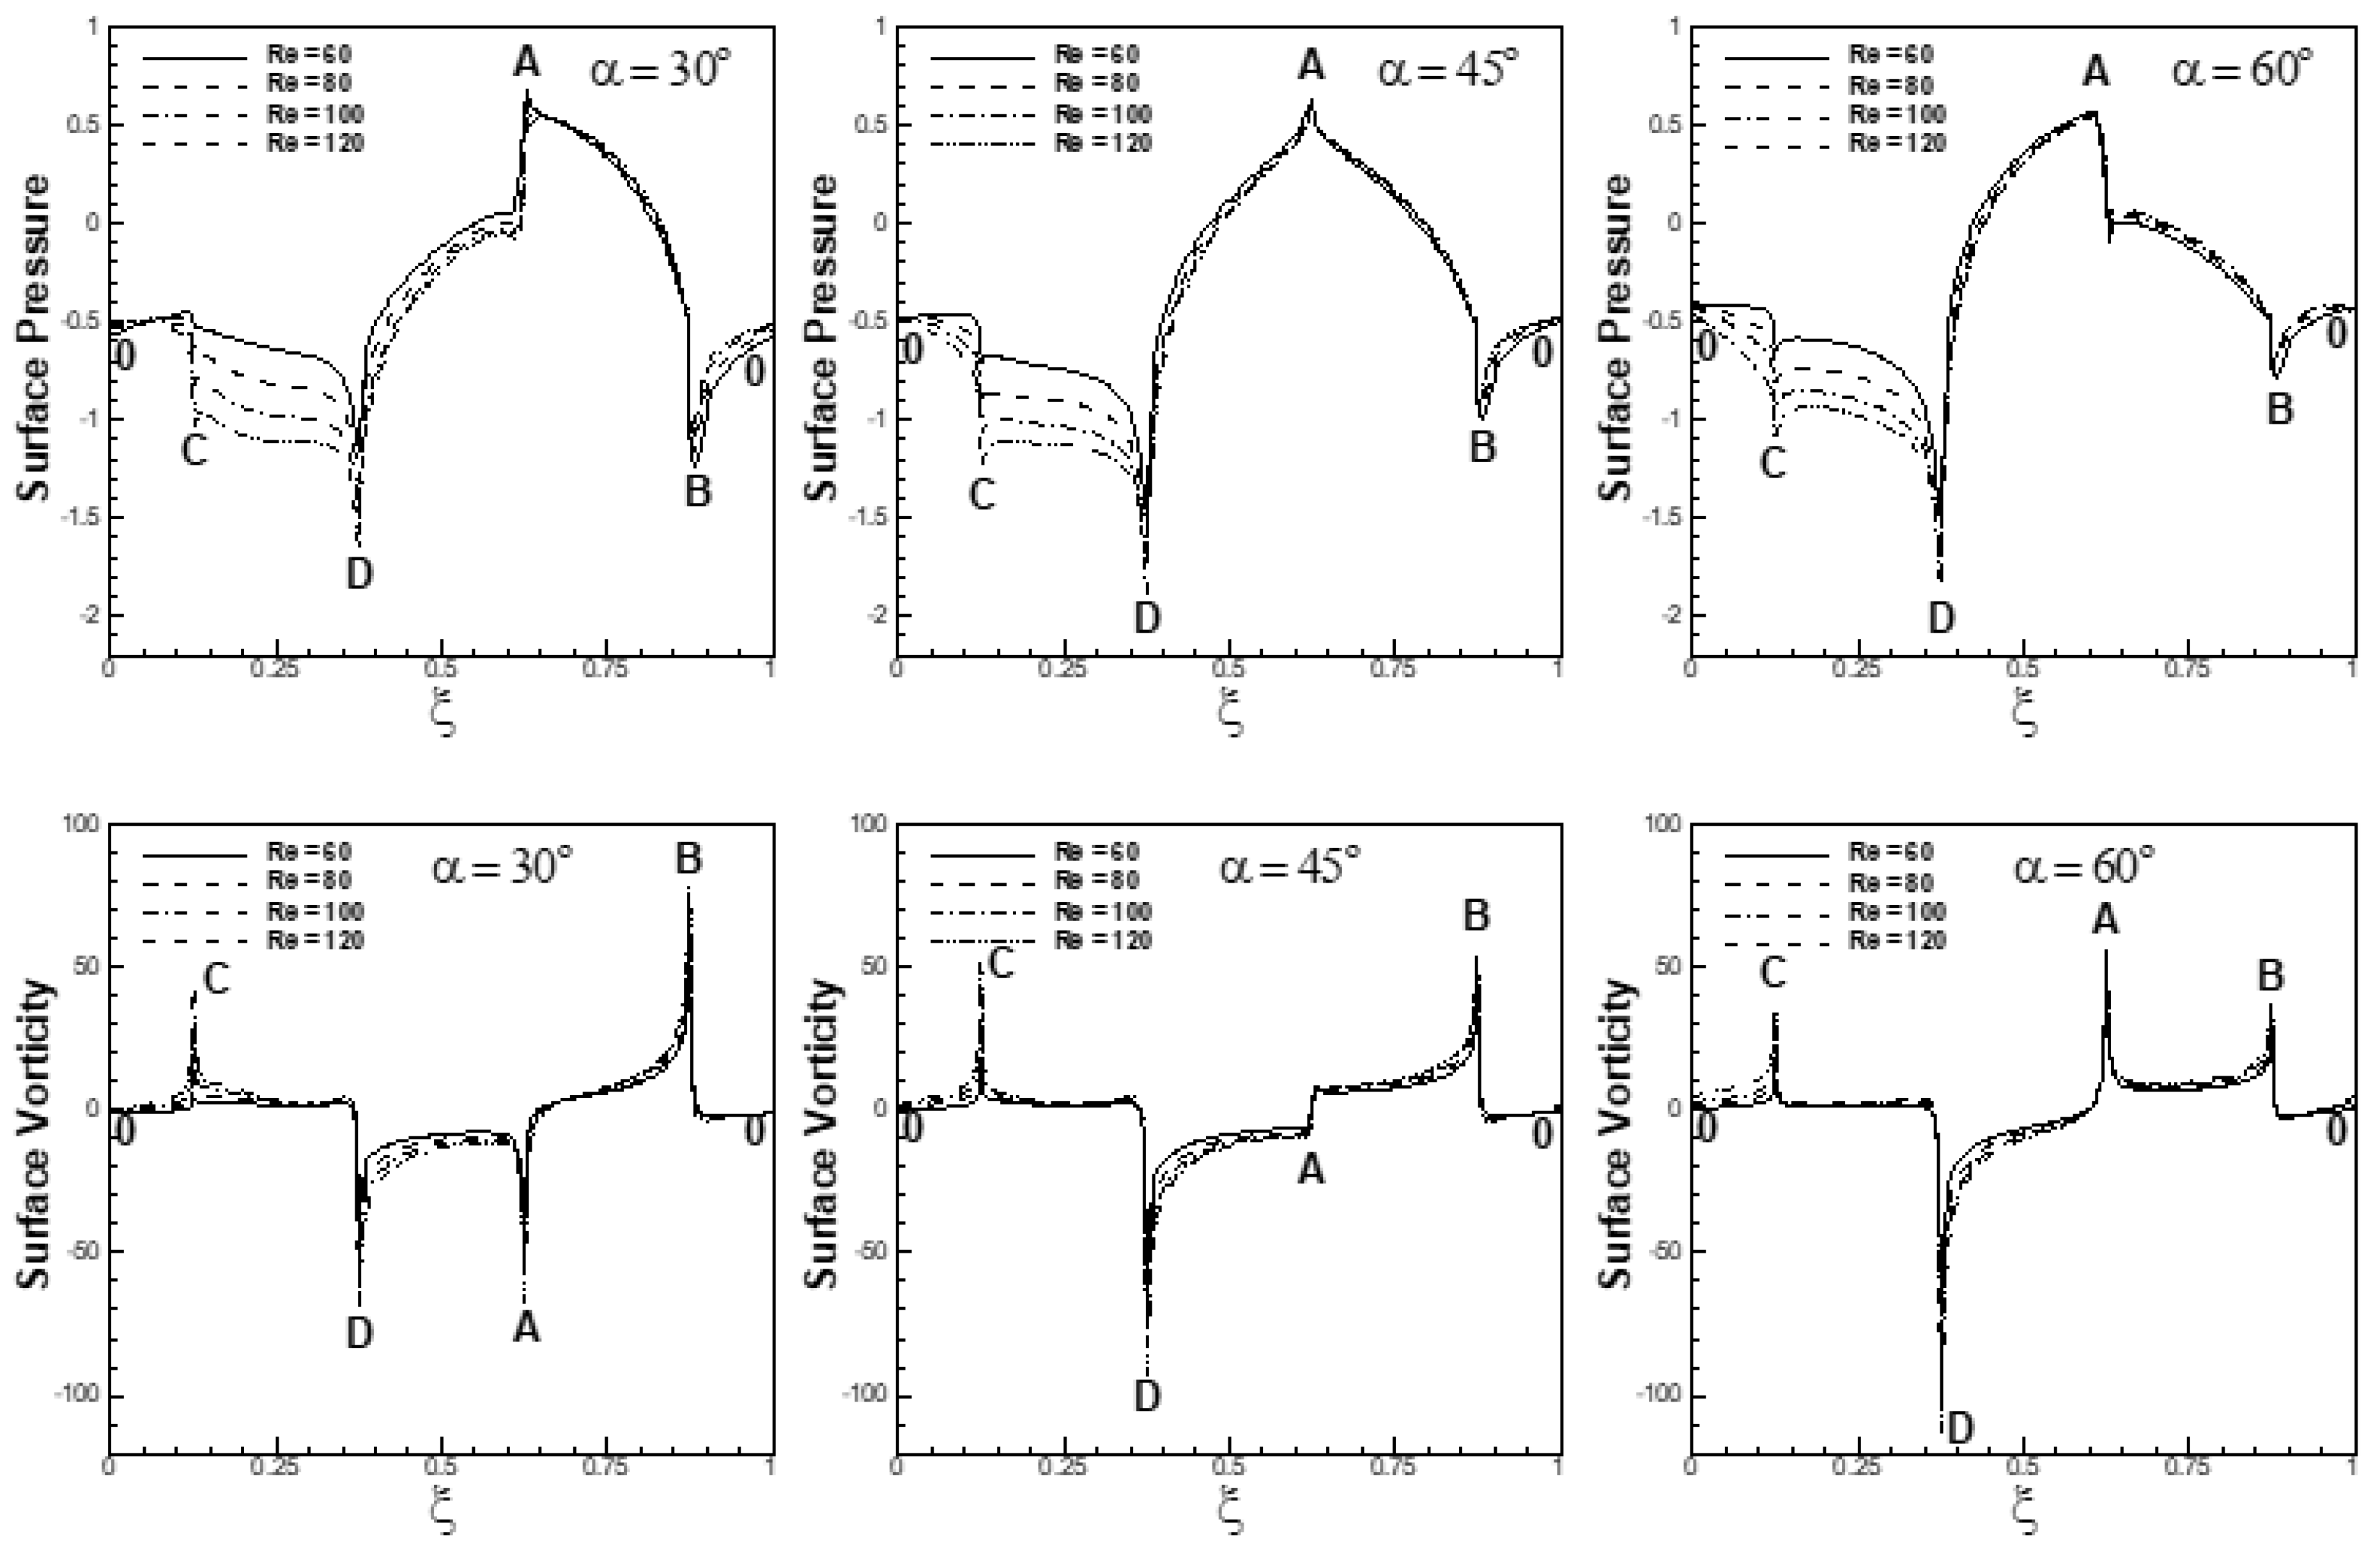
4.3. Mean Surface Pressure and Surface Vorticity

Figure 12 depicts the variation of mean pressure along the surface of the cylinder (ξ) for 20 ≤ Re ≤ 120 and 0° ≤ α ≤ 70° at Ri = 0, 0.8 and 1.6, respectively. The mean surface pressure is found to be maximal for the face(s) that faces the free-stream for the entire range of selected parameters. It is interesting to see from Figure 12 that the surface pressure in the forced convective flow regime decreases with an increase in Reynolds number for the entire free-stream orientation range. It is seen from the Figure 12 for Ri = 0 at α = 45° that the mean pressure on faces AB and AD decreases with an increase in Reynolds number. An increase in Reynolds number increases inertia effects relative to viscous diffusion, resulting in an enhanced reduction in mean pressure on the faces AB and AD of the cylinder. Additionally, the mean pressure on the faces BC and DC decreases with an increase in Reynolds number. The effects of Reynolds number on mean pressure for the faces BC and DC are explained via the mean streamline patterns shown in Figure 13a for Ri = 0 and α = 45°. It is depicted in Figure 13 that the attached vortices behind the cylinder are reduced in size with an increase in Re. The point of minimum pressure (i.e., the pressure at the center of the vortex) shifts near the faces (BC and DC) of the cylinder and influences the mean pressure on the faces BC and DC. The pressure at the vertices B and D of the cylinder decreases with an increase in Reynolds number due to enhanced bending of streamlines at higher Reynolds number at vertices B and D, as depicted in Figure 13a. Additionally, the pressure along the faces BC and DC is nearly constant for the entire range of Reynolds number. The outcome is the reduction in mean pressure on the faces BC and DC of the cylinder with an increase in Reynolds number.
Similarly, for free-stream orientations α = 0°, 30° and 70°, mean surface pressure or the pressure at the vertices of the cylinder altered significantly with an increase in Reynolds number. The surface pressure is affected significantly by the buoyancy forces for α = 0°, as can be seen from Figure 12. The effect of buoyancy is reduced with an increase in the orientation of the free-stream and is found to be minimal when the free-stream approaches a cross-flow (α = 90°) situation. For Ri = 1.6 and α = 45°, it is observed that the mean pressure on the front face AD decreases with an increase in Reynolds number. An increase in Reynolds number increases fluid inertia relative to viscous diffusion. This results in sharper turns of flow by buoyancy effects near the cylinder, resulting in a reduction in mean pressure on the face AD. It is also depicted in figure that the mean pressure on the face AB increases with an increase in Reynolds number. Mean pressure on the faces BC and DC increases with an increase in Reynolds number. The reason for this is the formation of larger vortices behind the cylinder at a higher Reynolds number, as depicted in Figure 13b, which affects the pressure recovery along faces BC and DC of the cylinder at different Re.
The point of minimum pressure is shifted far from the faces BC and DC with an increase in Reynolds number, which influences the mean pressure on the faces BC and DC. The pressure along the faces BC and DC is nearly constant for the entire range of Reynolds number. The shifting of the center of minimum pressure from the faces BC and DC and the pressure recovery along the faces resulted in an increase in the pressure on the faces BC and DC with an increase in Reynolds number. Additionally, the pressure on the vertices B and D of the cylinder increases with an increase in Reynolds number due to the fact that the bending of streamlines is lesser at a higher Reynolds number, as can be seen from Figure 13b. In the same manner, mean surface pressure and pressure at the vortices are affected significantly with the variation in Reynolds number for α = 0°, 30° and 70°.
Variation of mean surface vorticity along the surface of cylinder is depicted in Figure 14 for the conditions (20 ≤ Re ≤ 120, 0 ≤ Ri ≤ 1.6 and 0° ≤ α ≤ 70°). The mean surface velocity changes its sense across the stagnation point, resulting in a change in the sign of the surface vorticity across the stagnation point. The separation point, as depicted in Figure 14, is found on face AB of the cylinder for α = 0°; for α = 30°, the stagnation point is shifted toward vertex A, and for α = 45° and 70°, it lies on face AD of the cylinder. It is depicted in Figure 14 that the mean surface vorticity increases with an increase in Reynolds number. An increase in Reynolds number increases the fluid inertia relative to viscous diffusion, leading to thinner viscous layers near attached flow faces, leading to an increase in the mean surface vorticity. The rapid acceleration of fluid particles across the corners with an increase in Reynolds number causes large vorticity at the corners of the cylinder. Magnitude of vorticity is always found maximum for the face having the stagnation point and at the vertices of the cylinder adjacent to the stagnation point.

4.4. Global Parameters

Numerical experiments are conducted in the forced and mixed convective flow regime to investigate the role of Reynolds number on global parameters (i.e., on aerodynamic parameters and on heat transfer characteristics) for the conditions (20 ≤ Re ≤ 120, 0 ≤ Ri ≤ 1.6 and 0° ≤ α ≤ 90°).

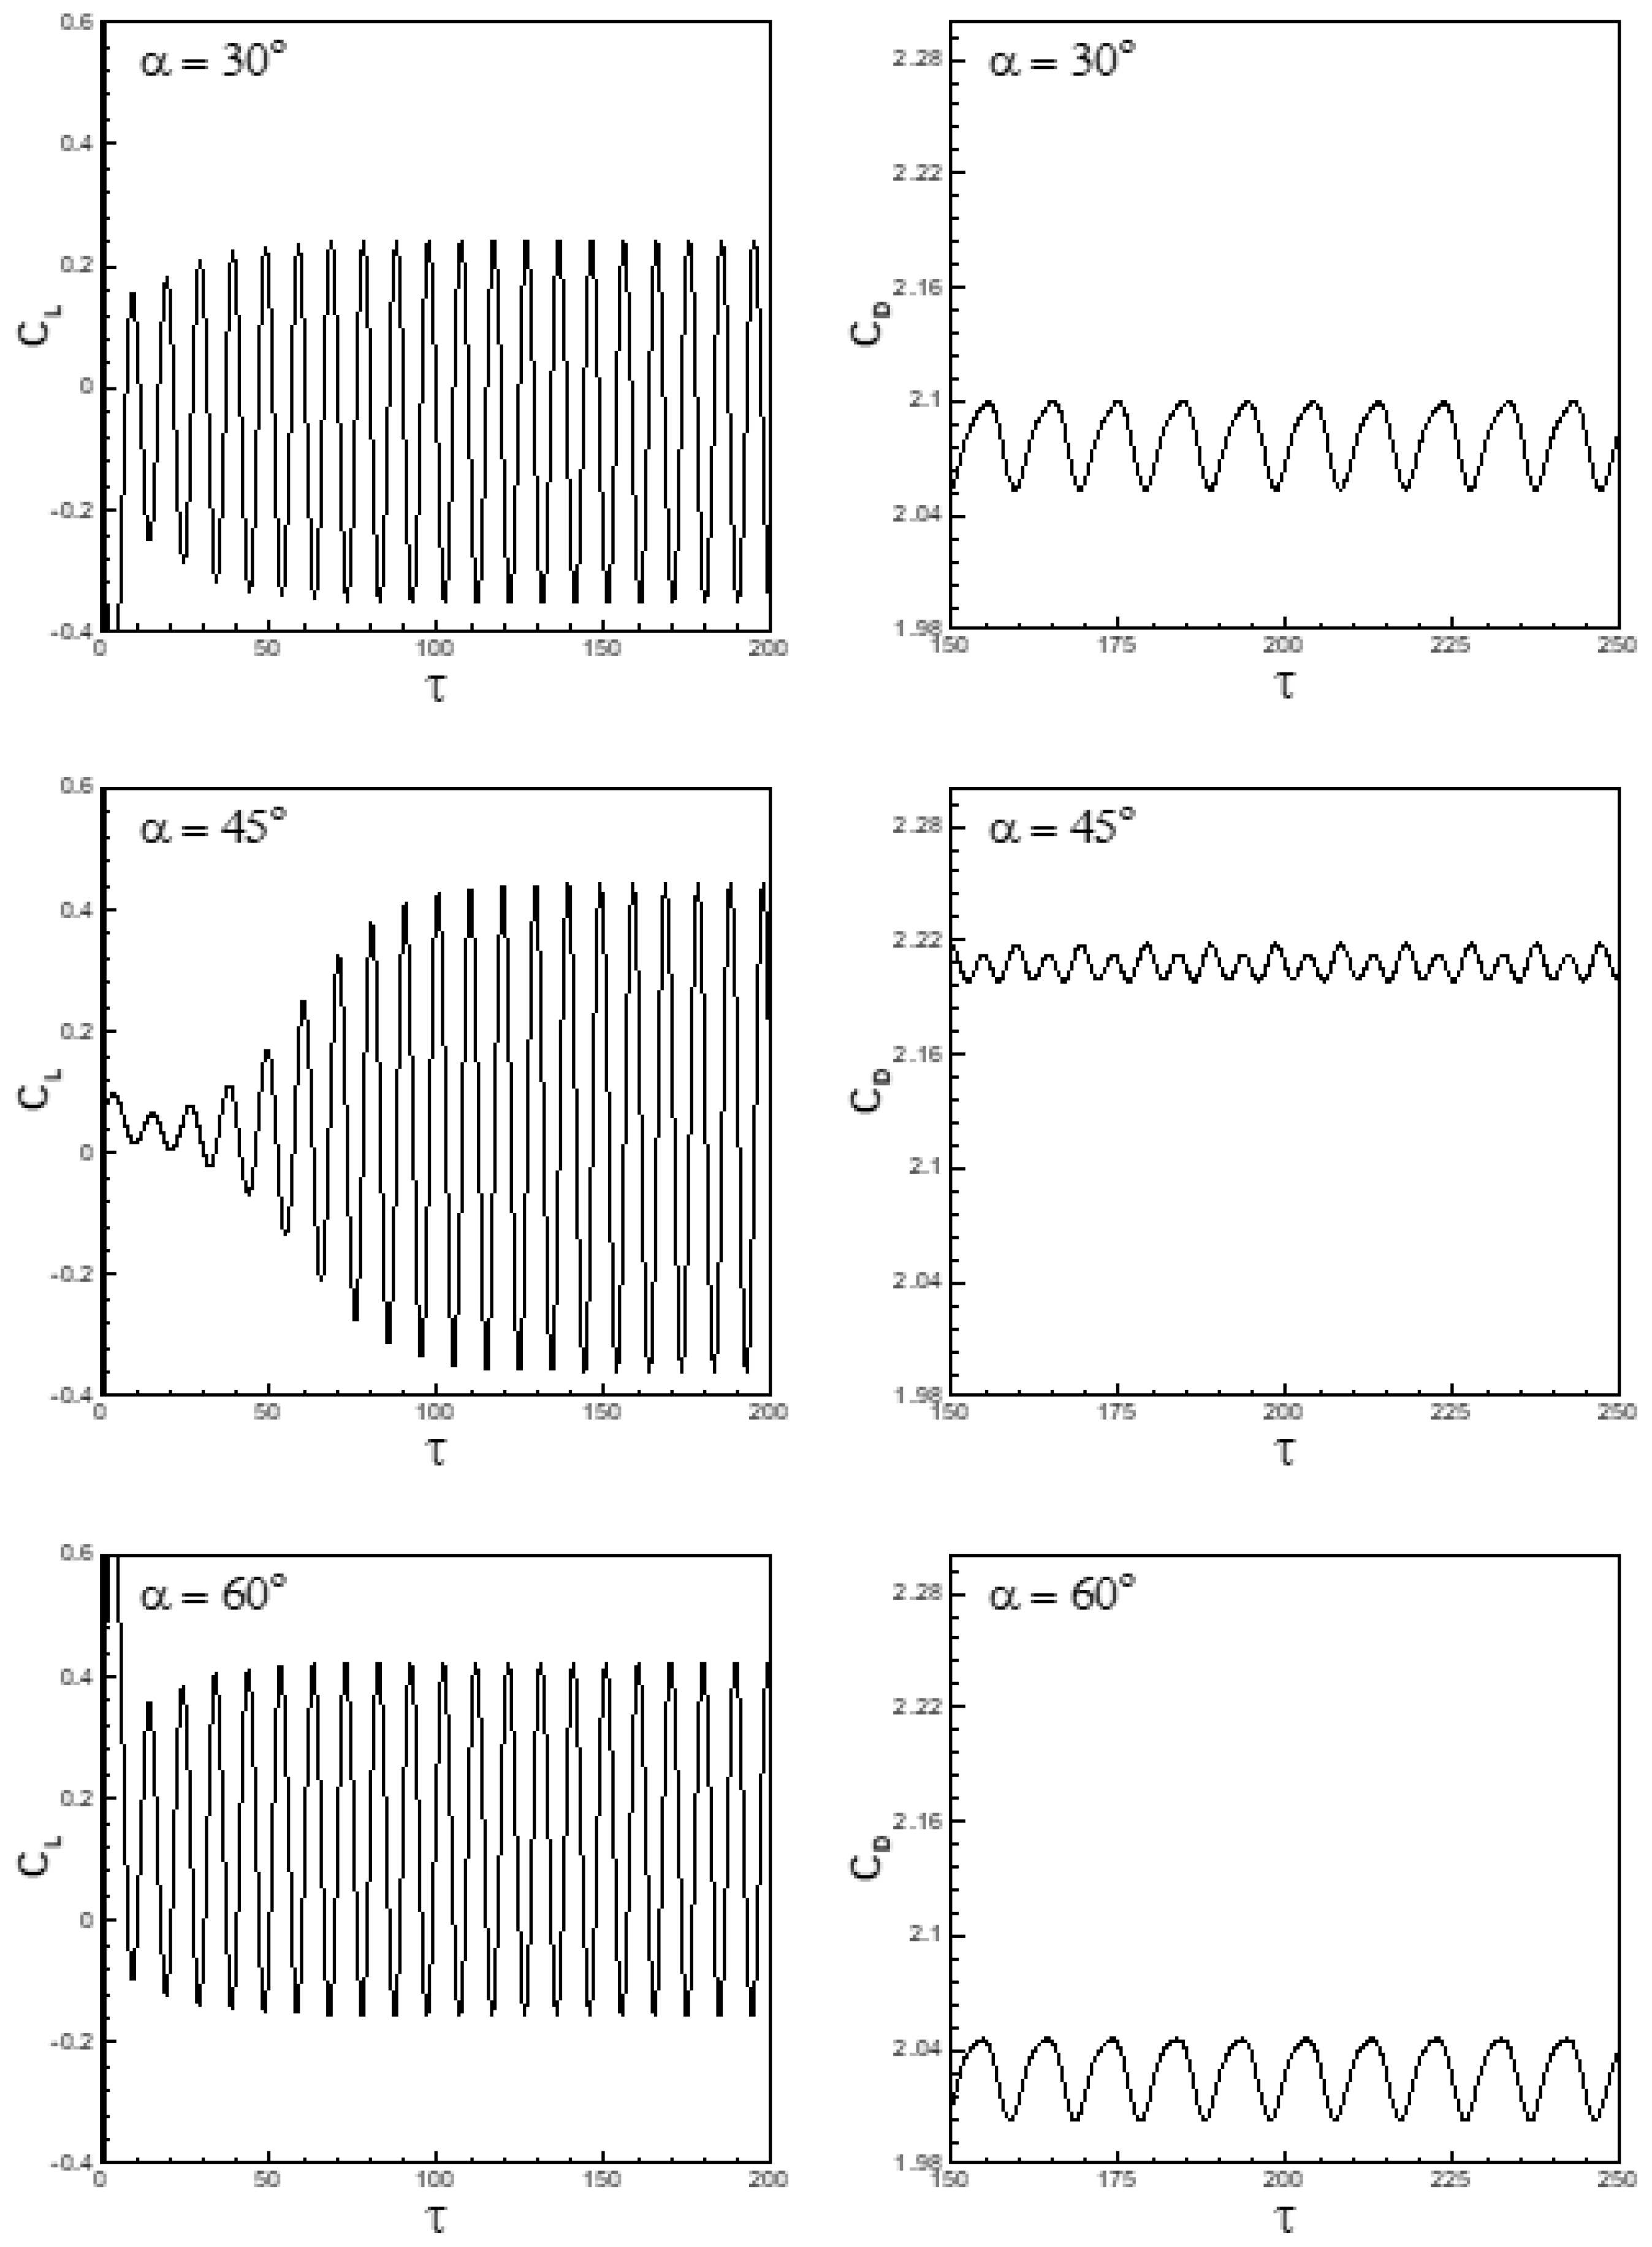
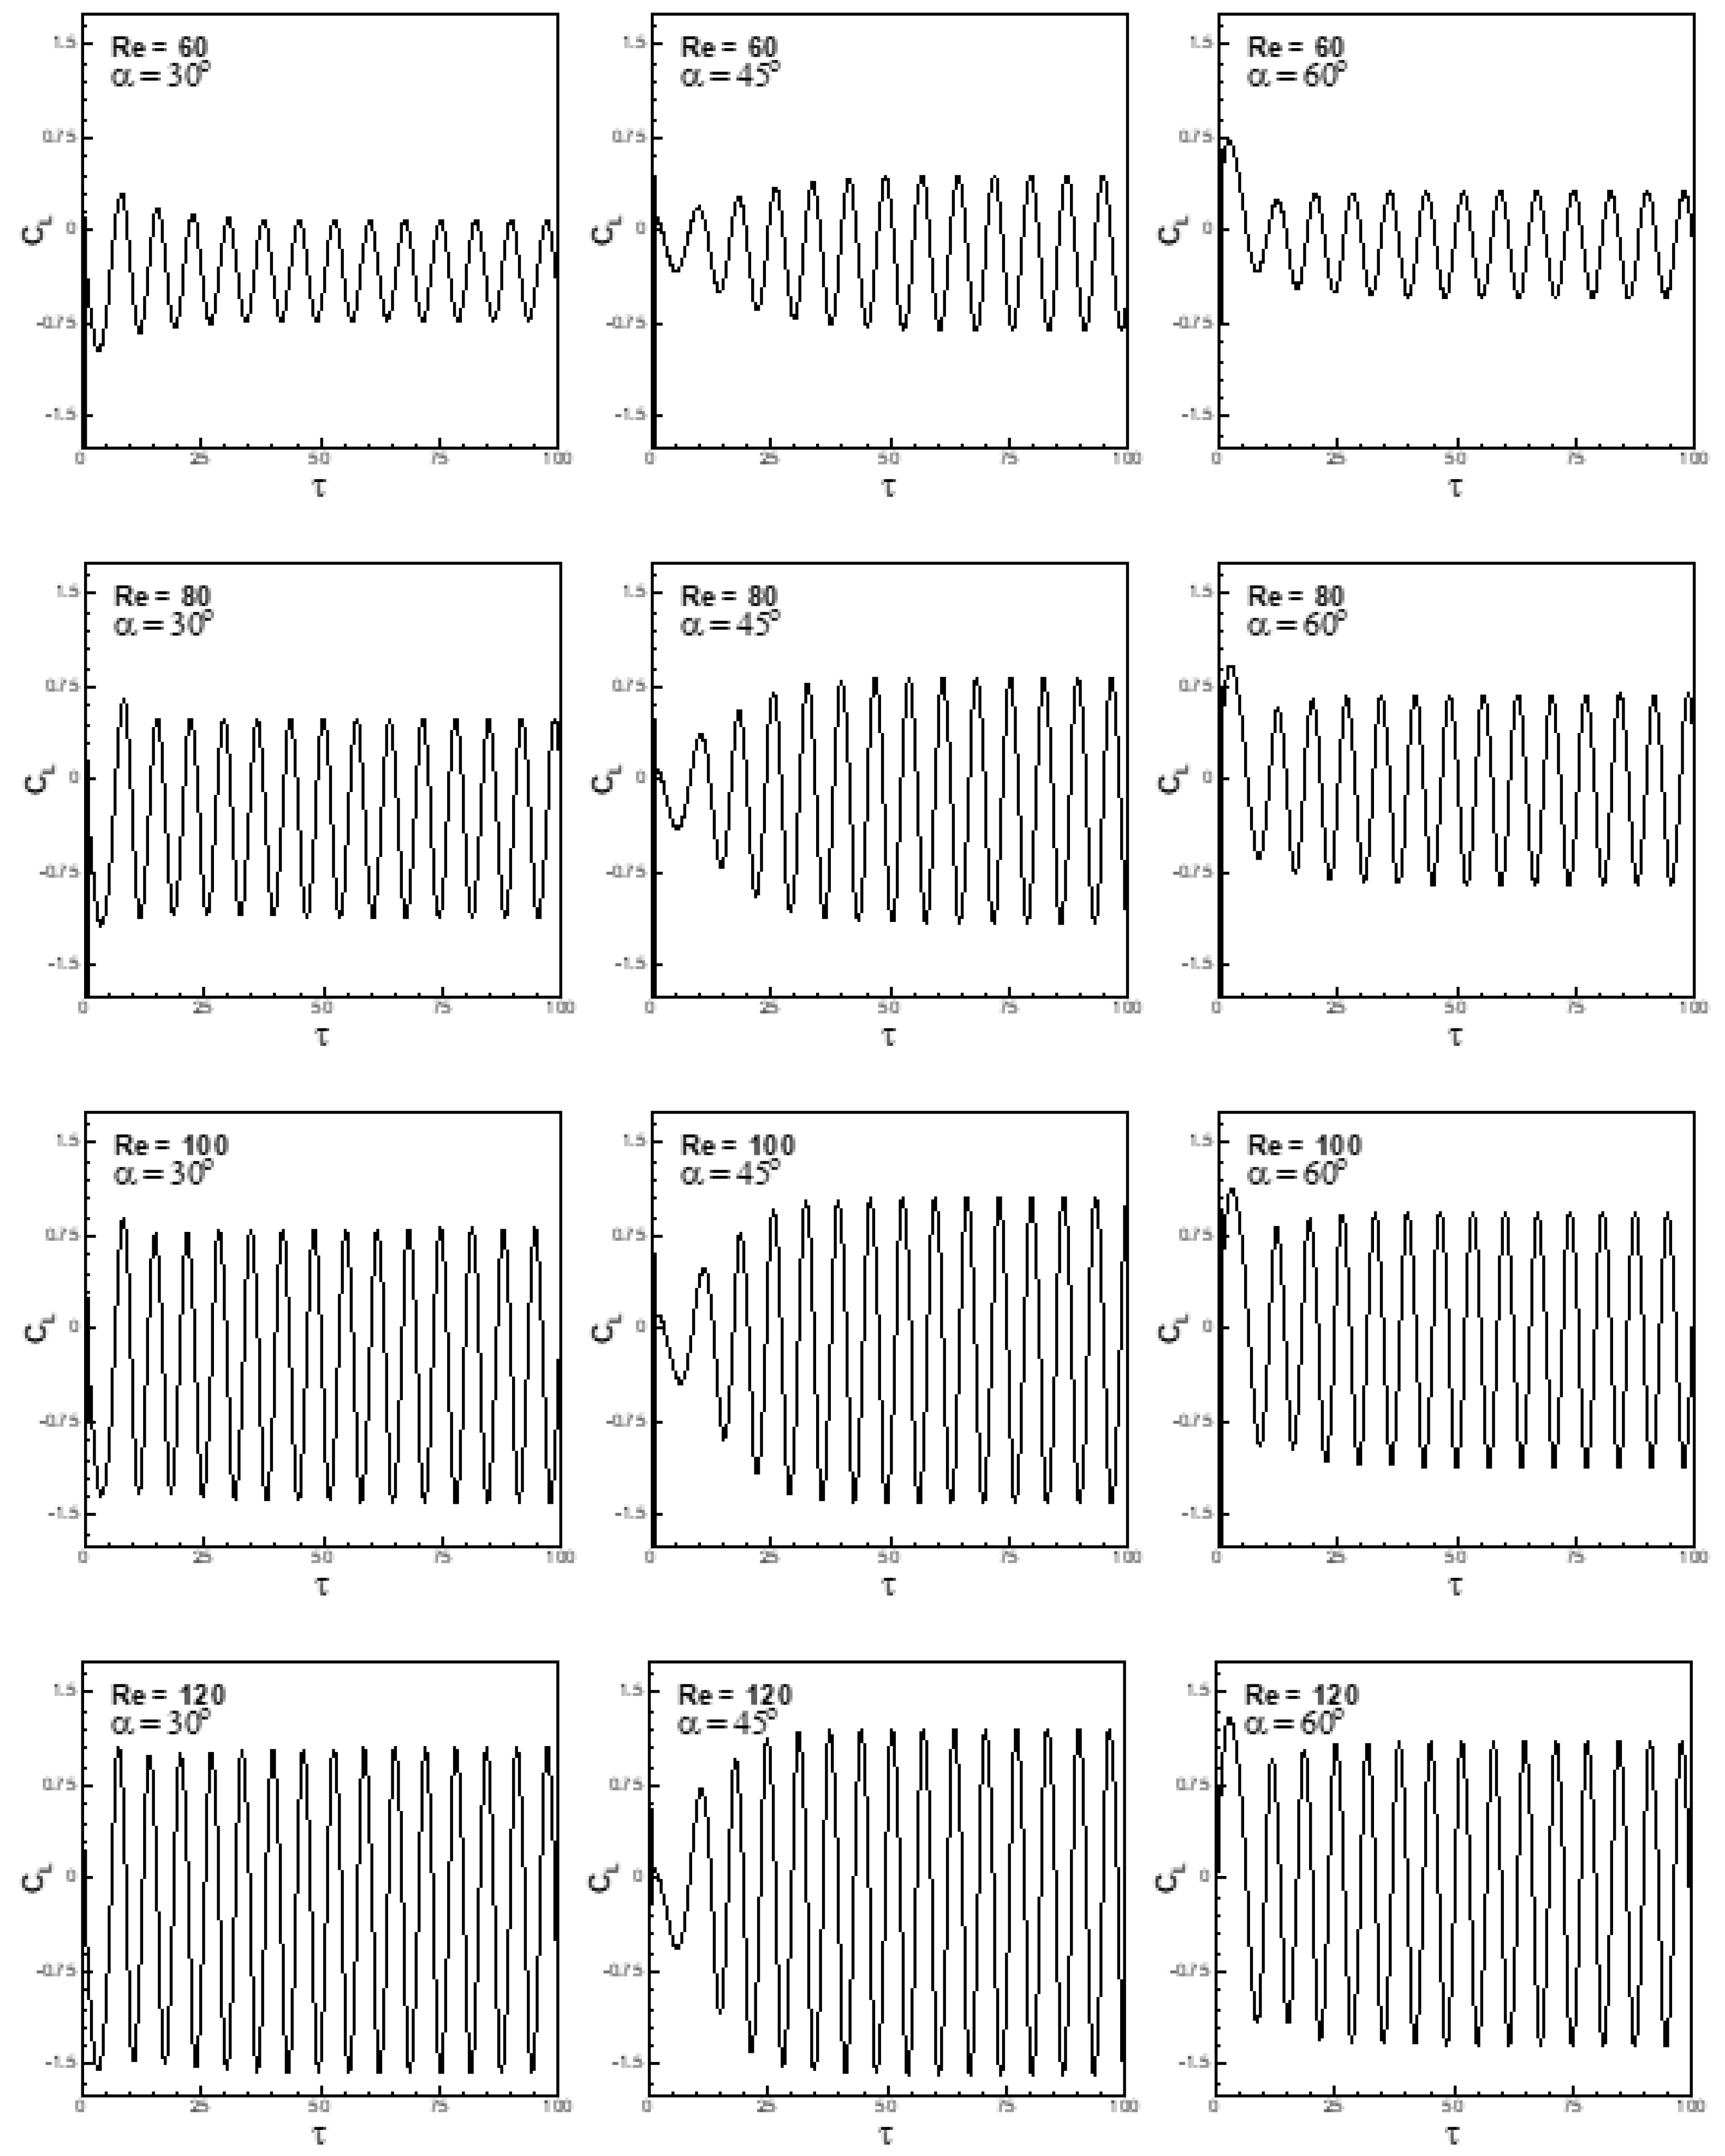
4.4.1. Aerodynamic Parameters

The time histories of the lift and drag coefficients in the forced flow regime are depicted in Figure 15 for Re = 40 and free-stream orientation 30° ≤ α ≤ 60°. The flow for the selected range of parameters is found to be an unsteady periodic flow with shedding of vortices in the wake on the downstream side of the cylinder. The flow after an initial transition attains an unsteady periodic flow; the transition period is large for α = 45° as compared to free-stream orientations 30° and 60°, respectively, as can be seen from Figure 15. It is also seen from Figure 15 that the amplitudes of the lift coefficient for α = 45° are greater than those for either α = 30° or 60°. The reason for large amplitudes of lift coefficient at α = 45° is the shedding of large-size vortices from either side of the cylinder, as depicted in Figure 5. The highest (peak) and lowest (trough) values of the amplitude of the lift coefficient are associated with the shedding of vortices with a positive and negative sense of vorticity. The amplitudes of the drag coefficient shown in Figure 15 are found to be smaller for a free-stream orientation of 45° in comparison with α = 30° and 60°, respectively. It is observed from Figure 15 that the mean (time mean) drag coefficient for Re = 40 and Ri = 0 is larger at α = 45° than at α = 30° and 60°, respectively.
Variations in lift and drag coefficients with non-dimensional time are shown in Figure 16 and Figure 17 for the conditions (60 ≤ Re ≤ 120 and 30° ≤ α ≤ 60°) at a fixed Richardson number Ri = 0.2 to highlight the effects of free-stream orientation and Reynolds number on aerodynamic parameters. It is depicted in Figure 16 and Figure 17 that the flow is found to be an unsteady periodic flow with an initial transition. The initial transition period is found to be more at a free stream orientation α = 45° in comparison with free-stream orientations 30° and 60°, respectively, for the selected range of Reynolds number. The growth rate of instability is lower at α = 45° than for α = 30° or α = 60° owing to the symmetry of the flow configuration on either side of the free-stream orientation. It is seen from Figure 16 that the amplitudes of the lift coefficient are larger at α = 45° than at α = 30° and 60° for the entire range of Reynolds number. It is also seen from Figure 16 that the amplitudes of the lift coefficient increase with an increase in Reynolds number for the selected range of free-stream orientations. On the other hand, smaller amplitudes of drag coefficient are found for α = 45° than at α = 30° and α = 60° for the entire range of Reynolds number (Figure 17). It is also observed from Figure 17 that the mean values of the drag coefficient increase with an increase in Reynolds number. The amplitudes of the drag coefficient also increase with an increase in Reynolds number. Figure 16 and Figure 17 show an increase in the frequency of vortex-shedding with an increase in Reynolds number for the selected range of free-stream orientations.
Variation in pressure along the surface of the cylinder for five successive moments of time that span the whole period is shown in Figure 18 for the conditions (α = 45°, Ri = 0.2, 60 ≤ Re ≤ 120). It is observed that the pressure difference across vertices B and D at any instant of time increases with an increase in Reynolds number. An increase in pressure difference across vertices B and D of the cylinder increases the lift force and also the amplitudes of the lift coefficient with an increase in Reynolds number (refer to Figure 16). An increase in pressure difference across corners A and C increases the amplitudes of the drag coefficient with an increase in Reynolds number, as can be seen from Figure 17. The mean values of the drag coefficient increase with an increase in Reynolds number, as observed in Figure 17, due to the fact that the pressure difference across vertices A and C and the vorticity at vertices A and C increases with an increase in Reynolds number (Figure 19). At higher Re, more vorticity is generated from cylinder faces, as can be seen in Figure 19.
To highlight the effects of buoyancy and inertia forces on the time histories of lift and drag coefficients, the results of numerical simulations are presented for the range of Reynolds and Richardson numbers (0 ≤ Ri ≤ 0.4 and 60 ≤ Re ≤ 120) at a fixed free-stream orientation α = 45° in Figure 20 and Figure 21. It is depicted in Figure 20 that the amplitudes of the lift coefficient increase with an increase in Reynolds number (as discussed earlier) for the entire range of the Richardson number. The effect of the Richardson number is more pronounced at lower Reynolds number than at higher Reynolds numbers. It is also observed that the frequency of vortex-shedding increases with an increase in the Richardson number, as depicted in Figure 20. It is observed that the amplitudes of the drag coefficient increase with an increase in Reynolds number for the entire range of the Richardson number, as shown in Figure 21. The mean drag coefficient increases either with an increase in Reynolds number or with an increase in the Richardson number, as can be seen from Figure 21.
As depicted in Figure 22, the pressure decreases significantly on faces BC and CD of the cylinder with an increase in Reynolds number and/or Richardson number, leading to a large pressure gradient across the cylinder and hence a large mean drag coefficient. An increase in Reynolds number brings about a greater pressure drop around corners B and D due to the dominance of inertia effects over viscous diffusion. This leads to lower pressures on the downstream faces BC and CD of the cylinder.
Table 2 summarizes the data for mean lift, mean drag, heat transfer (Nusselt number) and vortex-shedding frequency (Strouhal number) for the cases discussed above. It is evident from the data given in Table 2 that the mean drag coefficient and frequency of vortex-shedding increases with an increase in Reynolds number for a set of free-stream orientations and the Richardson number. Additionally, the heat transfer increases with an increase in Reynolds number for a set of free-stream orientation and Richardson number.
Variations in the mean (time mean) coefficient of the lift ( C ¯ L ) with Richardson number for various Reynolds number at different free-stream orientation is shown in Figure 23. The mean coefficient of the lift in Figure 23 for the unsteady and steady flow regimes is shown by firm and dotted lines, respectively. It is observed from Figure 23 that the mean lift coefficient is nearly zero at a free-stream orientation α = 0° for the entire range of the Richardson number. The trend remains the same for the selected range of Reynolds number. For the condition when free-stream is aligned (α = 0°) with buoyancy forces, the mean pressure difference across the faces AD and BC of the cylinder is found to be negligible, as can be seen from Figure 12, resulting in nearly zero transverse or lift force and also the mean lift coefficient. For α = 30°, 45°, 60° and 90°, it is observed that C ¯ L increases in magnitude with (a) an increase in the Richardson number and/or (b) a decrease in Reynolds number. However, sensitivity to the Richardson number is greater for a lower Reynolds number than for a higher Reynolds number. This is expected, as buoyancy effects would tend to dominate more over inertia effects at a lower Reynolds number.
At a fixed Richardson number, an increase in Reynolds number reduces the magnitude of the mean transverse force. An increase in the Richardson number bends the streamlines around corner B in a more pronounced manner than around corner D. This effect is readily observed in the mean streamline patterns depicted in Figure 24. At Ri = 1.6, the pronounced bending of the mean streamlines is readily observed. As Reynolds number increases, the bending around corner B is observed to be reduced. This corroborates well with the trends of reduction in C ¯ L with increase in Reynolds number. Figure 23 also depicts an interesting fact. The magnitude of C ¯ L is larger in the steady flow regime (dashed lines) than in the unsteady flow regime (solid lines).
Variations in the mean coefficient of moment C ¯ M with the Richardson number for various free-stream orientations and Reynolds number are shown in Figure 25. It is observed that the mean coefficient of moment at α = 0° is always found to be zero for the selected ranges of Reynolds and Richardson numbers. The mean flow at α = 0° is found to be symmetric, producing zero turning moment and hence zero mean coefficient of moment. The flow pattern for α ≠ 0° is found to be asymmetric for the selected range of Reynolds and Richardson numbers, as depicted in Figure 26. The mean coefficient of moment increases with an increase in the Richardson number at a fixed Reynolds number, while an increase in Reynolds number at a fixed Richardson number reduces the mean moment. The mean coefficient of moment at lower Re is found to be more sensitive to the Richardson number than at higher Re.
The mean flow asymmetry decreases with an increase in Reynolds number, as depicted in Figure 9 and Figure 26, resulting in a lower turning moment and lower C ¯ M at higher Reynolds number. In the case of α = 90°, the mean coefficient of moment is found to be least sensitive to the Richardson number at a higher Reynolds number. The trends of C ¯ M are similar to the trends exhibited by C ¯ L .
Figure 27 depicts the variation of the mean drag coefficient ( C ¯ D ) with respect to free-stream orientations at Ri = 0, 20 ≤ Re ≤ 120 and 0° ≤ α ≤ 90°. It is observed that ( C ¯ D ) R i = 0.0 increases with an increase in α, reaches its maximum at α = 45° and decreases there after with an increase in α. The trend is the same for the entire range of Reynolds number. The mean drag coefficient is nearly symmetric at about α = 45°. The author believes that Kunio Kuwahara’s [32] third-order upwind scheme, which is employed for convective terms in the interior of the domain, is responsible for the slight asymmetric variation of the mean drag coefficient about α = 45° due to numerical errors. The scheme is implemented in ξ and η directions by treating a one-dimensional approach (as in the usual practice), leading to numerical errors due to misalignment of the velocity vector with the local ξ and η coordinate directions.
The sensitivity of ( C ¯ D ) R i = 0.0 to α is found to be least for Re = 20 and it increases with an increase in Reynolds number and is found to be maximum for Re = 120 (Figure 27). An increase in Reynolds number increases inertia effects relative to viscous diffusion, leading to a change in mean pressure along the faces of the cylinder. Additionally, the mean pressure along the surface of the cylinder changes with respect to the orientation of the free-stream as depicted in Figure 12. The separation point changes on the cylinder surface due to a change in the orientation of the free-stream, leading to a change in mean pressure along the faces of the cylinder with respect to α. The change in the Reynolds number and/or free-stream orientation significantly alters the mean pressure across the cylinder in the direction of the fluid stream and the mean drag coefficient. At α = 0° and 90°, the mean drag coefficient decreases with an increase in Reynolds number, while it increases with an increase in Reynolds number at α ≠ 0° and α ≠ 90°.
Figure 28 depicts the variation of the ratio of the mean (time mean) drag coefficient ( C ¯ D / ( C ¯ D ) R i = 0.0 ) with Richardson number (0 ≤ Ri ≤ 1.6) for the range of Reynolds number and free-stream orientation 20 ≤ Re ≤ 120 and 0° ≤ α ≤ 90°, respectively.
The mean drag coefficient ( C ¯ D ) for a particular Reynolds number is normalized with respect to the value observed for forced flow (Ri = 0) for the same (α, Re) to highlight the effects of buoyancy. The firm and dotted lines in Figure 28 show the ratio of the mean drag coefficient ( C ¯ D / ( C ¯ D ) R i = 0.0 ) for unsteady and steady flows. As expected, the ratio increases with an increase in the Richardson number for the entire range of Reynolds number. The trend is the same for the selected range of free-stream orientations except for α = 90°. It is seen from Figure 28 that the mean drag coefficient is less sensitive to Reynolds number for unsteady flows in comparison with steady flows. This is owing to the fact that in the case of steady flows, the vortices are trapped in between the shear layers in the wake behind the cylinder. With an increase in Reynolds number, the shear layer speeds up, which increases the rate of circulation of trapped vortices. This, in turn, reduces the pressure in the circulating zone of vortices, resulting in a large drag force and, hence, a large mean drag coefficient.
A large mean pressure gradient across the cylinder in the direction of the fluid stream is responsible for the occurrence of a large mean drag force and a large mean drag coefficient. It is depicted in Figure 12 that for (α = 0°, Ri = 0) the mean pressure on the front face AB of the cylinder that faces the free-stream is large as compared to that at the rear face CD of the cylinder. The stagnation point is formed on the front face AB of the cylinder, leading to high mean pressure on the face AB of the cylinder; the fluid accelerates rapidly around the stagnation point. The cylinder in this condition experiences a large mean pressure gradient and, consequently, a large mean drag coefficient. It is also depicted in Figure 12 that the mean pressure gradient increases with an increase in the Richardson number, resulting in a large mean drag coefficient at a higher Richardson number. The trend remains the same for the selected range of Reynolds number. For free-stream orientations other than α = 0°, the mean drag coefficient varies accordingly, depending upon the mean surface pressure at various Reynolds and Richardson numbers.
The ratio C ¯ D / ( C ¯ D ) R i = 0.0 allows one to ascertain and highlight the effects of buoyancy. Figure 28 shows that at a fixed Ri, an increase in Re tends to reduce the ratio of the mean drag coefficients. This is an indication of the mitigation of buoyancy effects. At a fixed Ri, there is an increase in Re weakening of momentum and thermal diffusion effects. Since thermal diffusion is weakened, the effect of buoyancy does not spread to larger distances from the cylinder. Thus, the overall effect is a reduction in the effects of buoyancy on the flow. The scenario is more pronounced at lower α (buoyancy aligned to inertia situation) than at higher α.
Interesting results are observed for the cross-flow configuration (α = 90°). For Re = 20, 40, the mean drag values can be reduced by buoyancy effects to levels lower than those in the forced flow regime. Additionally, for higher Re (Re ˃ 40), an increase in Ri causes the drag values to increase in relation to the forced flow values.
For Re = 20 and 40, the average pressure difference across the faces AD and BC of the cylinder are found more at Ri = 0 than at Ri = 1.2, as depicted in Figure 29, leading to a large drag force at Ri = 0. The drag coefficient in this condition is higher at Ri = 0 than at Ri = 1.2. The consequence is the decrease in the ratio of C ¯ D / ( C ¯ D ) R i = 0.0 with increasing Ri for Re = 20 and 40. At a higher Reynolds number, the spatial average pressure difference across the faces AD and BC are found more at Ri = 1.2 than at Ri = 0, as can be seen from Figure 29, resulting in a large drag force and hence a large mean drag coefficient at Ri = 1.2 than at Ri = 0. In this condition, the ratio of C ¯ D / ( C ¯ D ) R i = 0.0 increases with an increase in Ri, as can be seen from Figure 28.

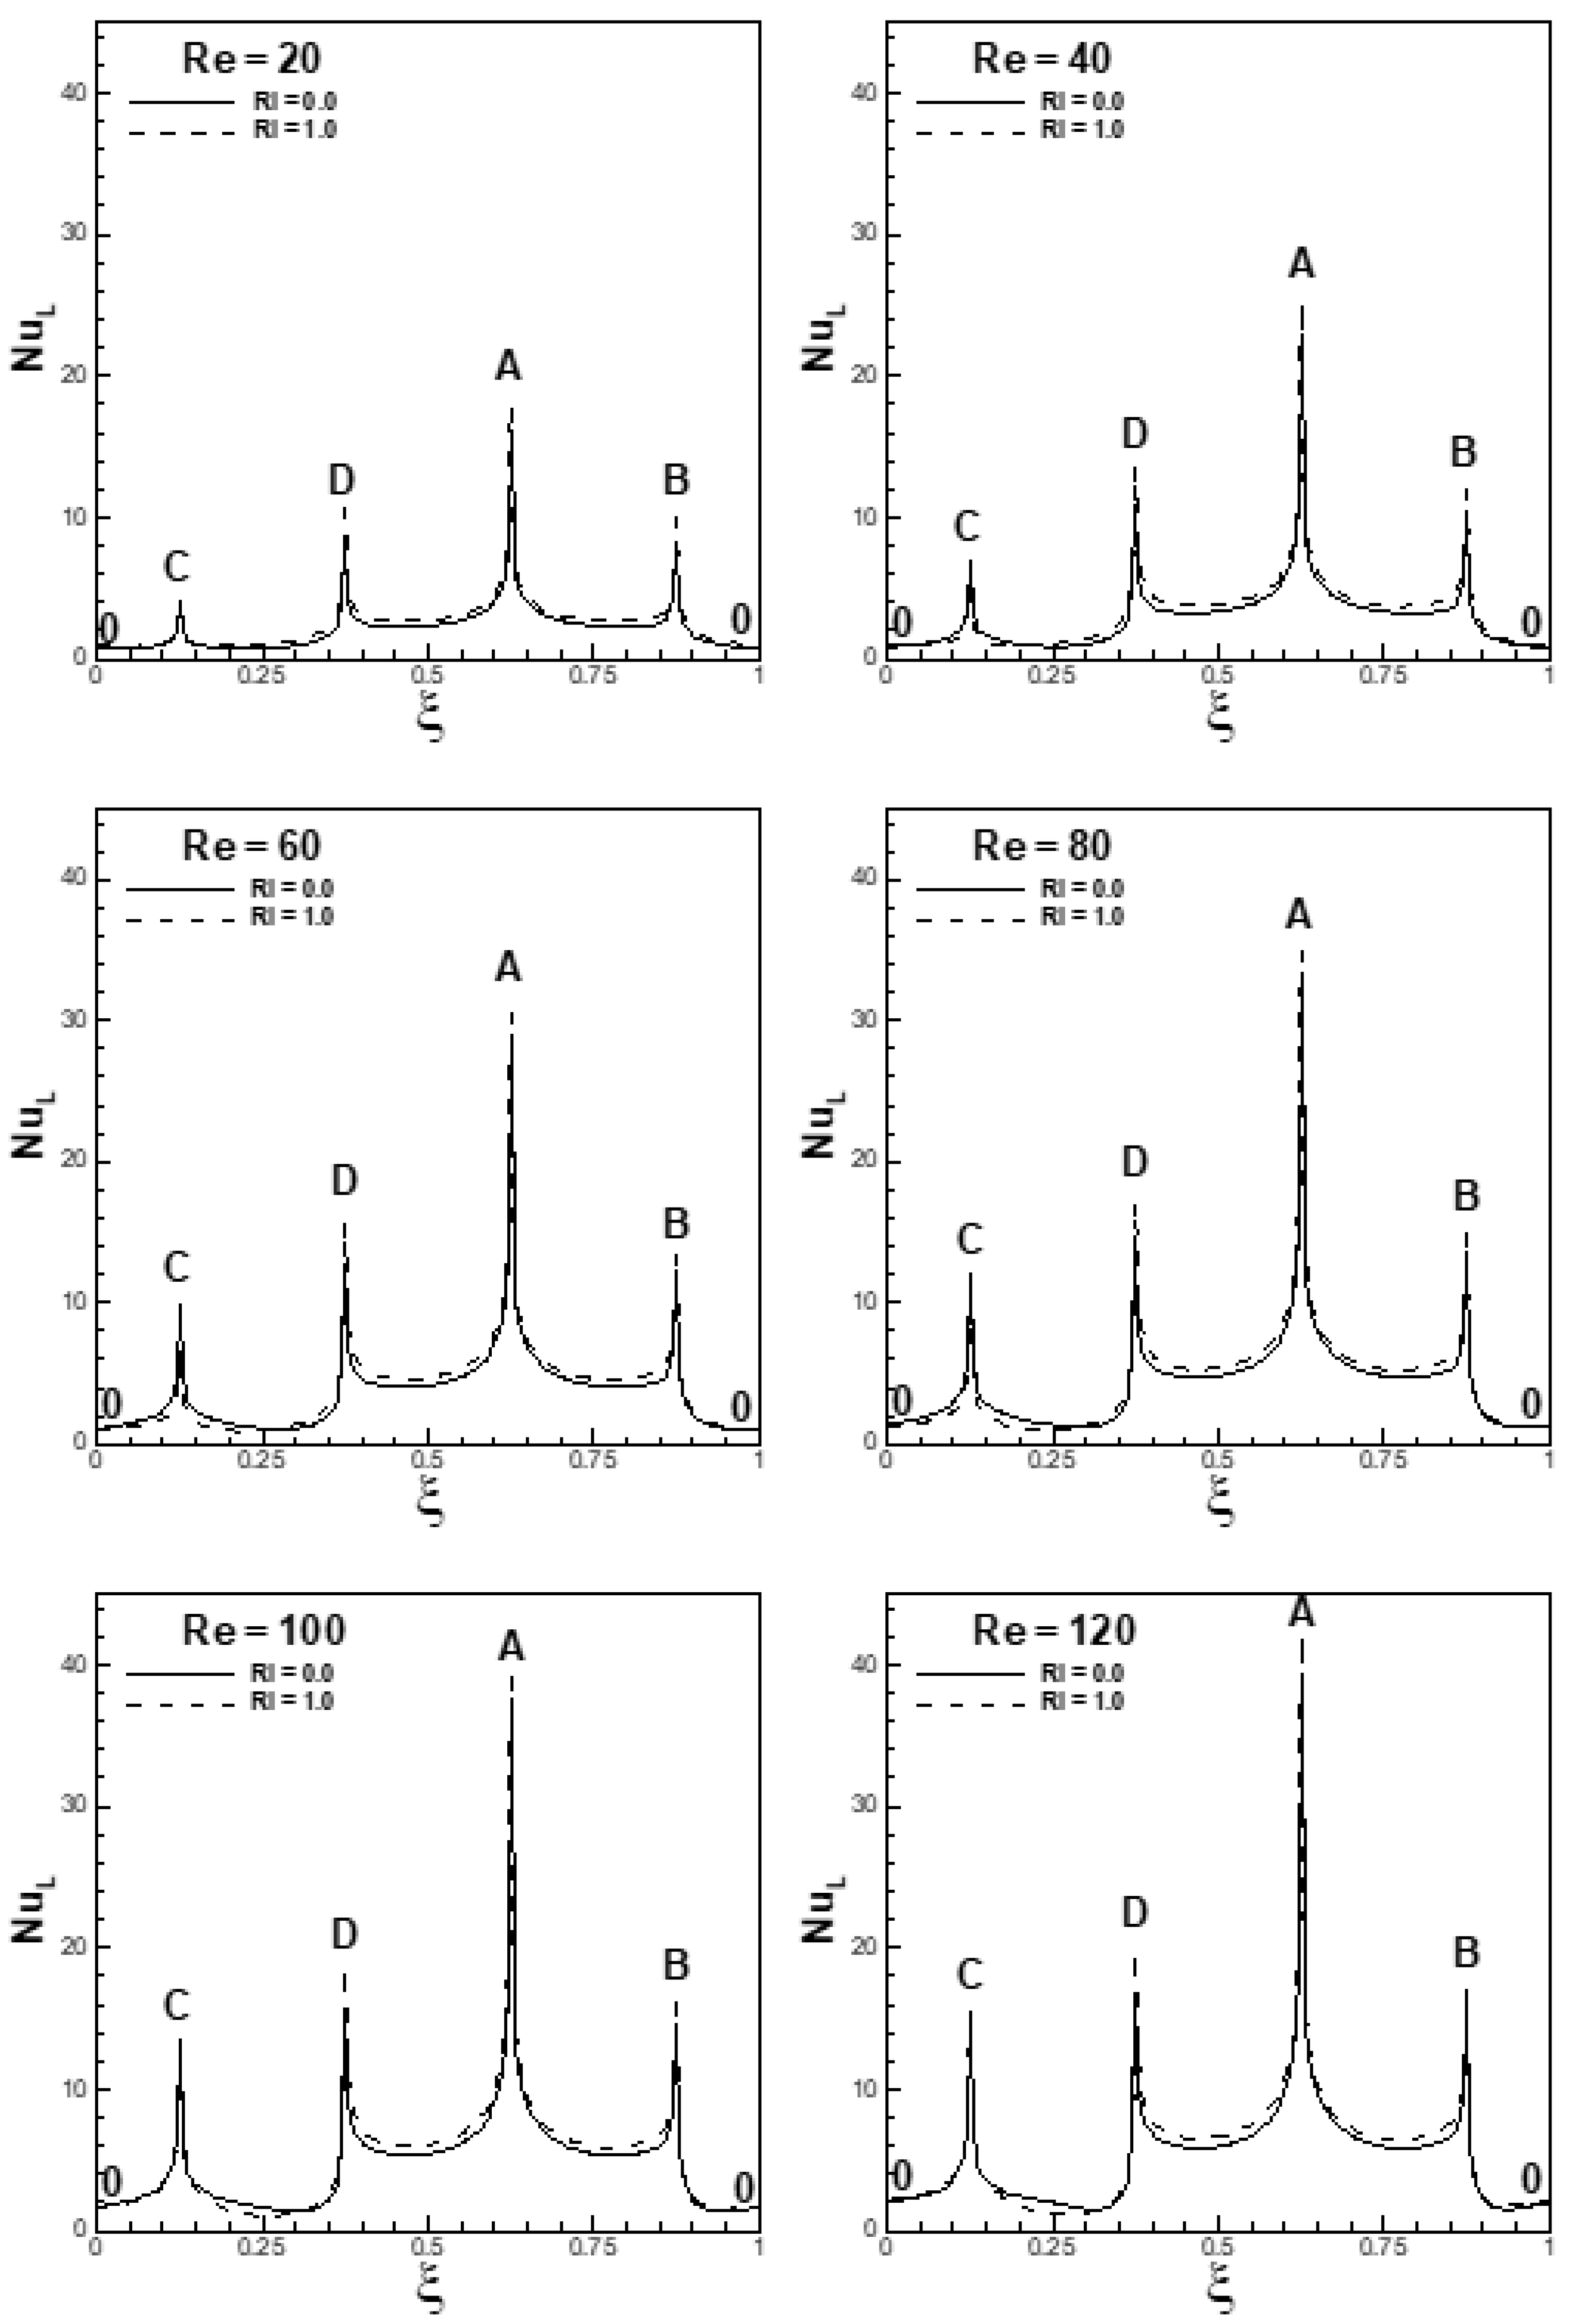
4.4.2. Heat Transfer Characteristics

Figure 30a depicts the variation of the mean Nusselt number ( N u ¯ ) with free-stream orientations for the conditions (Ri = 0, 20 ≤ Re ≤ 120, 0° ≤ α ≤ 90°). It is observed that at a fixed α, mean Nusselt number increases with an increase in Reynolds number. The trend is found to be the same for the entire range of α. An increase in Reynolds number increases the fluid inertia relative to viscous diffusion. The heat transfer from the faces of the cylinder increases with an increase in Reynolds number, as depicted in Figure 30b. The shear layer is accelerated with an increase in Reynolds number, while in turn increasing the heat transfer from the attached flow face(s) of the cylinder.
The circulation of vortices also increases with an increase in Reynolds number, increasing the heat transfer from the separated flow face(s) of the cylinder to the shear layers. The overall effect is the increase in the rate of heat transfer from the cylinder with an increase in Reynolds number. It is observed that the Nusselt number is less sensitive to α for Re = 20 and 40. The sensitivity of the Nusselt number to α increases with an increase in Reynolds number, as depicted in Figure 30a.
In a manner similar to drag characteristics, the variation of the ratio of the mean (time mean) Nusselt number ( N u ¯ / ( N u ¯ ) R i = 0.0 ) for various Richardson number (0 ≤ Ri ≤ 1.6), Reynolds number (20 ≤ Re ≤ 120), and free-stream orientation (0° ≤ α ≤ 90°) is depicted in Figure 31. To highlight the effects of buoyancy on heat transfer, the mean Nusselt number for various Reynolds number has been normalized or scaled with respect to the value observed at Ri = 0. The firm and dotted lines in the figure show the unsteady and steady flows, as shown in the previous cases of the mean lift and drag coefficients. At α = 0°, the ratio of the mean Nusselt number increases with an increase in the Richardson number. The trend is found to be similar for the entire range of Reynolds number. It is also depicted in Figure 31 that the heat transfer for the selected range of Reynolds number is found to be most sensitive to buoyancy for the condition when free-stream is aligned (α = 0°) with the buoyancy forces. In an aligned situation, the fluid particles are accelerated with an increase in the Richardson number. This results in a faster rate of heat removal from the cylinder compared to the scenario of forced flow.
The mean Nusselt number is found to be less sensitive to the Richardson number as the degree of misalignment increases (α = 30°, 45°, 60°), as expected, and is found to be least sensitive to Ri at α = 90° due to complete misalignment between inertia and buoyancy forces. The rate of heat transfer is found to be more sensitive to the Richardson number for steady flows in comparison to unsteady flows. The maximum increase in heat transfer for free-stream orientation of 30°, 45° and 60° over and above the forced flow regime value is found to be 28%, 24% and 20%, respectively, for (Re = 20, Ri = 1.6). At α = 0°, an almost 30% enhancement in the heat transfer is brought about by buoyancy effects at Ri = 1.6 for the selected range of Reynolds number. At a fixed Ri, as Re is increased, the ratio N u ¯ / ( N u ¯ ) R i = 0.0 decreases for any α (except α = 90°). However, in the cross-flow configuration (α = 90°), an increase in Re at a fixed Ri brings about an increase in heat transfer relative to the forced flow scenario. The major difference in the trend can be attributed to the fact that at α = 90° all flows (except at Re = 20) are unsteady in character, whereas for other values of α, owing to suppression of vortex-shedding for Ri ˃ Ric (Ric is the critical value of the Richardson number at which vortex-shedding is suppressed), the flows are steady. The effect of Re on the ratio N u ¯ / ( N u ¯ ) R i = 0.0 is different in the steady and unsteady flow regimes. At α = 90°, in the unsteady flow regime, an increase in Re at a fixed Ri brings about faster shedding of vortices, as well as an increase in thermal gradients at/near the attached flow faces. This brings about an overall increase in heat transfer at a fixed Ri. For 0° ≤ α ≤ 90°, in the steady flow regime, an increase in Re at a fixed Ri brings about a decrease in overall buoyancy effects as the thermal diffusion is weakened. The outcome is a shift in the heat transfer rate toward the values associated with the forced flow regime at the corresponding Re.
Variation of local Nusselt number (NuL) with respect to free-stream orientation is depicted in Figure 32 for α = 0°, 20 ≤ Re ≤ 120, Ri = 0 and 1.0. It is observed that the rate of heat transfer from the faces of the cylinder increases with an increase in Reynolds number. An increase in Reynolds number increases the fluid inertia relative to viscous diffusion, resulting in an increase in the rate of heat transfer from the faces. It is also observed that the heat transfer from the faces increases with an increase in the Richardson number for the entire range of Reynolds number, except for the face CD of the cylinder at a higher Reynolds number.
An increase in Ri increases the acceleration of the fluid particle and also the rate of heat transfer. At a higher Reynolds number, the vortices are not capable of transferring more heat from the rear face CD of the cylinder to the shear layers with increasing Ri; therefore, the heat transfer from the face CD of the cylinder is reduced slightly at higher Ri. However, the overall heat transfer from the cylinder increases with an increase in Ri and also the ratio N u ¯ / ( N u ¯ ) R i = 0.0 as depicted in Figure 31. Similar effects of Re and Ri are observed for α = 45°. The rate of heat transfer from the cylinder is found to increase either with an increase in Re or Ri, as depicted in Figure 33. For α = 45°, the ratio N u ¯ / ( N u ¯ ) R i = 0.0 decreases with an increase in Re at any fixed value of Ri, as can be seen from Figure 31. For a fixed Re = 20, the heat transfer from the faces of the cylinder is nearly the same at Ri = 0 and 1.0. In this condition, the ratio N u ¯ / ( N u ¯ ) R i = 0.0 remains nearly the same for the entire range of the Richardson number, as depicted in Figure 31. At a higher Reynolds number, the heat transfer from the faces BC and DC increases and from the faces AD and AB decreases with an increase in Ri. The overall rate of heat transfer from the cylinder at a higher Reynolds number increases with an increase in Ri. The ratio N u ¯ / ( N u ¯ ) R i = 0.0 at higher Reynolds number also increases with an increase in Ri.
Contour maps of mean/steady drag coefficient C ¯ D ( α , R i ) and Nusselt number N u ¯ ( α , R i ) on a ( α R i ) plane are depicted in Figure 34 and Figure 35 for 20 ≤ Re ≤ 120. From the contour maps of mean/steady drag coefficient and Nusselt number, it is possible to identify the ranges of parameters (α, Ri) that can yield a relatively high mean/steady heat transfer rate accompanied by relatively low values of mean/steady drag coefficient. It is depicted in Figure 34a–f that the mean/steady drag coefficient is sensitive to values of Ri for (Re = 20, α ≤ 60°) and (40 ≤ Re ≤ 120, α ≤ 50°). An increase in Ri increases the mean/steady drag coefficient, as depicted in Figure 34. Mean/steady drag coefficient is weakly influenced by Ri for (Re = 100 and 120, α ≥ 80°). Contour maps of mean/steady Nusselt number for 20 ≤ Re ≤ 120 are depicted in Figure 35a–f. It is observed that the sensitivity of N u ¯ to Ri is greatest for α = 0°, for the entire range of Reynolds number. High mean/steady Nusselt number for the entire range of Reynolds number is observed for (α ≤ 20°, Ri ≥ 0.8). The sensitivity to Ri of mean/steady Nusselt number is observed less for (20 ≤ Re ≤ 120, α ≥ 80°).

5. Conclusions

Numerical simulations are conducted for 20 ≤ Re ≤ 120, 0° ≤ α ≤ 90°, 0 ≤ Ri ≤ 1.6, Pr = 0.71 and ϕ = 0° to investigate the associated effects of Reynolds number, Richardson number and free-stream orientations.
  • It is observed that the vortices are reduced in size with increasing Re and are shed more frequently. The frequency of vortex-shedding increases either with an increase in Re and/or Ri for the entire range of α. The Strouhal number is found to be maximal for Re = 120 at (α = 45°, Ri = 1.2), which is approximately 34% over and above the forced flow value at the same time (Re, α);
  • In the forced flow regime, mean pressure on the faces AB, BC, CD and DA of the cylinder is found to decrease with an increase in Re; an increase in Re also decreases the pressure at the corners of the cylinder. The mean surface pressure in the mixed convective flow regime changes significantly due to buoyancy forces. The effect of buoyancy forces on surface pressure reduces with an increase in α and is found to be the least at α = 90°. Mean vorticity along the surface and vertices of the cylinder is found to increase with an increase in Re;
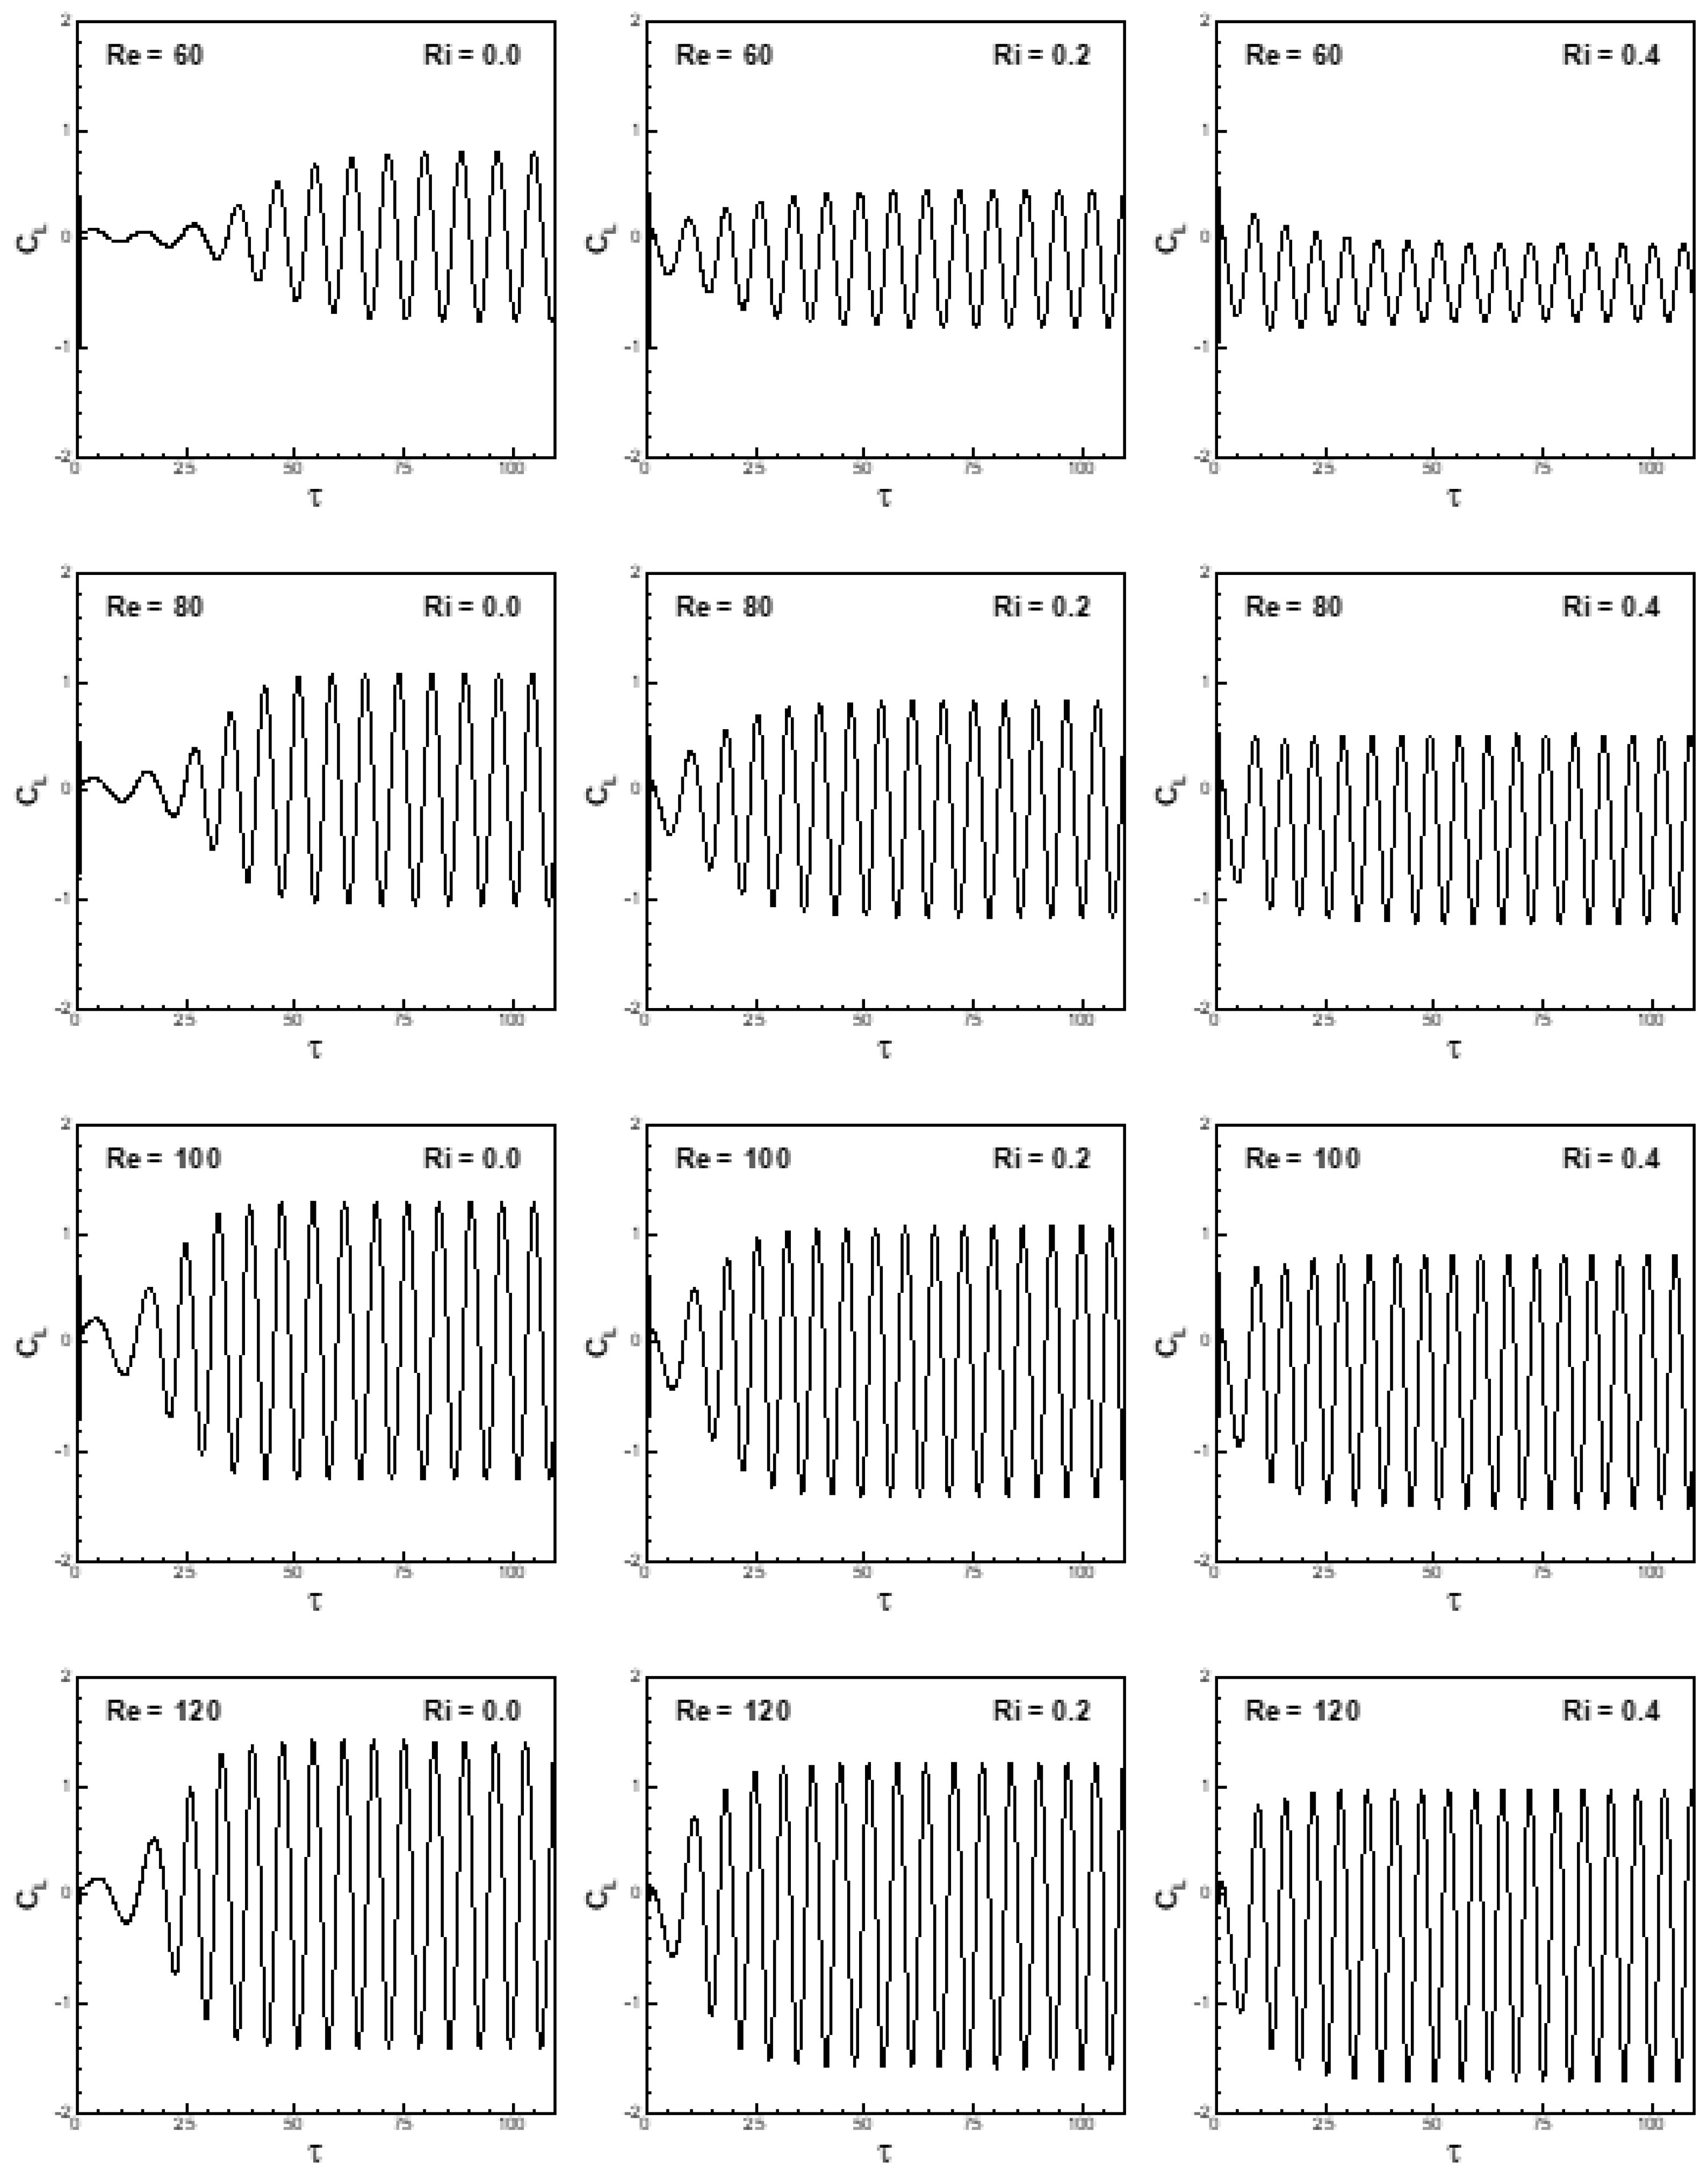
  • In the mixed convective flow regime, the amplitudes of lift coefficient are observed largest at α = 45° and increase with an increase in Re for the entire range of α. For free-stream orientations α ≠ 0°, the mean coefficient of lift increases with an increase in Ri, while it decreases with an increase in Re. Sensitivity of the mean lift coefficient to Ri is observed more at lower Re than at higher Re. The mean (or steady) coefficient of lift is found to be maximal at (Re = 20, Ri = 1.6) for any α ≠ 0°. The mean coefficient of moment ( C ¯ M ) follows the same trend as followed by the mean coefficient of lift;
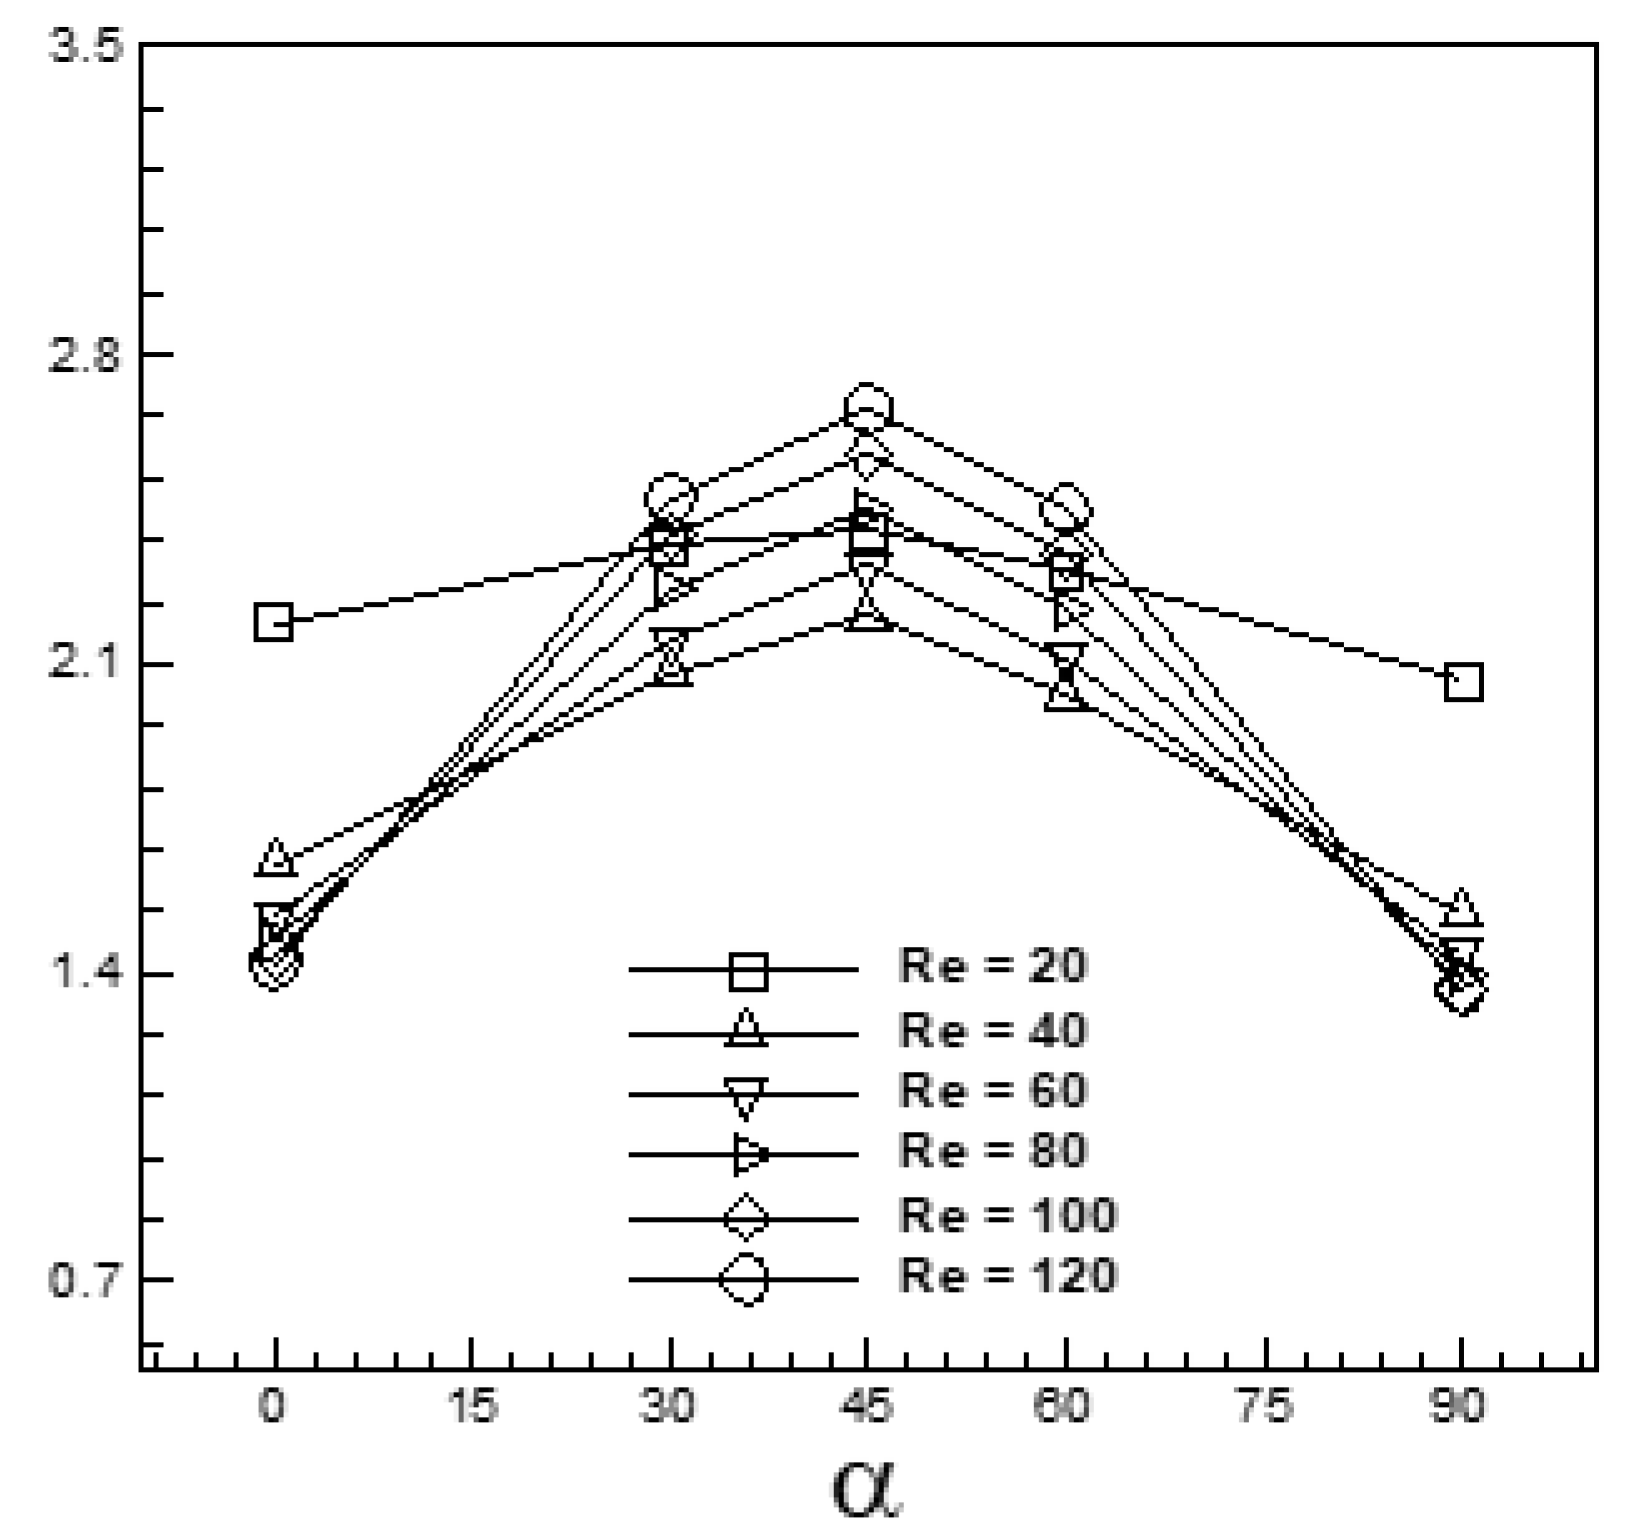
  • For the entire range of Re, the amplitudes of the drag coefficient are found to be smallest at α = 45°. It is observed that the amplitudes and the mean values of the drag coefficient increase with an increase in Re. Mean drag coefficient ( C ¯ D ) R i = 0.0 , increases with an increase in α, reaches its maximum value at α = 45° and then decreases with an increase in α for the entire range of Re. Sensitivity of ( C ¯ D ) R i = 0.0 to α is observed minimum for Re = 20 and maximum for Re = 120;
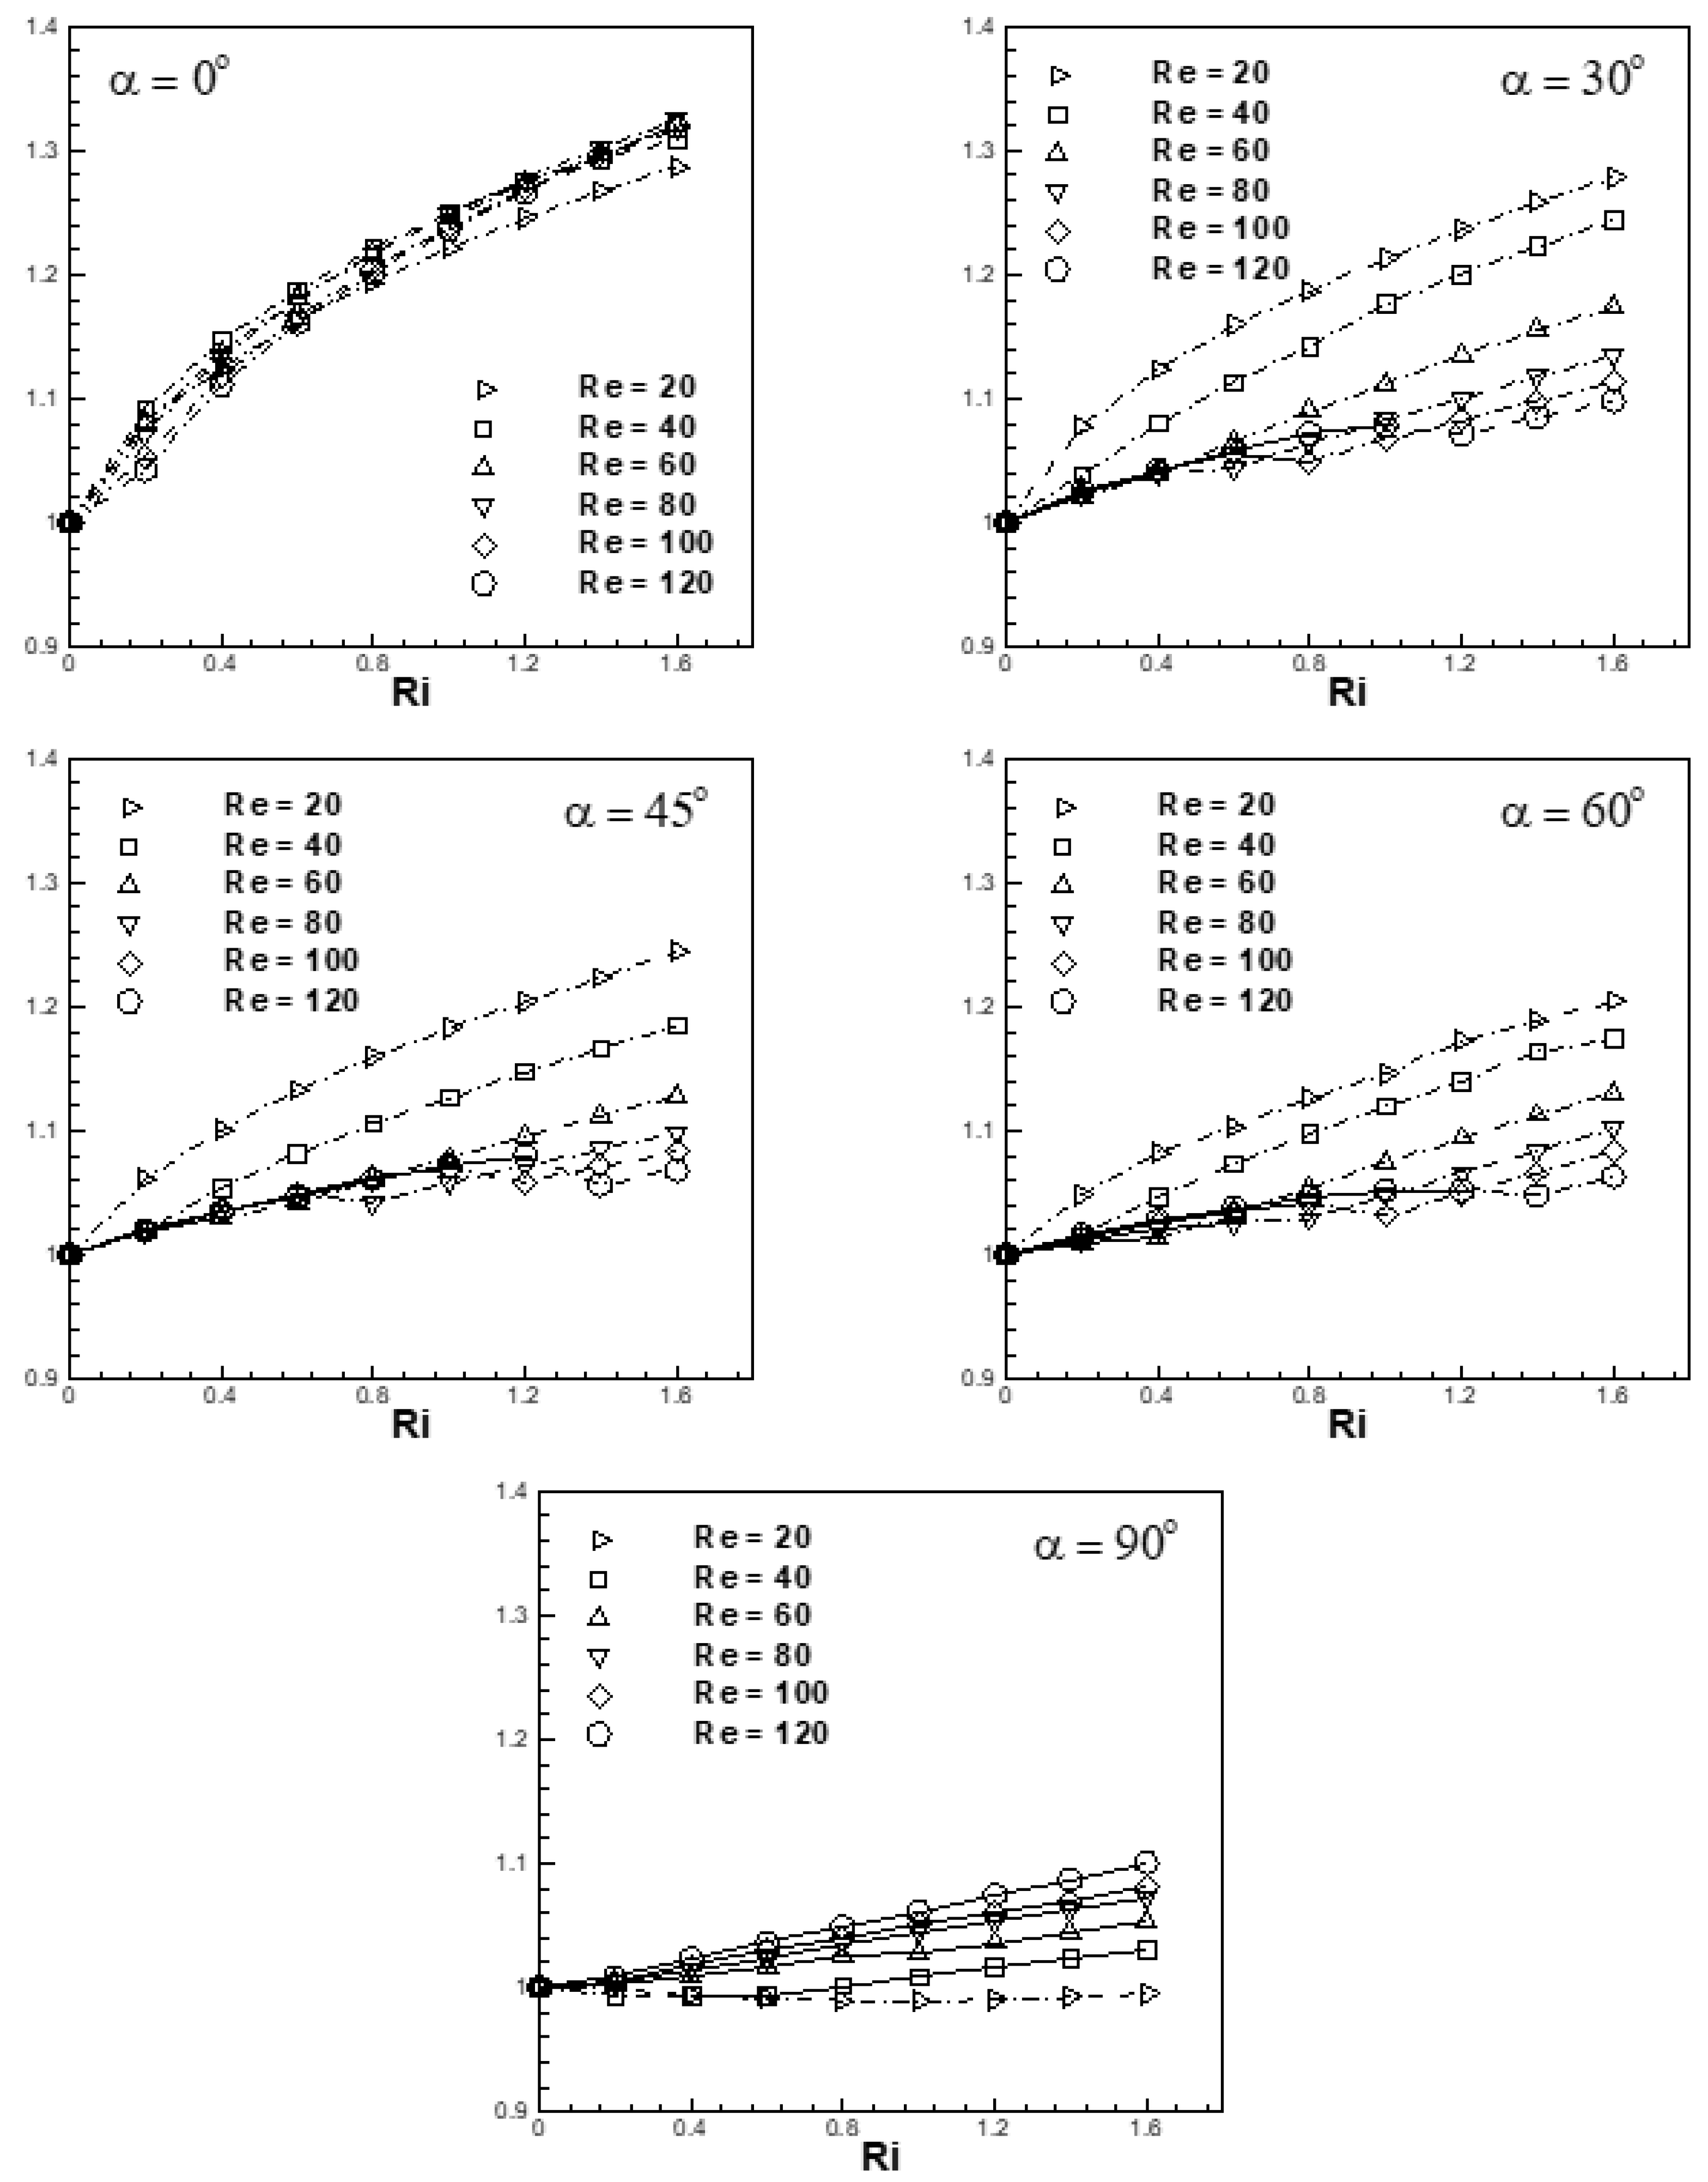
  • The ratio C ¯ D ( R i , α ) / C ¯ D ( 0 , α ) increases with an increase in Ri for the entire range of Re. Sensitivity of C ¯ D ( R i , α ) / C ¯ D ( 0 , α ) to Re is observed to be lower for unsteady flows than for steady flows. It is also observed that at a fixed value of Ri, the ratio C ¯ D ( R i , α ) / C ¯ D ( 0 , α ) decreases with an increase in Re. The sensitivity of C ¯ D ( R i , α ) / C ¯ D ( 0 , α ) to Ri is the observed maximum at α = 0° for the entire range of Re, and it decreases with an increase in α and is found to be theleast at α = 90°;
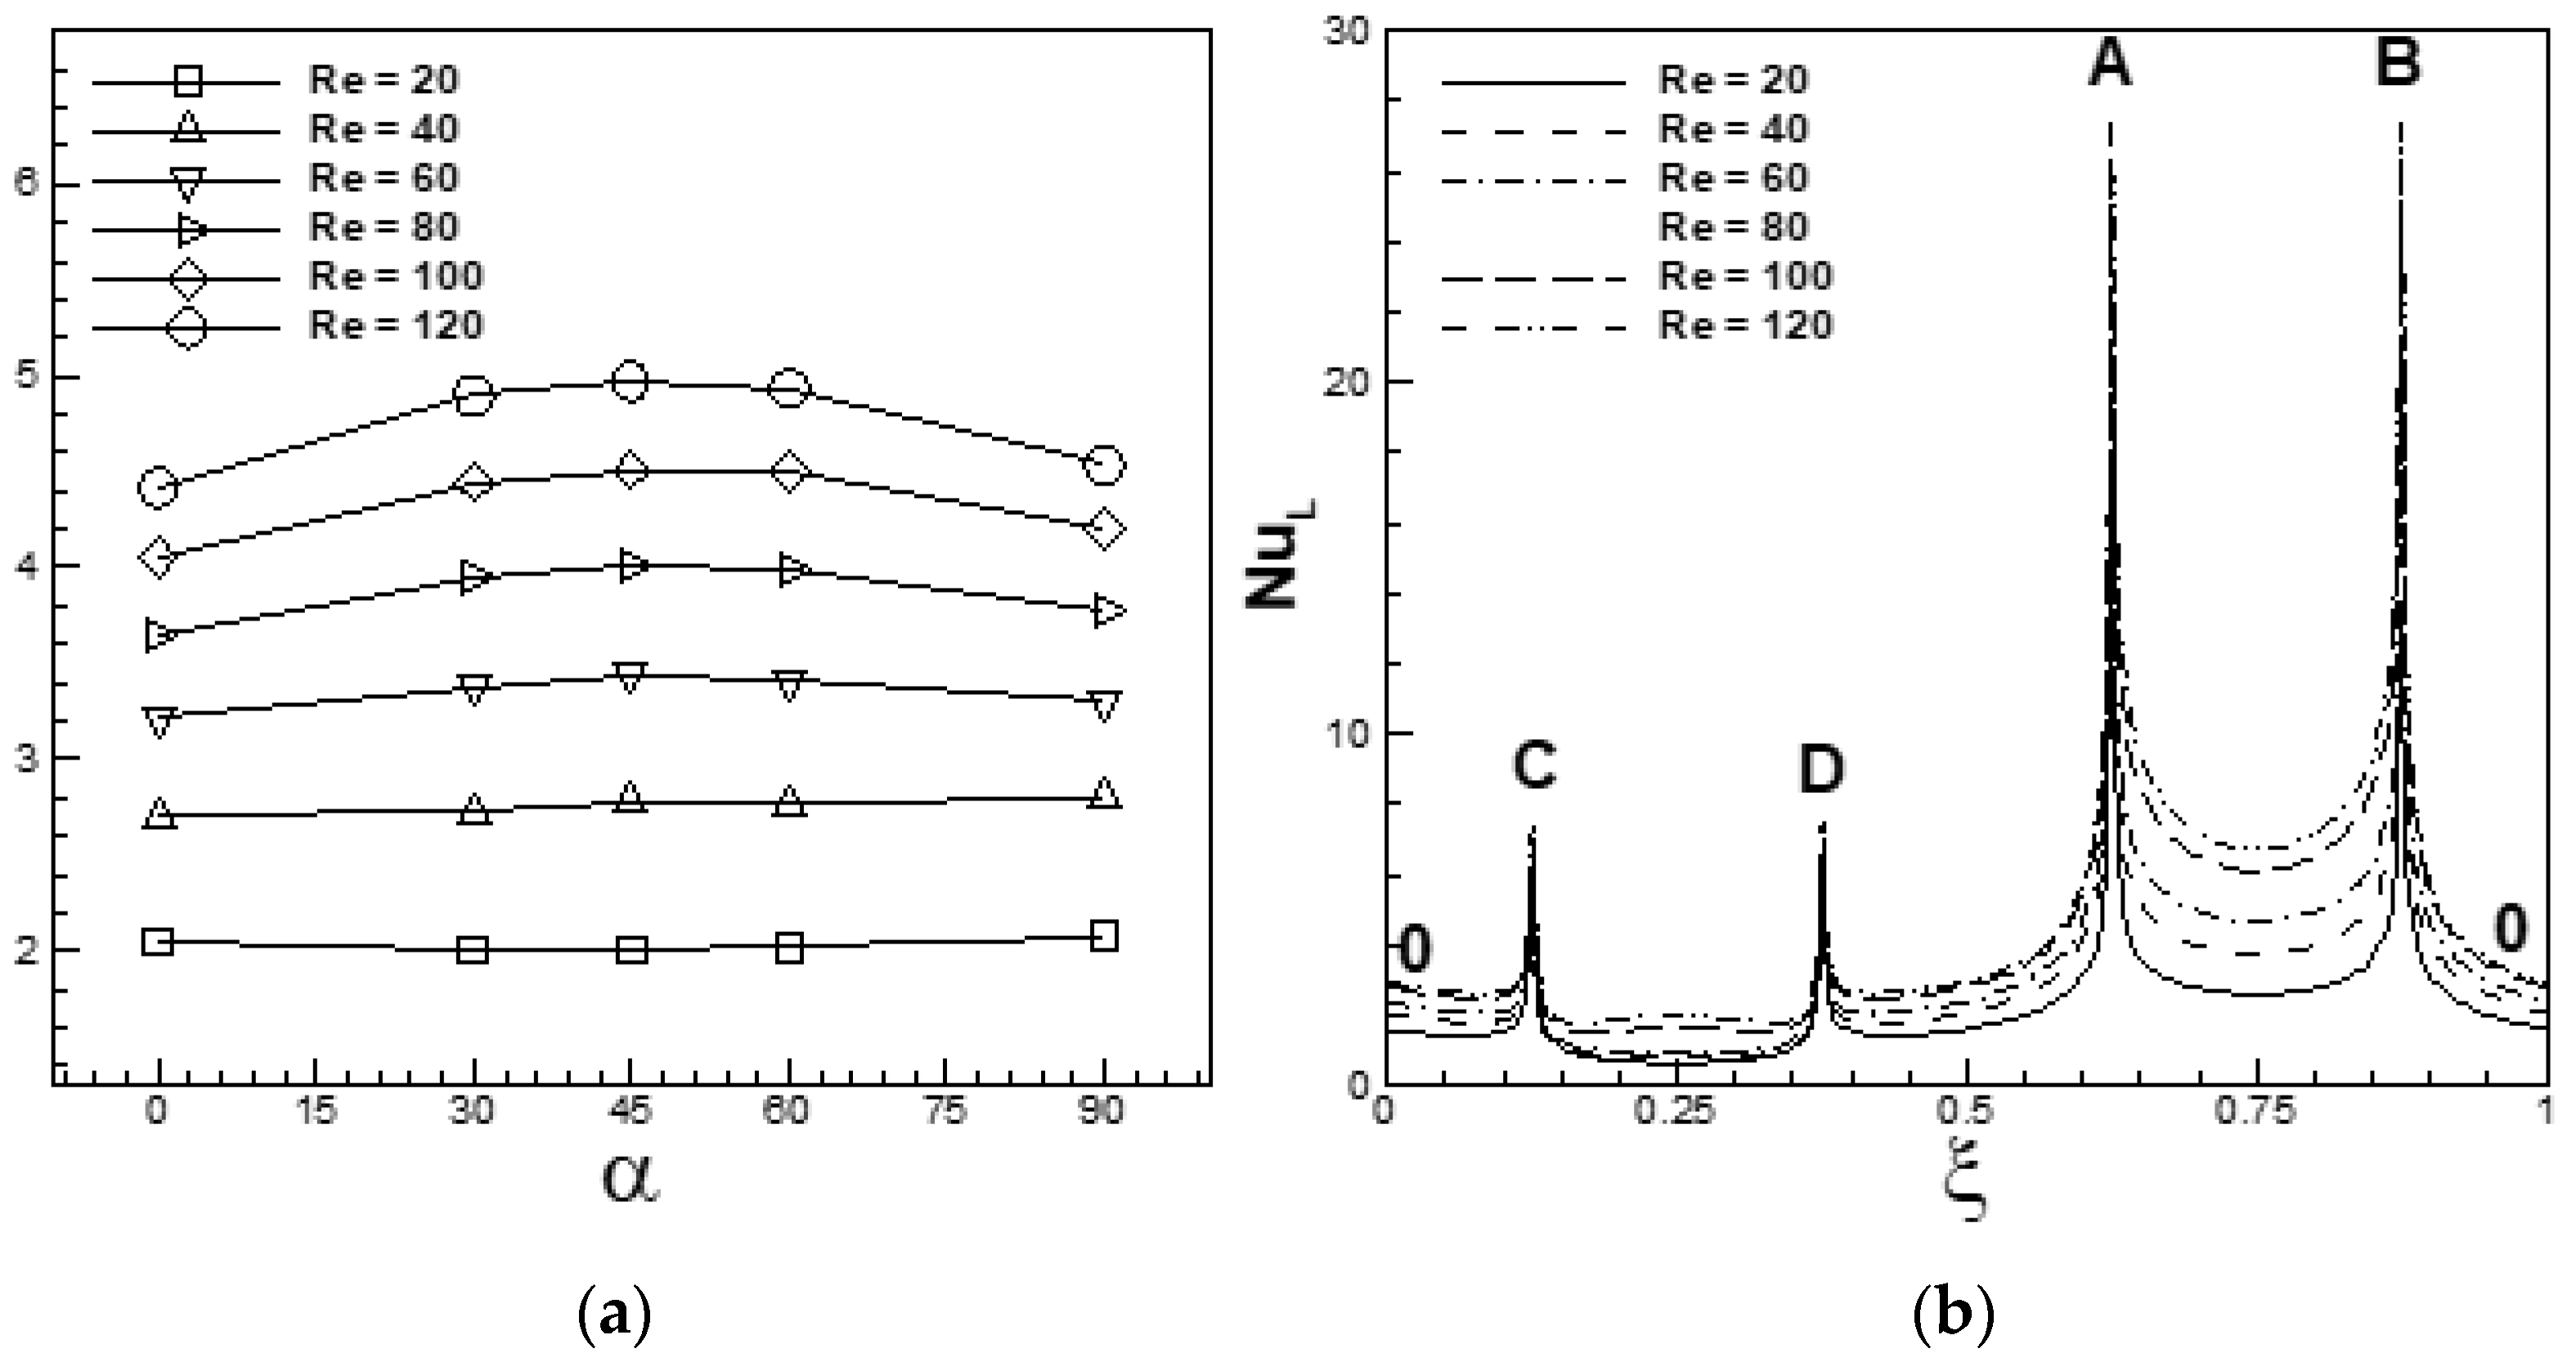
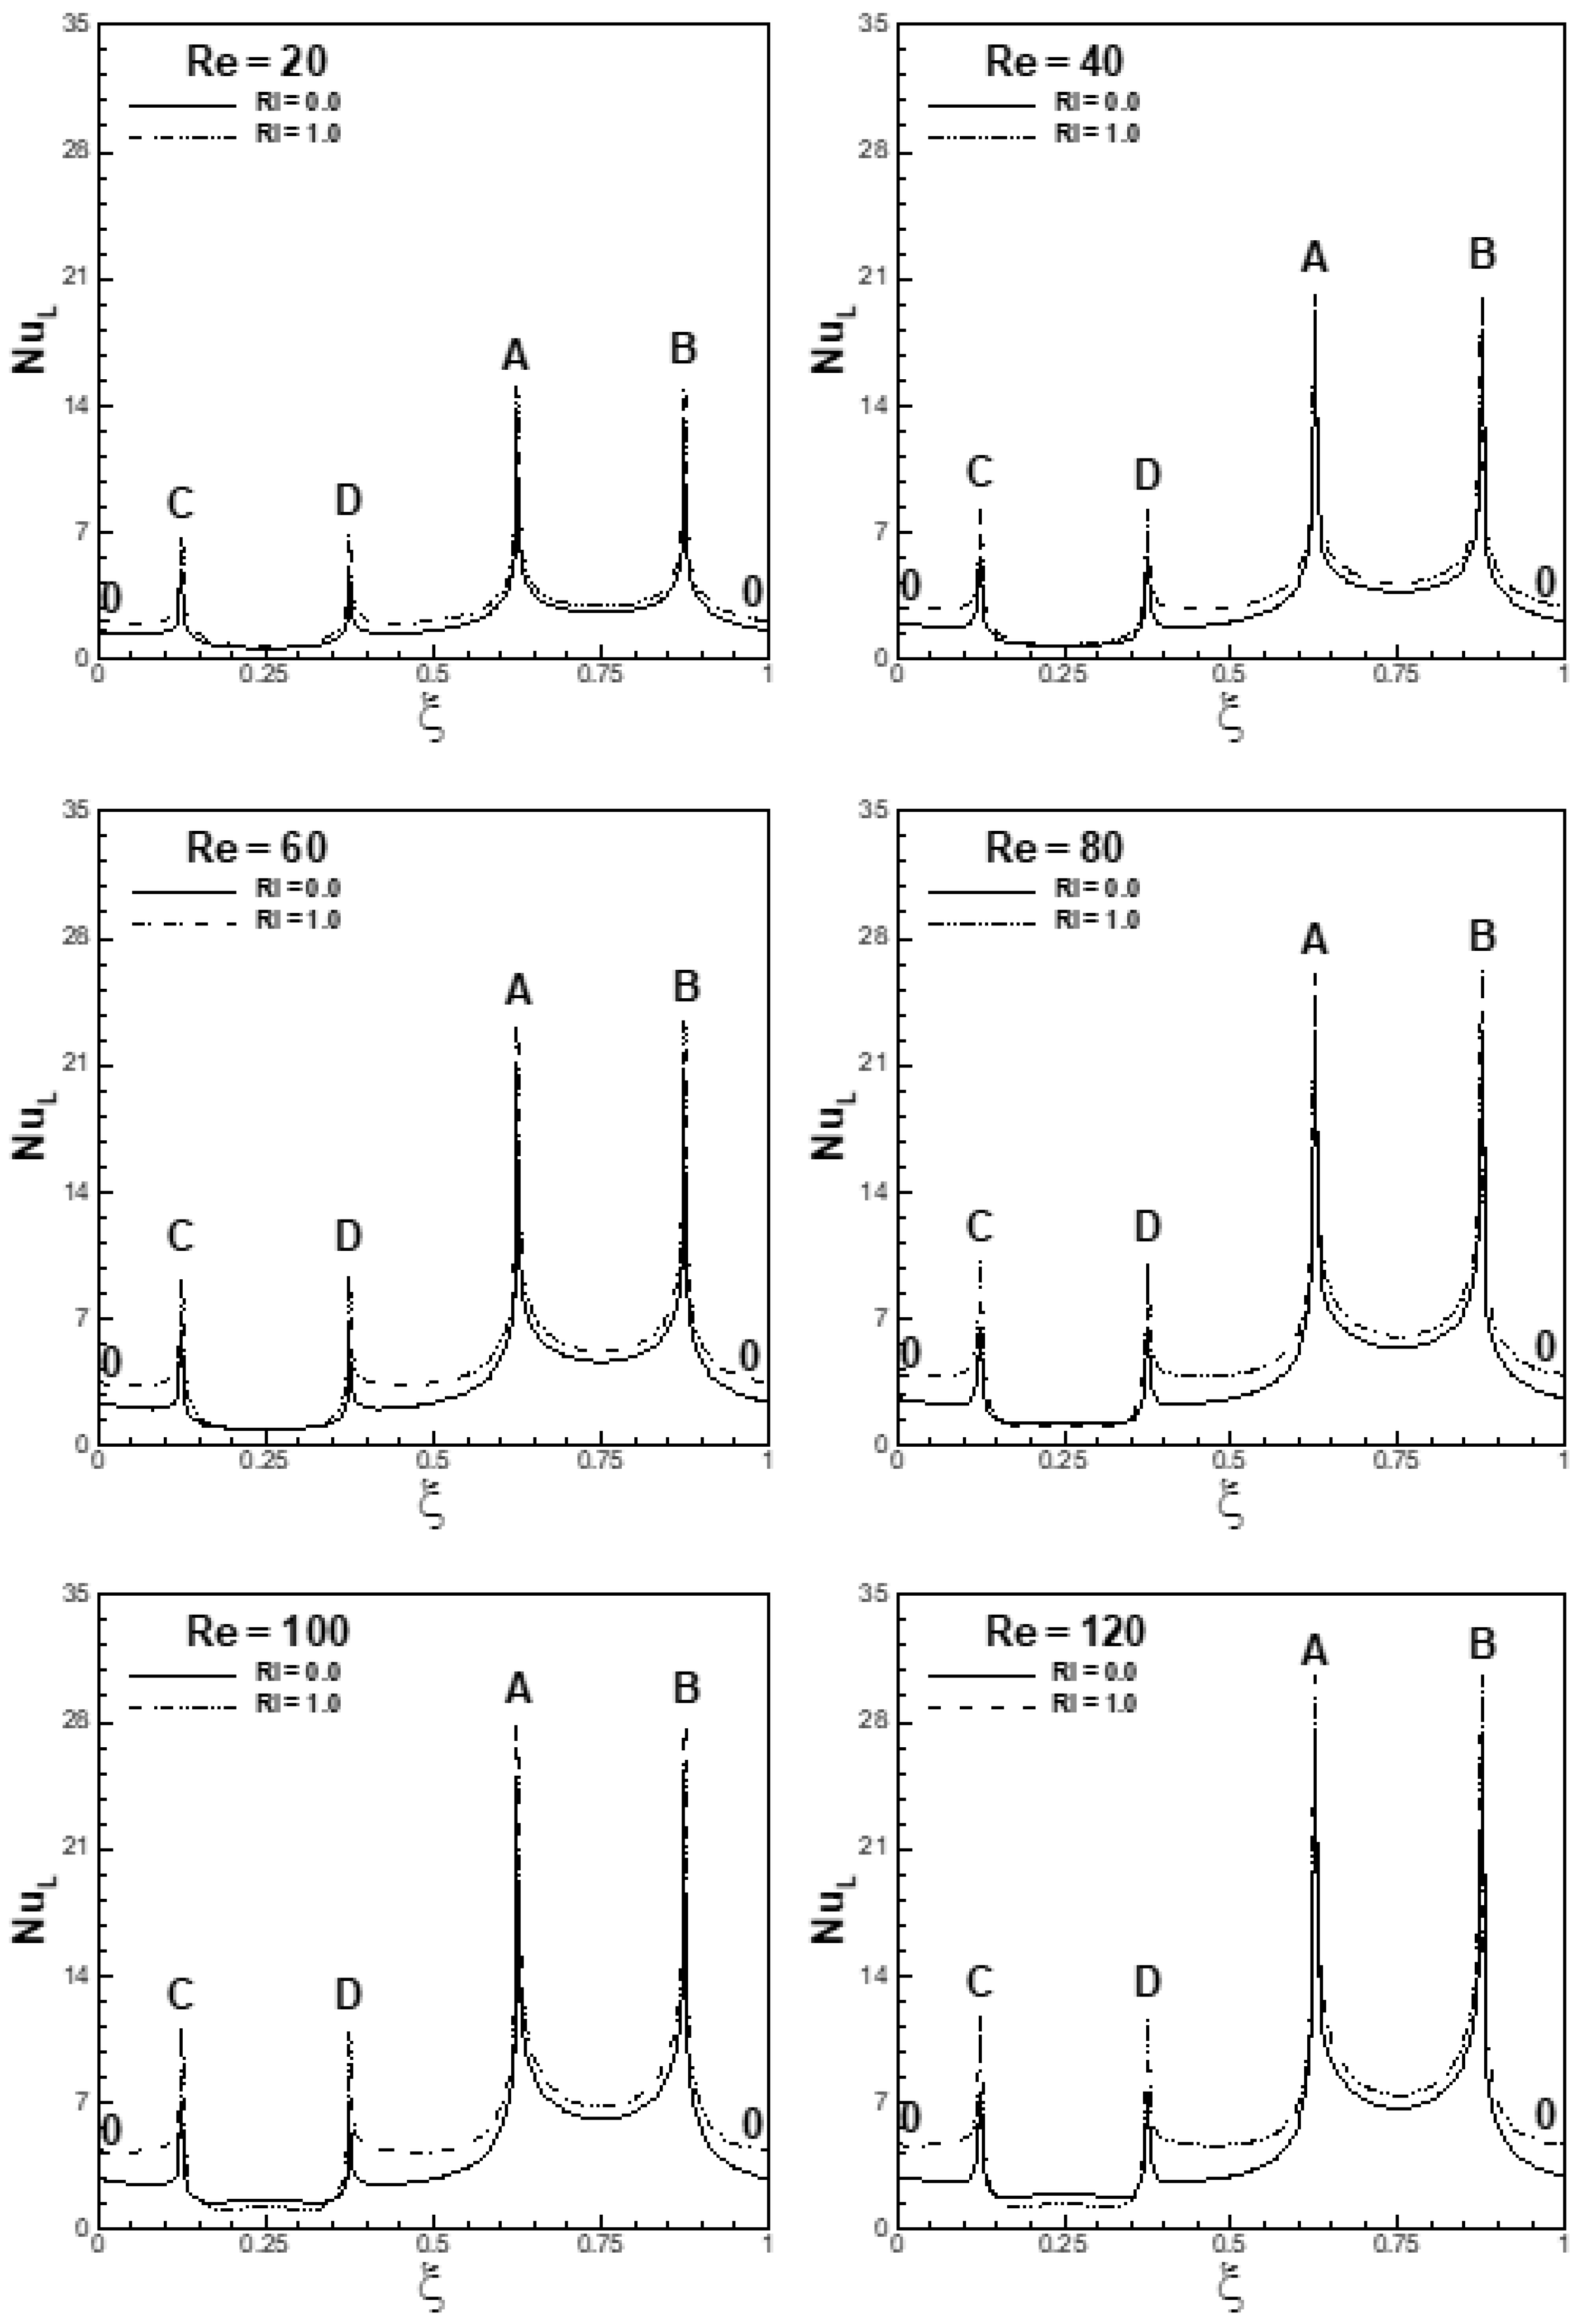
  • At a fixed α, the mean Nusselt number in the forced flow regime increases significantly with an increase in Re. The sensitivity of ( N u ¯ ) R i = 0.0 to α increases with an increase in Re for a fixed α. The sensitivity of the Nusselt number to Ri is found to decrease with an increase in α and is found to be least sensitive to Ri at α = 90°. Additionally, the Nusselt number is found to be more sensitive to Ri for steady flows than for unsteady flows;
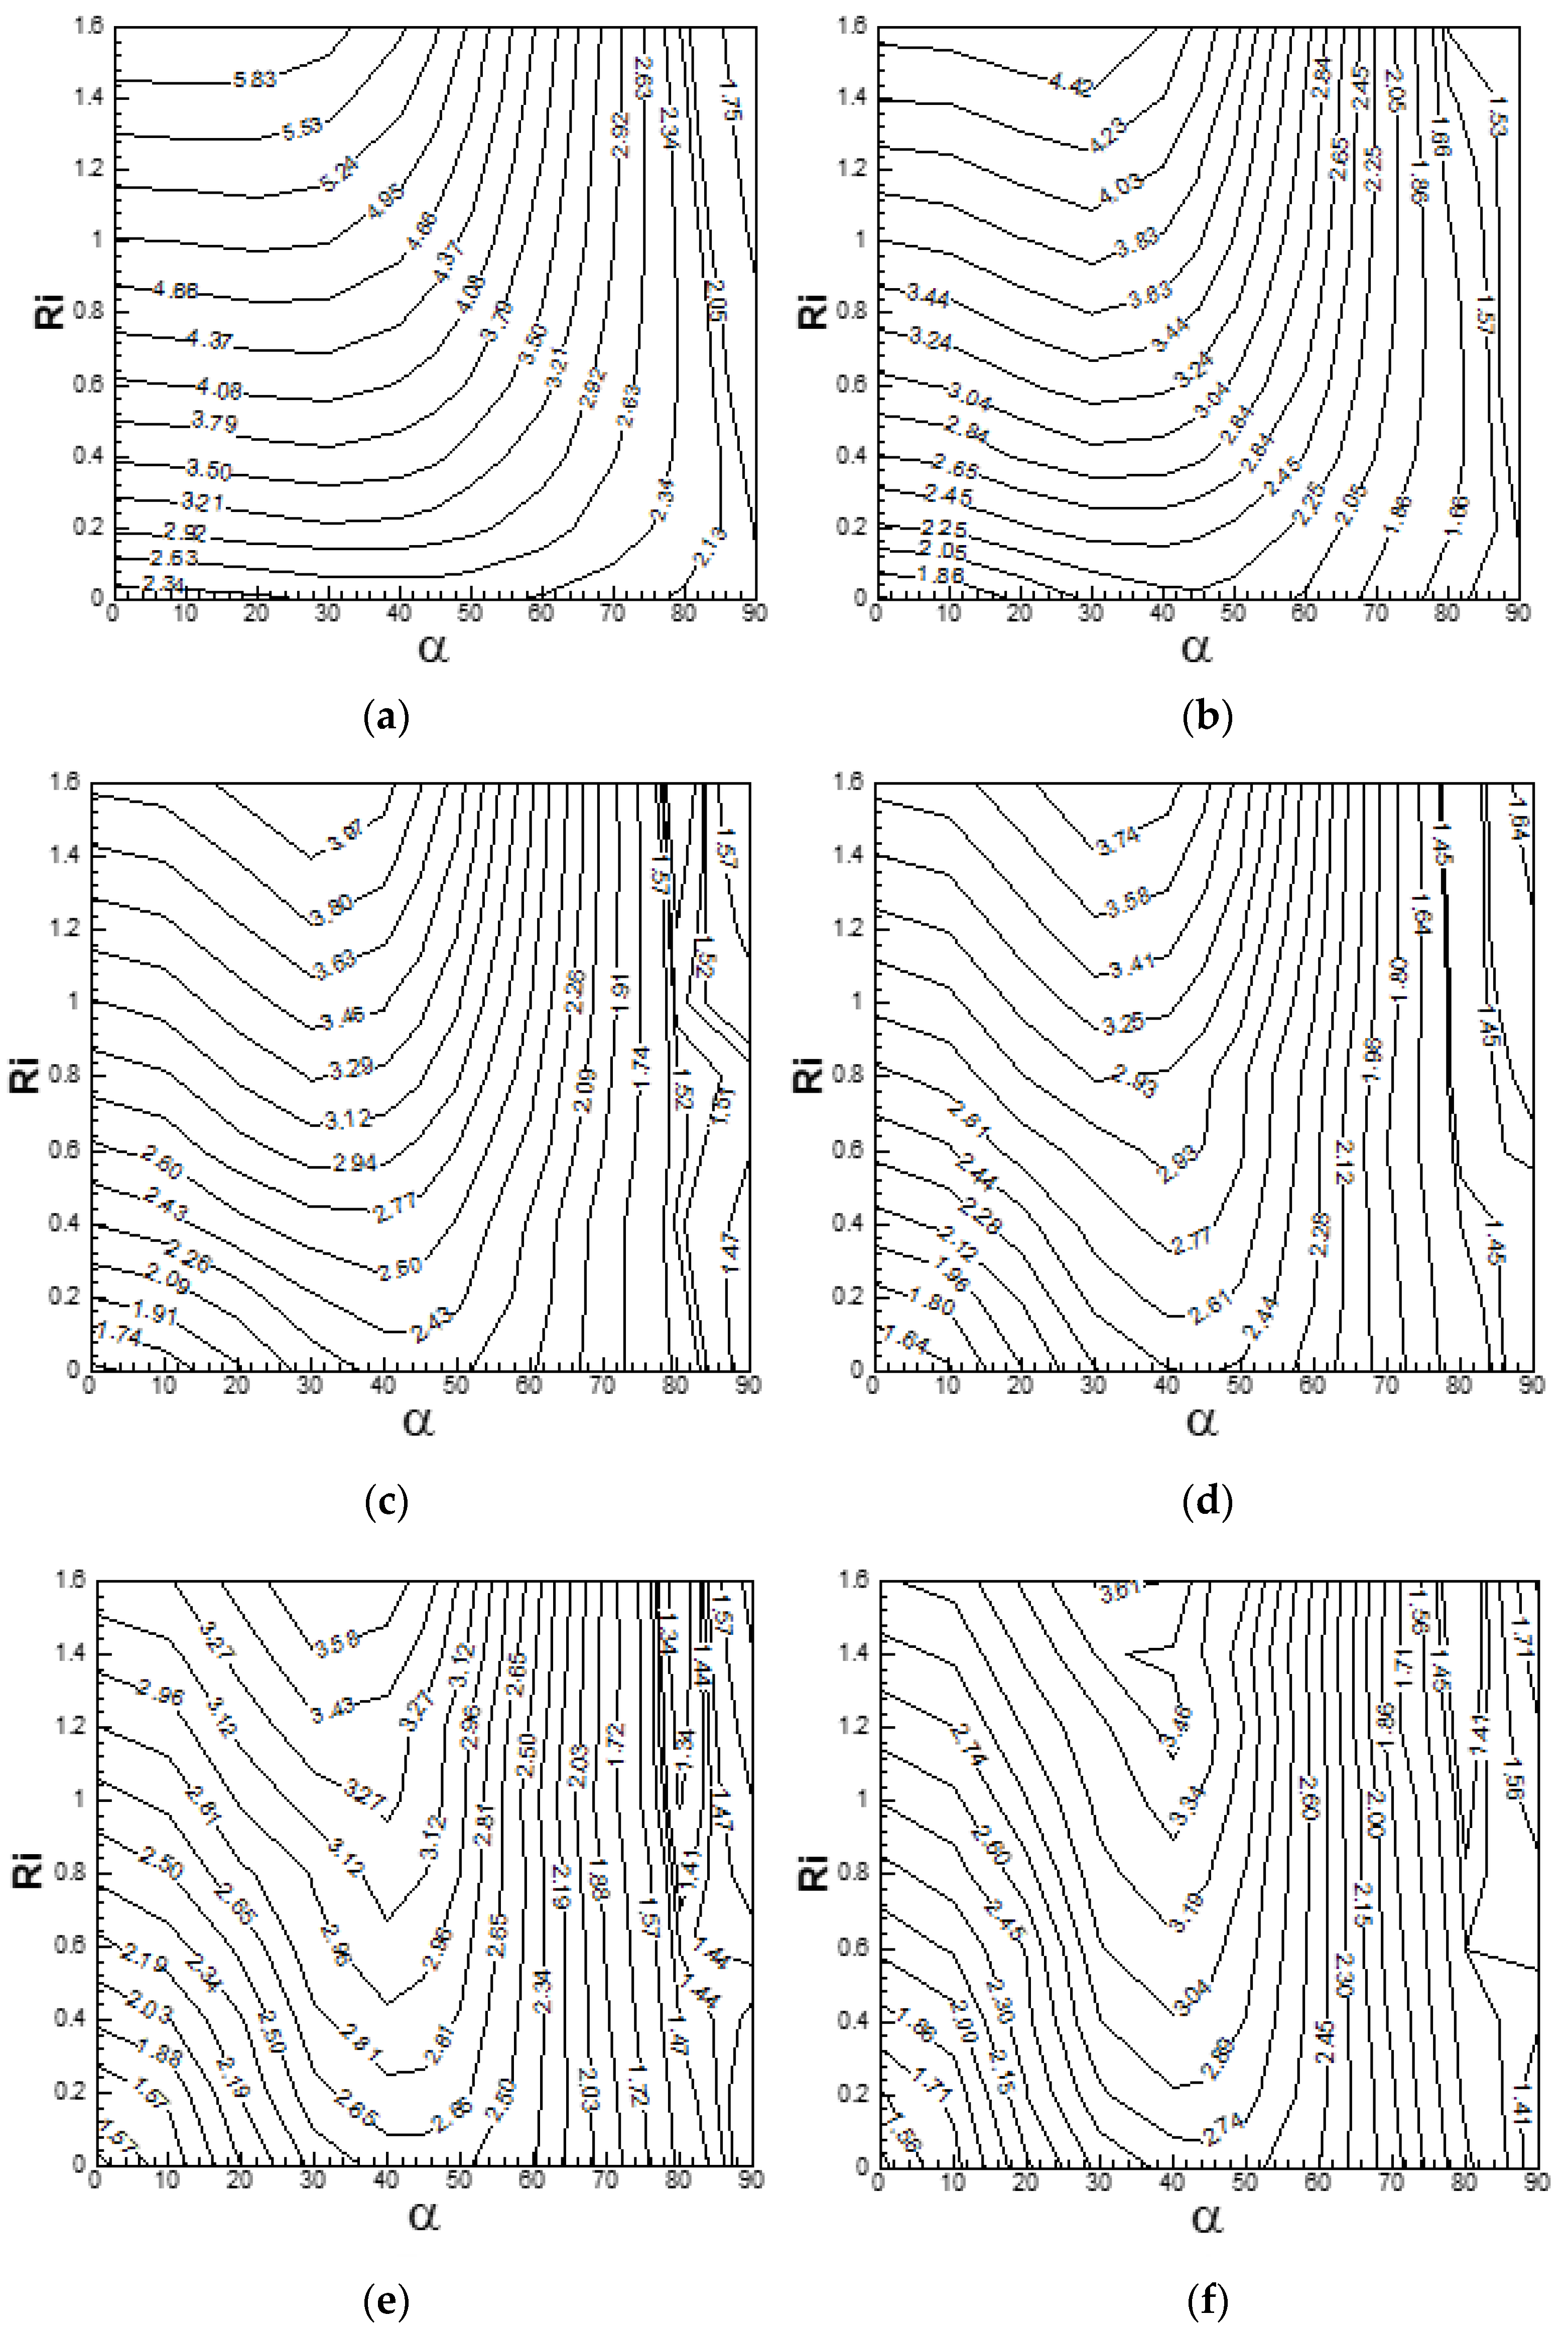
  • In the mixed-flow regime, the ratio N u ¯ ( R i , α ) / N u ¯ ( 0 , α ) for a given Re is found to increase with an increase in Ri at α = 0°. For Re = 100, the ratio increases to 31.94%, 11.31%, 08.38%, 08.30% and 08.23% at α = 0°, 30°, 45°, 60° and 90°, respectively, as Ri is increased to 1.6. The percentage change in the ratio N u ¯ ( R i , α ) / N u ¯ ( 0 , α ) for the entire range of Re is found to be 14.07%, 14.13%, 11.74% and 10.62% at α = 30°, 45°, 60° and 90°, respectively, at a fixed value of Ri = 1.6;
  • From the contour maps of mean/steady drag coefficient C ¯ D and Nusselt number N u ¯ it is possible to identify the ranges of parameters (α, Ri) that can yield a relatively high mean/steady heat transfer rate accompanied by relatively low values of mean/steady drag coefficient. Such a scenario is possible for [70° ≤ α ≤ 90°, 0 ≤ Ri ≤ 1.6] and for any Re [ 20 , 120 ] .

Author Contributions

R.A.: Data curation; Formal analysis; Methodology; Software; Validation; Visualization; Roles/Writing –; N.H.: Conceptualization; Formal analysis; Investigation; Methodology; Supervision; Roles/Writing – original draft. All authors have read and agreed to the published version of the manuscript.

Funding

This research received no external funding.

Institutional Review Board Statement

Not applicable.

Informed Consent Statement

Not applicable.

Data Availability Statement

Data available on request due to restrictions eg privacy or ethical.

Conflicts of Interest

The authors declare no conflict of interest.

References

  1. Turki, S.; Abbassi, H.; Nasrallah, S.B. Two-dimensional laminar fluid flow and heat transfer in a channel with a built-in heated square cylinder. Int. J. Ther. Sci. 2003, 42, 1105–1113. [Google Scholar] [CrossRef]
  2. Sharma, A.; Eswaran, V. Effect of aiding and opposing buoyancy on the heat and fluid flow across a square cylinder at Re = 100. Nume. Heat Trans. Part A 2004, 45, 601–624. [Google Scholar] [CrossRef]
  3. Bhattacharyya, S.; Mahapatra, S. Vortex shedding around a heated square cylinder under the influence of buoyancy. Heat Mass Trans. 2005, 41, 824–833. [Google Scholar] [CrossRef]
  4. Sharma, A.; Eswaran, V. Effect of channel-confinement and aiding/opposing buoyancy on the two-dimensional laminar flow and heat transfer across a square cylinder. Int. J. Heat Mass Trans. 2005, 48, 5310–5322. [Google Scholar] [CrossRef]
  5. Singh, S.K.; Panigrahi, P.K.; Muralidhar, K. Effect of buoyancy on the wakes of circular and square cylinders: A schlieren-interferometric study. Exp. Fluids 2007, 43, 101–123. [Google Scholar] [CrossRef]
  6. Perng, S.-W.; Wu, H.-W. Buoyancy-aided/opposed convection heat transfer for unsteady turbulent flow across a square cylinder in a vertical channel. Int. J. Heat Mass Trans. 2007, 50, 3701–3717. [Google Scholar] [CrossRef]
  7. Dhiman, A.K.; Chhabra, R.P.; Eswaran, V. Steady mixed convection across a confined square cylinder. Int. Comm. Heat Mass Trans. 2008, 35, 47–55. [Google Scholar] [CrossRef]
  8. Kakade, A.A.; Singh, S.K.; Panigrahi, P.K.; Muralidhar, K. Schlieren investigation of the square cylinder wake: Joint influence of buoyancy and orientation. Phys. Fluids 2010, 22, 054107. [Google Scholar] [CrossRef]
  9. Chatterjee, D. Triggering vortex-shedding by superimposed thermal buoyancy around bluff obstacles in cross-flow at low Reynolds numbers. Nume. Heat Trans. Part A 2012, 61, 800–806. [Google Scholar] [CrossRef]
  10. Chatterjee, D.; Mondal, B. Effect of thermal buoyancy on the two-dimensional upward flow and heat transfer around a square cylinder. Heat Trans. Eng. 2012, 33, 1063–1074. [Google Scholar] [CrossRef]
  11. Dhiman, A.; Sharma, N.; Kumar, S. Buoyancy-aided momentum and heat transfer in a vertical channel with a built-in square cylinder. Int. J. Sust. Energy 2013, 33, 963–984. [Google Scholar] [CrossRef]
  12. Yang, G.; Wu, J. Effect of side ratio and aiding/opposing buoyancy on the aerodynamic and heat transfer characteristics around a rectangular cylinder at low Reynolds numbers. Nume. Heat Trans. Part A 2013, 64, 1016–1037. [Google Scholar] [CrossRef]
  13. Sivakumar, S.; Nirmalkar, N.; Chhabra, R.P. Effect of orientation on mixed convection from a heated square bar in Newtonian and power-law fluids. Nume. Heat Trans. Part A 2014, 65, 435–460. [Google Scholar] [CrossRef]
  14. Islam, S.U.; Rahman, H.; Abbasi, W.S.; Shahina, T. Lattice boltzmann study of wake structure and force statistics for various gap spacings between a square cylinder with a detached flat plate. Arabian J. Sci. and Eng. 2015, 40, 2169–2182. [Google Scholar] [CrossRef]
  15. Rastan, M.R.; Sohankar, A.; Alam, M.M. Flow control over a square cylinder using attached rigid and flexible splitter plate at intermediate flow regime. Phys. Fluids 2017, 29, 103601. [Google Scholar] [CrossRef]
  16. Dey, P.; Das, A.K. Analysis of fluid flow and heat transfer characteristics over a square cylinder: Effect of corner radius and nanofluid volume fraction. Arabian J. Sci. and Eng. 2017, 42, 1687–1698. [Google Scholar] [CrossRef]
  17. Bensedira, S.; El-hadj, A.A.; Semmar, D.; Messaoudene, N.A. Dynamic analysis of flow around two side-by-side cylinders near a wall. Arabian J. Sci. and Eng. 2018, 43, 4531–4540. [Google Scholar] [CrossRef]
  18. Wang, Y.Q. Effects of Reynolds number on vortex structure behind a surface-mounted finite square cylinder with AR = 7. Phys. Fluids 2019, 31, 115103. [Google Scholar] [CrossRef]
  19. Islam, S.U.; Ullah, N.; Zhou, C.Y. Fluid dynamics of flow around side-by-side arranged cylinders. Arabian J. Sci. and Eng. 2020, 45, 5907–5923. [Google Scholar] [CrossRef]
  20. Abdelhamid, M.M.A.T.; Sohankar, A. Effect of cylinder corner radius and attack angle on heat transfer and flow topology. Int. J. Mech. Sci. 2020, 175, 105566. [Google Scholar]
  21. Rashid, A.; Hasan, N. Steady and unsteady flow regimes in two-dimensional mixed convective flow of air past a heated square cylinder. Int. J. Mech. Sci. 2020, 175, 105533. [Google Scholar]
  22. Zafar, F.; Alam, M.M. Mixed convection heat transfer from a circular cylinder submerged in wake. Int. J. Mech. Sci. 2000, 183, 105733. [Google Scholar] [CrossRef]
  23. Rashid, A.; Anshumaan, S. Numerical study of fluid dynamics and heat transfer characteristics for the flow past a heated square cylinder. Jordan J. Mech. Ind. Eng. 2021, 15, 357–376. [Google Scholar]
  24. Abbasi, W.S.; Naheed, A.; Islam, S.U.; Rahman, H. Investigation of Optimum Conditions for Flow Control Around Two Inline Square Cylinders. Arabian J. Sci. Eng. 2021, 46, 2845–2864. [Google Scholar] [CrossRef]
  25. Sohankar, A.M.A.; Alam, M.M. Flow over rectangular cylinder: Effects of cylinder aspect ratio and Reynolds number. Int. J. Mech. Sci. 2021, 195, 106264. [Google Scholar]
  26. Arif, M.R.; Hasan, N. Effect of free-stream inclination and buoyancy on flow past a square cylinder in large-scale heating regime. Phys. Fluids 2021, 33, 073601. [Google Scholar] [CrossRef]
  27. Tritton, D.J. Physical fluid dynamics. ELBS Edi. Chap. 1979, 13, 127–130. [Google Scholar]
  28. Rhie, C.M.; Chow, W.L. Numerical study of the turbulent flow past an airfoil with trailing edge separation. AIAA J. 1983, 21, 1525–1532. [Google Scholar] [CrossRef]
  29. Amsden, A.A.; Harlow, F.H. The SMAC Method: A Numerical Technique for Calculating Incompressible Fluid Flows; Los Alamos Scientific Report; Los Alamos Scientific Lab.: Los Alamos, NM, USA, 1970; p. LA 4370. [Google Scholar]
  30. Cheng, L.; Armfield, S. A simplified marker and cell method for unsteady flows on non-staggered grids. Int. J. Nume. Meth. Fluids 1995, 21, 15–34. [Google Scholar] [CrossRef]
  31. Kim, S.W.; Benson, T.J. Comparison of the SMAC, PISO and iterative time advancing schemes for unsteady flows. Compt. Fluids 1992, 21, 435–454. [Google Scholar] [CrossRef] [Green Version]
  32. Kuwahara, K. Unsteady flow simulation and its visualization. In Proceedings of the 30th AIAA Fluid Dynamics Conference AIAA, Norfolk, VA, USA, 28 June–1 July 1999. [Google Scholar] [CrossRef]
  33. Hasan, N.; Sanghi, S. The dynamics of two-dimensional buoyancy driven convection in a horizontal rotating cylinder. J. Heat Trans. 2004, 126, 963–984. [Google Scholar] [CrossRef]
  34. Hasan, N.; Anwer, S.F.; Sanghi, S. On the outflow boundary condition for external incompressible flows: A new approach. J. Compu. Phys. 2005, 206, 661–683. [Google Scholar] [CrossRef]
  35. Gresho, P.M. Incompressible fluid dynamics: Some fundamental formulation issue. Annu. Rev. Fluid Mech. 1991, 23, 413–454. [Google Scholar] [CrossRef]
  36. Hasan, N.; Rashid, A. Vortex-shedding suppression in two-dimensional mixed convective flows past circular and square cylinders. Phys. Fluids 2013, 22, 053603. [Google Scholar] [CrossRef]
  37. Sohankar, A.; Norberg, C.; Davidson, L. Low-Reynolds-number flow around a cylinder at incidence: Study of blockage, onset of vortex shedding and outlet boundary condition. Int. J. Nume. Meth. Fluids 1998, 26, 39–56. [Google Scholar] [CrossRef]
  38. Ranjan, R.; Dalal, A.; Biswas, G. A numerical study of fluid flow and heat transfer around a square cylinder at incidence using unstructured grids. Nume. Heat Trans. Part A 2008, 54, 890–913. [Google Scholar] [CrossRef]
Figure 1. Geometry of the proposed problem in a two-dimensional framework.
Atmosphere 14 00022 g001
Figure 2. (a) Structure of the grid (241 × 258) in the physical (x-y) plane and (b) magnified view of the grid near the cylinder surface.
Atmosphere 14 00022 g002
Figure 3. Instantaneous streamline patterns at α = 45°, Ri = 0 and 40 ≤ Re ≤ 120 for five successive moments of time that span the whole period.
Atmosphere 14 00022 g003
Figure 4. Instantaneous contours of vorticity for the conditions (α = 45°, Ri = 0 and 40 ≤ Re ≤ 120) for five successive moments of time that span the whole period.
Atmosphere 14 00022 g004
Figure 5. Instantaneous streamline patterns in the vicinity of the square cylinder for 40 ≤ Re ≤ 120, 30° ≤ α ≤ 60° at Ri = 0.
Atmosphere 14 00022 g005
Figure 6. Instantaneous contours of vorticity for 30° ≤ α ≤ 60°, 40 ≤ Re ≤ 120 at Ri = 0.
Atmosphere 14 00022 g006
Figure 7. Instantaneous streamline patterns in the vicinity of the square cylinder for the conditions (α = 90°, 40 ≤ Re ≤ 120 and 0.6 ≤ Ri ≤ 1.4) in the same phase of the shedding cycle.
Atmosphere 14 00022 g007
Figure 8. Instantaneous contours of vorticity at α = 90°, 40 ≤ Re ≤ 120 and 0.6 ≤ Ri ≤ 1.4 around the square cylinder in the same phase of the shedding cycle.
Atmosphere 14 00022 g008
Figure 9. Steady state streamline patterns at (α = 30°, 20 ≤ Re ≤ 120 and 1.2 ≤ Ri ≤ 1.6).
Atmosphere 14 00022 g009
Figure 10. Steady state contours of vorticity for (20 ≤ Re ≤ 120 and 1.2 ≤ Ri ≤ 1.6) at α = 30°.
Atmosphere 14 00022 g010
Figure 11. St-α and St-Ri characteristics at (a) Ri = 0, 40 ≤ Re ≤ 120 for 0° ≤ α ≤ 90° and (bf) at 0 ≤ Ri ≤ 1.6, 40 ≤ Re ≤ 120 for 30° ≤ α ≤ 90°.
Atmosphere 14 00022 g011
Figure 12. Variation of mean pressure along the surface (ξ) of the cylinder for the condition (20 ≤ Re ≤ 120, 0° ≤ α ≤ 70° at Ri = 0, 0.8, 1.6).
Atmosphere 14 00022 g012
Figure 13. Mean/steady streamline pattern at α = 45° for Re = 20, 60 and 100 at (a) Ri = 0 and (b) Ri = 1.6.
Atmosphere 14 00022 g013
Figure 14. Mean vorticity along the surface of cylinder at 20 ≤ Re ≤ 120, 0 ≤ Ri ≤ 1.6 and 0° ≤ α ≤ 70°.
Atmosphere 14 00022 g014
Figure 15. Lift and drag coefficients vs. non-dimensional time at Re = 40, Ri = 0 and 30° ≤ α ≤ 60°.
Atmosphere 14 00022 g015
Figure 16. Temporal variation of lift coefficient for the conditions (Ri = 0.2, 60 ≤ Re ≤ 120 and 30° ≤ α ≤ 60°).
Atmosphere 14 00022 g016
Figure 17. Variation of drag coefficient with non-dimensional time for 60 ≤ Re ≤ 120 and 30° ≤ α ≤ 60° at Ri = 0.2.
Atmosphere 14 00022 g017
Figure 18. Pressure along the surface of cylinder at α = 45°, Ri = 0.2 and 60 ≤ Re ≤ 120 for five successive moments of time that span over the whole period.
Atmosphere 14 00022 g018
Figure 19. Mean pressure and mean vorticity along the surface of the cylinder for 60 ≤ Re ≤ 120 and 30° ≤ α ≤ 60° at Ri = 0.2.
Atmosphere 14 00022 g019
Figure 20. Temporal variation of lift coefficient in the forced and mixed convective flow regime at a free-stream orientation of 45°, 0 ≤ Ri ≤ 0.4 and 60 ≤ Re ≤ 120.
Atmosphere 14 00022 g020
Figure 21. Variation of coefficient of drag with non-dimensional time for the conditions (α = 45°, 0 ≤ Ri ≤ 0.4 and 60 ≤ Re ≤ 120).
Atmosphere 14 00022 g021
Figure 22. Mean surface pressure profiles at 60 ≤ Re ≤ 120, 0 ≤ Ri ≤ 0.4 and α = 45°.
Atmosphere 14 00022 g022
Figure 23. Time mean lift coefficient vs. Richardson number for the conditions (20 ≤ Re ≤ 120, 0° ≤ α ≤ 90° and 0 ≤ Ri ≤ 1.6) (— — — — steady flow, Atmosphere 14 00022 i001 unsteady flow).
Atmosphere 14 00022 g023
Figure 24. Mean/steady streamline patterns for 60 ≤ Re ≤ 120, Ri = 0.2 and 1.6 at α = 45°.
Atmosphere 14 00022 g024
Figure 25. Variation of the mean/steady coefficient of moment with Richardson number at 20 ≤ Re ≤ 120, 0° ≤ α ≤ 90° and 0 ≤ Ri ≤ 1.6 (— — — — steady flow, Atmosphere 14 00022 i001 unsteady flow).
Atmosphere 14 00022 g025
Figure 26. Mean/steady streamline patterns for Re = 20 and 120, 0° ≤ α ≤ 90° at Ri = 1.6.
Atmosphere 14 00022 g026
Figure 27. Variation of the mean/steady drag coefficient with free-stream orientation for the conditions (Ri = 0, 20 ≤ Re ≤ 120 and 0° ≤ α ≤ 90°).
Atmosphere 14 00022 g027
Figure 28. Variation in the ratio of the mean/steady drag coefficient ( C ¯ D / ( C ¯ D ) R i = 0.0 ) with Richardson number at 20 ≤ Re ≤ 120, 0° ≤ α ≤ 90° and 0 ≤ Ri ≤ 1.6 (— — — — steady flow, Atmosphere 14 00022 i001 unsteady flow).
Atmosphere 14 00022 g028
Figure 29. Variation of steady/mean pressure along the surface of cylinder at α = 90°, Ri = 0 and 1.2 and 20 ≤ Re ≤ 120.
Atmosphere 14 00022 g029
Figure 30. (a) Variation of the mean/steady Nusselt number with free-stream orientation for Ri = 0, 20 ≤ Re ≤ 120, 0° ≤ α ≤ 90° and (b) Time mean local Nusselt number along the surface of cylinder for α = 0°, Ri = 0, 20 ≤ Re ≤ 120.
Atmosphere 14 00022 g030
Figure 31. Variation of time mean Nusselt number ( N u ¯ / ( N u ¯ ) R i = 0.0 ) as a function of Richardson number for 20 ≤ Re ≤ 120, 0° ≤ α ≤ 90° and 0 ≤ Ri ≤ 1.6 (— — — — steady flow, Atmosphere 14 00022 i001 unsteady flow).
Atmosphere 14 00022 g031
Figure 32. Variation in the local Nusselt number along the cylinder surface for the conditions (α = 0°, Ri = 0 and 1.0, 20 ≤ Re ≤ 120).
Atmosphere 14 00022 g032
Figure 33. Variation of local Nusselt number along the surface of the cylinder at α = 45°, 20 ≤ Re ≤ 120 and Ri = 0 and 1.0.
Atmosphere 14 00022 g033
Figure 34. Contour maps of mean/steady drag coefficient ( C ¯ D ) in α—Ri plane at (a) Re = 20, (b) Re = 40, (c) Re = 60, (d) Re = 80, (e) Re = 100 and (f) Re = 120.
Atmosphere 14 00022 g034
Figure 35. Contour map of the mean/steady Nusselt number ( N u ¯ ) in α—Ri plane at (a) Re = 20, (b) Re = 40, (c) Re = 60, (d) Re = 80, (e) Re = 100 and (f) Re = 120.
Atmosphere 14 00022 g035
Table 1. Comparison of CL,r.m.s, CD (time mean), Nu (time mean) and St for square cylinder at Ri = 0, Re = 100, α = 0° and Pr = 0.71.
ParametersSharma and Eswaran [2]Sohankar et al. [37]Ranjan et al. [38]Present
CL,rms0.1830.1390.1900.175
CD (time mean)1.5591.4601.4491.438
Nu (time mean)4.070-4.1244.051
St0.1480.1460.1450.143
Table 2. Mean lift and drag coefficients, Strouhal number (St) and mean Nusselt number ( N u ¯ ) for 40 ≤ Re ≤ 120, 0° ≤ α ≤ 60° and 0 ≤ Ri ≤ 0.4.
Reynolds Number (Re)Free-Stream
Orientation (α)
Richardson Number (Ri) C ¯ L C ¯ D St N u ¯
30°0−5.5705 × 10−22.07950.10262.7245
4045°04.2002 × 10−22.20720.10282.7782
60°00.13552.02740.10282.7640
0−1.4203 × 10−31.52750.12063.2128
6030°0.2−0.31932.41010.13453.4517
45°02.7197 × 10−22.32190.11953.4411
45°0.2−0.17222.53140.13123.5082
45°0.4−0.39192.69150.14203.5460
60°0.2−0.10642.18860.12933.4491
0−1.3655 × 10−31.47120.13383.6471
8030°0.2−0.30612.49650.14384.0371
45°02.2897 × 10−22.45240.13004.0069
45°0.2−0.15582.64950.14094.0888
45°0.4−0.33412.79570.15044.1508
60°0.2−6.7151 × 10−22.28650.13944.0381
0−1.0942 × 10−31.43800.14324.0511
10030°0.2−0.28412.60900.15084.5526
45°01.9272 × 10−22.57630.13774.5124
45°0.2−0.15702.76510.14814.6026
45°0.4−0.32852.89610.15624.6722
60°0.2−6.7827 × 10−22.39870.14644.5625
0−4.1067 × 10−41.42120.14924.4162
12030°0.2−0.24182.71840.15605.0199
45°09.6314 × 10−32.67400.14304.9684
45°0.2−0.17212.86630.15315.0658
45°0.4−0.34892.98880.16105.1373
60°0.2−0.11422.51180.15155.0137
Disclaimer/Publisher’s Note: The statements, opinions and data contained in all publications are solely those of the individual author(s) and contributor(s) and not of MDPI and/or the editor(s). MDPI and/or the editor(s) disclaim responsibility for any injury to people or property resulting from any ideas, methods, instructions or products referred to in the content.

