Article

An Experimental Method for Evaluating Ammonia Emission Rates of Bio-Curtain

Animal Environment Division, Department of Animal Biotechnology and Environment, National Institute of Animal Science (NIAS), Rural Development Administration (RDA), Wanju-gun, Jeonju 55365, Republic of Korea
*
Author to whom correspondence should be addressed.
Atmosphere 2023, 14(1), 127; https://doi.org/10.3390/atmos14010127
Submission received: 16 November 2022 / Revised: 26 December 2022 / Accepted: 2 January 2023 / Published: 6 January 2023
(This article belongs to the Special Issue Ammonia Emission and Particulate Matter)

Abstract

:
Bio-curtain (i.e., curtain) is a permeable cover equipped with a spraying system for ammonia (NH3) control in a swine facility. Previous studies investigated the NH3 reduction effects primarily based on concentration units. It is challenging to determine the actual efficiency because of the large amount of air discharged through the large surface of the curtain, and external wind rapidly dilutes and disperses the exhausted air. Therefore, this study investigates a technique to evaluate the NH3 reduction effect of the curtain in terms of emission rate. We constructed a metallic cover with a single hole around the curtain to gather the air discharged through it. The NH3 reduction effect was calculated by comparing the NH3 emission rate that was monitored in the barn exhaust fan and at the single hole of metallic cover during the non-spray and spray treatments inside the curtain at the maximum and minimum operating rate of the barn’s exhaust fan. NH3 emission rates declined both non-spray and spray at the minimum operation rate of the barn exhaust fan, but the reduction effect was higher in spray conditions than non-spray. Accumulating NH3-absorbed water inside the curtain under the low ventilation of the exhaust fan caused these circumstances.

1. Introduction

The odor emission from the swine facilities has become a major source of environmental pollution and social nuisance. Volatile fatty acids (VFAs), phenol compounds, indole compounds, ammonia (NH3), and volatile sulfur compounds are the primary odorous substances. Among these, ammonia is the odorous compound remaining in high concentrations [1,2,3] and has the characteristics of high solubility in water [4,5]. In swine farms, water, microbial additive, deodorant, etc. spraying on the inside and outside air of the facilities is a method to control emissions by adsorption and dissolution of NH3 [6,7]. The mist spraying device is also installed inside Bio-curtain (i.e., curtain) of a light shielding cover. The curtain is a known technique for reducing odor emission from swine facilities’ surroundings [8]. Compared to other odor-reduction techniques, many swine farmers preferred because of inexpensive and simple to install [9]. Most of the previous studies on the curtain’s odor reduction effect evaluated the reduction rate of the NH3 concentration at a specific point outside the curtain multiple times [8,9,10]. However, it is challenging to determine the accurate odor concentration in the released air outside the curtain on the dilution and rapid dispersion by external winds around the curtain. As the growing awareness emphasizes the significance of accurate emission measurement, therefore, it is essential to determine, how to evaluate the effectiveness of any NH3 reduction processes [11,12,13].
Therefore, to avoid the free release of the air and investigate the emission precisely, we installed a leak proof metallic cover covering the curtain to reduce the impact of external wind. Furthermore, a single air outlet hole on the front side of the metallic cover installed to measure the ventilation rate and odor concentrations discharged from the curtain in real time. Using this process, we have tried to evaluate the NH3 reduction effect of the curtain in the viewpoint of emission rate reflecting ventilation rate rather than the conventional concentration.

2. Materials and Methods

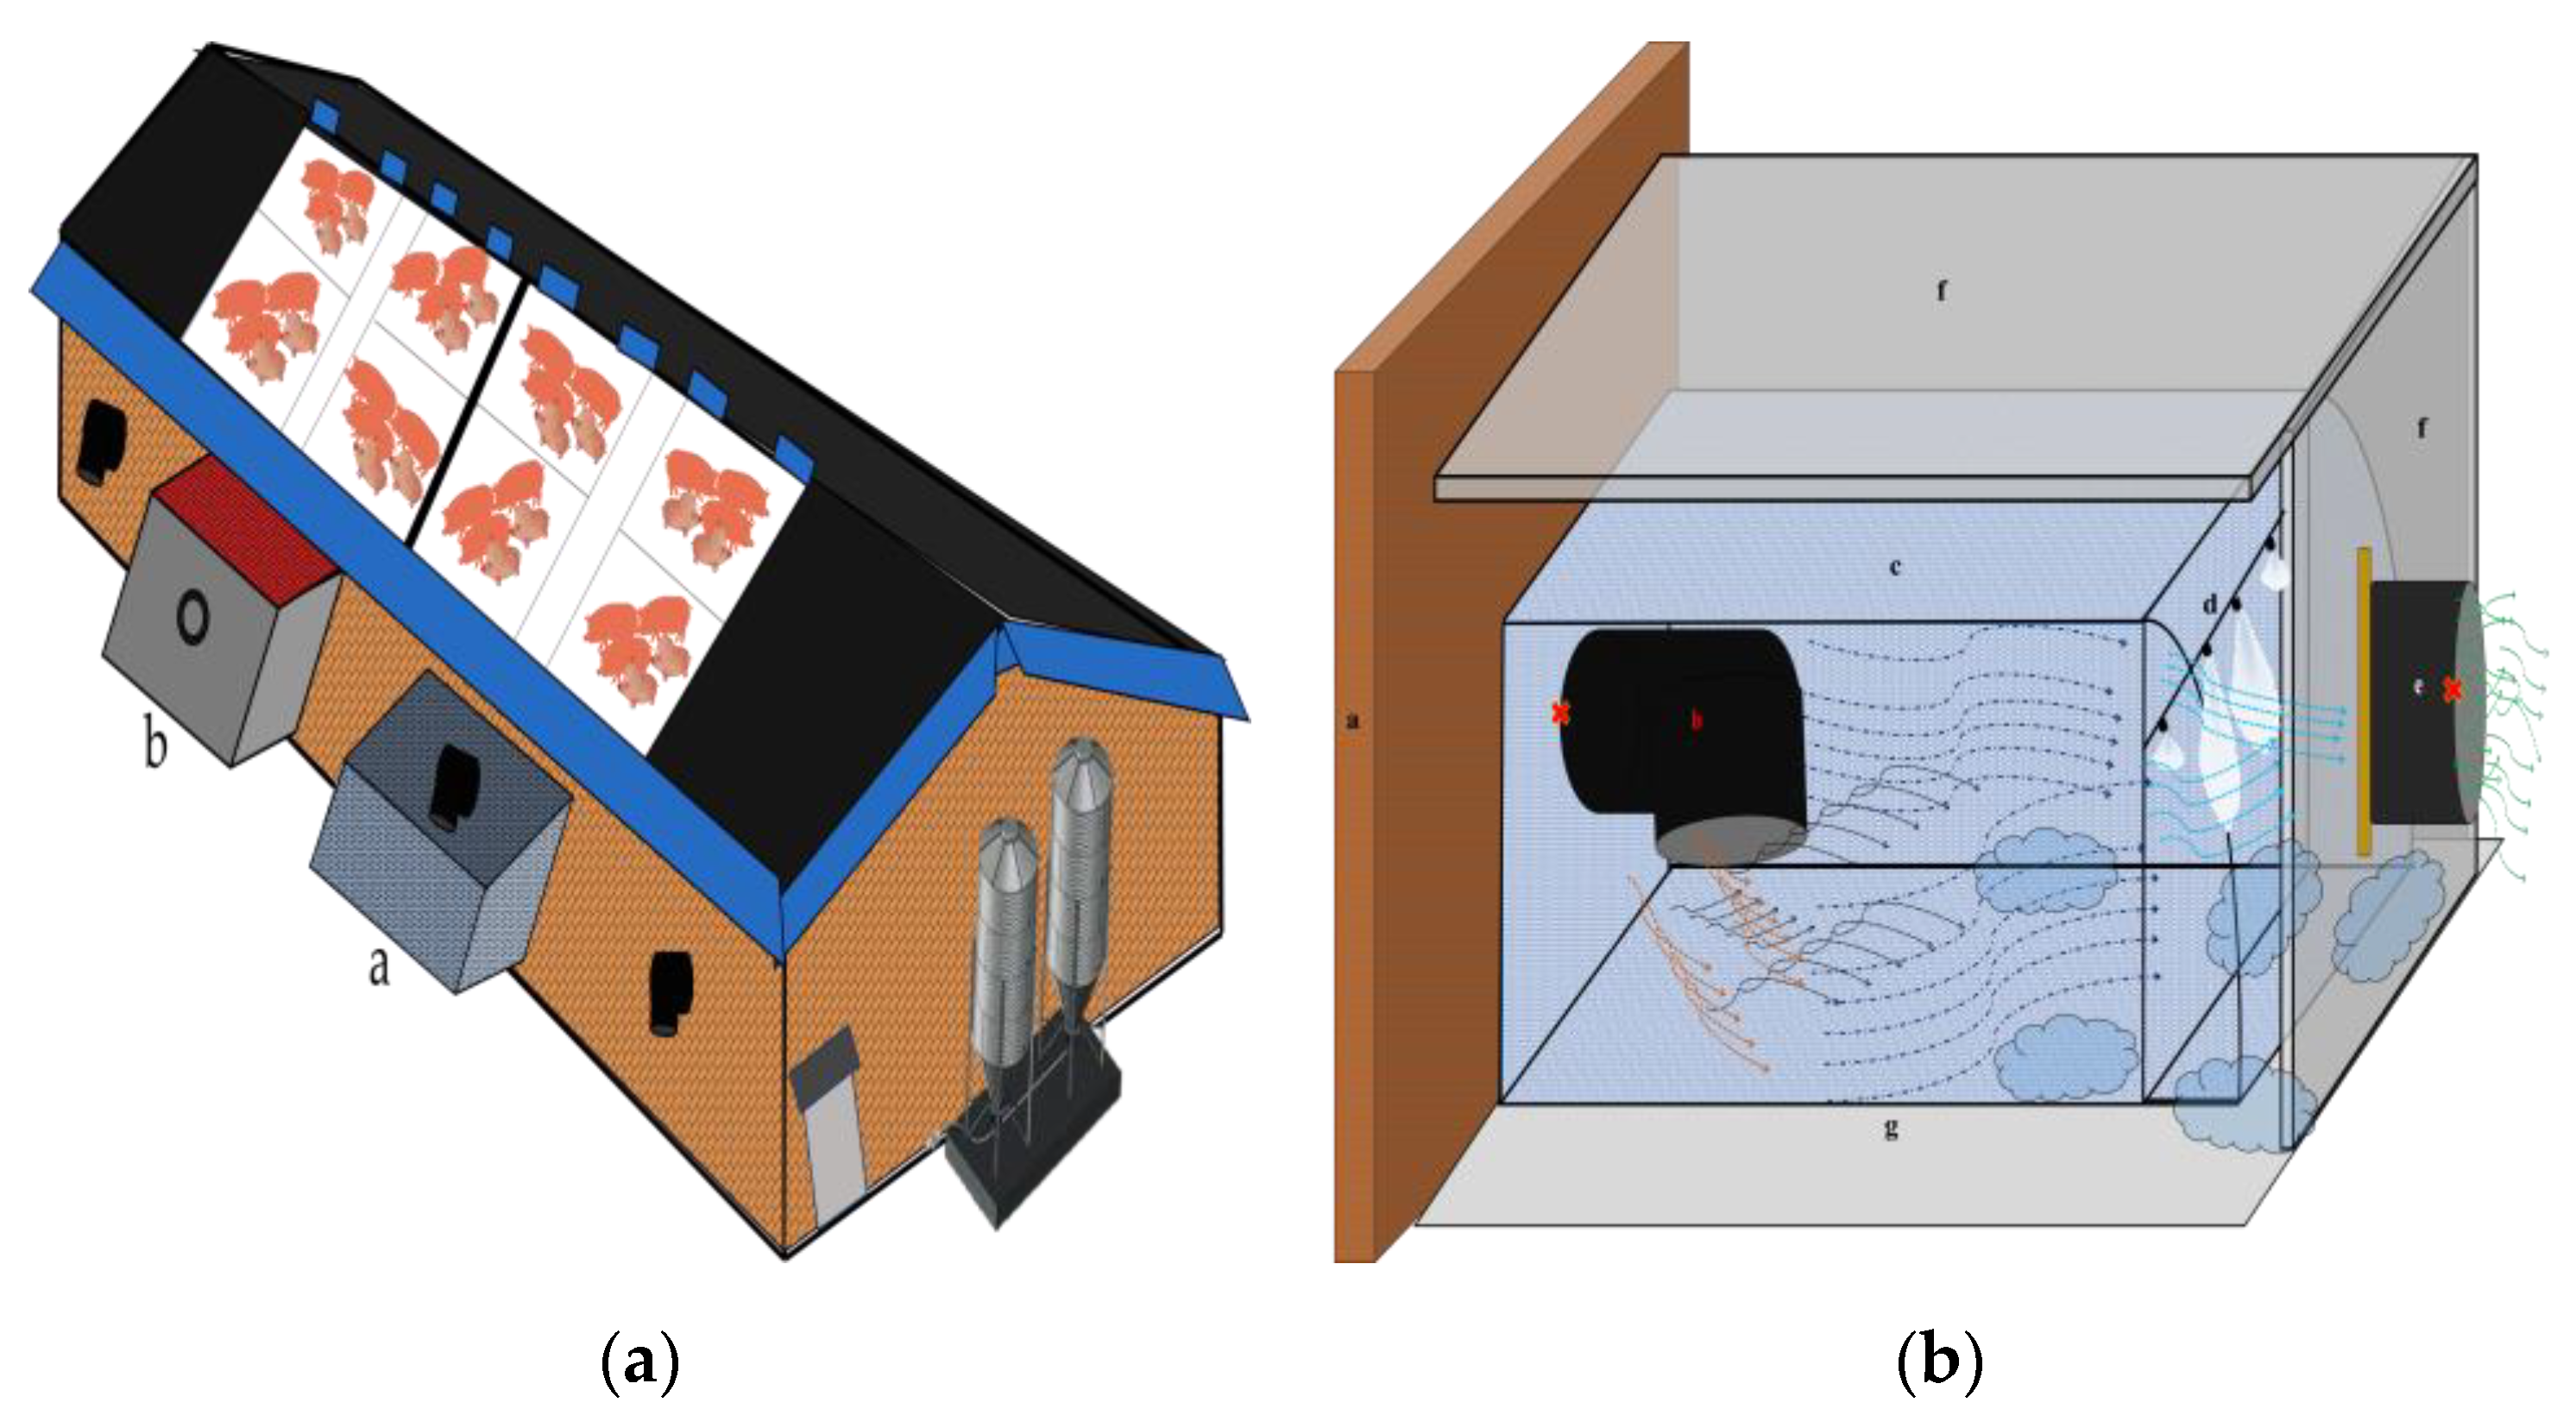
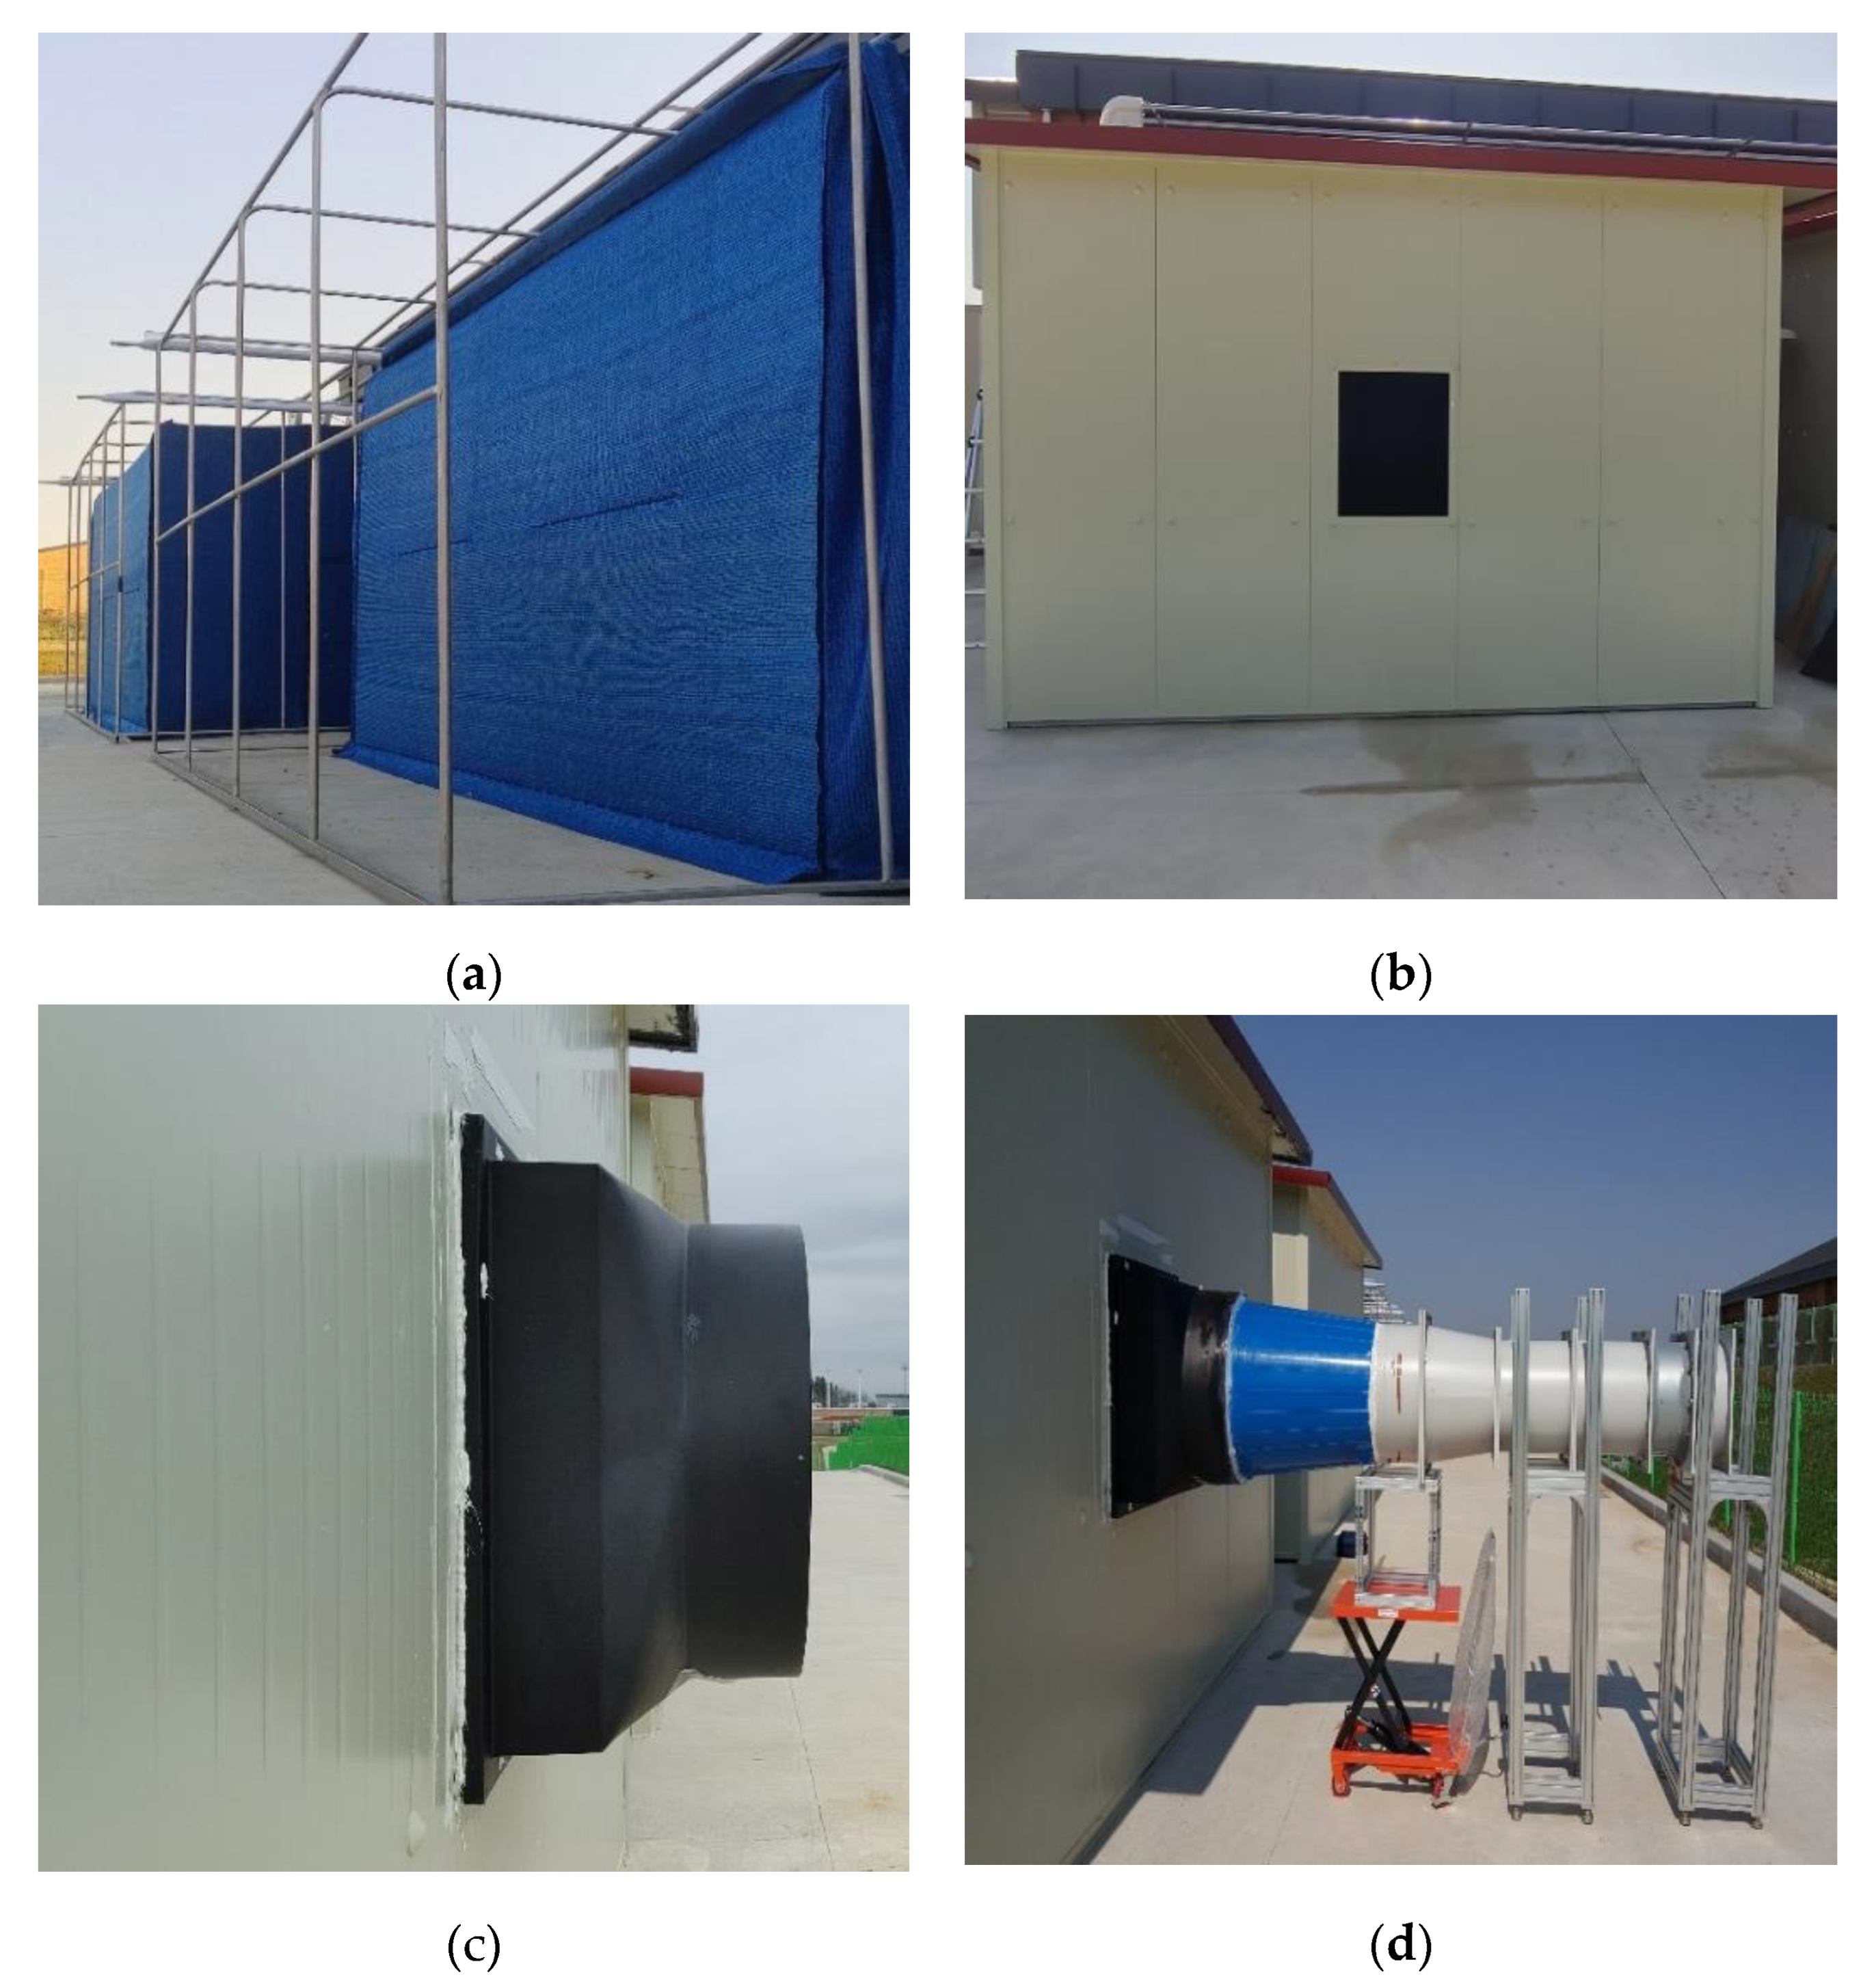
2.1. Swine Facility and the Curtain

This study was conducted at an experimental confined swine facility with a mechanical ventilation system in the National Institute of Animal Science of Rural Development Administration, Wanju-gun, Jeollabuk-do, Republic of Korea. The ventilation system of the facility consists of a side air inlet through the building corridor and air ventilated through a 630 mm exhaust fan (model COCO-630A, Dongsung CoCofan. Ltd., Hwaseong-si, Gyeonggi-do, Republic of Korea) on the side wall (Figure 1). The curtain was constructed outside of an 8 m × 7 m dimensional animal barn with a concrete slated floor, where a total of 48 finisher pigs (average body weight 93 kg) were reared during this study period. The curtain cover was made of two layers of permeable geotextile fabric stretched over a rectangular-shaped aluminum pipe frame (H: 2.6 m × W: 4.7 m × L: 3.1 m) (Figure 2a). The distance from the barn’s exhaust fan to the curtain was 1.8 m on the front sides, and the gap between the curtain and the metallic cover was 0.8 m (Figure 1b). Four spraying nozzles were installed in the upper front of the inside curtain (Figure 1b). The metallic cover with a single hole was enclosed around the curtain, and we used silicon glue to seal all gaps. This single hole was an apparatus made from an exhaust fan frame without a propeller for leading discharge air in one direction (Figure 2c).

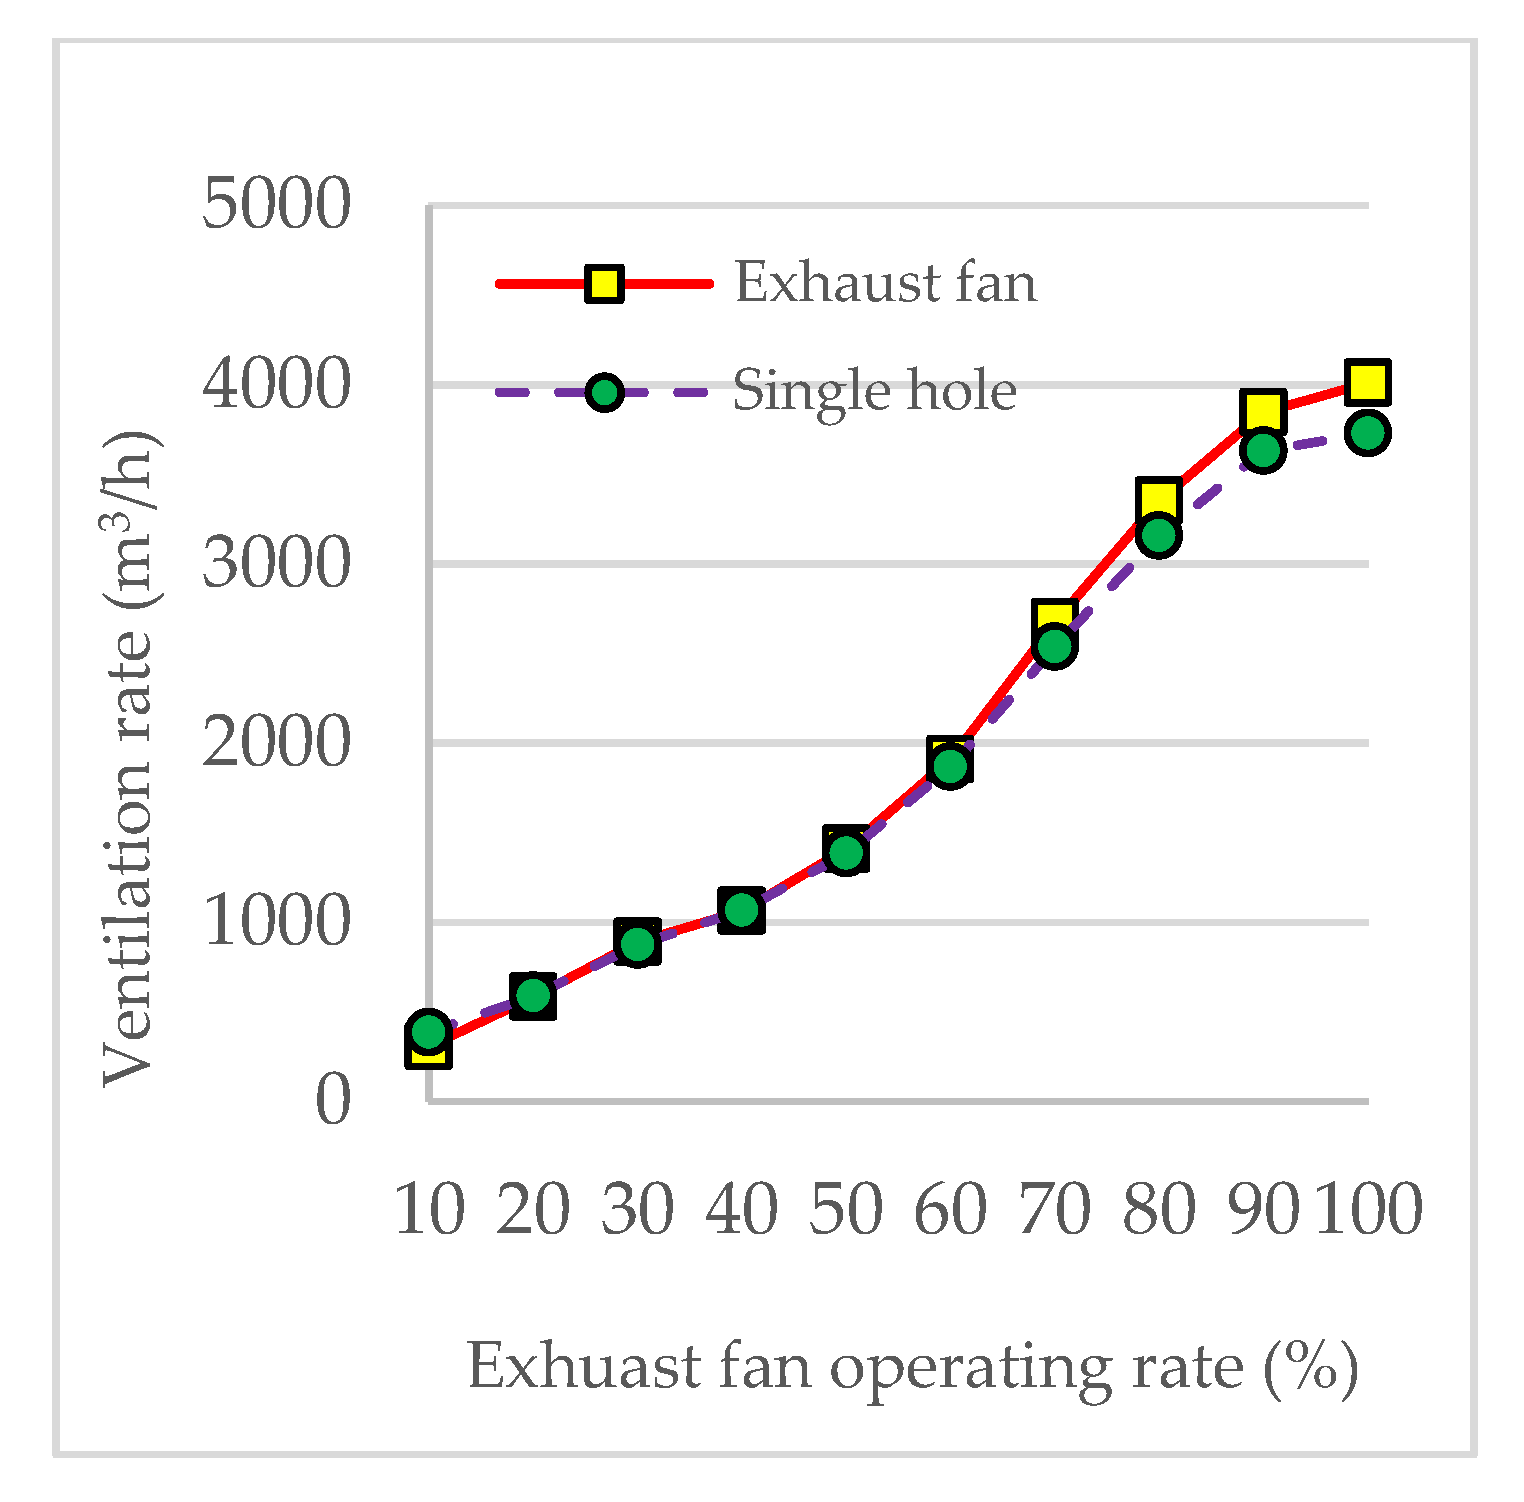
2.2. Enclosing Ability of Metallic Cover

To ensure the enclosing metallic cover, we measured the air ventilation rates discharged through the swine barn exhaust fan and the single hole of the metallic cover, according to the increased operation rate of the exhaust fan (Figure 2). The airflow measurement system was designed to meet the standards of the ASHRAE (American Society of Heating, Refrigerating and Air Conditioning Engineers) and the flow rates were measured with a micro-manometer (model: DPClaic 5825; TSI Incorporated, MN, USA). The enclosing ability of the metallic cover was evaluated as the difference in ventilation rate between the exhaust fan and the single hole.

2.3. Ammonia-Reducing Effect of Curtain

A photoacoustic infrared multi-gas monitor (INNOVA 1512) integrated with an INNOVA 1409 (12 ports, LumaSense Technologies, Ballerup, Denmark) multipoint sampler has been used for instant analysis and measurement for the NH3 concentration. The air sampling points were at the barn exhaust fan and the single hole of the metallic cover, respectively. The analyzing conditions are as follows: sample integration 5 s, measurement 50 s, and flushing time 11 s with continuous sampling runs the whole time. Before starting the experiment, these instruments were calibrated in the lab with the 99.999% N2 and NH3 standard gas. The NH3-reducing effect of the curtain was evaluated for the two experimental conditions of non-spray and spray, respectively. Ventilation conditions of both experiments were set at 100% (maximum, 3727 m3/h) and 30% (minimum, 891 m3/h) for the operating rate of the barn exhaust fan. The spray conditions were divided into three treatments based on the pause times (30 min, 10 min, and 5 min), while the spray time was 10 min. The time scale for each experiment was 24 h. The NH3 reduction was calculated as the difference in concentrations between the exhaust fan and the single hole. In addition, HOBO data loggers (UX100-011A, Onset Computer Corporation, Bourne, MA, USA) automatically log the humidity during the experimental period.

2.4. Chemical Properties of Sprayed Water

The pH, electrical conductivity (EC), total Kjeldahl nitrogen (TKN), and ammoniacal nitrogen (NH4+) were analyzed in tank water (before spraying) and sprayed water (during spraying). The sprayed water was collected from the floor inside of the curtain using a plastic tray and the inner surface of the curtain by attaching a wiping medium at the 30% operating rate of the exhaust fan. Because we could not collect the sprayed water at the higher operating rate of the exhaust fan by the reason as fallow: the water droplets were quickly removed out of the curtain by the high speed of exhaust fan. The chemical properties were measured by methods as follows: (1) electrode pH meter (Model 850C, Schott, Mainz, Germany), (2) EC (ES 04310.1c), (3) TKN (ES 04363.1a, ES 04363.3b), (4) NH4+ (ES 04355.1c, ES 04363.1a). Detailed information was reported by Hwang et al. [14].

2.5. Data Analysis

Ammonia emission rate or mass flow rate (g/h) was measured in the exhaust fan and at the single hole during the maximum (100%) and minimum (30%) ventilation, on the basis of mass balance by using the ammonia concentrations and the air flow rate (m3/h) by using Equations (1) and (2).
C NH 3   ( g / h ) = [ [ M × ( 17.03 ÷ 22.4 ) × [ 273 K ÷ ( 273 K + T ) ] mg / m 3 m 3 / h ] Q ( m 3 / h ) ] × 100
R ( % ) = [ ( C IN NH 3 C OUT NH 3 ) ÷ C IN NH 3 ] × 100
where, C NH 3 (g/h) = mass flow rate; M = NH3 concentrations (ppm); 17.03 = the atomic mass of ammonia; T = temperature (°C); 22.4 = The volume of 1 mol at 1 atmospheric pressure at 0 °C; Q (m3/h) = mean flow rate; R (%) = Reduction efficiency.

3. Results and Discussion

3.1. Enclosing Ability of Metallic Cover

The NH3 emission calculates on ventilation rate and concentration, and thus the accurate measurement of the ventilation rate is the essential factor for emission estimation [15,16]. The enclosing ability of the metallic cover is important to evaluate the amount of air exhausted from the curtain. The ventilation rate from the single hole of the metallic cover was an average of 3–5% lower than that of the barn exhaust fan according to the increase in the operating rate of the barn exhaust fan (Figure 3). In the test code for leakage by the HVAC (Heating, Ventilating, and Air Conditioning) air duct, the allowable leakage rate is 3–10% ranges for the general ventilation system [17]. Accordingly, the metallic cover had the enclosing ability to measure an accurate ventilation rate from the curtain by gathering most of the air. In addition, the ventilation rates gradually increased with a curve of a straight line (R2 = 0.97) according to the operating rate of the barn exhaust fan as follows: 3727 m3/h at 100%, 1383 m3/h at 50%, and 891 m3/h at 30% (Figure 3). It is a result of confirming that the exhaust fan is operating regularly [18,19]. However, during low ventilation operation the air velocity at the single hole got influenced by the relatively stronger external wind velocity.

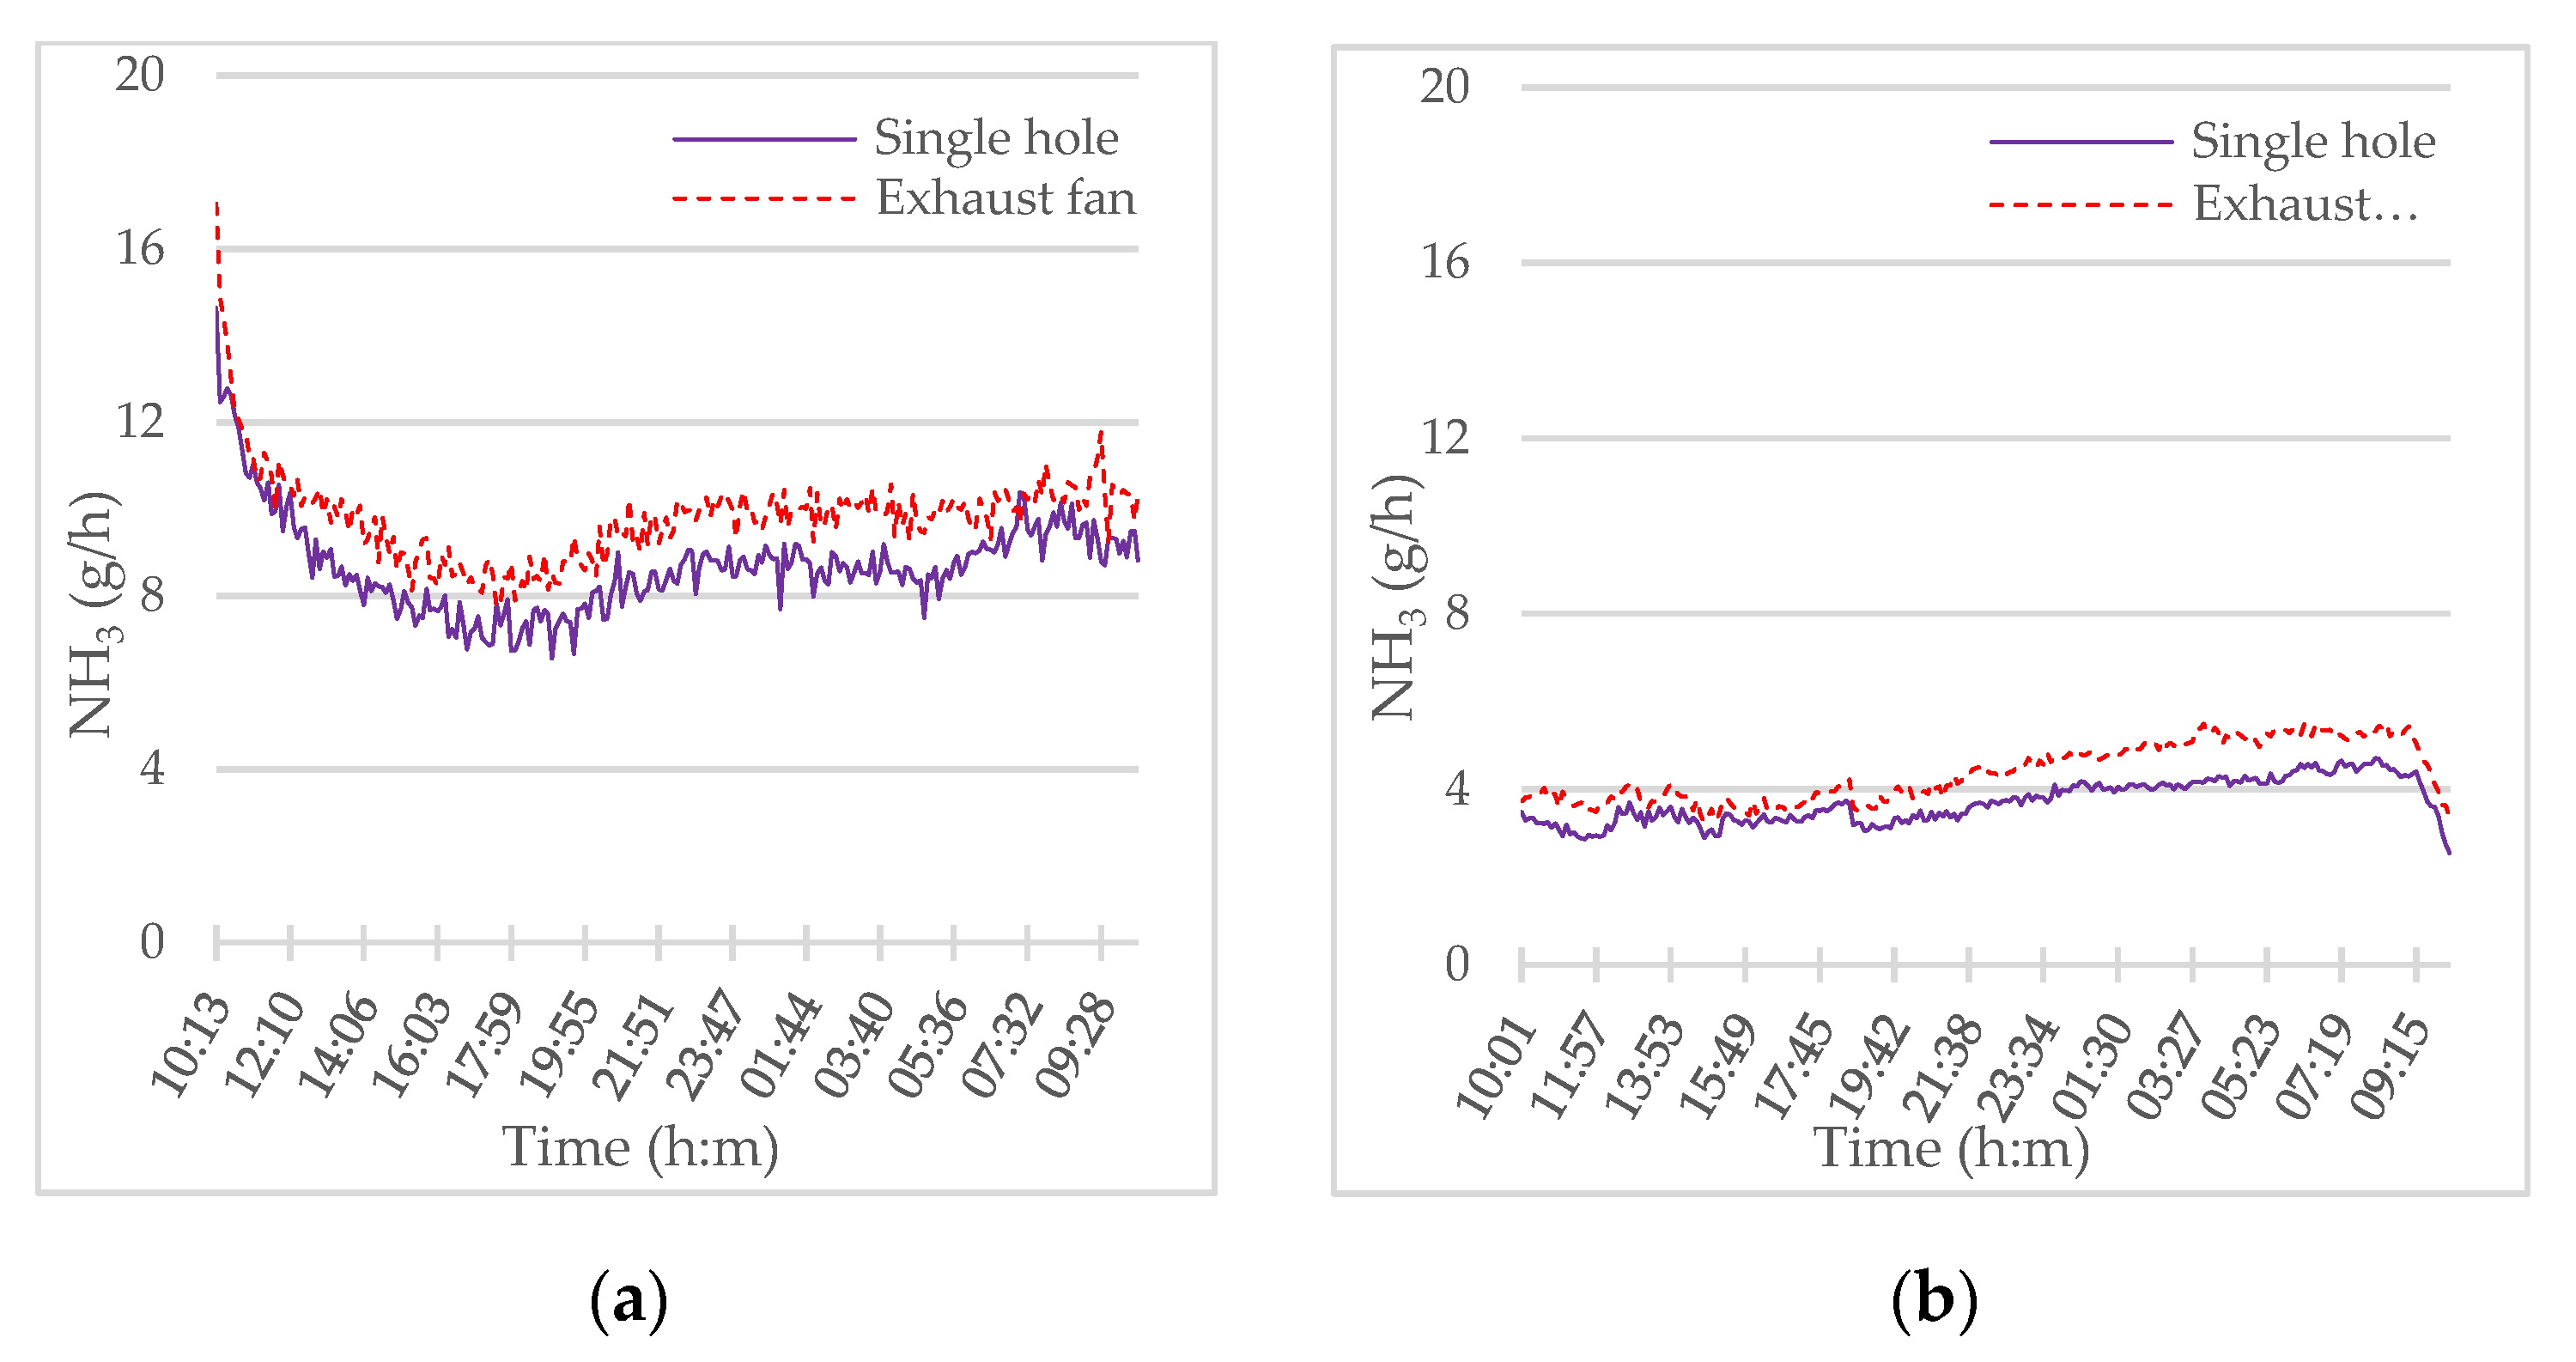
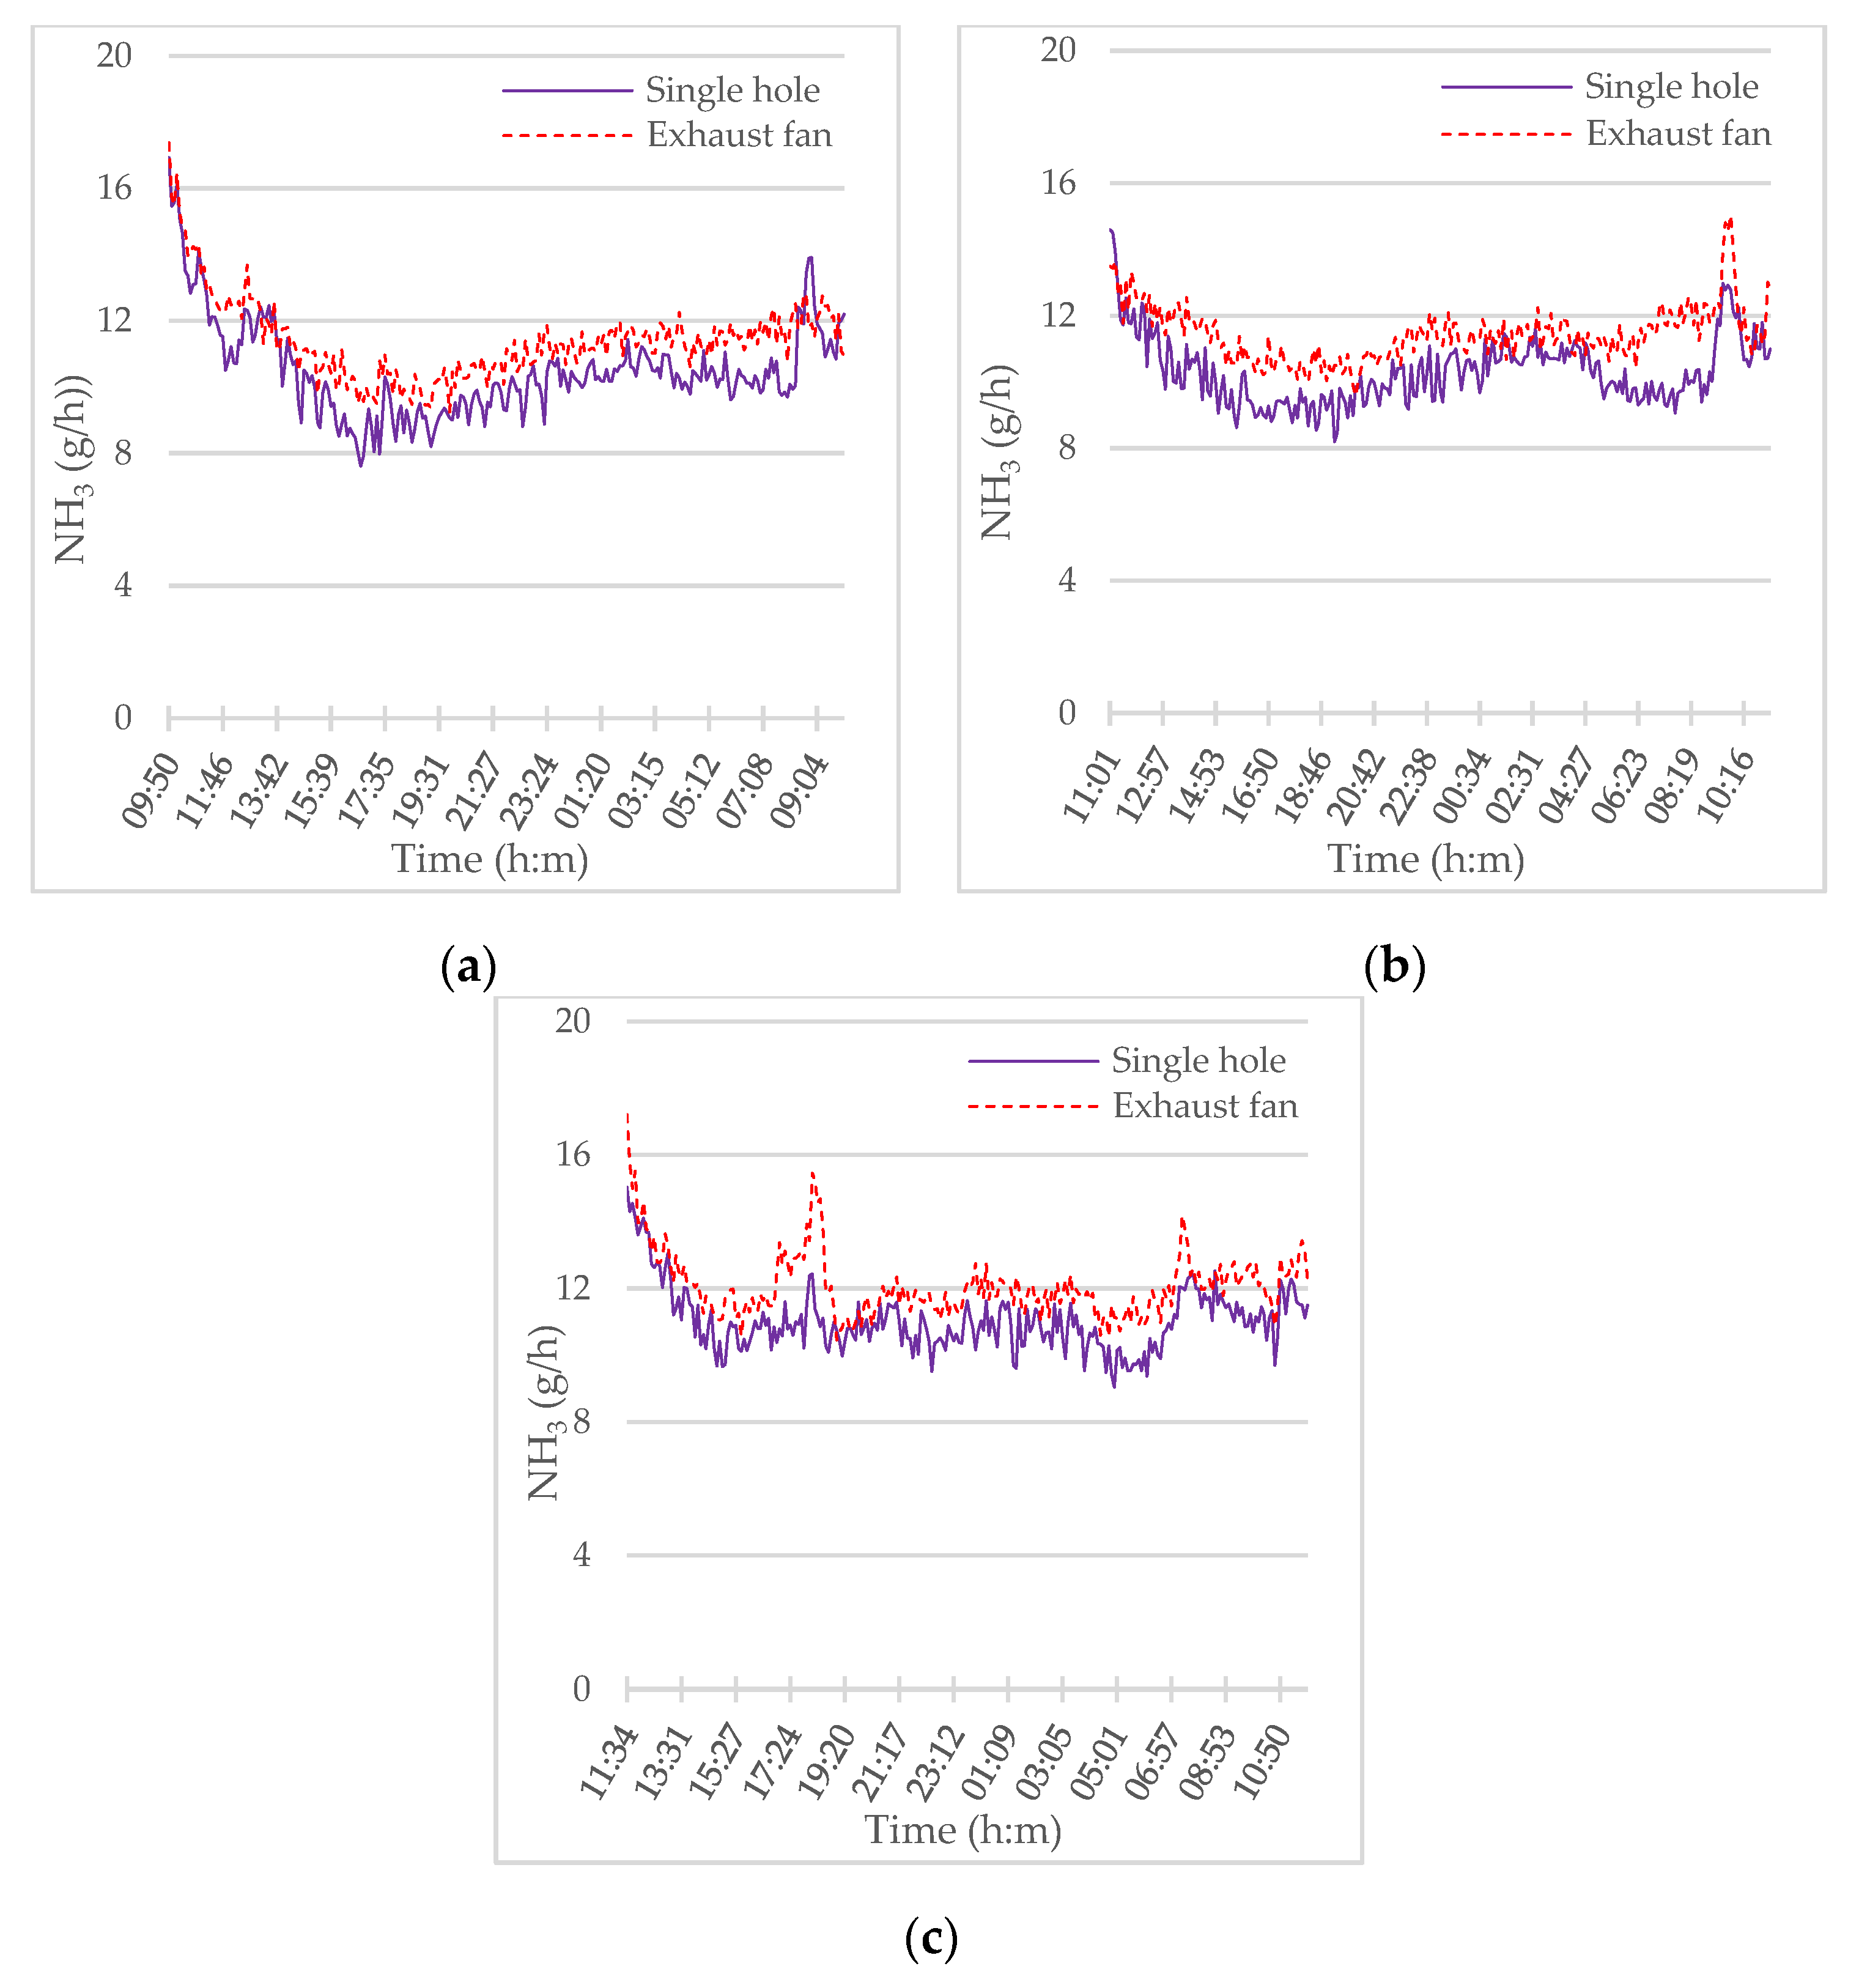
3.2. Ammonia Reduction Effects in Non-Spraying Condition

The NH3 emission rate declined at the single hole of the metal cover compared to the barn exhaust fan for both minimum (30%) and maximum (100%) ventilation rates, and the ranges were 6.6 ± 1.1 to 14.6 ± 1.1 g/h and 2.5 ± 0.5 to 4.7 ± 0.5 g/h, respectively. The reduction effect showed higher in 30% than 100% on average during non-spray treatment (Figure 4; Figure S1 in the Supplementary Materials). The major causes behind the reduction effects are two. Firstly, the meshes of curtains could capture dust/gas [10] and reduce odor in the air discharged from the barn [8,20]. In other hand, the effectiveness of odor reduction highly relates to the air retention time inside the curtain, which depends on the exhaust fan’s speed or ventilation rate [10,21]. In this case, while fan speed noticeably lowered the discharged air at the minimum operation of the exhaust fan, the NH3 emission rate also decreased than the maximum operating condition [10,22,23]. The lower airflow rate allowed the NH3 to stay inside the curtain for a long time and thus reduced the NH3 emission at the single hole. Also, the amount of discharged air closely relates to the NH3 emission [24,25] and has a contradictory relationship [26,27]. Although the NH3 concentration inside the barn decreases with the higher operating rate of the barn’s exhaust fan because of the immediate removal of NH3 by the faster fan speed [28,29], the mass flow rate (emission rate) increases in the exhaust fan [25]. Therefore, the sensors detected a higher NH3 emission in the maximum fan operation with a higher air flow rate, but we found a considerable reduction effect during minimum fan operation because of longer air retention time and less flow rate.

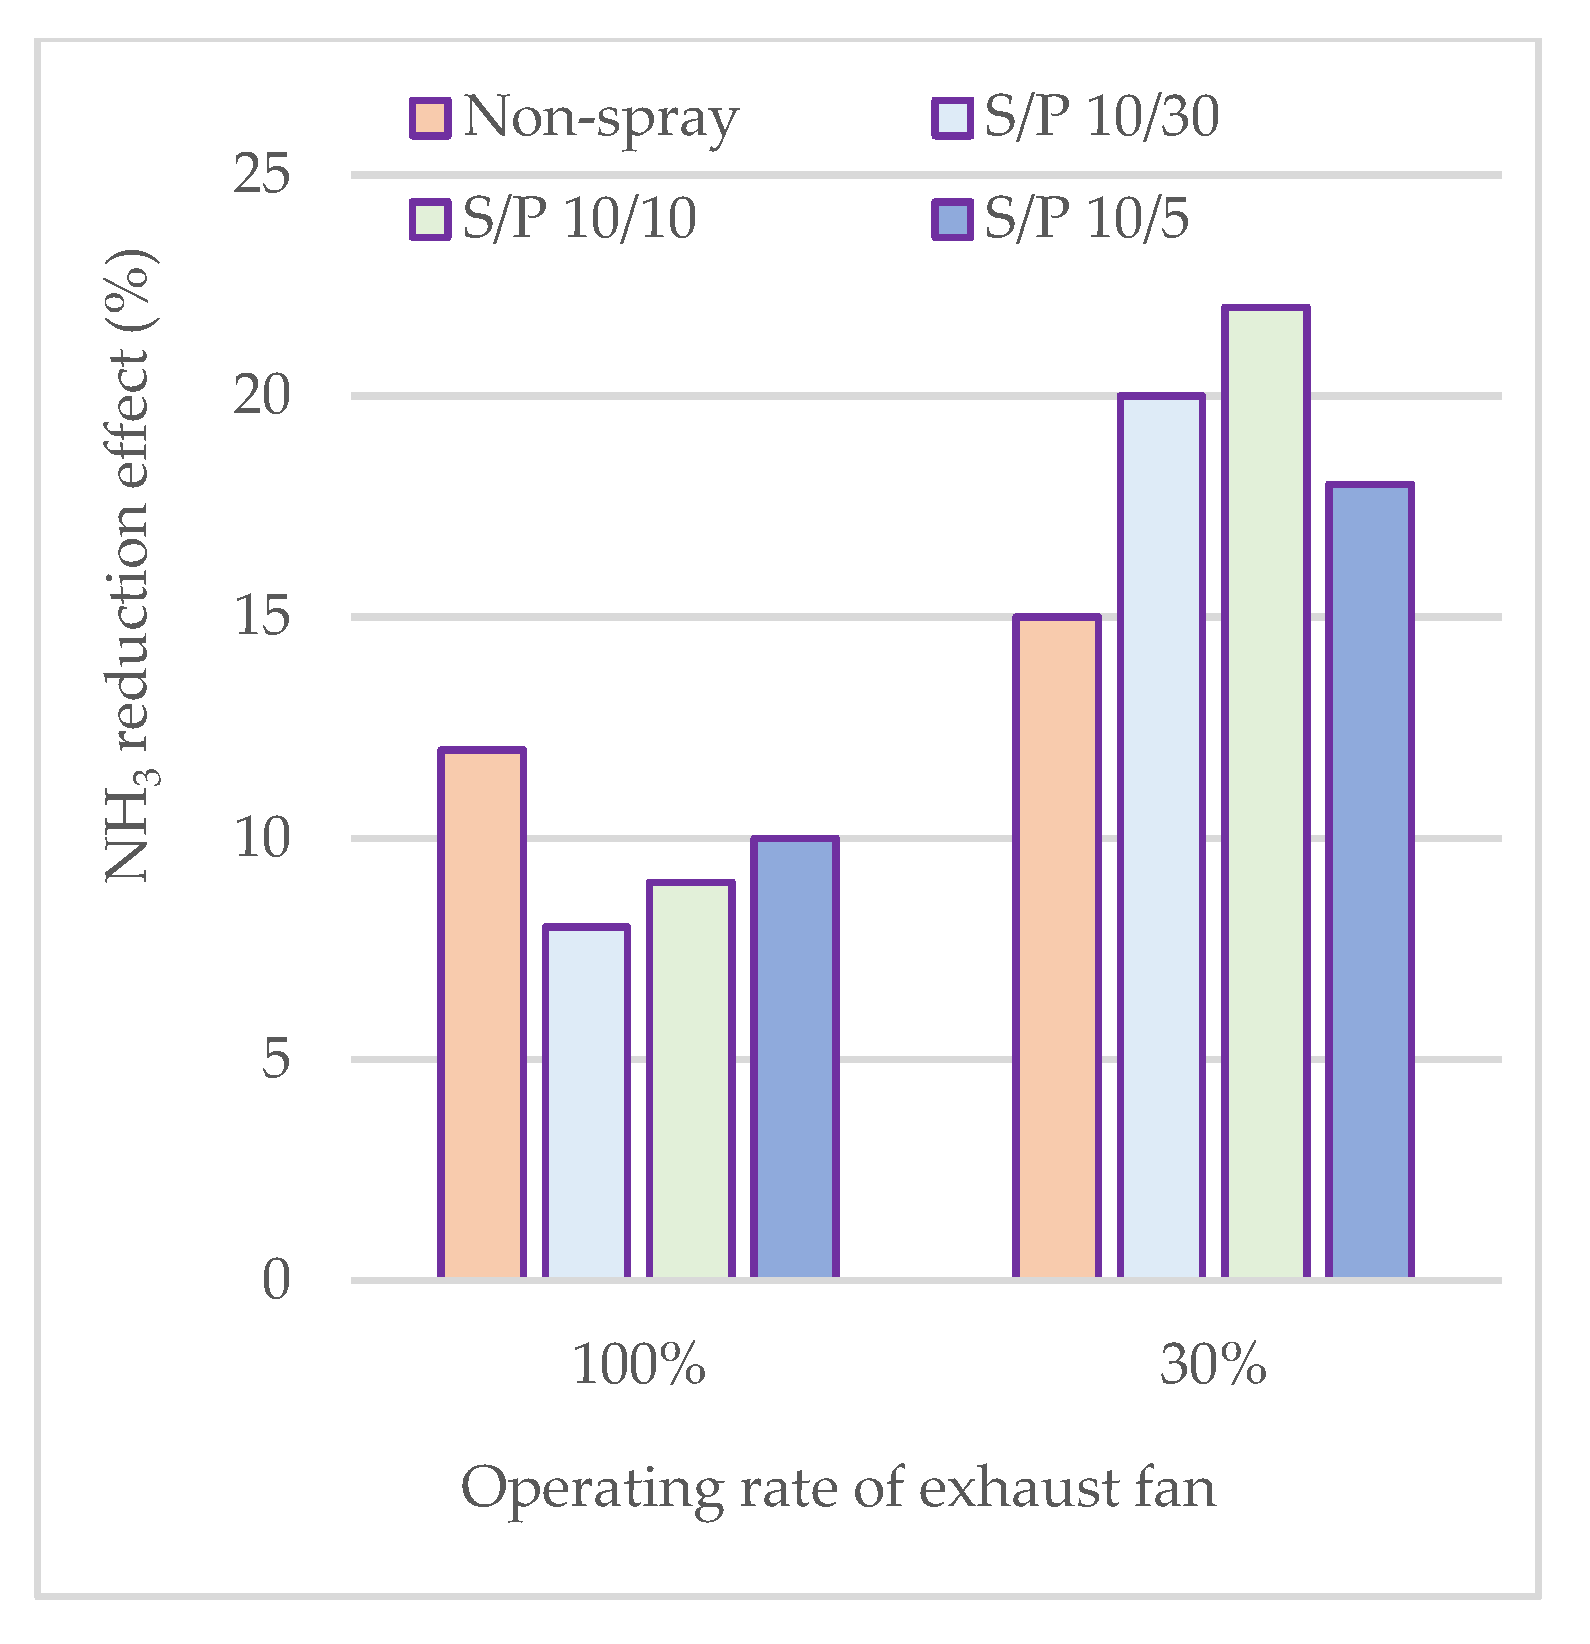
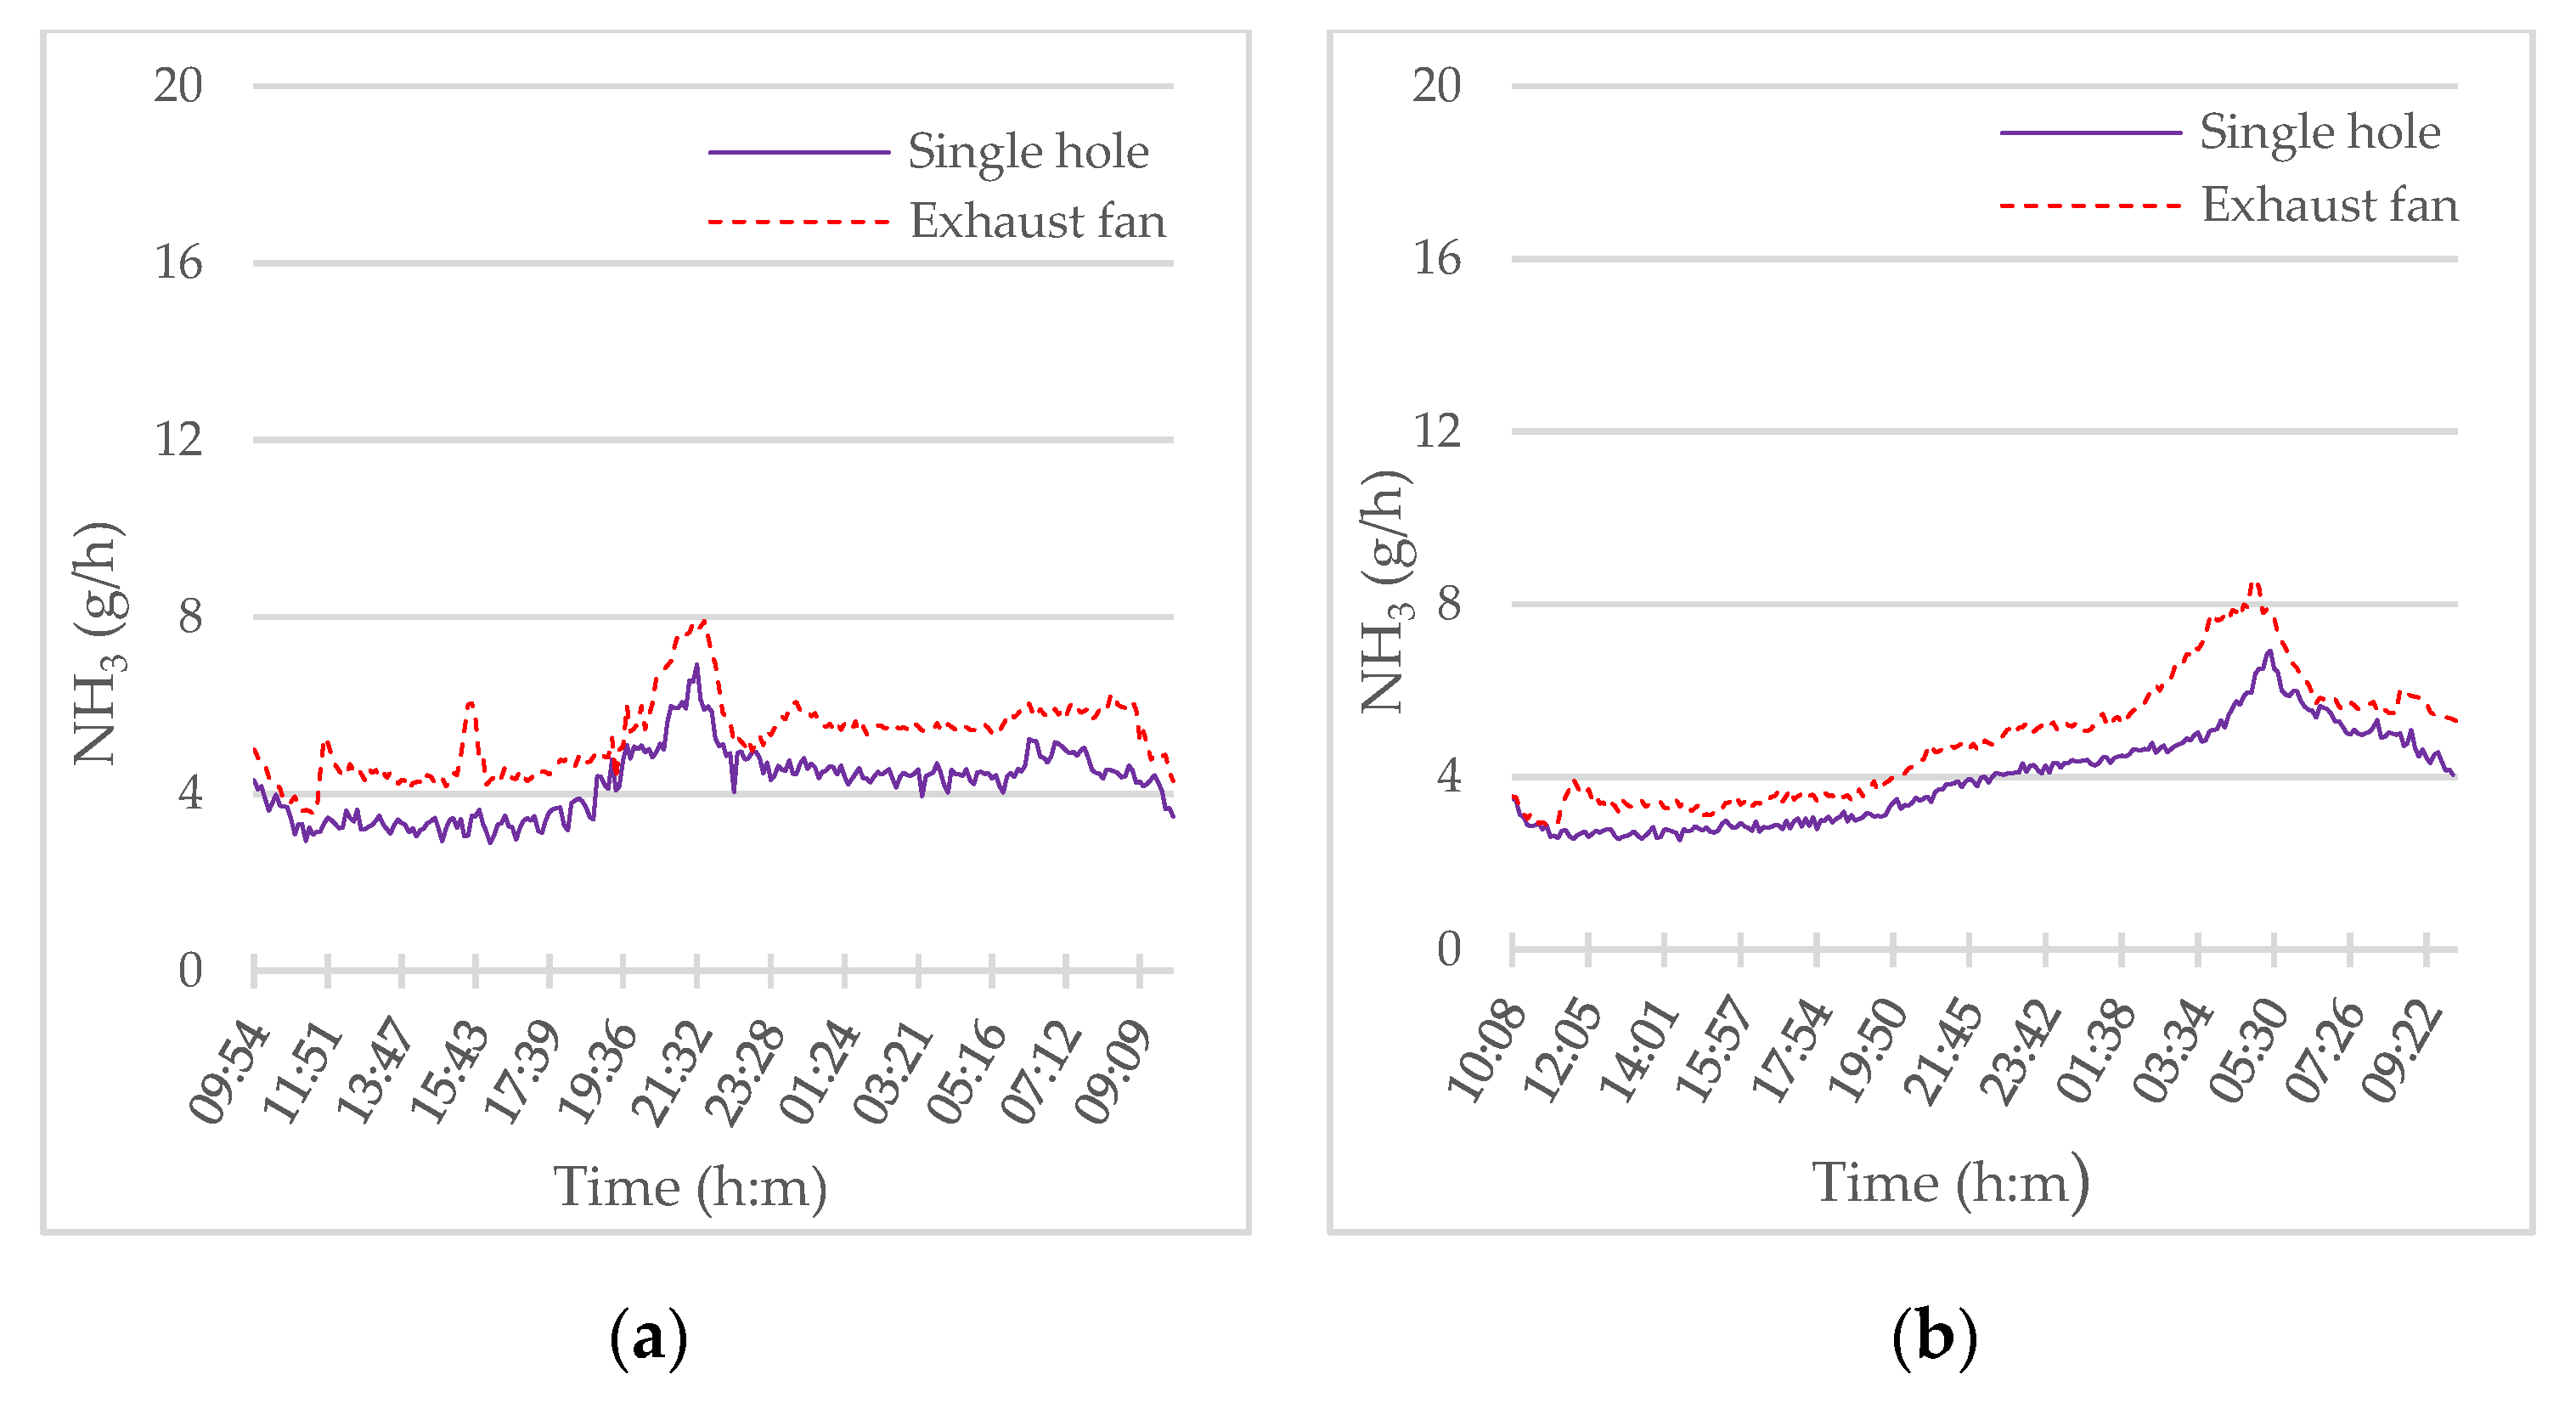
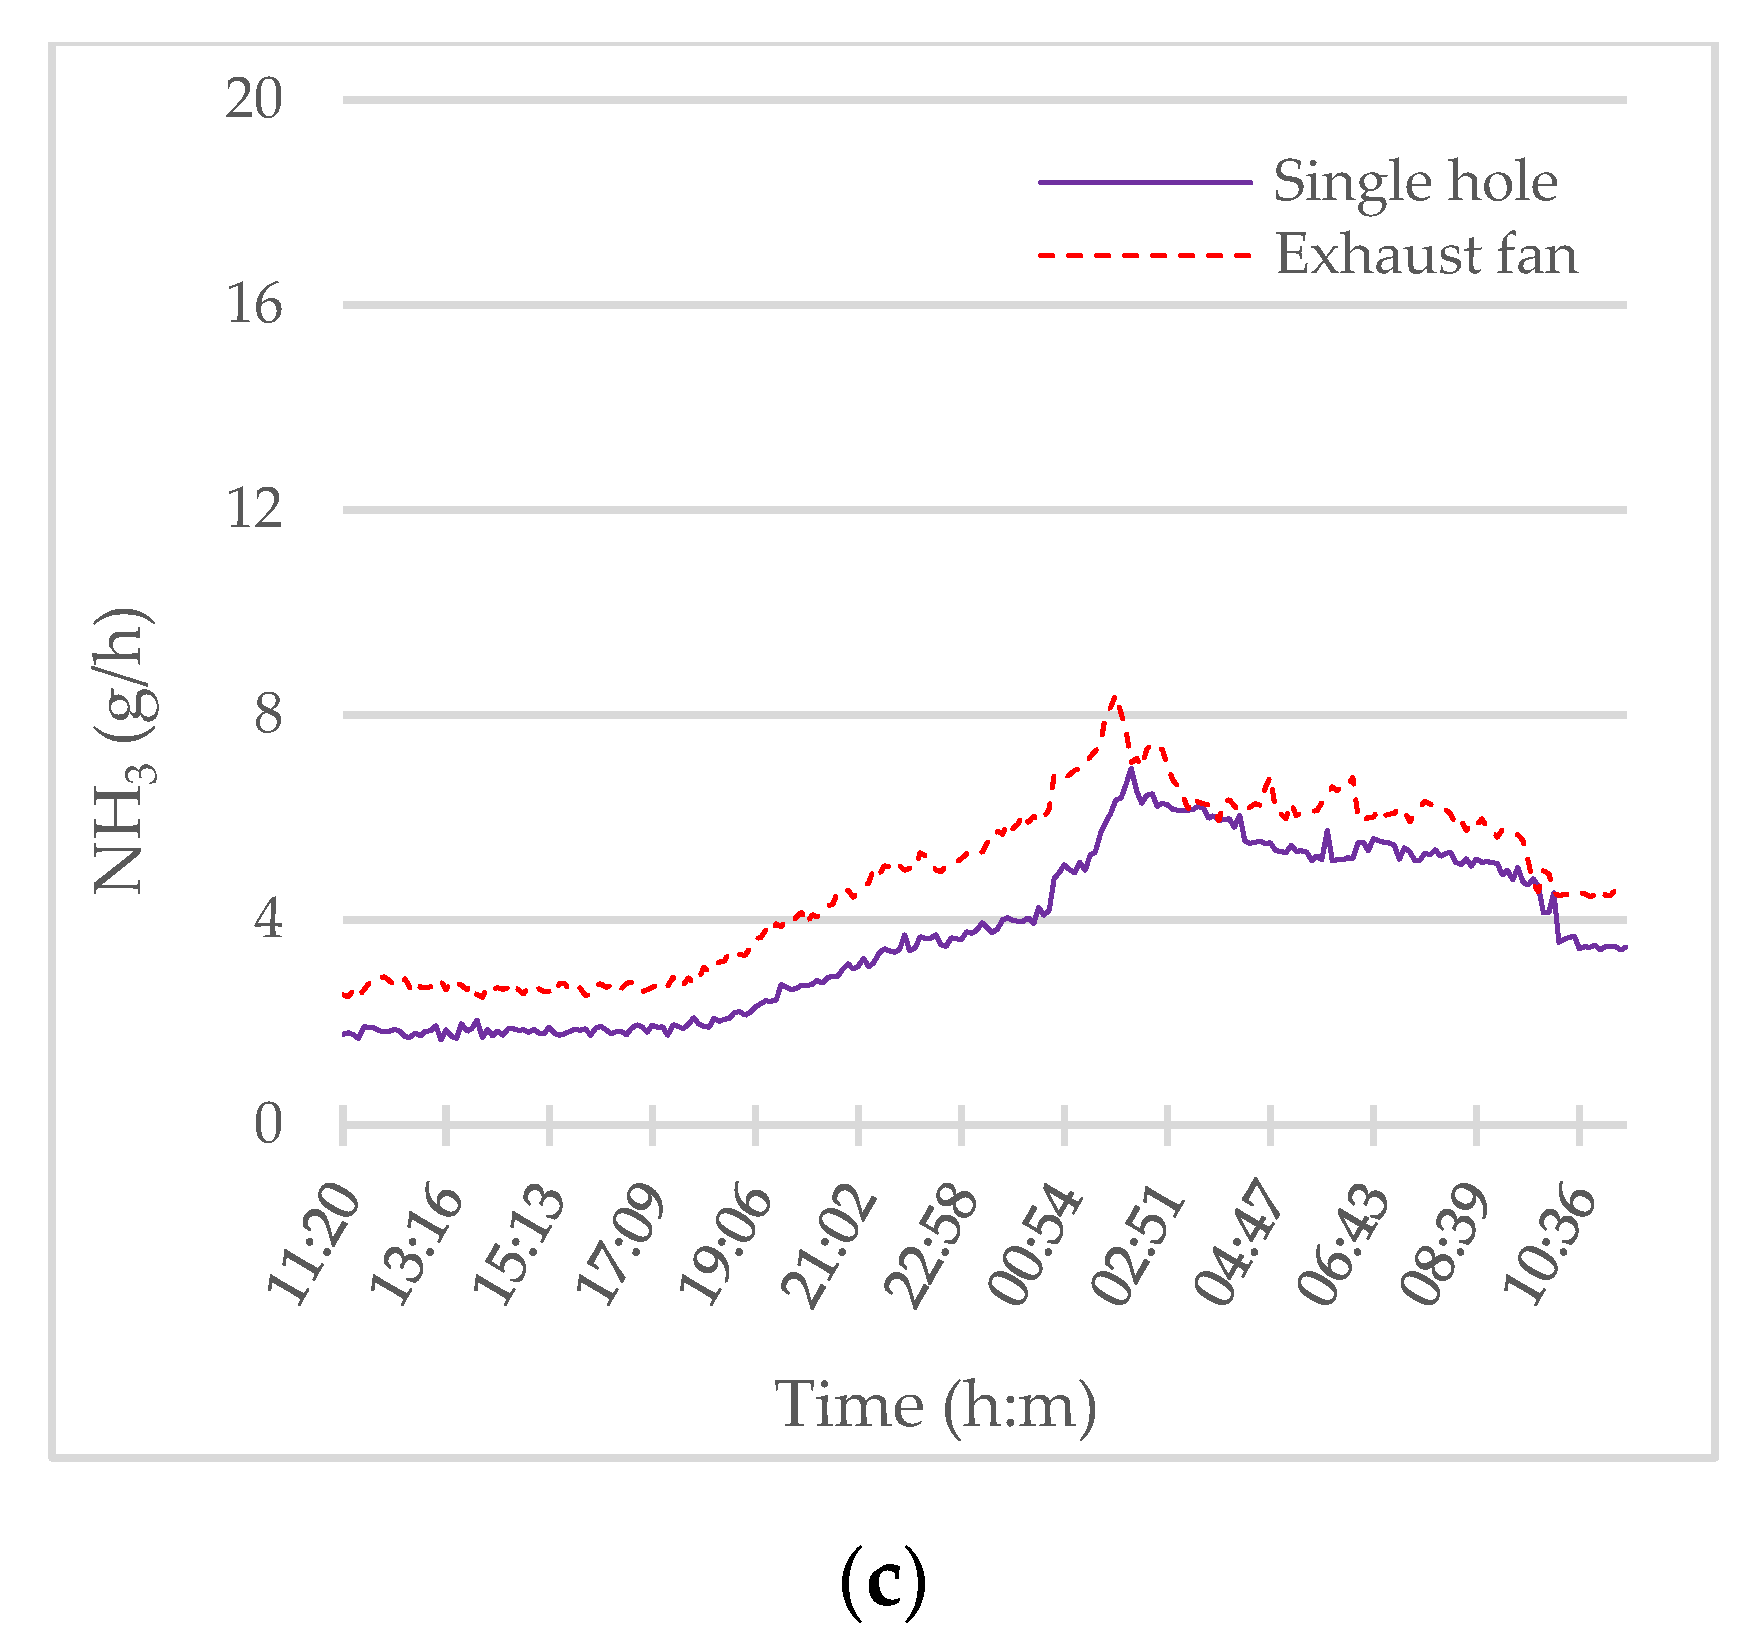
3.3. Ammonia Reduction Effect of Spraying Treatment Inside the Curtain

Swine farms spray water inside the curtains to increase the NH3 reduction effect. The highly soluble characteristics of NH3 let it get adsorbed by the sprayed water [30,31]. At the max exhaust fan operation, the NH3 emission rate was slightly lower in the single hole than in the exhaust fan (Figure 5; Figure S2 in the Supplementary Materials). The spray treatments displayed a gradual increase in emission reduction efficiencies of 8%, 9%, and 10% (Figure 6) for S/P (spray time, min./pause time, min.) 10/30, 10/10, and 10/5, respectively. At this stage, we observed that a large amount of mist got discharged through the single hole of the metallic cover, and there was no accumulated water inside the curtain and metal cover. Because of that, the discharged air through the single hole was more humid in the spray treatments than in the non-spray [32]. The assumption was that, because of the accelerated operation of the barn exhaust fan, the absorbed NH3 by the sprayed water quickly evaporated [33] to the outside of the single hole of the metallic cover [28,29]. In addition, the moist air would have affected some similar peak formations in the NH3 emission rate (Figure 5). Our best guess is that the backflow and back pressure caused by maximum ventilation of the exhaust fan yielded the NH3-enriched moist air [34,35]. Therefore, there was no notable reduction effect of NH3 at the exhaust fan’s maximum operation [36] while spraying inside the curtain (Figure 5).
In contrast to the above, during the minimum operation (30%) of the barn exhaust fan, the NH3 emission rate at the metallic cover’s single hole was lower in the range of 2.9 ± 0.7 to 6.9 ± 0.5 g/h, 1.7 ± 1.6 to 7.0 ± 1.6 g/h, and 2.5 ± 1.4 to 6.0 ± 1.1 g/h, correspondingly, than the exhaust fan for all three spraying treatments (Figure 7; Figure S3 in the Supplementary Materials). And the reduction rates of NH3 emission were noticeable and higher than the non-spray as follows: non-spray (15%), S/P 10/30 (20%), S/P 10/10 (22%), and S/P 10/5 (18%) (Figure 6). Unlike the optimum operation (100%), there was no mist in the air discharged from the single hole of the metallic cover, and instead, sprayed water accumulated inside the curtain and metal cover.
We analyzed sprayed water collected from the surface and inner floor of the curtain. Ammoniacal nitrogen was only found in the water collected from the curtain-covered area but not detected in the tank water (Table 1). The water can capture NH3 of 31% to 74% in the air [37,38,39,40], and captured NH3 is transformed into NH4+ [37,38]. Ammoniacal nitrogen strongly depends on EC and TKN [41,42], and in this study, they were higher at 91% and 87% on average in collected water from curtains compared to tank water, respectively (Table 1). A high EC represents the existence and quantity of hydrogen ions, for instance NH4+ [40,43], and an increase in nitrogen sources escalates to TKN [44]. Because the accumulated water absorbed the emitted NH3 inside the curtain, the NH3 emission rates declined in all spray treatments. And also, the NH3 emission rates showed almost stable formation between 3.7 ± 0.5 g/h to 4.2 ± 0.8 g/h. However, the S/P 10/5 treatment had the minimum reduction rate among the spray treatments of minimum fan operation, and we assumed that the frequent spraying accumulated more water and caused some secondary emissions [24,45,46]. The NH3 reduction mechanism of the curtain-spray system follows a similar principle of a wet scrubber where NH3 emission reduction got affected by the quality of washing water [47,48,49] in this case, the accumulated water. Installing a water de-accumulation hole in the metallic cover could solve this situation by discharging the hoarded water, but the ventilation rate, NH3 concentration, and emission rate would not be measured precisely because of air leakage [50]. Put together, spraying inside the curtain reduces NH3 emission by trapping accumulated water inside the curtain.

4. Conclusions

The metallic cover installed around the curtain made it possible to measure the ventilation rates, NH3 concentration, and emission rate in the air discharged through the curtain. This study shows that the hard metallic exterior could help to evaluate the NH3-reducing effect of the curtain in terms of emission rate. Ammonia emission rate gets reduced highly at the minimum operating speed of the barn exhaust fan in both non-spray and spray amid low air ventilation (with NH3 flow rate) discharged through the curtain. However, the NH3 reduction effect had little difference among treatments and relatively had a higher NH3 emission reduction in spraying conditions as time passed. The reason is that sprayed water inside the curtain absorbed the emitted NH3 and accumulated inside at the lower ventilation rate, and thus the emission rate got reduced. The evaluation of the NH3 emission rate using a metallic cover is countable for dry conditions, but for the spray treatment curtain, it became challenging to estimate the reduction effect based on NH3 emission or mass flow rate as time passed. Therefore, this study suggests further investigation of strategies to evaluate the NH3 reduction effect in terms of odor reduction techniques by using the spray system. In addition, to assess the NH3 reduction effect of the spraying system inside the curtain without a metallic cover, additional research is required.

Supplementary Materials

The following supporting information can be downloaded at: https://www.mdpi.com/article/10.3390/atmos14010127/s1, Figure S1: The changes of NH3 concentration for (a) 100% and (b) 30% ventilation in non-sprayed treatments. Figure S2: The changes of NH3 concentration by spraying water inside of the curtain at the maximum operating rate of the barn exhaust fan (100%). Figure S3: The changes of NH3 concentration by spraying water inside of the curtain at the maximum operating rate of the barn exhaust fan (30%).

Author Contributions

Conceptualization, O.H.H.; methodology, O.H.H.; validation, O.H.H.; formal analysis, O.H.H., J.N.H., J.S.P., S.Y.P.; investigation, O.H.H., J.N.H.; resources, O.H.H.; data curation, O.H.H., J.N.H.; writing—original draft preparation, O.H.H.; writing—review and editing, O.H.H., J.N.H., K.S.K.; visualization, O.H.H., J.N.H.; supervision, O.H.H.; project administration, O.H.H.; funding acquisition, O.H.H. All authors have read and agreed to the published version of the manuscript.

Funding

This work was carried out with the support of “The Cooperative Research Program for Agriculture Science and Technology Development (Project No. PJ016019)” Rural Development Administration, Republic of Korea.

Institutional Review Board Statement

Not applicable.

Informed Consent Statement

Not applicable.

Data Availability Statement

The data presented in this study are available in this article and Supplementary Materials.

Acknowledgments

This study was supported by 2022 the RDA Fellowship Program of the National Institute of Animal Science, Rural Development Administration, Republic of Korea.

Conflicts of Interest

The authors declare no conflict of interest.

References

  1. Merchant, J.A.; Ross, R.F.; Hodne, C. Iowa Concentrated Animal Feeding Operations Air Quality Study; Iowa State University and The University of Iowa: Ames. 2002. Available online: https://www.oregonlegislature.gov/citizen_engagement/Reports/2011_DEQ_Dairy%20Air%20Quality%20Task%20Force%20Appendix%20L%20Iowa%20CAFO%20study.pdf (accessed on 23 February 2022).
  2. Thu, K.; Donham, K.; Ziegenhorn, R.; Reynolds, S.; Thorne, P.S.; Subramanian, P.; Whitten, J. A Control Study of the Physical and Mental Health of Residents Living near a Large-Scale Swine Operation. J. Agric. Saf. Health 1997, 3, 13–26. [Google Scholar] [CrossRef]
  3. Schiffman, S.S.; Miller, E.A.; Suggs, M.S.; Graham, B.G. The Effect of Environmental Odors Emanating from Commercial Swine Operations on the Mood of Nearby Residents. Brain Res. Bull. 1995, 37, 369–375. [Google Scholar] [CrossRef] [PubMed]
  4. Emerson, K.; Russo, R.C.; Lund, R.E.; Thurston, R.V. Aqueous Ammonia Equilibrium Calculations: Effect of PH and Temperature. J. Fish. Res. Board Can. 1975, 32, 2379–2383. [Google Scholar] [CrossRef]
  5. Lyu, C.; Li, N.; Li, M.; Lyu, Y.; Liu, Z.; Zhong, S. Efficiency of the Integrated Nitrogen Removal Device to Remove Ammonia in a Hog House. J. Chem. 2021, 2021, 1–8. [Google Scholar] [CrossRef]
  6. Kim, K.-Y.; Ko, H.-J.; Kim, H.-T.; Kim, Y.-S.; Roh, Y.-M.; Lee, C.-M.; Kim, C.-N. Odor Reduction Rate in the Confinement Pig Building by Spraying Various Additives. Bioresour. Technol. 2008, 99, 8464–8469. [Google Scholar] [CrossRef]
  7. Wachenfelt, E.V. Dust Reduction in Alternative Production Systems for Laying Hens. In International Symposium on Dust Control in Animal Production Facilities: Congress Proceedings; Department of Agricultural Engineering: Aarhus, Denmark, 1999; p. 349. [Google Scholar]
  8. Moore, P.A., Jr.; Li, H.; Burns, R.; Miles, D.; Maguire, R.; Ogejo, J.; Reiter, M.S.; Buser, M.D.; Trabue, S. Development and Testing of the ARS Air Scrubber: A Device for Reducing Ammonia Emissions from Animal Rearing Facilities. Front. Sustain. Food Syst. 2018, 2, 23. [Google Scholar] [CrossRef] [Green Version]
  9. Santonja, G.G.; Georgitzikis, K.; Scalet, B.M.; Montobbio, P.; Roudier, S.; Sancho, L.D. Best Available Techniques (BAT) Reference Document for the Intensive Rearing of Poultry or Pigs; 2017, Volume 11, 898. Available online: http://eippcb.jrc.ec.europa.eu/reference/ (accessed on 10 October 2022).
  10. Ellis, M.; Funk, T.; Zhang, Y.; Peterson, B.; Rojo-Gomez, A.; Jerez, S.; Su, J.; Robert, M. Evaluation of the Effectiveness of a BEI Biocurtain and Electrostatic Space Charge System for Reducing Emissions of Total Suspended Particulate Matter from Swine Building Exhaust Streams; The University of Illinois: Champaign, IL, USA, 2008; Available online: https://porkcheckoff.org/wp-content/uploads/2021/02/05-132-ELLIS-UofILREVISED.pdf (accessed on 23 February 2022).
  11. Sommer, S.G.; Hafner, S.D.; Laubach, J.; van der Weerden, T.J.; Leytem, A.B.; Pacholski, A. Model for Calculating Ammonia Emission from Stored Animal Liquid Manure. Biosyst. Eng. 2022, 223, 41–55. [Google Scholar] [CrossRef]
  12. Wyer, K.E.; Kelleghan, D.B.; Blanes-Vidal, V.; Schauberger, G.; Curran, T.P. Ammonia Emissions from Agriculture and Their Contribution to Fine Particulate Matter: A Review of Implications for Human Health. J. Environ. Manage. 2022, 323, 116285. [Google Scholar] [CrossRef]
  13. Arogo, J.; Westerman, P.W.; Heber, A.J.; Robarge, W.P.; Classen, J.J. Ammonia Emissions from Animal Feeding Operations; ASABE: St. Joseph, MI, USA, 2006. [Google Scholar]
  14. Hwang, O.H.; Cho, S.B.; Han, D.W.; Lee, S.R.; Kwag, J.H.; Park, S.K. Effect of Storage Period on the Changes of Odorous Compound Concentrations and Bacterial Ecology for Identifying the Cause of Odor Production from Pig Slurry. PLoS ONE 2016, 11, e0162714. [Google Scholar] [CrossRef] [Green Version]
  15. Banhazi, T.M. Seasonal, Diurnal and Spatial Variations of Environmental Variables in Australian Livestock Buildings. Aust. J. Multi-Discip. Eng. 2013, 10, 60–69. [Google Scholar] [CrossRef]
  16. Aarnink, A.J.A.; Wagemans, M.J.M. Ammonia Volatilization and Dust Concentration as Affected by Ventilation Systems in Houses for Fattening Pigs. Trans. ASAE 1997, 40, 1161–1170. [Google Scholar] [CrossRef]
  17. KARSE (Korean Association of Air Conditioning Refrigerating and Sanitary Engineers). The Test Code for Leakage of HVAC (Heating, Ventilating and Air Conditioning) Air Duct, SPS-KARSE B 0016-0178; KARSE: Seoul, Republic of Korea, 2018; p. 5. [Google Scholar]
  18. Moody, L.; Li, H.; Burns, R.; Xin, H.; Gates, R. Quality Assurance Project Plan (QAPP) for Monitoring Gaseous and Particulate Matter Emissions from Southeastern Broiler Houses. In Symposium on Air Quality Measurement: Methods and Technology; The American Society of Agricultural and Biological Engineer: Michigan, USA, 2006; pp. 470–481. [Google Scholar]
  19. Yeo, U.-H.; Decano-Valentin, C.; Ha, T.; Lee, I.-B.; Kim, R.-W.; Lee, S.-Y.; Kim, J.-G. Impact Analysis of Environmental Conditions on Odour Dispersion Emitted from Pig House with Complex Terrain Using CFD. Agronomy 2020, 10, 1828. [Google Scholar] [CrossRef]
  20. Ajami, A.; Shah, S.B.; Stikeleather, L.F. Windbreak Wall-Vegetative Strip System to Reduce Air Emissions from Mechanically-Ventilated Livestock Barns—Part 1: CFD Modeling. Water Air Soil Pollut. 2019, 230, 291. [Google Scholar] [CrossRef]
  21. Ocepek, M.; Berk, P.; Rakun, J.; Janzekovic, M.; Skorjanc, D. Diurnal Variation of Ammonia Emission in Pig Fattening Facilities. In DAAAM International Scientific Book 2012; Katalinic, B., Ed.; DAAAM International: Vienna, Austria, 2012; Chapter 10; pp. 107–116. ISBN 978-3-901509-86-5. ISSN 1726-9687. [Google Scholar] [CrossRef]
  22. Manuzon, R.B.; Zhao, L.Y.; Keener, H.M.; Darr, M.J. A Prototype Acid Spray Scrubber for Absorbing Ammonia Emissions from Exhaust Fans of Animal Buildings. Trans. ASABE 2007, 50, 1395–1407. [Google Scholar] [CrossRef]
  23. Ajami, A.; Shah, S.B.; Wang-Li, L.; Kolar, P.; Castillo, M.S. Windbreak Wall-Vegetative Strip System to Reduce Air Emissions from Mechanically Ventilated Livestock Barns: Part 2—Swine House Evaluation. Water Air Soil Pollut. 2019, 230, 12. [Google Scholar] [CrossRef]
  24. Snoek, D.J.W.; Stigter, J.D.; Ogink, N.W.M.; Groot Koerkamp, P.W.G. Sensitivity Analysis of Mechanistic Models for Estimating Ammonia Emission from Dairy Cow Urine Puddles. Biosyst. Eng. 2014, 121, 12–24. [Google Scholar] [CrossRef]
  25. Li, R. Effect of partial pit exhaust ventilation system on ammonia removal ratio and mass transfer coefficients from different emission sources in pig houses. Energy Built Environ. 2020, 1, 343–350. [Google Scholar] [CrossRef]
  26. Philippe, F.-X.; Cabaraux, J.-F.; Nicks, B. Ammonia Emissions from Pig Houses: Influencing Factors and Mitigation Techniques. Agric. Ecosyst. Environ. 2011, 141, 245–260. [Google Scholar] [CrossRef]
  27. Arogo, J.; Westerman, P.W.; Heber, A.J. A Review of Ammonia Emissions from Confined Swine Feeding Operations. Trans. ASAE 2003, 46, 3. [Google Scholar] [CrossRef]
  28. Schauberger, G.; Piringer, M.; Petz, E. Diurnal and Annual Variation of Odour Emission from Animal Houses: A Model Calculation for Fattening Pigs. J. Agric. Eng. Res. 1999, 74, 251–259. [Google Scholar] [CrossRef]
  29. Wang, K.; Wei, B.; Zhu, S.; Ye, Z. Ammonia and Odour Emitted from Deep Litter and Fully Slatted Floor Systems for Growing-Finishing Pigs. Biosyst. Eng. 2011, 109, 203–210. [Google Scholar] [CrossRef]
  30. Palakodeti, A.; Azman, S.; Rossi, B.; Dewil, R.; Appels, L. A Critical Review of Ammonia Recovery from Anaerobic Digestate of Organic Wastes via Stripping. Renew. Sustain. Energy Rev. 2021, 143, 110903. [Google Scholar] [CrossRef]
  31. Zheng, J.; Lyu, Y.; Qiao, M.; Wang, R.; Zhou, Y.; Li, H.; Chen, C.; Li, Y.; Zhou, H.; Jiang, S.P.; et al. Photoelectrochemical Synthesis of Ammonia on the Aerophilic-Hydrophilic Heterostructure with 37.8% Efficiency. Chem 2019, 5, 617–633. [Google Scholar] [CrossRef] [Green Version]
  32. Mackay, D.; Yeun, A.T.K. Mass Transfer Coefficient Correlations for Volatilization of Organic Solutes from Water. Environ. Sci. Technol. 1983, 17, 211–217. [Google Scholar] [CrossRef]
  33. Arogo, J.; Zhang, R.H.; Riskowski, G.L.; Christianson, L.L.; Day, D.L. Mass transfer coefficient of ammonia in liquid swine manure and aqueous solutions. J. Agric. Eng. Res. 1999, 73, 77–86. [Google Scholar] [CrossRef]
  34. Bjerg, B.; Cascone, G.; Lee, I.B.; Thomas, B.; Norton, T.; Hong, S.W.; Seo, I.H.; Banhazi, T.; Liberati, P.; Marucci, A.; et al. Modelling of ammonia emissions from naturally ventilated livestock buildings. Part 3: CFD modelling. Biosyst. Eng. 2013, 6, 259–275. [Google Scholar] [CrossRef]
  35. Jerez, S.B.; Mukhtar, S.; Faulkner, W.; Casey, K.D.; Borhan, M.S.; Smith, R.A. Evaluation of Electrostatic Particle Ionization and BioCurtainTM Technologies to Reduce Air Pollutants from Broiler Houses. Appl. Eng. Agric. 2013, 29, 975–984. [Google Scholar] [CrossRef]
  36. Jo, G.; Ha, T.; Jang, Y.A.; Hwang, O.; Seo, S.; Woo, S.E.; Lee, S.; Kim, D.; Jung, D. Ammonia emission characteristics of a mechanically ventilated swine finishing facility in Korea. Atmosphere 2020, 11, 1088. [Google Scholar] [CrossRef]
  37. Jamaludin, Z.; Rollings-Scattergood, S.; Lutes, K.; Vaneeckhaute, C. Evaluation of Sustainable Scrubbing Agents for Ammonia Recovery from Anaerobic Digestate. Bioresour. Technol. 2018, 270, 596–602. [Google Scholar] [CrossRef]
  38. Sander, R. Compilation of Henry’s Law Constants (Version 4.0) for Water as Solvent. Atmos. Chem. Phys. 2015, 15, 4399–4981. [Google Scholar] [CrossRef] [Green Version]
  39. Zhang, C.; Ma, J.; Waite, T.D. The Impact of Absorbents on Ammonia Recovery in a Capacitive Membrane Stripping System. Chem. Eng. J. 2020, 382, 122851. [Google Scholar] [CrossRef]
  40. Soto-Herranz, M.; Sánchez-Báscones, M.; Antolín-Rodríguez, J.M.; Martín-Ramos, P. Evaluation of Different Capture Solutions for Ammonia Recovery in Suspended Gas Permeable Membrane Systems. Membranes 2022, 12, 572. [Google Scholar] [CrossRef] [PubMed]
  41. Provolo, G.; Martínez-Suller, L. In Situ Determination of Slurry Nutrient Content by Electrical Conductivity. Bioresour. Technol. 2007, 98, 3235–3242. [Google Scholar] [CrossRef] [PubMed]
  42. Yagüe, M.R.; Quílez, D. On-Farm Measurement of Electrical Conductivity for the Estimation of Ammonium Nitrogen Concentration in Pig Slurry. J. Environ. Qual. 2012, 41, 893–900. [Google Scholar] [CrossRef] [Green Version]
  43. Damtie, M.M.; Volpin, F.; Yao, M.; Tijing, L.D.; Hailemariam, R.H.; Bao, T.; Park, K.-D.; Shon, H.K.; Choi, J.-S. Ammonia Recovery from Human Urine as Liquid Fertilizers in Hollow Fiber Membrane Contactor: Effects of Permeate Chemistry. Environ. Eng. Res. 2020, 26, 1. [Google Scholar] [CrossRef]
  44. Leek, A.B.G.; Hayes, E.T.; Curran, T.P.; Callan, J.J.; Beattie, V.E.; Dodd, V.A.; O’Doherty, J.V. The Influence of Manure Composition on Emissions of Odour and Ammonia from Finishing Pigs Fed Different Concentrations of Dietary Crude Protein. Bioresour. Technol. 2007, 98, 3431–3439. [Google Scholar] [CrossRef]
  45. Haeussermann, A.; Jungbluth, T.; Hartung, E. NH3 mission from Pig Husbandry in Relation to Ventilation Control and Indoor Air Cooling. In Workshop on Agricultural Air Quality; Department of Communication Services, North Carolina State University: North Carolina, CA, USA, 2006; pp. 657–664. [Google Scholar]
  46. Cortus, E.L.; Lemay, S.P.; Barber, E.M.; Hill, G.A.; Godbout, S. A dynamic model of ammonia emission from urine puddles. Biosyst. Eng. 2008, 99, 390–402. [Google Scholar] [CrossRef]
  47. Ashtari, A.K.; Majd, A.M.S.; Riskowski, G.L.; Mukhtar, S.; Zhao, L. Removing Ammonia from Air with a Constant PH, Slightly Acidic Water Spray Wet Scrubber Using Recycled Scrubbing Solution. Front. Environ. Sci. Eng. 2016, 10, 3. [Google Scholar] [CrossRef]
  48. Melse, R.W.; Ploegaert, J.P.M.; Ogink, N.W.M. Biotrickling Filter for the Treatment of Exhaust Air from a Pig Rearing Building: Ammonia Removal Performance and Its Fluctuations. Biosyst. Eng. 2012, 113, 242–252. [Google Scholar] [CrossRef]
  49. Van Geelen, M.A.; Van Der Hoek, K.W. Odour Control with Biological Air Washers. Agric. Environ. 1977, 3, 217–222. [Google Scholar] [CrossRef]
  50. Melse, R.W.; Ogink, N.W.M.; Rulkens, W.H. Air Treatment Techniques for Abatement of Emissions from Intensive Livestock Production. Open Agric. J. 2009, 3, 6–12. [Google Scholar] [CrossRef]
Figure 1. Schematic diagram of the experimental setup, (a) swine facility: a. curtain set up, b. metallic cover setup, (b) curtain and metallic cover setup: a. barn wall, b. exhaust fan, c. curtain, d. spraying nozzles, e. single hole, f. metallic cover, g. floor, “x” markings represent the NH3 sampling point.
Atmosphere 14 00127 g001
Figure 2. Curtain constructed on the outside of swine facility. (a) curtain, (b) metallic cover concealed the curtain, (c) single hole on the front of metallic cover, (d) ventilation measurement setup for air discharged through the single hole of metallic cover.
Atmosphere 14 00127 g002
Figure 3. Enclosing ability of metallic cover.
Atmosphere 14 00127 g003
Figure 4. The ammonia (NH3) reduction effect in non-spray conditions inside the curtain: (a) the maximum operating rate of the barn exhaust fan (100%), (b) minimum operating rate of barn exhaust fan (30%).
Atmosphere 14 00127 g004
Figure 5. The ammonia (NH3) reduction effect by spraying water inside of the curtain at the maximum operating rate of the barn exhaust fan (100%), (a) S/P (spray time, min./pause time, min.) 10/30, (b) 10/10, (c) 10/5.
Atmosphere 14 00127 g005
Figure 6. The ammonia (NH3) reduction effects (%) of non-spraying and spraying water treatment. S/P (spray time, min./pause time, min.) 10/30, S/P 10/10, and S/P 10/5 at the 100% or 30% in operating rate of the barn exhaust fan.
Atmosphere 14 00127 g006
Figure 7. The ammonia (NH3) emission reduction effect by spraying inside the curtain at the minimum operating rate of the barn exhaust fan (30%). (a) S/P (spray time, min./pause time, min.) 10/30, (b) S/P 10/10, (c) S/P 10/5.
Atmosphere 14 00127 g007aAtmosphere 14 00127 g007b
Table 1. Characteristics of sprayed water.
SourcepHEC (mS/cm)TKN (mg/L)NH4+ (mg/L)
Tank7.3 ± 0.0299.7 ± 0.60.005 ± 0.020.0 ± 2.1
Surface of curtain7.4 ± 0.041252.7 ± 0.60.026 ± 0.1047.0 ± 0.7
Floor of the curtain7.6 ± 0.03994.7 ± 0.60.051 ± 0.0260.5 ± 2.1
EC, electrical conductivity; TKN, total Kjedahl nitrogen; NH4+, ammoniacal nitrogen.
Disclaimer/Publisher’s Note: The statements, opinions and data contained in all publications are solely those of the individual author(s) and contributor(s) and not of MDPI and/or the editor(s). MDPI and/or the editor(s) disclaim responsibility for any injury to people or property resulting from any ideas, methods, instructions or products referred to in the content.

