Article

Study on Enhancing Shale Oil Recovery by CO2 Pre-Pad Energized Fracturing in A83 Block, Ordos Basin

1
College of Energy, Chengdu University of Technology, Chengdu 610059, China
2
Sun-Energy Technology Co., Ltd. of Chengdu University of Technology, Chengdu 610059, China
*
Author to whom correspondence should be addressed.
Atmosphere 2022, 13(9), 1509; https://doi.org/10.3390/atmos13091509
Submission received: 16 August 2022 / Revised: 9 September 2022 / Accepted: 12 September 2022 / Published: 15 September 2022
(This article belongs to the Special Issue CO2 Geological Storage and Utilization)

Abstract

:
The Ordos Basin is rich in shale oil resources. The main targeted layers of blocks A83 and X233 are the Chang 7 member of the Yanchang Formation. Due to extremely low permeability, a fracturing technique was required to enhance oil recovery. However, after adopting the stimulated reservoir volume-fracturing technology, the post-fracturing production of the A83 block is significantly lower than that of the X233 block. For this problem, the dominating factors of productivity of the two blocks were analyzed using the Pearson correlation coefficient (PCC) and the Spearman rank correlation coefficient (SRCC), showing that the main reason for the lower production of the A83 block is its insufficient formation energy. To solve this problem, the CO2 pre-pad energized fracturing method was proposed. To study the feasibility of CO2 pre-pad energized fracturing in the A83 block, an integrated reservoir numerical simulation model of well A83-1 was established based on the idea of integration of geology and engineering. Additionally, the productions within five years after conventional volume fracturing and CO2 pre-pad energized fracturing were compared. The results show that compared with conventional volume fracturing, the cumulative oil production of CO2 pre-pad energized fracturing increases by 11.8%, and the water cut decreases by 16.5%. The research results can guide the subsequent reservoir reconstruction operation in the A83 block and provide new ideas for fracturing in the future.

1. Introduction

To enhance the recovery of shale resources, many scholars and oilfields have developed more and more reservoir stimulation technologies. For shale reservoirs with sufficient formation energy but low permeability, large-scale volume-fracturing technology was recommended to form a complex fracture network and maximize production [1,2]. Xu et al. concluded that the central ideas of volume-fracturing technology were “maximum contact area, shortest flow distance and minimum pressure difference”; that is to say, it was hoped that the contact area between the fracture wall and the reservoir matrix was the largest, the flow distance of fluid from the matrix to the fracture was the shortest, and the pressure difference for the fluid flowed to the fracture was the smallest [3]. The multistage stimulated reservoir volume-fracturing technology for horizontal wells can “break up” the reservoir to the maximum extent and obtain the largest stimulated reservoir volume (SRV) [4,5].
In the case of high horizontal stress difference and strong heterogeneity and as an improvement for traditional hydraulic fracturing, temporary plugging and diverting fracturing can form new branch fractures in the previous fractures to form fracture networks and increase the SRV. Solid and degradable diverters were often used in temporary plugging and diverting fracturing and refracturing treatments [6,7]. The diverters can effectively block pre-opened fractures and improve the net pressure; thus, the fracturing fluid is forced to enter the high-stress area to generate new diverting fractures [8,9]. Chemical diverters were widely used in fracturing operations of unconventional oil and gas reservoirs because they would degrade after the treatments with less damage [10]. Wang et al. found in the tri-axial temporary plugging fracturing experiment that a complex diverted fracture network tended to be created at a small differential stress (2.5 MPa in their case), while new fractures tend to grow parallel to the initial fractures at a high differential stress (7.5 MPa in their case) [11]. It is believed that the composite structure is more suitable for unconventional reservoir development than the single plugging structure [12].
Compared with conventional hydraulic fracturing, CO2 fracturing is more suitable for reservoirs with higher contents of clay minerals, and it has less possibility to cause water sensitivity or water-blocking effects [13]. The interaction between CO2 and shale will change the pore structure and reduce the uniaxial compressive strength and Young’s modulus [14], which can reduce the pressure required to open fractures by more than 50% [15]. This fracturing technology can form complex fracture networks and play a significant role in improving shale production [16]. However, due to the low viscosity, CO2 fracturing fluid has poor proppant-carrying capacity, which limits its application in unconventional oil and gas reservoirs [17,18,19]. CO2 foam fracturing fluid has good properties of high viscosity and low fluid loss, but its overall cost is high [20,21].
In the absence of energy supplementation, the recovery ratio of shale reservoirs with low pressure is only 5–10% using horizontal well drilling and multistage hydraulic fracturing. To replenish formation energy, some fluids, such as water, natural gas, or other mixed fluids, are generally injected into the reservoirs [22]. According to different periods, there are generally three ways to supplement formation energy [23]. The first is to inject a large amount of fracturing fluid in the early stage for energy complement, which can not only improve the complexity of artificial fractures but also increase the residence time and volume of fracturing fluid to replenish formation energy. The second is to improve reservoir pressure by multi-cycle water injection in the middle-later stage. After hydraulic fracturing, it is difficult for fracturing fluid to reach the matrix far from artificial fractures; hence, the reservoir pressure is still very low. The recovery ratio can be effectively improved by conducting multiple cycles of “injection-shut in-production”. The third is to replenish formation energy by injecting gas in the late stage. The miscible gas injected into the formation will displace the crude oil remaining in the matrix by having mass transfer with fluid in the matrix through capillary pressure drainage and dispersion diffusion.
Compared with other fracturing methods, CO2 pre-pad energized fracturing (CO2-PPEF) technology has the advantages of both hydraulic fracturing and CO2 fracturing, which can not only increase the SRV but also improve the formation energy and has broad application prospect in the development of unconventional reservoirs [24,25]. The results of a series of laboratory tri-axial fracturing experiments and CO2 soaking experiments show that CO2 has a strong ability to break the rocks, while its ability to expand the fractures is weak [26]. For low-pressure reservoirs, CO2-PPEF can increase formation energy, improve the flowback rate of fracturing fluids, and reduce the damage to the reservoirs [27,28]. The use of CO2 fracturing technologies can not only improve oil production but also effectively realize the geological storage and utilization of carbon dioxide, thus greatly reduce the greenhouse effect [29].
The numerical simulation method was used to investigate the feasibility of CO2-PPEF in the A83 block. In recent years, the integration modeling technology has gradually become an important means of unconventional resources development. Cipolla et al. proposed an integrated workflow of geological engineering for unconventional reservoirs to achieve seamless integration of the whole process from seismic data interpretation to productivity simulation [30]. Porcu et al. investigated the variation of three-dimensional stress field after hydraulic fracturing of shale gas multi-well group, optimization design of well completion plan, refracturing plan, and well spacing by means of integrated geological engineering method [31]. Di et al. proposed an AI-based geology–engineering integration method, treating exploration and development as an organic whole [32]. Based on the idea of integration, the modeling can be divided into three steps, including the dynamic 3D geomechanical modeling, complex artificial fracture networks modeling, and integrated numerical simulation. After modeling, the post-fracturing productivity of conventional volume fracturing and CO2-PPEF can be predicted and compared to verify the applicability of CO2-PPEF in the A83 block.
The Chang 7 member of the Triassic Yanchang Formation in the Ordos Basin is rich in shale oil resources and is one of the most important shale reservoirs in China [33,34,35,36,37,38]. Both the A83 block and the X233 block have the Chang 7 member as the main targeted zone for exploration and development. The geological conditions of the two blocks are similar, and the same volume-fracturing method was used for reservoir stimulation. However, the production of the A83 block after stimulation was significantly lower than the X233 block. This indicated that the current reservoir stimulation method in the A83 block had a poor match with the actual conditions of the reservoir. Therefore, to solve the problem of the A83 block, based on the correlation analysis and difference analysis of dominating factors of productivity, the reason for the low post-frac production of A83 block was clarified, and the method of CO2-PPEF was proposed, and the feasibility of the technology was verified.

2. Materials and Methods

2.1. Data

The correlation analysis selected 337 sets of data, 241 of which were the field data of 197 wells from 2011 to 2020 in blocks A83 and X233, and the rest was interpreted and calculated by the researchers.
Production data (Y) includes cumulative production in the short term (three months and six months), cumulative production in the long term (twenty-four months and thirty-six months), average daily production, and final cumulative oil production of two blocks. To eliminate the effect of nozzles and take into consideration the combined effect of pressure and production, the dynamic reserves are calculated using the material balance method (FMB) [39] and the rate transient analysis, such as Agarwal–Gardner [40], Blasingame [41], and Fetkovich [42]. It can comprehensively evaluate the short-term production and long-term production potential of oil wells. At the same time, to eliminate the influence of horizontal section lengths, the dynamic reserves per 100 m were calculated as the basis for the difference analysis.
Additionally, the correlation parameters (X) were divided into five categories as follows.
  • Geological parameters, such as porosity, permeability, thickness, oil saturation, etc.
  • Geomechanical parameters, such as brittleness index, minimum horizontal principal stress, closure stress, etc.
  • Fracturing treatment parameters, such as pumping rate, fracturing liquid volume, sand ratio, etc.
  • Production characteristic parameters, such as bottom-hole pressure, produced gas-oil ratio, water cut, etc.
  • High-pressure physical property parameters, such as saturation pressure, dissolved gas-oil ratio, oil density under saturation pressure, etc.

2.2. Methods

2.2.1. Correlation Analysis Methods

Based on the research of correlation analysis methods, the Pearson correlation coefficient (PCC) and the Spearman rank correlation coefficient (SRCC) were used to study the effects of different types of parameters on production.
The Pearson correlation coefficient is a statistical method that quantitatively measures the correlation between variables. The characteristic of the method is that linear changes will not affect the results; thus, the change of the unit of the abscissa or the ordinate will not change the value of the correlation coefficient, r, so that the r values of data in different units are also comparable. The formula for calculating the Pearson correlation coefficient, r, is defined in Equation (1) [43]:
r = X Y X Y N X 2 X 2 N Y 2 Y 2 N
where, X is the set of X coordinates of all sample points, Y is the set of Y coordinates of all sample points, and N represents the total number of sample points.
The Spearman rank correlation coefficient (SRCC) is used to estimate the correlation between two variables. It has the advantages of being fast and stable because it does not need to consider the overall distribution pattern and sample size of variables. For two vectors, X and Y , of dimension n, X i and Y i , respectively, represent their corresponding i-th (1 ≤ in) elements. Arrange X and Y in ascending or descending order to obtain two new sets, x = x 1 , x 2 ,   , x n and y = y 1 , y 2 ,   , y n , where element x i is the rank of X i in X , and y i is the rank of Y i in Y . Accordingly, the difference set d i = x i y i is obtained. Then the Spearman rank correlation coefficient of X and Y is defined as in Equation (2) [44]:
r = 1 6 j = 1 n d i 2 n n 2 1
When performing correlation analysis, the correlation between variables is determined by the value of r, which reflects the degree of linear correlation between two variables, and the value range of r ranges from −1 to +1. The standard of the correlation coefficient is shown in Table 1.

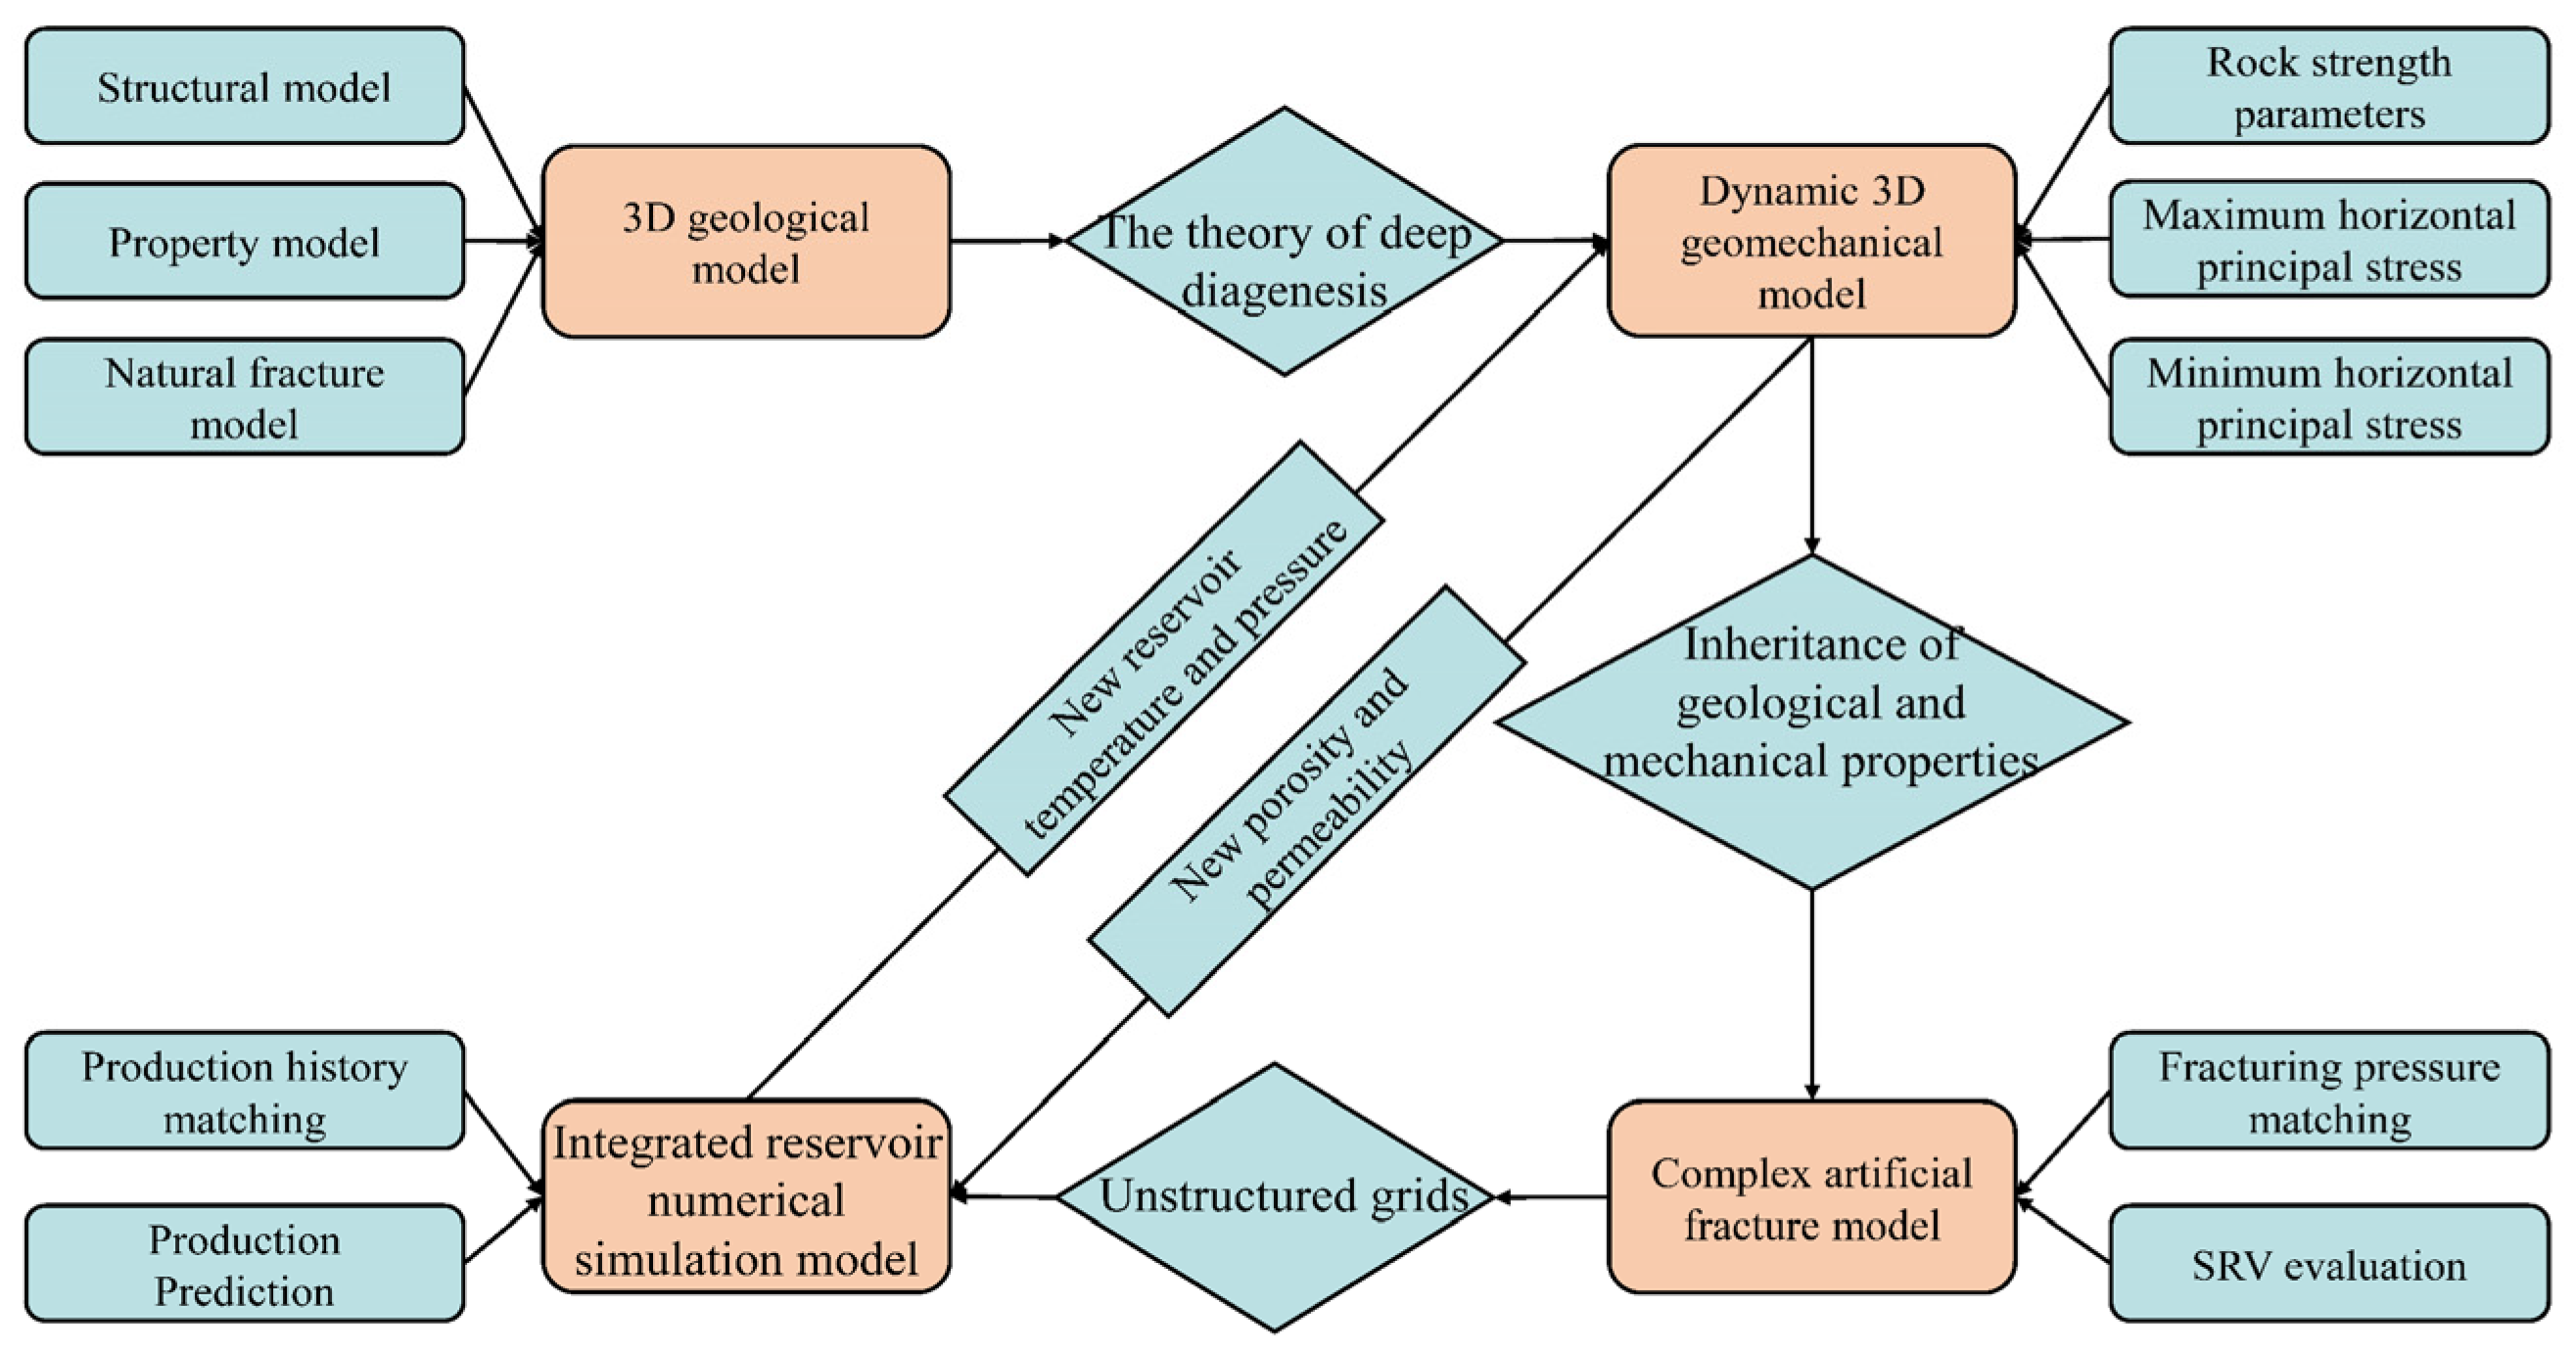
2.2.2. Method of Establishing an Integrated Model of Geology and Engineering

The conventional numerical simulation model is established directly based on the geological model, which ignores the influence of the actual in situ stress environment and complex artificial fractures on the post-frac productivity of shale reservoirs, and the simulation results are quite different from the actual production. However, the integrated modeling method can comprehensively consider the influence of geological conditions, the in situ stress environment, and natural fractures on CO2-PPEF; thus, it can simulate more realistic complex artificial fractures. Therefore, to make the simulation results closer to the real post-frac production, it is necessary to adopt an integrated modeling process (Figure 1).
Based on the idea of integration of geology and engineering, the modeling can be divided into the following three steps.
(1) On the basis of the previous 3D geological modeling, considering the impact of rock mechanical properties and the in situ stress environment on fracturing, a 3D geomechanical model is established based on the theory of deep diagenesis. The 3D geomechanical model can only reflect the current in situ stress conditions of the reservoir. During stimulation and production, the changes in temperature and pressure of the reservoirs will lead to deformation and displacement of the rock, thereby changing the stress. At the same time, the change of the stress will lead to the change of porosity and permeability, thus affecting the production of the reservoirs (Figure 1). Therefore, to simulate the dynamic production process of the reservoirs after fracturing, the iterative coupling method was used to establish the dynamic 3D geomechanical model, and the stress distribution characteristics of the reservoirs at different times can be obtained.
(2) Based on the true 3D geological and geomechanical properties, the complex artificial fracture networks model is established using the unconventional fracture model (UFM). UFM can simulate the initiation and propagation of artificial fractures in the presence of natural fractures, while considering the effect of “stress shadow” [45]. “Stress shadowing” refers to the phenomenon that different artificial fractures extend and intersect each other at the same time, and the formed hydraulic fractures will generate additional stress on adjacent fractures.
For hydraulic fractures to pass through natural fractures and generate new fractures, the maximum hoop tensile stress at the stress concentration point needs to be greater than the tensile strength of the rock [46]:
σ θ θ x j ; r ; θ j r < δ T T 0
At the same time, according to the energy criterion, the elastic strain energy released by new fractures needs to be greater than the critical energy required for the rock rupture:
G i n c δ l > G I C = K I C 2 E ,     δ l < δ T
where, σ θ θ is the maximum hoop tensile stress, MPa; x j is the stress concentration point; θ j is the angle between the maximum hoop tensile stress and the natural fracture, degree; r is the range of potential initiation crack lengths, m; δ T is the radius of critical stress area, m; T 0 is the tensile strength of the rock, Mpa; δ l is the length of the new fracture, m; G i n c is the energy release rate, MN/m; G I C is the critical energy release rate for the rock rupture, MN/m; K I C is the plane-strain fracture toughness of the rock, Mpa   m 1 / 2 ; E is the average value of plane-strain modulus of the rock, Mpa.
(3) Productivity evaluation of fractured wells is a very important part of post-fracturing evaluation, and numerical simulation is the most commonly used method of productivity evaluation. The traditional evaluation methods mostly use preset simple fractures for numerical simulation. It is simple and fast, but it is difficult to characterize the stimulation effect of complex fractures. Therefore, the simulation results are usually quite different from the production data. To accurately simulate the development effect after fracturing, unstructured grids are used to describe the seepage channel of the complex artificial fracture network after CO2-PPEF. On this basis, the integrated numerical simulation is carried out to complete the post-fracturing evaluation.

3. Results and Discussion

3.1. Correlation Analysis of Dominating Factors of Productivity

3.1.1. The Dominating Factors of the Production Capacity of Blocks A83 and X233

To eliminate the influence of different horizontal section lengths and nozzles, the dynamic reserves per 100 m were calculated as the basis for the difference analysis. The average length of the horizontal section of the X233 block was nearly twice that of the A83 block (Figure 2a), while the dynamic reserves per 100 m of the X233 block were still twice that of the A83 block (Figure 2b). It indicated that the length of the horizontal section was not the main reason for the difference in post-frac productivity. It is necessary to carry out a productivity correlation analysis of the two blocks to clarify the main controlling factors of productivity and to propose an effective fracturing method for the A83 block based on the difference analysis.
The results of the correlation analysis showed that the dominating factors of the production capacity of the two blocks were similar. Those parameters that had higher degrees of correlation with the production data included: thickness, porosity, oil saturation, brittleness index, minimum horizontal principal stress, closure stress, water cut, and dissolved gas–oil ratio (Table 2).

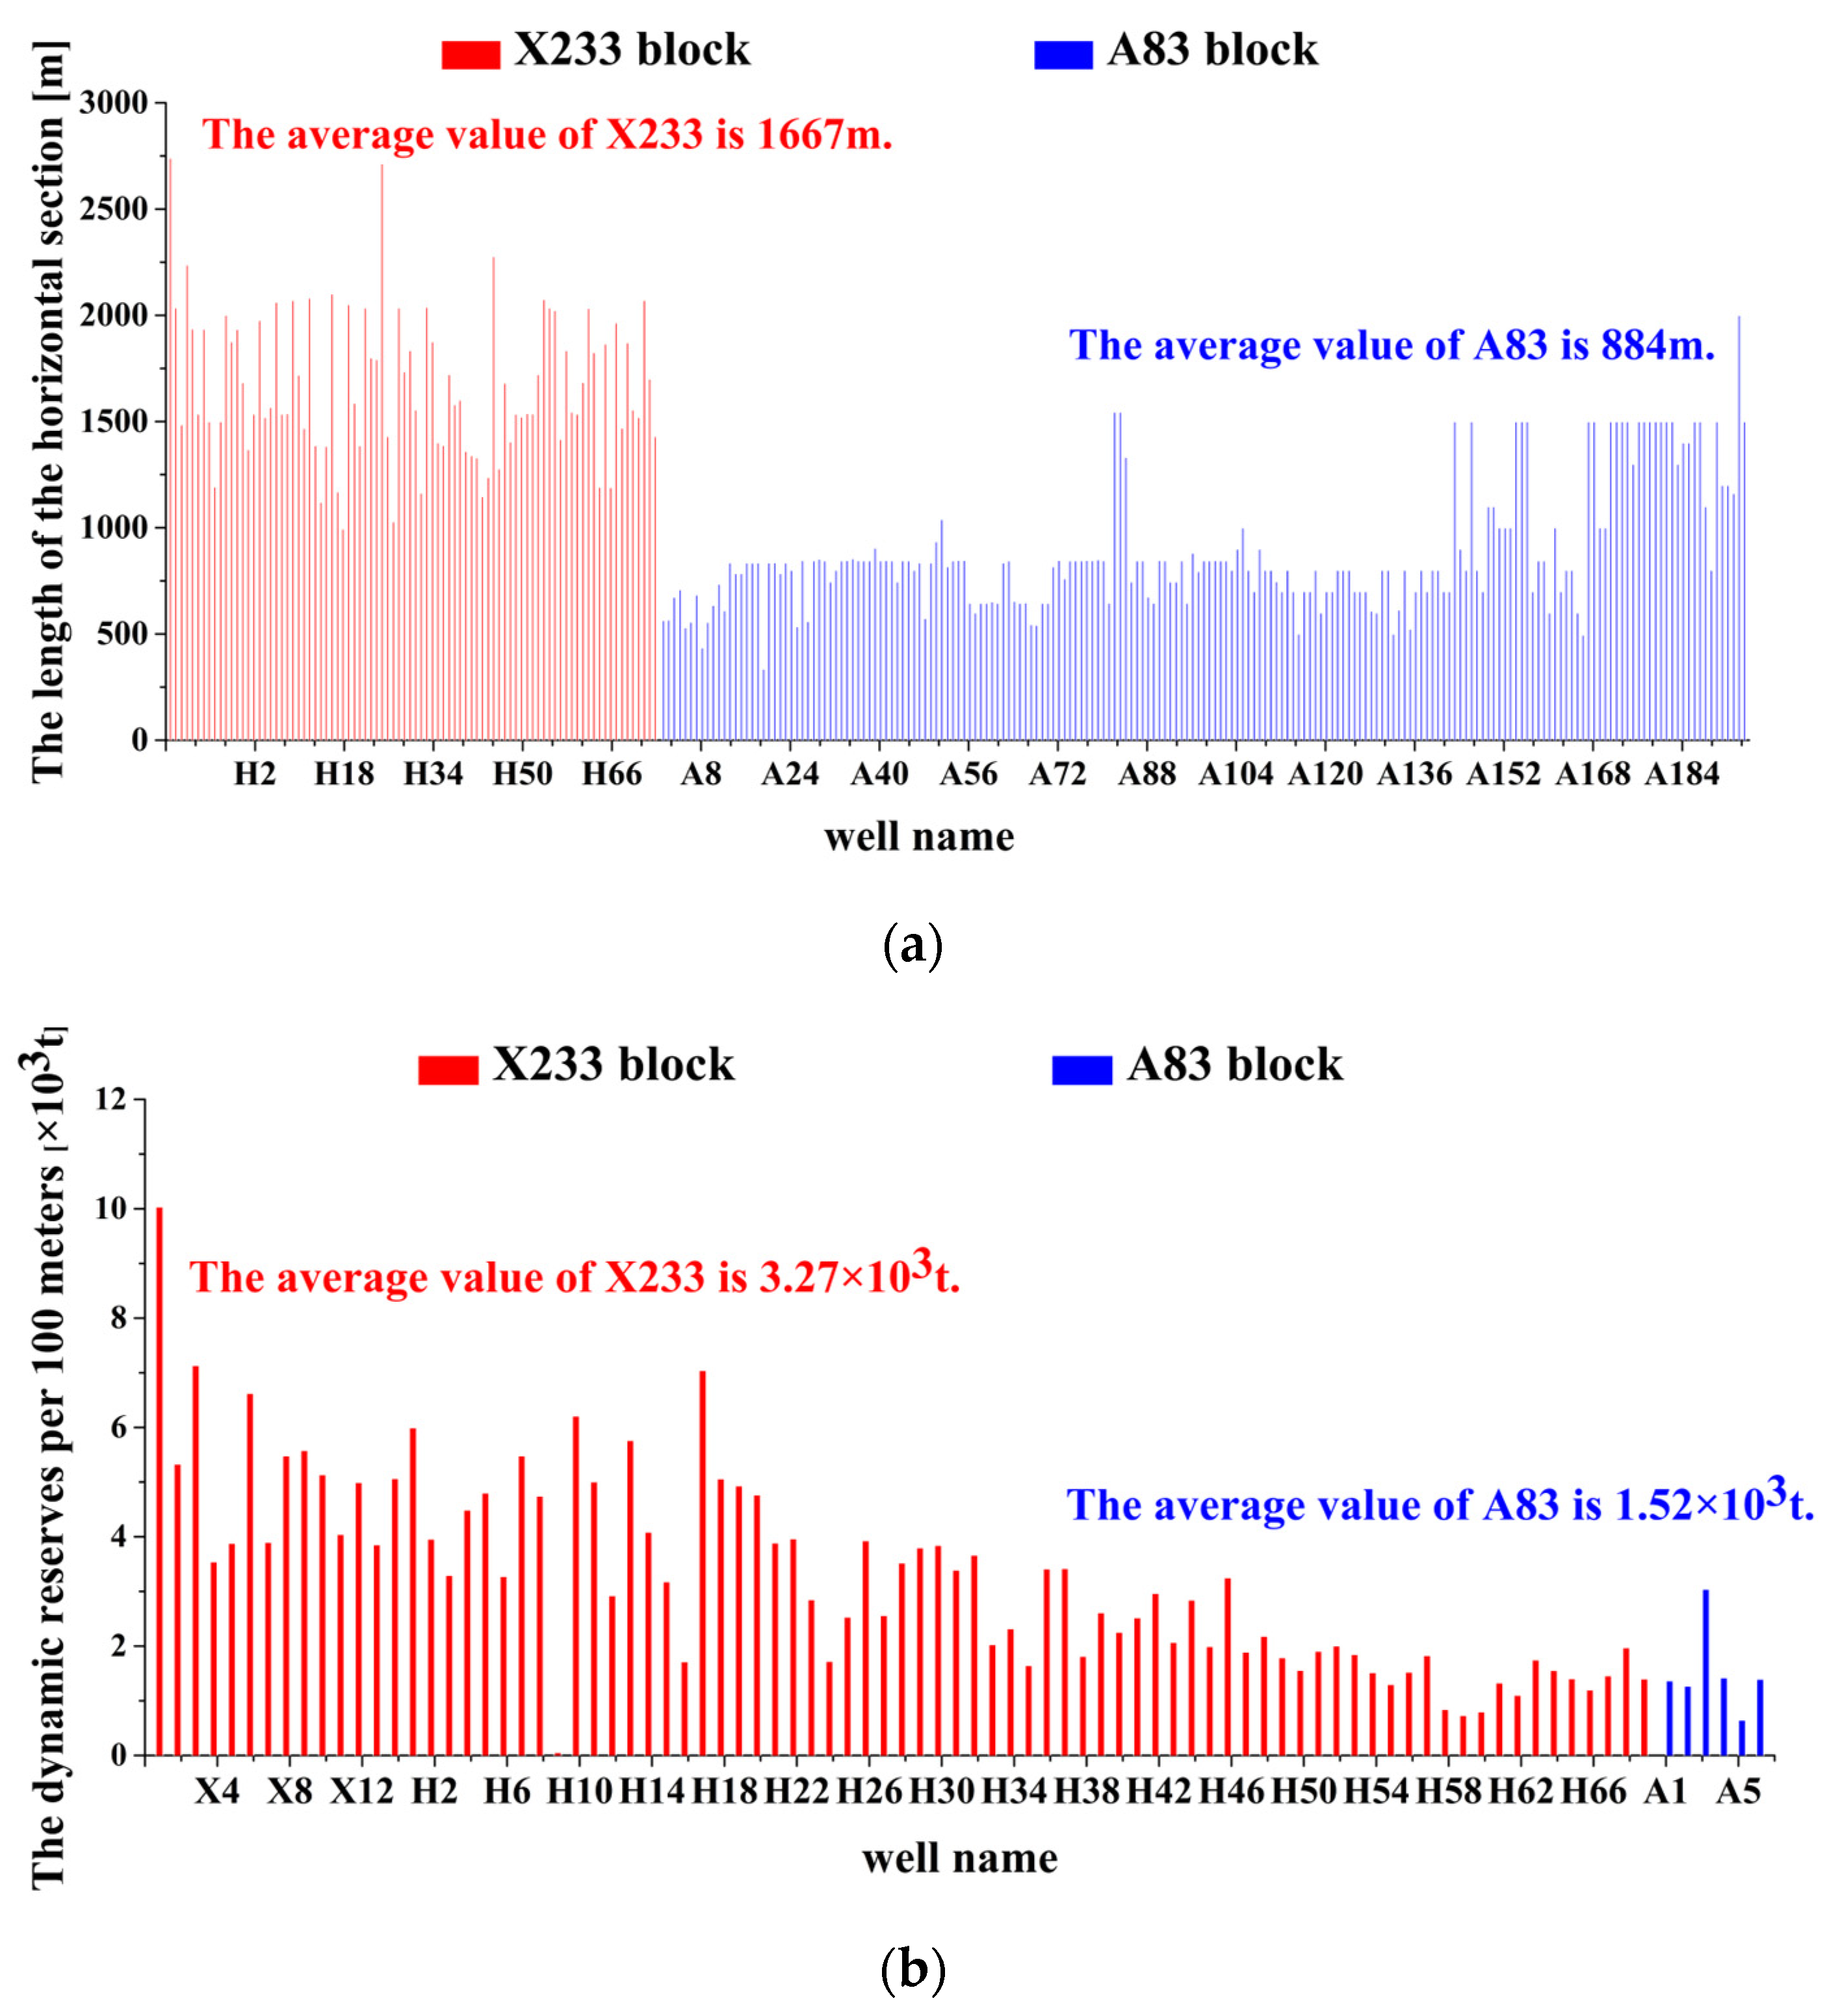
3.1.2. Difference Analysis of Dominating Factors of Productivity of Blocks A83 and X233

From the five aspects of geological parameters, geomechanical parameters, fracturing treatment parameters, production characteristic parameters, and high-pressure physical property parameters, the dominating factors of productivity of blocks A83 and X233 were compared, and the reasons for their differences in production capacity were analyzed (Table 3).
After comprehensive comparison, it was found that there was little difference between blocks A83 and X233 in geological parameters and engineering parameters. However, in terms of geomechanical parameters, there was a certain difference between them. The average brittleness index of the X233 block was 0.9 higher than that of the A83 block, the minimum horizontal stress of the A83 block was 1.7 MPa higher than that of the X233 block, and the closure stress of the A83 block is 3.1 MPa higher than that of the X233 block. It meant the compressibility of the X233 block was better, and it was easier to form a complex fracture network. Nonetheless, the differences in geomechanical parameters were not enough to cause the gap of dynamic reserves per 100 m of the two blocks.
With the comparison of production characteristic parameters and high-pressure physical property parameters of two blocks, it could be found that the dissolved gas–oil ratio of the A83 block decreased by 2.1 times that of the X233 block after one year’s production, and the ultimate water cut of the A83 block was 53.75%, while that of the X233 block was 38.97%. That indicated that the formation energy in the A83 block was insufficient; thus, a large amount of the light components in the crude oil were precipitated after production, resulting in an rapid rise in water cut, which inhibited the production after fracturing.

3.1.3. The Mechanism of CO2 Pre-Pad Energized Fracturing in A83 Block

As an emerging reservoir stimulation technology, CO2-PPEF has been successfully conducted in the Jinlin Oilfield and the Yanchang Oilfield in China and has enhanced the stimulation and production of shale oil reservoirs [27,28]. CO2-PPEF can not only promote the opening of natural fractures and improve the complexity of artificial fractures but also promote the reaction between CO2 and rocks to increase the porosity and permeability of the reservoirs [26,29]. In addition, due to the high compressibility of CO2, it can improve the flowback rate of the fracturing fluid, replenish the formation energy, and restrain the increase of water cut. The effects can be summarized as follows.
  • After CO2 is dissolved in water, it will dissolve with fillings in natural fractures (such as calcite), which can reduce the fracturing pressure and promote the activation of natural fractures to form complex hydraulic fractures.
  • The shale matrix can be corroded by CO2 solution under reservoir temperature and pressure, which can expand the original pores and even form new pores, in-creasing the porosity and permeability of the matrix.
  • CO2 will be dissolved in crude oil after injection; it can reduce the viscosity of crude oil and improve the formation energy.
  • CO2 has high compressibility; it will form the “gas cap” in the reservoir after injection and continuously occupy the volume after crude oil discharge, inhibiting the invasion of water and restraining the increase of water cut. If CO2 is injected after fracturing, it will drive oil from near wellbore to the far end, which will reduce the recovery factor.
Through the difference analysis, it can be concluded that the low production after fracturing in the A83 block was mainly due to the low formation energy which cannot effectively suppress the rapid intrusion of interlayer water. Aiming at the reasons for the low production in the A83 block after stimulation, the CO2-PPEF technology was suggested. The interaction between CO2 and rocks can promote the rupture of natural fractures, thereby increasing the complexity of the fracture networks. After the CO2 fluid was injected, a high viscosity water-based fracturing fluid with proppant was injected subsequently to further extend and prop artificial fractures. At the same time, after CO2 was injected into the formation, it would gasify and expand due to the increase of temperature, which can supplement the formation energy and reduce the incremental rate of water cut, thereby increasing the post-frac productivity of the A83 block.

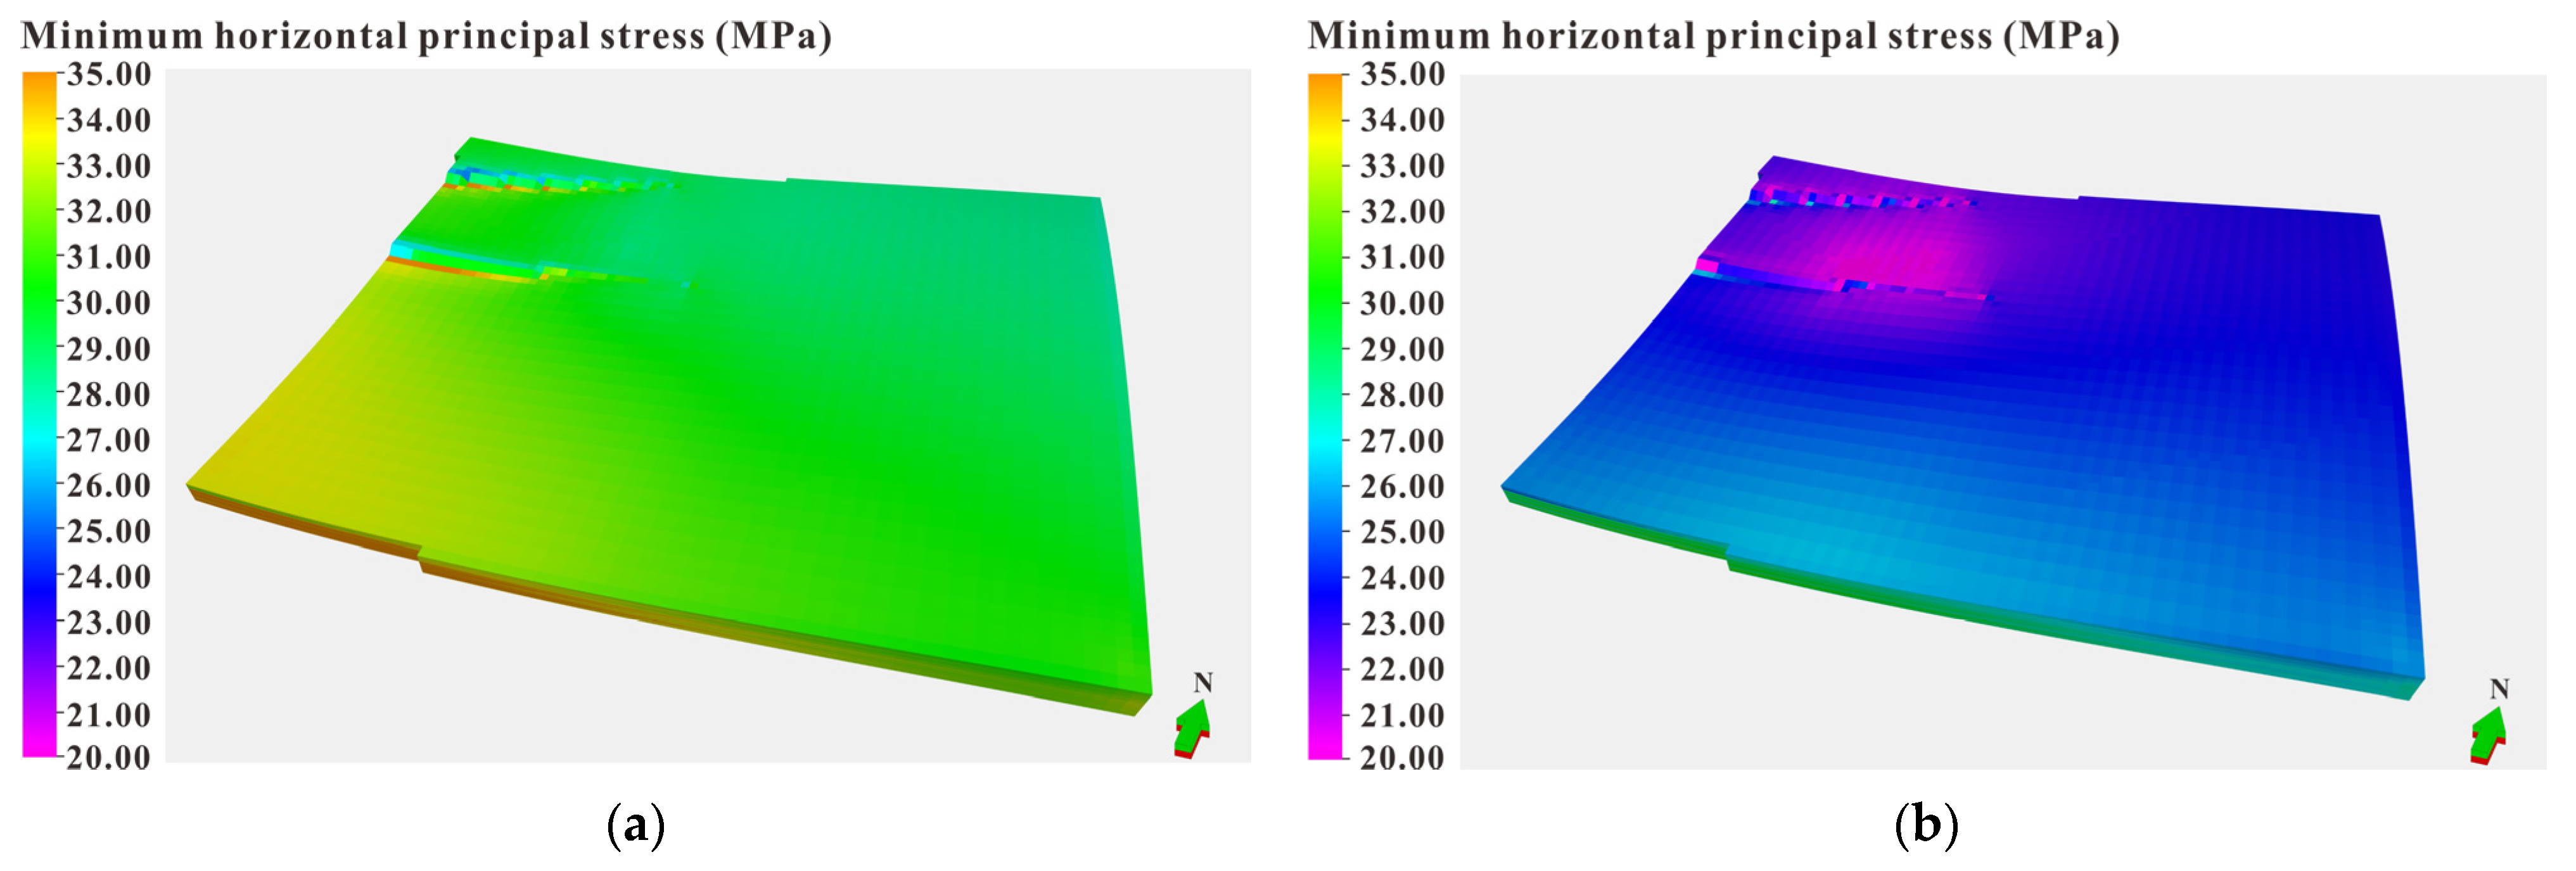
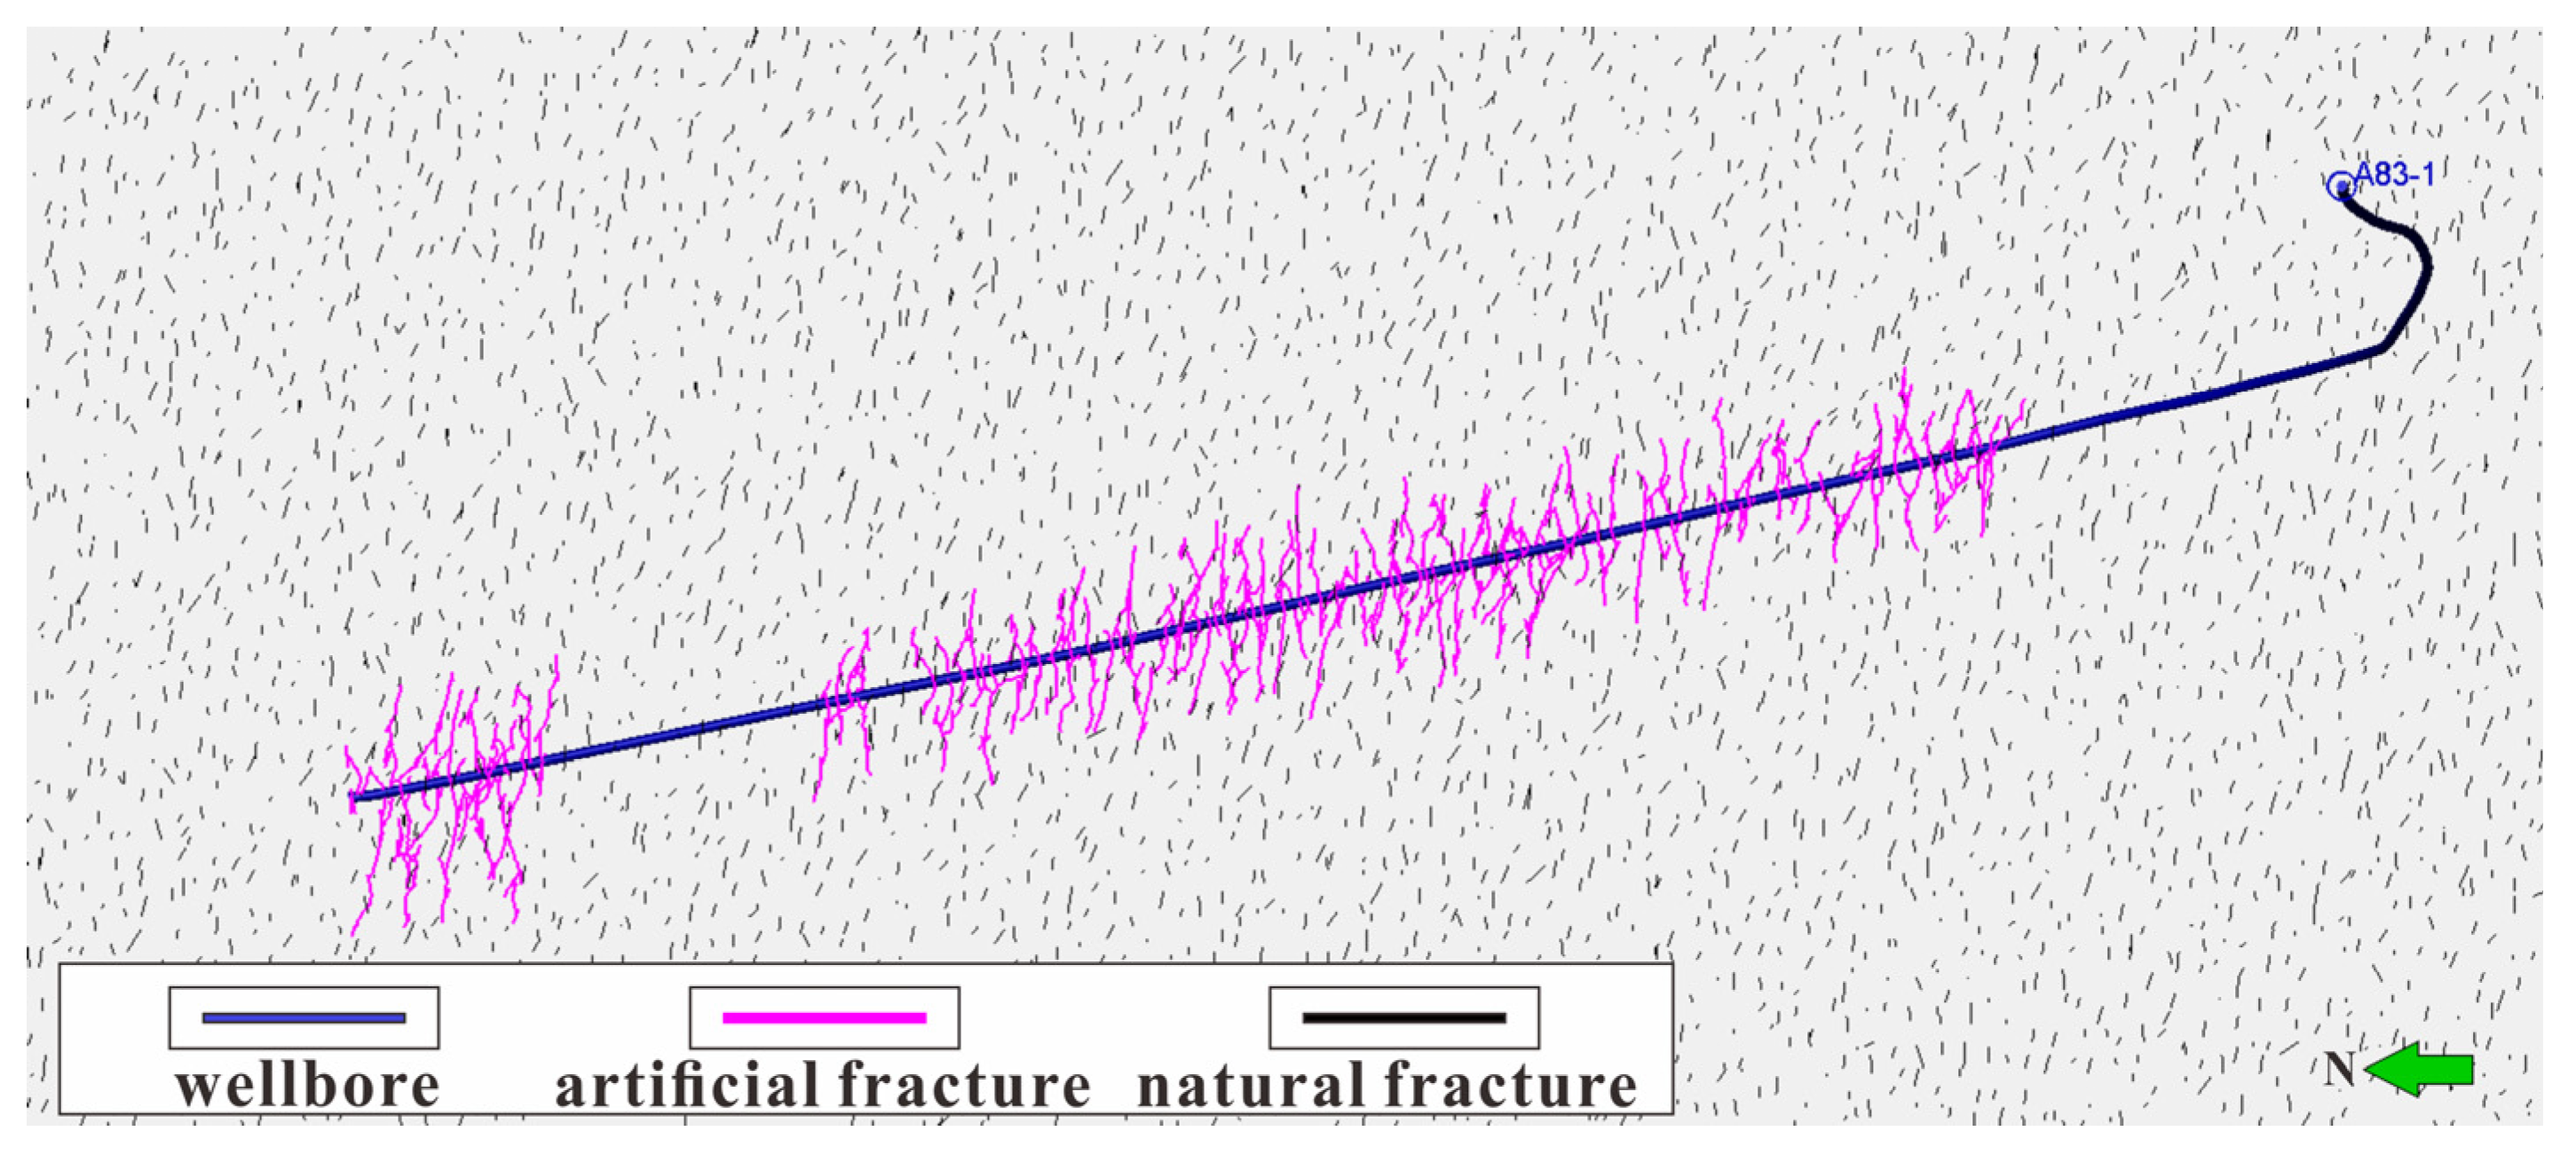
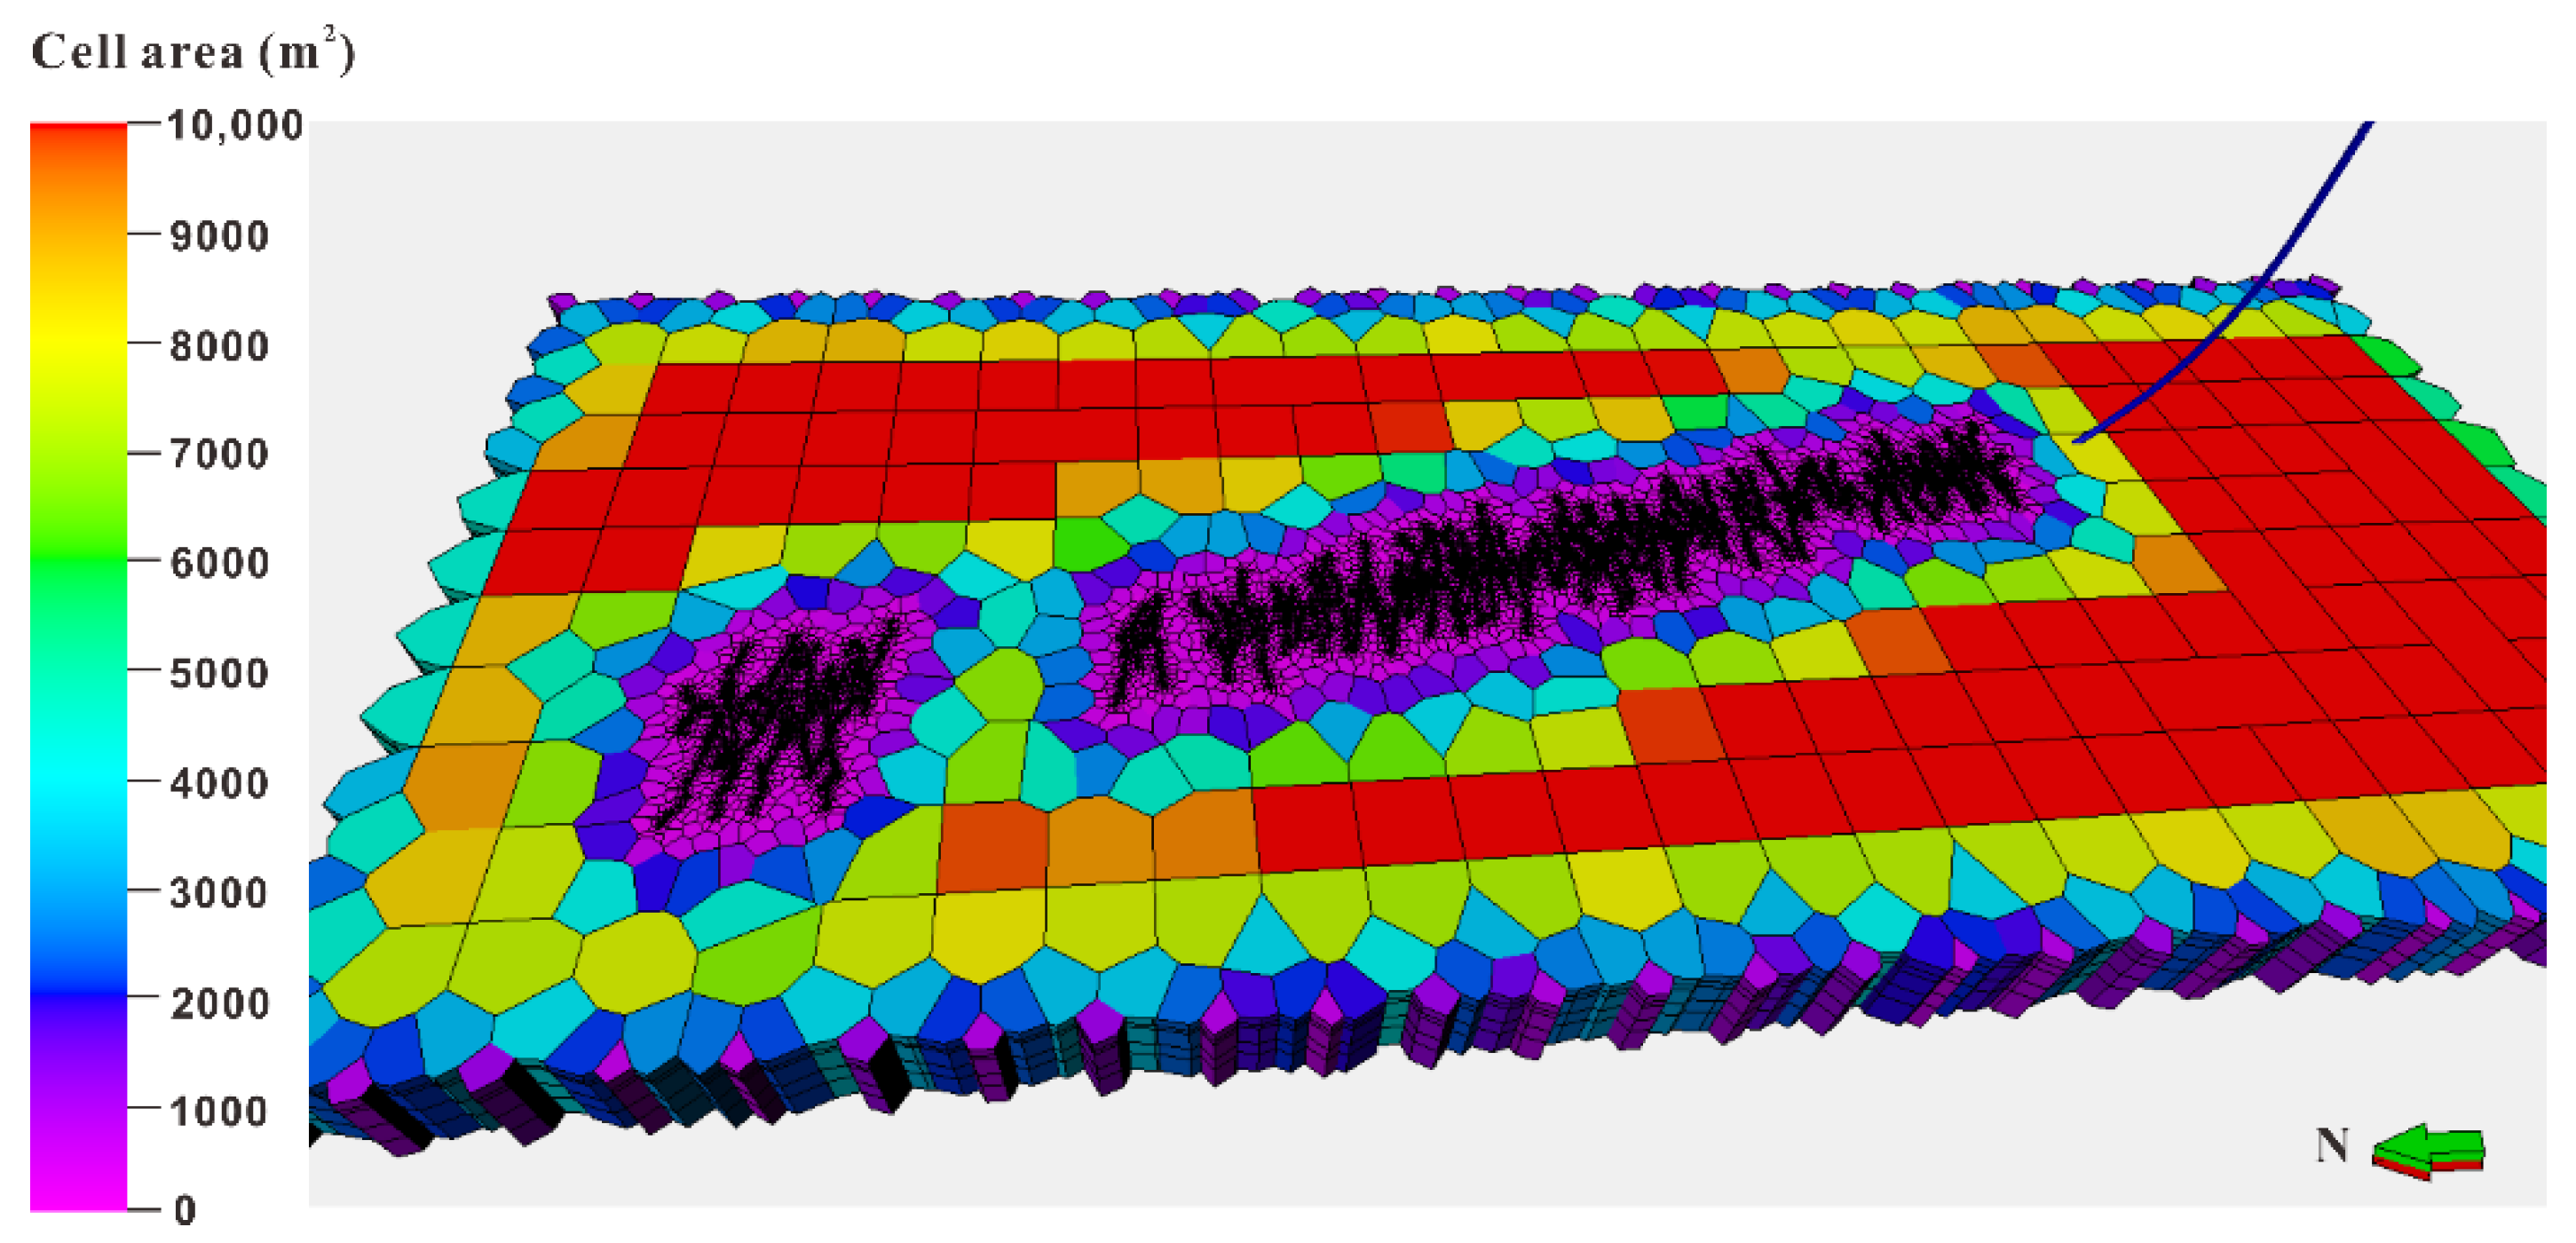
3.2. Establishment of a Geo-Engineering Integrated Model of Well A83-1 after Conducting CO2 Pre-Pad Energized Fracturing

The key production well A83-1 is an example used to study the feasibility of CO2-PPEF technology in the A83 block. The main production layer of well A83-1 is the Chang 72 layer of the Yanchang Formation, the reservoir was buried at a depth of 2250 m, the original formation pressure is 16.9 MPa, and the pressure coefficient is 0.75. The average porosity of the reservoir is 8.9%, and the average permeability is 0.12 mD. After conducting conventional volume fracturing (Table 4), the initial oil production of well A83-1 was considerable, which can reach more than 40 sm3/d. But the daily oil production dropped very fast, and in only half a month it seemed to drop to about 16 sm3/d.
Based on the method of establishing an integrated model of geology and engineering, the dynamic 3D geomechanical model of the Chang 7 member of the Yanchang Formation in the A83 block was established based on the 3D geological model. As shown in Figure 3, before reservoir development, the average minimum horizontal principal stress of the Chang 7 member of the Yanchang Formation in the A83 block was about 30 MPa, but after one year of production, the average stress dropped to 23 MPa and to even only 20 MPa in some areas, which indicated that the formation energy is insufficient; thus, the reservoir stress dropped rapidly after production.
The complex artificial fractures model of well A83-1 was established using the unconventional fracture model (UFM); thus, phenomena, such as “stress shadow” and inter-well interference between fractures, can be simulated. As shown in Figure 4, after considering natural fractures and stress shadow, the morphology of artificial fractures is very complex rather than the simple double-wing symmetrical fractures.
Ultimately, to accurately simulate the actual development effects after fracturing, an integrated reservoir numerical simulation mode (Figure 5) can be established based on the unstructured grids of the networks model, which is helpful to compare the productivity difference of the well A83-1 after conducting different fracturing methods.

3.3. Numerical Simulation of Productivity of Well A83-1

According to the integrated numerical simulation model of well A83-1, the productivity after actual volume fracturing and the CO2-PPEF were simulated, respectively. The production data of different fracturing methods were compared to evaluate the feasibility of CO2-PPEF for enhancing oil recovery in the A83 block.

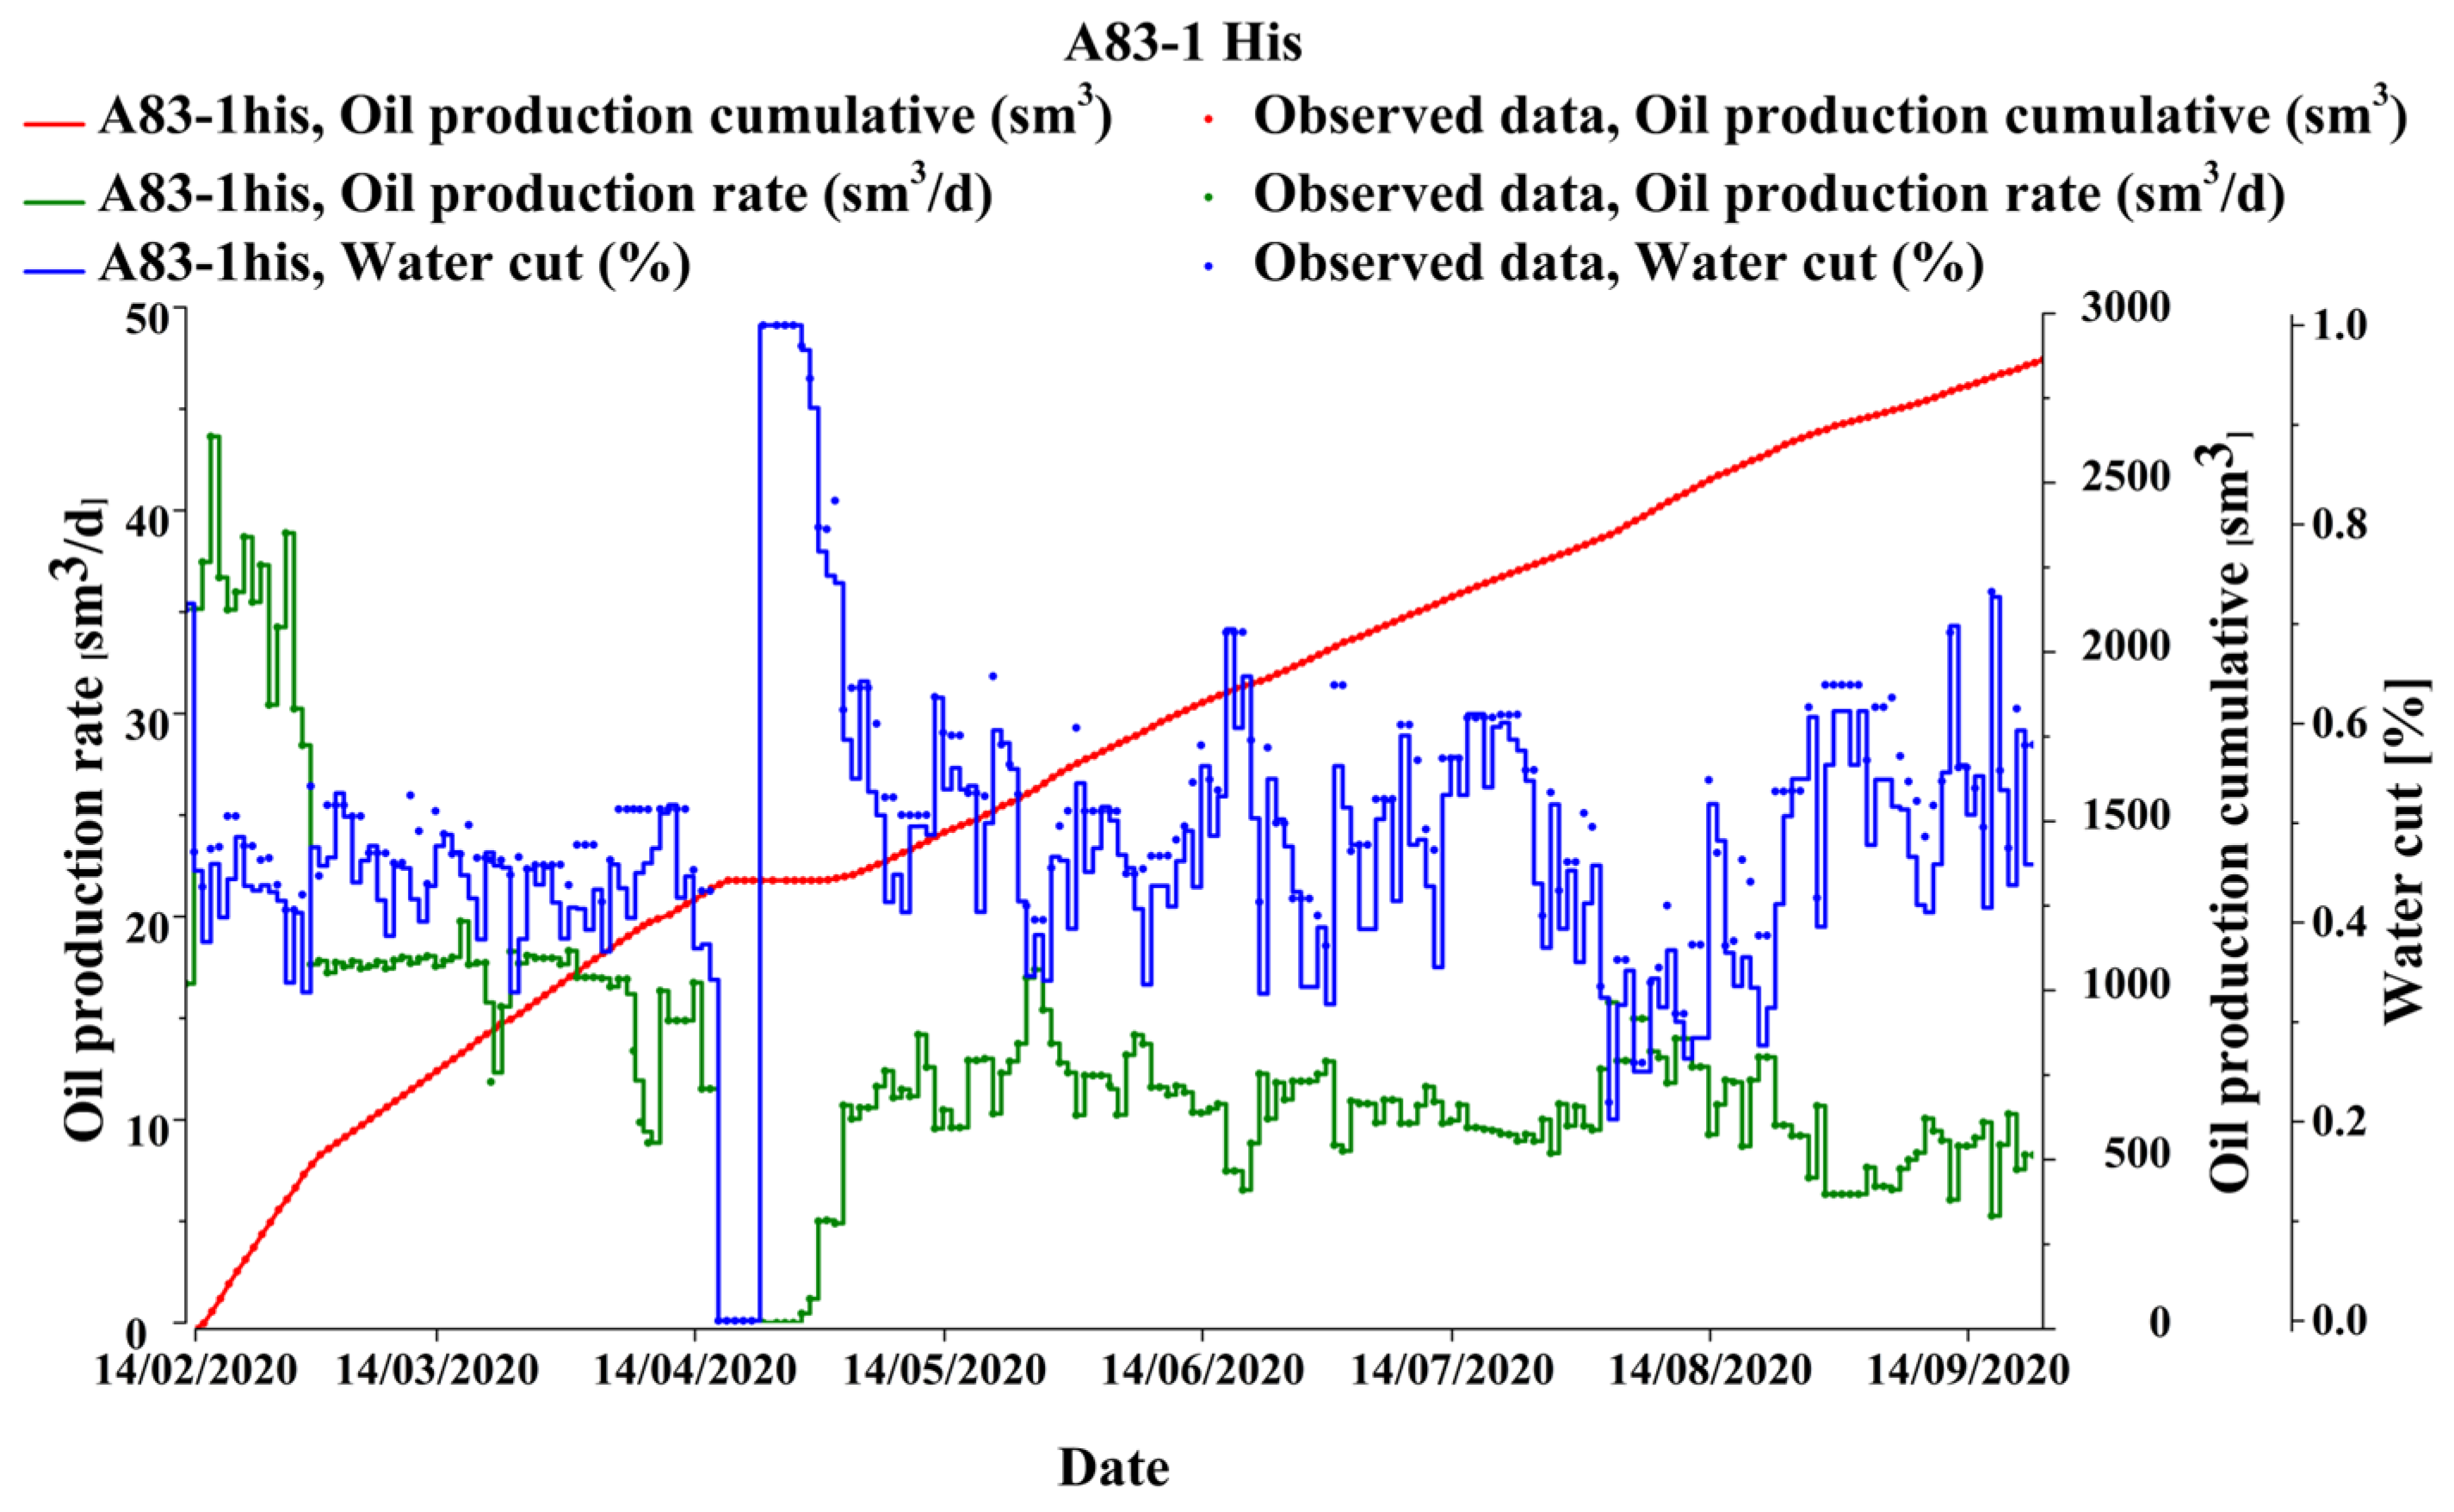
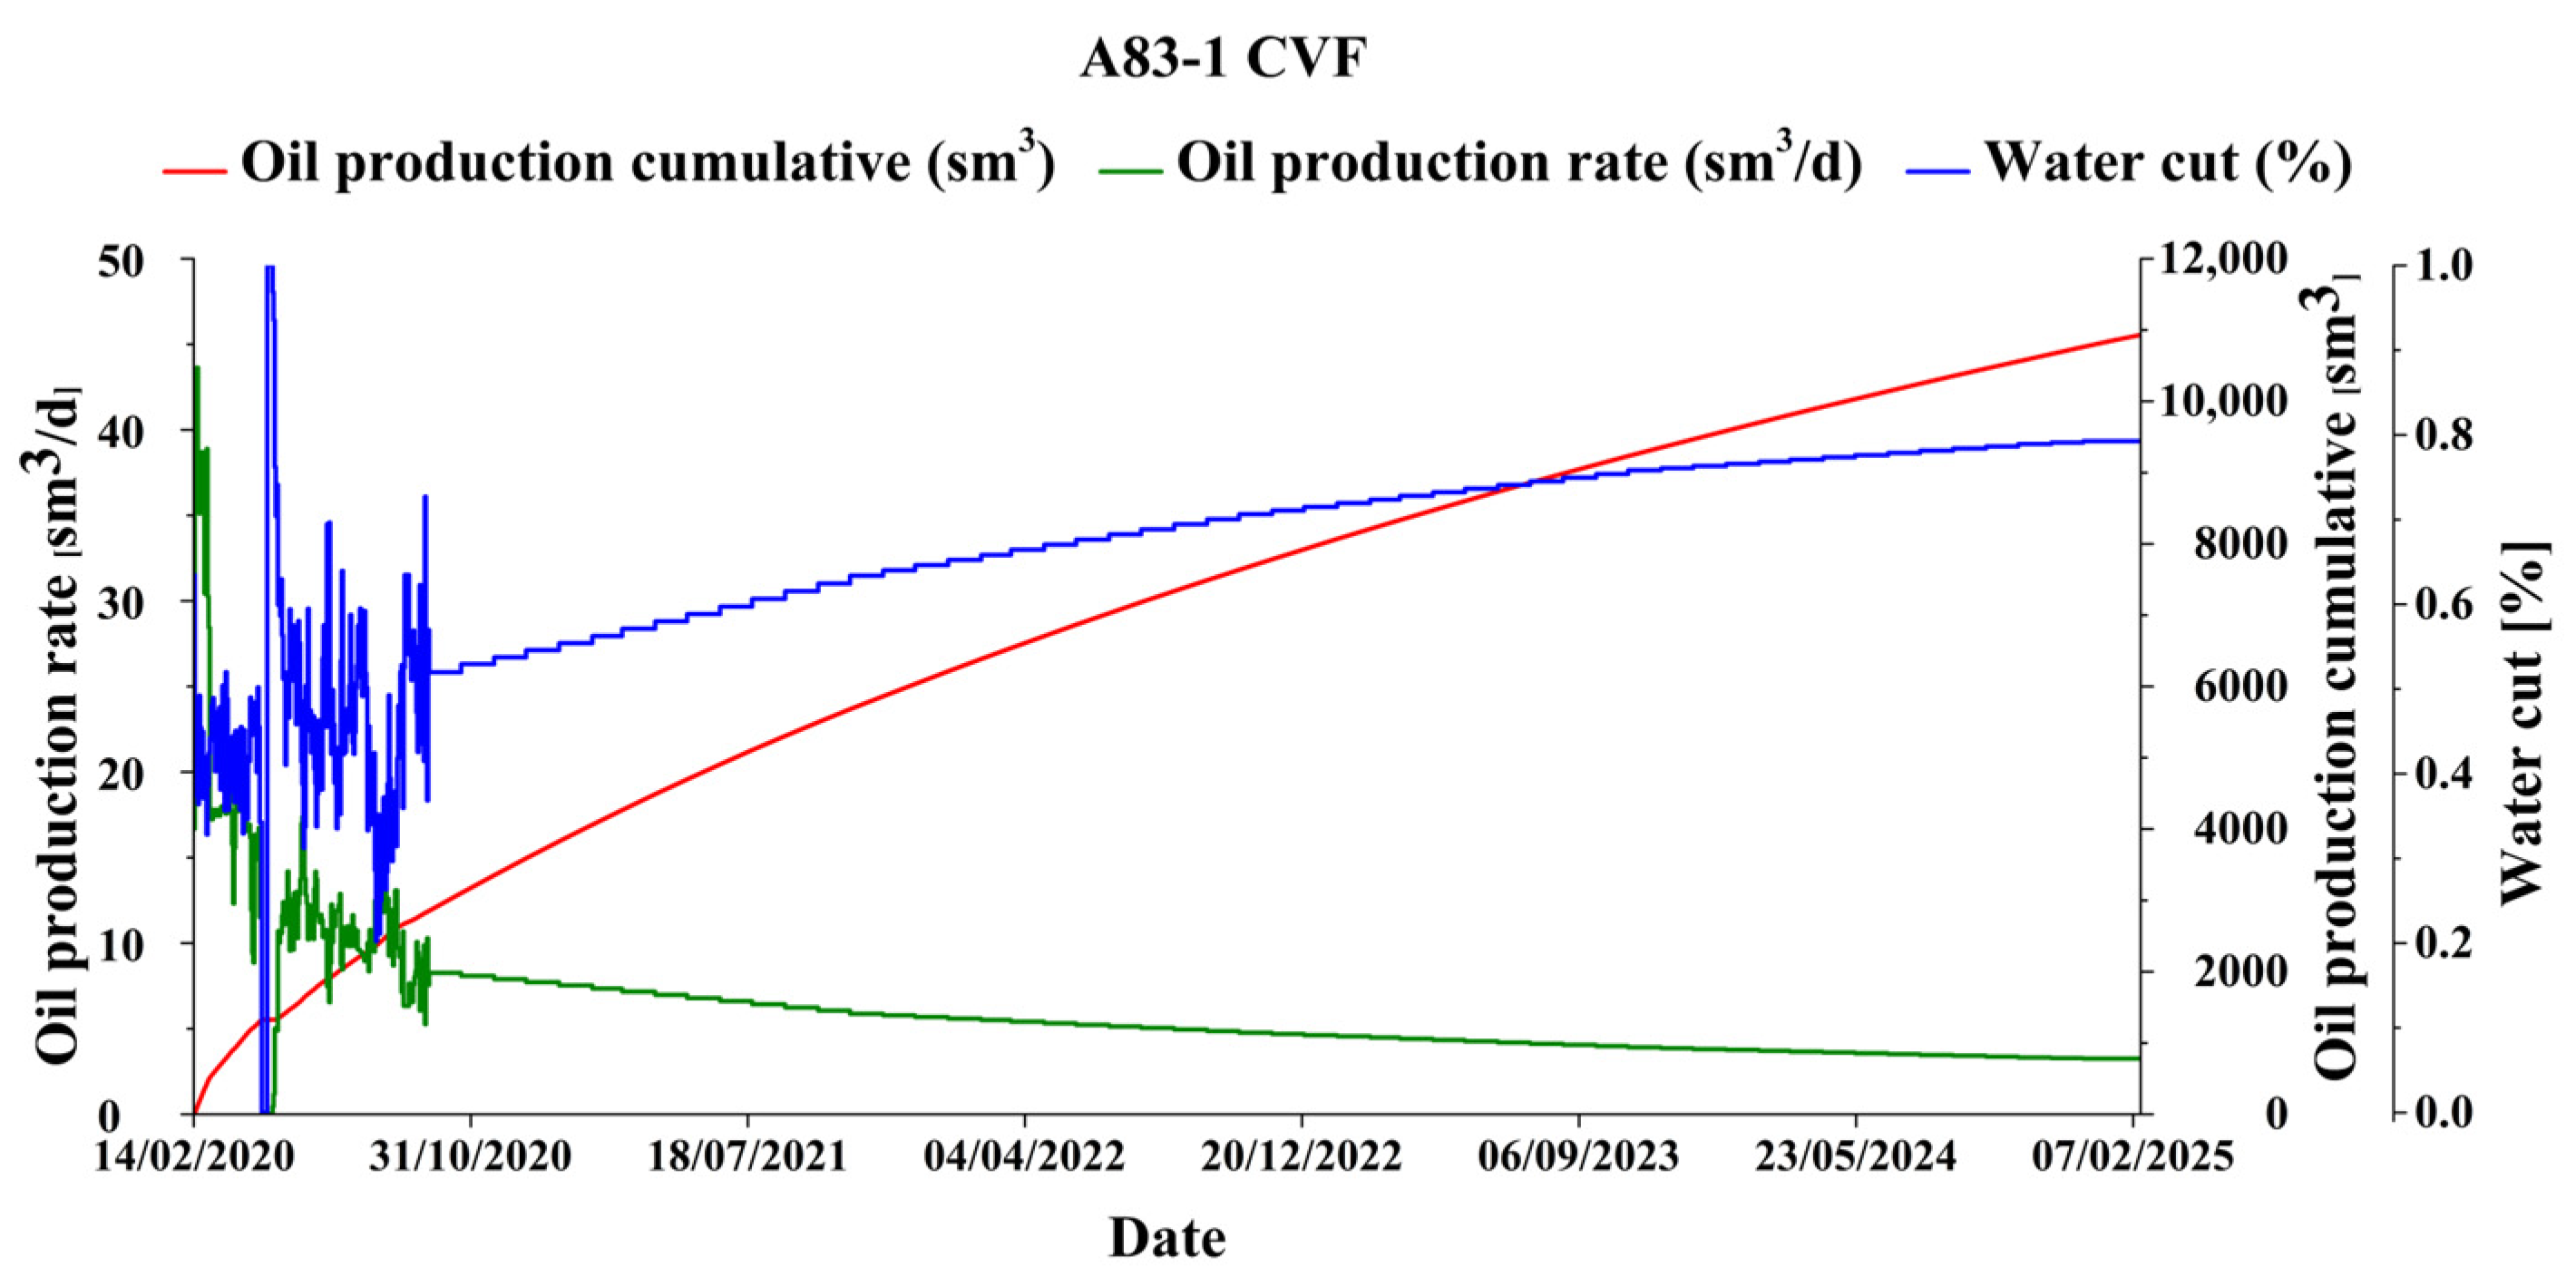
3.3.1. History Matching and Production Prediction of Well A83-1 after Actual Volume Fracturing

Based on the integrated reservoir numerical simulation model, the numerical simulation study of well A83-1 after conventional volume fracturing was carried out. To verify the reliability of the model, the method of matching production dynamic data was usually used to make the model closer to the actual reservoir situation as to predict the production progress after fracturing precisely. The oil production was well fitted, and the water cut can also reflect the actual production law (Figure 6).
By analyzing the production data (Figure 6), it was found that the water cut of well A83-1 was as high as 45% in the first month of production after fracturing, and the daily oil production at the initial stage could reach the highest level of 43.5 sm3/d, which proved that good reservoir stimulation effects had been achieved. However, the daily oil production dropped by 50% within only half a month, and the water cut rose to more than 50%, which indicated that the formation energy of well A83-1 was insufficient to restrain the rise of water cut, resulting in a rapid decline in oil production.
Based on the history matching of production data, the oil production and water cut of well A83-1 within five years after the conventional volume fracturing were predicted (Figure 7). In the first year of prediction, the daily oil production dropped rapidly from the highest 43.5 sm3/d to 7.5 sm3/d, and after five years of production, it dropped to about 3 sm3/d, and the cumulative oil production for five years was about 11,000 sm3. Water appeared immediately after production, and ultimate water cut was about 79%.

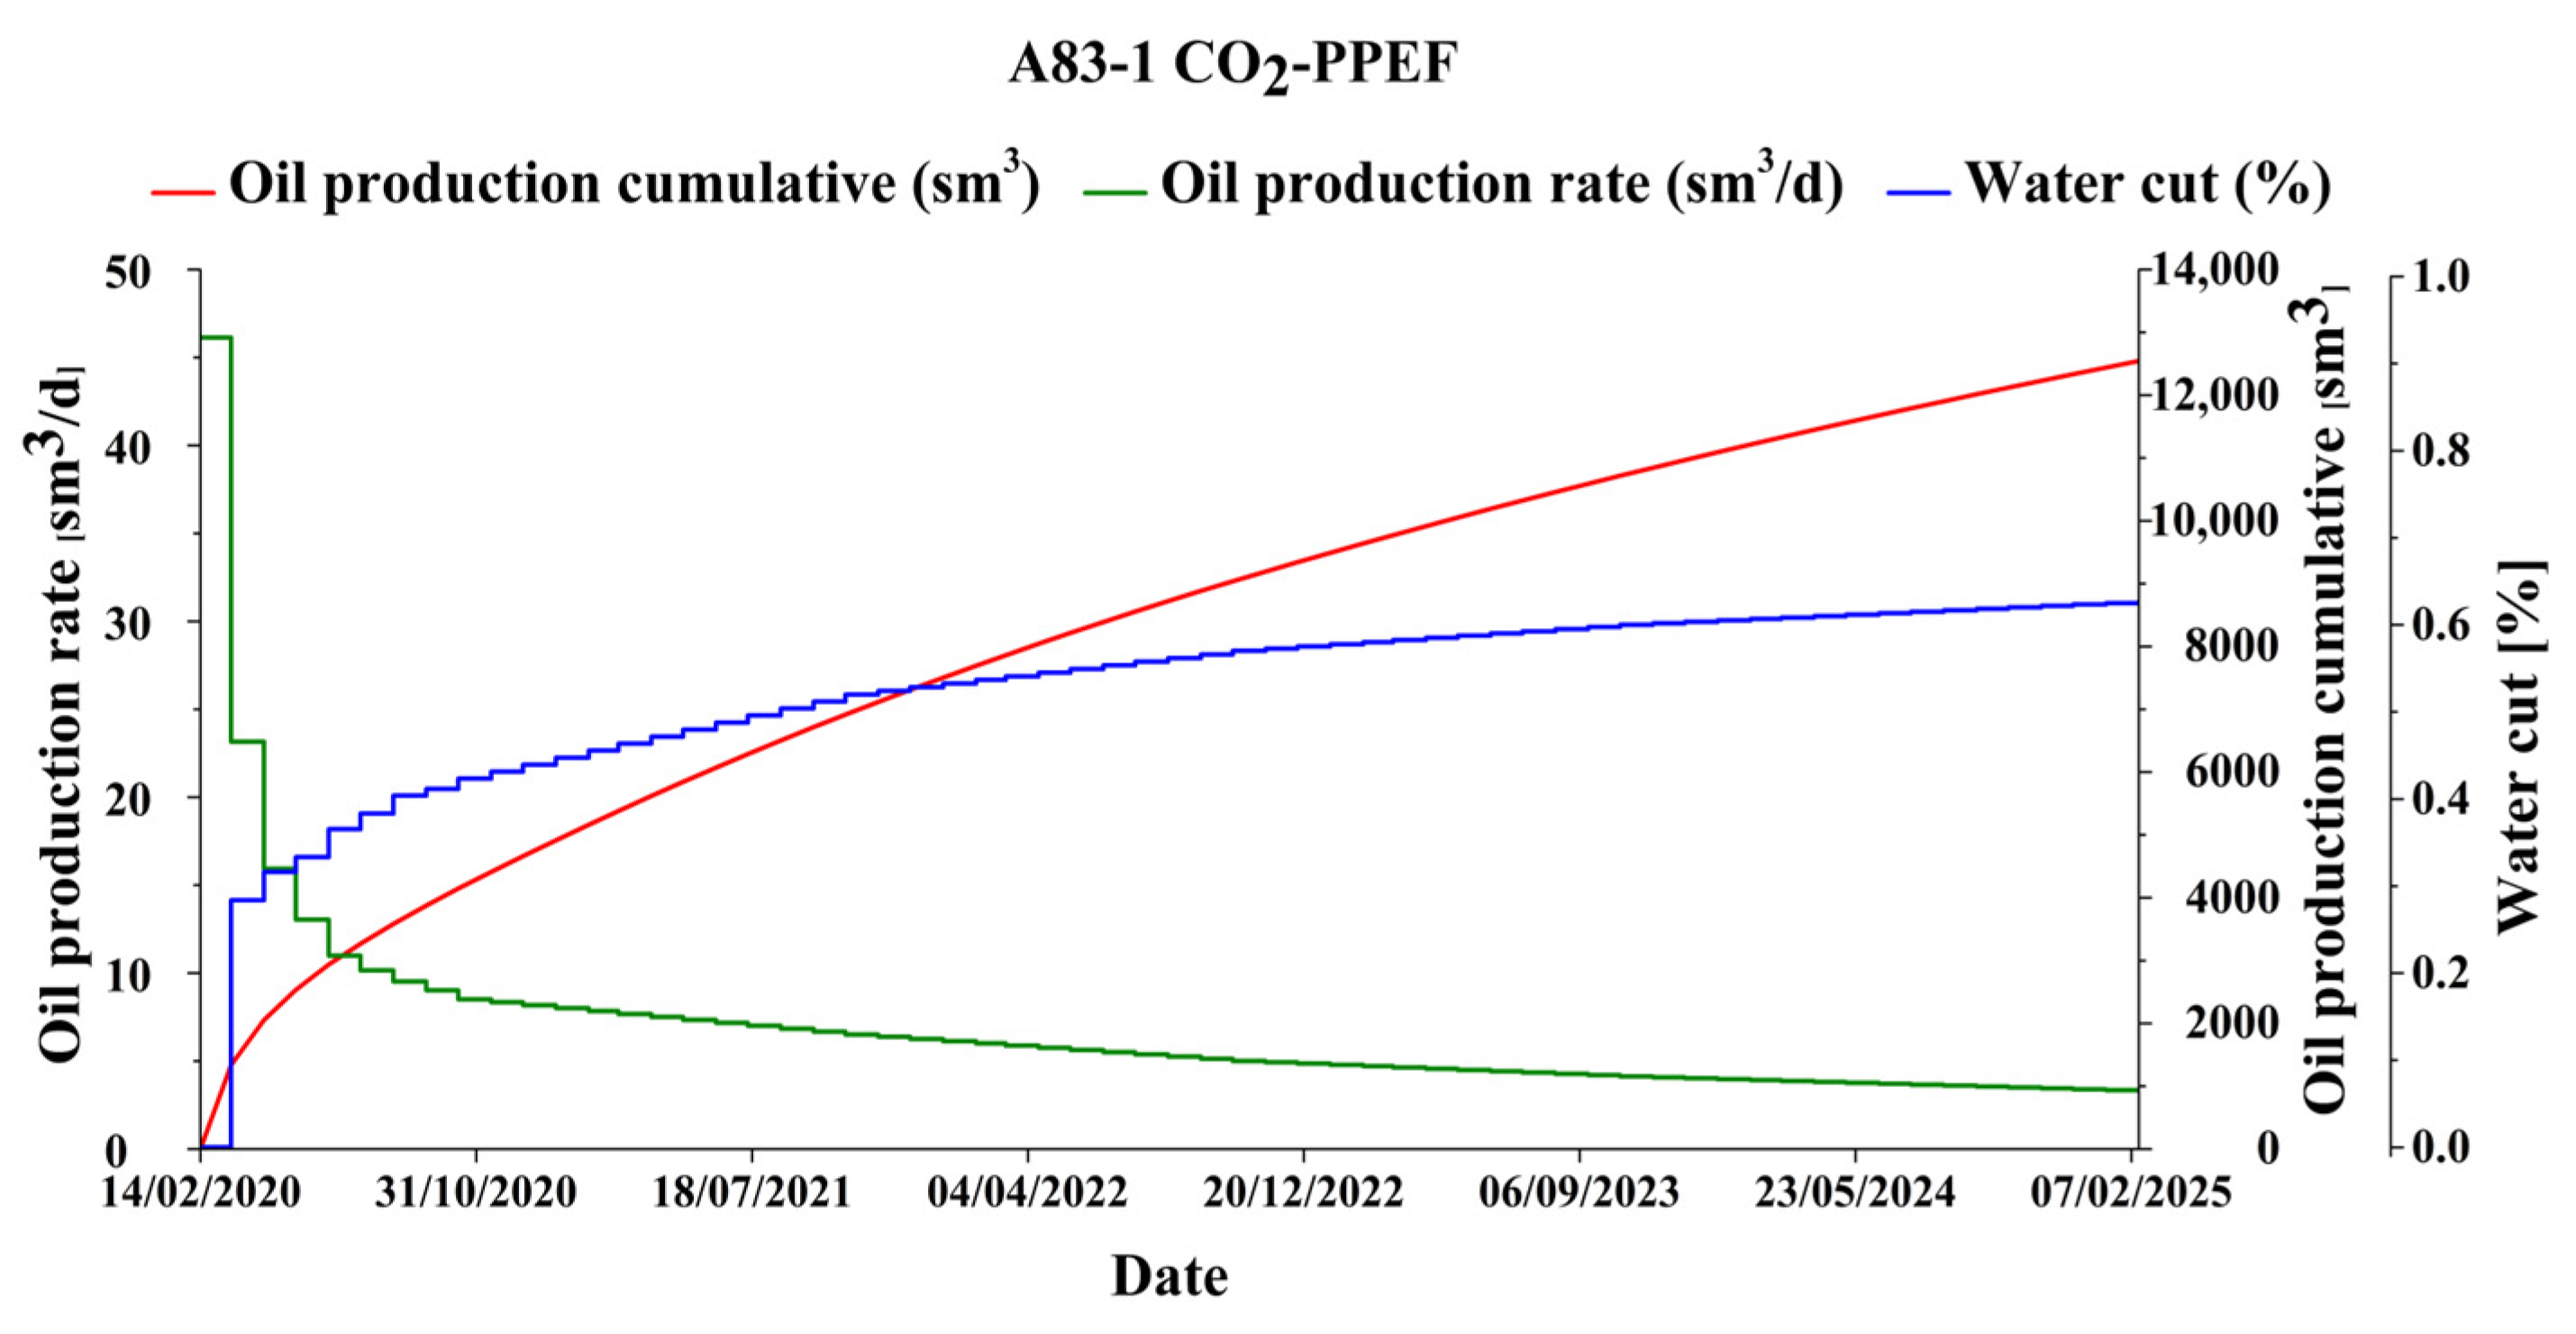
3.3.2. Production Prediction of Well A83-1 after CO2 Pre-Pad Energized Fracturing

According to the design scheme of CO2-PPEF (Table 4), the complex artificial fracture network model was generated. Based on the artificial fracture network model, a new reservoir numerical simulation model was established, and the production prediction results of A83-1 after CO2 pre-energized fracturing were obtained.
The oil production and water cut of well A83-1 within five years after CO2-PPEF were predicted (Figure 8). The maximum daily oil production could reach 46 sm3/d in the early stage of production, it would drop to 8.5 sm3/d after the first year of production, finally drop to about 3.5 sm3/d after five years of production, and the cumulative oil production for five years was about 12,300 sm3. Water appeared about one month after production, and ultimate water cut was about 62.5%.

3.3.3. Comparison of Stimulation Effects of Two Fracturing Methods

By contrasting the production prediction of conventional volume fracturing and CO2-PPEF in well A83-1 (Table 5), it was found that due to the energizing effect of CO2, the initial maximum production was slightly increased from 43.5 sm3/d to 46 sm3/d, the production decline rate slowed down, and the cumulative oil production increased by about 11.8% compared with conventional volume fracturing. In the early stage of production, due to the “gas cap” effect of CO2, the time of water breakthrough was delayed by one month, and the final water cut also dropped from 79% to 62.5% at the end of five years. In general, compared with conventional volume fracturing methods, CO2-PPEF has a better stimulation effect. It also proved that the CO2-PPEF has good feasibility in the A83 block.

4. Conclusions

The current stimulation method in the A83 block is poorly matched with the actual conditions of the reservoir, resulting in low production after fracturing. Through the correlation analysis, the differences in the dominating factors of productivity of the A83 block and the X233 block were analyzed. The reason for the low production of the A83 block was clarified. Therefore, CO2-PPEF technology was proposed, and the feasibility of the technology was verified by numerical simulation based on the integrated modeling method of geology and engineering. The main conclusions are as follows:
  • The dominating factors of the production capacity of blocks A83 and X233 include thickness, porosity, oil saturation, minimum horizontal principal stress, water cut, and dissolved gas–oil ratio. The result of difference analysis showed that the main reason for the low productivity of block A83 was its insufficient formation energy. Therefore, it was recommended to utilize CO2-PPEF technology to supplement formation energy and to improve the oil production.
  • Based on the integrated modeling method of geology and engineering, an integrated reservoir numerical model of well A83-1 was established, and the production of conventional volume fracturing and CO2-PPEF was predicted. The simulation results showed that after CO2 pre-energized fracturing, the decline rate of oil production in the early stage slowed down significantly, the cumulative production increased by 11.8% within five years, the water breakthrough time was delayed by one month, and the final water cut decreased by 16.5%.
The results show that CO2 pre-pad energized fracturing has a promising prospect in enhancing shale oil recovery in the A83 block.

Author Contributions

Conceptualization, methodology, software, validation, resources, project administration, and funding acquisition, Y.X.; formal analysis, investigation, writing—original draft, writing—review and editing, Z.L.; data curation and supervision, J.W., J.Y., Z.M., S.L. and C.H. All authors have read and agreed to the published version of the manuscript.

Funding

This research was funded by the National Natural Science Foundation of China, grant number 51504042, the subitem of National Science and Technology Major Project, grant number 2016ZX05048-001-04-LH and the key project of Sichuan Provincial Education Department Foundation, grant number 18ZA0063.

Institutional Review Board Statement

Not applicable.

Informed Consent Statement

Not applicable.

Data Availability Statement

The datasets supporting the conclusions of this article are private and came from the Sun-Energy Technology Co. Ltd. of Chengdu University of Technology, Chengdu, China.

Conflicts of Interest

The authors declare no conflict of interest. The funders had no role in the design of the study; in the collection, analyses, or interpretation of data; in the writing of the manuscript; or in the decision to publish the results.

References

  1. Mayerhofer, M.J.; Lolon, E.P.; Warpinski, N.R.; Cipolla, C.L.; Walser, D.; Rightmire, C.M. What Is Stimulated Reservoir Volume? SPE Prod. Oper. 2010, 25, 89–98. [Google Scholar] [CrossRef]
  2. Wu, B.; Li, J.; Wu, Y.; Han, L.; Zhao, T.; Zou, Y. Development practices of geology-engineering integration on upper sweet spots of Lucaogou Formation shale oil in Jimsar sag, Junggar Basin. China Pet. Explor. 2019, 24, 679–690. [Google Scholar]
  3. Xu, Y.; Lei, Q.; Chen, M.; Wu, Q.; Yang, N.; Weng, D.; Li, D.; Jiang, H. Progress and development of volume stimulation techniques. Pet. Explor. Dev. 2018, 45, 932–947. [Google Scholar] [CrossRef]
  4. Wu, Q.; Xu, Y.; Zhang, S.; Wang, T.; Guan, B.; Wu, G.; Wang, X. The core theories and key optimization designs of volume stimulation technology for unconventional reservoirs. Acta Pet. Sin. 2014, 35, 706–714. [Google Scholar]
  5. Ren, L.; Lin, R.; Zhao, J.; Wu, L. An optimal design of cluster spacing intervals for staged fracturing in horizontal shale gas wells based on the optimal SRVs. Nat. Gas Ind. B 2017, 4, 364–373. [Google Scholar] [CrossRef]
  6. Fragachán, F.E.; Pordel Shahri, M.; Arnold, D.M.; Babey, A.G.; Smith, C.S. Enhancing Well Performance via In-Stage Diversion in Unconventional Wells: Physics and Case Studies. In Proceedings of the SPE Argentina Exploration and Production of Unconventional Resources Symposium, Buenos Aires, Argentina, 1–3 June 2016. [Google Scholar]
  7. Huang, J.; Safari, R.; Fragachán, F.E.; Smith, C. Improving Diversion Efficiency in Re-Fracturing by Using Engineered Solid Particulate Diverters. In Proceedings of the SPE Western Regional Meeting, Garden Grove, CA, USA, 22–27 April 2018. [Google Scholar]
  8. Van Domelen, M.S. A Practical Guide to Modern Diversion Technology. In Proceedings of the SPE Oklahoma City Oil and Gas Symposium, Oklahoma City, OK, USA, 27–31 March 2017. [Google Scholar]
  9. Sadykov, A.; Baki, S.; Mechkak, K.; Momin, A.M.; Rueda, J.I.; Kazakoff, S.; Kalbani, A.; Kurdi, M.; Mulhim, N.I. Diversion Techniques Applications in Unconventional Resources Fields. In Proceedings of the SPE Middle East Oil and Gas Show and Conference, Manama, Bahrain, 18–21 March 2019. [Google Scholar]
  10. Kabannik, A.; Parkhonyuk, S.; Korkin, R.; Litvinets, F.; Dunaeva, A.; Nikolaev, M.; Usoltsev, D. Can We Trust the Diversion Pressure as a Decision-Making Tool: Novel Technique Reveals the Truth. In Proceedings of the Abu Dhabi International Petroleum Exhibition & Conference, Abu Dhabi, United Arab Emirates, 12–15 November 2018. [Google Scholar]
  11. Wang, B.; Zhou, F.; Yang, C.; Wang, D.; Yang, K.; Liang, T. Experimental Study on Injection Pressure Response and Fracture Geometry during Temporary Plugging and Diverting Fracturing. SPE J. 2020, 25, 573–586. [Google Scholar] [CrossRef]
  12. Zhou, H.; Wu, X.; Song, Z.; Zheng, B.; Zhang, K. A review on mechanism and adaptive materials of temporary plugging agent for chemical diverting fracturing. J. Pet. Sci. Eng. 2022, 212, 110256. [Google Scholar] [CrossRef]
  13. Guo, T.; Zhang, Y.; Shen, L.; Liu, X.; Duan, W.; Liao, H.; Chen, M.; Liu, X. Numerical study on the law of fracture propagation in supercritical carbon dioxide fracturing. J. Pet. Sci. Eng. 2022, 208, 109369. [Google Scholar] [CrossRef]
  14. Lu, Y.; Chen, X.; Tang, J.; Li, H.; Zhou, L.; Han, S.; Ge, Z.; Xia, B.; Shen, H.; Zhang, J. Relationship between pore structure and mechanical properties of shale on supercritical carbon dioxide saturation. Energy 2019, 172, 270–285. [Google Scholar] [CrossRef]
  15. Zhang, X.; Lu, Y.; Tang, J.; Zhou, Z.; Liao, Y. Experimental study on fracture initiation and propagation in shale using supercritical carbon dioxide fracturing. Fuel 2017, 190, 370–378. [Google Scholar] [CrossRef]
  16. Hu, Y.; Liu, F.; Hu, Y.; Kang, Y.; Chen, H.; Liu, J. Propagation Characteristics of Supercritical Carbon Dioxide Induced Fractures under True Tri-Axial Stresses. Energies 2019, 12, 4229. [Google Scholar] [CrossRef]
  17. Liu, H.; Wang, F.; Zhang, J.; Meng, S.; Duan, Y. Fracturing with carbon dioxide: Application status and development trend. Pet. Explor. Dev. 2014, 41, 513–519. [Google Scholar] [CrossRef]
  18. Gupta, D.V.S.; Bobier, D.M. The History and Success of Liquid CO2 and CO2/N2 Fracturing System. In Proceedings of the SPE Gas Technology Symposium, Calgary, AB, Canada, 15–18 March 1998. [Google Scholar]
  19. Du, M.; Sun, X.; Dai, C.; Li, H.; Wang, T.; Xu, Z.; Zhao, M.; Guan, B.; Liu, P. Laboratory experiment on a toluene-polydimethyl silicone thickened supercritical carbon dioxide fracturing fluid. J. Pet. Sci. Eng. 2018, 166, 369–374. [Google Scholar] [CrossRef]
  20. Sun, X.; Liang, X.; Wang, S.; Lu, Y. Experimental study on the rheology of CO2 viscoelastic surfactant foam fracturing fluid. J. Pet. Sci. Eng. 2014, 119, 104–111. [Google Scholar] [CrossRef]
  21. Li, C.; Huang, Y.; Sun, X.; Gao, R.; Zeng, F.; Tontiwachwuthiku, P.; Liang, Z. Rheological properties study of foam fracturing fluid using CO2 and surfactant. Chem. Eng. Sci. 2017, 170, 720–730. [Google Scholar] [CrossRef]
  22. Li, L.; Su, Y.; Sheng, J.J.; Hao, Y.; Wang, W.; Lv, Y.; Zhao, Q.; Wang, H. Experimental and numerical study on co2 sweep volume during co2 huff-n-puff enhanced oil recovery process in shale oil reservoirs. Energy Fuels 2019, 33, 4017–4032. [Google Scholar] [CrossRef]
  23. Lei, Q.; Yang, L.; Duan, Y.; Weng, D.; Wang, X.; Guan, B.; Wang, Z.; Guo, Y. The “Fracture-controlled reserves” based stimulation technology for unconventional oil and gas reservoirs. Pet. Explor. Dev. 2018, 45, 770–778. [Google Scholar] [CrossRef]
  24. Xia, Y.; Li, L.; Wang, Z. Experimental and numerical study on influencing factors of replacement capacity and slickwater flowback efficiency using pre-CO2 fracturing in tight oil reservoirs. J. Pet. Sci. Eng. 2022, 215, 110697. [Google Scholar] [CrossRef]
  25. Fan, L.; Li, L.; Su, Y.; Cai, M.; Tang, M.; Gao, X.; Chen, Z.; Wang, C. CO2-prepad injection EOR simulation and sensitivity analysis considering miscibility and geomechanics in tight oil reservoirs. J. Pet. Sci. Eng. 2020, 195, 107905. [Google Scholar] [CrossRef]
  26. Li, B.; Mou, J.; Zhang, S.; Ma, X.; Zou, Y.; Wang, F. Experimental Study on the Interaction between CO2 and Rock during CO2 Pre-pad Energized Fracturing Operation in Thin Interbedded Shale. Front. Energy Res. 2022, 10, 825464. [Google Scholar] [CrossRef]
  27. Wang, X.; Wu, J.; Zhang, J. Application of CO2 fracturing technology for terrestrial shale gas reservoirs. Nat. Gas Ind. 2014, 34, 64–67. [Google Scholar]
  28. Zheng, Y.; Bai, X.; Luo, Y.; Yang, C.; Wang, Y. Research progress of carbon dioxide fracturing technology for unconventional oil and gas. China Pet. Chem. Stand. Qual. 2019, 39, 221–224. [Google Scholar]
  29. Li, N.; Yu, J.; Wang, C.; Zhang, S.; Liu, X.; Kang, J.; Wang, Y. Fracturing technology with carbon dioxide: A review. J. Pet. Sci. Eng. 2021, 205, 108793. [Google Scholar]
  30. Cipolla, C.L.; Fitzpatrick, T.; Williams, M.J.; Ganguly, U.K. Seismic-to-Simulation for Unconventional Reservoir Development. In Proceedings of the SPE Reservoir Characterisation and Simulation Conference and Exhibition, Abu Dhabi, United Arab Emirates, 9–11 October 2011. [Google Scholar]
  31. Porcu, M.M.; Lee, D.; Shan, D.; Morales, A. Advanced Modeling of Interwell-Fracturing Interference: An Eagle Ford Shale-Oil Study. SPE J. 2016, 21, 1567–1582. [Google Scholar] [CrossRef]
  32. Di, S.; Cheng, S.; Cao, N.; Gao, C.; Miao, L. AI-based geo-engineering integration in unconventional oil and gas. J. King Saud Univ.-Sci. 2021, 33, 101542. [Google Scholar] [CrossRef]
  33. Bai, Y.; Ma, Y. Geology of the Chang 7 Member oil shale of the Yanchang Formation of the Ordos Basin in central north China. Pet. Geosci. 2019, 26, 355–371. [Google Scholar]
  34. Fu, J.; Li, S.; Niu, X.; Deng, X.; Zhou, X. Geological characteristics and exploration of shale oil in Chang 7 Member of Triassic Yanchang Formation, Ordos Basin, NW China. Pet. Explor. Dev. 2020, 47, 931–945. [Google Scholar] [CrossRef]
  35. Fu, S.; Yu, J.; Zhang, K.; Liu, H.; Ma, B.; Su, Y. Investigation of Multistage Hydraulic Fracture Optimization Design Methods in Horizontal Shale Oil Wells in the Ordos Basin. Geofluids 2020, 2020, 8818903. [Google Scholar] [CrossRef]
  36. Zhao, W.; Hu, S.; Hou, L. Connotation and strategic role of in-situ conversion processing of shale oil underground in the onshore China. Pet. Explor. Dev. 2018, 45, 563–572. [Google Scholar] [CrossRef]
  37. Bai, Y.; Tang, H.; Yan, K. Geological characteristics and some problems in development for oil shale in northwest China. Oil Shale 2011, 28, 380. [Google Scholar]
  38. Zou, C.; Guo, Q.; Yang, Z.; Wu, S.; Chen, N.; Lin, S.; Pan, S. Resource potential and core area prediction of lacustrine tight oil: The Triassic Yanchang Formation in Ordos Basin, China. AAPG Bull. 2019, 103, 1493–1523. [Google Scholar] [CrossRef]
  39. Mattar, L.; McNeil, R. The “Flowing” Gas Material Balance. J. Can. Pet. Technol. 1998, 37, 52–55. [Google Scholar] [CrossRef]
  40. Agarwal, R.G.; Gardner, D.C.; Kleinsteiber, S.W.; Fussell, D.D. Analyzing Well Production Data Using Combined-Type-Curve and Decline-Curve Analysis Concepts. SPE Res. Eval. Eng. 1999, 2, 478–486. [Google Scholar] [CrossRef]
  41. Blasingame, T.A.; Lee, W.J. The Variable-Rate Reservoir Limits Testing of Gas Wells. In Proceedings of the SPE Gas Technology Symposium, Dallas, TX, USA, 13–15 June 1988. [Google Scholar]
  42. Fetkovich, M.J. Decline Curve Analysis Using Type Curves. J. Pet. Technol. 1980, 32, 1065–1077. [Google Scholar] [CrossRef]
  43. Bommisetty, R.M.; Prakash, O.; Khare, A. Keyframe Extraction Using Pearson Correlation Coefficient and Color Moments. Multimed. Syst. 2019, 26, 267–299. [Google Scholar] [CrossRef]
  44. Ashok Kumar, J.; Abirami, S. Aspect-based opinion ranking framework for product reviews using a Spearman’s rank correlation coefficient method. Inf. Sci. 2018, 460, 23–41. [Google Scholar]
  45. Kresse, O.; Weng, X. Numerical Modeling of 3D Hydraulic Fractures Interaction in Complex Naturally Fractured Formations. Rock Mech. Rock Eng. 2018, 51, 3863–3881. [Google Scholar] [CrossRef]
  46. Chuprakov, D.; Melchaeva, O.; Prioul, R. Injection-sensitive mechanics of hydraulic fracture interaction with discontinuities. Rock Mech. Rock Eng. 2014, 47, 1625–1640. [Google Scholar] [CrossRef]
Figure 1. The workflow of establishing integrated model of geology and engineering.
Atmosphere 13 01509 g001
Figure 2. Comparison of horizontal section length (a) and dynamic reserves per 100 m (b) of blocks A83 and X233.
Atmosphere 13 01509 g002
Figure 3. The dynamic 3D geomechanical model of the Chang 7 member of the Yanchang Formation in the A83 block: (a) the minimum principal stress model before production and (b) the minimum principal stress model after one year’s production.
Atmosphere 13 01509 g003
Figure 4. The complex artificial fracture network model of well A83-1.
Atmosphere 13 01509 g004
Figure 5. The integrated numerical simulation model of well A83-1 by using unstructured grid.
Atmosphere 13 01509 g005
Figure 6. History matching of well A83-1 after actual volume fracturing.
Atmosphere 13 01509 g006
Figure 7. Production prediction of well A83-1 after actual volume fracturing.
Atmosphere 13 01509 g007
Figure 8. Production prediction of well A83-1 after CO2 pre-pad energized fracturing.
Atmosphere 13 01509 g008
Table 1. The standard of correlation coefficient.
Range of |r|Degree of Relevance
0.0 ≤ |r|< 0.2Extremely weak correlation or irrelevant
0.2 ≤ |r| < 0.4Weak correlation
0.4 ≤ |r| < 0.6Moderate correlation
0.6 ≤ |r| < 0.8Strong correlation
0.8 ≤ |r| < 1.0Extremely strong correlation
Table 2. The results of correlation analysis of the production capacity of blocks A83 and X233.
ParametersDegree of Correlation with Production of A83 BlockDegree of Correlation with Production of X233 Block
Geological parametersThickness0.610 0.703
Porosity0.740 0.663
Permeability0.492 0.403
Oil saturation0.603 0.728
Geomechanical parametersBrittleness index0.715 0.526
Minimum horizontal principal stress0.686 0.621
Closure stress0.654 0.523
Fracturing treatment parametersPumping rate0.427 0.335
Fracturing liquid volume and 0.483 0.542
Sand ratio0.413 0.495
Production characteristic parametersWater cut0.726 0.609
High-pressure physical property parametersDissolved gas–oil ratio0.668 0.615
Saturation pressure0.531 0.419
Oil density under saturation pressure0.558 0.426
Table 3. Comparison of dominating factors of productivity of blocks A83 and X233.
BlocksX233A83
Parameters
Thickness (m)21.8520.86
Porosity (%)9.549.41
Oil saturation (%)52.1353.75
Brittleness index (%)6253
Minimum horizontal principal stress (MPa)24.7626.46
Closure stress (MPa)31.5134.61
Water cut (%)38.9753.75
The descent of dissolved gas–oil ratio after one year’s production (m3/t)14.8431.33
Table 4. Comparison of design parameters between conventional volume fracturing and CO2 pre-pad energized fracturing.
Fracturing
Methods
Volume of CO2
per Stage (m3)
Pumping Rate of CO2 (m3/min)Volume of Fracturing Liquid per Stage (m3)Volume of Proppant per Stage (m3)Pumping Rate of Fracturing Liquid (m3/min)
Conventional volume fracturing//10501256~8
CO2 pre-pad energized fracturing11029401256~8
Table 5. Comparison of stimulation effects of two fracturing methods.
Fracturing
Methods
Maximum Production Rate after Fracturing (sm3/d)Production Rate after the First Year (sm3/d)Cumulative Oil Production for Five Years (sm3)Ultimate Water Cut (%)
Conventional volume fracturing43.57.511,00079
CO2 pre-pad energized fracturing468.512,30062.5
Publisher’s Note: MDPI stays neutral with regard to jurisdictional claims in published maps and institutional affiliations.

