
Molecule Simulation of CH4/CO2 Competitive Adsorption and CO2 Storage in Shale Montmorillonite

Abstract
:1. Introduction
2. Simulation Model and Potential Energy Parameters
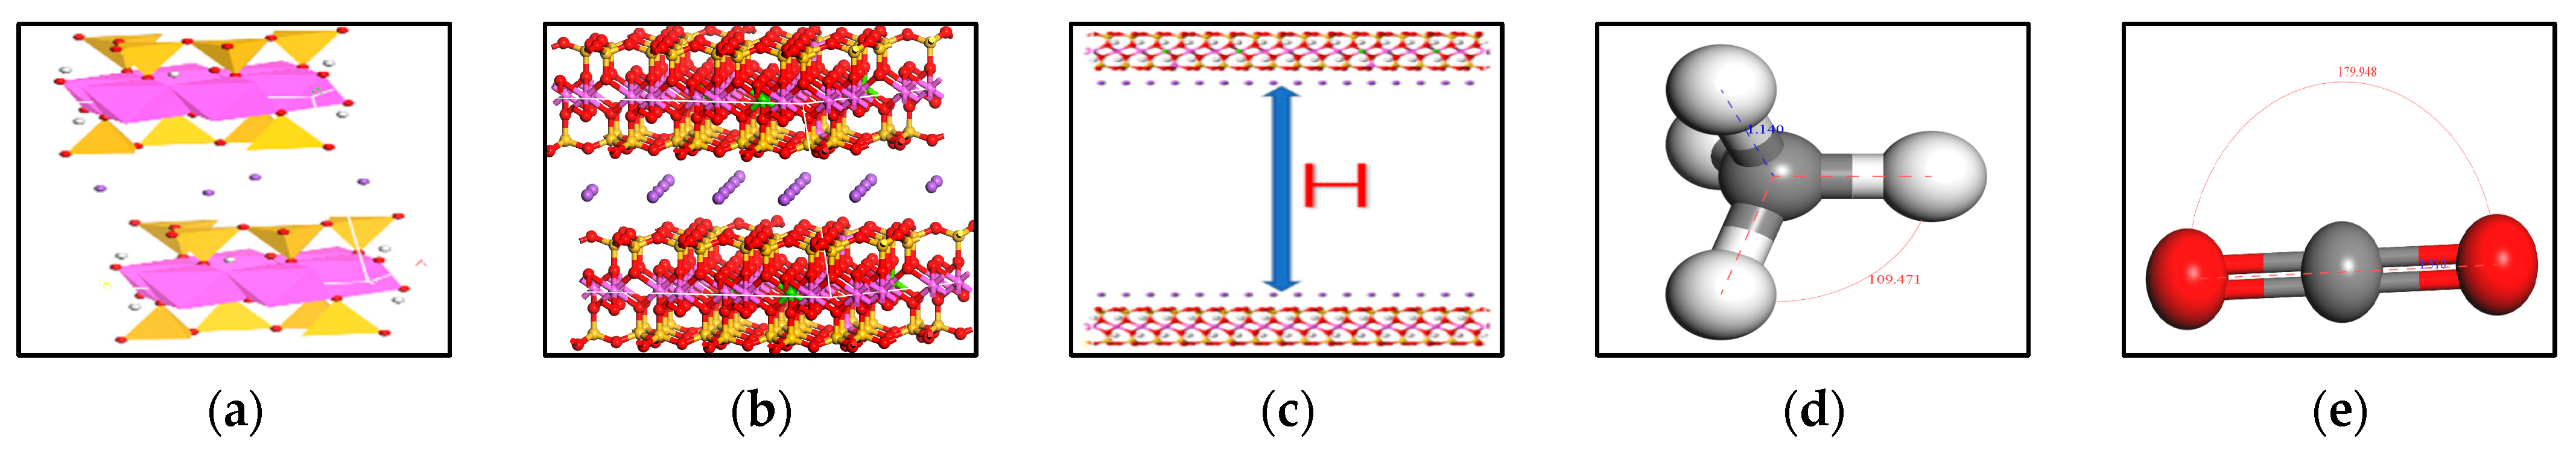
2.1. Model Building
2.2. Potential Energy Selection and Parameters
2.3. Model Verification
3. Study on Adsorption Law of CH4
3.1. Simulation Methods and Conditions
3.2. Analysis of Simulation Results
- (1)
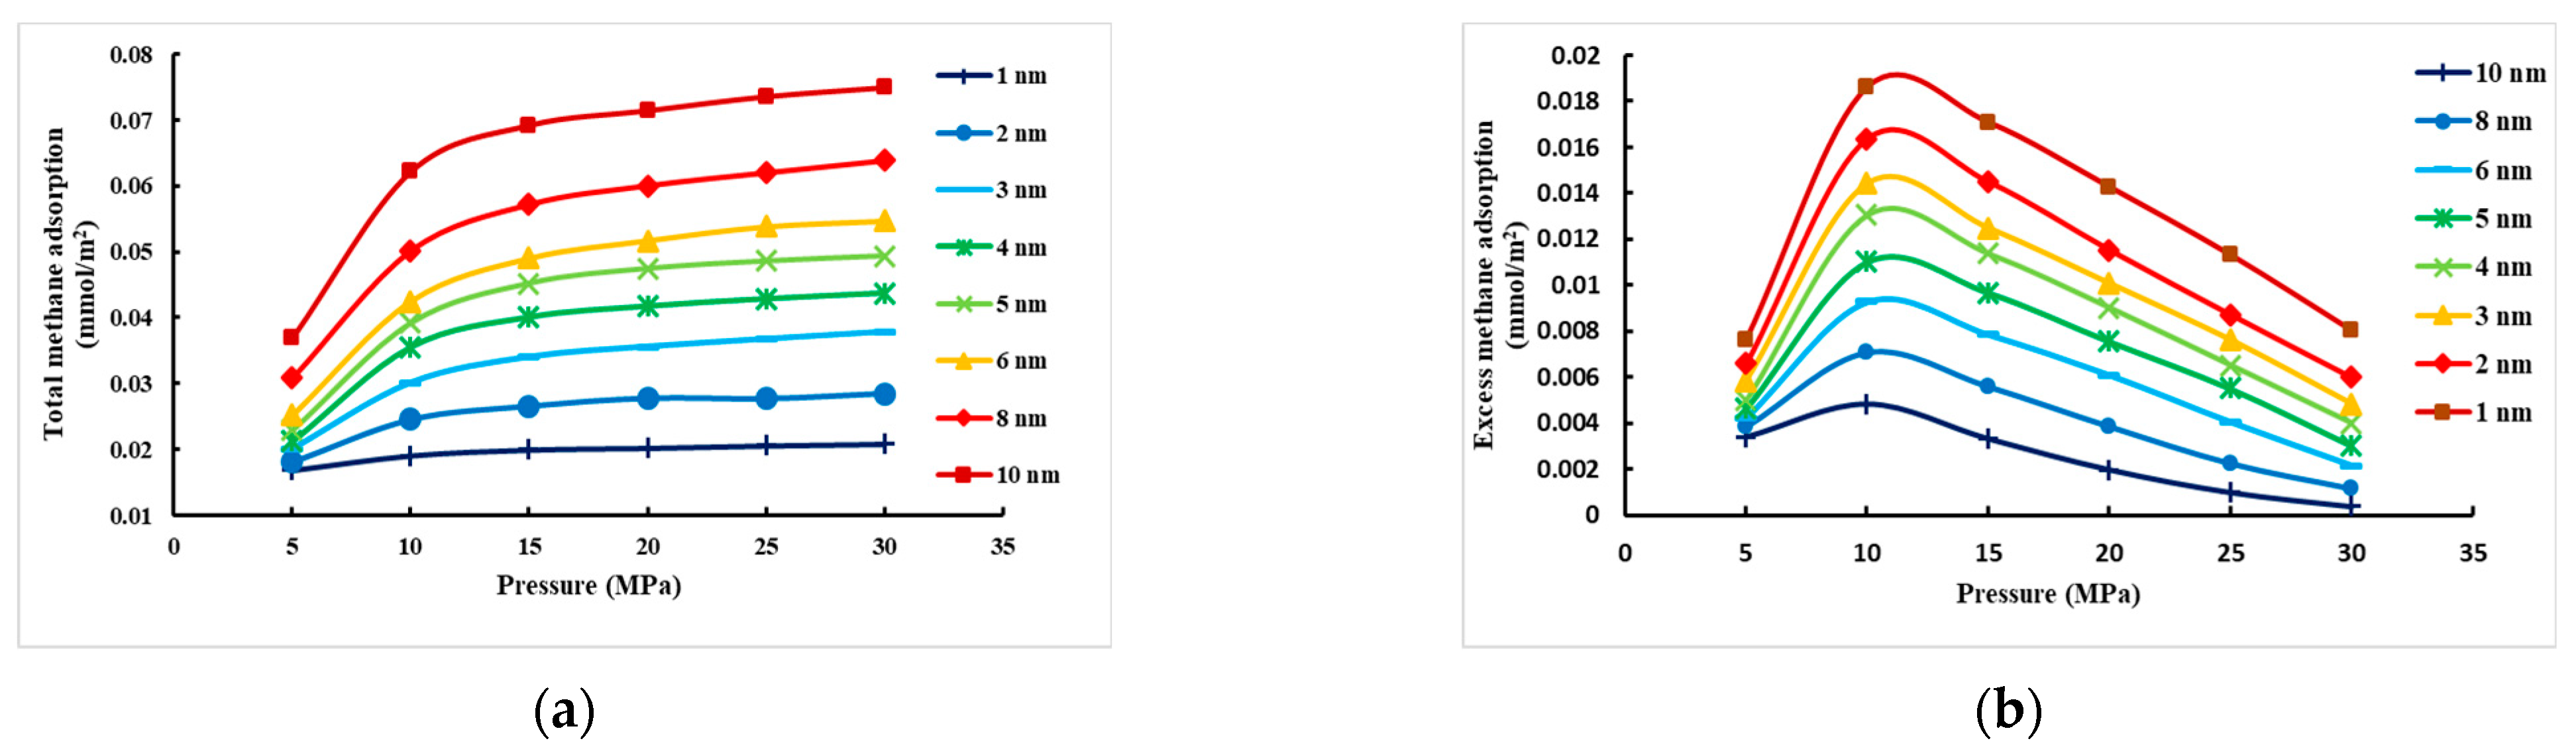
- Effect of pressure on CH4 adsorption under different pore sizes of montmorillonite slit
- (2)
- Effect of temperature on CH4 adsorption under different pore sizes of montmorillonite slits
- (3)
- Density variation under different pore sizes of montmorillonite slit
- (4)
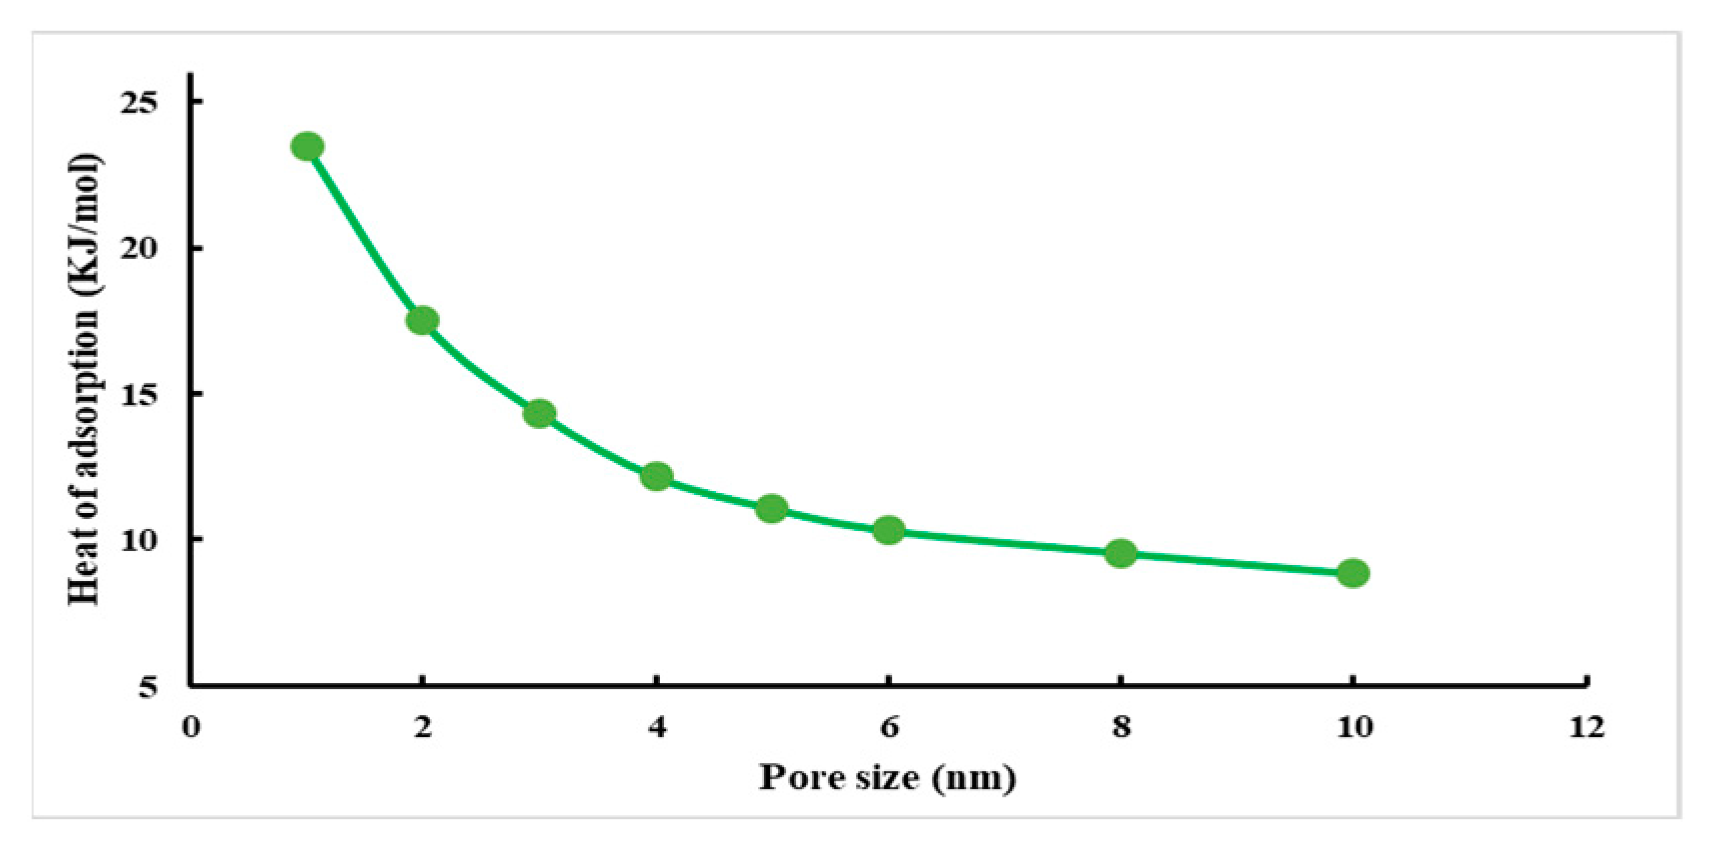
- Heat of adsorption
4. Study of Competitive Adsorption Pattern of CH4 and CO2
4.1. Simulation Method and Conditions
4.2. Analysis of Simulation Results
- (1)
- CO2 adsorption capacity in mixed-phase
- (2)
- CO2/CH4 competitive adsorption ratio
5. Conclusions
- (1)
- At constant temperature, the excess adsorption of CH4 in the montmorillonite slit increases first and then decreases with increasing pressure and reaches a peak between 10.0 MPa and 15.00 MPa. At constant pressure, the excess adsorption decreases gradually with increasing temperature and is at a peak at 278.0 K. The adsorption effect decreases as the pore size becomes larger, with the maximum adsorption of 1 nm pore size.
- (2)
- Comparing the changes in the CH4 density at the 1 nm~10 nm pore size, it was found that the peak of the CH4 density appeared at the slit wall after the simulation of the adsorption process was performed. The CH4 in the slit of montmorillonite has two occurrences and is mainly in the adsorption state. With the increase in the slit width, the free state of CH4 becomes more and the slit appears to have two occurrences coexisting.
- (3)
- The adsorption of CH4 on the slit of montmorillonite is physical adsorption; the adsorption capacity of the slit decreases with increasing pore size.
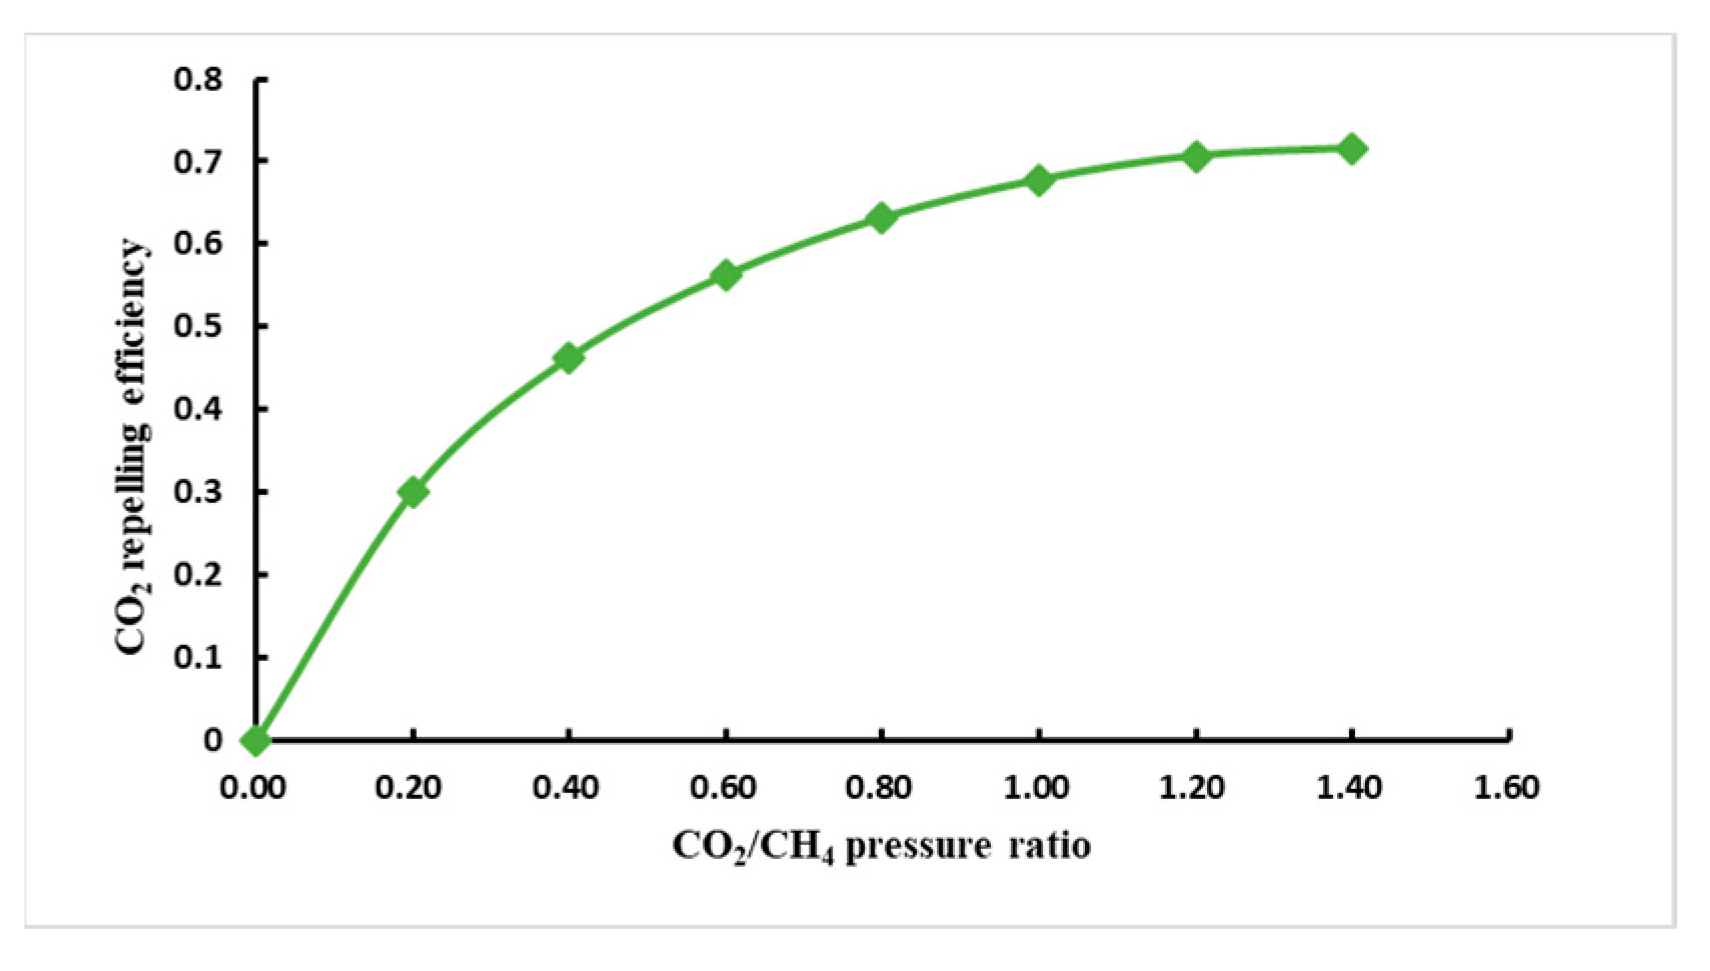
- (4)
- When the adsorbent is the coexistence of CH4 and CO2, the initial pressure of CH4 is constant, and the repulsion efficiency of CO2 increases with the increase in the initial pressure of CO2; it is also analyzed that the amount of CO2 storage decreases with the increase in temperature and increases with the increase in injection pressure.
- (5)
- When the initial pressure of CH4 and CO2 are equal, it can be concluded from the curve of pressure and the CO2/CH4 competitive adsorption ratio that the competitive adsorption ratio is negatively correlated with the pressure, and the higher the pressure the lower the competitive adsorption ratio.
Author Contributions
Funding
Institutional Review Board Statement
Informed Consent Statement
Data Availability Statement
Conflicts of Interest
References
- Curtis, J.B. Fractured shale-gas systems. AAPG Bull. 2002, 86, 1921–1938. [Google Scholar]
- Liu, Y.Y.; Wilcox, J. Effects of surface heterogeneity on the adsorption of CO2 in microporous carbons. Environ. Sci. Technol. 2012, 46, 1940–1947. [Google Scholar] [CrossRef] [PubMed]
- Liu, B.; Shi, J.Q. A molecular dynamics simulation of methane adsorption in graphite slit-pores. Chin. J. Comput. Phys. 2013, 30, 692–699. [Google Scholar]
- Xiong, J.; Liu, X.J.; Liang, L.X.; Zeng, Q. Methane adsorption on carbon models of the organic matter of organic-rich shales. Energy Fuels 2017, 31, 1489–1501. [Google Scholar] [CrossRef]
- Srinivas, G.; Burress, J.W.; Ford, J.; Yildirim, T. Porous graphene oxide frameworks: Synthesis and gas sorption properties. J. Mater. Chem. 2011, 21, 11323–11329. [Google Scholar] [CrossRef]
- Jin, Z.H.; Firoozabadi, A. Methane and carbon dioxide adsorption in clay-like slit pores by Monte Carlo simulations. Fluid Phase Equilibria 2013, 360, 456–465. [Google Scholar] [CrossRef]
- Xiong, J.; Liu, X.; Liang, L.; Zeng, Q. Adsorption of methane in organic-rich shale nanopores: An experimental and molecular simulation study. Fuel 2017, 200, 299–315. [Google Scholar] [CrossRef]
- Liang, L.; Luo, D.; Liu, X.; Xiong, J. Experimental study on the wettability and adsorption characteristics of Longmaxi Formation shale in the Sichuan Basin, China. J. Nat. Gas Sci. Eng. 2016, 33, 1107–1118. [Google Scholar] [CrossRef]
- Xu, C.X.; Xue, H.T.; Li, H.B. Microscopic adsorption mechanism difference in the mineral pore of shale gas reservoir. Spec. Oil Gas Reserv. 2020, 27, 79–84. [Google Scholar]
- Tian, S.C.; Wang, T.Y.; Li, G.S.; Sheng, M.; Ren, W.X. Molecular simulation of methane adsorption behavior in different shale kerogen types. Nat. Gas Ind. 2017, 37, 18–25. [Google Scholar]
- Sui, H.G.; Yao, J. Effect of surface chemistry for CH4/CO2 adsorption in kerogen: A molecular simulation study. J. Nat. Gas Sci. Eng. 2016, 31, 738–746. [Google Scholar] [CrossRef]
- Katti, D.R.; Thapa, K.B.; Katti, K.S. Modeling molecular interactions of sodium montmorillonite clay with 3D kerogen models. Fuel 2017, 199, 641–652. [Google Scholar] [CrossRef]
- Tang, X.; Zhou, X.Y.; Peng, Y.J. Molecular simulation of methane adsorption within illite minerals in the Longmaxi Formation shale based on a grand canonical Monte Carlo method and the pore size distribution in southeastern Chongqing, China. J. Nat. Gas Geosci. 2019, 4, 111–119. [Google Scholar] [CrossRef]
- Shi, Y.; Yang, X.N.; Li, S.G.; Yan, M.; Shuang, H.Q.; Xue, J.H. Effect of moisture on adsorption and diffusion of multi-component gas in kerogen: A molecular simulation study. J. Xi’an Shiyou Univ. 2021, 36, 50–57. [Google Scholar]
- Collell, J.; Galliero, G.; Gouth, F.; Montel, F.; Pujol, M.; Ungerer, P.; Yiannourakou, M. Molecular simulation and modelisation of methane/ethane mixtures adsorption onto a microporous molecular model of kerogen under typical reservoir conditions. Microporous Mesoporous Mater. 2014, 197, 194–203. [Google Scholar] [CrossRef]
- Ru, X.; Cheng, Z.; Song, L.; Wang, H.; Li, J. Experimental and computational studies on the average molecular structure of Chinese Huadian oil shale kerogen. J. Mol. Struct. 2012, 1030, 10–18. [Google Scholar] [CrossRef]
- Ungerer, P.; Collell, J.; Yiannourakou, M. Molecular Modeling of the Volumetric and Thermodynamic Properties of Kerogen: Influence of Organic Type and Maturity. Energy Fuels 2015, 29, 91–105. [Google Scholar] [CrossRef]
- Babatunde, K.A.; Negash Mojid, B.M.; Ahmed MR, T.Y.; Jufar, S.R. Molecular simulation study of CO2/CH4 adsorption on realistic heterogeneous shale surfaces. Appl. Surf. Sci. 2021, 543, 148789. [Google Scholar] [CrossRef]
- Xiong, J.; Liu, X.J.; Liang, L.X. Molecular simulation on the adsorption behaviors of methane in montmorillonite slit pores. Acta Pet. Sin. 2016, 37, 1021–1029. [Google Scholar]
- Feng, D.; Li, X.F.; Wang, X.Z.; Li, J.; Shi, J.T.; Zhang, T.; Li, P.H.; Chen, Y. Pore distribution characteristics and methane adsorption capacity of clay under different water content conditions. J. China Coal Soc. 2017, 42, 2402–2413. [Google Scholar]
- Lu, Z.L.; Ning, Z.F.; Wang, Q.; Huang, L.; Meng, H.; Yu, X.F.; Qin, H.B. Molecular simulation of methane adsorption behavior on clay minerals in shale. J. China Coal Soc. 2019, 44, 3117–3124. [Google Scholar]
- Huang, T.; Liu, D.H.; Sun, J. Simulation on adsorption of methane in micro-pore of clay minerals. Sci. Technol. Eng. 2020, 20, 141–145. [Google Scholar]
- Ren, J.H.; Ren, X.H.; Song, H.Q.; Han, D.L.; Wang, C.C.; Sheng, G.L.; Lu, W.F. Adsorption and diffusion characteristics of methane in nanopores based on molecular simulation. Acta Pet. Sin. 2020, 41, 1366–1375. [Google Scholar]
- Greathouse, J.A.; Cygan, R.T.; Fredrich, J.T.; Jerauld, G.R. Adsorption of Aqueous Crude Oil Components on the Basal Surfaces of Clay Minerals: Molecular Simulations Including Salinity and Temperature Effects. J. Phys. Chem. C 2017, 121, 22773–22786. [Google Scholar] [CrossRef]
- Li, W.; Pang, X.; Snape, C.; Zhang, B.; Zheng, D.; Zhang, X. Molecular Simulation Study on Methane Adsorption Capacity and Mechanism in Clay Minerals: Effect of Clay Type, Pressure, and Water Saturation in Shales. Energy Fuels 2019, 33, 765–778. [Google Scholar] [CrossRef]
- Xiong, J. Investigation of the Influences of the Methane Adsorption Capacity on the Shales; Southwest Petroleum University: Chengdu, China, 2015. [Google Scholar]
- Bowker, K.A. Recent developments of the Barnett Shale play, Fort Worth basin. West Tex. Geol. Soc. Bull. 2003, 42, 4–11. [Google Scholar]
- Ross, D.J.K.; Bustin, R.M. Characterizing the shale gas resource potential of Devonian–Mississippian strata in the Western Canada sedimentary basin: Application of an integrated formation evaluation. AAPG Bull. 2008, 92, 87–125. [Google Scholar] [CrossRef]
- Liang, C.; Jiang, Z.X.; Yang, Y.T.; Wei, X.J. Shale lithofacies and reservoir space of the Wufeng–Longmaxi formation, Sichuan Basin, China. Pet. Explor. Dev. 2012, 39, 736–743. [Google Scholar] [CrossRef]
- Li, J.; Yu, B.; Zhang, J.; Li, Y.; Wu, J. Reservoir characteristics and their influence factors of the Lower Cambrian dark shale in northern Guizhou. Oil Gas Geol. 2012, 33, 364–374. [Google Scholar]
- Zhang, Y.Y.; Chen, M.; Deng, Y.; Jin, Y.; Lu, Y.H.; Xia, Y. Molecular dynamics simulation of temperature and pressure effects on hydration characteristics of montmorillonites. J. Chin. Ceram. Soc. 2018, 46, 1489–1498. [Google Scholar]
- Wang, J.; Wang, J.X.; Zeng, F.G.; Wu, X.L. Molecular simulations of crystal structure conformation X-Ray diffraction and infra-red spectrum in montmorillonites. Acta Mineral. Sin. 2011, 31, 133–136. [Google Scholar]
- Wang, Z.H.; Zhang, Y.P.; Guo, P.; Li, F.H.; Bai, Y. Research on methane adsorption of pure clay minerals and evaluation of adsorption models. Sci. Technol. Eng. 2020, 20, 2209–2215. [Google Scholar]
- Xiong, J.; Liu, X.J.; Liang, L.X. Molecular simulation study on the adsorption behaviors of methane in slit-like clay mineral pore. J. China Coal Soc. 2017, 42, 959–968. [Google Scholar]


| Atoms | c = 1.25 nm | c = 1.53 nm | ||||
|---|---|---|---|---|---|---|
| x | y | z | x | y | z | |
| Al | 0 | 3.02 | 12.5 | 0 | 3.02 | 15.5 |
| Si | 0.472 | 1.51 | 9.58 | 0.472 | 1.51 | 12.58 |
| O | 0.122 | 0 | 9.04 | 0.122 | 0 | 12.04 |
| O | −0.686 | 2.615 | 9.24 | −0.686 | 2.615 | 12.04 |
| O | 0.772 | 1.51 | 11.2 | 0.772 | 1.51 | 14.2 |
| O(OH) | 0.808 | 4.53 | 11.25 | 0.808 | 4.53 | 14.25 |
| H(OH) | −0.103 | 4.53 | 10.812 | −0.103 | 4.53 | 13.182 |
| Na+ | 0 | 4.53 | 6.25 | 0 | 4.53 | 9.25 |
| Types | Atom Types | (ε/KB)/K | σ/nm | q/c |
|---|---|---|---|---|
| CH4 | CH4 | 148.1 | 0.373 | 0 |
| CO2 | C | 28.129 | 0.2757 | 0.6512 |
| O | 80.507 | 0.3033 | −0.3256 | |
| Montmorillonite | Al | 0 | 0 | 3 |
| Mg | 0 | 0 | 2 | |
| Si | 3153 | 0.184 | 1.2 | |
| O | 156 | 0.317 | −1 | |
| Na+ | 100 | 0.259 | 1 |
Publisher’s Note: MDPI stays neutral with regard to jurisdictional claims in published maps and institutional affiliations. |
© 2022 by the authors. Licensee MDPI, Basel, Switzerland. This article is an open access article distributed under the terms and conditions of the Creative Commons Attribution (CC BY) license (https://creativecommons.org/licenses/by/4.0/).
Share and Cite
Hou, D.; Gong, F.; Tang, H.; Guo, J.; Qiang, X.; Sun, L. Molecule Simulation of CH4/CO2 Competitive Adsorption and CO2 Storage in Shale Montmorillonite. Atmosphere 2022, 13, 1565. https://doi.org/10.3390/atmos13101565
Hou D, Gong F, Tang H, Guo J, Qiang X, Sun L. Molecule Simulation of CH4/CO2 Competitive Adsorption and CO2 Storage in Shale Montmorillonite. Atmosphere. 2022; 13(10):1565. https://doi.org/10.3390/atmos13101565
Chicago/Turabian StyleHou, Dali, Fengming Gong, Hongming Tang, Jianchun Guo, Xianyu Qiang, and Lei Sun. 2022. "Molecule Simulation of CH4/CO2 Competitive Adsorption and CO2 Storage in Shale Montmorillonite" Atmosphere 13, no. 10: 1565. https://doi.org/10.3390/atmos13101565