Article

Factors Influencing the CO2 Corrosion Pattern of Oil–Water Mixed Transmission Pipeline during High Water Content Period

1
Key Laboratory of Drilling and Production Engineering for Oil and Gas, Hubei Province, Wuhan 430100, China
2
School of Petroleum Engineering, Yangtze University, Wuhan 430100, China
3
Petroleum Engineering Research Institute of SINOPEC North China Oilfield Branch, Zhengzhou 450006, China
*
Author to whom correspondence should be addressed.
Atmosphere 2022, 13(10), 1687; https://doi.org/10.3390/atmos13101687
Submission received: 7 September 2022 / Revised: 22 September 2022 / Accepted: 13 October 2022 / Published: 14 October 2022
(This article belongs to the Special Issue CO2 Geological Storage and Utilization)

Abstract

:
After the oil field enters the high water content period, the oil–water mixed fluid in the mixing system will gradually change into the water-in-oil mixed fluid, while the dissolved CO2 causes the pH value of the mixed fluid to decrease. There is also a certain amount of bacteria in the output fluid, with many factors leading to the intensification in the corrosion of the oil–water mixed system pipeline in the high water content period. To clarify its corrosion law, through the mixed transmission pipeline material, 20# carbon steel, in high water conditions under the action of different single factor dynamic corrosion rate experiments, along with the use of the SPSS method, were used to determine the corrosion of the main control factors. The results show that in the high water content period, the corrosion rate of the mixed pipeline 20# steel gradually increases with the increase in temperature pressure, CO2 partial pressure, SRB content, Ca2+ + Mg2+ content, and Cl content. The corrosion rate with the CO2 partial pressure and SRB content changes show a strong multiplicative power relationship; with Ca2+ + Mg2+ content, Cl content changes show a logarithmic relationship, the relationship degree R2 is above 0.98. Through SPSS data analysis software combined with experimental data for correlation degree analysis, it is concluded that the correlation magnitude relationship between each factor and corrosion rate is CO2 partial pressure > SRB content > Cl content > Ca2+ + Mg2+ content > temperature pressure, which provides a theoretical basis for the corrosion protection of an oil gathering pipeline.

1. Introduction

The water content of oil and gas wells gradually increases in the middle and late stages of extraction due to the influence of water injection development [1,2]. Different oil–water mixed fluid ratios on metal corrosion are very complex, according to relevant statistics showing that the water content rate and the number of corrosion perforations occurring in the pipeline is a positive correlation change; when the water content rate is low, the number of corrosion perforations in the pipeline accounts for about 20% of the total accidents; in the water content rate higher than 60% of the region, the proportion of possession accidents occurring is nearly 50% [3].
Water content affects pipeline corrosion mainly because when the crude oil–water content is low (less than 30%), the oil–water mixed fluid will form an oil-in-water type mixture, thus inhibiting the contact between water and carbon steel, and the tendency of corrosion is small, and uniform corrosion mainly occurs; with the increase in water content (higher than 50%), water can be separated from the emulsion, the oil–water mixed fluid will gradually become an oil-in-water type mixed fluid, or in the form of the free water phase, at this time the collection system is in the water-wetted environment, the environment of CO2 dissolved in the water phase to produce a higher concentration of carbonic acid, which promotes the electrochemical corrosion of carbon steel, thereby increasing corrosion [4,5,6]. The increase in water content makes the corrosion environment complex; the presence of a small amount of CO2 in the associated gas, the presence of a certain amount of bacteria in the water system, and Ca2+, Mg2+, Cl contained in the water can lead to the corrosion of the gathering system pipeline affected by different factors [7]. In a complex corrosive environment, it is of great significance to establish the main control factors affecting corrosion for pipeline corrosion protection, and at present, it is more current to analyze the main control factors of corrosion by using SPSS correlation, gray correlation, Pearson correlation coefficient, etc. Fang [8] used the SPSS program to analyze the correlation between various factors and corrosion in oil field wastewater, which showed that in the mineralization degree of less than 20,000 mg/L, dissolved salts, dissolved oxygen, and bacteria are the main factors causing corrosion; Cheng [9] et al. concluded that CO2 partial pressure and SRB content are the main controlling factors affecting the corrosion failure of shale gas wellbore by the gray correlation method; Tianli [10] et al. concluded that the main controlling factors of corrosion in the Yuanba gas surface gathering system are H2S partial pressure, gas-liquid ratio and CO2 partial pressure; Yanshuang [11] et al. determined that the main controlling factors of flow corrosion in gathering pipelines are liquid holding rate and gas flow rate by using the Pearson correlation coefficient.
To clarify the corrosion law and main control factors of the gathering pipeline at high water content, 20# steel used in the gathering system of HH oilfield was selected as the test sample, and the dynamic corrosion evaluation experiment was carried out by using a high temperature and high pressure dynamic corrosion scaling evaluation instrument to study the influence of different temperature and pressure, CO2 content, SRB content, Ca2++Mg2+ content, and Cl content on the corrosion law of 20# steel at a high water content. SEM electron microscope scanning technology was used to microscopically analyze the specimens after the experiment, to further clarify the corrosion law of an oil gathering pipeline in a high water content area, and to determine the main factors of corrosion by SPSS data analysis software, so as to provide a theoretical basis for the protection of a high water content oil gathering pipeline.

2. Materials and Methods

The original 20# steel was processed into the size of 50 mm × 10 mm × 3 mm corrosion test piece, with 6 mm holes on the end for hanging, the use of not less than a 600~1200 purpose sandpaper on the test piece step by step grinding, degreasing, and dehydration with acetone and anhydrous ethanol, wrapped with filter paper, air-dried in a dry box, and weighed for use. The 20# steel chemical composition table is shown in Table 1.
Experimental instruments: The main instruments used in the experiment are SA-1 type dynamic corrosion scaling evaluation instrument (Jiangsu UNIPAC TECHNOLOGY Company, China), SU8010 cold field emission scanning electron microscope (Hitachi Corporation, Ibaraki, Japan). Other experimental instruments: vacuum pump, analytical balance, CO2 gas cylinder, N2 gas cylinder, and other auxiliary devices and tools; the chemical reagents involved in the experiment (unless otherwise noted), should meet the national standards of chemical purity.
Water sample compounding: According to the results of ionic composition analysis of formation water samples in the reservoir output fluid (as shown in Table 2), water sample compounding was carried out in the laboratory to carry out experiments, in which water samples containing bacteria were prepared using simulated compound water and water samples containing bacteria to form experimental water samples with different SRB contents, which were determined by the secondary repetitive bacterial count method of the dilution method, and the compounded water samples were filtered and treated with 45 μm filter membrane for use, and the oil samples were in the laboratory. The oil sample was laboratory simulated oil (the physical properties of the oil are shown in Table 3); the gas sample was industrial pure CO2 gas with 99.999% purity; industrial pure N2 gas with 99.9% purity.
The experimental process refers to the nationally recommended standard GB/T 16545-2015 “corrosion of metals and alloys: removal of corrosion products on corrosion specimens” and JB/T 6073-92 “metal cladding laboratory full immersion corrosion test” in the loss of weight method, the specimen hanging in the dynamic corrosion instrument to simulate various working conditions on the corrosion of the specimen.
Before the experiment, the specimens were wiped with filter paper, put into petroleum ether vessels with a boiling range of 333~363 k, and then put into anhydrous ethanol for 5 min to further degrease and dehydrate after removing the surface grease of the hanging pieces with degreasing cotton balls. After removing the grease, the hanging pieces were put on the filter paper, blown dry with cold air, and then wrapped with filter paper, placed in a desiccator, and weighed before weight loss after one hour, accurate to 1 mg. The experiments were carried out in SA-1 type dynamic corrosion and scaling evaluation apparatus, the experimental solution and the experimental specimen were put into the reaction kettle first, and the kettle was evacuated by vacuum pump for 30 min, and then the CO2 gas was introduced into the reaction kettle according to the experimental partial pressure requirement. Then, CO2 gas was injected into the reactor according to the partial pressure requirement, and finally, nitrogen gas was injected to reach the total pressure requirement and the speed was adjusted to 125 r/min.
After the experiment, the experimental solution in the reaction kettle was discharged, and then the test piece was removed from the reaction kettle, further decontaminated and dehydrated with petroleum ether and anhydrous ethanol, and the surface corrosion products were removed with hydrochloric acid cleaning solution, rinsed with water and the test piece was immediately put into anhydrous ethanol for cleaning and dehydration, and then weighed after being blown dry with cold air. The weight loss of the test piece before and after the experiment was recorded; each group of experiments obtains three test pieces for parallel samples, using Equation (1) to calculate the uniform corrosion rate of the test piece and obtaining the average of the three test pieces.
v = 87600 × ( m 1 m 2 ) S t ρ
where, v: corrosion rate, mm/a; m1: the mass of the test piece before the experiment, g; m2: the mass of the test piece after cleaning, g; S: specimen exposure area, cm2; t: experimental time, h; ρ:specimen density, g/cm3.
To clarify the dynamic corrosion law of 20# steel of the mixed pipeline of the gathering system under the condition of high water content, according to the actual working conditions of the mixed pipeline of the gathering system of HH oil field, the designed dynamic corrosion experiment scheme is shown in Table 4.

3. Results

3.1. Effect of Temperature Pressure on Corrosion

Measurement conditions: 90% water content, 0MPa CO2 partial pressure, 100,000 mg/L total mineralization, 11,000 mg/L Ca2+ + Mg2+ content, 49,250 mg/L Cl content, temperature pressure designed as 298 K + 0.5 MPa, 308 K + 2.5 MPa and 313 K + 3.5 MPa respectively.
As seen in Figure 1, with the increase in temperature and pressure, the corrosion rate of 20# steel gradually increased. The main reasons are that on the one hand, with the increase in temperature, the diffusion coefficient of substances in water increases, and more dissolved oxygen diffuses to the cathodic area of the metal surface, accelerating corrosion; at the same time, the electrolyte resistance and the polarization resistance of the anodic reaction decrease with the increase in temperature, promoting the corrosion of the metal specimen. On the other hand, the change in temperature affects the deposition rate of corrosion products and the coverage, denseness, and bond strength of the corrosion product film, which in turn affects the protectiveness of the metal [12,13].
SEM scanning electron microscopy was used to observe the microscopic morphology of the hanging pieces after corrosion at different temperatures, and the results are shown in Figure 2. It can be seen from the figure, that 20# in the 298 K + 0.5 MPa test piece surface is cleaner, there are fewer corrosion products, and a small number of local clusters of corrosion products, but this does not quite affect the body; the main reason being that, at a lower temperature, the 20# steel electrochemical reaction rate is low, the degree of corrosion is relatively light. With the increase in temperature and pressure, corrosion products gradually increased; a 308 K + 2.5 MPa corrosion product increase is not too obvious but at 313 K + 3.5 MPa, whereby the corrosion products increased significantly, indicating the higher temperature and pressure with the corrosion of the 20# steel influence [14].

3.2. Effect of CO2 Partial Pressure on Corrosion

Test conditions: temperature and pressure are 308 K and 2.5 MPa, water content is 90%, bacteria content is 0 pcs/mL, total mineralization is 100,000 mg/L, Ca2+ + Mg2+ content is 11,000 mg/L, Cl content is 49,250 mg/L, CO2 partial pressure is designed as 0 MPa, 0.05 MPa, 0.10 MPa and 0.17 MPa respectively. Through the above experimental conditions in order to carry out dynamic corrosion experiments on 20# steel, a clearly different CO2 partial pressure on the corrosion rate of the law, CO2 partial pressure, and 20# steel corrosion rate relationship curve is shown in Figure 2.
Figure 3 shows that the 20# steel corrosion rate with the CO2 partial pressure increases the trend of change, mainly with the increase in CO2 partial pressure, the corrosion rate gradually increases, and contains CO2, compared to the conditions without CO2 which increase very quickly, indicating the presence of CO2 on the corrosion rate and the impact is greater. The main reason is that CO2 will produce carbonic acid when it meets water, and carbonic acid promotes the electrochemical corrosion of metals. As the partial pressure increases, more CO2 combines with the water molecules in the solution, which increases the H2CO3 in the solution and intensifies the ionization of H2CO3 at the same time, and the H+ in the solution increases, which decreases the pH of the solution and accelerates the cathodic reaction in the electrochemical reaction, leading to increased corrosion, and the reaction equation is shown in Equations (2)–(7).
C O 2 + H 2 O H 2 C O 3
2 H 2 C O 3 + 2 e - H 2 + 2 H C O 3 -
2 H C O 3 - + 2 e - H 2 + C O 3 2 -
2 H + + 2 e - H 2
F e F e 2 + + 2 e -
F e + C O 2 + H 2 O = F e C O 3 + H 2
The corrosion morphology under a different partial pressure of CO2 is shown in Figure 4. Comparing the corrosion morphology results under a different partial pressure of CO2, it can be seen that with the increase in partial pressure of CO2 from 0 MPa to 0.1 MPa, the corrosion gradually intensifies and the corrosion product thickens, but the corrosion product film is relatively intact. This is because as the partial pressure of CO2 increases, the solubility of CO2 in solution also increases, the content of CO2 series of ions in solution increases, the corrosion reaction is accelerated, and the content of Fe2+ in solution increases. The ions of the CO2 series combined with the production of deposition on the surface of the specimen promote the deposition of corrosion products film more quickly, forming a dense corrosion product film, thus inhibiting the corrosion reaction. When the partial pressure of CO2 increases from 0.1 MPa to 0.17 MPa, the corrosion product film is disrupted and local corrosion begins to occur and the corrosion rate increases. This is because, with the increasing partial pressure of CO2, CO2 dissolves in water and forms carbonic acid, and the pH solution decreases will form an acidic solution, which will increase the corrosion rate of the material and destroy the corrosion product film [15,16,17].

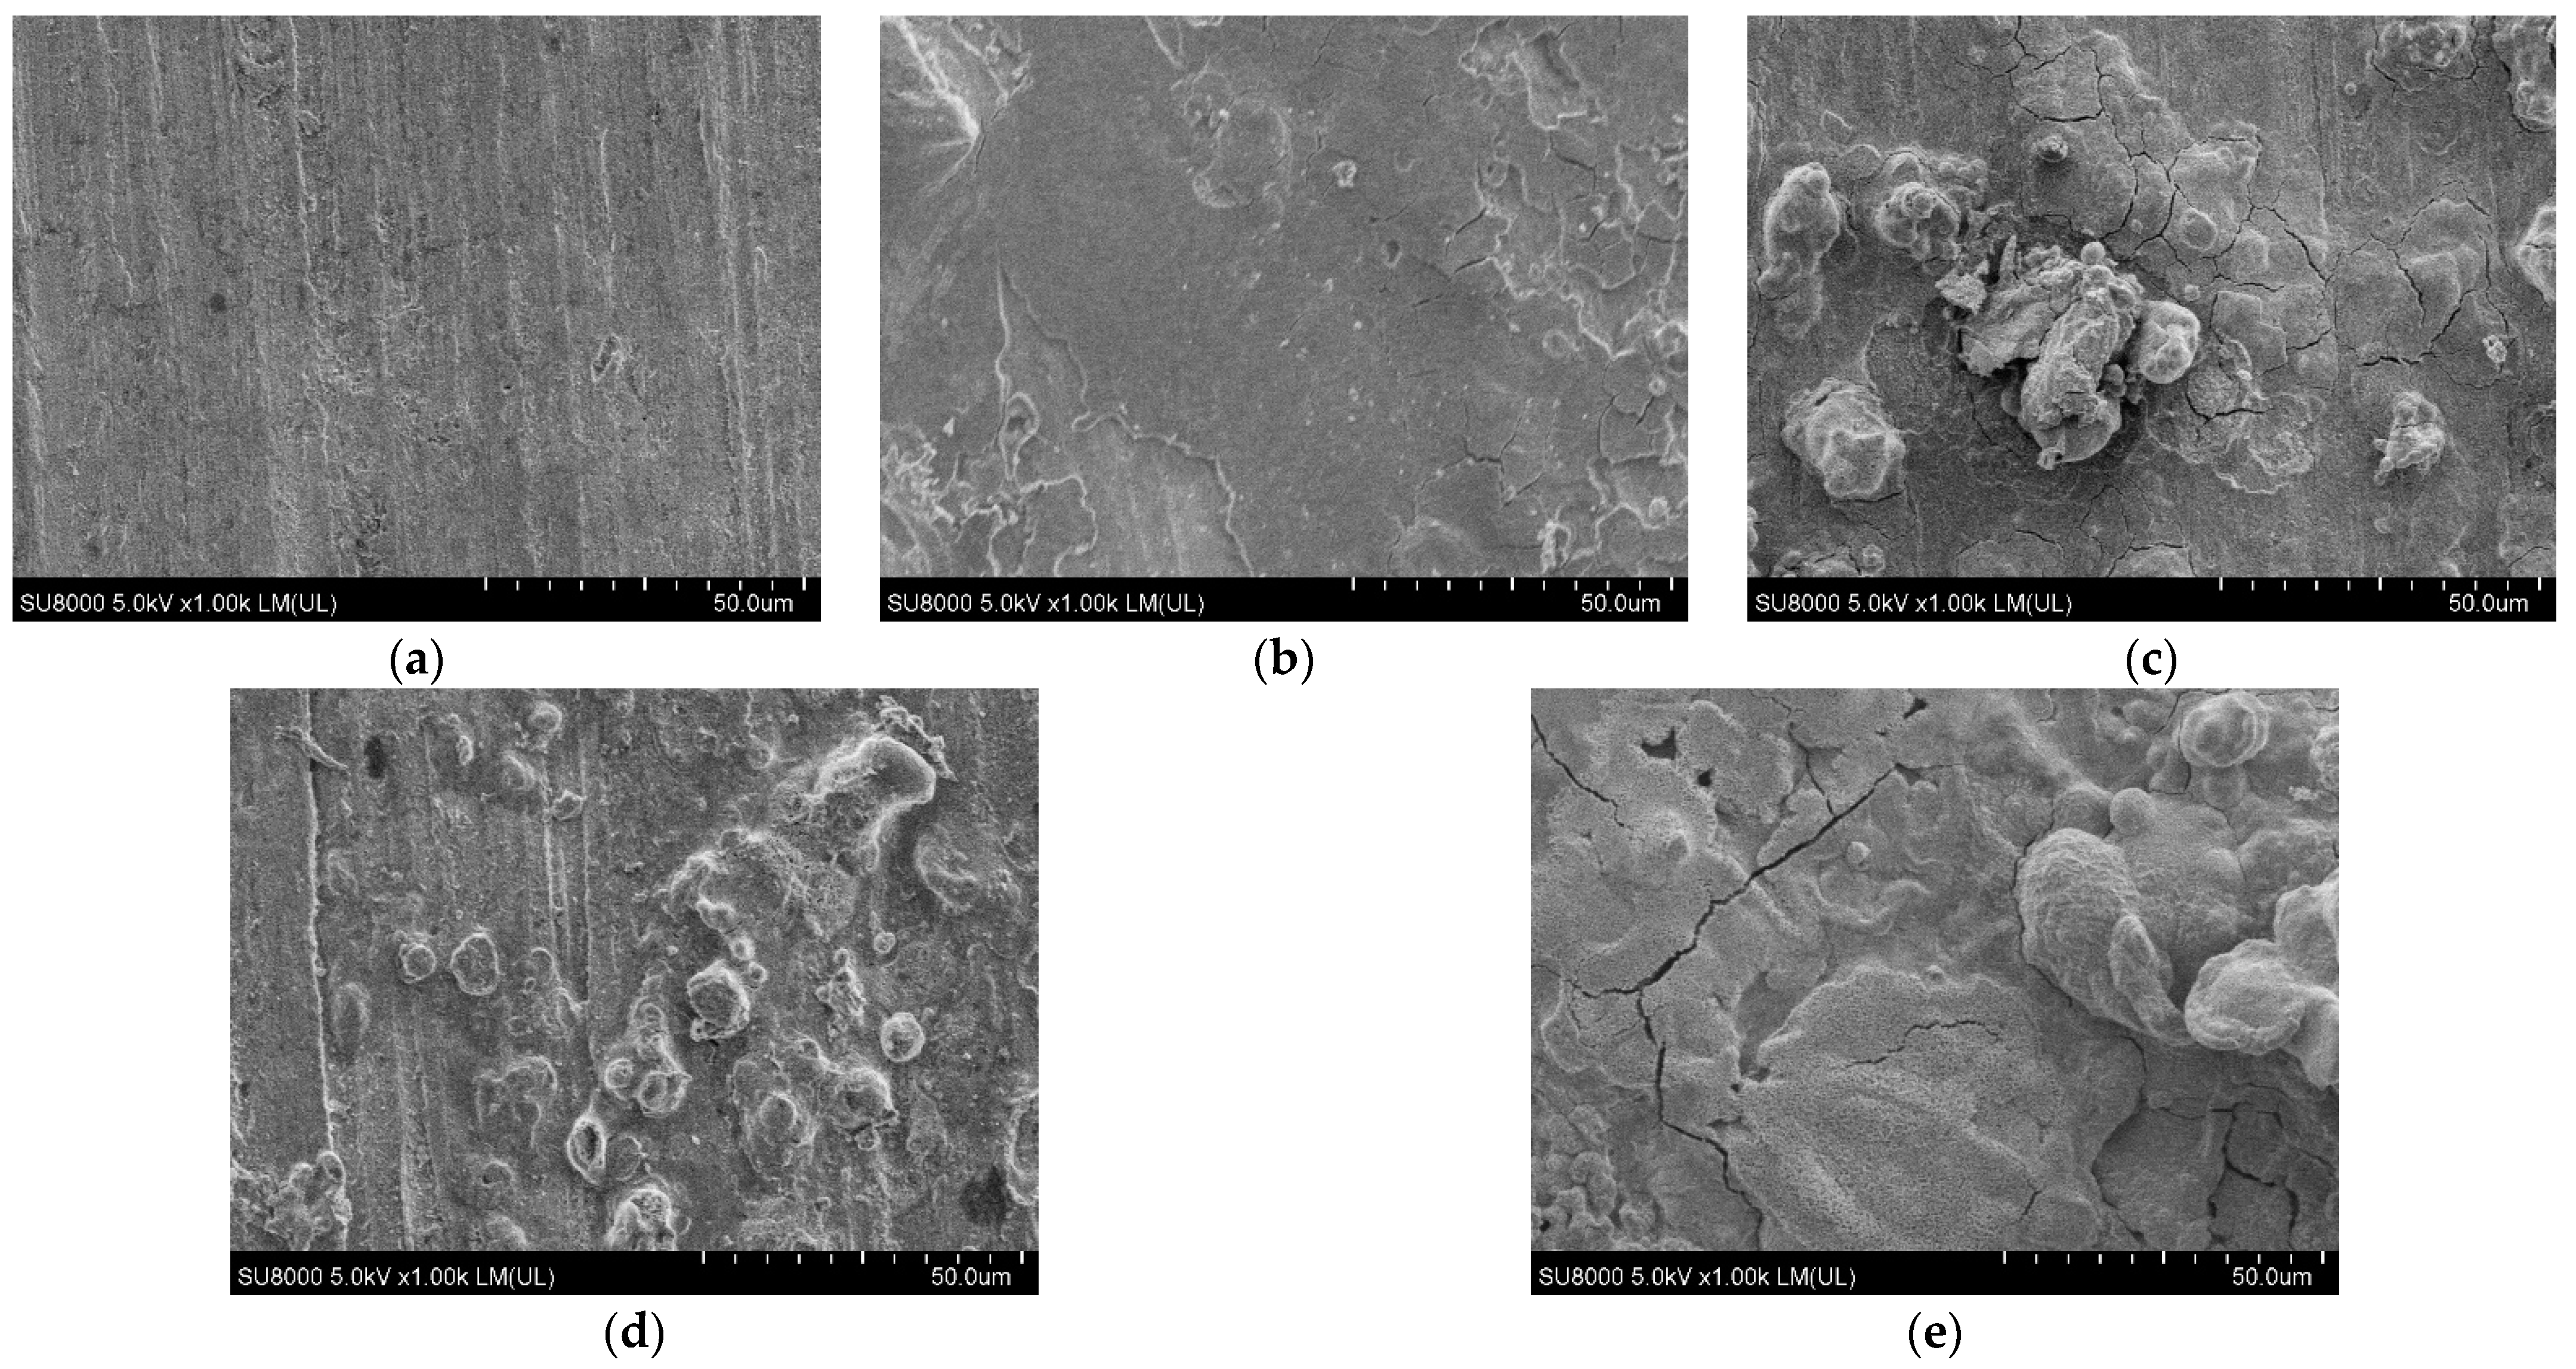
3.3. Effect of SRB Content on Corrosion

Test conditions: temperature and pressure were 40 °C and 3.5 MPa, water content was 80%, CO2 partial pressure was 0.05 MPa, total mineralization was 100,000 mg/L, Ca2+ + Mg2+ content was 11,000 mg/L, Cl content was 49,250 mg/L, and bacterial content was designed to be 0, 60, 120, 300, and 600 per mL, respectively.
To clarify the SRB content on the corrosion rate of the law, dynamic corrosion experiments were carried out through the above experimental conditions; the experimental results are shown in Figure 5. From the results, it can be seen that the corrosion rate of 20# steel mainly shows a gradual increase in corrosion rate with the increase in SRB content, while the increasing trend of corrosion rate gradually slows down with the increase in SRB content. The current mechanisms for the influence of SRB on metal corrosion includes the cathodic polarization, concentration cell mechanism, and metabolite mechanisms [18], of which the more recognized cathodic depolarization theory believes that in the oxygen-deficient environment, the SRB attached to the surface of carbon steel will produce depolarization, so that the SO42− oxidation in the medium absorbs hydrogen atoms so that the corrosion rate of carbon steel increases and the reaction equation is shown in Equations (8)–(14).
F e F e 2 + + 2 e
H 2 O H + + O H
H + + e H
S O 4 2 + 8 H S 2 + 4 H 2 O
F e 2 + + S 2 = F e S
3 F e 2 + + 6 O H 3 F e ( O H ) 2
4 F e + S O 4 2 + 4 H 2 O = F e S + 3 F e ( O H ) 2 + 2 O H
The corrosion morphology under different SRB content is shown in Figure 6. When the SRB content is 0, due to the presence of CO2 partial pressure, the surface of the test piece formed irregular granular-like corrosion products, and with the SRB content continuing to increase, more corrosion products gather on the surface of the test piece, indicating that under the conditions of the presence of CO2, with the increase in SRB content, the corrosion rate accelerates and the product film formation faster. However, there is a local surface corrosion product thickening phenomenon, the corrosion product film cracks exist, easily caused by the intrusion of corrosive media and cause corrosion.

3.4. Effect of Ca2+ + Mg2+ Content on Corrosion

Test conditions: temperature and pressure of 313 K + 3.5 MPa, water content of 90%, CO2 partial pressure of 0MPa, total mineralization of 100,000 mg/L, Cl content of 49,250 mg/L, Ca2+ + Mg2+ content designed for 7700, 9500, 11,000, 12,500, and 14,000 mg/L respectively.
In order to carry out dynamic corrosion experiments, through the above experimental conditions on 20# steel, there was clearly different Ca2+ + Mg2+ content on the corrosion rate of the influence of the law; the experimental results are shown in Figure 7. The results show that the dynamic corrosion rate of 20# steel with Ca2+ + Mg2+ content increases gradually, and in the Ca2+ + Mg2+ content of 14,000 mg/L corrosion rate reached a maximum of 0.1235 mm/a. With a Ca2+ + Mg2+ content less than 12,500 mg/L, the 20# steel corrosion rate rises faster, when Ca2+ + Mg2+ content is greater than 125,00 mg/L, the 20# steel dynamic corrosion rate continues to increase, but the increase in the amount slows down. The main reason is that on the one hand, the medium, CO32− and Ca2+/Mg2+ reaction CaCO3/MgCO3 deposited on the surface of the test piece, and the deposition layer is not complete and dense, but increased the unevenness of the metal surface, and may become a pitting source and induce pitting and local corrosion of the metal, thereby increasing the corrosion rate. On the other hand, the increase in carbonate deposition on the metal surface, the increase in corrosion microcells, and corrosion products below the corrosion rate increase.
The corrosion morphology under different Ca2++Mg2+ content is shown in Figure 8. When the Ca2+ + Mg2+ content is 7700 mg/L (as shown in Figure 8a), there are irregular lumpy products attached to the surface of the test piece; at this time, the corrosion products may be calcium and magnesium chloride deposits, but the metal body is still visible, indicating that the corrosion rate is not high under this condition; when the Ca2+ + Mg2+ content is 9500 mg/L (as shown in Figure 8b shown), the specimen surface becomes pitting corrosion, and the reason may be the solution of Cl broke through the deposition of CaCO3/MgCO3 deposited on the metal surface, resulting in the specimen pitting corrosion, making the corrosion rate rise; with Ca2+ + Mg2+ content increasing, the specimen surface cluster corrosion products and the analysis of possible components should be calcium magnesium chloride deposition, the emergence of calcified deposits cannot block the medium on the specimen corrosion effect, and easily cause the metal local electrode potential differences, leading to electrochemical corrosion and resulting in increased corrosion under the scale. When Ca2+ + Mg2+ content increased to 14,000 mg/L, corrosion products increases, but the corrosion products are loose, and there are many cracks that were not dense enough to complete. When the corrosion medium has CO2, bacteria or other factors that exist, it will lead to increased corrosion, resulting in localized corrosion, or even pitting corrosion [19].

3.5. Effect of Cl Content

Test conditions: temperature and pressure of 313 K+3.5 MPa, water content of 90%, CO2 partial pressure of 0 MPa, total mineralization of 100,000 mg/L, Ca2++Mg2+ content of 11,000 mg/L, and Cl content of 40,000, 45,000, 49,250, 55,000, 60,000 mg/L designed, respectively.
To carry out dynamic corrosion experiments, through the above experimental conditions in the 20# steel, clear different Cl content on the corrosion rate of the influence of the law, as can be seen in Figure 9, the corrosion rate with the Cl content and rising is shown. Among them is the Cl content ranging from 45,000 mg/L to 50,000 mg/L, 20# steel uniform corrosion rate change is the largest when the Cl content is from 55,000 mg/L to 60,000 mg/L, 20# steel uniform corrosion rate change is the smallest. Combined with the corrosion morphology, the results were analyzed as follows: as can be seen from Figure 10 with the Cl content of 40,000 mg/L, the test piece surface corrosion products are less and the surface is relatively flat; when the Cl content rises to 45,000 mg/L, the test piece of corrosion products film is destroyed; the main reason may be the Cl ion radius is a very small penetrating force and can destroy the test piece of the protective film, so that the corrosion rate increased; with the Cl content continuing to rise, the corrosion products on the surface of the test piece also increase sharply, and there is a cluster of corrosion products, at this time under the influence of Cl, the corrosion product film cracks, resulting in Cl which can penetrate and easily cause pitting; when the Cl content ranges from 55,000 mg/L to 60,000 mg/L, the corrosion products on the surface increases and the corrosion product film thickens, and to a certain extent will obstruct Cl, so its corrosion rate rise is weakened [20,21,22].

3.6. Analysis of Main Control Factors

To establish the main control factors influencing the corrosion of the oil–water mixed transmission system in the high water content period of the HH oil field, five influencing factors: temperature pressure, Ca2+ + Mg2+ content, CO2 partial pressure, Cl content, and SRB content were set as independent variables, and the corrosion rate of the test piece was set as the dependent variable, and Eta correlation analysis was performed using the mean comparison of SPSS; the operation results are shown in Figure 11. Eta squared represents “the proportion of the variance of the dependent variable explained by the difference between groups”. Eta squared is less than 0.06, indicating that the correlation between the variables is weak; this degree does not reach statistical significance, that is, the results are not statistically significant, cannot determine whether the difference in the mean value is due to random error; when Eta squared is greater than 0.06 and less than 0.16, this indicates a moderate correlation between the variables; when Eta squared is greater than 0.16, it indicates a strong correlation between the variables.
From the results of the Eta correlation analysis, it can be seen that the correlation (square of Eta) between temperature pressure, Ca2+ + Mg2+ content, CO2 partial pressure, Cl content, SRB content, and corrosion rate of 20# steel is greater than 0.06, which means that all five factors have a statistically significant effect on the corrosion rate and show a strong correlation with the corrosion rate. Among them, CO2 partial pressure, Cl content, SRB content, and the corrosion rate of 20# steel have a strong correlation, temperature pressure, Ca2+ + Mg2+ content, and the corrosion rate of 20# steel have a moderate correlation. The relationship between the magnitude of correlation (Eta value) of the five influencing factors and the corrosion rate is CO2 partial pressure > SRB content > Cl content > Ca2+ + Mg2+ content > temperature pressure, indicating that CO2 partial pressure and SRB content are the main controlling factors affecting the corrosion rate of the pipeline when the HH oil field gathering pipeline is working under high water content conditions.

4. Conclusions

(1)
The corrosion rate of HH oil field gathering pipeline in the high water content period showed a positive correlation with temperature pressure, CO2 partial pressure, SRB content, Ca2+ + Mg2+ content, and Cl content. The corrosion rate reached the maximum of 0.4697mm/a at the temperature and pressure of 313 K + 3.5 MPa, 0 bacteria/mL, total mineralization of 100,000 mg/L, Ca2+ + Mg2+ content of 11,000 mg/L, Cl content of 49,250 mg/L, and CO2 partial pressure of 0.17MPa.
(2)
In high water conditions, with the temperature pressure, CO2 partial pressure, SRB content, Ca2+ + Mg2+ content, Cl content increases, 20# steel corrosion products are gradually increased when the presence of CO2, the formed corrosion products film is looser, and the existence of gaps, cannot effectively prevent the occurrence of corrosion.
(3)
A 20# steel gathering pipeline in the high water content period for oil–water mixing shows the following impact of factors on the size of corrosion: CO2 partial pressure > SRB content > Cl content > Ca2+ + Mg2+ content > temperature pressure, where the partial pressure of CO2 for the control of the corrosion rate of the main control factors, and Eta square value of up to 0.934. Therefore, the effect of CO2 partial pressure should be considered first in the corrosion problem of high water-bearing catchment system containing CO2.

Author Contributions

Conceptualization, Z.Y.; Data curation, Z.Y.; Formal analysis, Z.Y.; Funding acquisition, C.W.; Investigation, M.Z.; Methodology, L.S.; Project administration, L.S.; Resources, M.Z.; Supervision, Z.Y.; Validation, L.S.; Visualization, L.S.; Writing – original draft, Z.Y.; Writing – review & editing, Z.Y. All authors have read and agreed to the published version of the manuscript.

Funding

This research received no external funding.

Institutional Review Board Statement

The study does not require ethical approval.

Informed Consent Statement

The study did not involve human.

Data Availability Statement

The data that support the findings of this study are available from the corresponding author, [Lihong Shi], upon reasonable request.

Conflicts of Interest

The authors declare no conflict of interest.

References

  1. Cheng, Y.; Bai, Y.; Li, Z.; Liu, J. The corrosion behavior of X65 steel in CO2/oil/water environment of gathering pipeline. Anti-Corrosion Methods Mater. 2019, 66, 174–187. [Google Scholar] [CrossRef]
  2. Bastidas, D.M. Corrosion and Protection of Metals. Metals 2020, 10, 458. [Google Scholar] [CrossRef] [Green Version]
  3. Yaro, A.S.; Abdul-Khalik, K.R.; Khadom, A. Effect of CO2 corrosion behavior of mild steel in oilfield produced water. J. Loss Prev. Process Ind. 2015, 38, 24–38. [Google Scholar] [CrossRef]
  4. Rmpsa, B.; Hbs, B.; Inb, C.; Lfs, D.; Amps, D. Naphthenic corrosion of API 5L X70 steel in aqueous/oil environment using electrochemical surface-resolved and analytical techniques. Electrochim. Acta 2022, 407, 139900. [Google Scholar]
  5. Wei, L.; Pang, X.; Gao, K. Effects of Crude Oil on Corrosion Behavior of Pipeline Steel Under Wet CO2 Condition. In CORROSION 2014; OnePetro: Richardson, TX, USA, 2014. [Google Scholar]
  6. Hu, Z.Y.; Duan, D.L.; Hou, S.H.; Ding, X.J.; Li, S. Preliminary Study on Corrosion Behaviour of Carbon Steel in Oil–Water Two-Phase Fluids. J. Mater. Sci. Technol. 2015, 31, 1274–1281. [Google Scholar] [CrossRef]
  7. Qin, M.; He, G.; Liao, K.; Zou, Q.; Zhao, S.; Jiang, X.; Zhang, S.J. Performance, CO2-O2-SRB-Cl Multifactor Synergistic Corrosion in Shale Gas Pipelines at a Low Liquid Flow Rate. J. Mater. Eng. Perform. 2022, 31, 4820–4835. [Google Scholar] [CrossRef]
  8. Shaoyan, F. Corrosion Factors Analysis of Oilfield Water Injection System. Oilfield Chem. 2015, 32, 277–281. (In Chinese) [Google Scholar]
  9. LI Cheng, W.C.; Chen, X.; Lu, J.; Zhang, Z.; Shi, L. Corrosion Law and Protection Measures of Shale Gas Well Wellbores. Corros. Prot. 2020, 41, 35–40. (In Chinese) [Google Scholar]
  10. Tianli, S.; Guo, Z.; Zhonghong, L.; Xiaoyu, Y.; Bing, W.; Dezhi, Z. Study on main control factor of surface systerm corrosion in Yuanba sulfur gas field. Chem. Engineegine Oil Gas 2021, 50, 77–82. (In Chinese) [Google Scholar]
  11. Yanshuang, G.; Tan, G.; Chao, A.; Ailiang, Z.; Kexi, L. Analysis of main controlling factors of flow corrosion of gathering and transportation pipelines based on Pearson correlation coefficient. Chem. Eng. Oil Gas 2021, 50, 93–99. (In Chinese) [Google Scholar]
  12. Jun, F.X.; Li, L.; Gang, Y.Z.; Qiang, Z.Y. Corrosion Behavior and Mechanism of Oil Casing Steel in CO2 Salt Solution. J. Mater. Sci. Forum 2021, 6114, 534–538. [Google Scholar]
  13. Wang, S.; Yin, X.; Zhang, H.; Liu, D.; Du, N. Coupling Effects of pH and Dissolved Oxygen on the Corrosion Behavior and Mechanism of X80 Steel in Acidic Soil Simulated Solution. Materials 2019, 12, 3175. [Google Scholar] [CrossRef] [Green Version]
  14. Zhao, S.; Liao, K.; Zhou, F.; Leng, J.; Huang, Q.; He, G. Effect of Temperature on the Corrosion Behavior of L245NS Steel in a CO2/H2S/O2 Multi-component Thermal Fluid Collection and Transportation System. Arab. J. Sci. Eng. 2021. prepublish. [Google Scholar] [CrossRef]
  15. Ma, W.; Qu, H.; Huang, W.; Dou, Y.; Wang, Z. Study on Failure Behavior of Gas Well Tubing Under CO2 Corrosion After Erosion. J. Fail. Anal. Prev. 2020, 20, 950–957. [Google Scholar] [CrossRef]
  16. Motte, R.D.; Basilico, E.; Rémy, M.; Kittel, J.; Marcelin, S. A study by electrochemical impedance spectroscopy and surface analysis of corrosion product layers formed during CO2 corrosion of low alloy steel. Corros. Sci. 2020, 172, 108666. [Google Scholar] [CrossRef]
  17. Sun, X.; Cui, H.; Li, Z.; He, R.; Liu, Z.; Lu, L. Effect of Service Environmental Parameters on Electrochemical Corrosion Behavior of L80 Casing Steel. Materials 2021, 14, 5575. [Google Scholar] [CrossRef]
  18. Peng, X.; Liu, X. Modification of D-W model for corrosion rate of shale gas pipeline under the synergistic corrosion of SRB and CO2. Anti–Corros. Methods Mater. 2021, 68, 150–159. [Google Scholar] [CrossRef]
  19. Chang, P.; Shi, R.X.; Wang, L.; Han, W.; Ye, C.D.; Ma, Y. Study on Source Analysis of the Cation in Produced Water from Sulige Gas Field and Anti-Scaling Measures. Key Eng. Mater. 2019, 4838, 505–510. [Google Scholar] [CrossRef]
  20. Xiaoqi, Y.; Yongqiang, R.; Luyao, H.; Shuai, Z.; Lei, Z.; Yong, H. The role of Cl- in the formation of the corrosion products and localised corrosion of 15Cr martensite stainless steel under an CO2-containing extreme oilfield condition. Corros. Sci. 2022, 194, 109935. [Google Scholar]
  21. Kexi, L.; Min, Q.; Guoxi, H.; Na, Y.; Shijian, Z. Study on corrosion mechanism and the risk of the shale gas gathering pipelines. Eng. Fail. Anal. 2021, 128, 105622. [Google Scholar]
  22. Chen, X.; Zhang, Z.; Zhang, H.; Yan, H.; Liu, F.; Tu, S. Influence of Air Pollution Factors on Corrosion of Metal Equipment in Transmission and Transformation Power Stations. Atmosphere 2022, 13, 1041. [Google Scholar] [CrossRef]
Figure 1. Variation curve of dynamic corrosion rate of 20# steel with temperature and pressure.
Atmosphere 13 01687 g001
Figure 2. Microscopic corrosion morphology of hanging piece under different temperatures and pressure. (a) 298 K + 0.5 MPa; (b) 308 K +2.5 MPa; (c) 313K + 3.5 MPa.
Atmosphere 13 01687 g002
Figure 3. Variation curve of 20# steel dynamic corrosion rate with CO2 partial pressure.
Atmosphere 13 01687 g003
Figure 4. Microscopic corrosion morphology of hanging piece under different CO2 partial pressure. (a) CO2 partial pressure 0 MPa; (b) CO2 partial pressure 0.05 MPa; (c) CO2 partial pressure 0.1 MPa; (d) CO2 partial pressure 0.17 MPa.
Atmosphere 13 01687 g004
Figure 5. Variation curve of dynamic corrosion rate of 20# steel with SRB content.
Atmosphere 13 01687 g005
Figure 6. Microscopic corrosion morphology of hanging piece under different SRB content. (a) 0 pcs/mL; (b) 60 pcs/mL; (c) 120 pcs/mL; (d) 300 pcs/mL; (e) 600 pcs/mL.
Atmosphere 13 01687 g006
Figure 7. Variation curve of dynamic corrosion rate of 20# steel with Ca2 + + Mg2 + content.
Atmosphere 13 01687 g007
Figure 8. Microscopic corrosion morphology of hanging piece under different Ca2+ + Mg2+ content. (a) Ca2+ + Mg2+ content 7700 mg/L; (b) Ca2+ + Mg2+ content 9500 mg/L; (c) Ca2+ + Mg2+ content 11,000 mg/L; (d) Ca2+ + Mg2+ content 12,500 mg/L; (e) Ca2+ + Mg2+ content 14,000 mg/L.
Atmosphere 13 01687 g008
Figure 9. Variation curve of dynamic corrosion rate of 20# steel with Cl content.
Atmosphere 13 01687 g009
Figure 10. Microscopic corrosion morphology of hanging piece under different Cl content. (a) Cl content 40,000 mg/L; (b) Cl content 45,000 mg/L; (c) Cl content 49,250 mg/L; (d) Cl content 55,000 mg/L; (e) Cl content 60,000 mg/L.
Atmosphere 13 01687 g010
Figure 11. SPSS data analysis results.
Atmosphere 13 01687 g011
Table 1. Chemical composition of the sample.
ElementCSiMnPSCrNiCuFe
Elemental Content, %0.2000.2100.4100.0140.0050.0600.0500.165Residuals
Table 2. Analysis results of ion composition of the produced water samples.
Ionic Content, mg/LMineralization, mg/L
K+ + Na+Ca2+Mg2+Ba2+ + Sr2+ClHCO3SO42+99,383.4
24,385.510,588446.62520.649,250.526.847.9
Table 3. Basic physical properties of the experimental oil.
Density, g/cm3Viscosity, mPa·sSulfur Content, %
0.835~0.8693.53~15.80.07~0.09
Table 4. Experimental conditions.
Temperature + PressureRotational Speed
(r/min)
CO2 Partial Pressure
(MPa)
Water Content
(%)
Bacterial Content (SRB)
(pcs/mL)
Ca2+ Content
(mg/L)
Cl
Content
(mg/L)
Soaking Time
(h)
298 K + 0.5 MPa
308 K + 2.5 MPa
313 K + 3.5 MPa
1250.05
0.1
0.17
900770040,00072
60950045,000
12011,00049,250
30012,50055,000
60014,00060,000
Publisher’s Note: MDPI stays neutral with regard to jurisdictional claims in published maps and institutional affiliations.

