Article

Transmission of Seeding Agent for Aircraft Precipitation Enhancement Based on the HYSPLIT Model

1
China Meteorological Administration, Henan Key Laboratory of Agrometeorological Support and Applied Technique, Zhengzhou 450000, China
2
Weather Modification Center of Henan Province, Henan Meteorological Bureau, Zhengzhou 450000, China
3
Anhui Public Meteorological Service Center, Anhui Meteorological Bureau, Hefei 230031, China
4
School of Civil Aviation, Zhengzhou University of Aeronautics, Zhengzhou 450046, China
5
College of Resources and Environment, Anhui Agricultural University, Hefei 230036, China
6
Henan Meteorological Service Center, Henan Meteorological Bureau, Zhengzhou 450000, China
7
Troops 61741 of PLA, Beijing 100094, China
*
Author to whom correspondence should be addressed.
Atmosphere 2022, 13(9), 1508; https://doi.org/10.3390/atmos13091508
Submission received: 10 August 2022 / Revised: 3 September 2022 / Accepted: 13 September 2022 / Published: 15 September 2022
(This article belongs to the Section Meteorology)

Abstract

:
The precipitation enhancement operation data of aircraft from 2014 to 2019 and the global data assimilation system (NCEP GDAS) were used in this study. The transport process of the transmission of artificial precipitation enhancement seeding agents for aircraft was successfully simulated by the HYSPLIT model. The purpose of the study was to explore the applicability of the model in determining the artificial precipitation enhancement influence area and provide a technical method for evaluating the effect of artificial precipitation enhancement. The results show that (1) the HYSPLIT model can be used to track the transmission of aircraft precipitation enhancement seeding agents hourly. Suppose the seeding route satisfies the condition that the route and its interval area are the effective seeding area within 3 h after the end of the seeding agent. In that case, the seeding area’s boundary points can be used as dynamic change markers in the influence area. (2) The HYSPLIT model was used to simulate 24 aircraft precipitation enhancement seeding agent transmission processes. The transmission path for the seeding agent influence altitude layer was mostly southwest or west; the angle ranged from 225° to 268°; the horizontal transport distance of the seeding agent for three hours was 100–200 km; the vertical transmission direction was mostly upward; the range was 0–1200 m; the influence area decreased at the third h of seeding agent transport for 71% of the precipitation enhancement operations. (3) Based on the dynamic variations of 24 aircraft precipitation affected areas determined by the HYSPLIT model, and the contrast area selected by the similarity measurement method, 15 (63%) aircraft precipitation operations contributed to the increase in precipitation.

1. Introduction

It is of great theoretical and practical significance to explore the transmission and diffusion of artificial precipitation enhancement seeding agents. When artificial precipitation operations and scientific experiments are carried out using seeding agents, the spatial and temporal distribution of the seeding agent and the catalysis are closely related to the effect of artificial precipitation enhancement, so it is very important to understand and master the characteristics and laws of catalyst transport and diffusion for the scientific evaluation of precipitation enhancement effects. How to determine the effective range after seeding, how the effective seeding region changes over time, and how to carry out seeding to ensure adequate seeding of the cloud being operated are important problems to be solved in the field of weather modification [1,2].
The composition, solubility, scale, and quantity of natural aerosol can affect the process of cloud condensation nucleus (CCN) on clouds. It has been found that organic aerosol accounts for the main part of the total CCN [3]. At the same time, anthropogenic aerosol pollution from industrial processes, automobile exhaust, and coal-fired power plants has strong hygroscopicity, so it can be used as CCN. However, excessive CCN will lead to a large number of cloud droplets, which are very small and inhibit the formation of precipitation through the collision and coalescence of cloud droplets [4]. The solubility of natural aerosol in water is different, the low solubility of natural aerosol will lead to smaller surface precipitation, and soluble aerosol particles (such as NaCl) will cause an increase in surface precipitation [5]. The huge seed particles exert a strong solute effect throughout the simulation, changing the subsequent collision–coalescence process, so the solute term is very important during the droplet growth process [6]. There is water competition between natural cloud droplets and artificial seeding particles during the entraining process from the outside through turbulent diffusion [7].
Additionally, the inadvertent transport of seeding material was analyzed by Ćurić et al. [8]. During weather modification activities, a large amount of seeding material can be transferred far from the seeding zone in a downwind direction. For distances above 10 km, most of the seeding agent would remain inactivated, because horizontal transport of the seeding agent becomes more important than transport induced by the main updraft. If the complete seeding material stays inactivated, it would be transferred far from its initial area, and the cloud would not be able to capture the seeding agent even during its greatest lateral extent.
Most of the existing research on the main methods of seeding agent transmission and diffusion in the cloud are mainly theoretical and numerical simulations, because it is difficult to carry out large-scale experiments of catalyst transmission and diffusion directly in the cloud [9,10]. In previous studies, some scholars used free atmospheric transport diffusion theory to construct numerical models of seeding agent diffusion (three-dimensional smoke trajectory models, Gaussian diffusion, etc.). Different types of seeding agent and cloud types were studied, by which the theoretical basis was accumulated for the exploration of precipitation enhancement seeding agent transmission and diffusion methods. However, the numerical simulation process usually sets certain assumptions and parameters and uses limited atmospheric observation data, focusing on individual cases. The current research methods for seeding agent transmission and diffusion in clouds mainly include the finite difference method, the unbounded atmospheric point source diffusion model, the linear source and point source diffusion theoretical models of stratiform clouds and convective clouds, the turbulent diffusion equation, and the three-dimensional smoke trajectory model of linear source transmission and diffusion of stratiform clouds, the Gaussian ground point source diffusion model, etc. [11,12,13,14,15]. For the research method that used a tracer test or a numerical model [16,17,18], the concentration and transport characteristics of the tracer seeding agent were the main things that were thoroughly studied [19,20,21].
For a long time, empirical non-quantitative methods have been mainly used to evaluate seeding agent influence over time, scope, and effectiveness. Still, this method is unsuitable for developing weather modification in the new situation. Using actual meteorological data and scientific and reasonable calculation means to accurately determine the transmission of precipitation enhancement seeding agents is our research direction and focus, which is also the route of this paper. In this paper, the Lagrange trajectory model HYSPLIT was used to analyze the transmission process of aircraft precipitation enhancement seeding agents, and the following factors were considered: First, there is a similar mechanism between the diffusion of artificial precipitation enhancement seeding agents and the diffusion of pollutants, which can be used as a reference in predicting atmospheric environmental impact. As a professional model for calculating the transport and diffusion trajectory of air pollutants, the HYSPLIT model not only shows certain advantages in exploring the transport of water vapor in the atmosphere or precipitation process [22,23,24,25,26,27,28,29], but also provides a reference for the calculation of precipitation enhancement seeding agent transmission [30]. Secondly, there is a limited type of research on aircraft precipitation seeding agent transmission using the HYSPLIT model and actual grid data. Given all that, this paper tries to explore the model’s applicability in tracking the area affected by artificial precipitation enhancement. It provides a reference for determining the suitable seeding position of seeding agents in the cloud and a more multidimensional technical method for evaluating the effects of artificial precipitation enhancement operations.

2. Data and Methods

2.1. Data

The following data were used by this study:
(1)
The Global Data Assimilation System (GDAS) from the National Centers for Environmental Prediction in the United States, which includes geopotential height, wind, temperature, specific humidity, and other elements, has a horizontal resolution of 1° × 1° and 21 layers in the vertical direction.
(2)
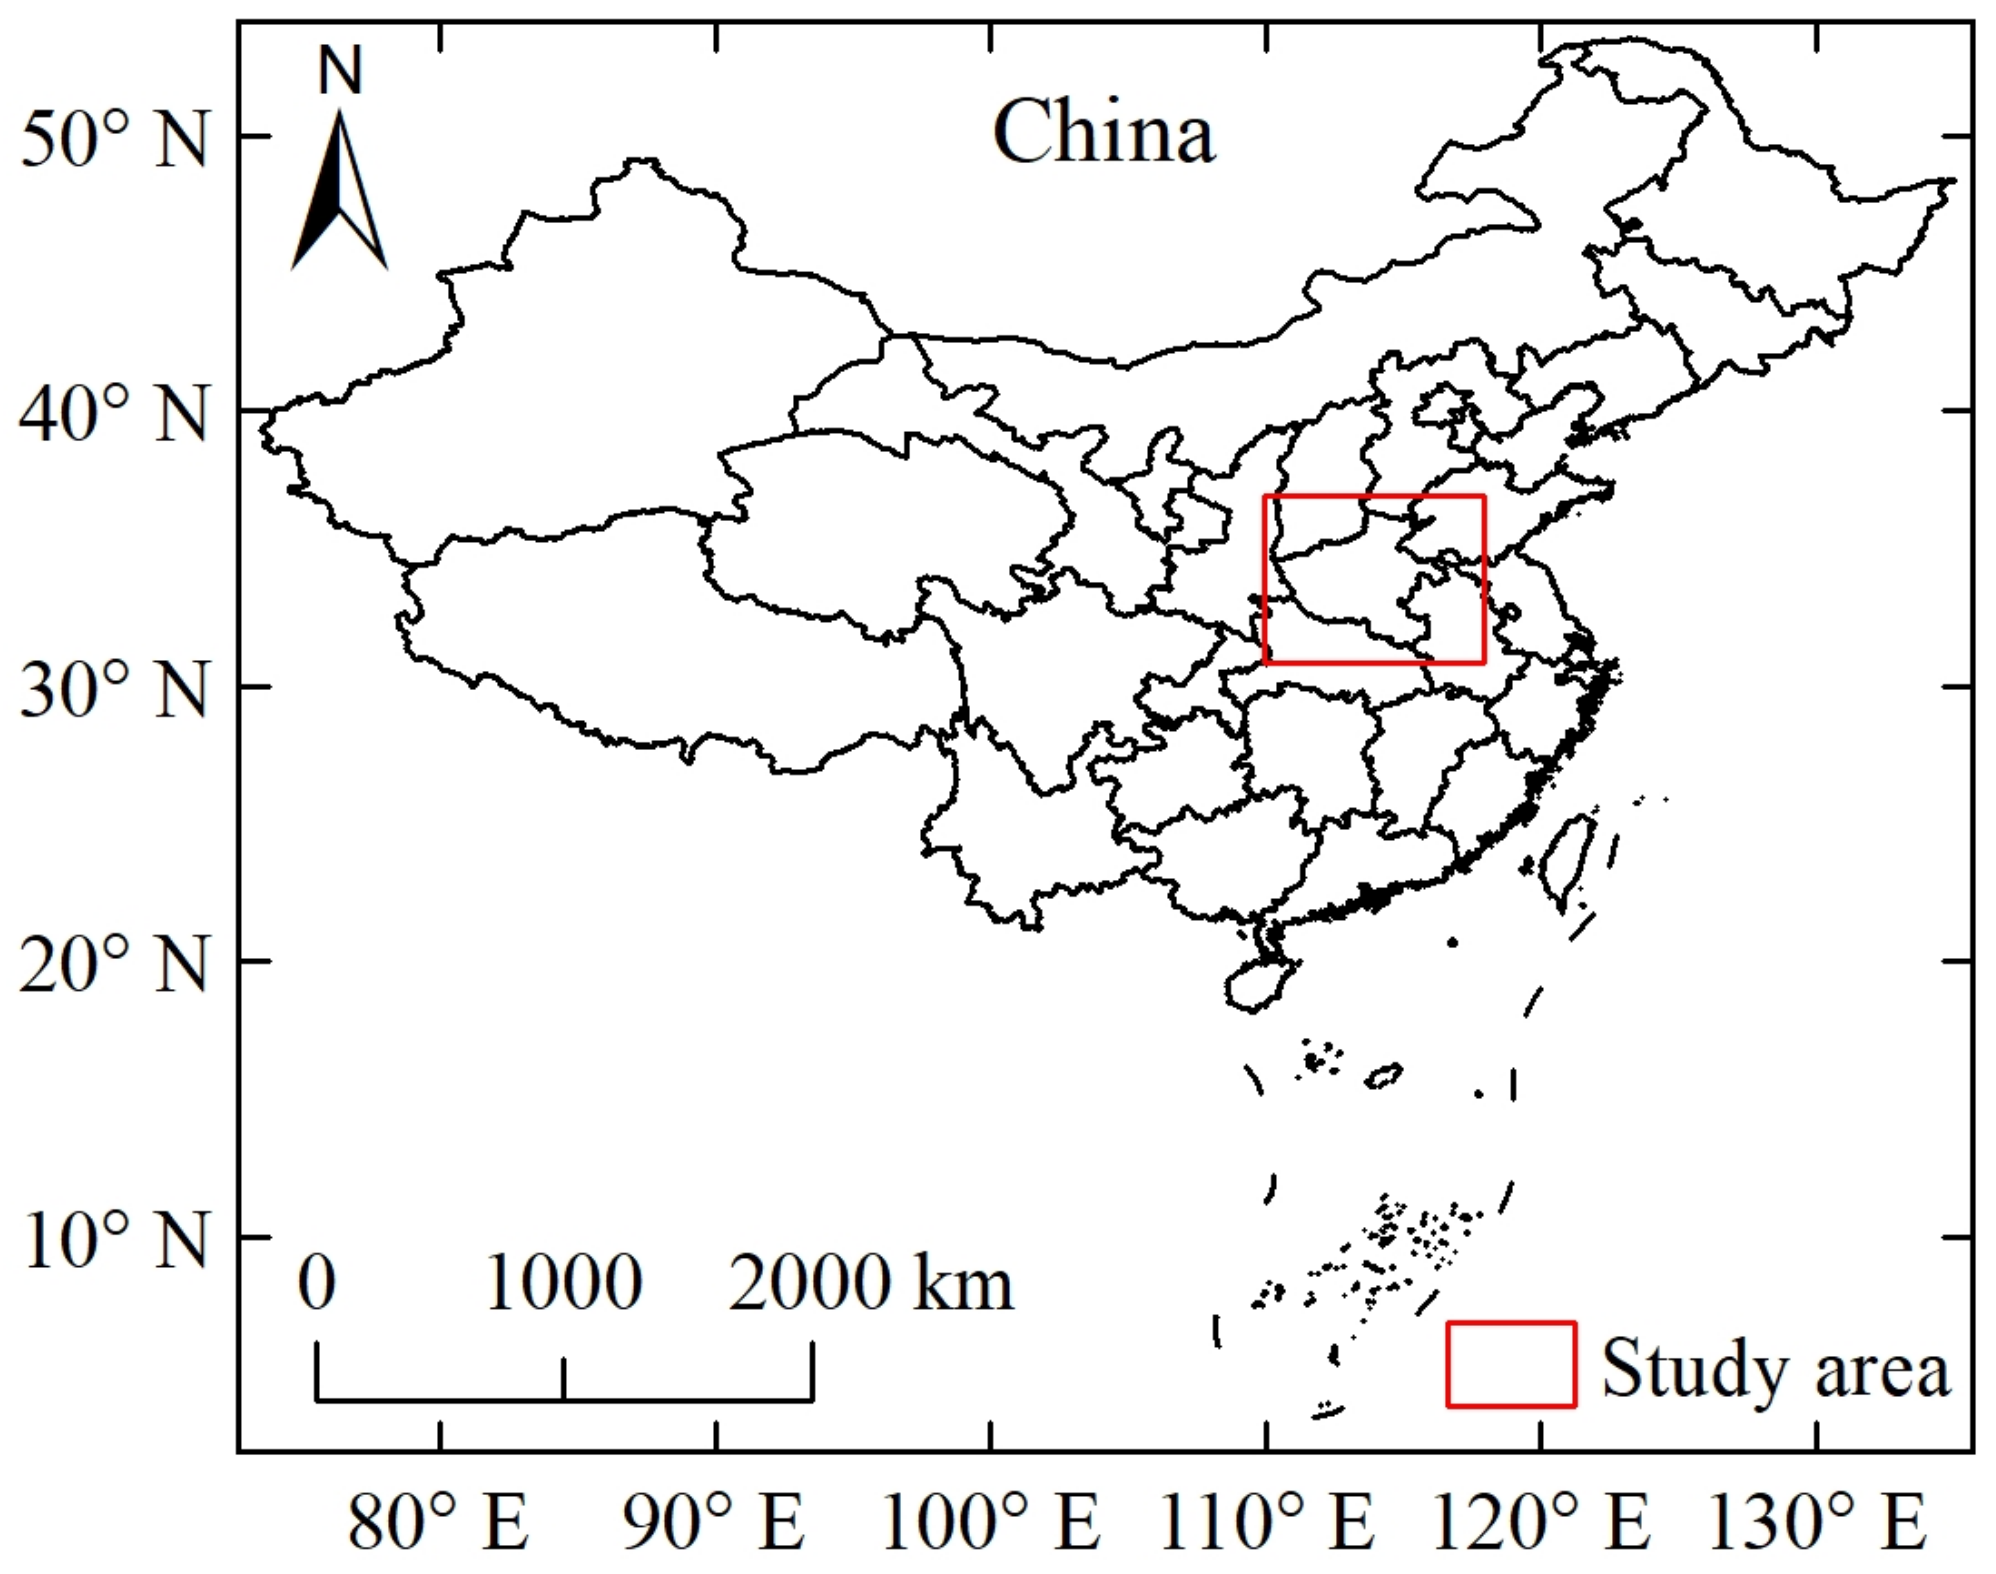
Data on 24 aircraft precipitation enhancement operations from 2014 to 2019, including aircraft routes, longitude, latitude, altitude, temperature, seeding time, seeding region, seeding altitude, and seeding dose. Figure 1 shows the borders of China with the study area.
(3)
Data from geostationary meteorological satellites and weather radars, including Fengyun geostationary meteorological satellite remote sensing data with time resolutions of 30 min or 4 min and Doppler weather radar detection data with a time resolution of 6 min.

2.2. HYSPLIT Model

2.2.1. Introduction to HYSPLIT Model

The HYSPLIT model (Hybrid Single-Particle Lagrangian Integrated Trajectories), developed jointly by NOAA’s Air Resources Laboratory and the Australian Bureau of Meteorology, is a professional model for calculating and analyzing air pollutant transport and diffusion trajectories, including the mixed single-particle Lagrangian integral trajectory model. The model has a complete transport, diffusion, and settlement model, which deals with the functions of various meteorological input fields, various physical processes, and different pollutant emission sources, and has been widely used in the transport and diffusion study of multiple pollutants and gases in various regions [31]. The model is a mixture of the Lagrangian and the Euler diffusion models. The Lagrange method is used to calculate advection and diffusion, and the Euler method is used to calculate the concentration field. The model can track the movement direction of particles or gases carried by the airflow and carry out a three-dimensional trajectory simulation of the target area. Meanwhile, it can calculate the forward and backward trajectories.
The trajectory calculation principle of the HYSPLIT model is as follows [31,32]: (Equations (1) and (2)) The particle trajectory moves in the wind field. The vector velocity at the position of the air mass is obtained through linear interpolation in space and time, and its trajectory is the integration in space and time. Where t represents the integral time step, P represents the initial position, P’ represents the first guess position, and V represents the wind speed. The particle is in position P(t) at time t, and the position P(t + Δt) after the time step δ t:
P ( t + t ) = P ( t ) + V ( P , t ) t
P ( t + t ) = P ( t ) + 0.5 [ V ( P , t ) + V ( P , t + t ) ] t
The integral time step satisfies the condition [33]: Δt·Umax < 0.75ΔL (Umax is the maximum wind speed, ΔL is a spacing between grid points); namely, the movement of the air mass within a time step is no more than 0.75 grid interval.
The horizontal coordinates of the model retain the original format of the input data, and the vertical direction is interpolated into the terrain σ coordinates (Equation (3)). Where Ztop is the top of the trajectory mode coordinate system, Zgt is the terrain height, and Zmst is the boundary height under the coordinate.
σ = z t o p z m s t z t o p z g t

2.2.2. Model Configuration of Precipitation Seeding Agent Transmission

The diffusion mechanism of the seeding agent is similar to that of pollutants in artificial precipitation enhancement operations. Therefore, the application of the HYSPLIT model in atmospheric environmental impact prediction can be used as a reference; the diffusion direction and range of seeding agents were obtained by using the model. When the HYSPLIT model is used to simulate the seeding agent transmission process in an artificial precipitation enhancement operation, it is necessary to clarify the key links in the effective action process of the seeding agent: the release process, diffusion process, and nucleation process, to determine the catalyst transport simulation scheme.
(1)
Release process. The pyrolytic seeding agent on board the aircraft is seeded into the cloud through the combustion release process, and the combustion duration from beginning to end is the release time. For the present airborne flame catalyst silver iodide smoke strip and silver iodide flame bomb, the release time is usually approximately ten minutes and one minute, respectively. At present, the release time of silver iodide smoke strip and silver iodide flame bomb, which are flame catalysts carried by precipitation enhancement aircraft, is usually approximately ten minutes and one minute, respectively.
(2)
Diffusion process. The seeding agent released by precipitation enhancement aircraft is discharged instantaneously at a certain point, and the aircraft operation belongs to moving line source seeding. Some studies show that the diffusion reaches the width of the effective catalytic concentration of approximately 7 km within 12 h [1,34].
(3)
Nucleation processes. The nucleation process refers to aerosol particles or ions [35]. In view of the seeding layer temperature of the case of aircraft precipitation enhancement in this paper, nucleation times of AgI seeding agent ranging from −20 °C to −4 °C in previous studies [36,37,38] were summarized. The nucleation temperature and nucleation time of AgI seeding agent are affected by various factors, such as atmospheric temperature and humidity conditions, seeding agent particle size and formula composition, and combustion mode of seeding agent particles. Consequently, the nucleation time from −20 to −4 °C for the artificial ice nucleation preparation currently used for cold cloud catalysis is typically 1~40 min. Theoretically, when the concentration of artificial ice cores generated by the seeding agent is greater than 10 L−1, it can enhance precipitation [39]. The optimum ice crystal density can be produced by introducing the appropriate amount of cold cloud seeding agent into the proper part of the cloud, thus promoting the development of the cloud precipitation process. Under the appropriate and sufficient catalytic dose, the changing trend in precipitation with different catalytic doses is consistent. Still, the effect of precipitation enhancement varies and increases with catalytic dose [40,41,42]. As for the duration of maintaining the effective concentration of seeding agent after release, diffusion, and nucleation (under the condition of sufficient artificial ice core), the study usually focuses on 3 h after seeding operation [43]. Some scholars think it could be longer. Based on previous research, the effective time for catalysis in this paper was set at 3 h.

3. Results

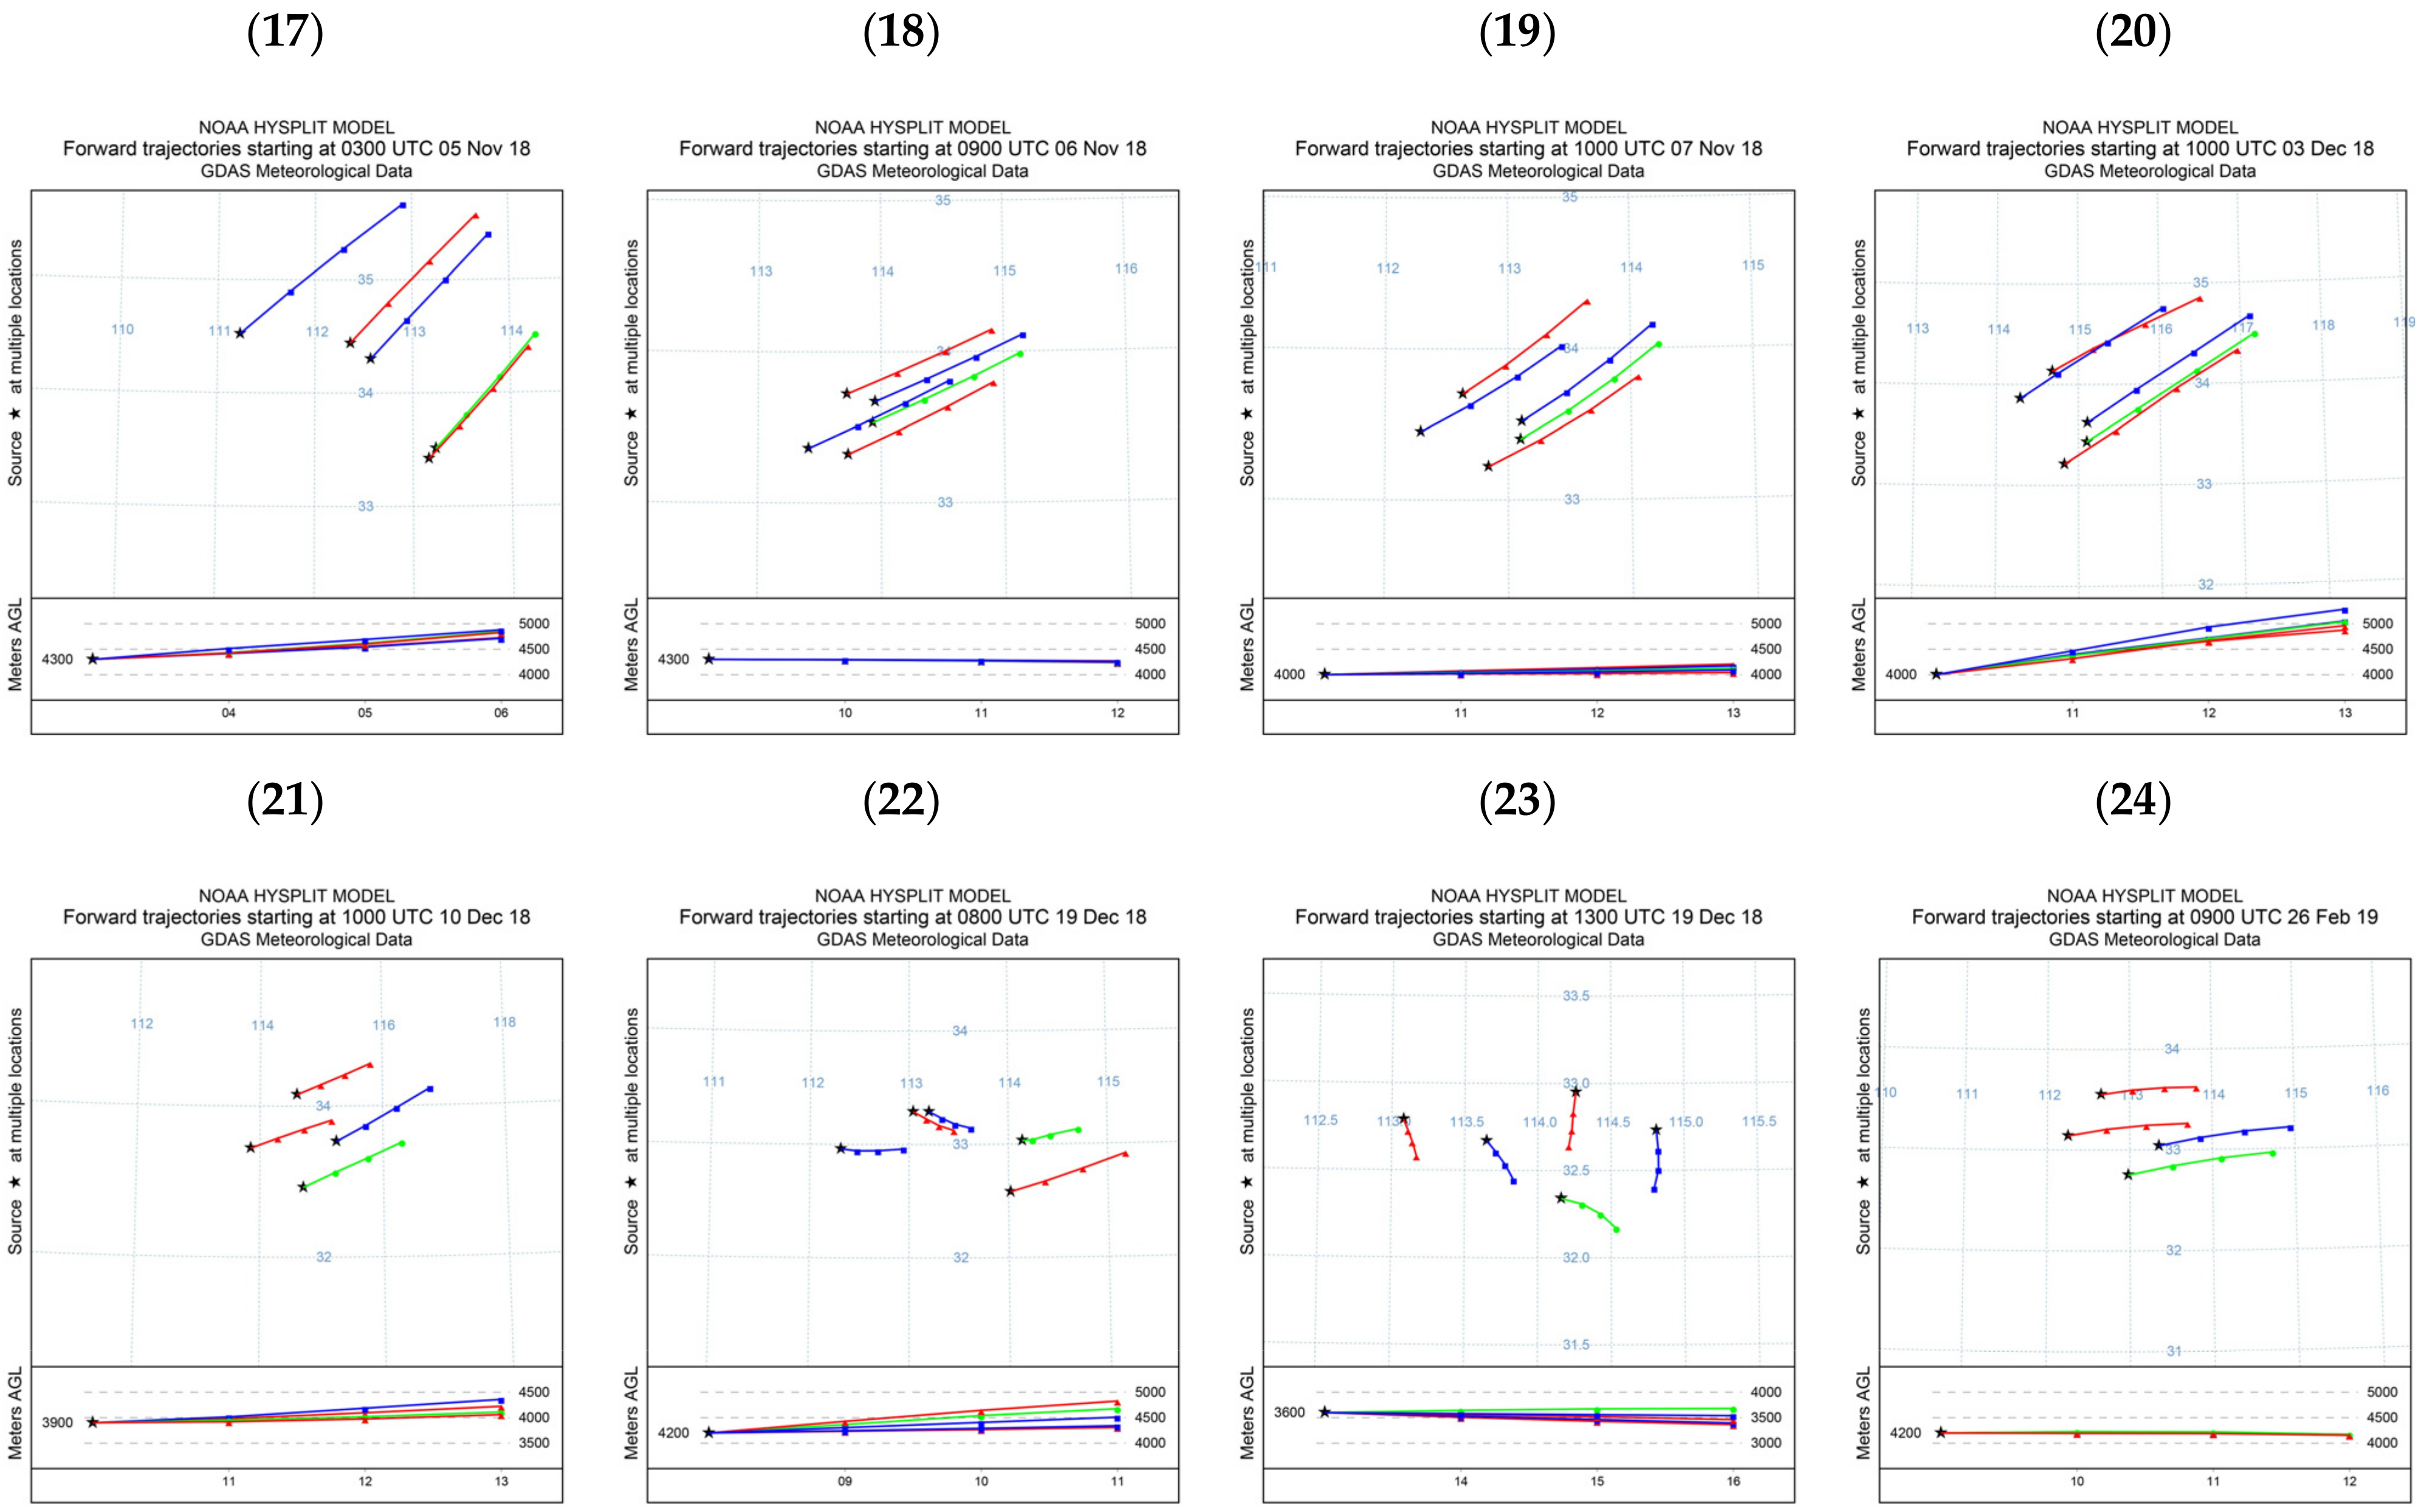
3.1. Simulation of Transmission of Aircraft Precipitation Enhancement Seeding Agent by HYSPLIT Model

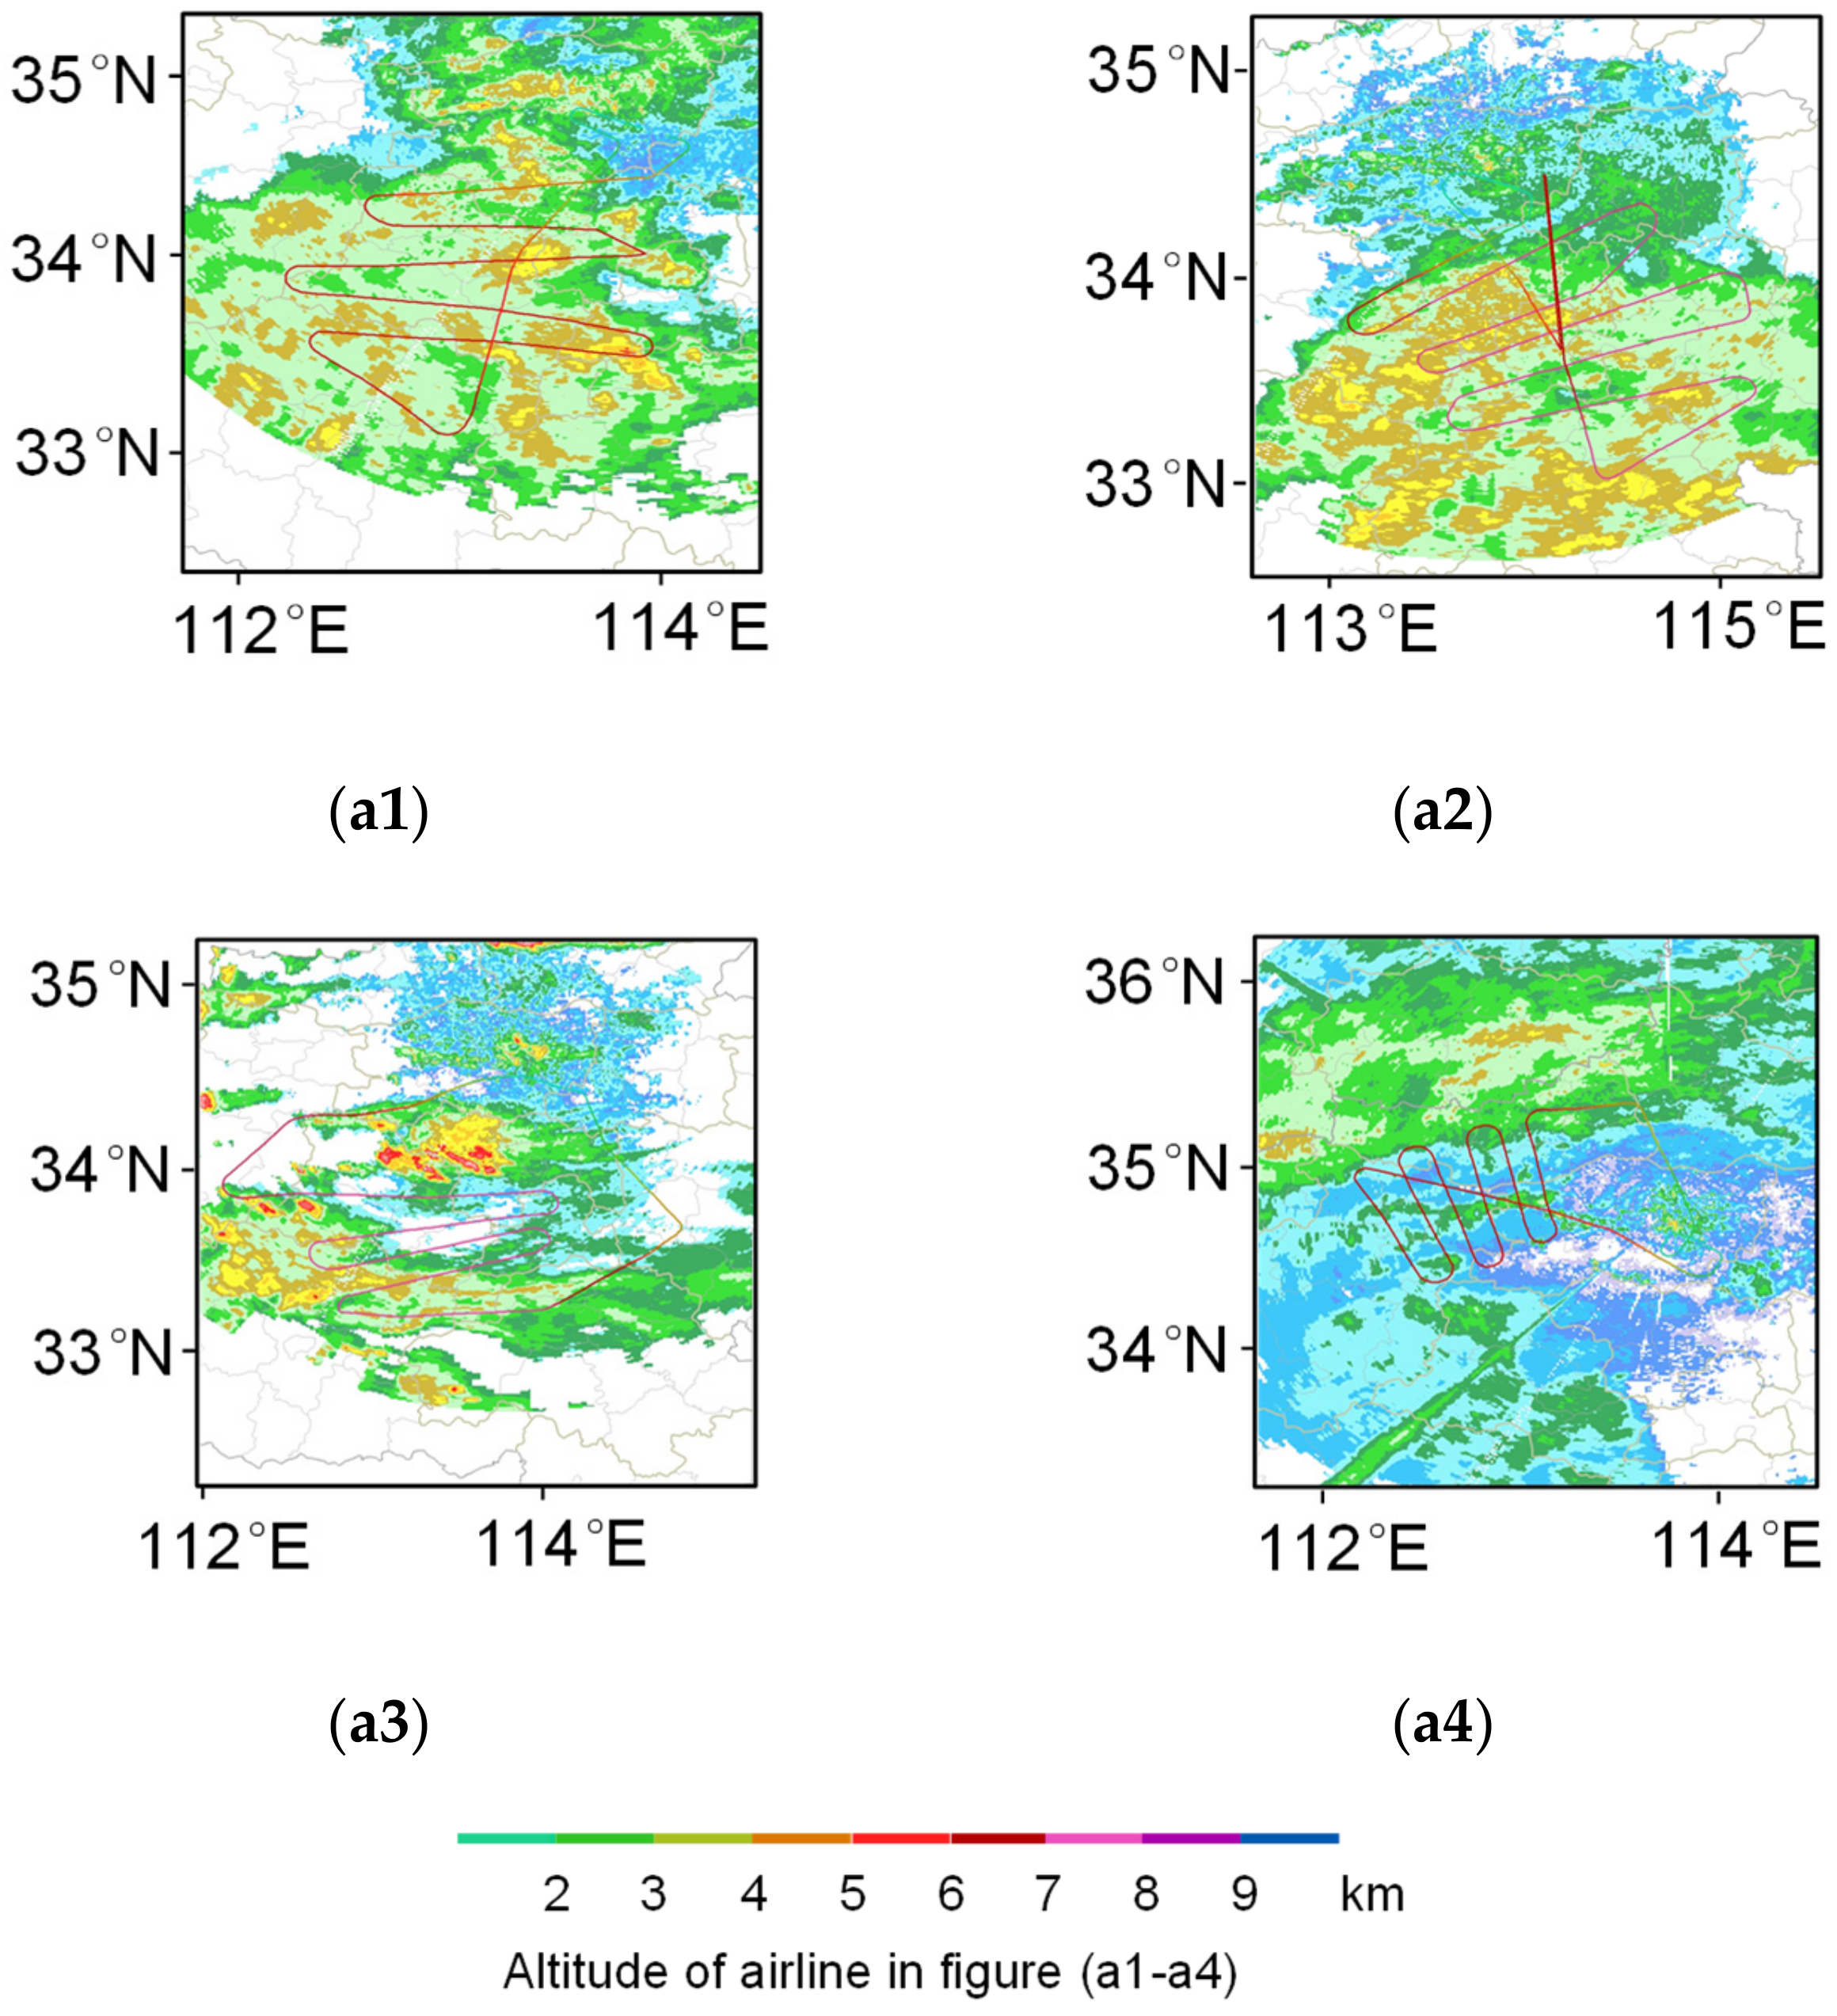
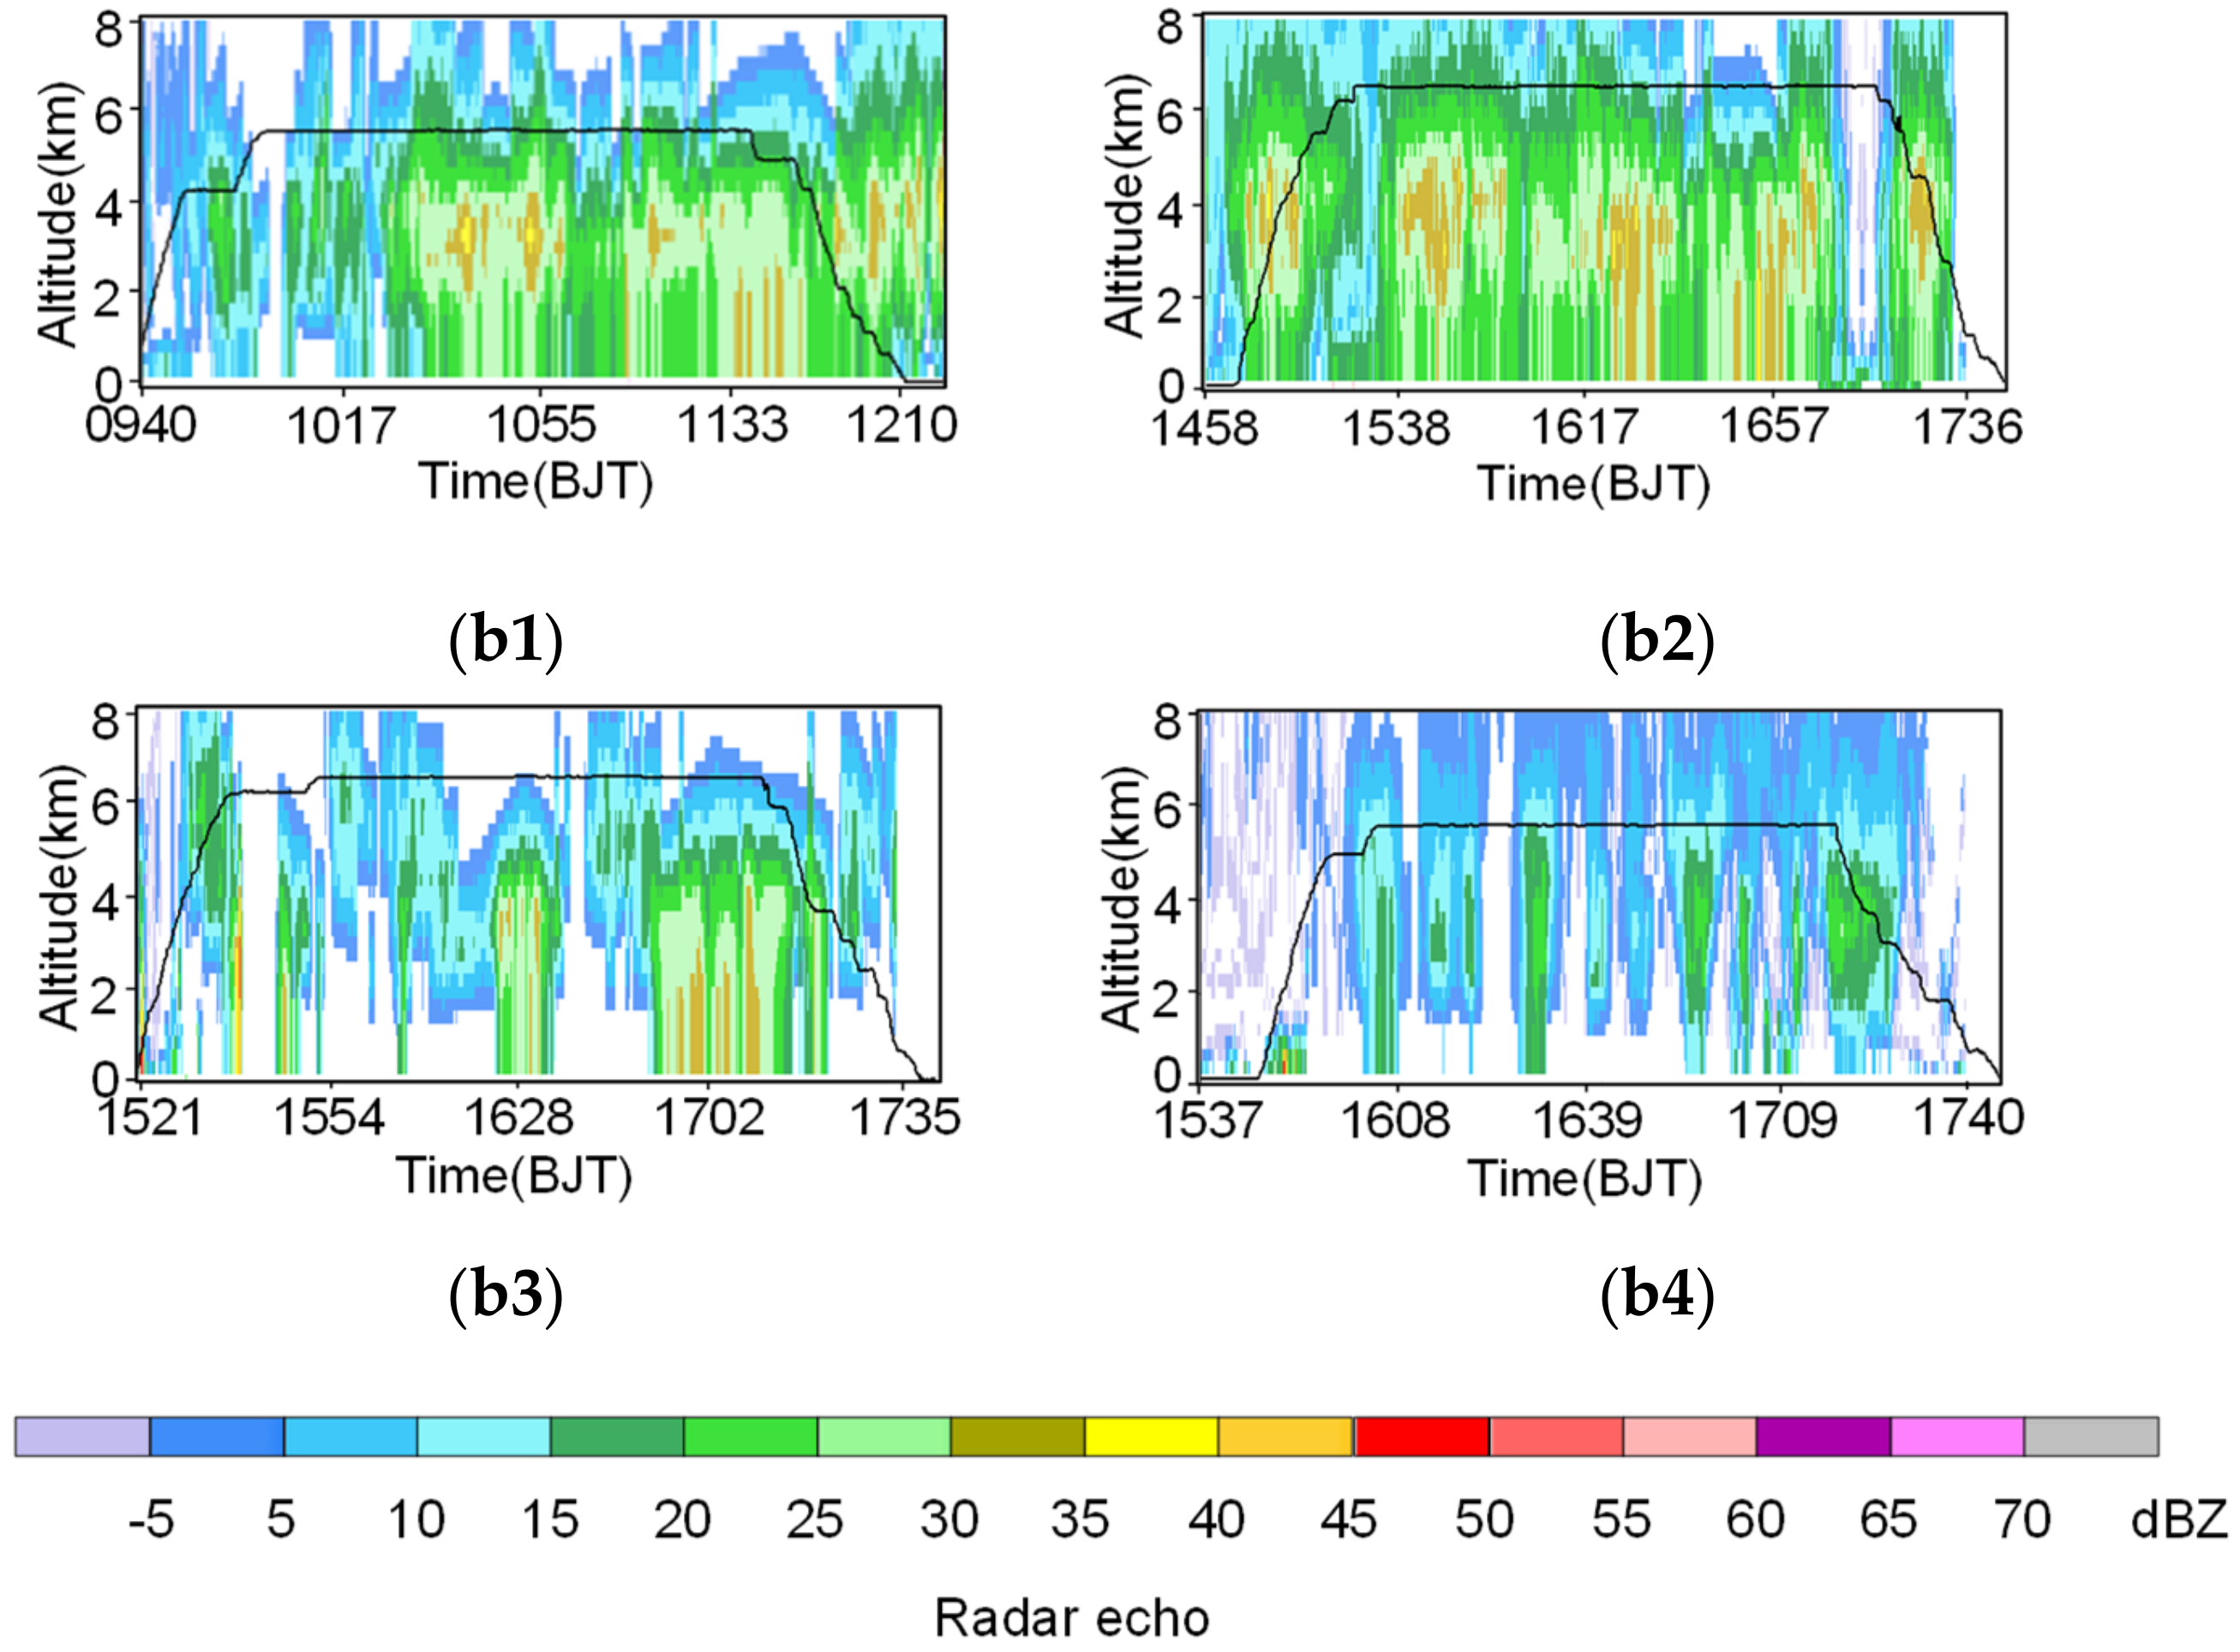
3.1.1. Information on Aircraft Precipitance Enhancement Operations

Before the study of seeding agent transmission for aircraft precipitation enhancement operation, the rationality of the precipitation enhancement operation process was analyzed from seeding conditions, seeding timing, seeding location [44], and catalytic dose. It is meaningful to conduct seeding agent transmission research to meet the requirement of operational rationality [45]. Table 1 shows the reasonable conditions of the precipitance enhancement operation process. Suppose the precipitance enhancement operation process does not meet the needs of operation rationality. In that case, the operation process is considered unreasonable, and the seeding agent transmission study is abandoned. The seeding agent transmission study will be carried out if the precipitance enhancement process is reasonable. From the aircraft precipitation enhancement operations conducted in Henan Province, China from 2014 to 2019, 24 aircraft precipitation enhancement operations meeting the practical requirements of the operation process were finally selected (Considering the length of the paper, Figure 2 only lists the schematic diagram of rationality analysis for operation No. 1–4); Table 2 shows the detailed information of the operations.

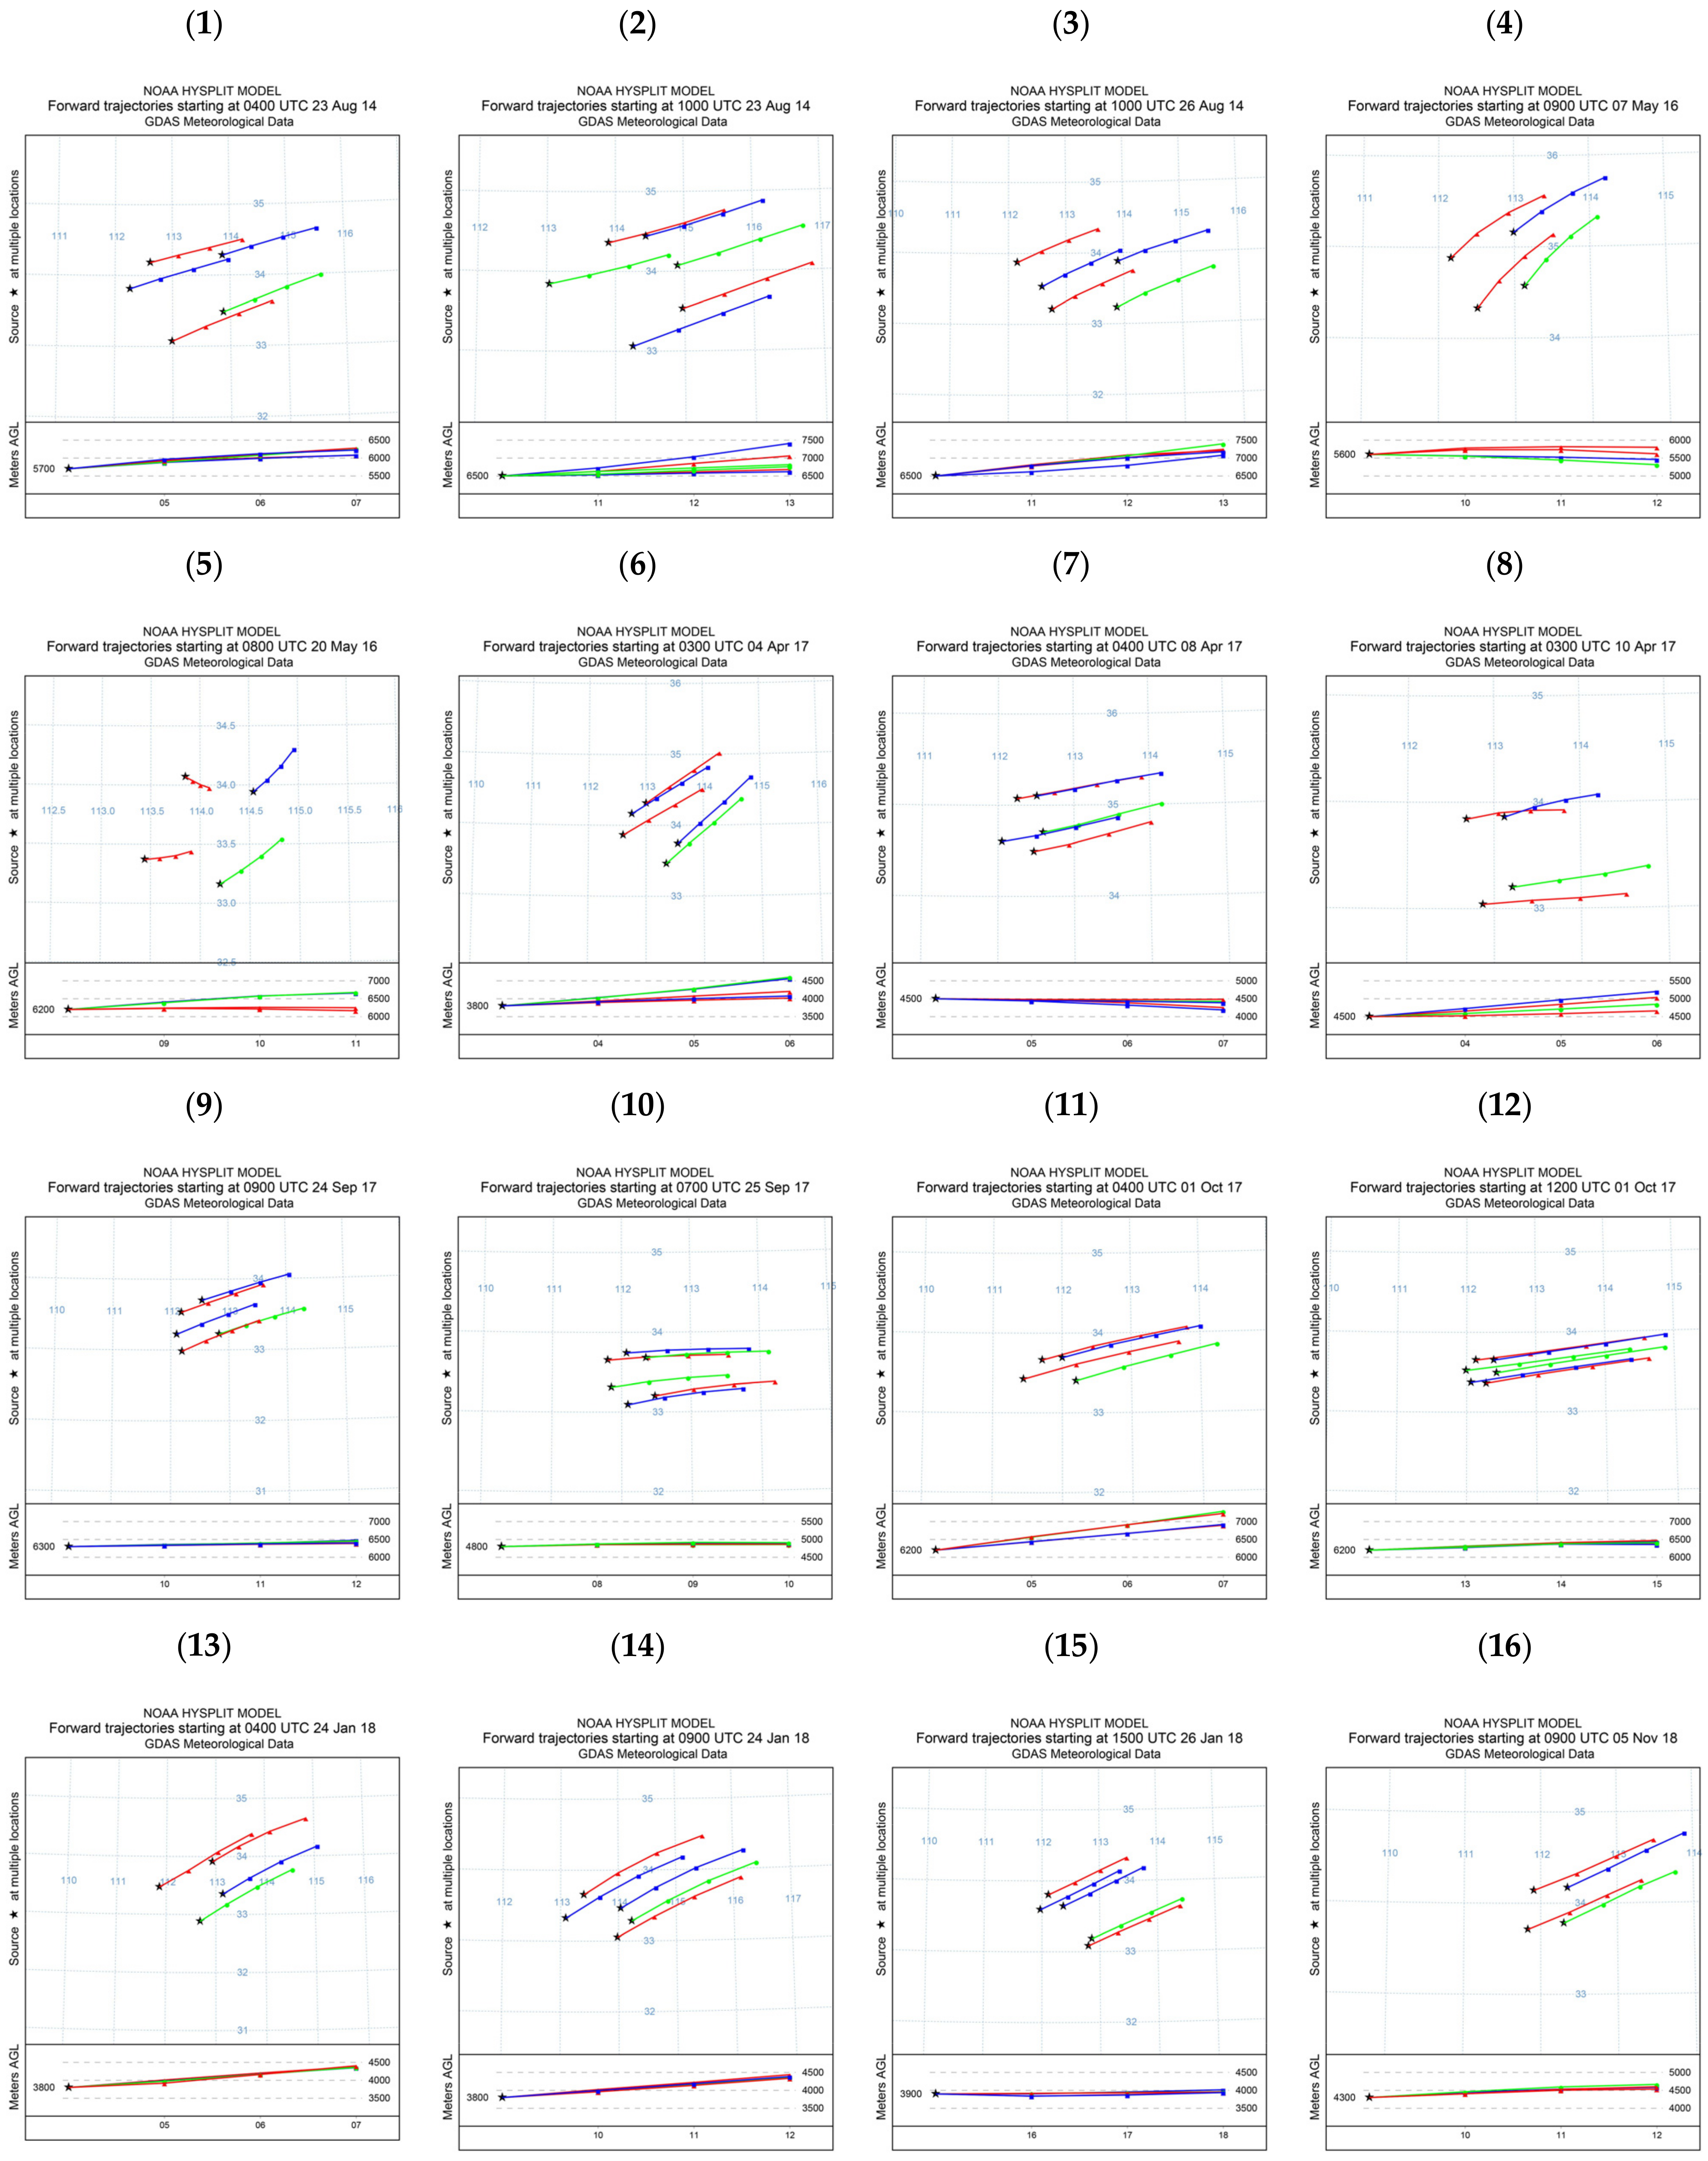
3.1.2. Simulation Results of Aircraft Precipitation Enhancement Seeding Agent Transmission

For the 24 aircraft precipitation enhancement operations meeting the rationality of the operation process, the model was used to simulate the hourly affected area 3 h after the operation, and several boundary points in the seeding area were used as model input sources. The transmission of boundary points of affected areas within 3 h after seeding for 24 aircraft precipitation enhancement operations simulated by the HYSPLIT model is shown in Figure 3. The direction and angle of the seeding agent transmission path projected to the horizontal plane are consistent with the general determination method of wind direction and degree (Figure 4). The characteristic elements of seeding agent 3 h transmission in 24 aircraft precipitation enhancement operations simulated by the HYSPLIT model were counted (Table 3), and the direction and angle of seeding agent transmission path and the characteristics of 3 h horizontal and vertical transmission distance were analyzed.
There were 15 operations in the southwest direction of seeding agent transmission, with an angle ranging from 225° to 255°. There were 8 westbound operations with an angle range of 260° to 268°; there was one in the NNW direction with an angle of 327°. The seeding agent’s 3 h horizontal transmission distance for 24 aircraft precipitation enhancement operations was 3 times in the range of 0–100 km, 16 times in the range of 100–200 km, and 5 times in the 200–300 km field. The seeding agent vertical transmission height of 3 h for 24 aircraft precipitation enhancement operations was 3 times in the range of 0~−30 m and 21 times in the field of 0~1200 m.
To sum up, the seeding agent transmission path of the 24 precipitation enhancement operations was mostly southwest and west, with an angle ranging from 225° to 268°. The horizontal transmission distance of the seeding agent is concentrated at 100–200 km in 3 h, and the vertical transmission is mostly 0–1200 m in the upward direction. The horizontal diffusion distance of the seeding agent is larger than the vertical diffusion distance in each period. The above results, based on the samples of 24 precipitation enhancement operations, provide reference for determining the appropriate seeding location of precipitation enhancement seeding agent in clouds.

3.1.3. Dynamic Variation of Affected Area of Aircraft Precipitation Enhancement Operation

According to the transmission results of 24 boundary points in the affected area of aircraft precipitation enhancement simulated by the HYSPLIT model within 3 h after operation, the three-dimensional geospatial configuration of the airline and the hourly affected area within 3 h after seeding for 24 aircraft precipitation enhancement operations were obtained (Figure 5). In terms of the change of the affected area, the hourly affected area of the 12 aircraft precipitation enhancement operations had obvious overlap, and the affected area of the three operations (Number 5, 22, and 23 operations) had obvious deformation after transmission. The number of operations that affected the area located in Henan province at 3 h after seeding was 19; however, the number of operations that involved the area covering parts of Henan province and its neighboring provinces at 3 h after seeding was 5. At the third h of seeding agent transmission, the number of affected areas increased 7 times and decreased 17 times.
The longitude and latitude coordinates corresponding to the boundary of the affected area were used to calculate the affected area (the area of the affected area was calculated by the projection area of the air-affected area on the ground). Then, the hourly affected area of 24 aircraft precipitation enhancement operations was counted. The following conclusions were obtained: The initial affected area of the 24 aircraft’s precipitation enhancement seeding was 1015.5~16,198 km2, and the affected area of seeding at the third h was 779.6~15,111 km2, the area change of the affected area ranged from −3773.4 to 883.8 km2 (the difference between the area of third h and the initial area was denoted as the area change of affected area). The cumulative influence area of the seeding agent transmission for 3 h is 5837.8~40,354.2 km2.
In conclusion, the cumulative influence area of seeding agent transmission for 3 h was 5837.8~40,354.2 km2 for the above 24 aircraft’s precipitation enhancement operations. Most of the affected areas were located in the eastern part of the precipitation enhancement operations, which were directly related to the westerly climatic characteristics of Henan Province. The influence area of 71% precipitation enhancement operations decreased at the third h of seeding agent transmission. According to the influence area boundary point transmission characteristics of the model simulation analysis, the main and direct factor causing the reduction in influence area after seeding is the difference in the wind speed at the simulated grid points. As time goes by, the influence area of seeding does not necessarily increase diffusively, and wind plays a decisive role.

3.2. Analysis of Precipitation in Influence Area by Seeding

Judging the change of natural precipitation is the most important and intuitive evaluation element for the test of artificial precipitation enhancement effect [10]. According to the dynamic changes of influence area and contrast area of 24 aircraft precipitation enhancement determined by the HYSPLIT model after seeding, the characteristic difference of hourly precipitation in seeding influence area and contrast area was obtained. The seeding effect of precipitation enhancement operation was analyzed to realize the application of the model in the evaluation of the artificial precipitation effect.

3.2.1. Selection of Contrast Area

APC, as a similarity measure coefficient, was used to select contrast area in this study, and the calculation formula is shown in Equations (4)–(8). The APC coefficient is the ratio of similarity divergence CXY to Pearson correlation coefficient ρXY.
A P C = C X Y ρ X Y
C X Y = 1 2 D X Y + S X Y
D X Y = 1 n k = 1 n X k Y k
S X Y = 1 n k = 1 n X k Y k 1 n k = 1 n X k Y k
ρ X Y = k = 1 n X k X ¯ Y k Y ¯ k = 1 n X k X ¯ 2 k = 1 n Y k Y ¯ 2
DXY is the value coefficient, which is the total average of absolute values of the difference between corresponding values of the two samples; the smaller the value is, the closer the values of the two samples are. SXY is the shape coefficient, representing the degree of dispersion of difference between the corresponding values of the two samples to their total average; the smaller the value is, the more similar the shapes of the two samples are. ρXY was used to characterize the correlation between the two samples (ρXY =1, completely positive correlation; 0 < ρXY < 1, positive correlation; −1 < ρXY < 0, negative correlation; ρXY = −1, completely negative correlation). The greater the ρXY (ρXY > 0), the more significant the linear positive correlation between two samples. Therefore, the smaller the APC value (APC > 0), the greater the similarity between two samples. X and Y respectively represent two samples to be compared, and n is the length of data.
The APC values of m comparison indexes were averaged to obtain the comprehensive APC (Equation (9)). The cloud with the smallest APC was the best contrast area (APC > 0).
A P C = 1 m A P C 1 + A P C 2 + A P C m
The following two factors were considered to determine the index of selected comparison area. First, the significance of cloud precipitation represented by physical cloud parameters themselves, and the test effect of cloud physical parameters in the test process of artificial precipitation enhancement; the second is the application of macro and micro parameters of cloud physics in the test of precipitance enhancement effect [9,46,47]. Cloud top temperature, cloud effective particle radius, cloud optical thickness, liquid water path, combined reflectivity, ≥30 dBZ echo area, and vertical cumulative liquid water content were used to select the contrast area.

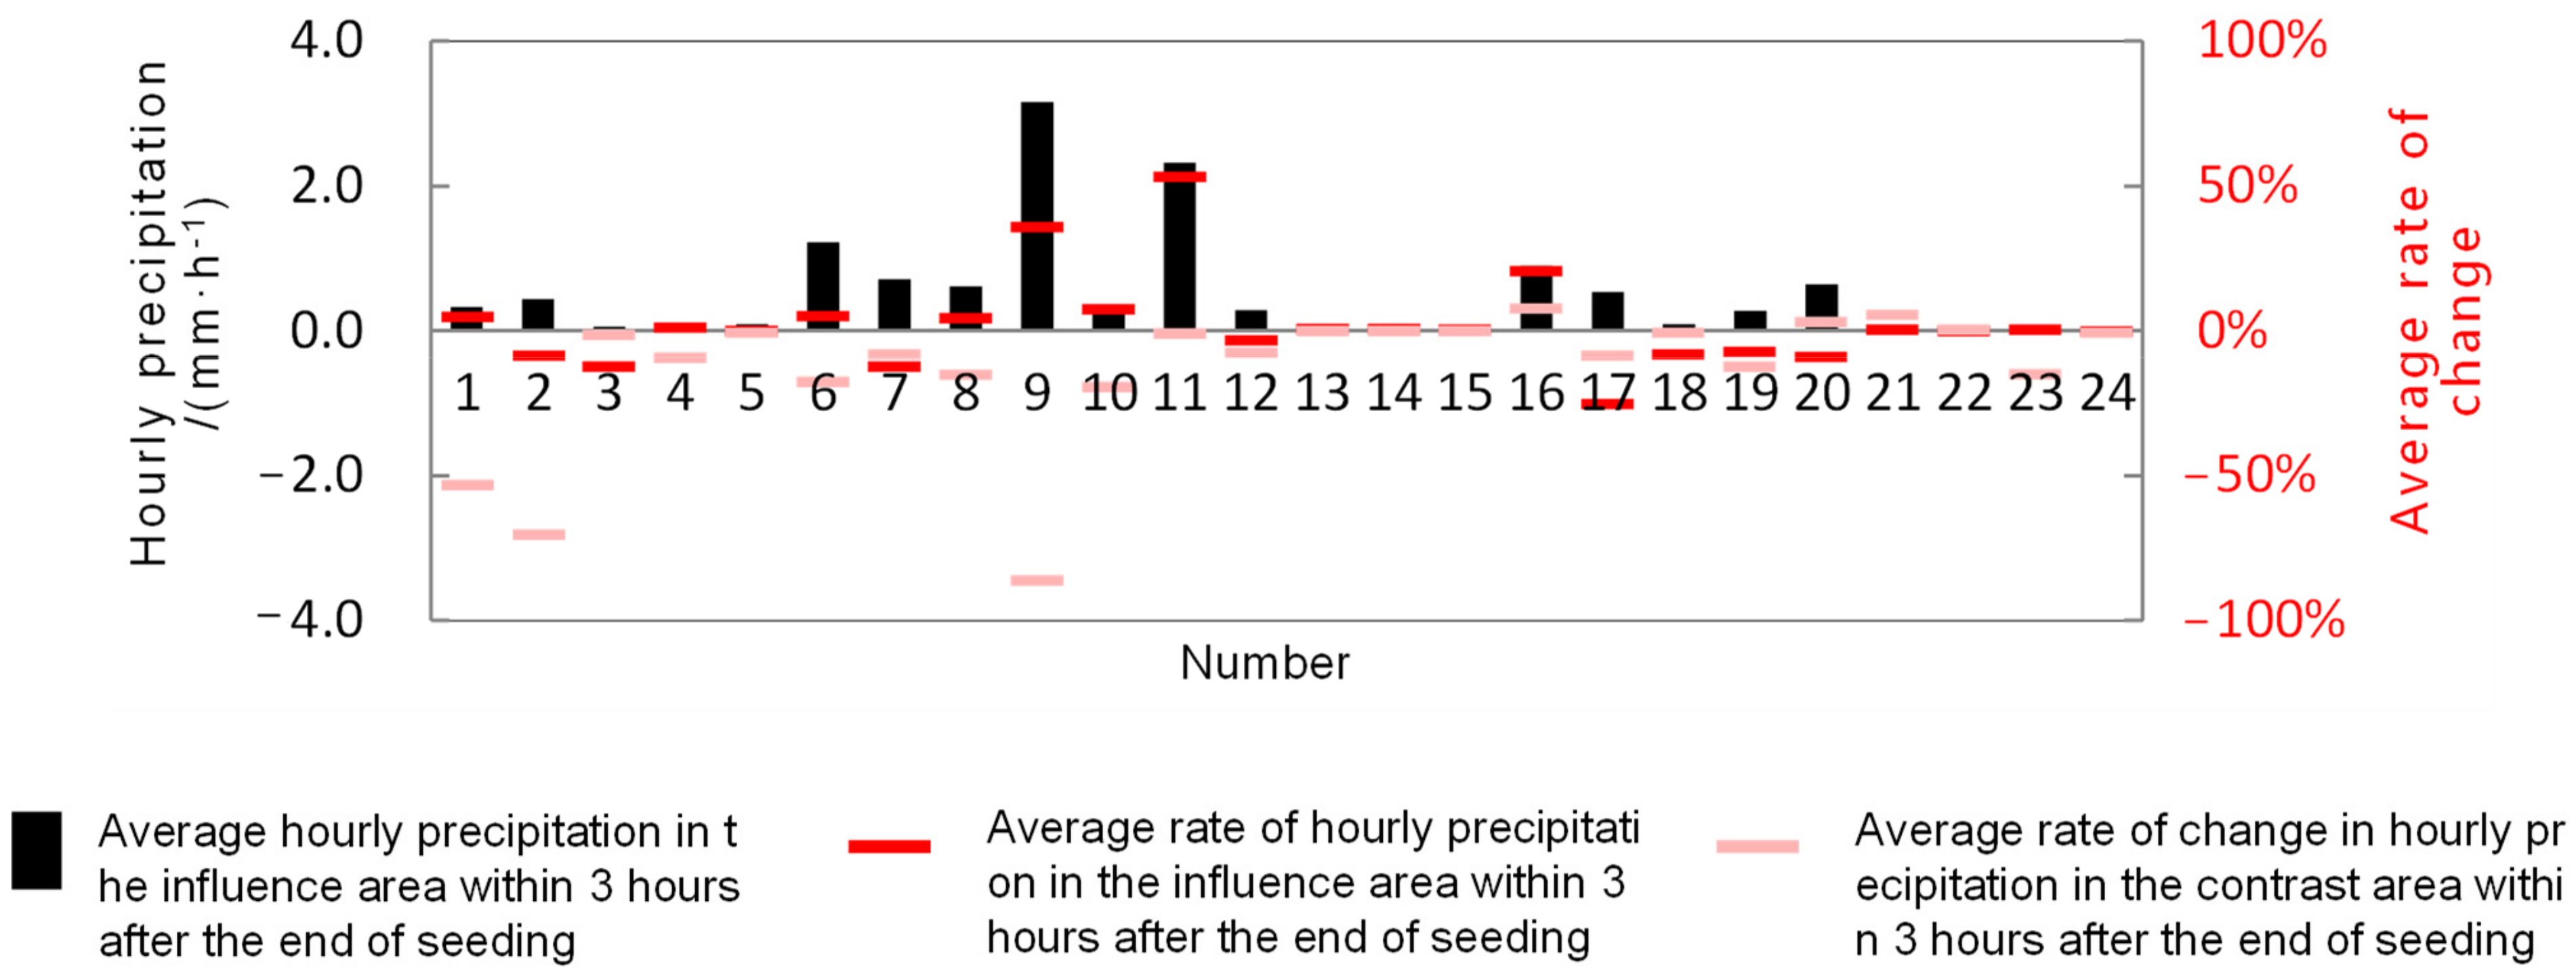
3.2.2. Comparison of Precipitation between Affected Area and Contrast Area

Statistically, the hourly average precipitation of 24 aircraft precipitation enhancement operations was the affected area at the end of seeding for 3 h and the average change rate of hourly precipitation of the influence area and contrast area (Figure 6). As shown in the figure, for 24 aircraft precipitation enhancement operations, the hourly average precipitation of the affected area within 3 h after seeding is 0~3.2 mm/h. Within 3 h after seeding, the average change rate of hourly precipitation of influence area is 25%~53%, and the number of positive and negative operations is 16 and 8, respectively. That is, 67% of the operations after seeding show an increasing trend in precipitation, while 33% of the operations show a decreasing trend in precipitation. The average change rate of hourly precipitation of contrast area is −86%~8%, and the number of positive and negative operations is 7 and 17, respectively. That is, 29% of the operational comparison area show an increasing trend in precipitation, while 71% of the operational comparison area show a decreasing trend in precipitation. The average change rate of hourly precipitation in the affected area and contrast area was compared with that in the contrast area within 3 h after seeding; the average change rate of precipitation in the affected area was greater than that in the contrast area for 15 operations. It can be considered that 15 (63%) aircraft precipitation operations contributed to the increase in precipitation based on the influence area determined by the HYSPLIT model and the comparison area determined by similarity measurement method.

4. Discussion

At present, many aircraft precipitation enhancement operations are critical drought resistance operations without strict design in advance. It is often complicated and complex to define the affected area from the concentration diffusion of different seeding agents. Therefore, in this study, boundary points of the seeding area were used as dynamic change markers of the affected area (the condition that the seeding route and its interval area was functional areas was met). The tracking module in the HYSPLIT model was used to complete this work in order to provide a universal technical method for the evaluation of the effect of artificial precipitance operations.
In previous studies of cloud seeding agent transmission, Yu et al. [14] thought that through the simulation, the horizontal diffusion range of seeding agent in the cloud is significantly larger than the vertical diffusion range, and the difference is obvious. Meanwhile, the horizontal diffusion range reached approximately 100 km in 2 h, and the vertical diffusion range reached approximately 0.5 km. In addition, Yu et al. [48] simulated the transmission diffusion of seeding agent by a transmission diffusion mathematical model, and reached the conclusion that the length of cloud orbit was 301 km and the average width 8.3 m. At present, the Fifth-Generation NCAR/Penn State Mesoscale Model has been used to simulate seeding clouds, augmented precipitation (varying from 5% to 25% downwind) was confined in space to within 250 km of the seeding target and in time to the 3-h period after initial seeding [49]. Yu et al. [50] simulated aircraft precipitation by using a 3-D model, and the result shows that the horizontal transmission distance is only related to wind. The 1-h transmission distance of seeding agent reaches 65 km, and the diffusion rate is dependent on wind, temperature, and turbulence, with a 1-h average of 0.82 m s−1. Moreover, field observations over the central Sierra Nevada reported that the effects of cloud seeding with silver iodide persisted for over 90 min after seeding and 100 km downwind of the seeding [51].
The simulation results of transmission of seeding agent for aircraft precipitation enhancement cases in the above studies are summarized as follows: the transmission distance is approximately 250~300 km within 3 h after sowing, the average transmission distance is approximately 65 km within 1 h, and the vertical speed range is approximately 0.5 km. In this study, the value of the horizontal transmission distance of seeding agent in 3 h is concentrated in 100~200 km, which is smaller than the corresponding value (250~300 km) above. This phenomenon may be caused by the difference of geographical region, individual cases of precipitation enhancement, and the numerical model. Yu et al. [50] found that the horizontal transmission distance is mainly related to the wind, which is consistent with the conclusion of our research. Additionally, there was no systematic study on the angle and influence area of the transmission path of seeding agent of artificial precipitation, which is also the novelty of this study.
The spatial and temporal resolution of GDAS data used in the HYSPLIT model is still insufficient to meet the data accuracy requirements in the study of aircraft precipitation seeding agent transmission. In the future, if the resolution of these data can be improved, the tracking accuracy of the seeding affected region will be significantly improved.
In this study, the influence area determined by the HYSPLIT model and the comparison area defined by the similarity measurement method were used; finally, the relationship between seeding and precipitation was obtained, and its accuracy was restricted by a variety of factors. First, even though the comparison area selection method is scientifically reasonable in theory, sometimes no comparison area has a high similarity with the operation-affected area in nature, so the natural variability of cloud and precipitation cannot be eliminated [52], which affects the precipitation assessment results based on this method to a certain extent. Secondly, the influence of the cloud precipitation was a detection error on the results. For example, when the influence area or contrast area is far from the neighboring detection radar, radar echo error will have a particular impact on the determination of the contrast area and the evaluation of precipitation.

5. Conclusions

In this study, the HYSPLIT model was used to simulate the seeding agent transmission process of 24 aircraft precipitation enhancement operations, the characteristics of seeding agent transmission and precipitation in the affected area of samples were obtained, and the applicability of the model in tracking the artificial precipitation affected area was explored.
(1)
For the seeding agent transmission of aircraft precipitation enhancement based on the HYSPLIT model, if the seeding route satisfies the condition that the route and its interval area within 3 h after seeding are the seeding-effective area, the boundary points of the seeding area can be used as the marker of dynamic change of influence area. The model can realize hourly tracking of aircraft precipitation enhancement seeding agent transmission, and the seeding agent transmission process simulation has good performance.
(2)
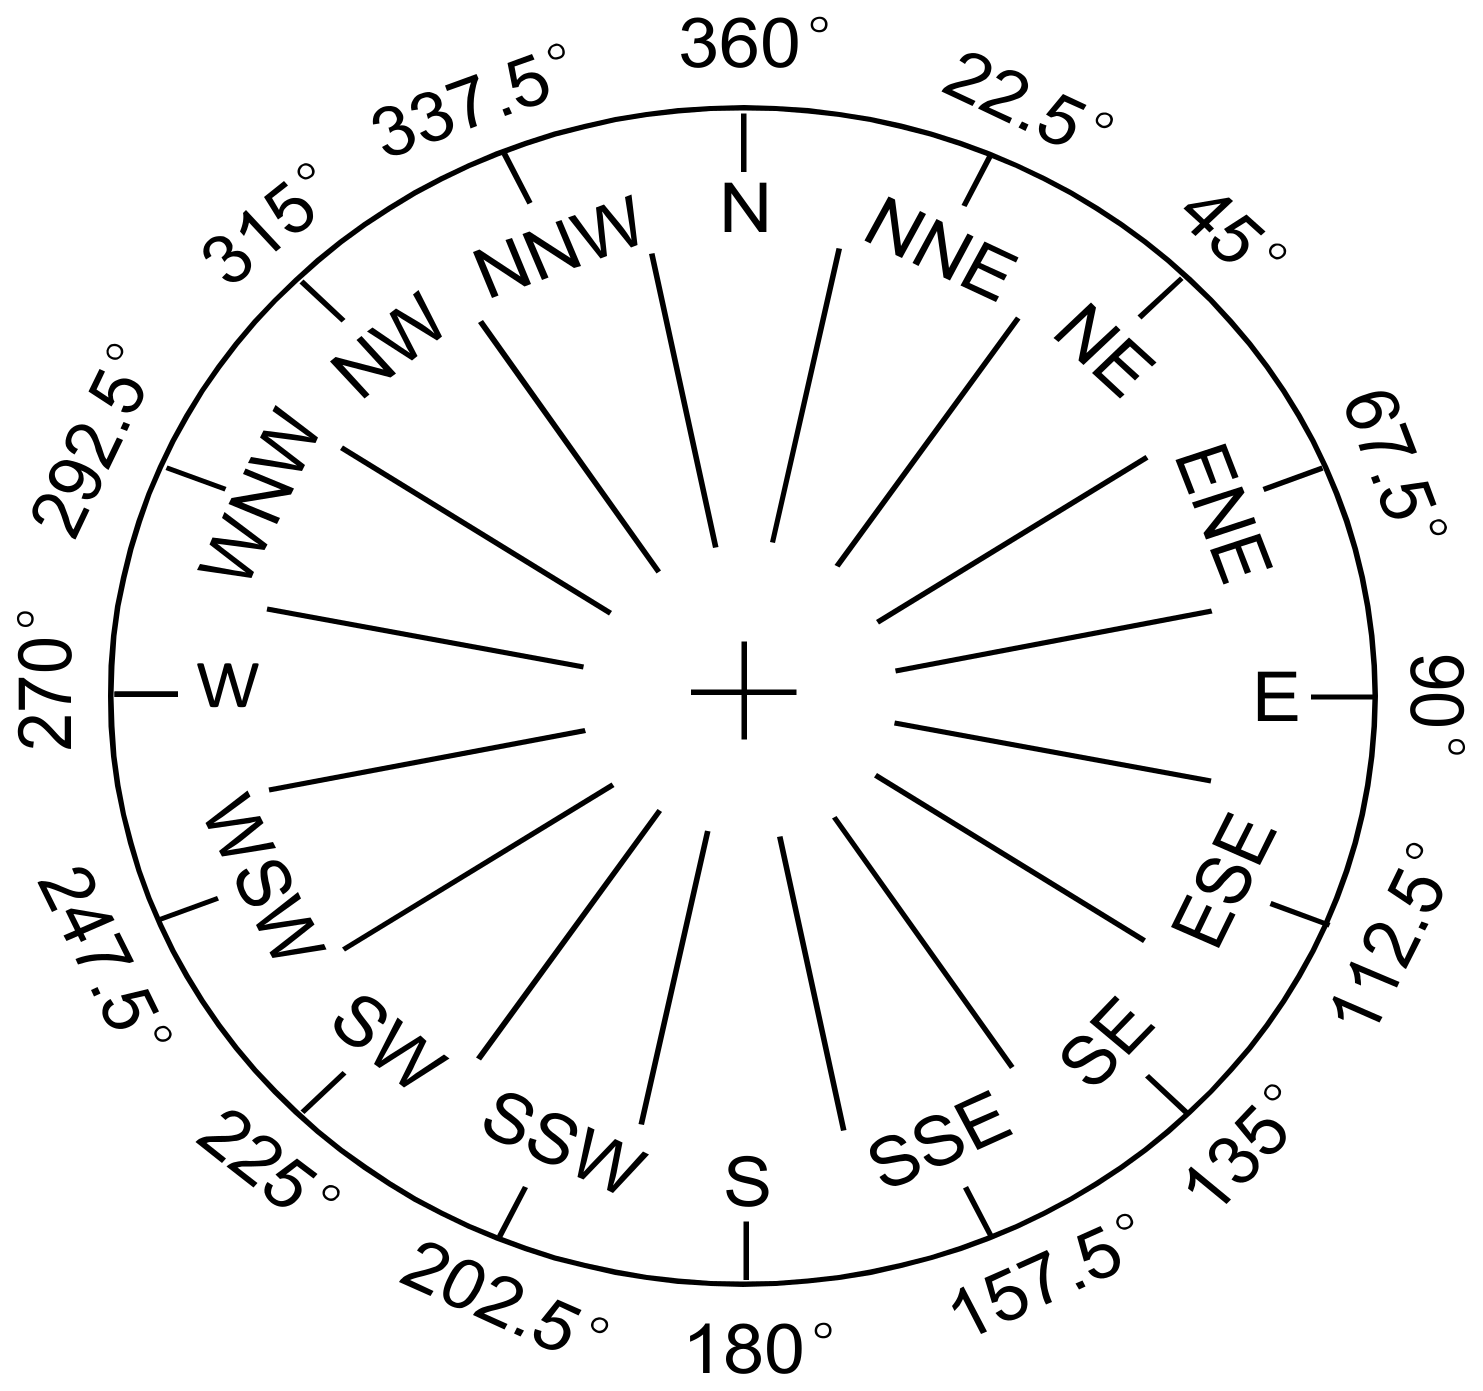
The HYSPLIT model simulated 24 aircraft precipitation seeding agent transmission processes. The seeding agent transmission path at the operational level is mostly southwest and west, with an angle of 225°~268°. The horizontal transmission distance of the seeding agent is concentrated within 100–200 km within 3 h after seeding, and the vertical transmission is mostly 0–1200 m in the upward direction. The 71% precipitation enhancement operation that affected the area decreased at the third h of seeding agent transmission. The primary and direct factor causing the reduction in the affected area after seeding agent transmission was the wind difference at simulated grid points, which played a decisive role in seeding agent transmission.
(3)
Based on the influence area determined by the HYSPLIT model and the contrast area defined by the similarity measurement method, the two dynamic changes were tracked, and hourly precipitation difference was obtained. The results show that 15 (63%) aircraft precipitation enhancement operations are conducive to the increase in precipitation.

Author Contributions

Conceptualization, X.S. and M.L.; Formal Analysis, R.C.; Data Curation, Y.X.; Writing—Original Draft Preparation, X.S., J.D. and L.F.; Writing—Review and Editing, R.C. and X.S. All authors have read and agreed to the published version of the manuscript.

Funding

This research was supported by the He’nan Key Laboratory of Agrometeorological Support and Applied Technique Research Project of China Meteorological Administration (grant numbers KM201923, KM202135).

Institutional Review Board Statement

Not applicable.

Informed Consent Statement

Not applicable.

Data Availability Statement

Not applicable.

Acknowledgments

The authors are grateful to the editors and anonymous reviewers for their valuable advice, and acknowledge the National Centers for Environmental Prediction in the United States and the Weather Modification Center of Henan Province for dataset support.

Conflicts of Interest

The authors declare no conflict of interest.

References

  1. Zhou, Y.Q.; Zhu, B. Study on diffusion regularity and operation design of antiaircraft-gun, rocket and plane cloud seeding. Meteor. Mon. 2014, 40, 965–980. [Google Scholar]
  2. Schaefer, V.J. The production of ice crystals in a cloud of supercooled water droplets. Science 1946, 104, 457–459. [Google Scholar] [CrossRef] [PubMed]
  3. Novakov, T.; Penner, J.E. Large contribution of organic aerosols to cloud-condensation nuclei concentrations. Nature 1993, 365, 823–826. [Google Scholar] [CrossRef]
  4. Cotton, W.R.; Jha, V. Does Dust and Pollution Aerosol Acting as Cloud Nucleating Particles Appreciably Impact Water Resources N The Colorado River Basin? West. Snow Conf. 2018, 11, 45–52. [Google Scholar]
  5. Kovačević, N. Hail suppression effectiveness for varying solubility of natural aerosols in water. Meteorol. Atmos. Phys. 2019, 131, 585–599. [Google Scholar] [CrossRef]
  6. Chen, S.; Xue, L.; Yau, M.K. Hygroscopic seeding effects of giant aerosol particles simulated by the Lagrangian-particle-based direct numerical simulation. Geophys. Res. Lett. 2021, 48, 1–9. [Google Scholar] [CrossRef]
  7. Zhekamukhov, M.K.; Abshaev, A.M. Simulation of rocket seeding of convective clouds with coarse-dispersion hygroscopic aerosol. 2. Condensation and coagulation in a cloud seeded with hygroscopic particles. Russ. Meteorol. Hydrol. 2009, 34, 293–300. [Google Scholar] [CrossRef]
  8. Ćurić, M.; Janc, D.; Vučković, V.; Kovačević, N. An inadvertent transport of the seeding material as a result of cloud modification. Meteorol. Atmos. Phys. 2009, 105, 157–165. [Google Scholar] [CrossRef]
  9. Ćurić, M.; Lompar, M.; Romanic, D.; Zou, L.; Liang, H. Three-Dimensional Modelling of Precipitation Enhancement by Cloud Seeding in Three Different Climate Zones. Atmosphere 2019, 10, 294. [Google Scholar] [CrossRef]
  10. Zhai, J.; Wang, F.; Hu, W.; Jiang, N.C.; Huang, Y. Diffusion simulating system of point-Source catalyst in convective clouds and its application. Meteor. Sci. Technol. 2010, 40, 843–848. [Google Scholar]
  11. Shen, Y.M. Bulletin of Meteorological Science and Technology (2); China Meteorological Press: Beijing, China, 1982; pp. 27–29. [Google Scholar]
  12. Shen, Y.M.; Liu, G.F.; Xu, H.B.; Yang, Y.X.; Wang, S.W. The problem of diffusion of point source in the convective clouds. Acta Meteor. Sin. 1983, 4, 415–425. [Google Scholar]
  13. Shen, Y.M. Diffusion of Catalysts in Clouds; China Meteorological Press: Beijing, China, 1994; pp. 42–134. [Google Scholar]
  14. Yu, X.; Fan, P.; Wang, X.L.; Dai, J.; Li, Z.Y. Numerical Simulation of Multiple Line Source Diffusion of Seeding Agents Within Stratiformis. Acta Meteor. Sin. 1998, 56, 708–723. [Google Scholar]
  15. Zhang, J.K.; Zhang, G.Q.; Liu, H.; Chen, Z.G.; Zhou, W.F. The diffusion of catalyst on ground point source over upper reach of yellow river. J. Meteor. Sci. 2003, 23, 273–281. [Google Scholar]
  16. Flossmann, A.I.; Manton, M.; Abshaev, A.; Bruintjes, R.; Murakami, M.; Prabhakaran, T.; Yao, Z. Review of Advances in Precipitation Enhancement Rsearch. Bull. Am. Meteorol. Soc. 2019, 100, 1465–1480. [Google Scholar] [CrossRef]
  17. Tessendorf, S.A.; Bruintjes, R.T.; Weeks, C.; Wilson, J.W.; Knight, C.A.; Roberts, R.D.; Peter, J.R.; Collis, S.; Buseck, P.R.; Freney, E.; et al. The Queensland Cloud Seeding Research Program. Bull. Am. Meteor. Soc. 2012, 93, 75–90. [Google Scholar] [CrossRef]
  18. Freud, E.; Koussevitzky, H.; Goren, T.; Rosenfeld, D. Cloud microphysical background for the Israel-4 cloud seeding experiment. Atmos. Res. 2015, 158, 122–138. [Google Scholar] [CrossRef]
  19. Holroyd, E.W.; McPartland, J.T.; Super, A.B. Observations of silver iodide plumes over the Grand Mesa of Colorado. Appl. Meteor. 1988, 27, 1125–1144. [Google Scholar] [CrossRef]
  20. Williams, B.D.; Denholm, J.A. An assessment of the environmental toxicity of silver iodide-with reference to a cloud seeding trial in the snowy mountains of Australia. J. Weather Modif. 2009, 41, 75–96. [Google Scholar]
  21. Duan, J.; Lou, X.F.; Wang, H.; Guo, X.L.; Li, J.M. Research progress on impact of AgI in weather modification operations on environment in related areas. Meteor. Mon. 2020, 46, 257–268. [Google Scholar]
  22. Stohls, A.; James, P. A Lagrangian analysis of the atmospheric branch of the global water cycle. Part I: Method description, validation, and demonstration for the August 2002 flooding in central Europe. J. Hydrometeorol. 2004, 5, 656–678. [Google Scholar] [CrossRef]
  23. Brimelow, J.C.; Reuter, G.W. Transport of atmospheric moisture during three extreme rainfall events over the Mackenzie River Basin. J. Hydrometeorol. 2005, 6, 423–440. [Google Scholar] [CrossRef]
  24. Jiang, Z.H.; Ren, W.; Liu, Z.Y.; Yang, H. Analysis of water vapor transport characteristics during the Meiyu over the Yangtze-Huaihe River valley using the Lagrangian method. Acta Meteor. Sin. 2013, 71, 295–304. [Google Scholar]
  25. Yang, H.; Jiang, Z.H.; Liu, Z.Y.; Zhang, Q. Analysis of climatic characteristics of water vapor transport based on the Lagrangian Method: A comparison between Meiyu in the Yangtze-Huaihe River region and the Huaibei rainy season. Chin. J. Atmos. Sci. 2014, 38, 965–973. [Google Scholar]
  26. Wang, J.J.; Wang, C.X.; Chen, C.P.; Ren, W. Analysis of a summer rainstorm water vapor paths and sources in Sichuan basin based on HYSPLIT4 model. Meteor. Mon. 2015, 41, 1315–1327. [Google Scholar]
  27. Ma, J.J.; Gao, X.Q. The transportation paths of water vapor and its relation to climate change over North China. Plateau Meteor. 2006, 25, 893–899. [Google Scholar]
  28. Sun, L.; Ma, L.; Shen, B.; Dong, W.; Sui, B. A diagnostic study of water vapor transport and budget of heavy rainfall over Northeast China during July to August 2010. Chin. J. Atmos. Sci. 2016, 40, 630–646. [Google Scholar]
  29. Ren, W.; Ren, Y.; Li, L.L. Analysis of water vapor transport characteristics during a torrential rain at Jinan Airport based on the HYSPLIT model. J. Mar. Meteorol. 2019, 39, 116–122. [Google Scholar]
  30. Ngaina, J.; Muthama, N.; Ininda, J.; Opere, A.; Mutai, B. Towards precipitation enhancement through cloud seeding in Kenya. Glob. Meteorol. 2014, 3, 7–13. [Google Scholar] [CrossRef]
  31. Qi, J.M. The Study of Atmospheric CO2 Transport Based on HYSPLIT Model; China University of Geosciences: Beijing, China, 2014. [Google Scholar]
  32. Shan, Y.C.; Zhang, J.X.; Wang, X.N.; Ma, J.W. Application of HYSPLIT model to the analysis of water vapor transport in the west of Jilin. Meteorol. Disaster Prev. 2017, 24, 19–23. [Google Scholar]
  33. Huang, J.; Yan, P.; Roland, R.D. Using HYSPLIT4 dispersion model to analyze the variations of surface SO2 in the Zhuhai region. J. Trop. Meteor. 2002, 4, 407–414. [Google Scholar]
  34. Yu, X.; Xu, X.H.; Dai, J. NOAA satellite inversion analysis and numerical simulation of supercooled stratified cloud AgI cloud seeding effect region. Prog. Nat. Sci. 2007, 17, 225–232. [Google Scholar]
  35. Sheng, P.X.; Mao, J.T.; LI, J.G.; Zhang, A.C.; Sang, J.G.; Pan, N.X. Atmospheric Physics; Peking University Press: Beijing, China, 2003. [Google Scholar]
  36. Fletcher, N.H. On ice-crystal production by aerosol particles. J. Meteor. 1959, 16, 173–180. [Google Scholar] [CrossRef]
  37. Alkezweeny, A.J. On the activation temperature of AgI-particles in cloud. J. Weather Modif. 1971, 3, 111–114. [Google Scholar]
  38. Finnegan, W.G.; Pitter, R.L. Rapid ice nucleation by acetone-silver iodide generator aerosols. J. Weather Modif. 1988, 20, 51–53. [Google Scholar]
  39. Guo, Y.G. Statistic Analysis of the Efficacy of Arificial Precipitation in Liaocheng and Simulation of Catalyst Diffusion; Ocean University of China: Qingdao, China, 2008. [Google Scholar]
  40. Guo, X.L. Atmospheric Physics and Weather Modification; China Meteorological Press: Beijing, China, 2010. [Google Scholar]
  41. Shi, Y.Q.; Lou, X.F.; Deng, X.J. Seeding numerical experiment s of cold front clouds in South China. Chin. J. Atmos. Sci. 2008, 32, 1256–1275. [Google Scholar]
  42. Liu, X.E.; Gao, Q.; He, H.; Ji, L. Numerical simulation research on silver iodide cold cloud seeding. Meteor. Mon. 2016, 42, 347–355. [Google Scholar]
  43. Zhu, X.Y.; Yao, Z.Y. Analysis of convective cloud seeding cases by rockets in Jiangxi province. Meteor. Mon. 2017, 43, 221–231. [Google Scholar]
  44. Ćurić, M.; Janc, D.; Vučković, V. Seeding agent dispersion within convective cloud as simulated by a 3-D numerical model. Meteor. Atmos. Phys. 2006, 92, 205–216. [Google Scholar] [CrossRef]
  45. Hosseinzadeh, F.M.; Javanmard, S. A Numerical Analysis of Homogeneous Cloud Seeding Agent Based on Sensitivity Tests in Different Conditions. J. Basic. Appl. Sci. Res. 2012, 2, 7328–7342. [Google Scholar]
  46. Manton, M.J.; Warren, L. A confirmatory snowfall enhancement project in the snowy mountains of Australia. Part II: Primary and associated analyses. J. Appl. Meteor. Clim. 2011, 50, 1448–1458. [Google Scholar] [CrossRef]
  47. Manton, M.J.; Peace, A.D.; Kemsley, K.; Kenyon, S.; Speirs, J.C.; Warren, L.; Denholm, J. Further analysis of a snowfall enhancement project in the snowy mountains of Australia. Atmos. Res. 2017, 193, 192–203. [Google Scholar] [CrossRef]
  48. Xing, Y.; Jin, D.; Hengchi, L.; Peng, F. Comparison Between Computer Simulation of Transport and Diffusion of Cloud Seeding Material Within Stratiform Cloud and the NOAA-14 Satellite Cloud Track. Adv. Atmos. Sci. 2005, 22, 133–141. [Google Scholar] [CrossRef]
  49. Zhao, Z.; Lei, H.C. Numerical Simulation of Seeding Extra-Area Effects of Precipitation Using a Three-Dimensional Mesoscale Model. Atmos. Ocean. Sci. Lett. 2010, 3, 19–24. [Google Scholar]
  50. Yu, X.; Wang, X.L.; Dai, J. Research on simulation of effective range for cloud seeding by aircraft within super-clooled stratus. Acta Meteorol. Sin. 2002, 60, 205–214. [Google Scholar]
  51. Deshler, T.; Reynolds, D.W. The persistence of seeding effects in a winter orographic cloud seeded with silver iodide burned in Acetone. J. Appl. Meteor. 1990, 29, 477–488. [Google Scholar] [CrossRef]
  52. Wu, X.; Niu, S.; Jin, D.; Sun, H. Influence of natural rainfall variability on the evaluation of artificial precipitation enhancement. Sci. China Earth Sci. 2015, 58, 906–914. [Google Scholar] [CrossRef]
Figure 1. Borders of China with the study area.
Atmosphere 13 01508 g001
Figure 2. Overlay of the airline and radar echo plane (a1a4), vertical radar profile (b1b4) of No.1–4 aircraft precipitation enhancement operations.
Atmosphere 13 01508 g002aAtmosphere 13 01508 g002b
Figure 3. The transmission of boundary points of affected areas within 3 h after seeding for 24 aircraft precipitation enhancement operations simulated by HYSPLIT model (124). Note: The upper part of each graph represents the horizontal transport path of the seeding point, the horizontal and vertical coordinates are longitude and latitude, respectively. The lower part represents the vertical transmission height of the seeding point, the horizontal and vertical coordinates are time (h) and altitude (m), respectively. Red, blue, and green lines indicate the transport paths of different seeding points.
Atmosphere 13 01508 g003aAtmosphere 13 01508 g003b
Figure 4. Direction and angle of seeding agent transmission path. Note: Take the example of querying the south wind, which indicates that the end point of the wind direction arrow is in the middle “+”, then the starting point of the arrow is at 180° marked on the circle, the angle of the south wind is 180°.
Atmosphere 13 01508 g004
Figure 5. Three-dimensional geospatial configuration of the airline and the hourly affected area within 3 h after seeding for 24 aircraft precipitation enhancement operations (124). Note: The solid red line is the airline path, the blue area in the sky is the influence area, the blue area on the ground is the projection of the influence area in the air.
Atmosphere 13 01508 g005aAtmosphere 13 01508 g005b
Figure 6. Mean hourly precipitation of influence area, mean change rate of hourly precipitation of affected area, and contrast area for 3 h after 24 aircraft precipitation enhancement operations.
Atmosphere 13 01508 g006
Table 1. Reasonableness condition of artificial precipitation enhancement process.
IndicatorRequirements
Condition of operation(1) The cloud system types are stratiform cloud or stratus–cumulus mixed cloud
(2) Weather conditions (precipitation cloud system) and water vapor transmission are suitable for precipitance enhancement
Opportunity of operation(1) The operation is located in the area with abundant water vapor content and liquid water content, and the cloud in the operation area has strong radar echo
(2) There is a supercooled water layer in seeding cloud, and the cloud has a relatively large thickness
(3) Temperature at the top of the cloud < −10 °C
Position of operation(1) The temperature of the seeding agent position is in the cloud seeding temperature window, which is conducive to the maximum nucleation of the seeding agent
(2) The design of flight path is reasonable, and the seeding area has enough area and full seeding is realized
Dose of seeding agentThe seeding dose is reasonable and the full seeding is basically realized
Table 2. Information of 24 aircraft precipitation enhancement operations in Henan from 2014 to 2019.
NumberDate of OperationTime of Seeding
(Beijing Time)
Duration of Seeding/hAverage Height of Seeding/kmThe Dose of SeedingSeeding Region
Dry Ice/kgAgI Article Flame/PipeAgI Flame Bomb/ShotAgI Smoke Tube/Pipe
12014 08 2309:39–12:012.45.74816200 Pingdingshan–Xuchang–Luohe–Nanyang, Henan Province, China
22014 08 2314:58–17:362.66.5 19187 Pingdingshan–Xuchang–Luohe–Zhoukou–Zhumadian, Henan Province, China
32014 08 2615:21–17:362.36.51201120 Pingdingshan–Xuchang–Luohe–Zhoukou–Zhumadian, Henan Province, China
42016 05 0716:17–17:201.15.6 15193 Luoyang–Jiaozuo–Zhengzhou, Henan Province, China
52016 05 2014:07–15:561.86.2 17195 Xuchang–Pingdingshan–Luohe–Zhoukou–Zhumadian, Henan Province, China
62017 04 0409:45–11:261.73.8 13 Pingdingshan–Xuchang, Henan Province, China
72017 04 0810:39–11:421.14.5 13 Luoyang–Jiaozuo, Henan Province, China
82017 04 1009:45–11:211.64.5 13 Luoyang–Pingdingshan–Nanyang, Henan Province, China
92017 09 2414:02–17:103.15.3 20180 Nanyang, Henan Province, China
102017 09 2511:57–14:593.06.2 18194 Nanyang, Henan Province, China
112017 10 0111:10–12:000.86.2 26191 Nanyang, Henan Province, China
122017 10 0117:19–19:432.46.2 37175 Nanyang, Henan Province, China
132018 01 2409:50–11:502.04.2 16182 Pingdingshan–Nanyang, Henan Province, China
142018 01 2415:20–16:401.34.2 16189 Pingdingshan–Luohe–Nanyang–Zhumadian, Henan Province, China
152018 01 2621:29–22:401.24.2 15192 Nanyang, Henan Province, China
162018 11 0509:10–10:591.84.0 33Luoyang–Pingdingshan, Henan Province, China
172018 11 0514:55––17:252.54.3 37Luoyang–Pingdingshan, Henan Province, China
182018 11 0616:42–17:300.84.3 36Xuchang–Luohe–Pingdingshan, Henan Province, China
192018 11 0715:11–17:352.44 35Pingdingshan–Nanyang, Henan Province, China
202018 12 0316:02–18:122.24 35Zhoukou, Henan Province, China
212018 12 1016:18–18:152.02.7 24183 Luohe–Zhoukou–Zhumadian, Henan Province, China
222018 12 1914:11–16:001.84.2 16187 Nanyang–Zhumadian, Henan Province, China
232018 12 1919:15–20:501.63.6 16177 Zhumadian–Nanyang–Xinyang, Henan Province, China
242019 02 2615:15–16:501.64.2 18 Nanyang, Henan Province, China
Note: AgI content for two specifications of article flames: 125 g/pipe, 35 g/pipe. The AgI content of AgI flame bomb is 3.6 g/shot, and the AgI content of AgI smoke tube is 12.5 g/pipe.
Table 3. Statistics of features of seeding agent transmission within 3 h after 24 aircraft precipitance enhancement operations.
NumberTransmission Path fromAngle of
Transmission Path
Horizontal Transmission Distance of Seeding Agent Within 3 h After Seeding/kmVertical Transmission Height of Seeding Agent Within 3 h After
Seeding/km
1WSW252°180.5524
2W260°188.7908
3WSW246°157.9898
4SW225°140.8201
5WSW253°27.0477
6WSW238°146.7803
7W260°183.6−15
8W266°125.6702
9WSW247°158.6179
10W268°193.3112
11W260°233.91090
12W265°271.3272
13WSW240°214.8605
14SW235°233.0638
15WSW246°153.859
16WSW246°176.0366
17SW230°153.6581
18WSW246°132.5−30
19SW235°116.4208
20WSW237°206.21286
21WSW236.5°134.7389
22W260°46.1626
23NNW327°15.181
24W265°128.9−26
Note: The vertical transmission height of seeding agent is positive in the upward direction and negative in the downward direction.
Publisher’s Note: MDPI stays neutral with regard to jurisdictional claims in published maps and institutional affiliations.

