1. Introduction
Road transport is one of the major sources of particulate matter in urban environments. The size distribution of particulate matter coming from a vehicle exhaust depends on factors including engine type, fuel and exhaust after-treatment devices, in addition to the vehicle operating conditions and drive mode (normal/eco/sport), test method and atmospheric conditions at the time of measurement [
1].
Though vehicle exhaust particulate emissions have historically been largely attributed to diesel engines, spark ignition (SI) engines can have a notable impact on particulate emissions and size distribution. The particle number size distribution (PNSD) from SI engines can be markedly different from diesel engines, in that the former generally has a unimodal distribution while the latter has a bimodal distribution [
1]. The operating mode of an SI engine strongly affects the particle number (PN) and particle mass (PM) concentrations of the resulting particulate matter but does not seem to affect the PNSD [
2]. The operating modes that contribute most strongly to particulate emissions are those associated with the enrichment of the fuel–air mixture. With the widespread application of particulate filters on diesel vehicles, the PN concentration from a state-of-the-art diesel vehicle could be lower than SI vehicles without a gasoline particulate filter (GPF). This highlights the necessity of more SI PN research [
3,
4].
For port fuel injection (PFI) SI engines, an enriched air–fuel mixture is needed during the cold start and warm-up phase to ensure enough fuel atomisation, proper ignition and smooth operation. This causes films of liquid fuel to accumulate on the combustion chamber walls, igniting capriciously and burning long into the expansion stroke [
5]. Poor air–fuel mixing tends to increase the proportion of smaller particles, which means that, during a cold start, we are likely to see a larger distribution of smaller particles [
6]. For harsh acceleration the same fuel enrichment may be applied [
5]. Additionally, at high engine speed conditions, the exhaust temperatures can increase, so fuel enrichment may be used to protect the three-way catalyst (TWC) and other engine components from thermal stress [
7]. A comparably high concentration of small particles can also be seen under high engine load conditions, attributed to the nucleation of exhaust-borne volatile and semi-volatile materials [
3].
In addition to purposeful fuel enrichment, deviations away from stoichiometry can occur due to fuel being deposited on the inside of the intake port of PFI SI vehicles, rather than going into the combustion chamber. This is not a problem during steady-state operation as the oxygen sensor will allow this to be compensated for. However, during transient operation these reservoirs can be problematic as lean operation will be followed by rich operation due to improper fuelling management. When shifts in engine operation occur, the temperature of the inlet valve can change, altering the accumulation and evaporation of fuel reservoirs and hence the amount of soot seen at the tailpipe. Vehicles have additionally been seen to eject a large quantity of particulate matter as a result of the release of previously captured particles from the exhaust pipe walls [
8].
Particulate matter from vehicle exhausts is considered one of the major sources of atmospheric particulate contamination [
1]. The PNSD is an important factor to incorporate into considerations of particulate matter health risks because the ability of particles to penetrate deeply into human tissues depends on their size [
9]. Particles with an aerodynamic diameter no larger than 10 μm (PM
10) or 2.5 μm (PM
2.5) are the most widely adopted index, as such particles are small enough to penetrate into the respiratory system [
10]. It has been well recognized that PM
2.5 gives a better indication of the health impacts as this size range can penetrate the deepest into the lungs [
11]. Among PM
2.5, ultrafine particles with aerodynamic diameters of less than 100 nm are the most dangerous types [
12]. This is due to smaller particles having much larger surface areas for toxic material adsorption, higher reactivity to induce inflammation [
13,
14] and long suspension times in the atmosphere.
Exhaust regulations were first introduced to monitor the mass emission rates of particulate emissions. However, PN became increasingly regarded as the exhaust particles became smaller but denser with the growing market share of direct injection SI engines. Smaller particles, with stronger penetration ability and related health hazards [
1], contribute substantially less mass onto a filter, meaning that the gravimetric-based weighing methods for PM are approaching their technological limits for vehicles equipped with particulate filters [
15]. As particulate measurement technologies have improved, the light-duty sector has been able to turn its focus to PN emissions. The Particle Measurement Programme (PMP) was launched in 2001 with the aim to develop a more sensitive and precise measurement methodology for PN quantification, and in 2007 the solid particle number measurement method based on the counting of solid particles above 23 nm in size was introduced [
16].
The nucleation of volatile fractions depends strongly on the condition of the exhaust dilution air and dilution ratio. As a result, the formation of particles smaller than 20 nm is heavily influenced by these conditions. The choice to count only solid particles greater than 23 nm was therefore made in the interest of measurement repeatability and reproducibility, because it is difficult to ensure that the exhaust sample conditions remain strictly constant [
17]. The European Union (EU) solid particle number measurement method mandates a volatile particle remover upstream of a particle number counter with a 50% counting efficiency at 23 nm. This was integrated into the European light-duty automotive emission control regulations in 2009.
Previous research has focussed on the unique PN emission characteristics of hybrid electric vehicles (HEVs). Unlike internal combustion engine (ICE)-only vehicles, HEVs suffer extra PN penalties because the engine undergoes frequent stop-and-goes [
18,
19], though the aid of electric propulsion partially relieves PN deterioration during cold start compared to ICE-only vehicles [
20,
21]. More than two-fold higher than regulatory limit PN emissions were reported by Yang et al. [
4] from a China-6 HEV during urban driving. Yang et al. [
4] suggested that catalyst cooling during electric propulsion periods can be another factor resulting in extra PN when the engine restarts. Robinson and Holmén [
19] also examined the PNSD from a 2010 model year/SULEV-II HEV and found a bi-modal distribution with peaks at 50 and 400 nm, while the 10 nm peak visible from an ICE-only counterpart was not evident. Driven by the global efforts to decarbonise and reduce emissions, HEVs—together with electric vehicles—are quickly replacing ICE-only models in mainstream markets. This makes it all the more important to better understand PN emissions and their size distribution from HEVs. The New European Drive Cycle (NEDC) that was used for type approval in the EU from Euro 3 until Euro 6 emission standards was replaced by the Worldwide Harmonised Light Vehicle Test Procedure (WLTP) and Worldwide Harmonised Light Vehicle Test Cycle (WLTC) because the NEDC was deemed unrepresentative of “real-world” driving and too easy to manipulate [
22]. More recently, a supplementary on-road test called the real driving emissions (RDE) test was added alongside the WLTC as a means to protect against so-called “cycle beating” on the fixed chassis dynamometer test cycles that led to the “Dieselgate” scandal of 2015 [
23].
Robinson and Holmén [
19] inferred from their on-road city driving investigation that the PN size distribution changes little over the route for a given vehicle type. However, no work to date has directly investigated how the type approval test cycles affect the PN and PNSD arising from an HEV. Given that many HEVs have been shown to display different PN emissions from conventional vehicles, it is important to assess how the test cycles used at type approval affect this.
The objective of the current study is to investigate the PN and PNSD arising from an HEV on the WLTC and an RDE-style chassis dynamometer test cycle. By assessing how the properties of these test cycles affect the PN and PNSD from HEVs, inferences can be made as to how the reported PN results are affected by the test cycle used.
2. Materials and Methods
2.1. Test Vehicle, On-Board Instrumentation and Fuel
A 2010 model year Third Generation Toyota Prius with Euro 5 emission compliance and 26,000 miles on the odometer was used for this study. This test vehicle and its onboard instrumentation are already detailed in Thomas et al. [
24] and so will only be briefly outlined here.
Table 1 summarises the properties of the test vehicle. A feature of this and other HEVs is their stop-and-go functionality whereby the ICE turns off when the vehicle is at standstill and re-ignites when the accelerator pedal is depressed. This ICE re-ignition is referred to as “engine re-ignition” in this paper. A range of thermocouples placed around the TWC system and at the tailpipe measured associated temperatures, while an OBD Mini Logger (HEM Data, Southfield, MI, USA) recorded a range of engine control unit (ECU) parameters, including lambda, mass air flow, engine coolant temperature and hybrid battery state of charge (SOC). A Horiba OBS-1000 (Horiba, Kyoto, Japan) also measured the air–fuel ratio downstream of the muffler.
The fuel used was an E10 blend. Ethanol was splash blended into research grade E0 gasoline to make a 10% by volume ratio. For the fuel change, the entire tank was first drained as fully as possible by a fuel pump attached to a connection in the fuel return line under the vehicle bonnet. Approximately 2 L of the new fuel was then poured into the fuel tank. This process was repeated with the drained fuel from each iteration being deposited in a waste fuel container. The process was repeated at least three times to ensure the tank and fuel delivery lines were flushed before the desired quantity of fuel for testing was added. After this, the vehicle was driven approximately 50 km on the chassis dynamometer, ensuring that the new fuel had completely flushed out the old fuel and that the ECU had adjusted to the different combustion properties of the new fuel type.
2.2. Chassis Dynamometer Test Cell
The University of Bath Centre for Low Emissions Vehicle Research (CLEVeR) (Bath, UK) chassis dynamometer test cell was used for this project. The tests were performed on a 4WD AVL RoadSimTM 48” chassis dynamometer (AVL, Graz, Austria) with a Horiba CVS-7100 system (Horiba, Kyoto, Japan), within a test cell capable of temperature and humidity control. A near full-frontal width road speed fan was placed approximately one metre in front of the vehicle for representative cooling of the full powertrain system. A Cambustion DMS500 fast particle size spectrometer (Cambustion, Cambridge, UK) was placed at the tailpipe for PN and PNSD measurement at 5 Hz sampling frequency. The Horiba smooth approach orifice and CO2 tracer capability each also enabled exhaust flow determination and hence transient tailpipe emission calculation.
2.3. Test Procedure and Test Cycles
All tests were driven by the same trained test driver. The chassis dynamometer was warmed up according to the manufacturer’s instructions at the beginning of each day of testing. The various pieces of equipment were turned on and any preparations for testing were performed as necessary, according to user manuals.
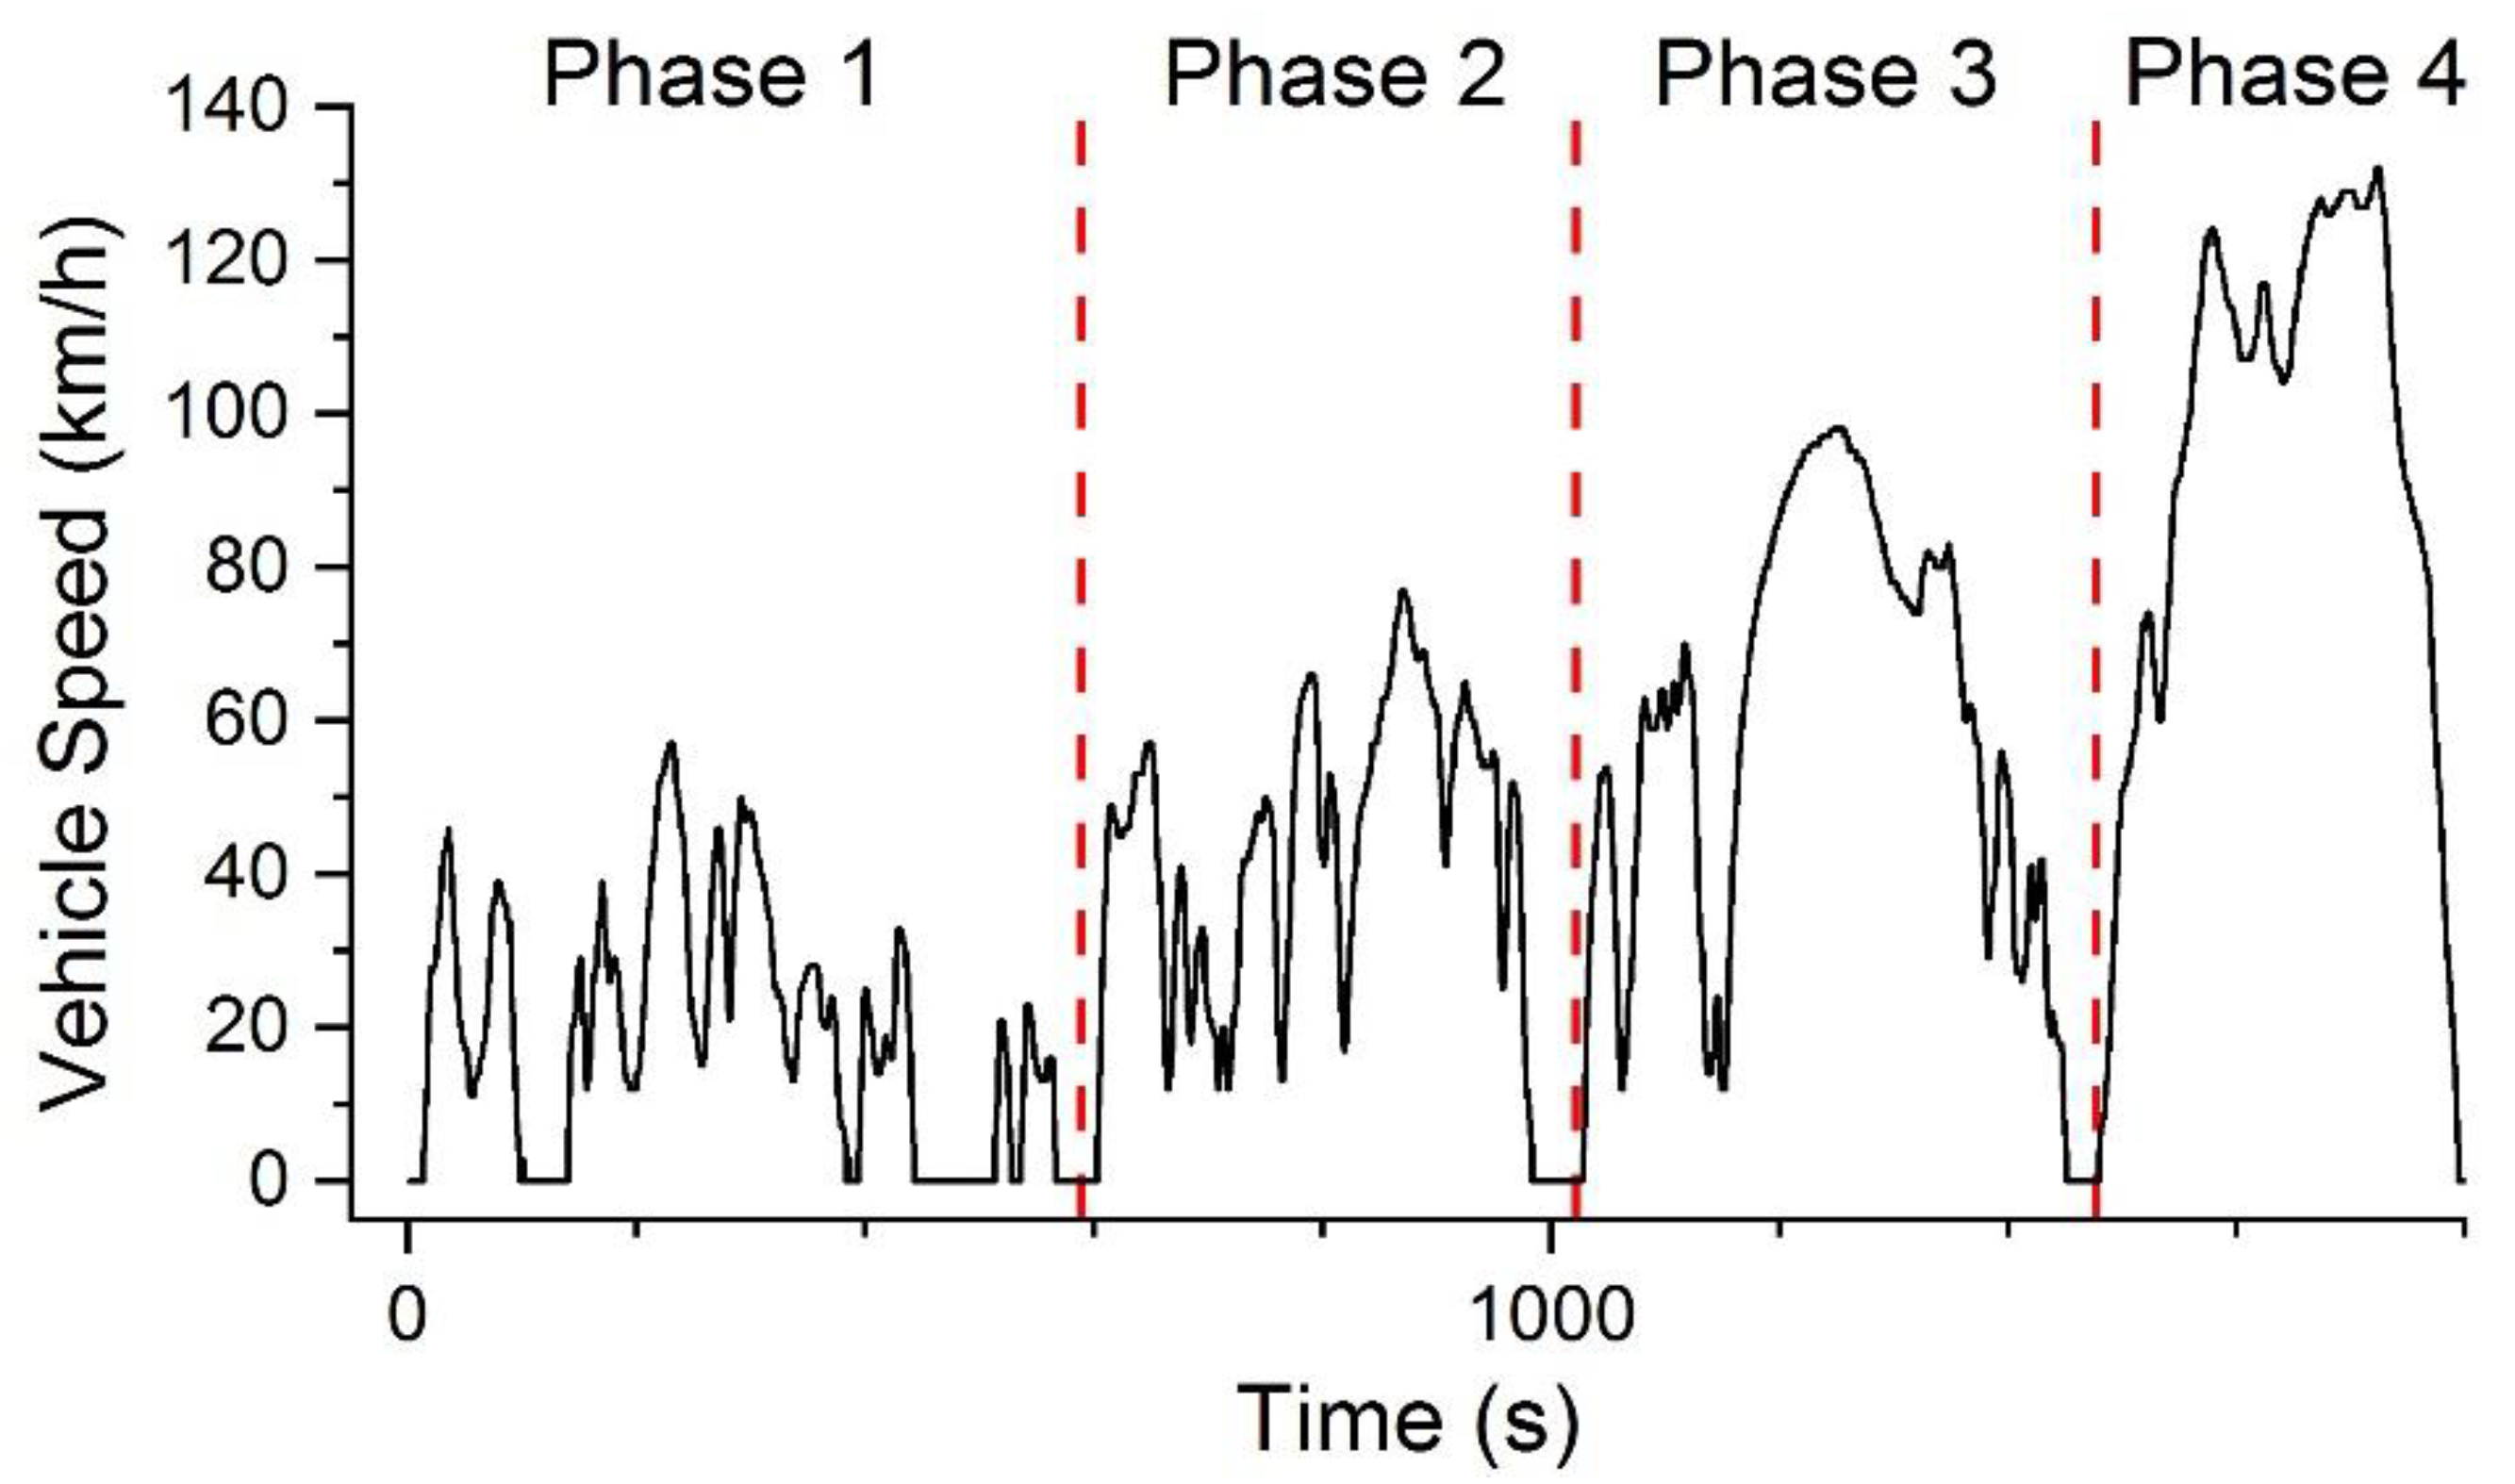
The WLTC cycle was performed largely according to the guidelines in Commission Regulation (EC) 2017/1151 [
25]. The main exception to this was the absence of any volatile particle remover and no cut-off at 23 nm ahead of the particle number counter, to allow more detailed characterisation of the particulate matter. The WLTC speed profile is presented in
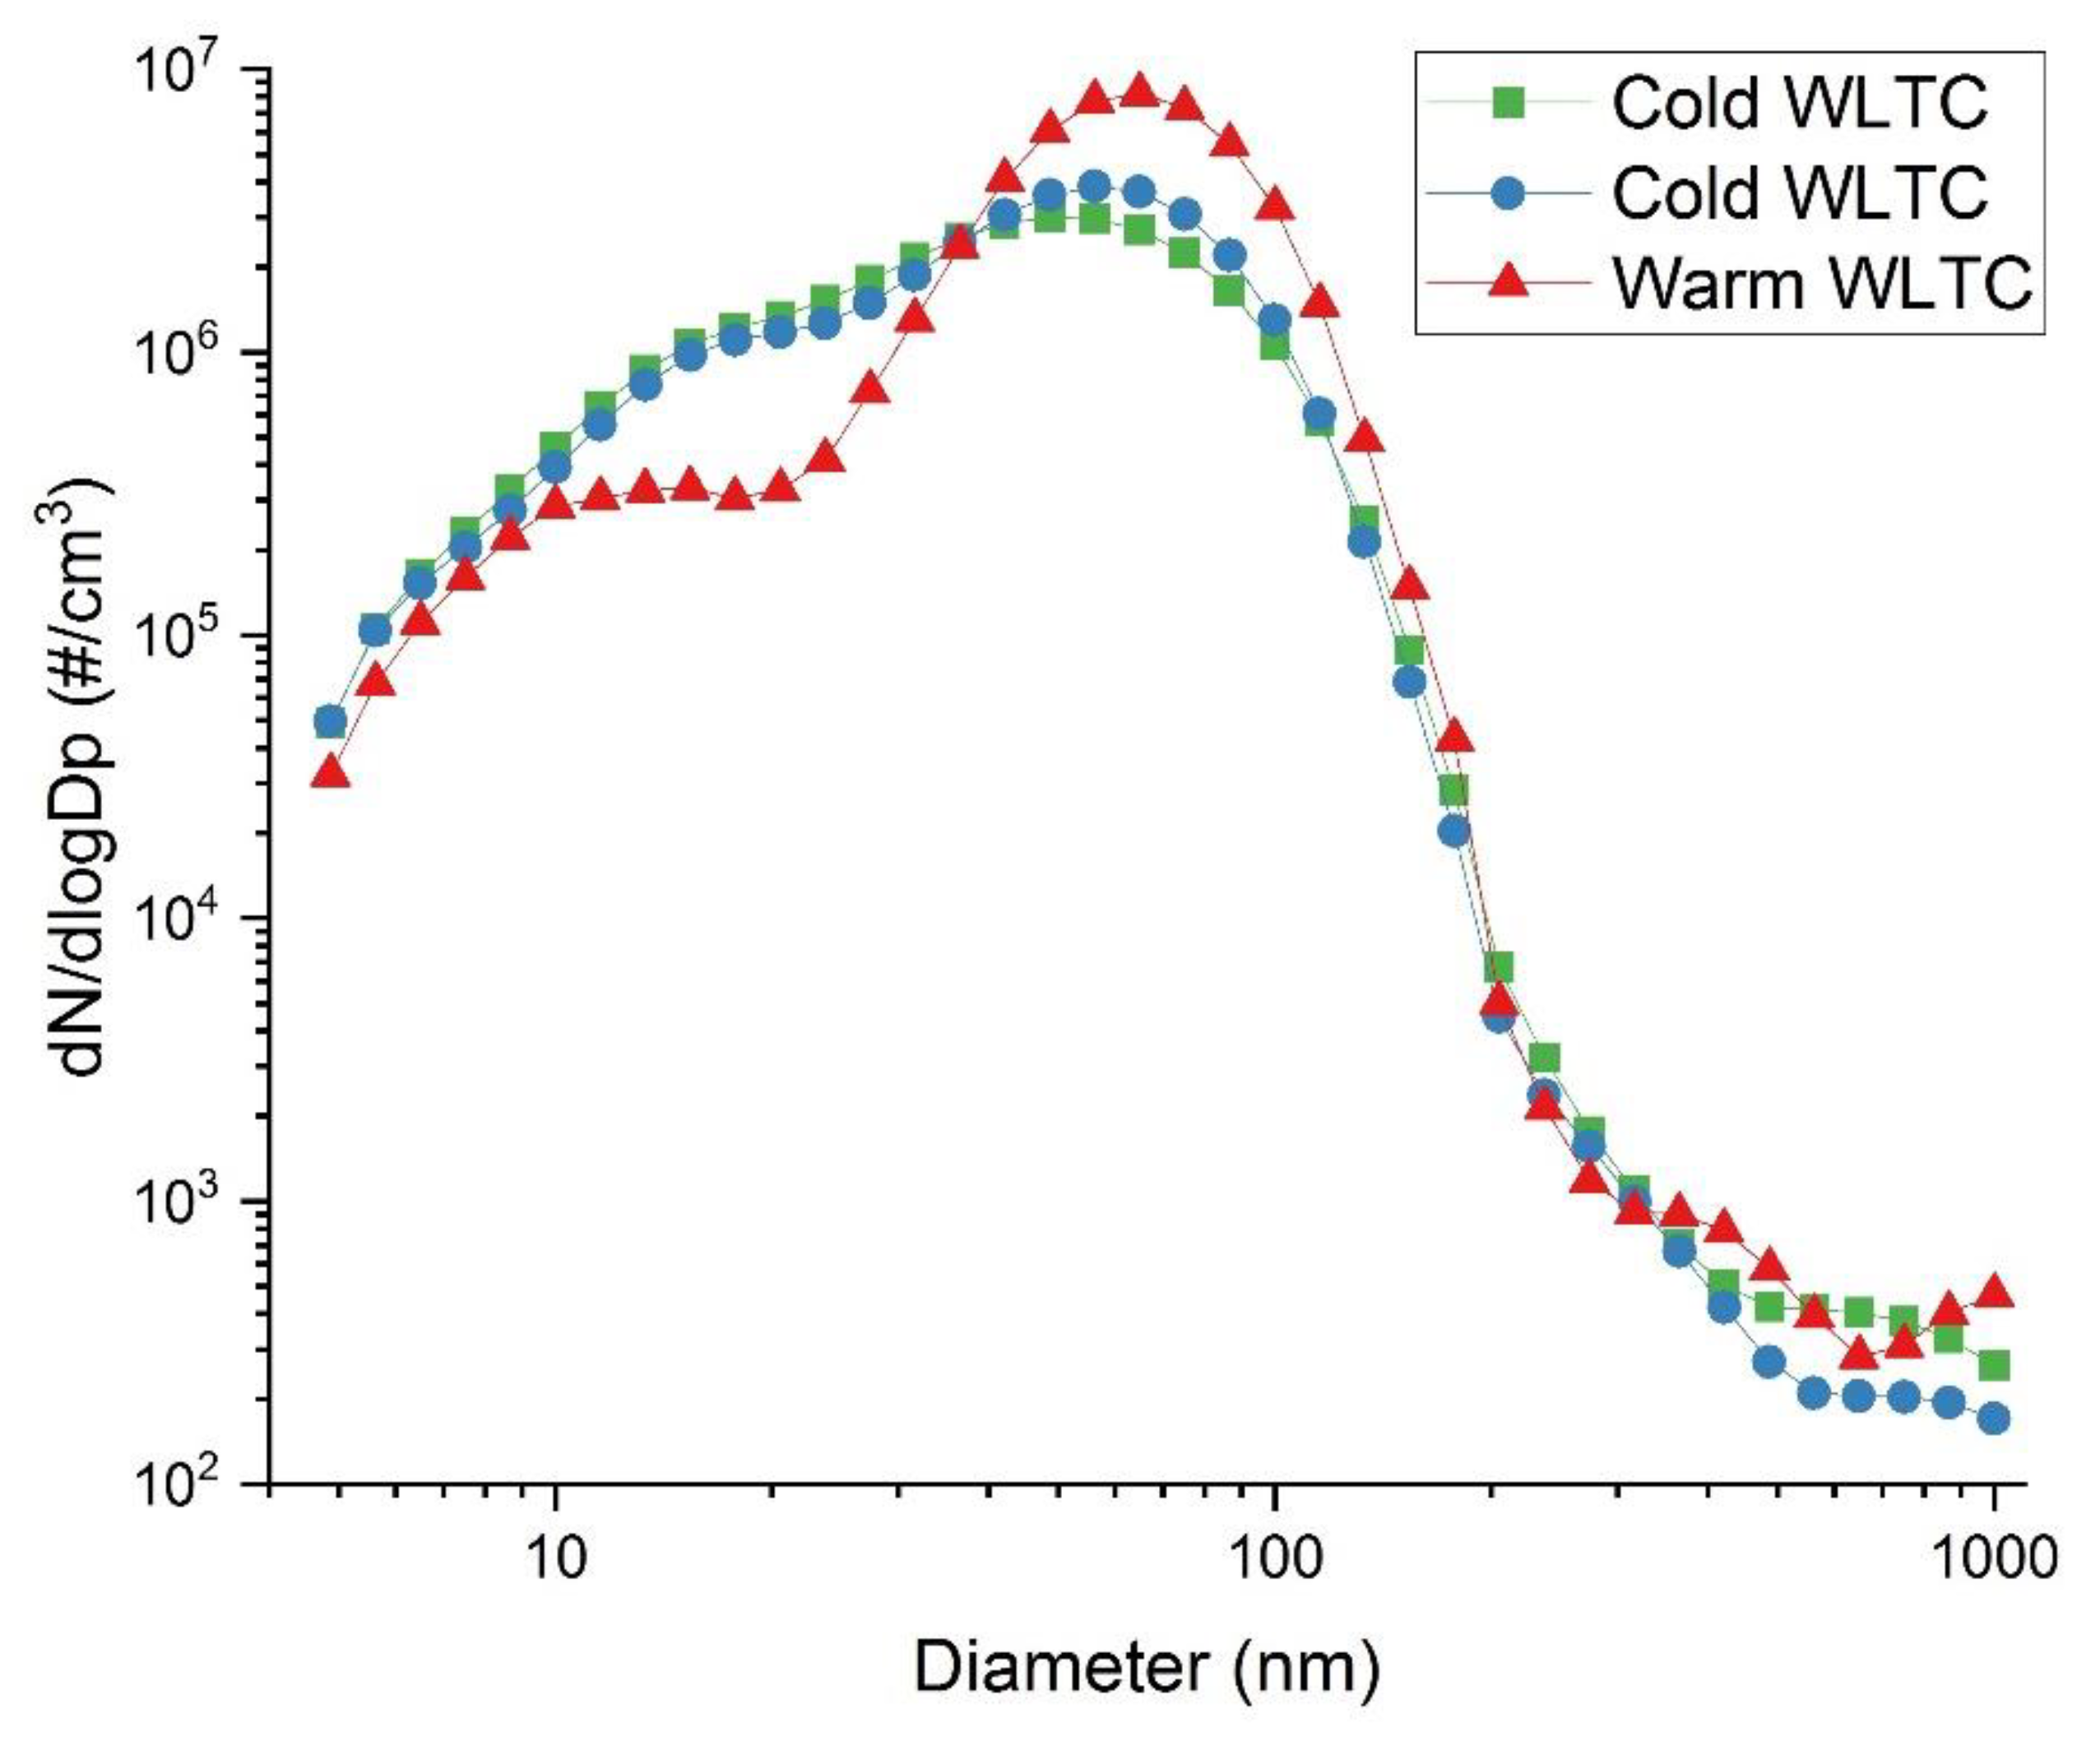
Figure 1. The WLTC test was repeated two times under identical initial hybrid vehicle SOC of 67.8%, to ensure reliability. A third WLTC test was also performed, but with a warm engine (starting engine coolant temperature 57 °C; initial SOC 68.2%) in order to allow the investigation of the cold start effect on PNSD.
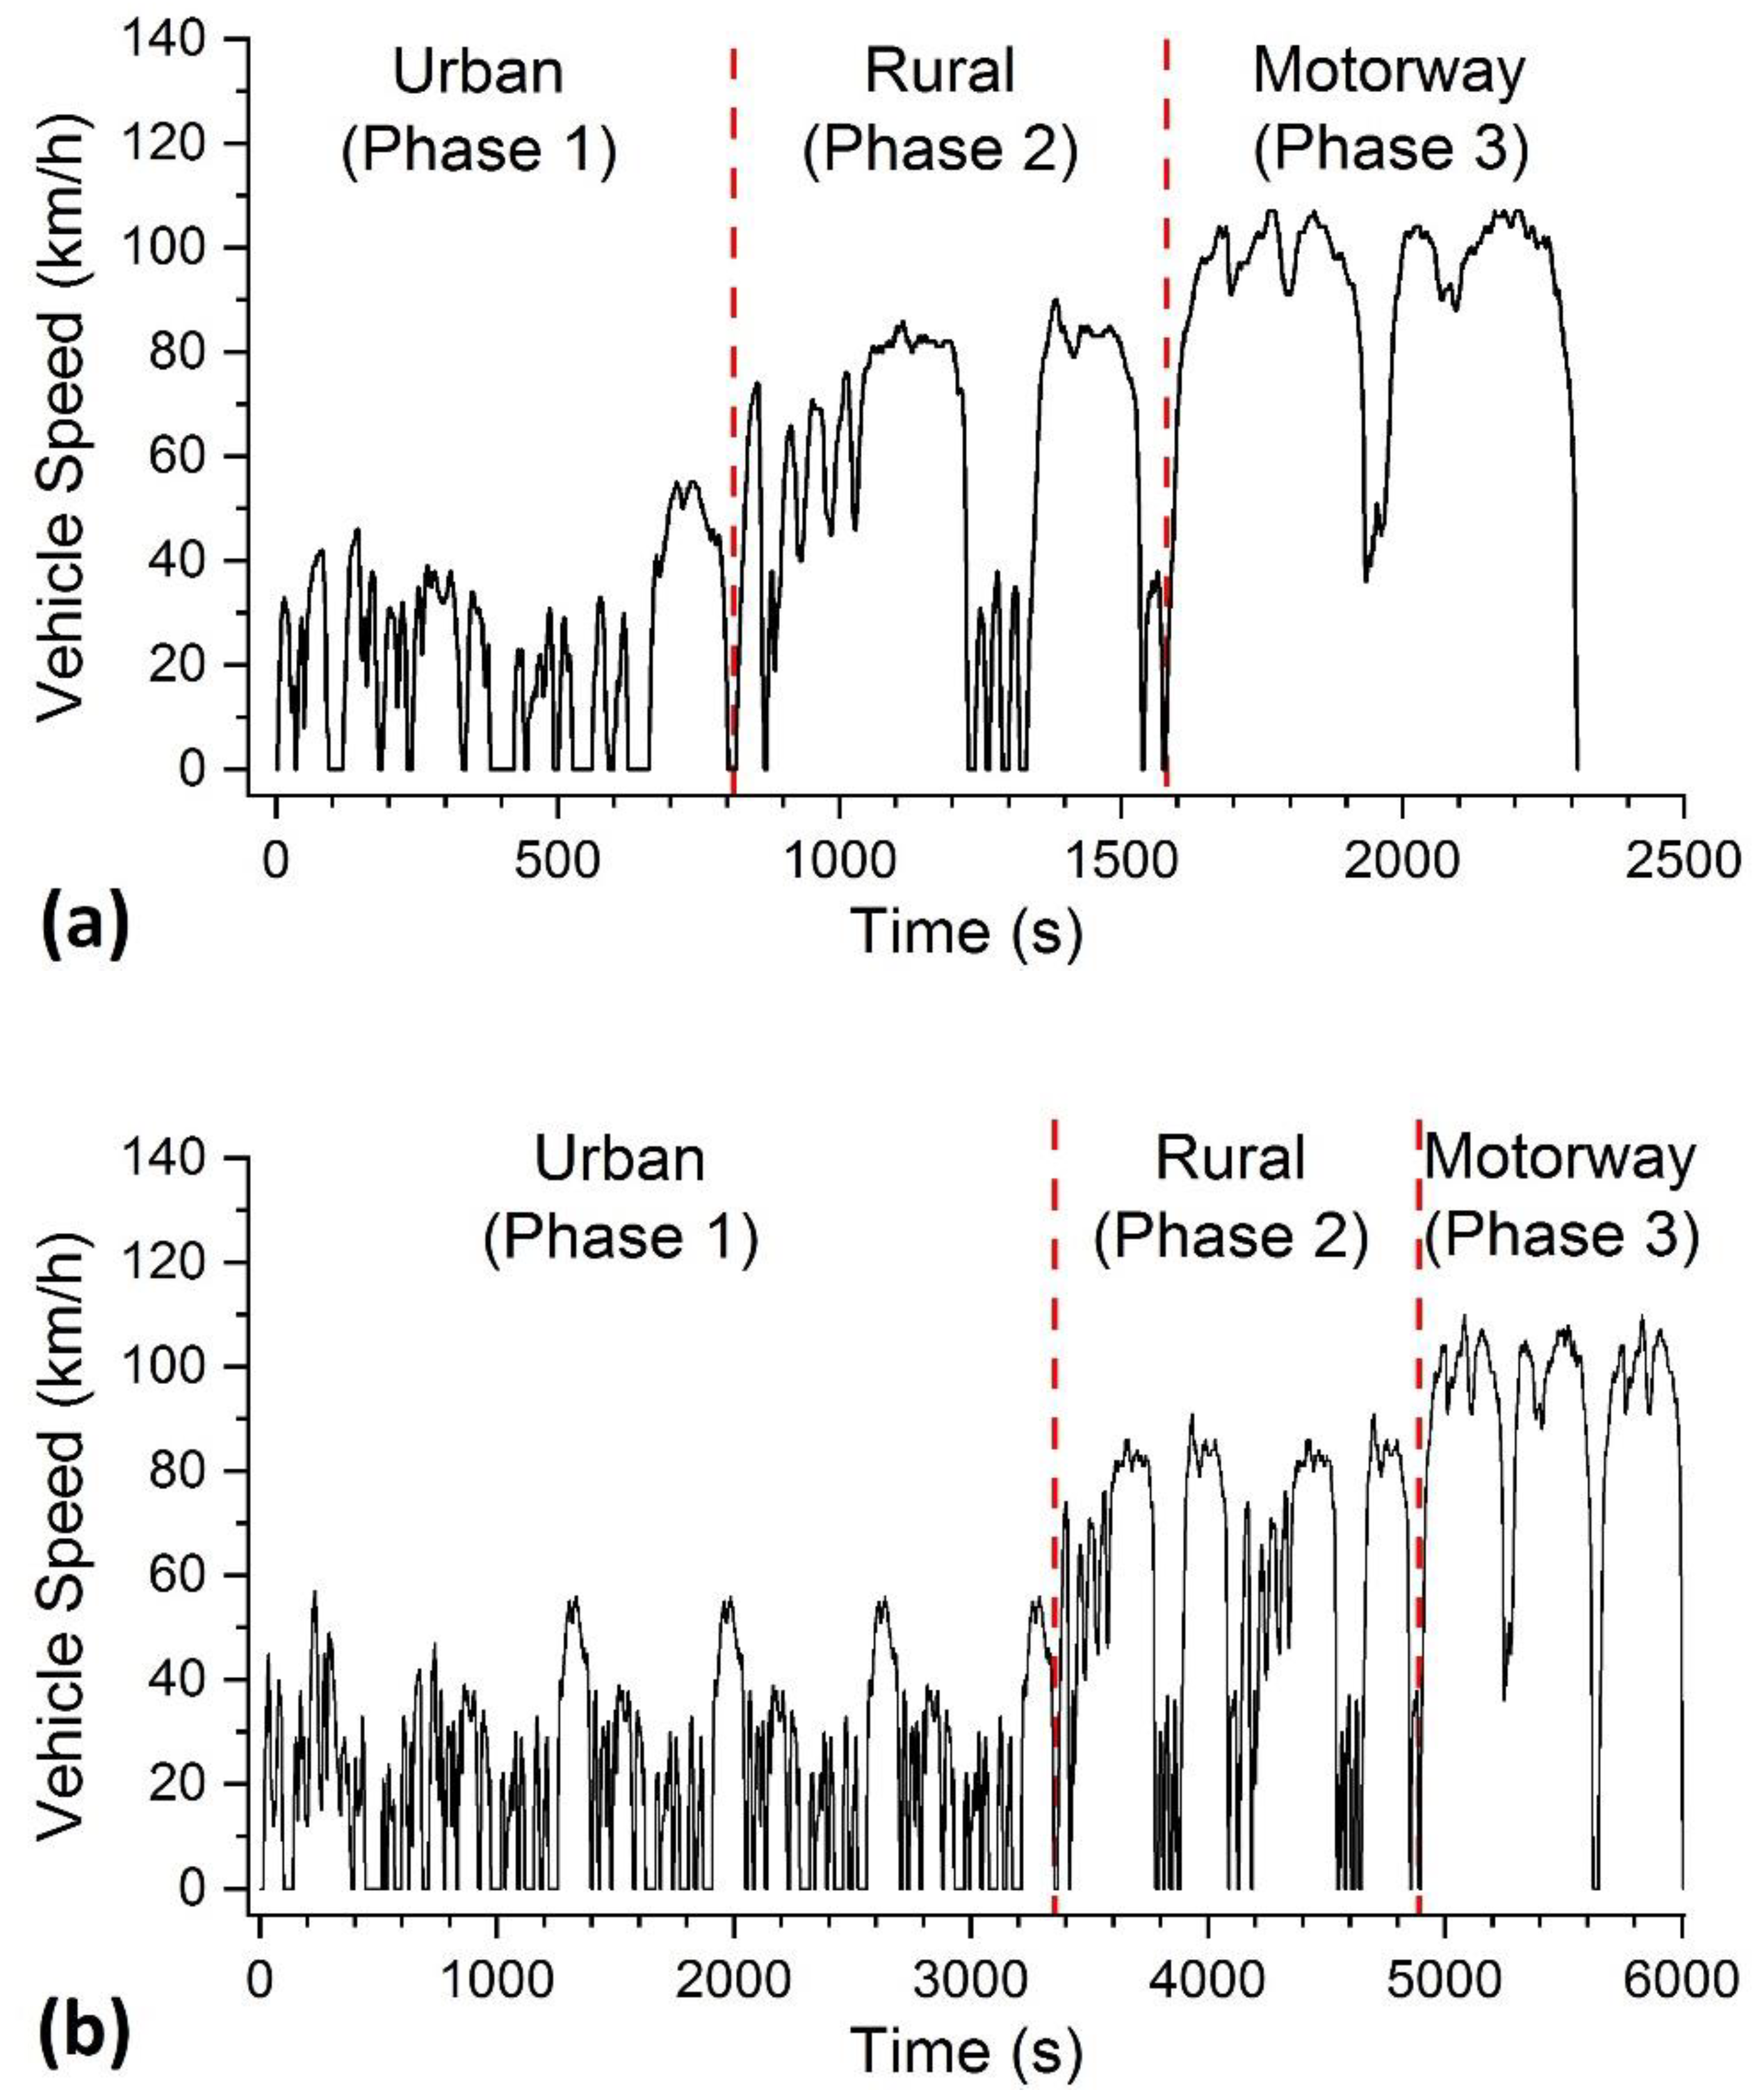
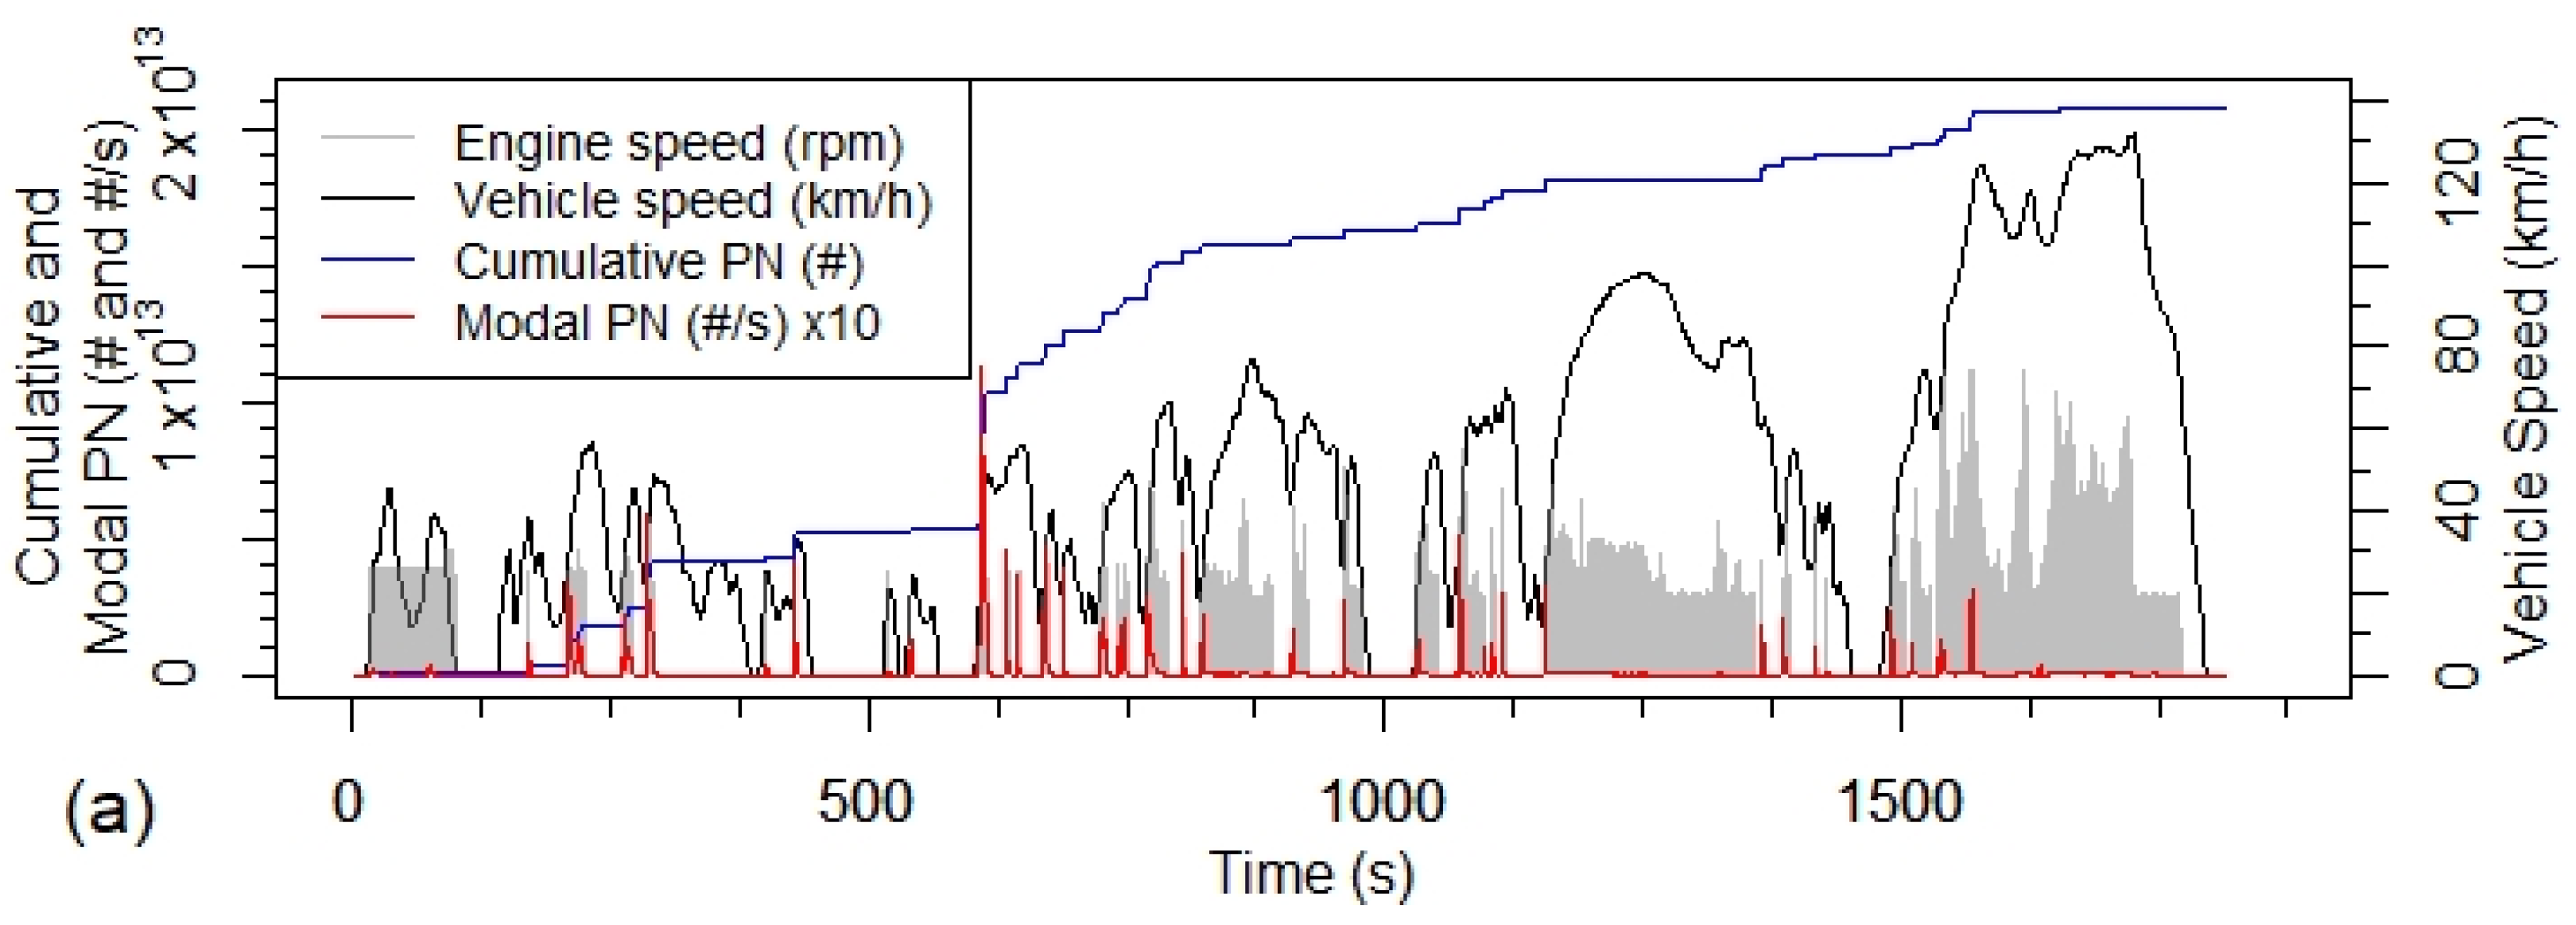
Due to bag sampling constraints, a full RDE cycle could not be performed on the chassis dynamometer. The volumetric capacity of the bag sampling system did not allow for such a large test. Instead, a “shortened RDE-style cycle” was executed on the chassis dynamometer. The shortened RDE-style cycle was a real-world velocity trace of an on-road test-driven in and around the city of Leeds, United Kingdom (UK), using the same research vehicle. The test—of 36.09 km distance and 2310 s duration—gave rise to the velocity trace given in
Figure 2a. This was then transposed into the test cell driver’s aid and driven on the chassis dynamometer according to the limits defined for the WLTC driver’s schedule. The shortened RDE-style drive cycle was repeated 3 times on the dynamometer with varying initial hybrid batteries SOC values (52.2%, 60% and 67.8%). The initial coolant temperatures for these three tests were 53 ± 8 °C.
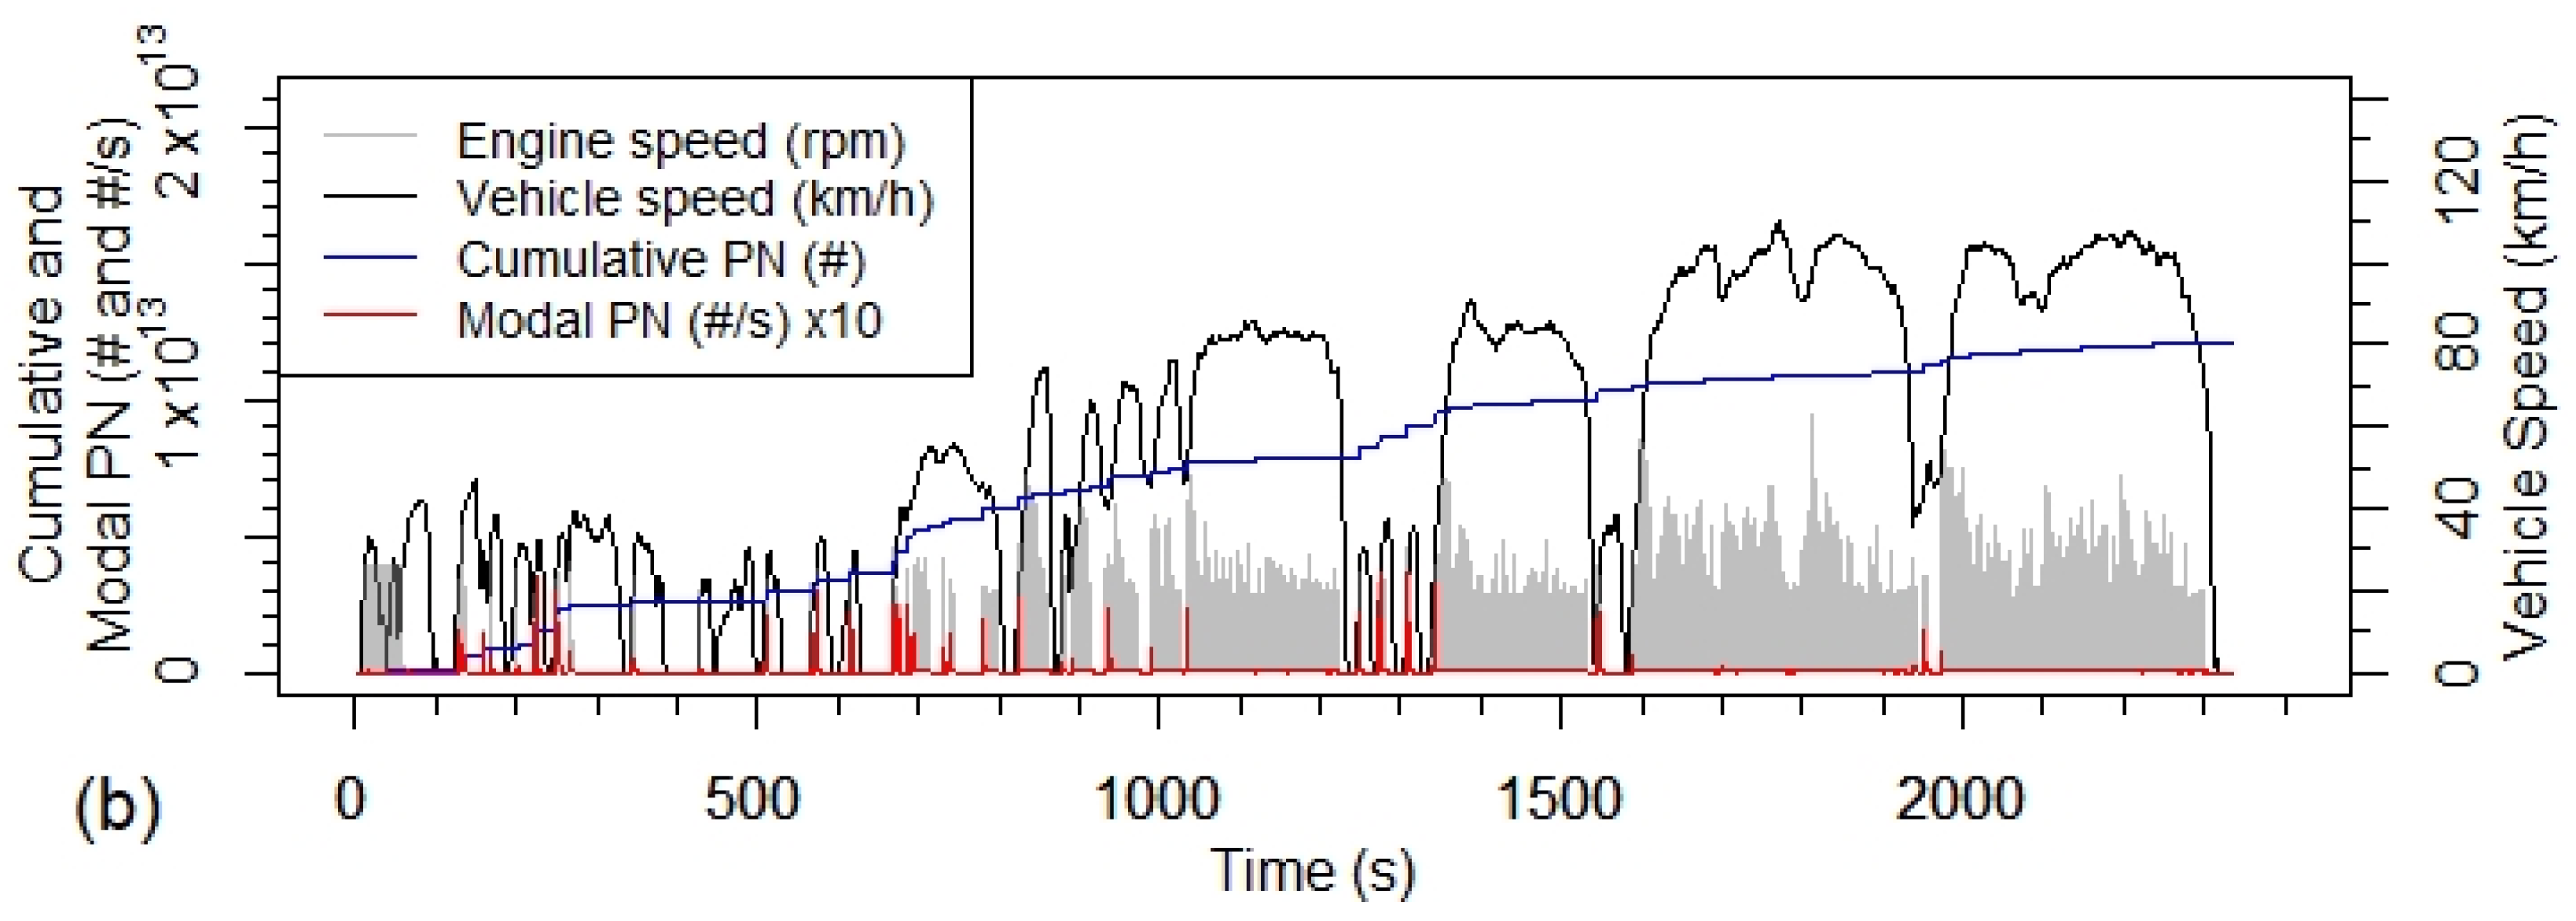
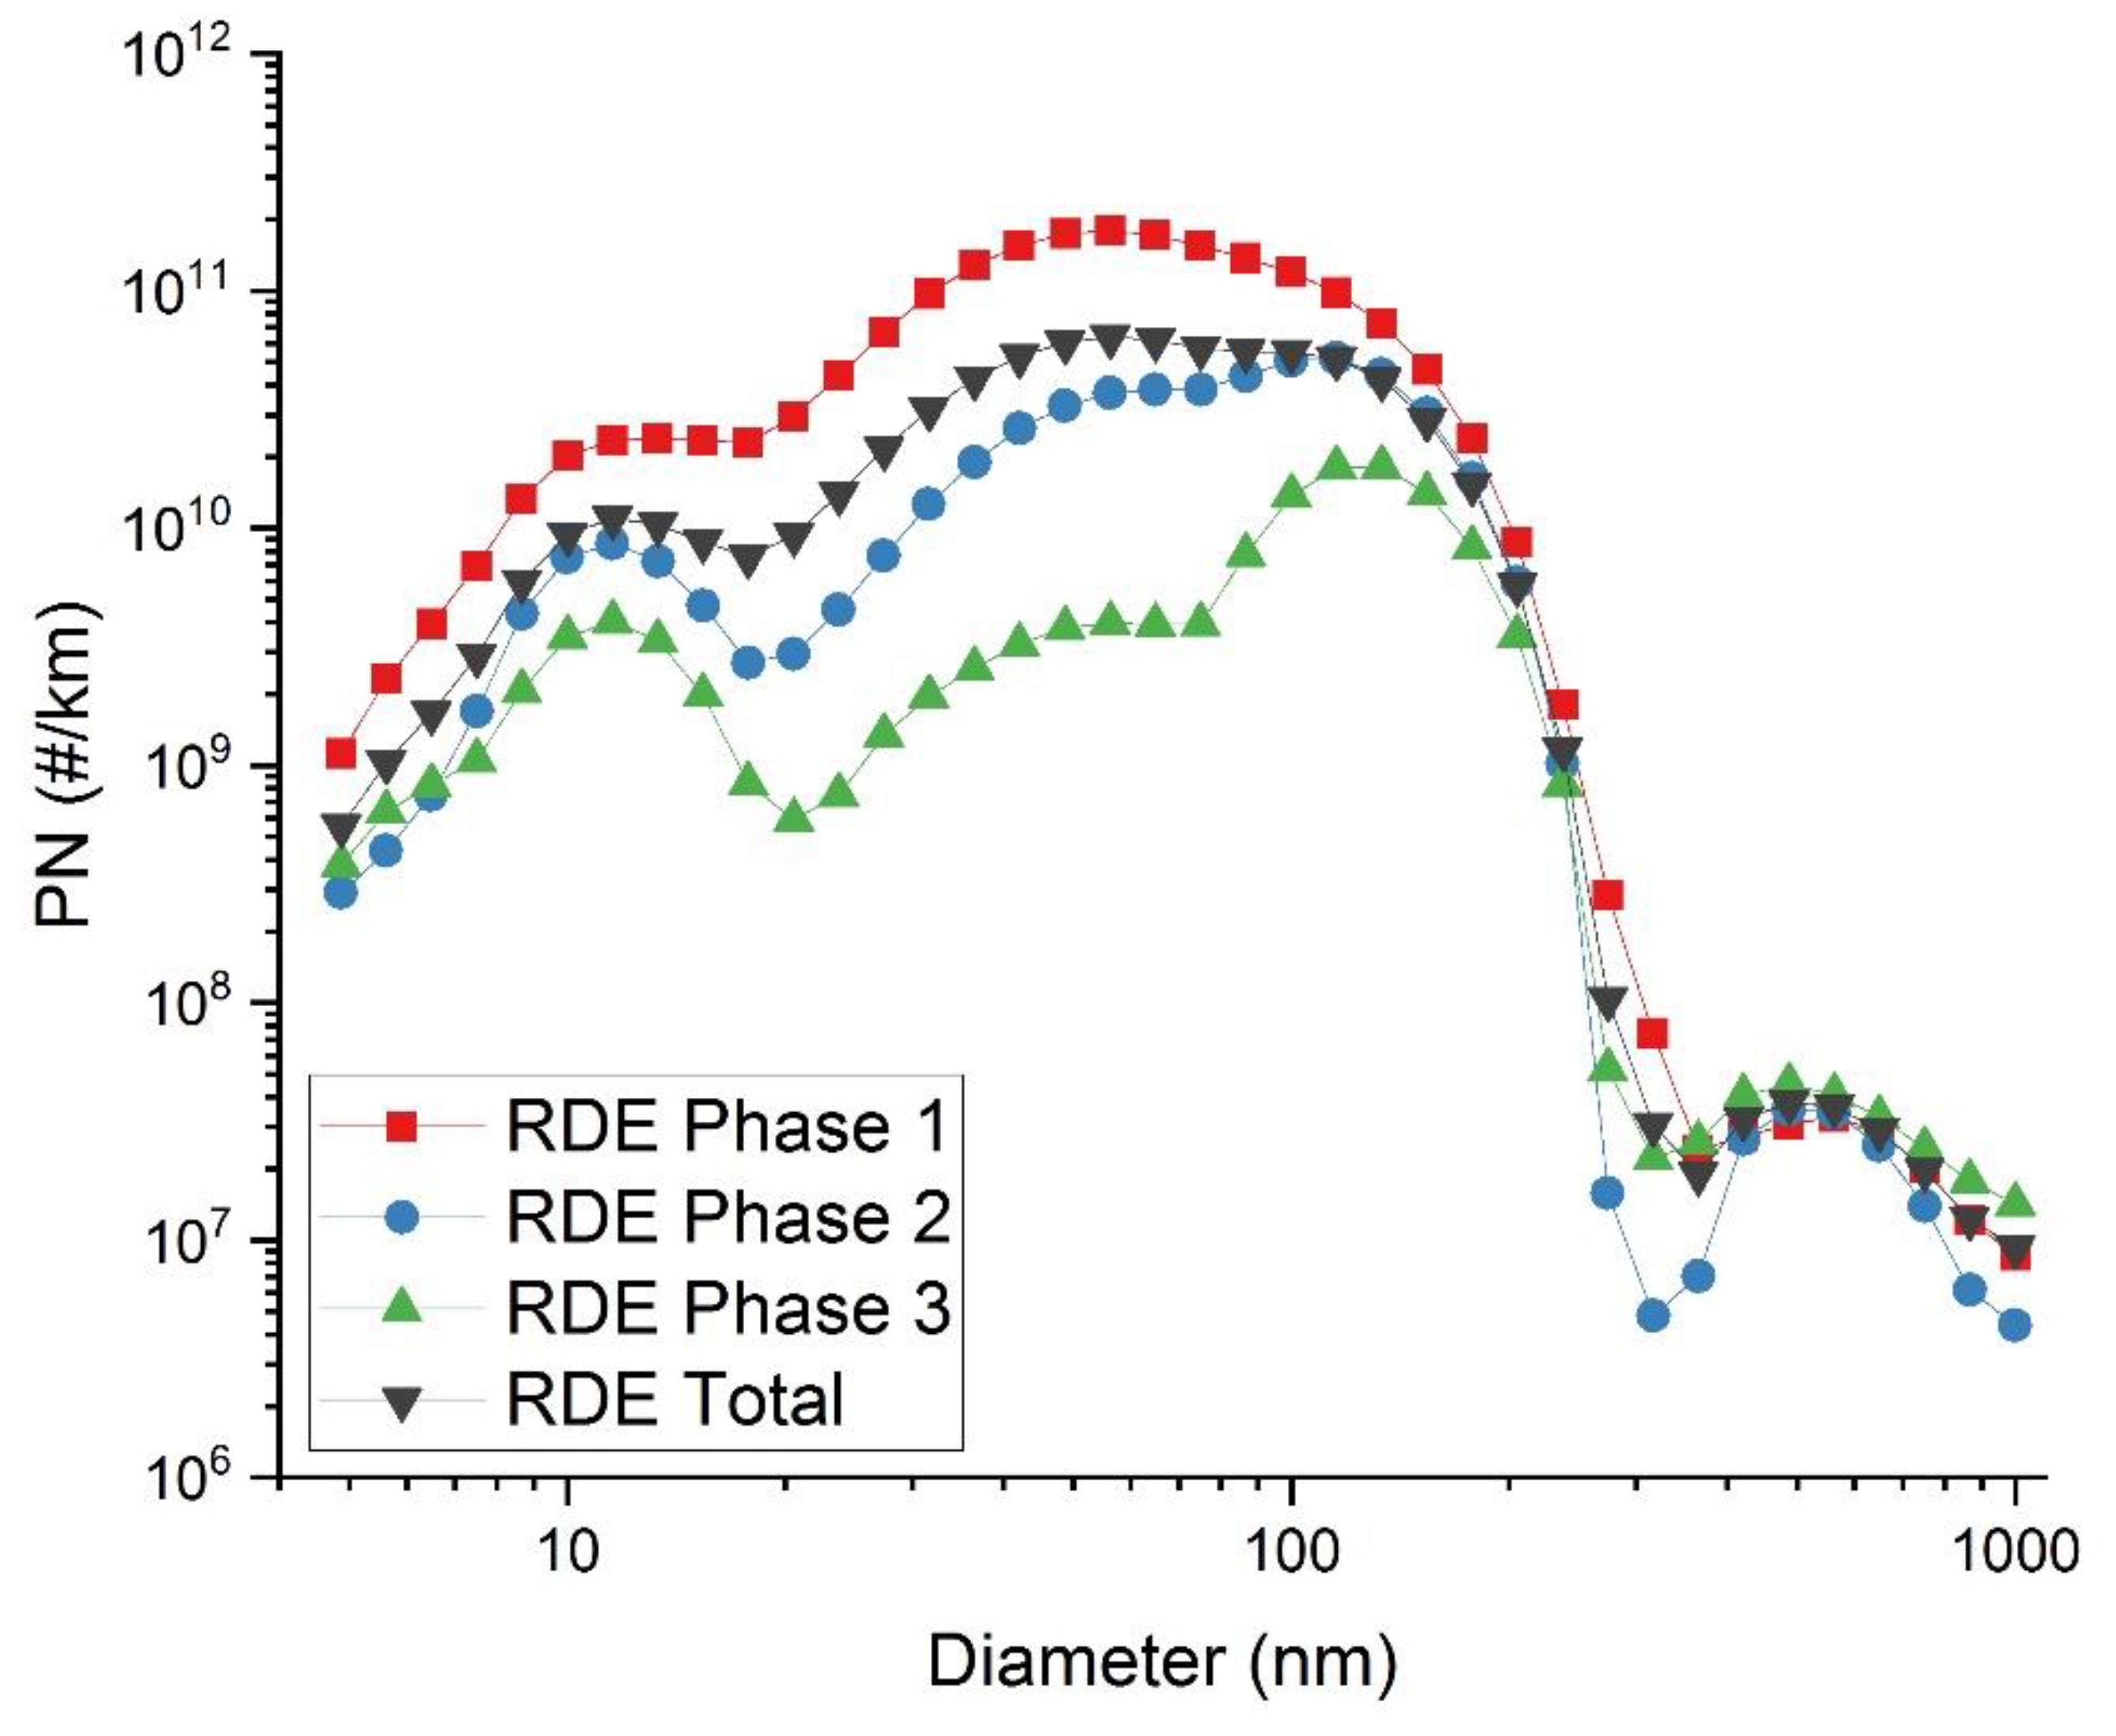
A composite “RDE-style cycle” was then created to allow cycle-average PNSD comparisons of an RDE cycle to be made against the WLTC. To do this, sections of the shortened RDE-style cycle were repeated in post-processing to build up a full-length RDE cycle. The shortened RDE-style cycle driven on the chassis dynamometer was from a warm start, and so phase 1 of the WLTC was incorporated into the beginning of the composite RDE-style test cycle to make it a cold start test. The resulting test cycle satisfied all of the dynamic requirements of the RDE package 4, as well as being within the moving averaging window tolerance (based on the CO
2 characteristic curve values resulting from the average of the legislative WLTC tests described above). The original speed profile of the shortened RDE-style cycle driven on the chassis dynamometer is given in
Figure 2a and the RDE-style cycle from which cycle-average PNSD values were attained is given in
Figure 2b. The urban, rural and motorway sections are referred to as “phase 1”, “phase 2” and “phase 3” respectively throughout this paper, unless otherwise stated.
Properties of the composite RDE-style cycle and the WLTC cycle are given in
Table 2. To enable easy comparison between tests the characterisations of “urban”, “rural” and “motorway” are used in
Table 2 for both WLTC and RDE, according to the definitions of the RDE legislation:
Urban: vehicle speed ≤ 60 km/h,
Rural: 60 km/h < vehicle speed ≤ 90 km/h,
Motorway: vehicle speed > 90 km/h.
2.4. Data Processing
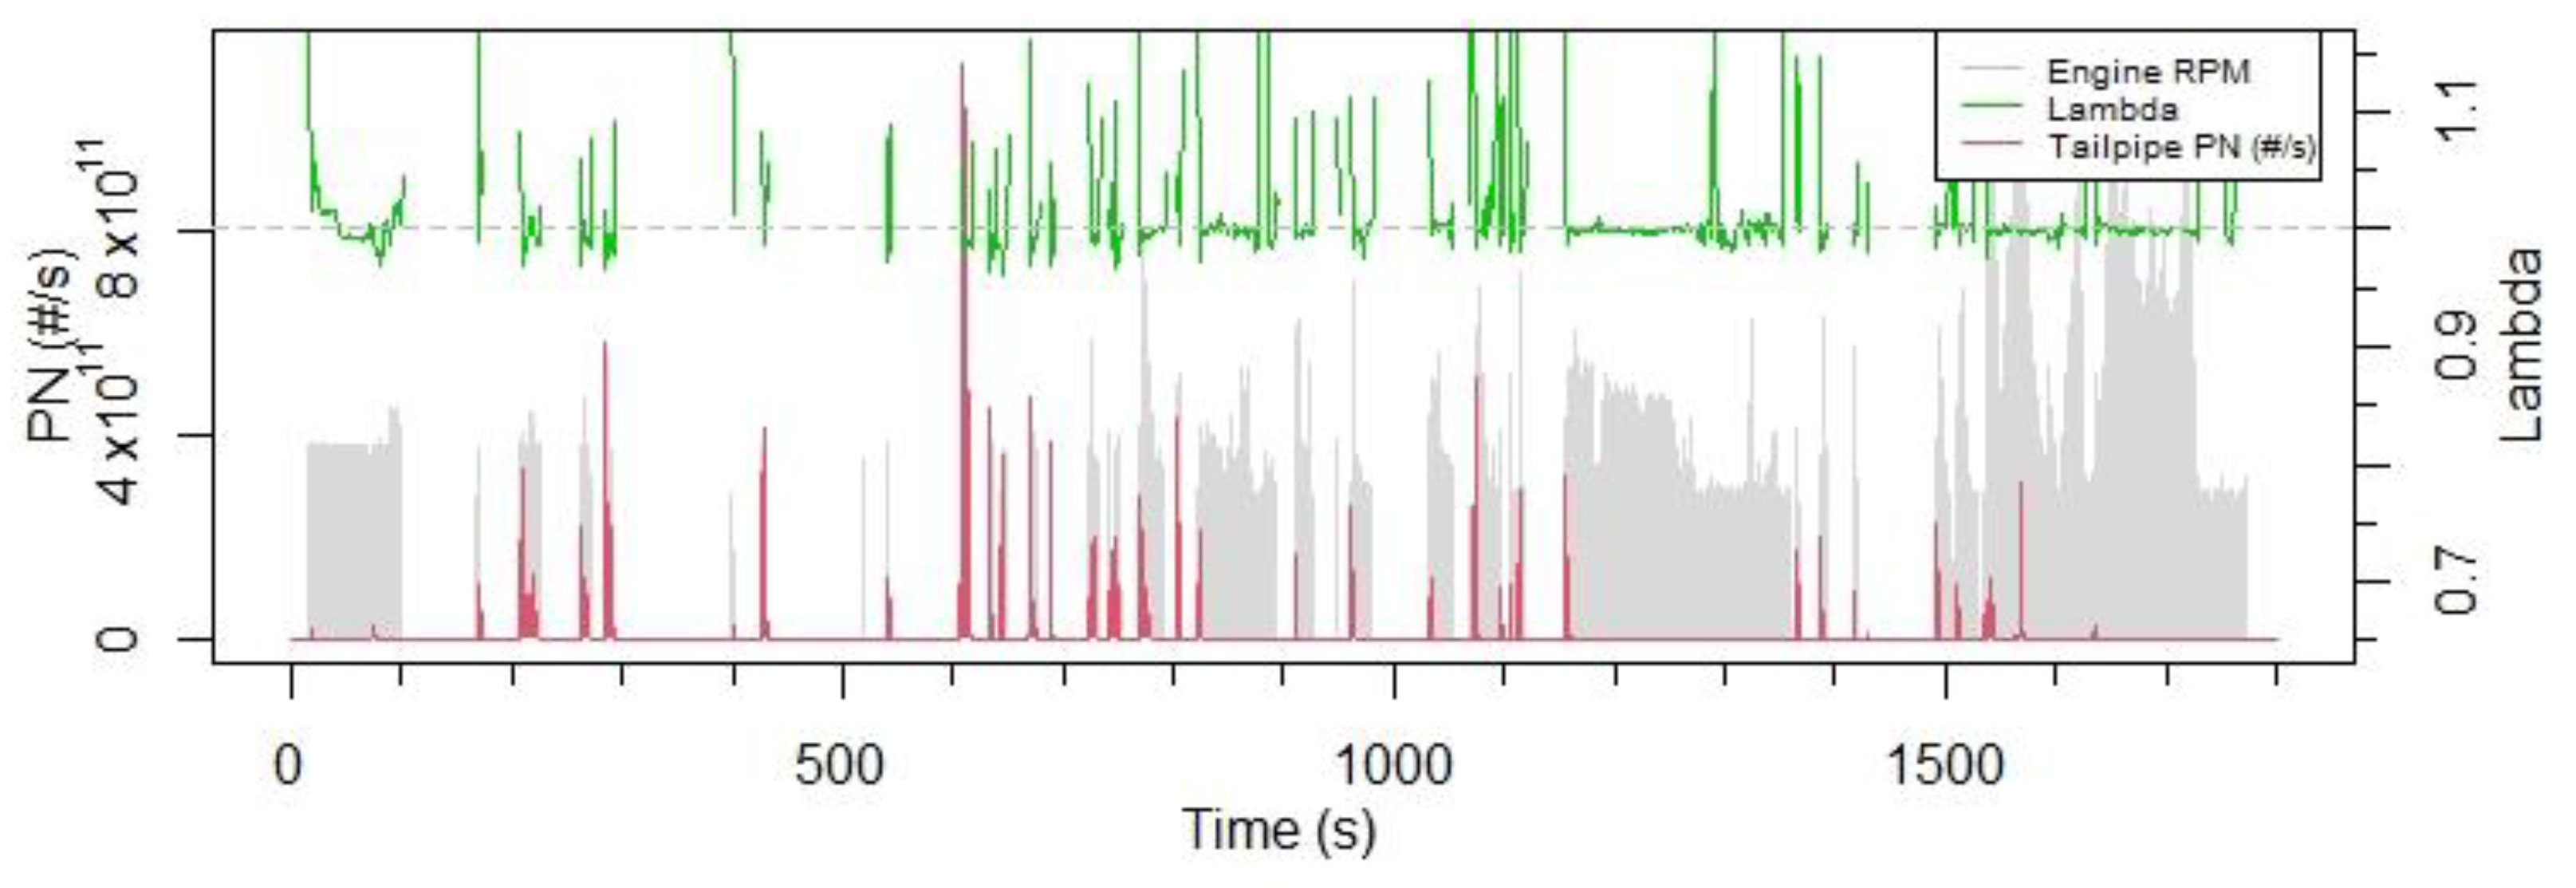
The chassis dynamometer test cell in-house equipment was automatically time aligned. The data from the ECU was aligned to this via matching of the exhaust flow rates calculated for each (and checked by comparing vehicle velocity traces). The Horiba OBS-1000 was then aligned to these using the exhaust flow rate measurement. The thermocouple exhaust temperatures and DMS500 PN values were aligned to the engine speed (RPM) from the ECU, matching signal increases for both the engine start and engine restart events, as indicated by the RPM signal.
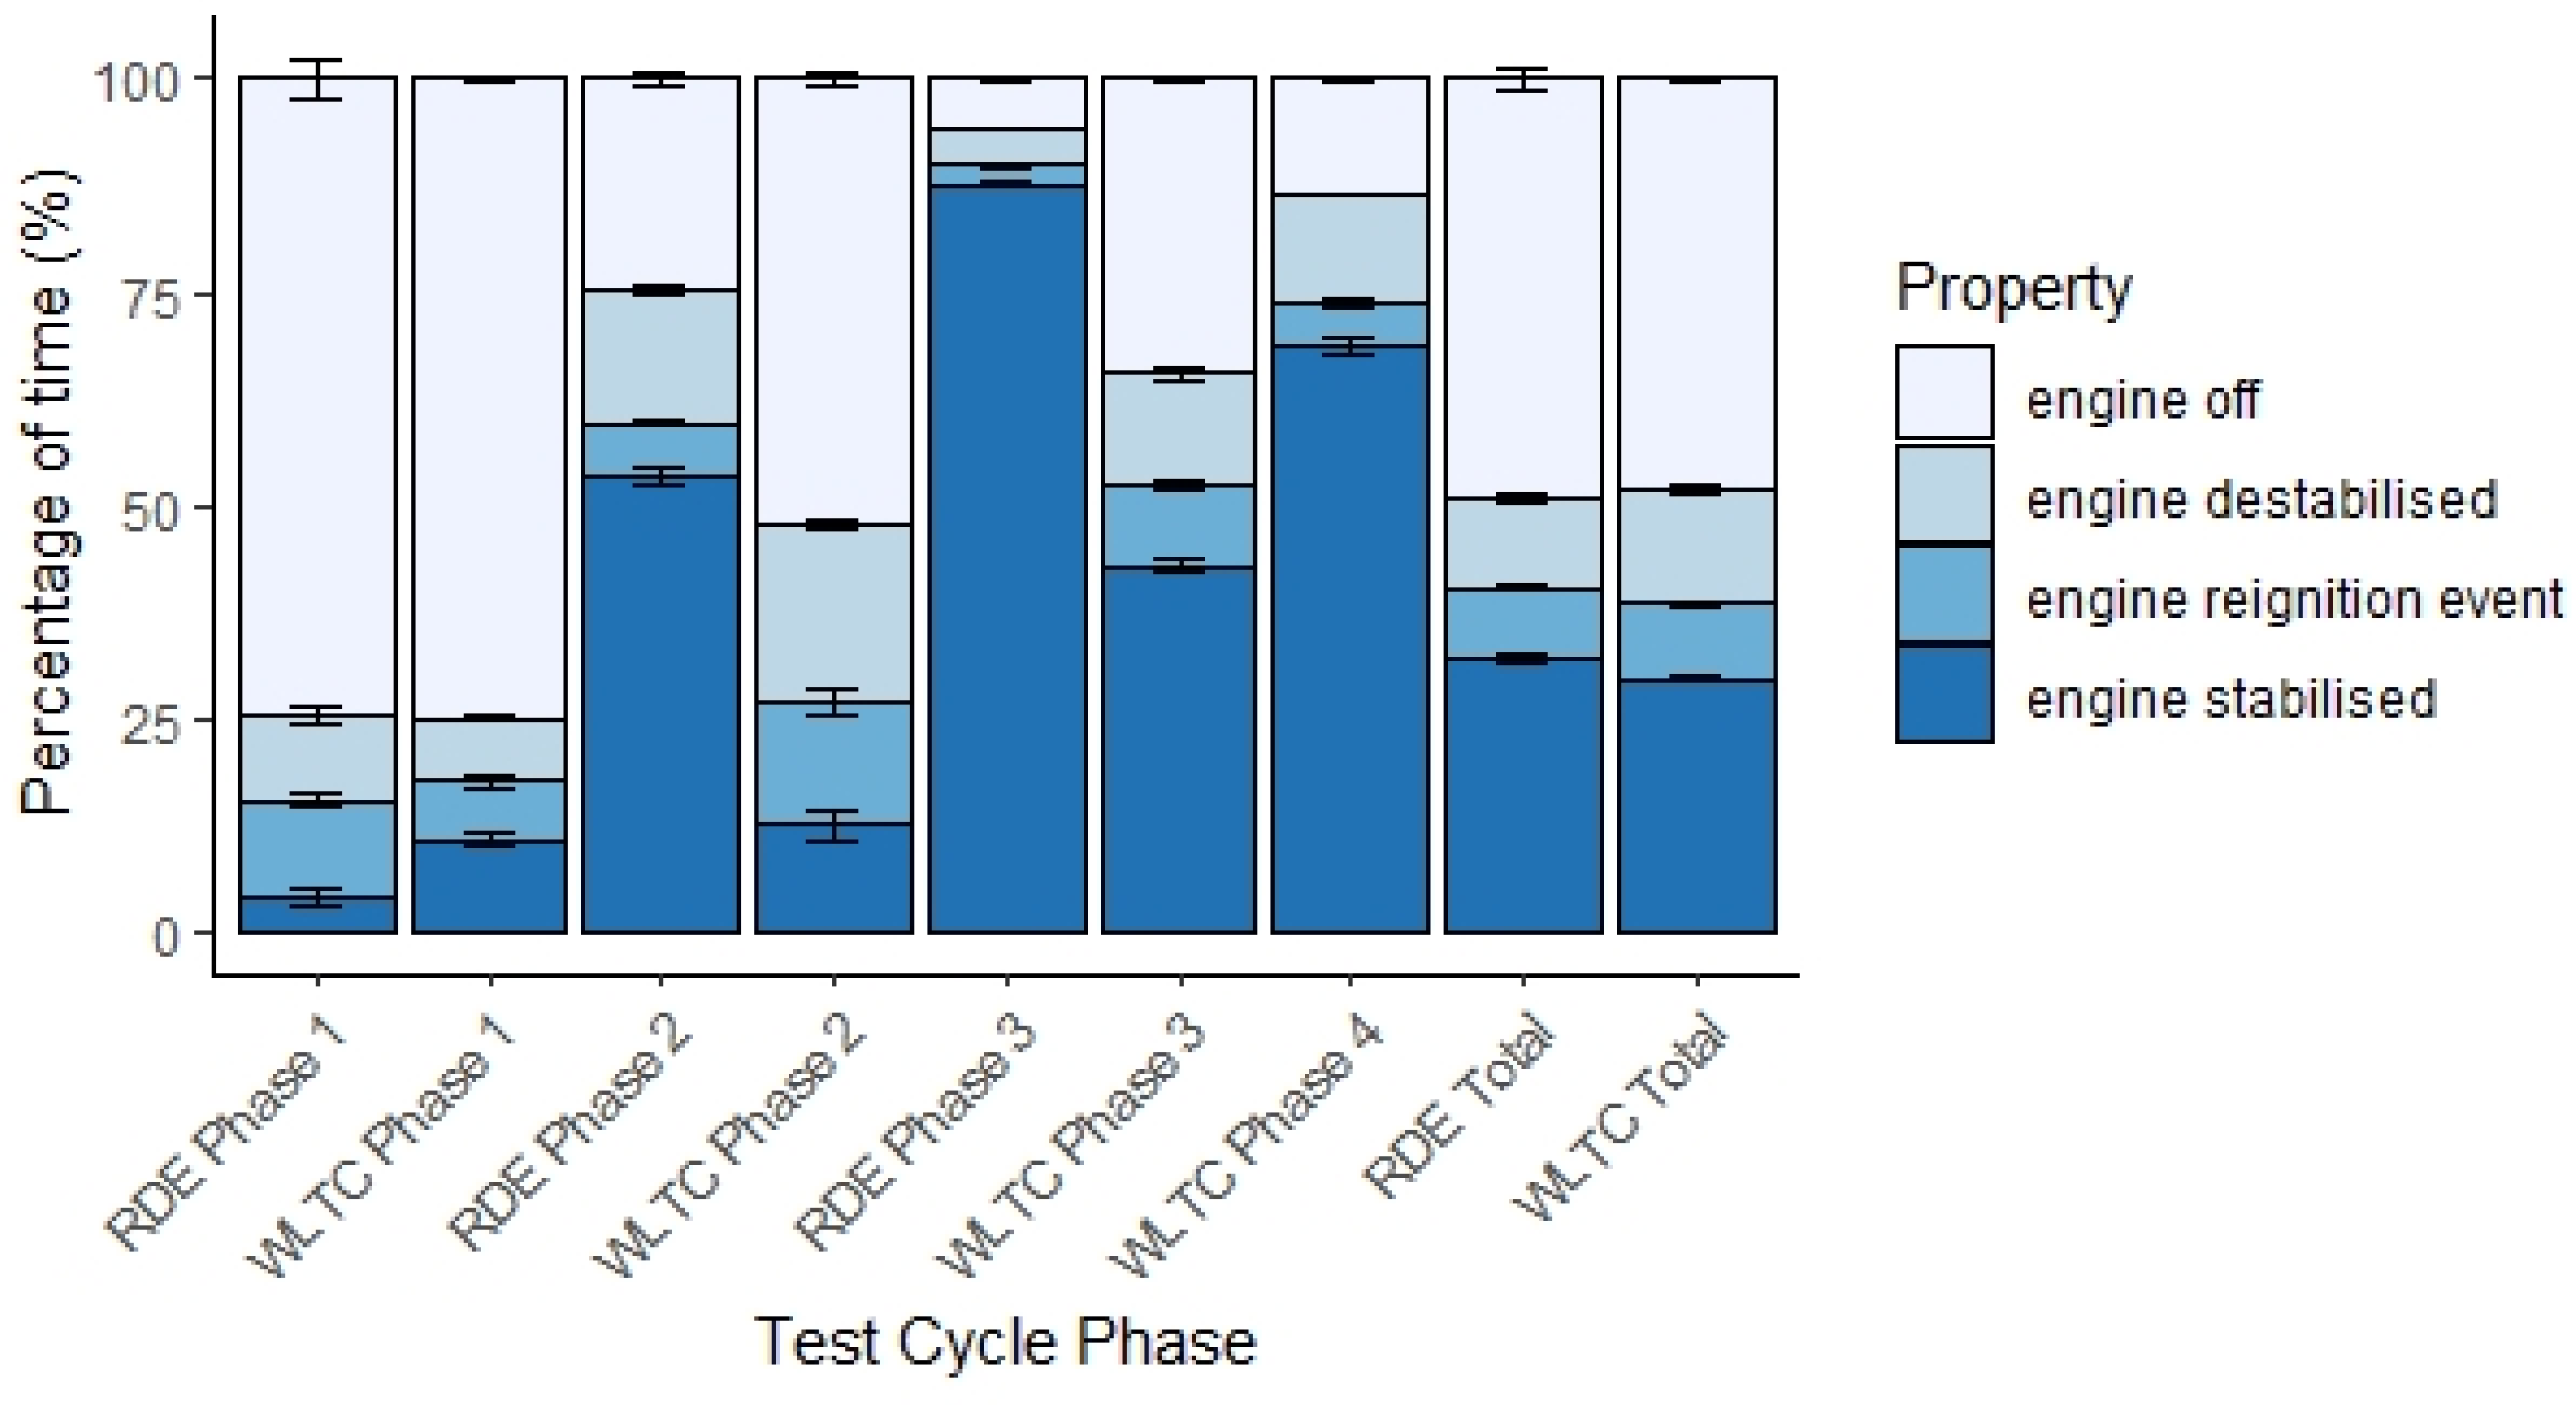
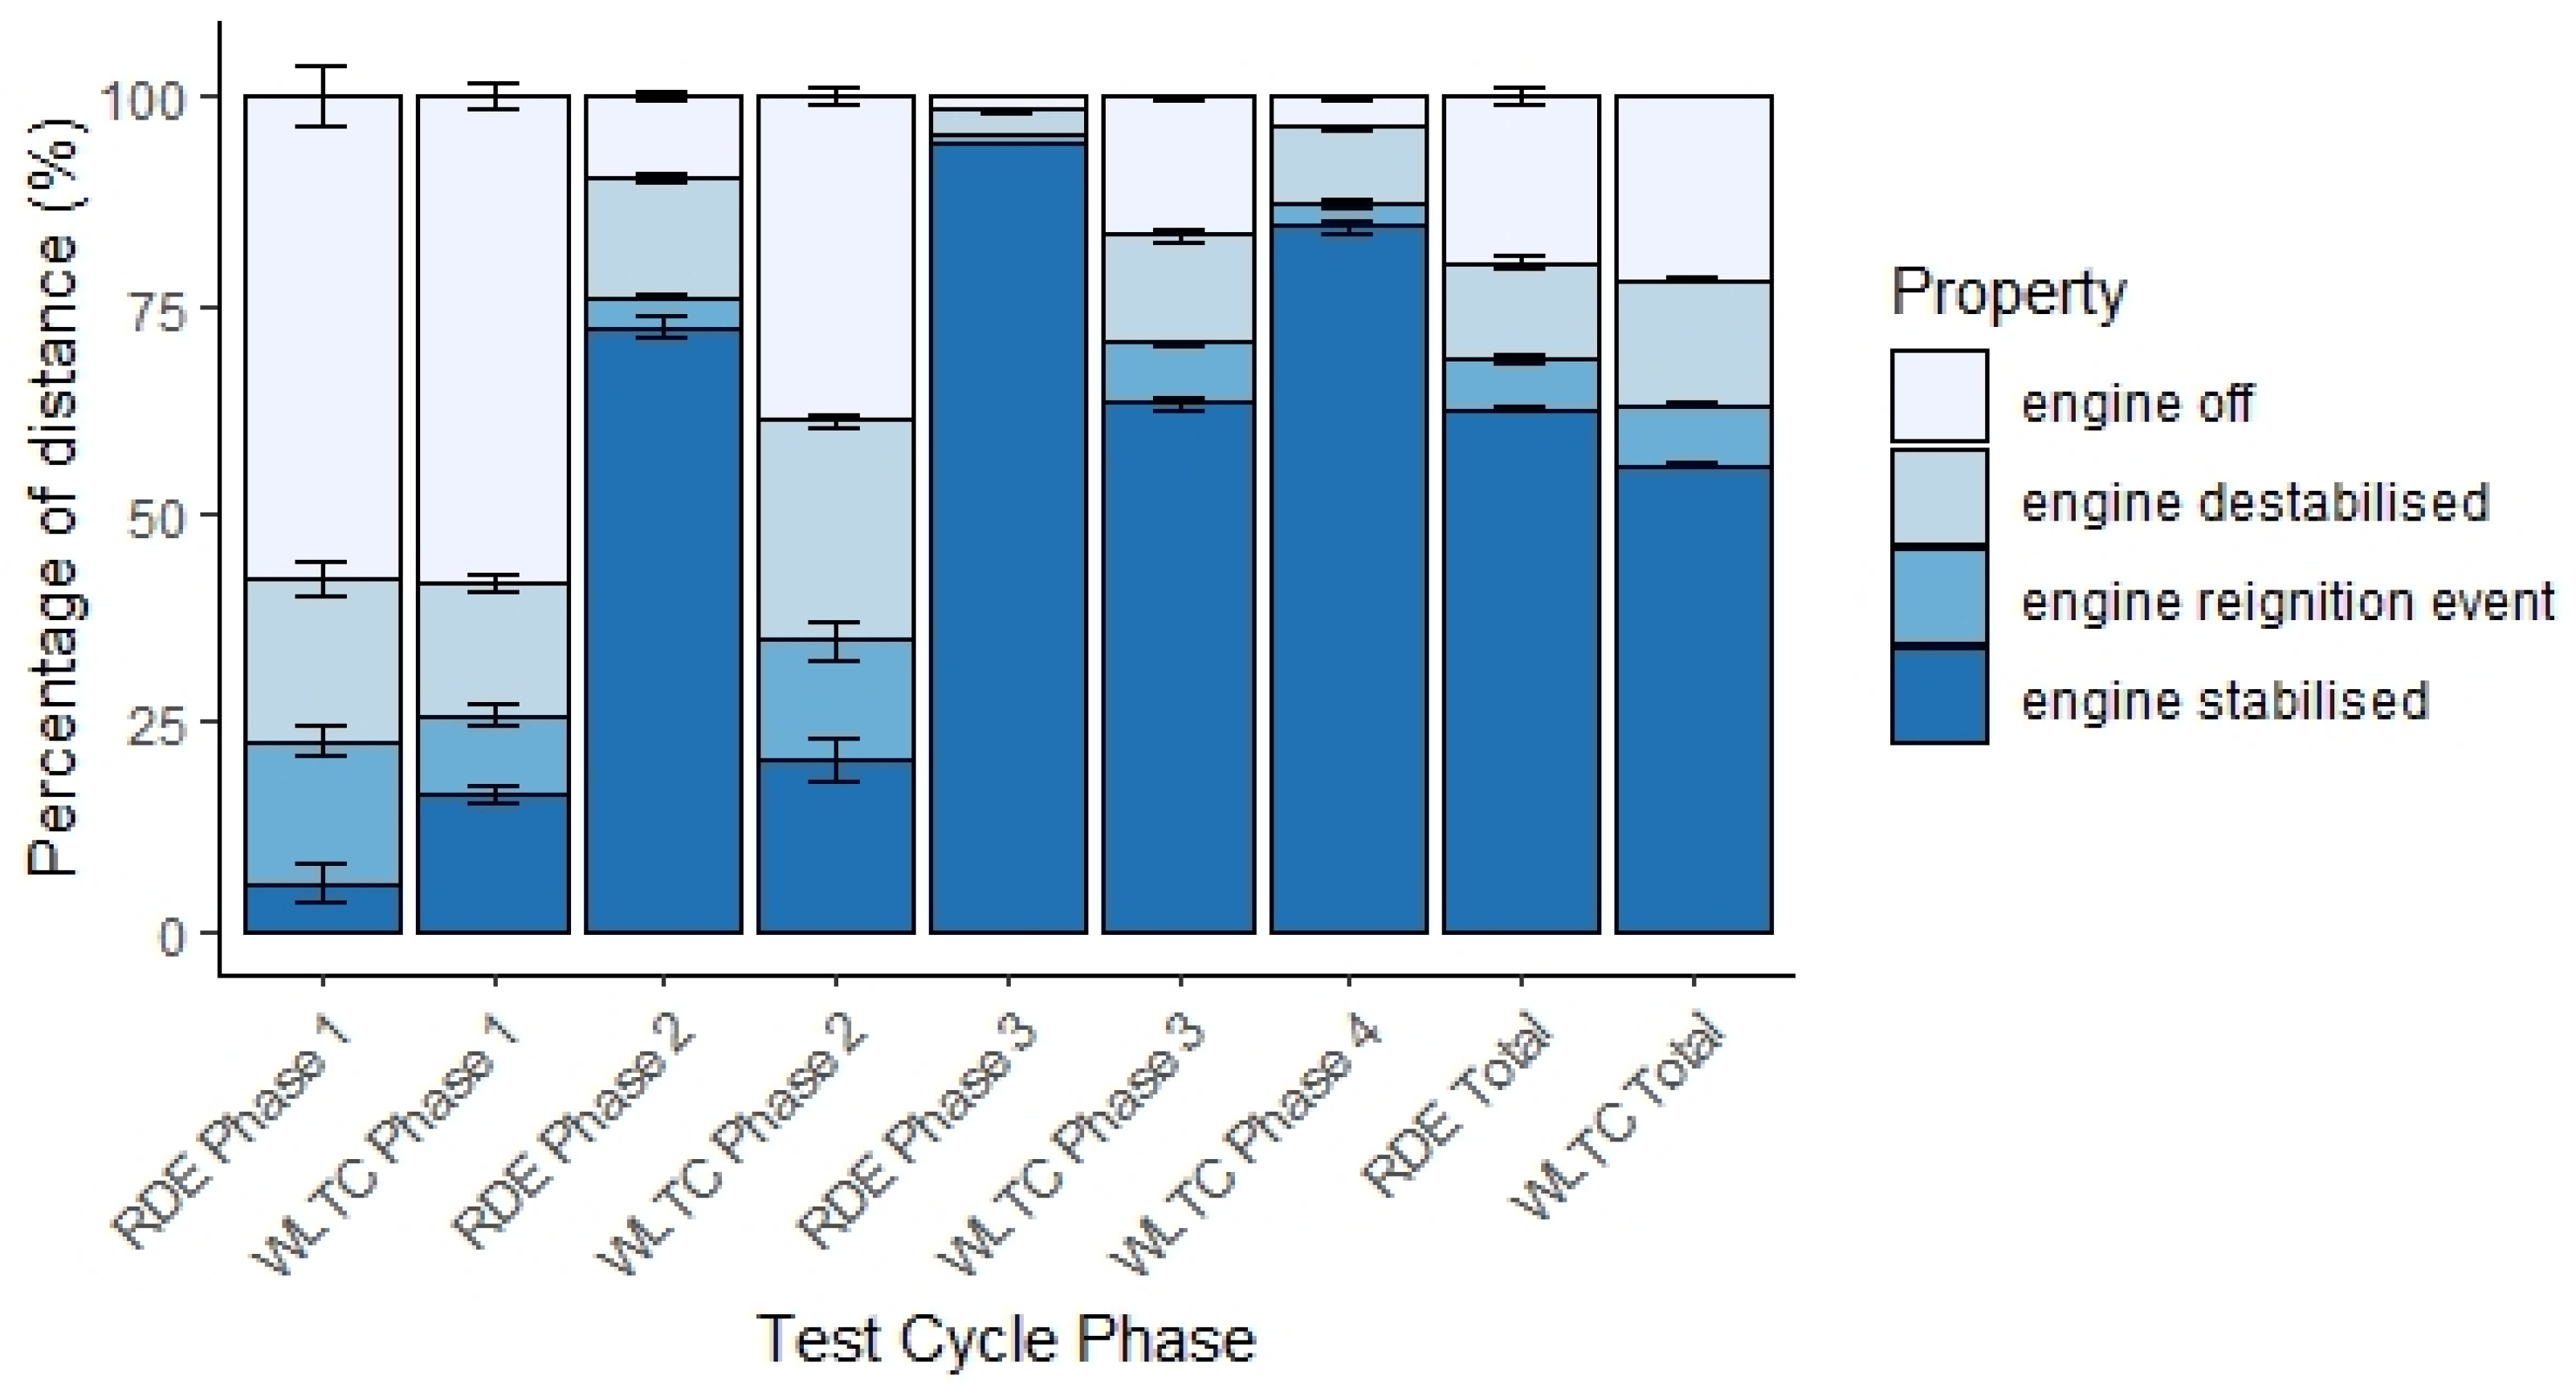
The emission rates of the DMS500 particle number (#/s) were calculated as the product of the number concentration and the tailpipe exhaust flow rate. The size-distributed concentration values were first converted to size-distributed PN emission rates. The data was then categorised into four engine-mode operations. “Engine off” was categorised as any portion of time with engine speed below 500 rpm. “Engine re-ignition event” was categorised as the four seconds with engine speed higher than 500 rpm after a period in “engine off” mode. “Engine stabilised” was categorised as any period of engine speed above 800 pm that was more than 10 s from an engine speed lower than 500 rpm. “Engine destabilised” represented all other engine states, i.e., any period 5–10 s after engine ignition or re-ignition and the 10 s before an engine off event, or any other period with engine speed between 500–800 rpm.
4. Conclusions
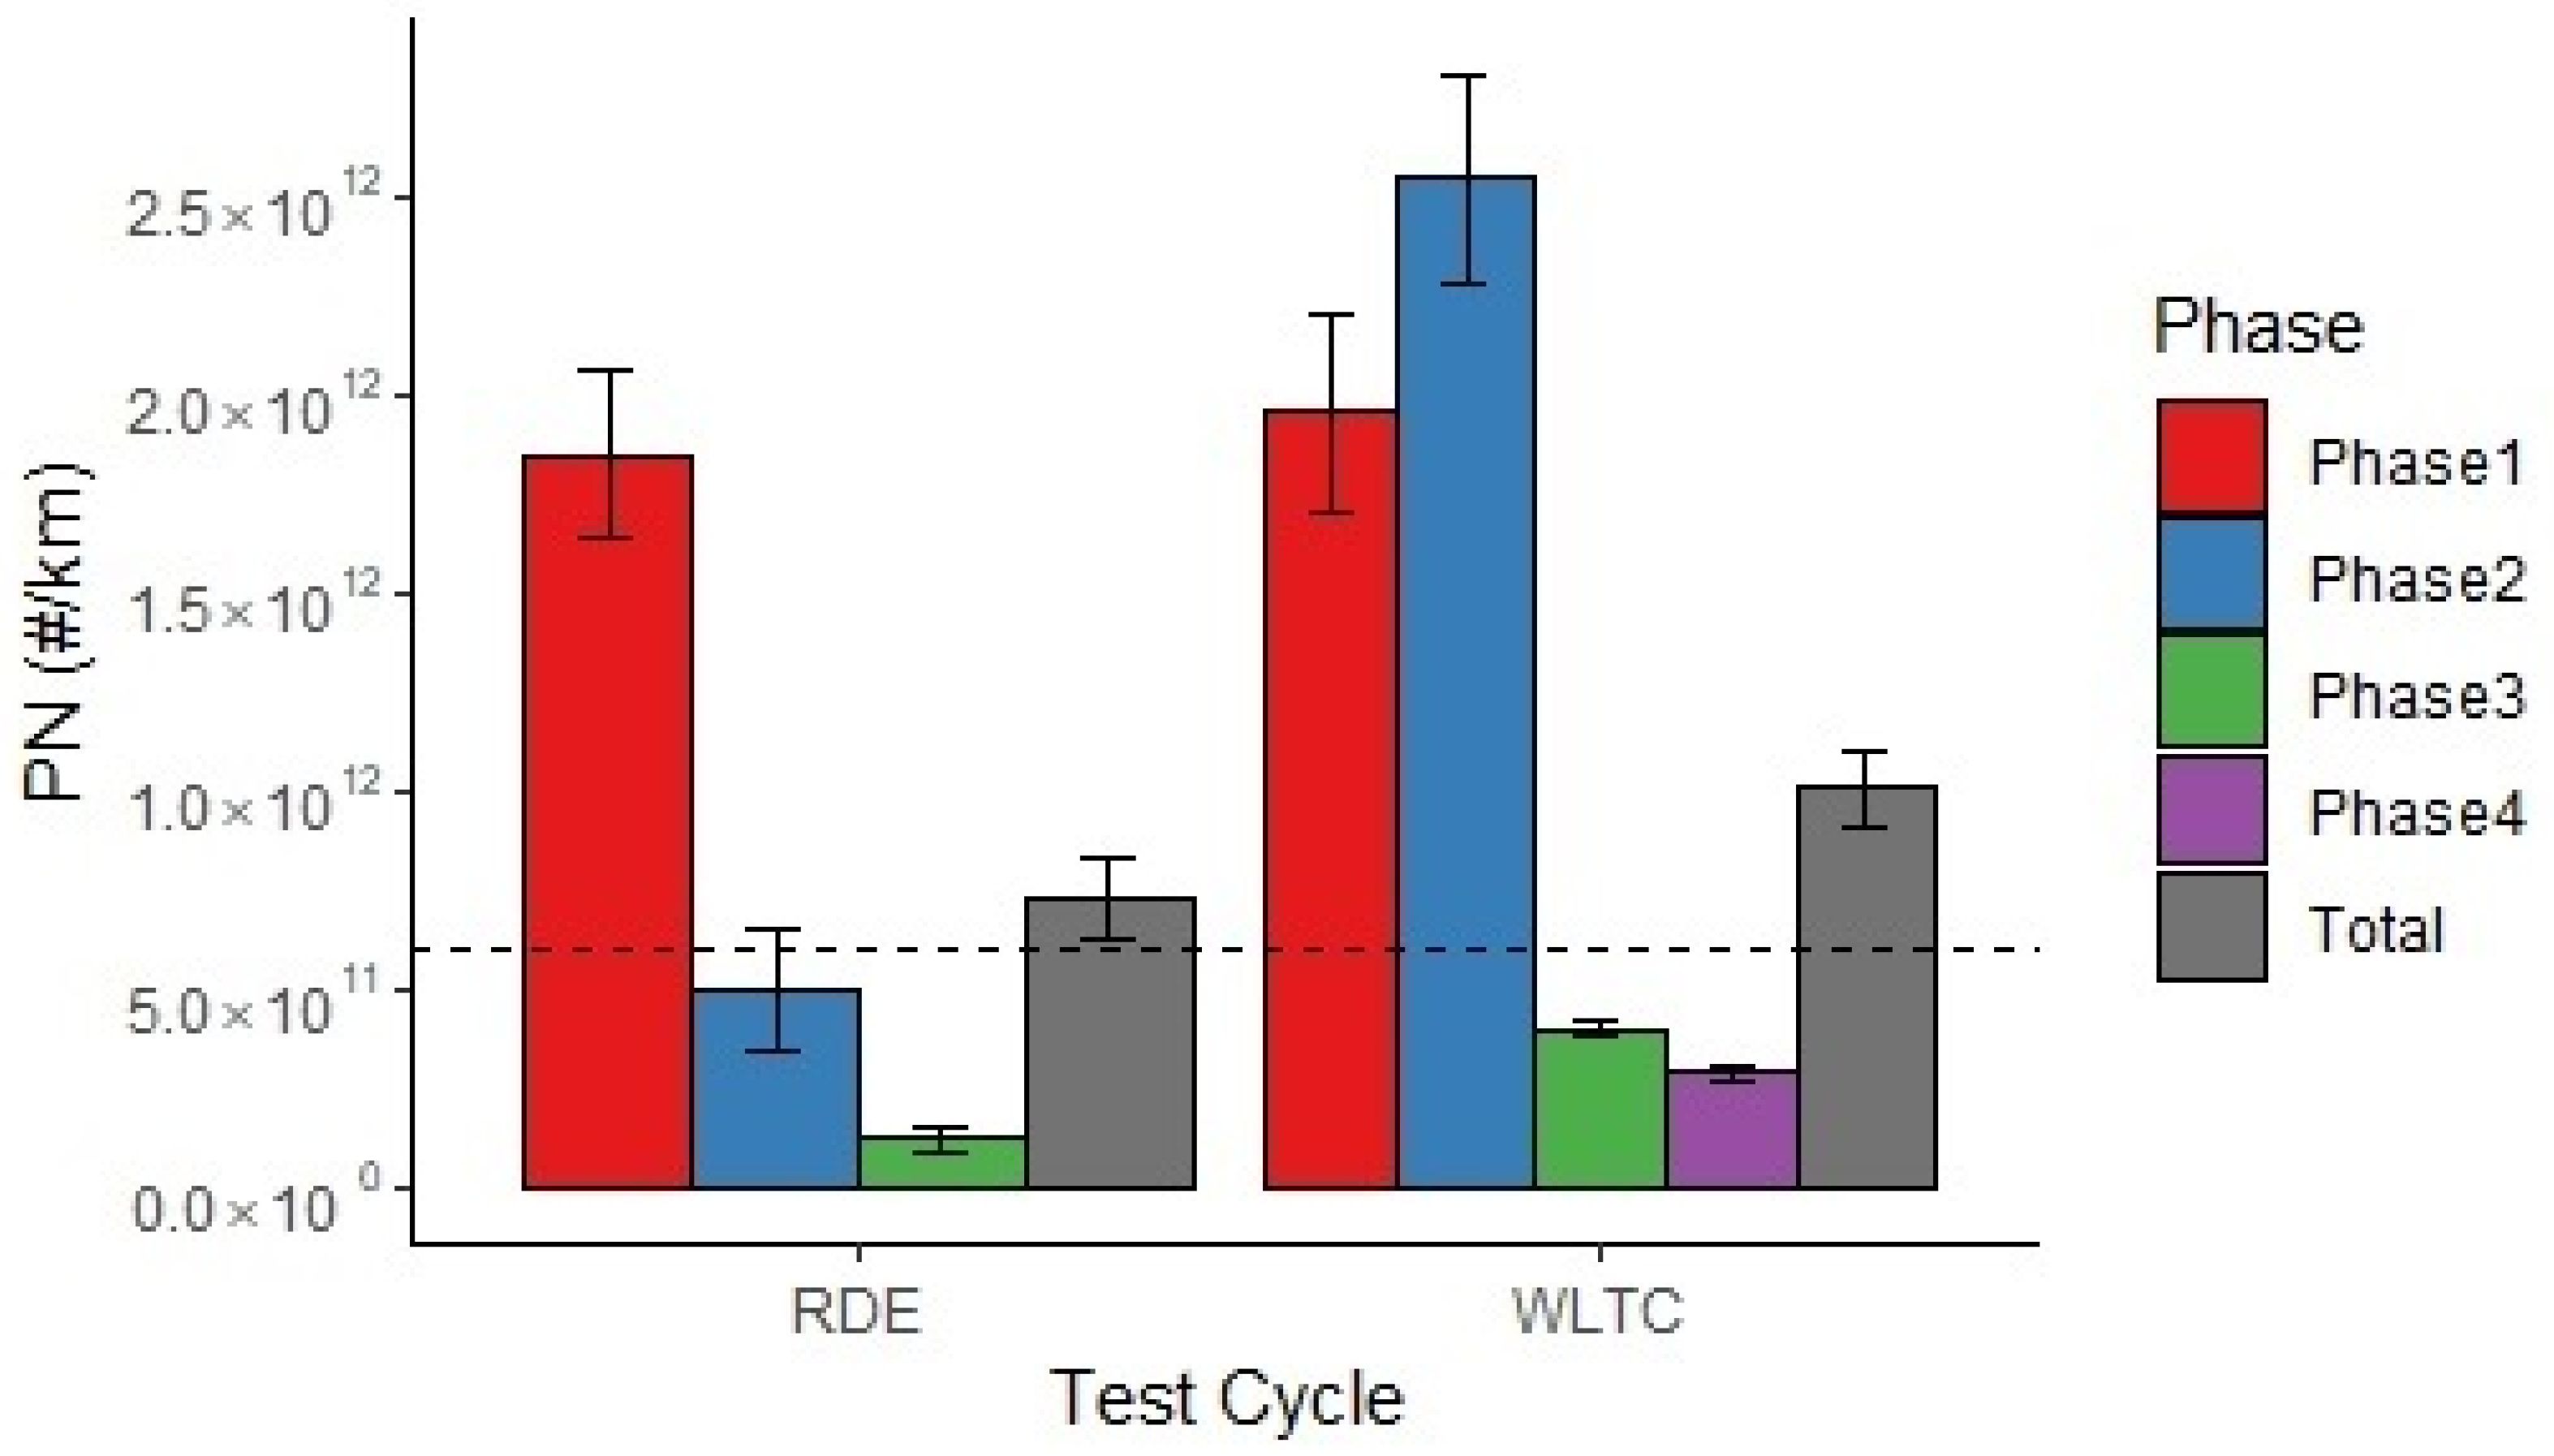
This paper has studied the effects of drive cycle properties on the engine behaviour of an HEV and investigated how this impacts the tailpipe PN emissions and their PNSD. The number of vehicle stops has a large impact on increasing the reported PN emission factors. The overall PN emission factors for both RDE and WLTC testing are 7.3 × 10
11 #/km and 1 × 10
12 #/km, respectively; above the Euro 6 limit (6 × 10
11 #/km) for this HEV (note, however that this is a Euro 5 HEV). The urban section of the RDE test gave an emission factor of 1.8 × 10
12 #/km; above the current RDE not-to-exceed (NTE) limit (9 × 10
11 #/km). These trends support the findings of Yang et al. [
4] and indicate that HEV PN emissions should be more carefully monitored and considered in future regulations.
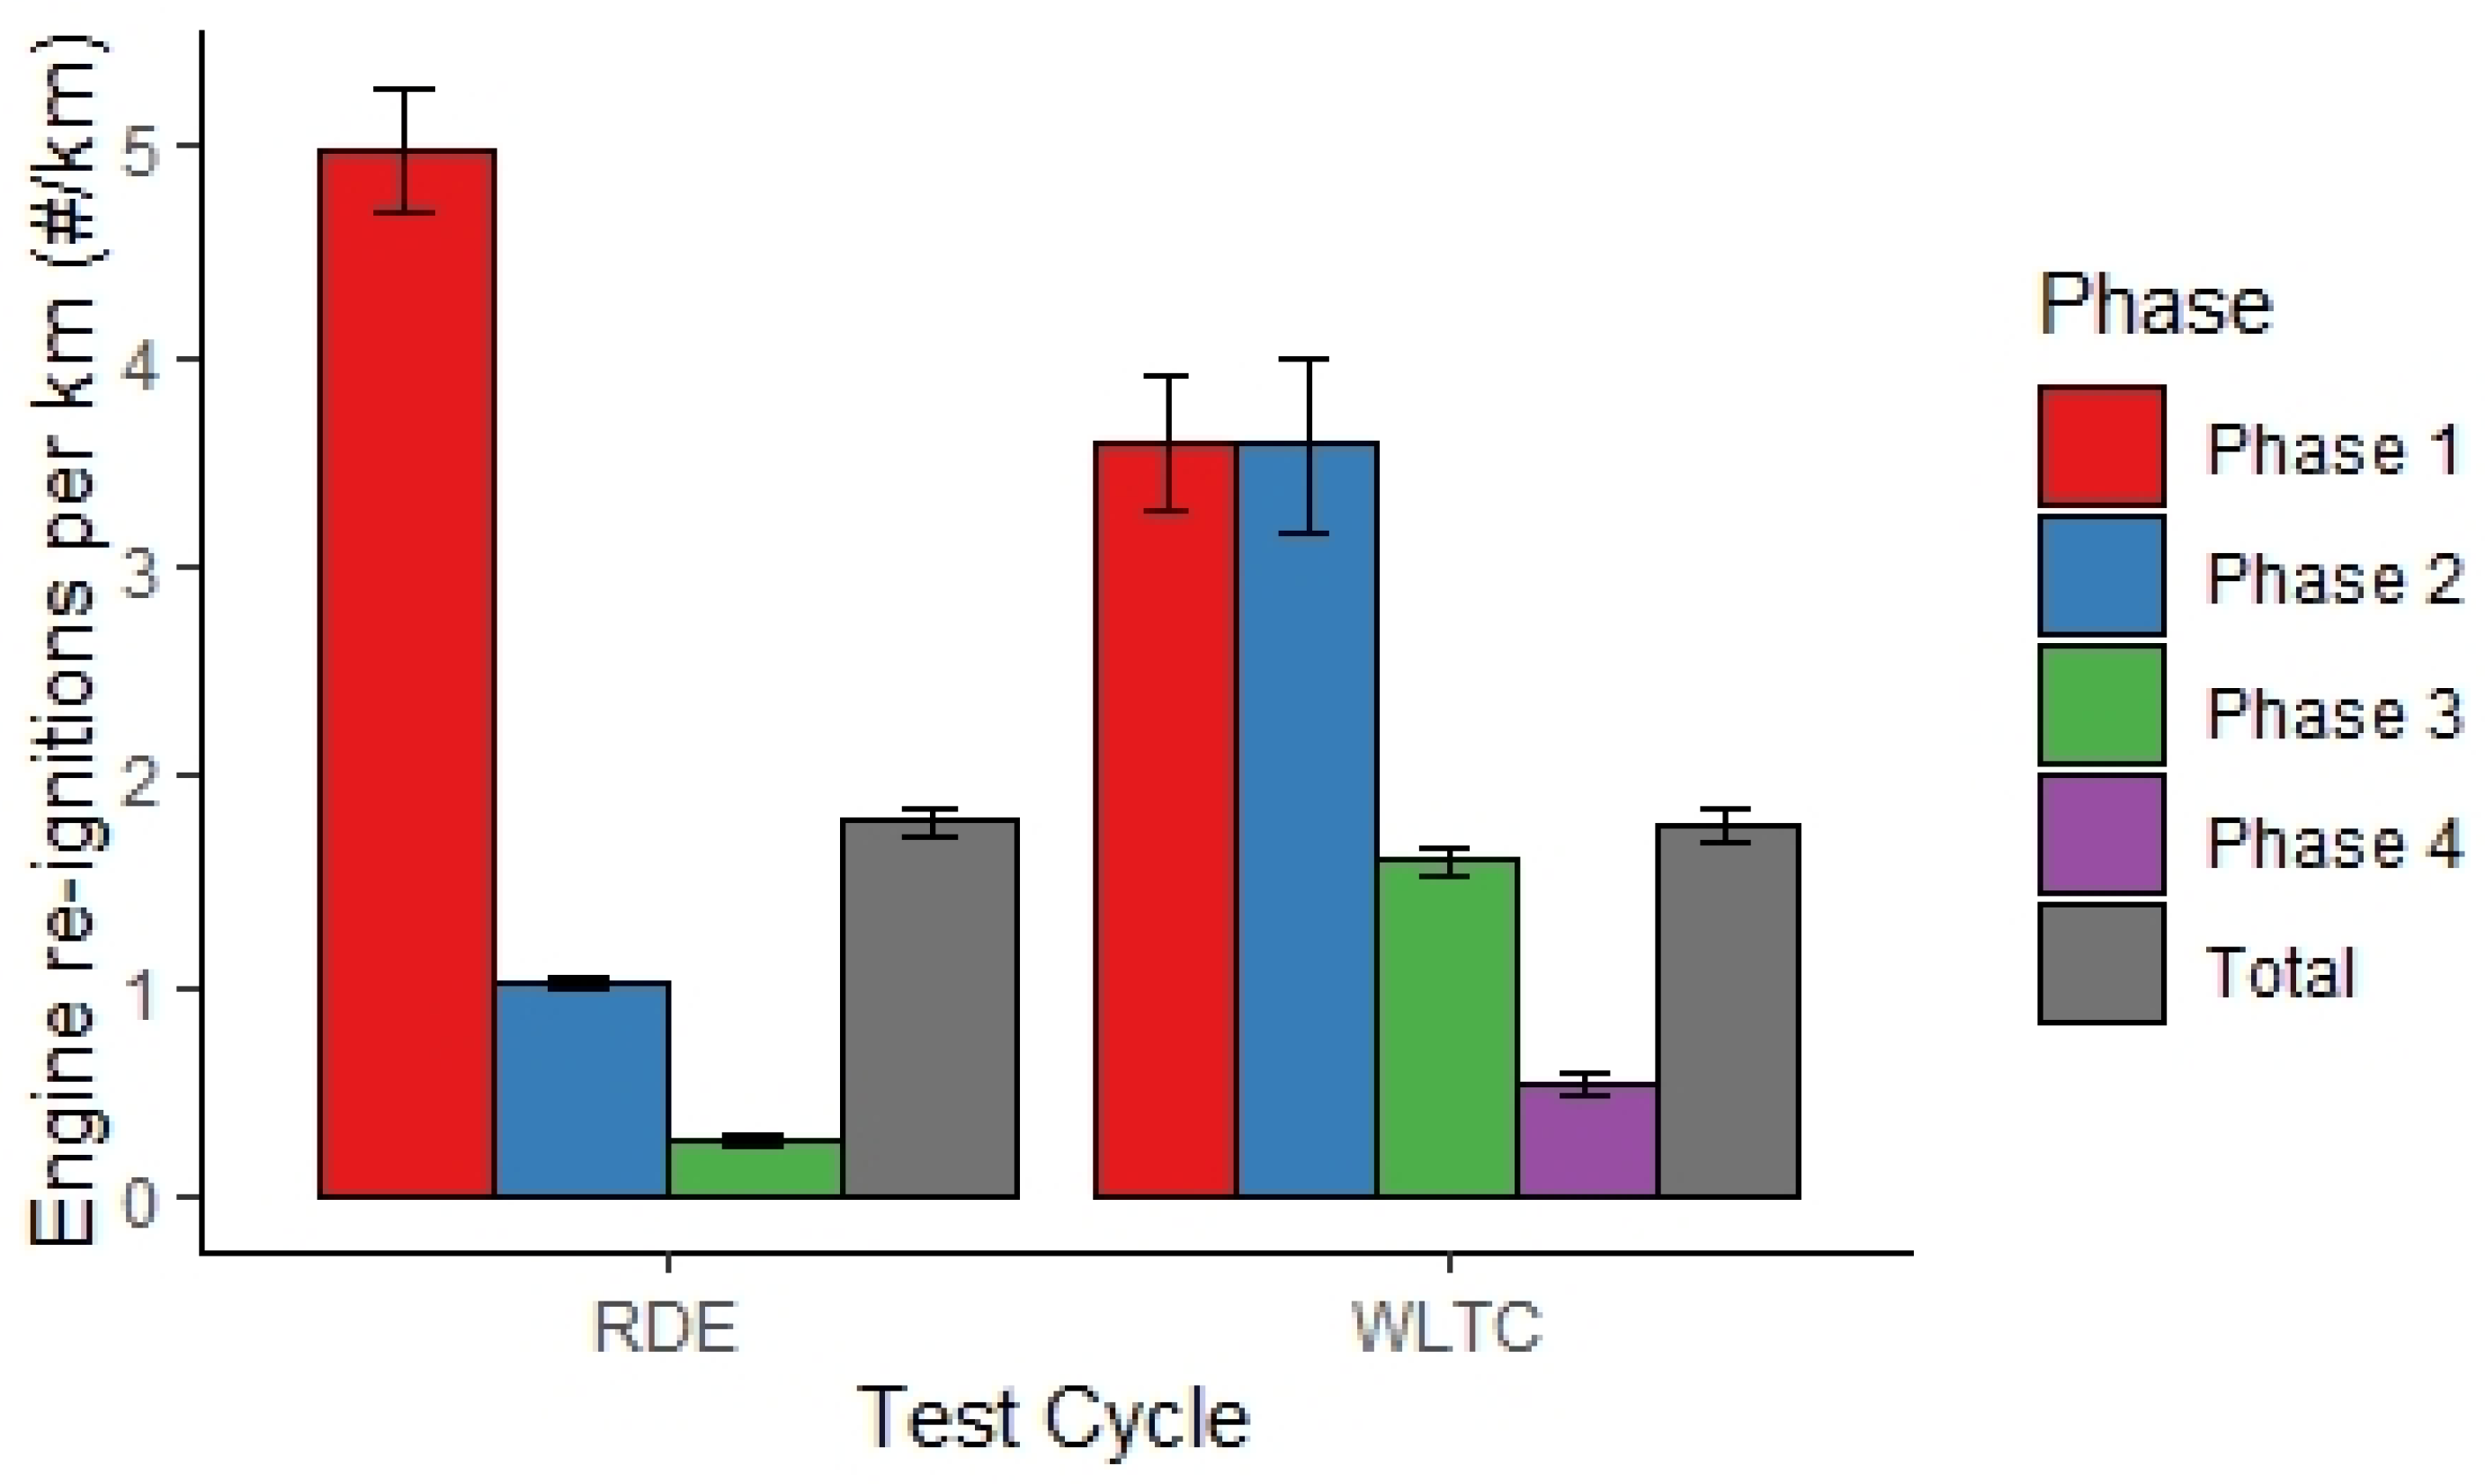
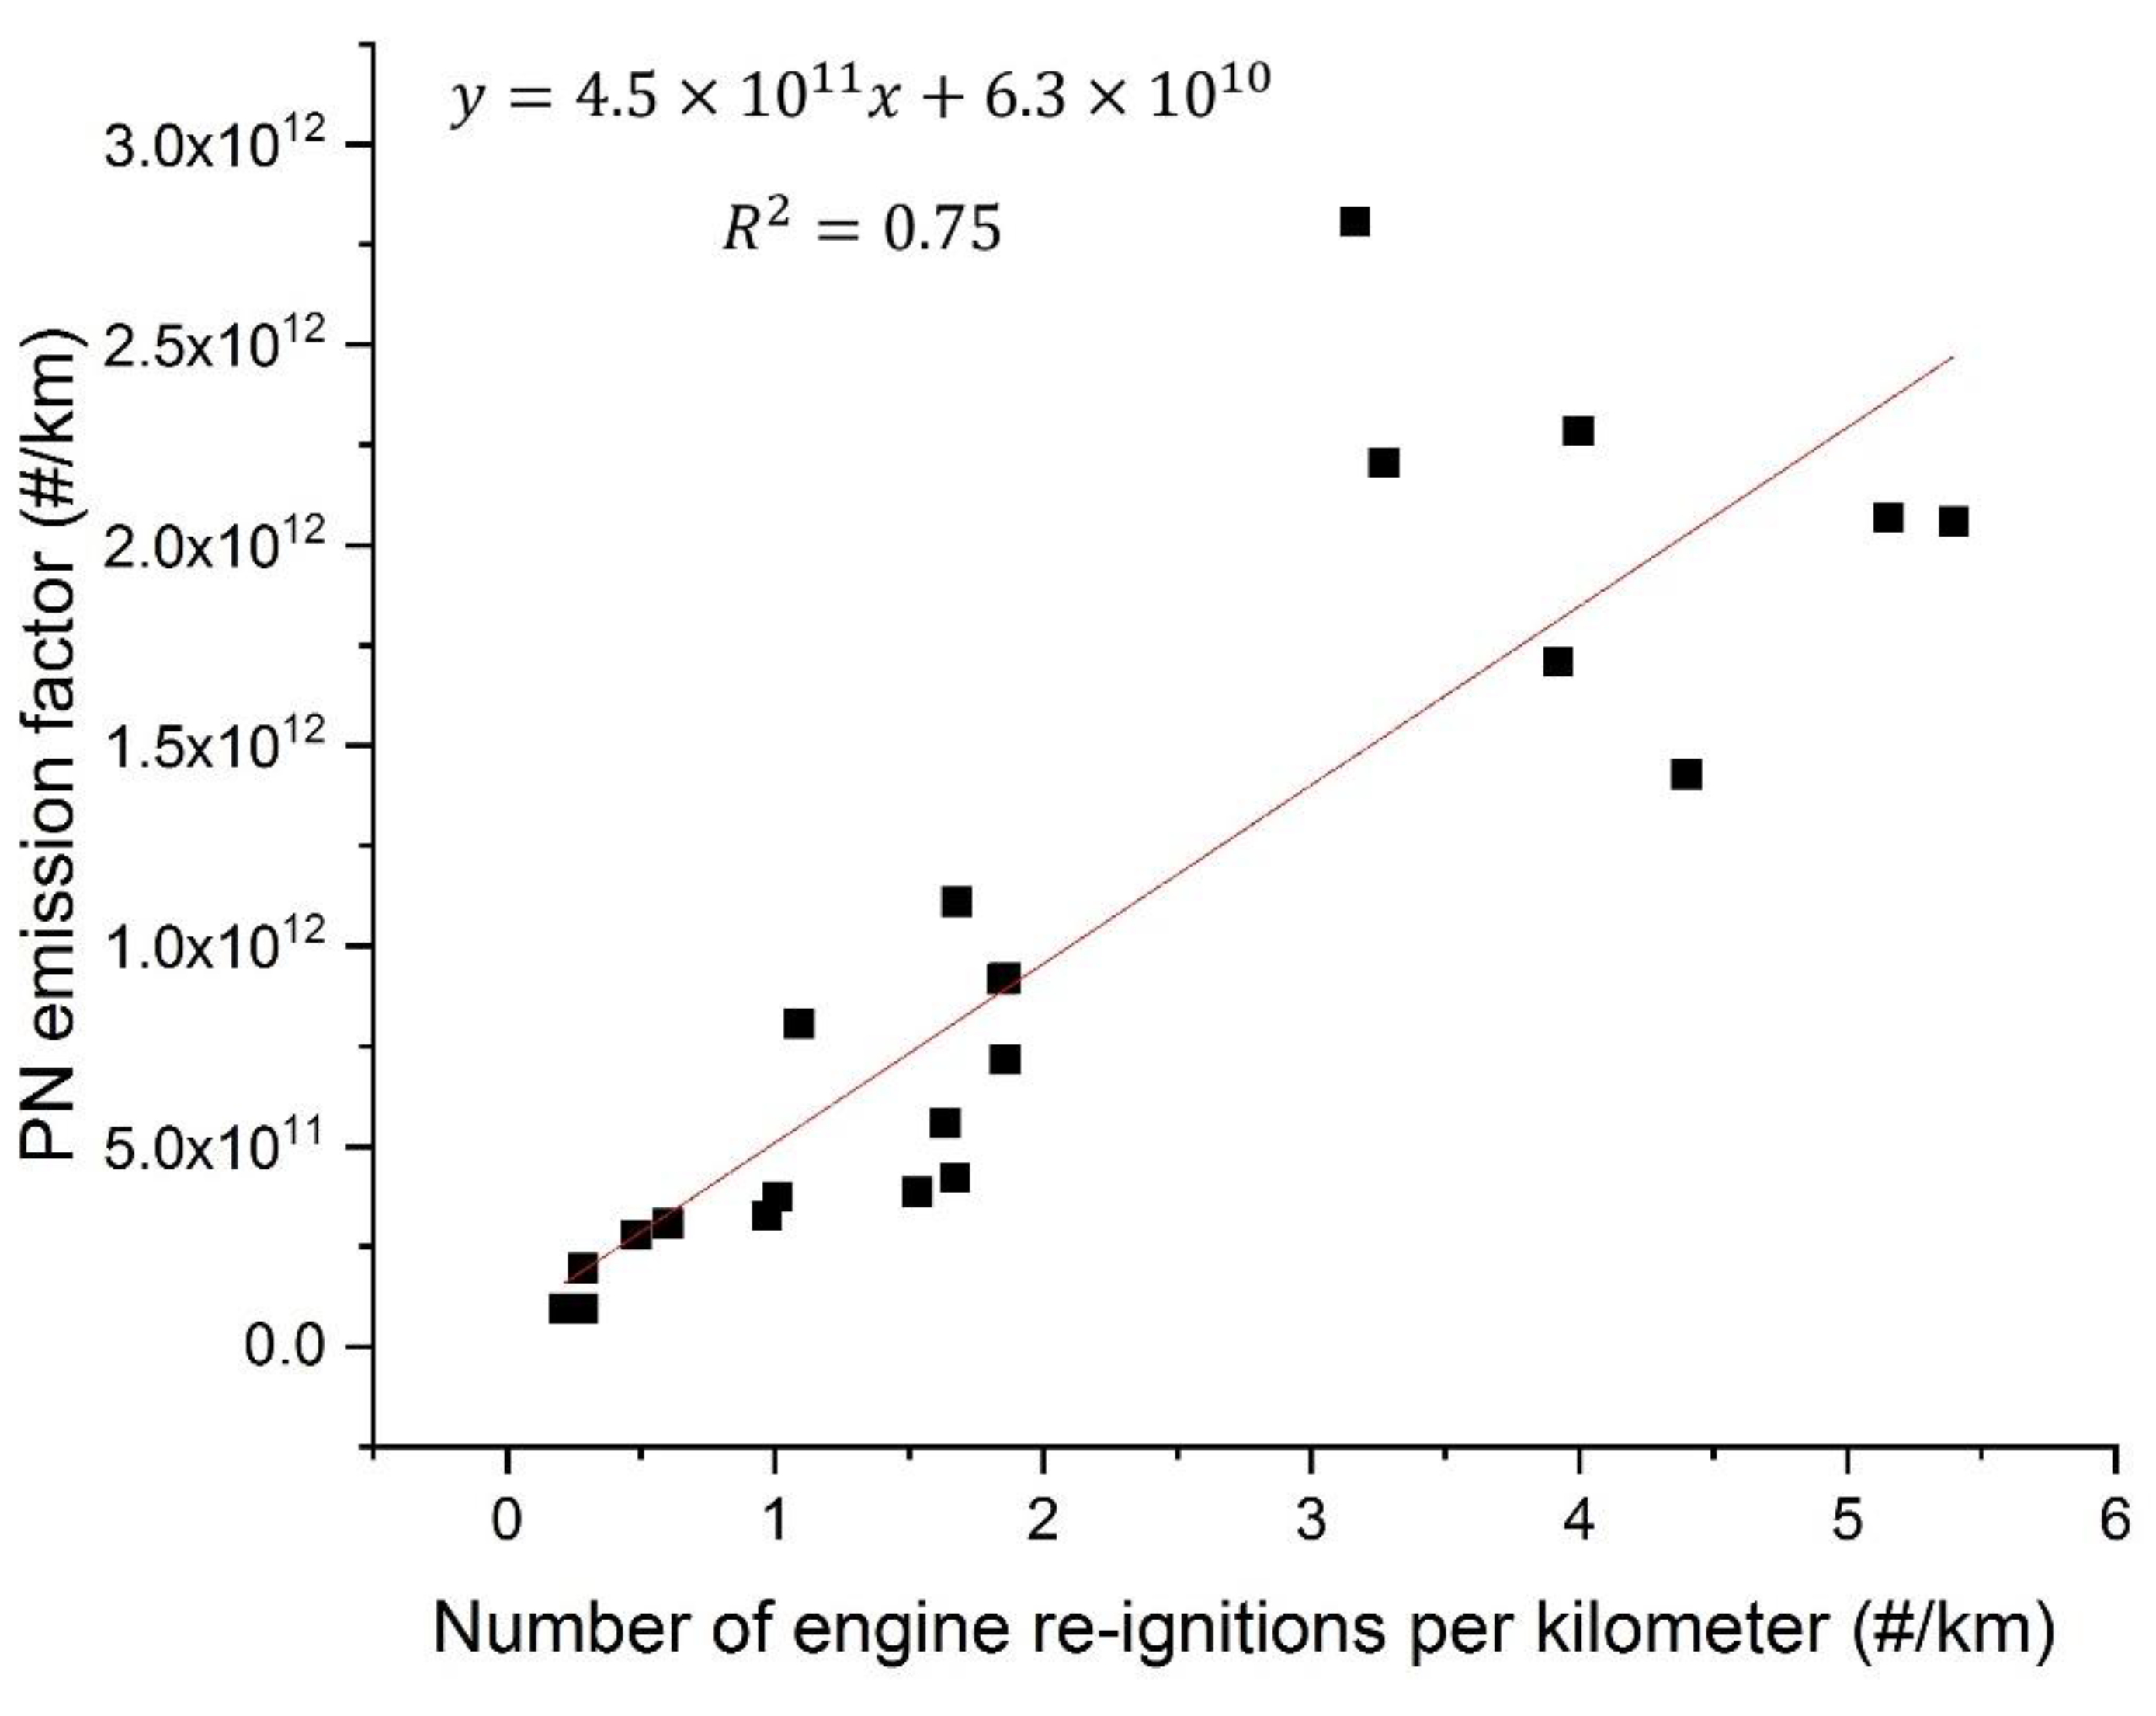
Building on the work of Conger and Holmén [
26], the percentage proportions of PN emitted over the WLTC and an RDE-style drive cycle occupied by different HEV operating states were calculated. It was shown that the number of vehicle stops during a test cycle has a direct impact on the re-ignition activity for the HEV. 64 ± 3% of total PN for WLTC and 77 ± 4% of total PN for RDE were produced during engine re-ignition events and a further 30% and 13% were produced during other types of destabilised engine operation, for WLTC and RDE, respectively. Meanwhile, 6 ± 1% and 10 + 3% was from stabilised engine operation for WLTC and RDE respectively. The majority of engine reignition and destabilised activity, and hence PN emissions, were found to occur during the low-speed urban and suburban sections of the drive cycles used. This highlights the importance of regulating HEV PN emissions in order to limit human exposure to PN.
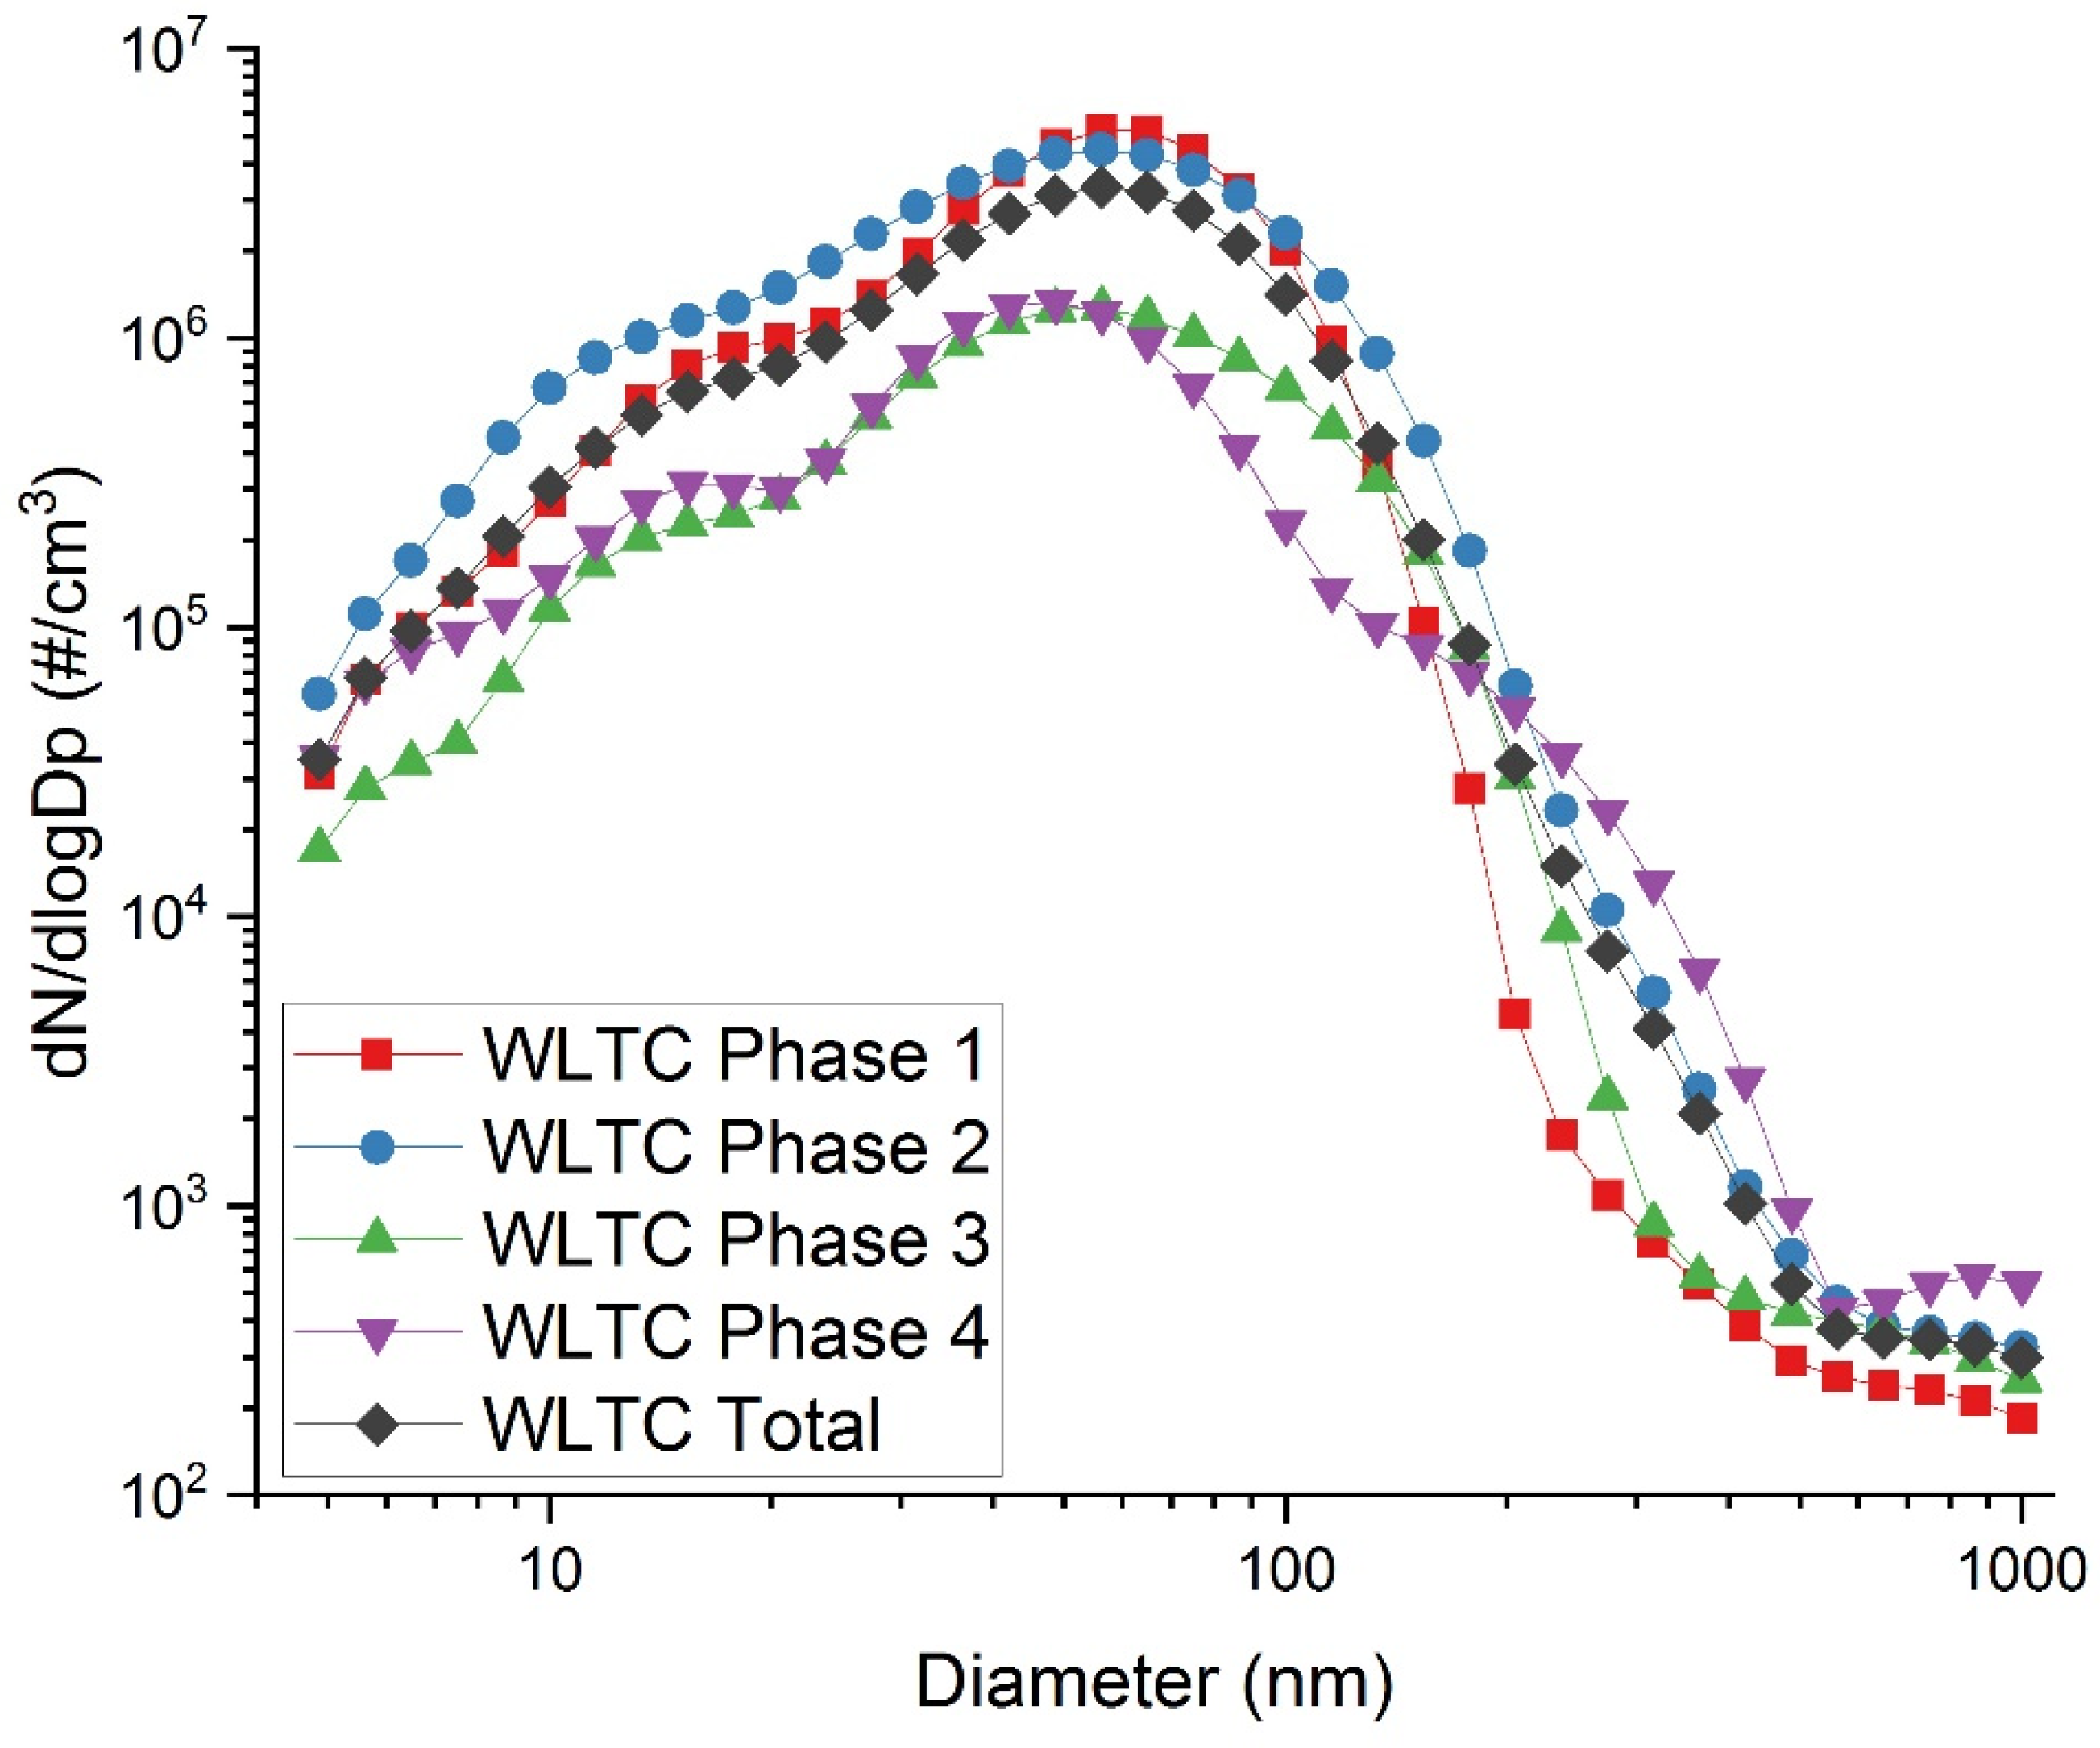
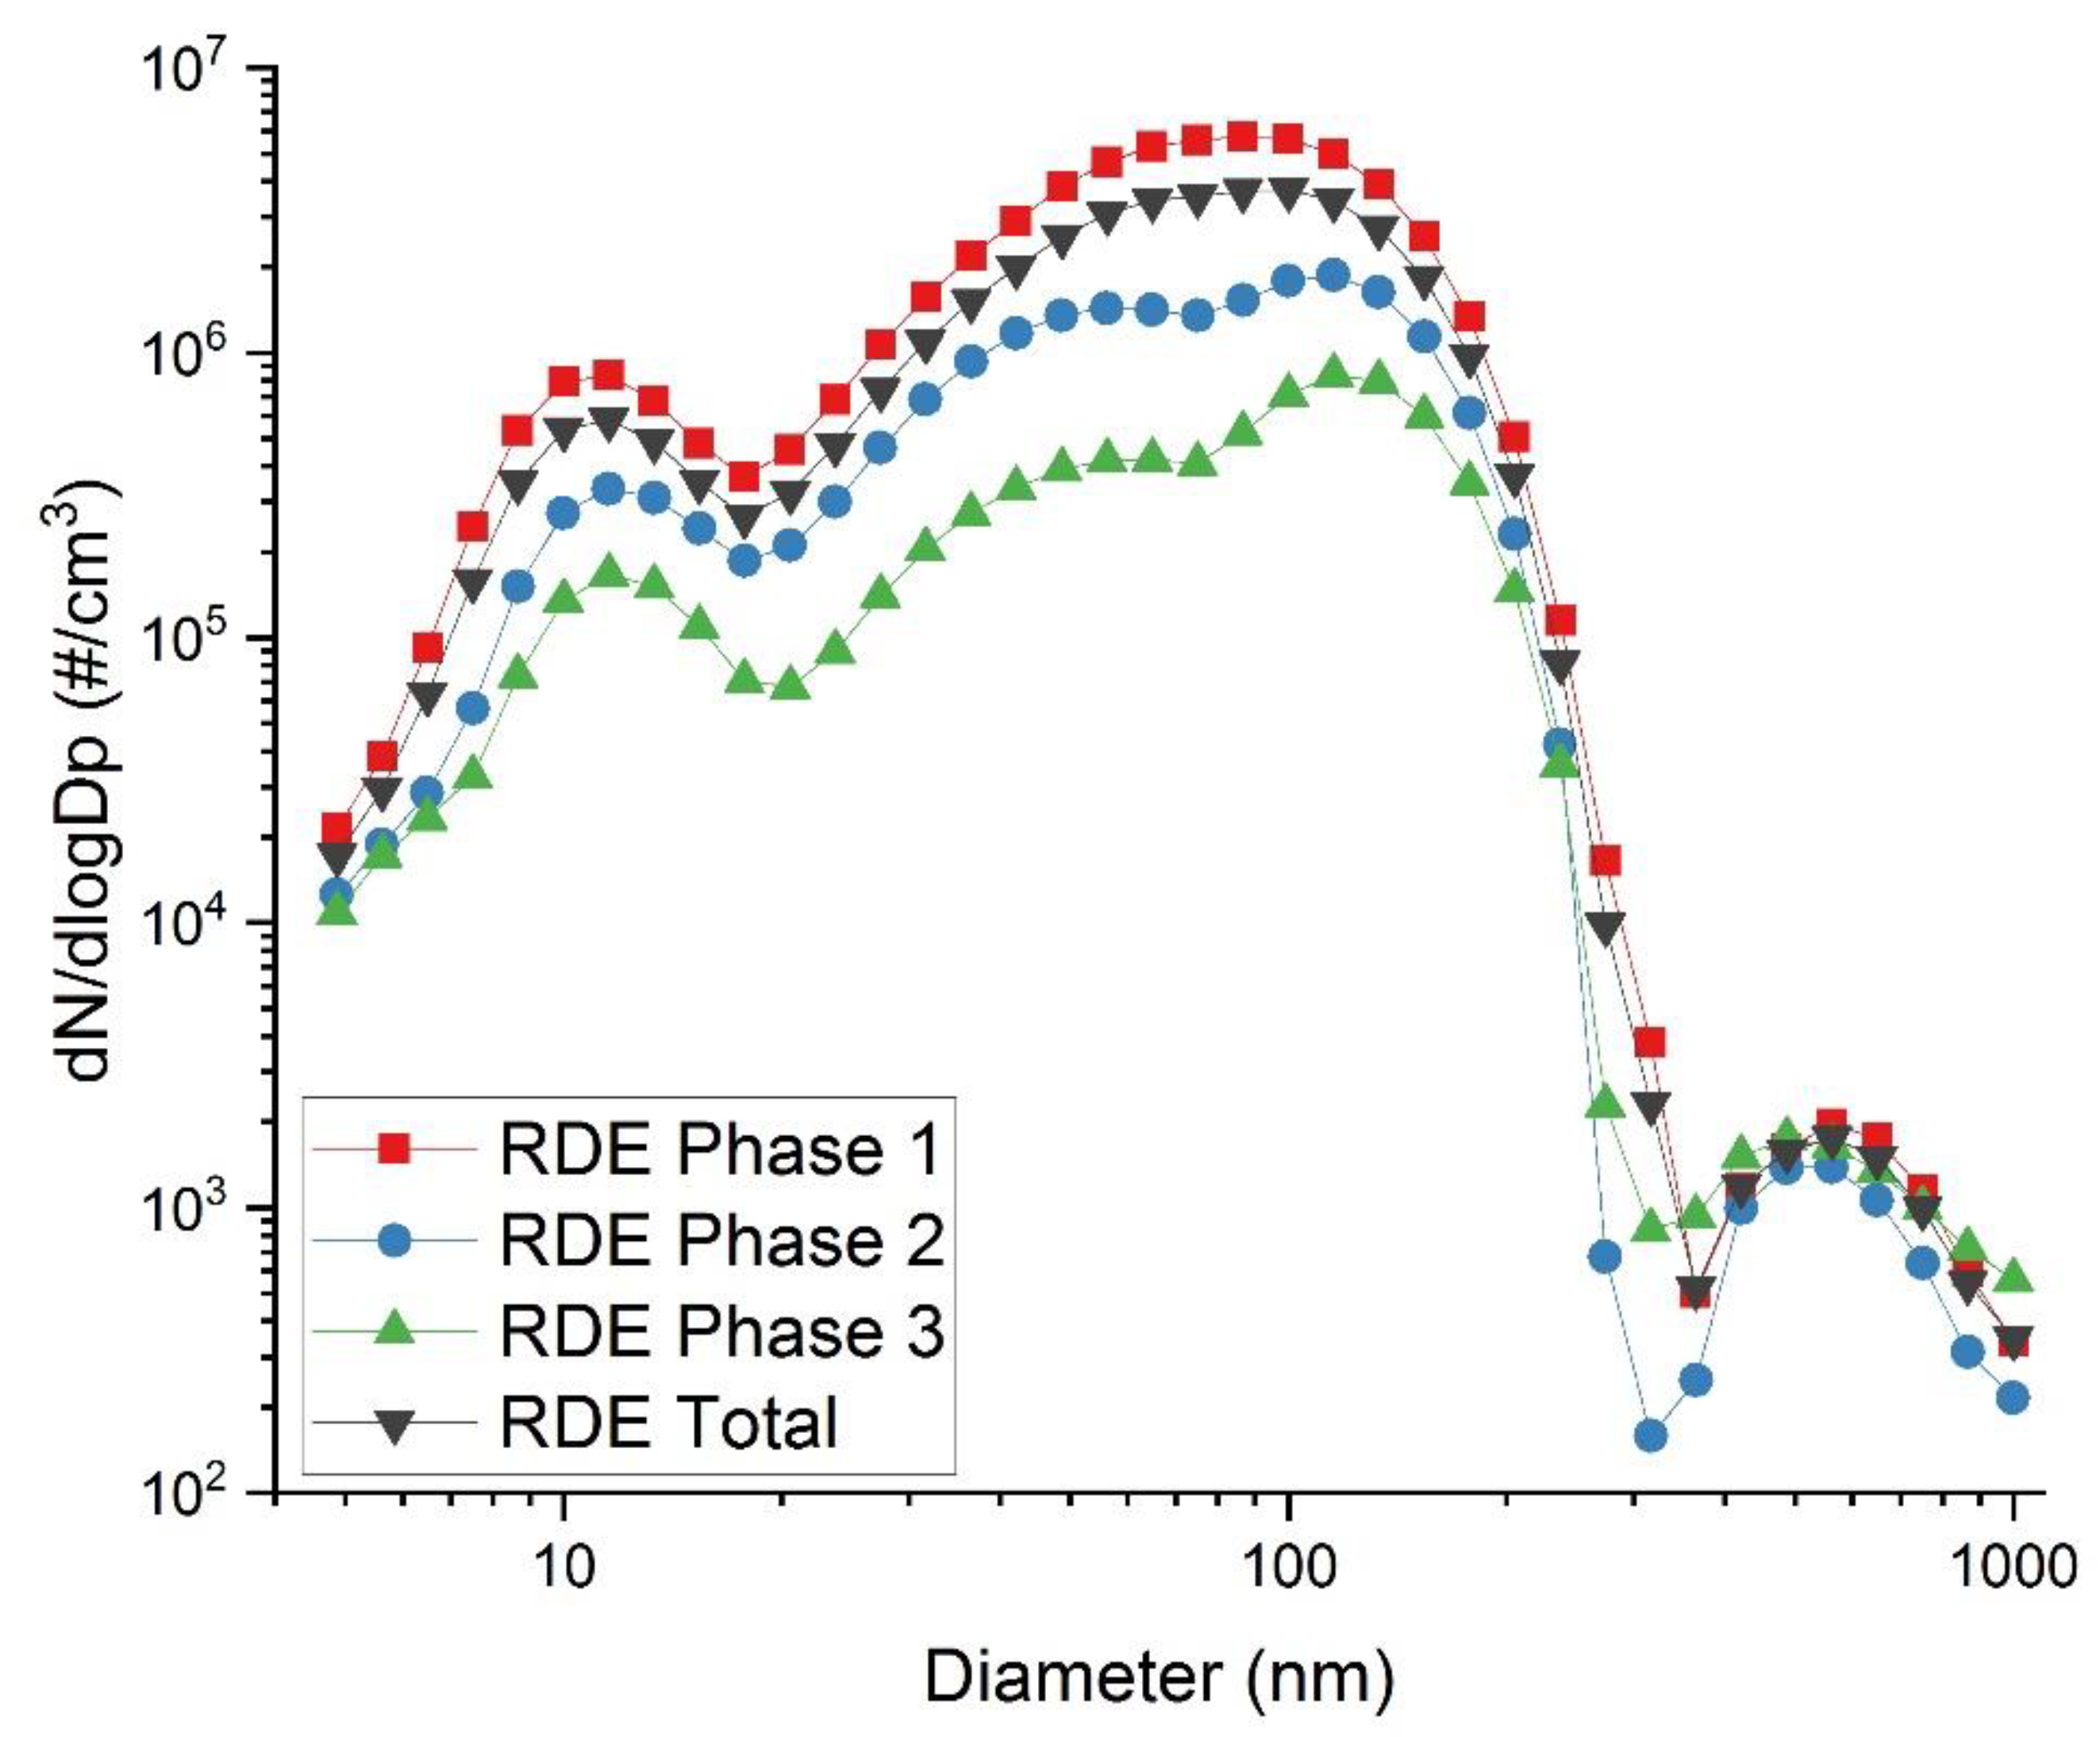
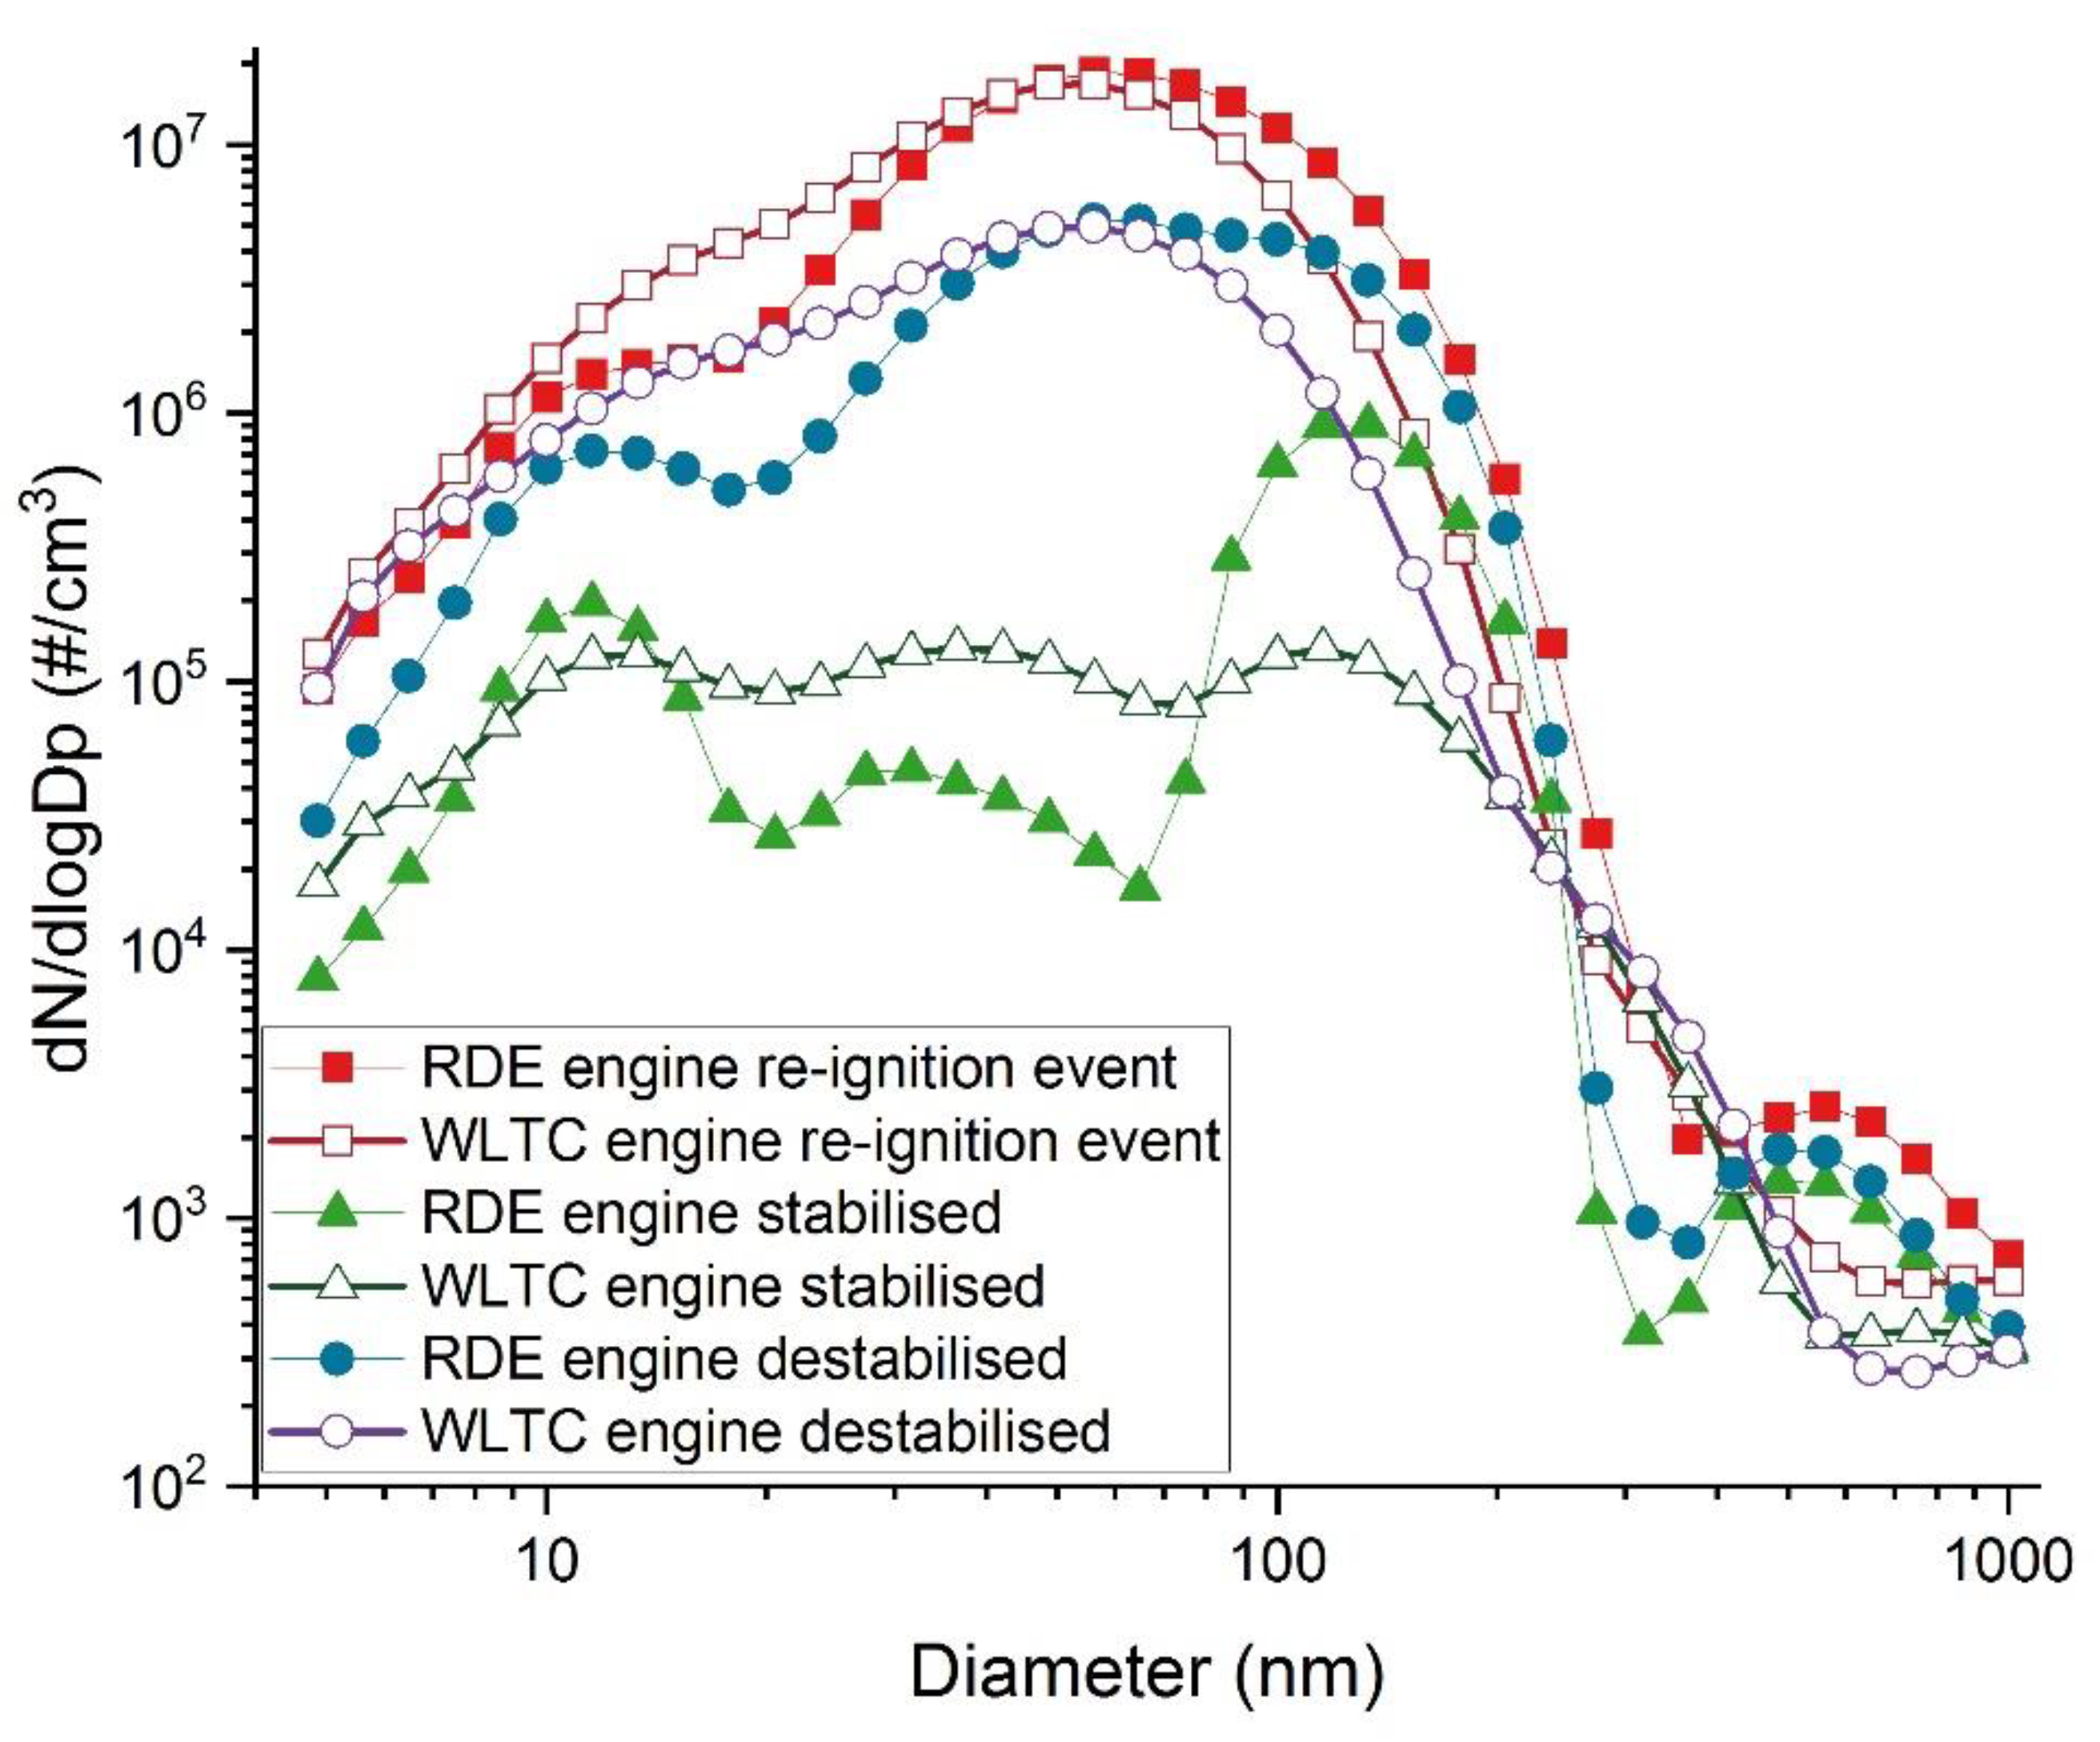
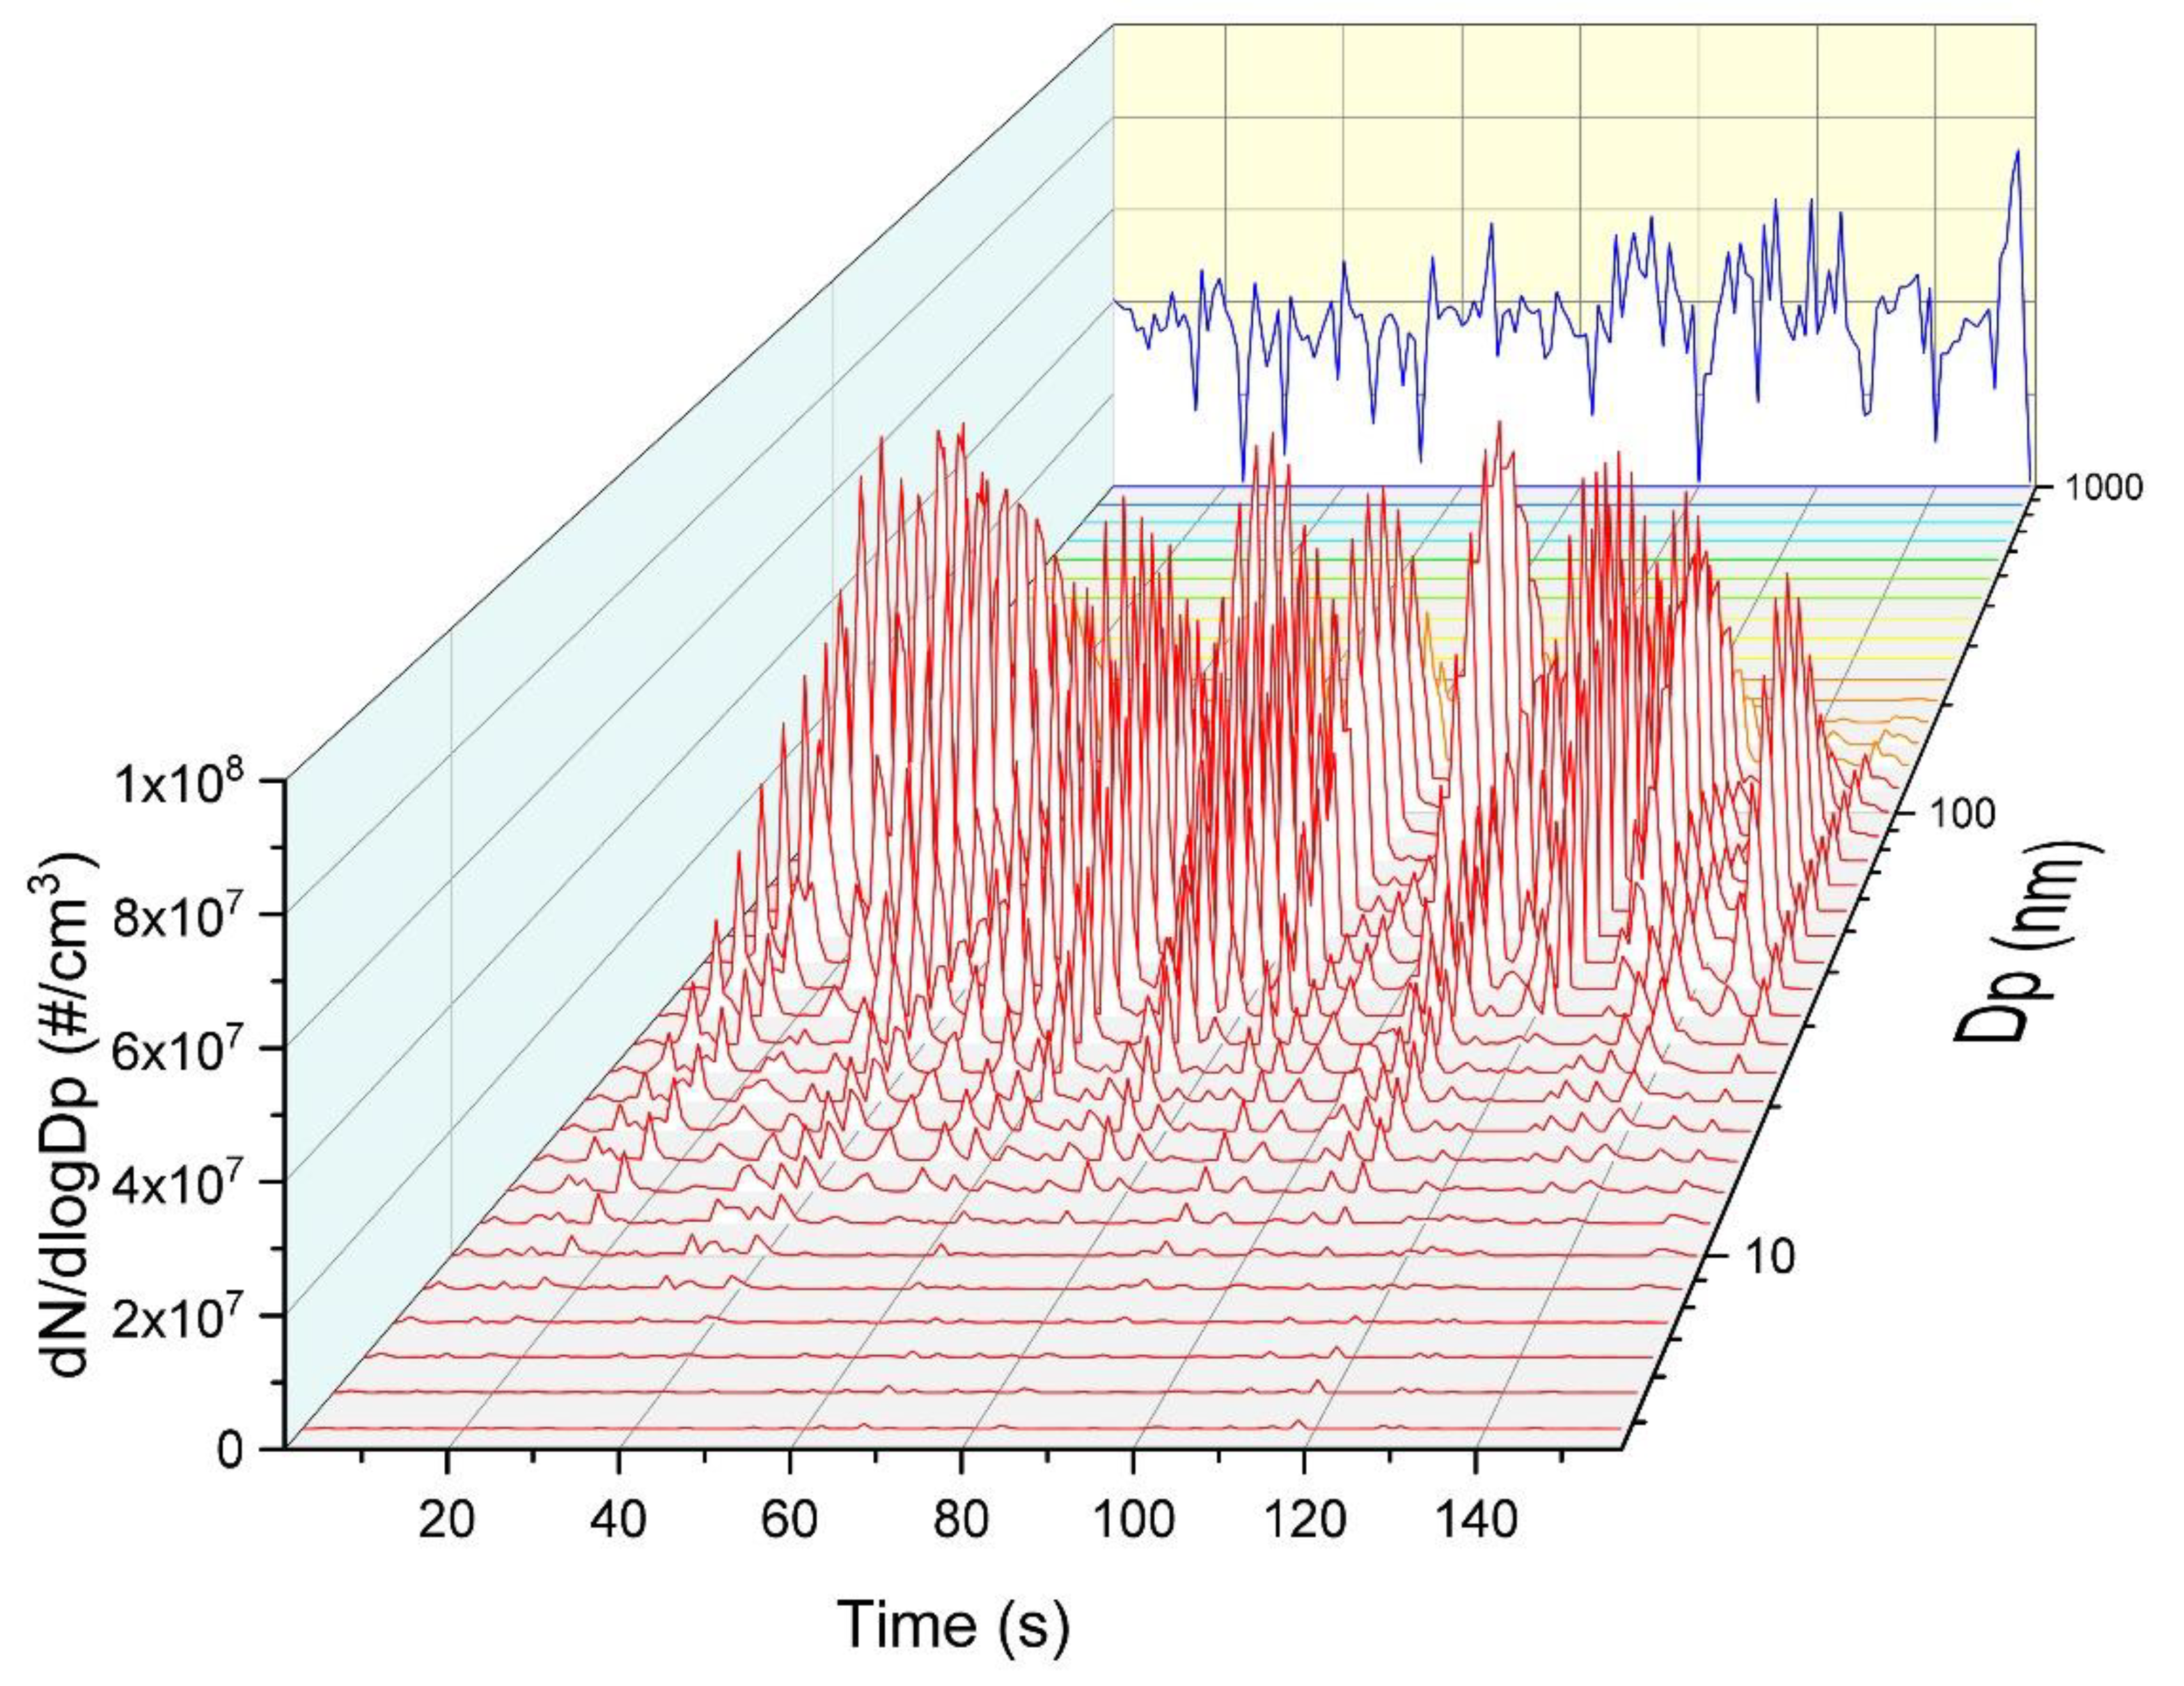
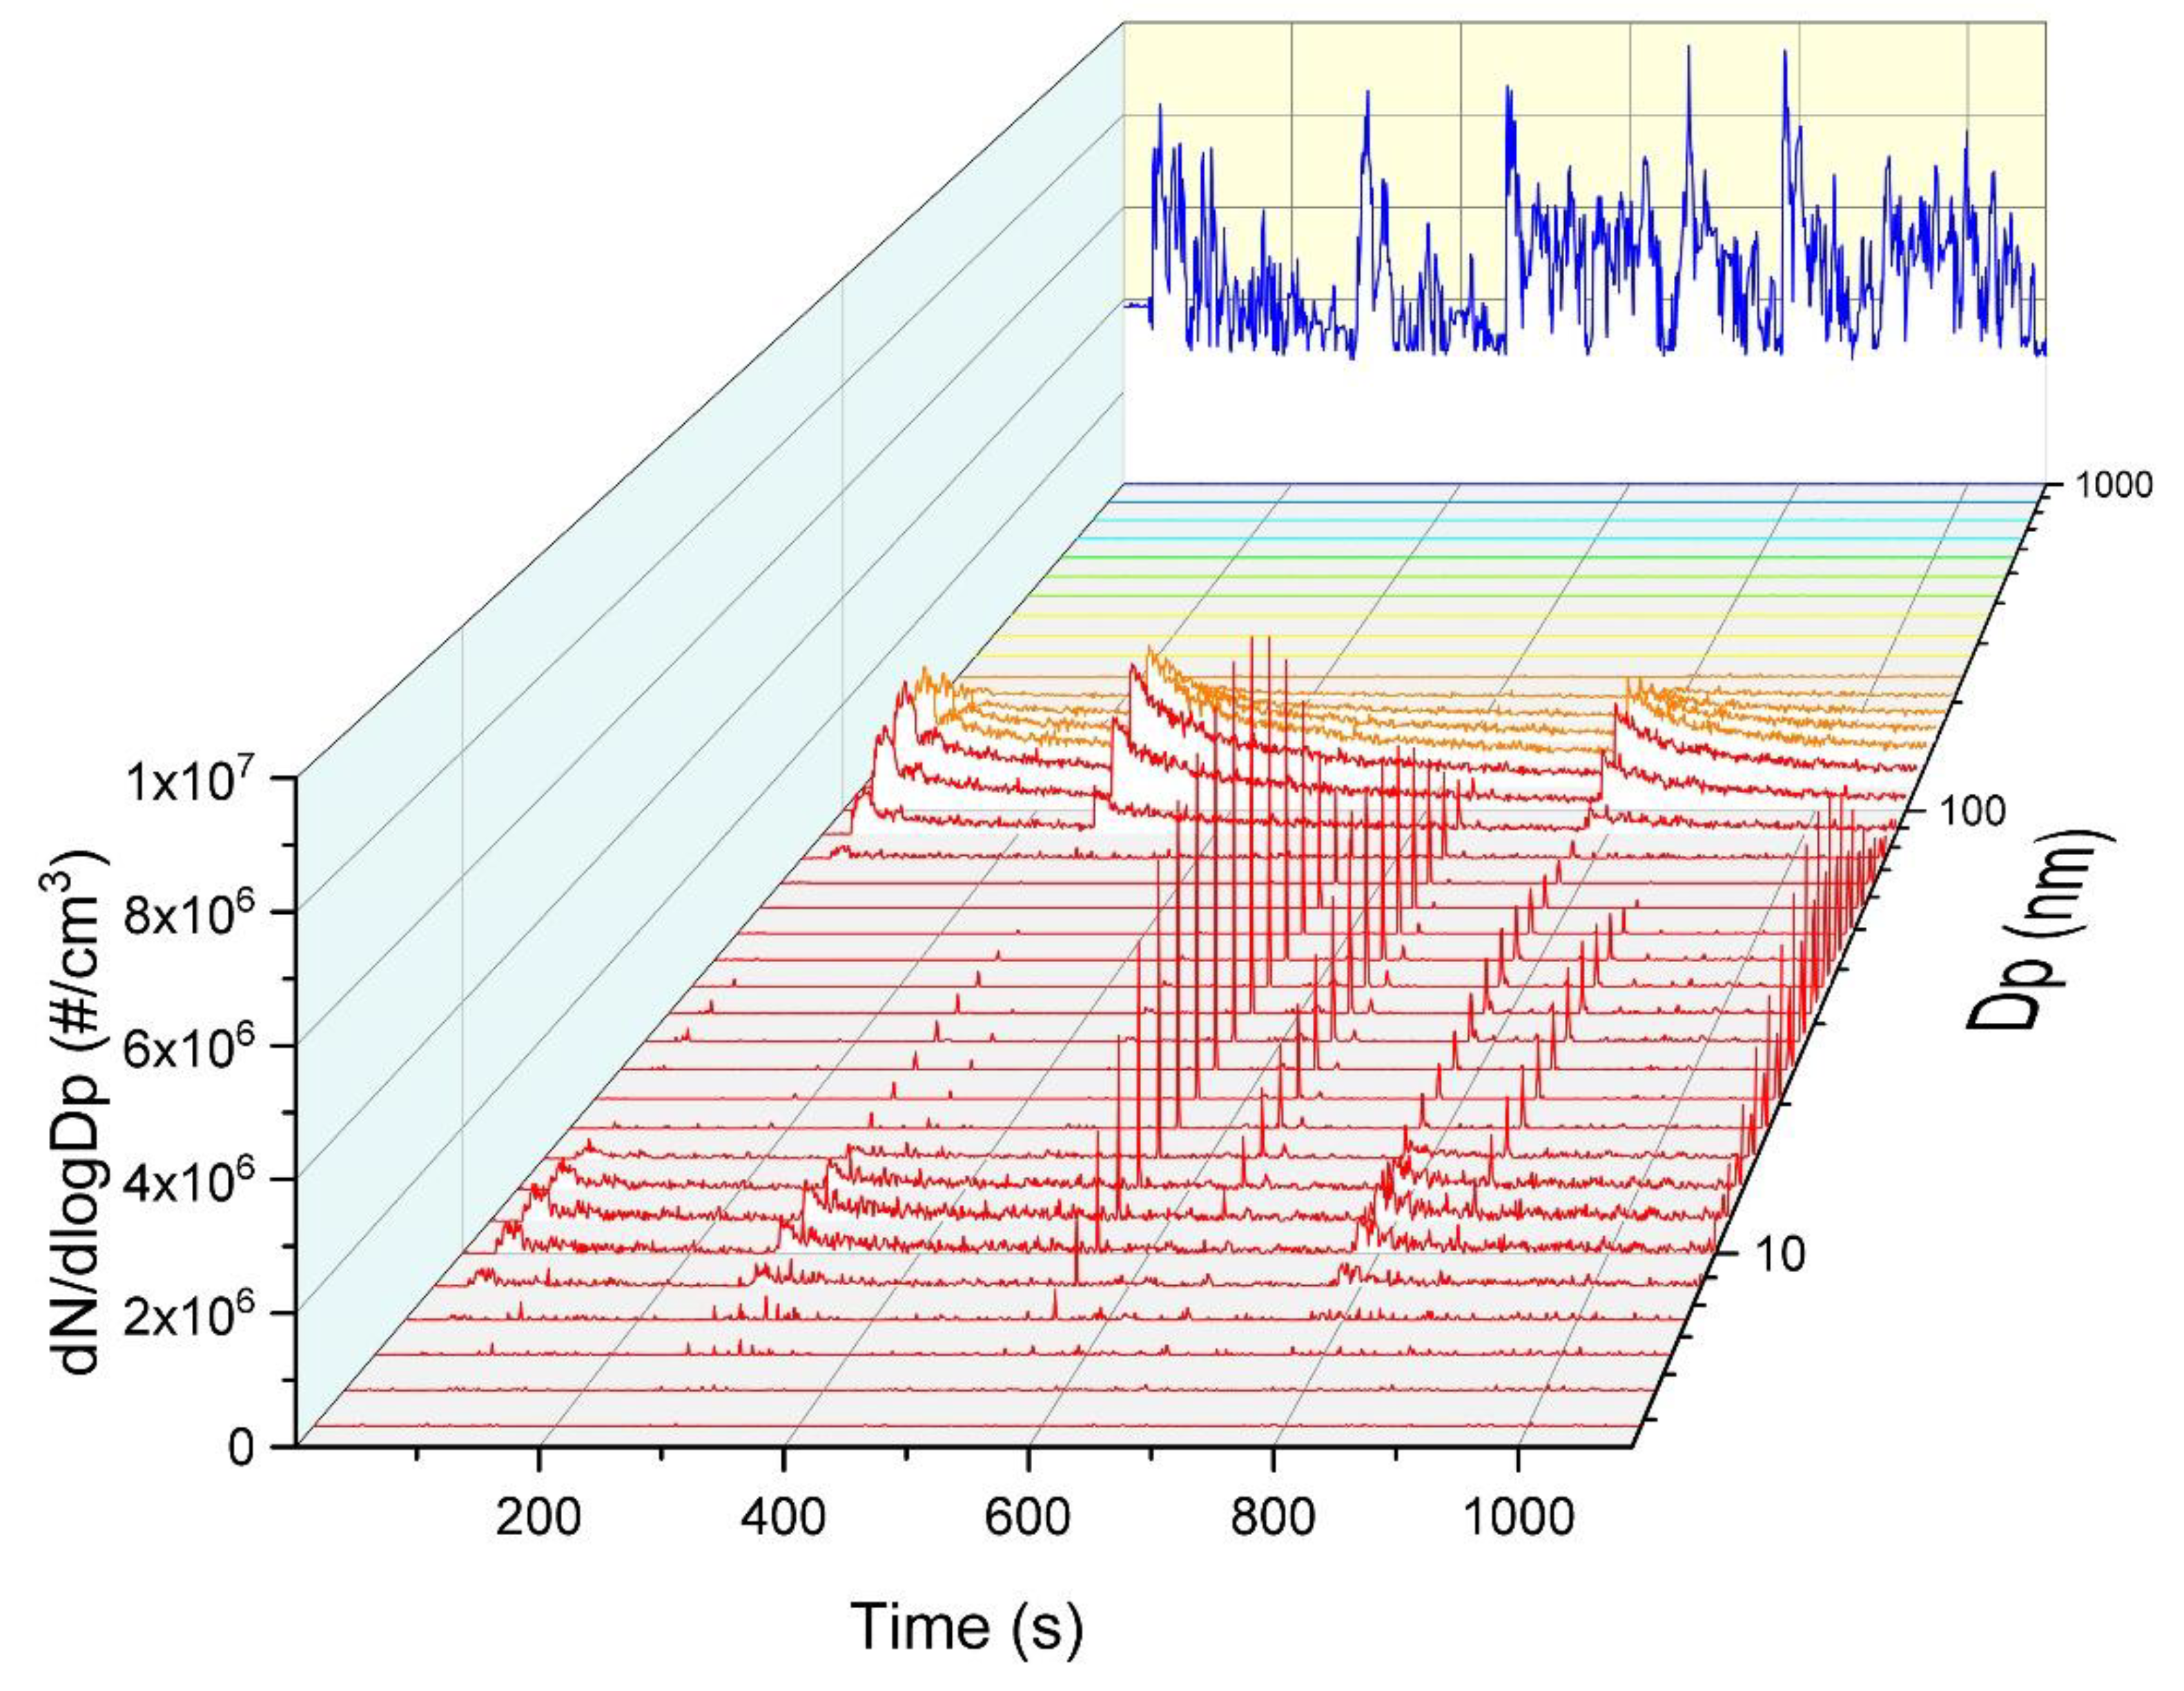
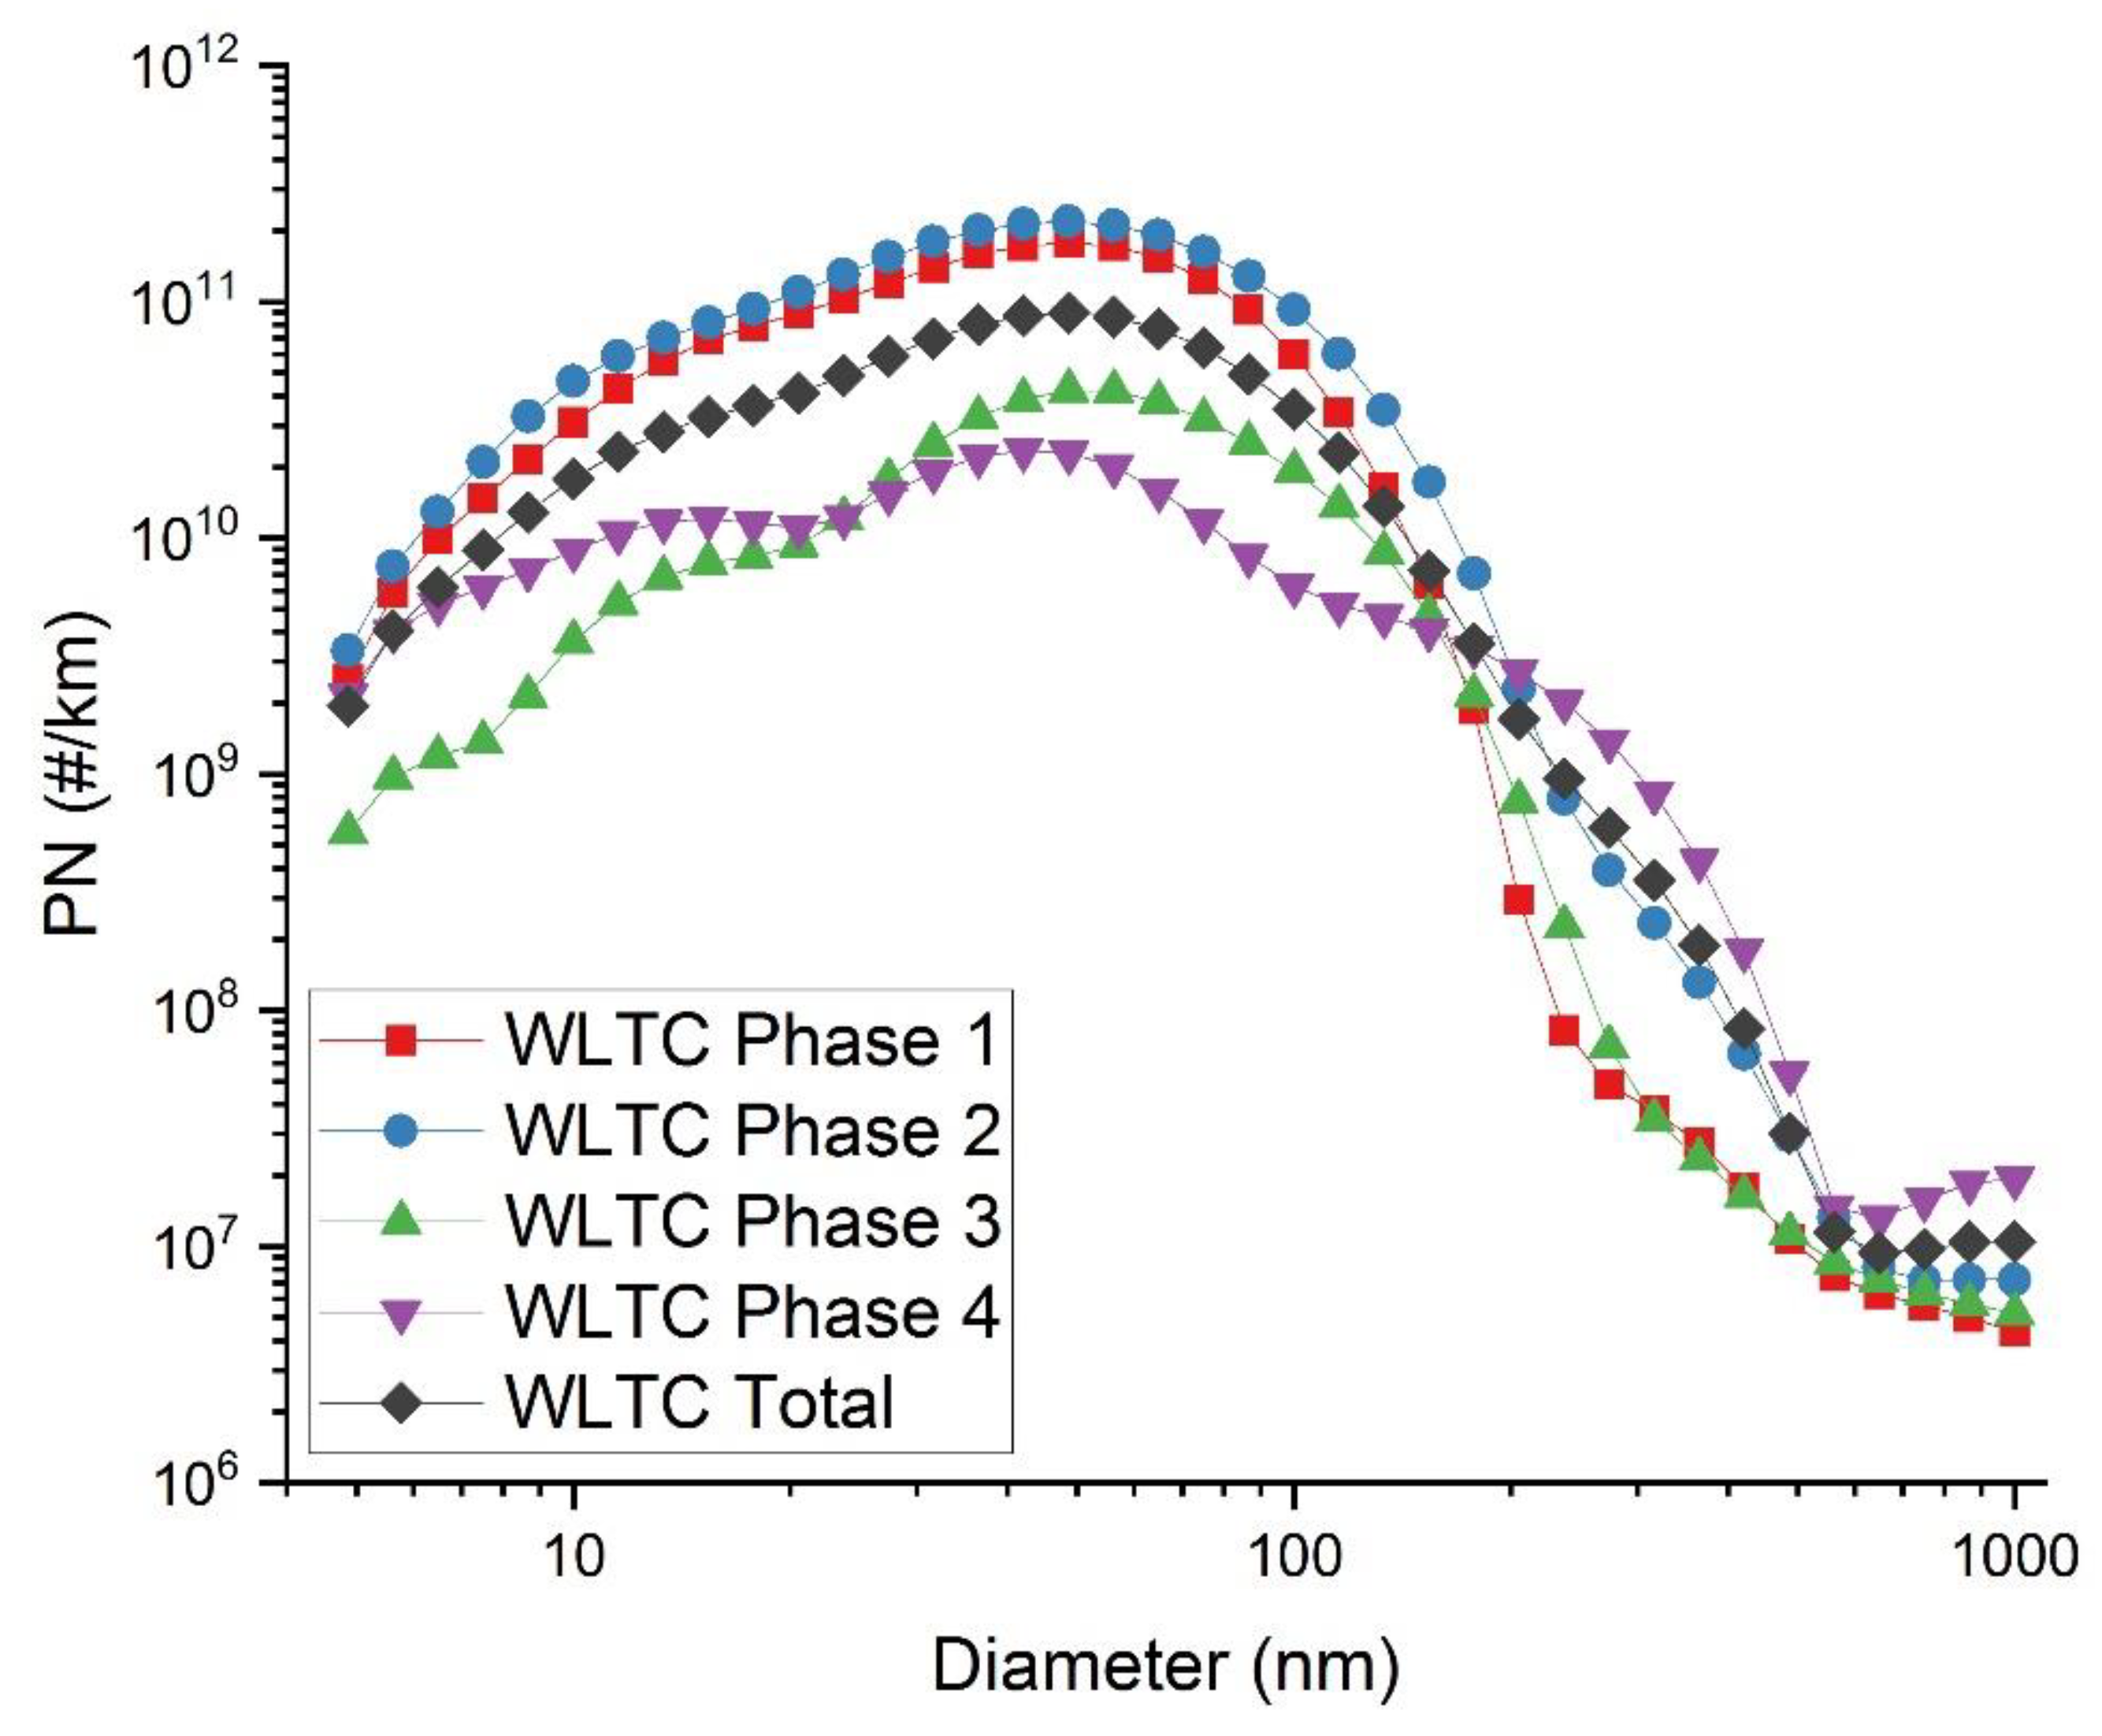
For the first time in available literature, the PNSD arising from an HEV on WLTC and RDE cycles has been investigated, including the specific study of the differences in PNSD during engine re-ignition events compared to stable engine operation. The average PNSD across cycle phases was markedly different for the RDE compared to the WLTC. This variation was found to be due to the different PN emission behaviour seen under different types of engine operation, which was heavily influenced by the dynamic properties of the cycles under study. A merged wide peak with a maximum at 60 nm diameter and a shoulder at 12 nm diameter was seen for engine re-ignition and engine destabilised events. These PN emissions were shown to be due to fuel enrichment, in agreement with Conger and Holmén [
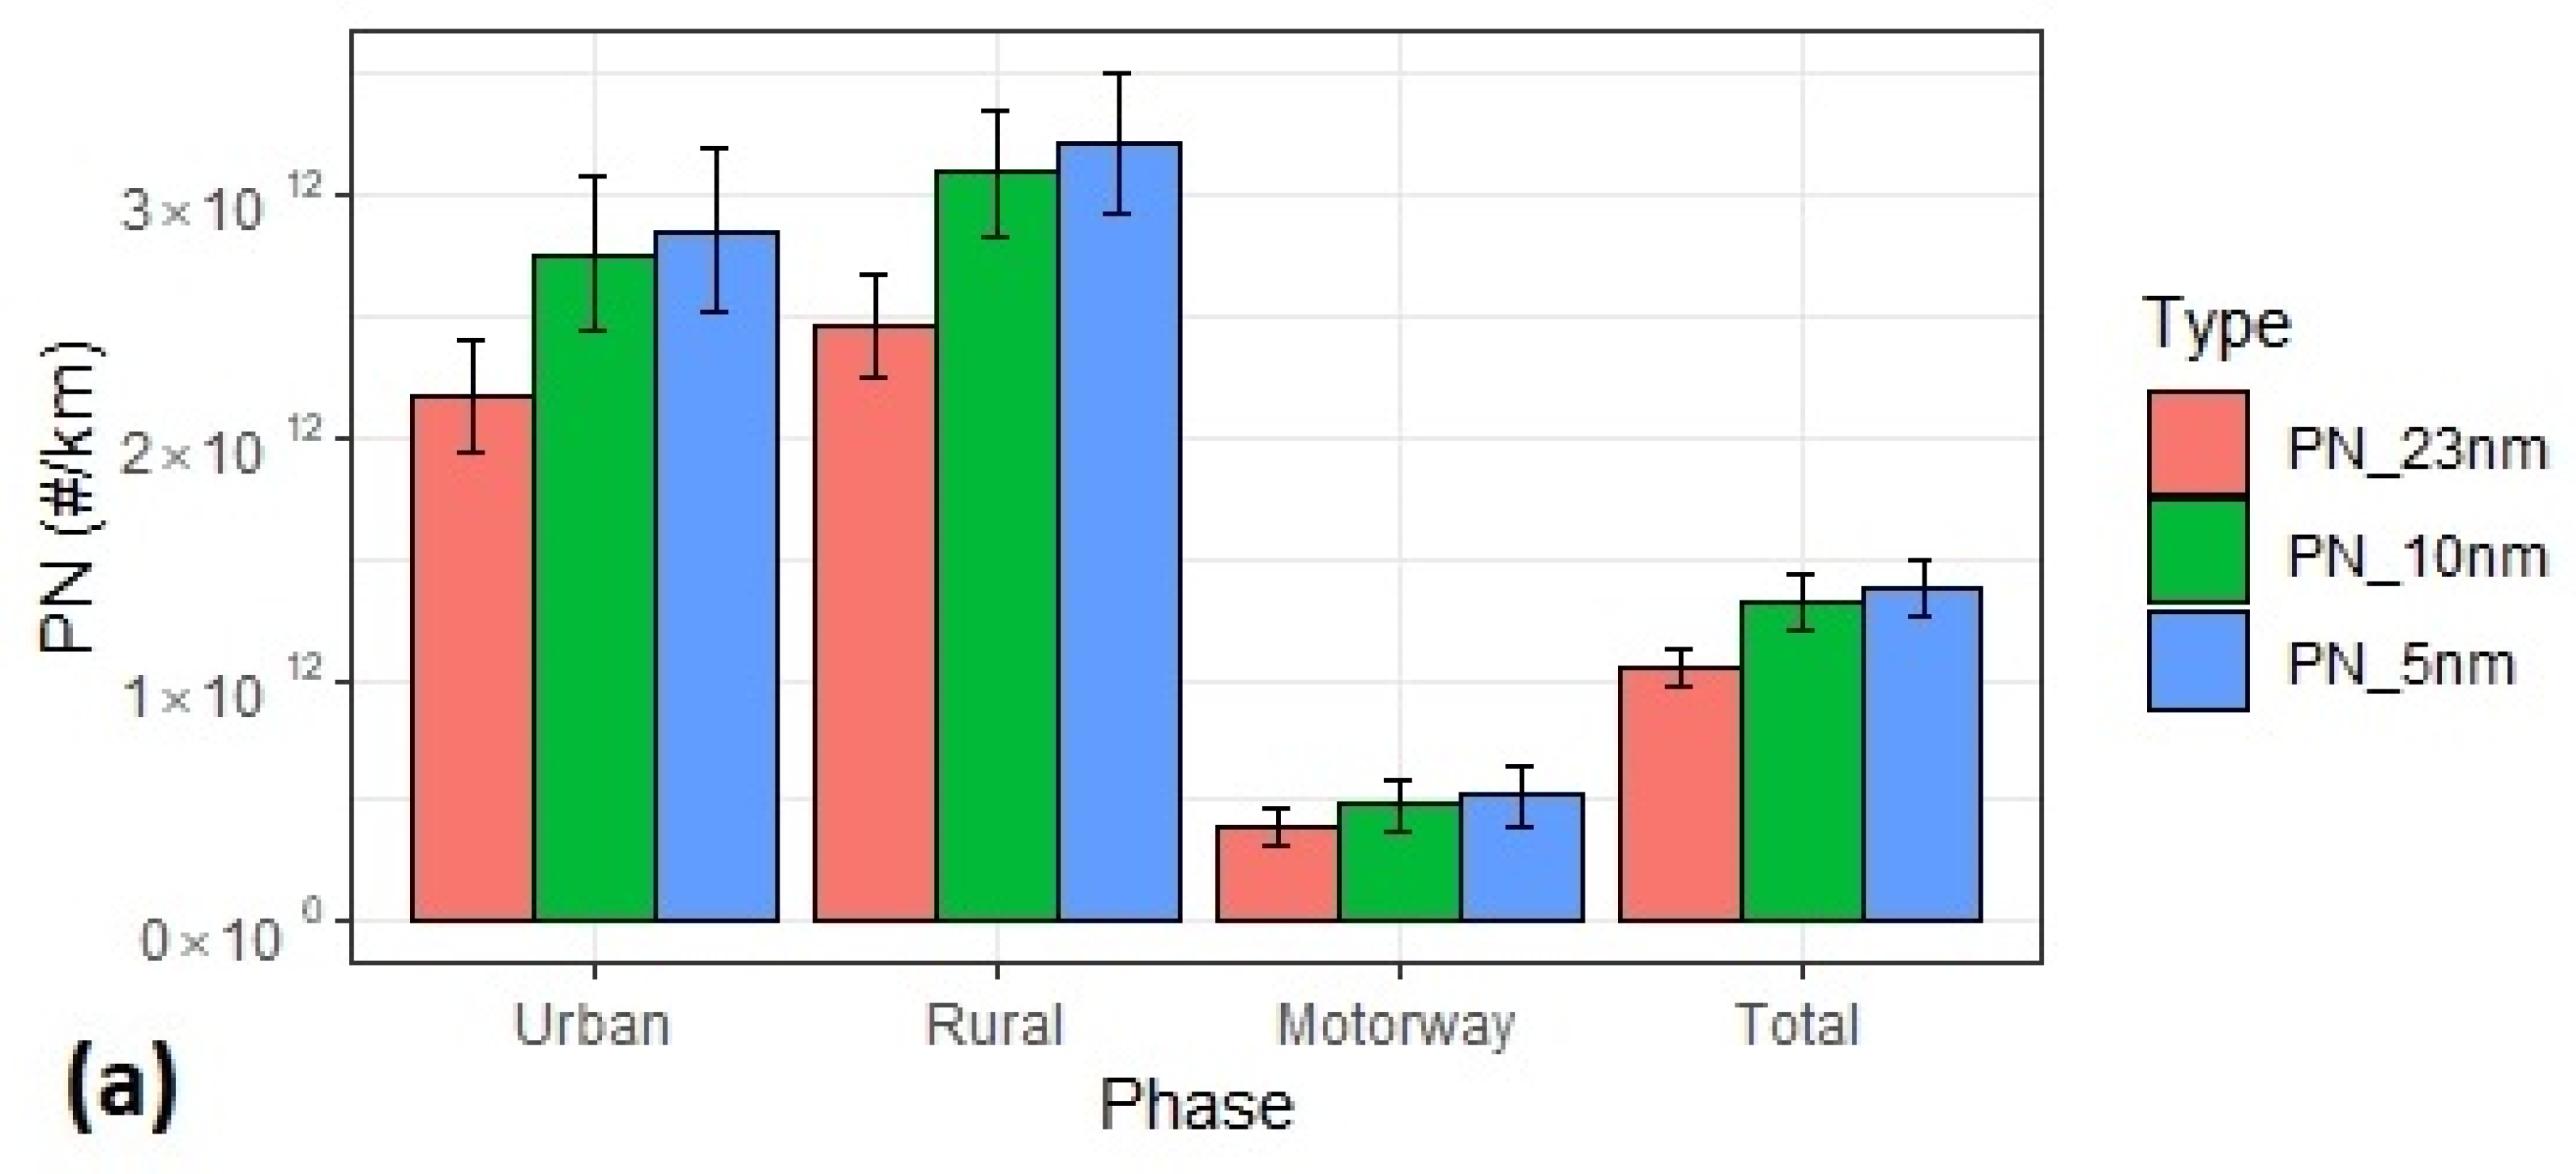
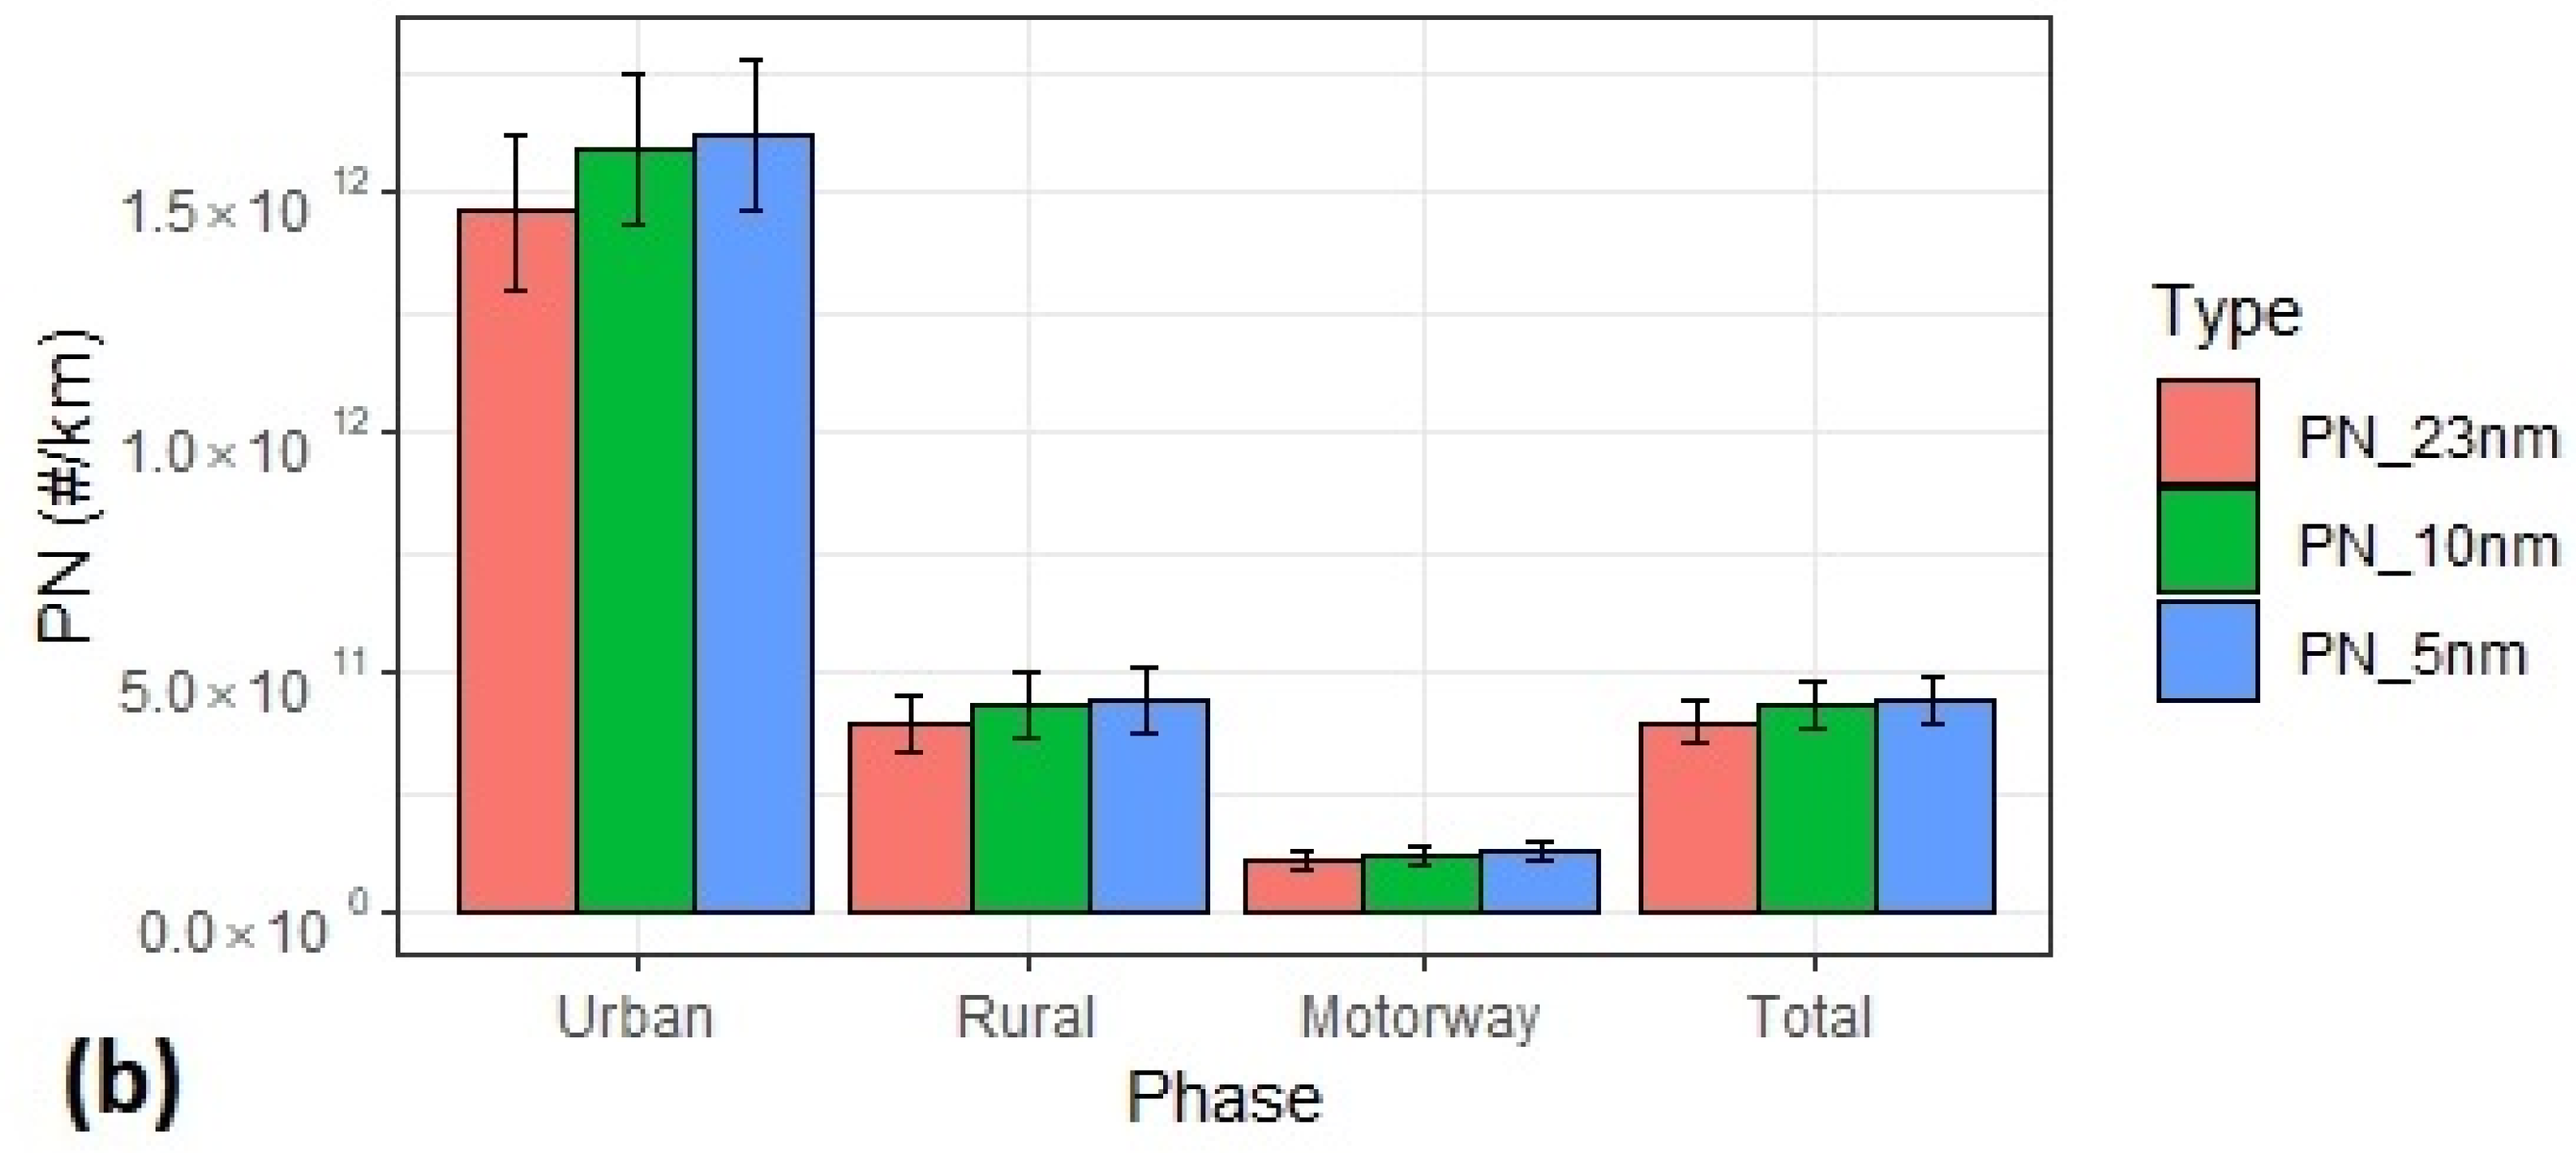
26]. The stabilised engine state was associated with a tri-modal PNSD: There were low but almost constant magnitude PN emissions at 12 nm and 115 nm modes, and intermittent high magnitude peaks at 35 nm associated with sudden increases in engine speed. The study of the PNSD during warm and cold operation shows for the first time that this HEV has increased emissions of the 12 nm mode particles under a cold start, but similar overall PN emission values, compared to a warm start. The cut-off size at 23 nm by the PMP means that the reported PN emissions by legislation are underestimates. The impact of the 23 nm cut-off on reported WLTC PN emission factors was investigated for the HEV under study. Decreasing the cut-off from 23 nm to 10 nm was found to increase reported PN by 25% on the WLTC while decreasing to 5 nm increased reported PN by 31%. These differences are much smaller than those witnessed by Giechaskiel et al. [
28] for two conventional PFI SI vehicles on the NEDC and WLTC, but still indicate that much of the PN is missed with a cut-off at 23 nm. Most of this HEV PN emissions would be captured if the cut-off were reduced to 10 nm.
The results of this work highlight the importance of controlling and regulating HEV PN emissions to limit human exposure to PN in urban environments where the majority of PN emissions were shown to occur. The findings also demonstrate the high level of dependency that HEV PN emission factors have on the properties of the test drive cycle used, and hence the attention that policymakers need to give to ensure that test drive cycles are as representative of real-world driving as possible. The sensitivity of HEV PNSD to engine behaviour and, in turn, to test cycle dynamic properties, is important to note when considering legislative test cycles, particularly with reference to the freedoms afforded by the RDE test cycle. The results also indicate that substantial improvements to air quality could be made by reducing the PMP PN cut-off to 10 nm.

 ,
, 


