Article

Assessing the Drought Variability in Northeast China over Multiple Temporal and Spatial Scales

Department of Cartography, GIS and Remote Sensing, Institute of Geography, University of Goettingen, 37077 Goettingen, Germany
*
Author to whom correspondence should be addressed.
Atmosphere 2022, 13(9), 1506; https://doi.org/10.3390/atmos13091506
Submission received: 25 July 2022 / Revised: 9 September 2022 / Accepted: 13 September 2022 / Published: 15 September 2022

Abstract

:
Long-term drought variation provides a scientific foundation for water resource planning and drought mitigation. However, the spatiotemporal variation characteristics of drought in northeast China (NEC) are unclear. We conducted a comprehensive assessment of drought status and trends based on the Standardized Precipitation Evapotranspiration Index (SPEI) in NEC from 1990 until 2018. The findings show that: (1) the drying trend peaked in 2001, and then exhibited a mitigation tendency before drying again after 2013. The implementation of ecological restoration projects is primarily responsible for drought mitigation. (2) The areas with wetting and drying trends in the future would cover 86% and 17% of NEC, respectively. (3) There is a time lag between improved vegetation and the trend shift from dry to wet. (4) Spring and winter revealed wet trends within 71% and 84% of NEC, respectively, showing high sensitivity and resilience to drought, while 92–93% of NEC displayed dry tendencies during the summer and autumn seasons. The drought-affected area was the highest in summer and lowest in autumn. (5) The interannual drought severity was highest in May and June. (6) The highest drought impacts and trends occur within shrub and grass and sparsely vegetated land, as well as middle-temperate semiarid regions (M-semiarid). (7) The warmer the temperature zone, the more sensitive it is towards drought under the same hydrological conditions, showing a high drought-affected area. The drier the land, the higher the drought-affected area within the same temperature zone, with pronounced drought trends during the spring and summer seasons. Our findings highlight the need for the government to more explicitly develop drought mitigation strategies in accordance with NEC’s spatiotemporal drought variations and specifically the need to concentrate on droughts in M-semiarid regions occurring in summer, particularly in May and June.

1. Introduction

Drought is a fundamental and recurring extreme climate event over terrestrial land that has severe direct and indirect impacts on the ecological, agricultural, and socioeconomic sectors [1,2,3]. Global drylands have expanded under a warming climate [4,5] and high greenhouse gas emission scenarios when the climate is expected to be warmer than it is now. Most land will become drier by 2100, with the exception of India and northern tropical Africa [4]. Observations from the Climatic Research Unit (CRU) have also revealed a significant positive drying trend in land areas under meteorological drought [6]. Meteorological drought is defined by precipitation deficits over a region for an extended period of time, possibly combined with increased potential evapotranspiration [1], can last for a wide range of time scales, and is frequently spatially variable due to landscape and climatic heterogeneity. The effects of different temporal scales on the efficacy of drought indices are well documented [7,8,9,10]. For example, severe droughts, even if only for a short period, would have a disastrous impact on agriculture during crop growth stages [11] and increase the risk of fire. In subsequent years after the severe drought, changes in hydro-meteorological variables are observable. The increase of water demand exacerbates the effects of future droughts [12,13]. Moreover, light and moderate droughts with long durations would have devastating impacts on ecosystems and the water supply [14]. As such, improved observational quality is required for the efficient monitoring and management of droughts in many regions of the world, due to potential high drought impacts, combined with complicated drought characteristics.
With regard to China, although the aridity trend has slowed over the past three decades, it has become more pronounced in the southwest and northeast of China [15]. Northeast China (NEC) is a typically vulnerable region to climate change and has been described as a major ecological barrier for northern China and even northeast Asia, playing a significant role in biodiversity conservation and regulating the regional climate of northeast Asia [16,17]. Previous research has shown that NEC is one of the hotspots of warming areas in East Asia [18,19], and has a high incidence of drought disasters [20]. Almost 45.4% of the ecosystem is at moderate or high risk of meteorological drought [21]. To date, there have been many studies on drought index trends and drought characteristics [22,23,24]. However, little attention has been paid to investigating the spatiotemporal mutation points of drought trends and the driving factors. The spatiotemporal characteristics of drought types that may have serious consequences for vegetation growth and ecosystems have also not been clarified. In addition, NEC has abundant vegetation resources and diverse climate regions characterized by different hydrothermal conditions. Revealing the drought status and trends of different land cover types and climate regions is beneficial for local governments to accurately monitor and mitigate the impact of drought by taking appropriate measures.
The atmosphere’s evaporative demand is expected to rise as global temperatures rise [25]. Thus, univariate risk assessment methods based solely on rainfall (i.e., the Standardized Precipitation Index (SPI), China Z Index (CZI)) may understate the risk of extreme drought events [26,27]. The Standardized Precipitation Evapotranspiration Index (SPEI) is calculated by normalizing the difference between precipitation and potential evapotranspiration based on a specific distribution, and is more sensitive to the drought severity caused by rapid temperature rises [28]. Moreover, unlike the Palmer Drought Severity Index (PDSI), where the identification of rapidly emerging droughts is limited due to the fixed time scale of 9 months, SPEI provides multiple time scales (1–48 months) [28]. Therefore, it facilitates the quantitative comparison of drought incidence over time and space [29] and thus has been widely used to quantify drought onset, duration, magnitude, and spatial extent globally [30,31,32]. However, high spatial resolution SPEI datasets have not yet been developed in NEC.
Here, SPEI-aggregated multi-time scales with a spatial resolution of 1 km were calculated to explore the annual and quarterly trends and their mutation points from 1990 to 2018. The future dry–wet trend was also investigated. Additionally, we evaluated the land area dynamics of monthly severe drought, quarterly moderate drought, and annual light drought during the study period. The drought area and trend of different climate regions and land cover types were further clarified. We aimed to explore the reliable spatiotemporal drought variation characteristics in NEC, which has important practical implications for coping with future drought risk and developing more detailed drought mitigation strategies to protect the ecological environment.

2. Materials and Methods
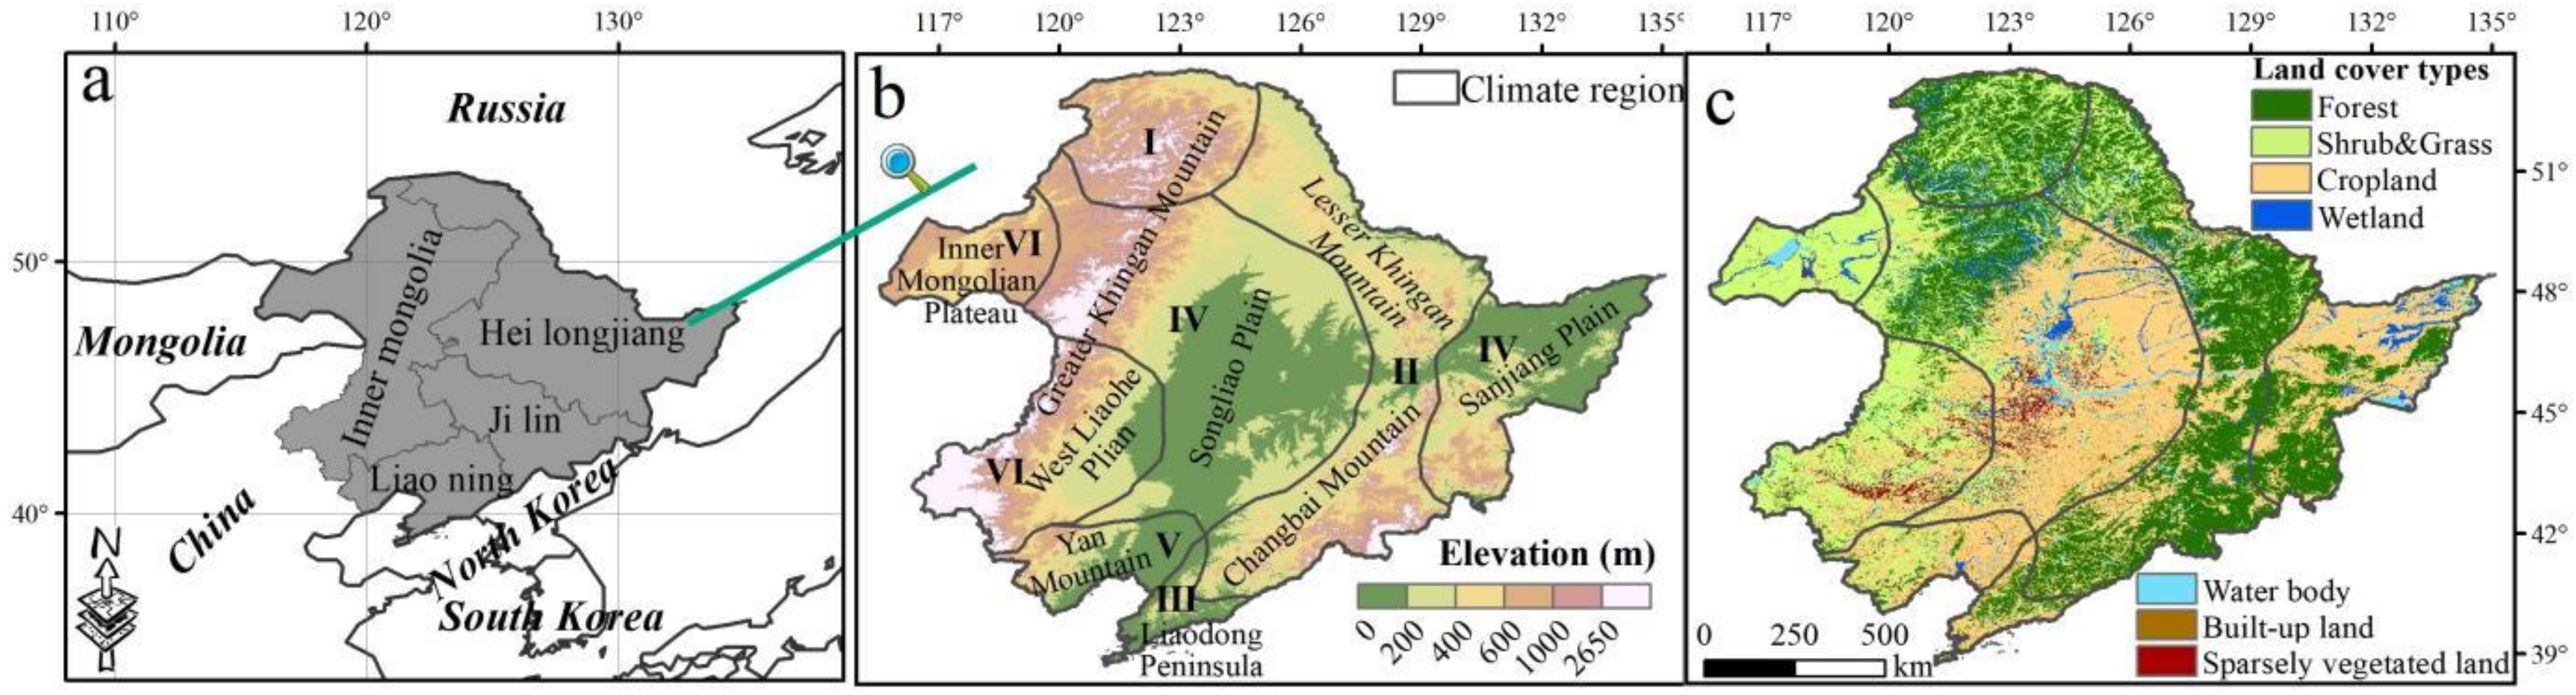
2.1. Study Area

NEC covers northeastern Inner Mongolia, Liaoning, Jilin, and Heilongjiang provinces, with an area of approximately 1.24 million km2 (115°32′–135°09′ E, 38°42′–53°35′ N; 0–2650 m a.s.l) (Figure 1a). It is an important grain-producing and ecological conservation area in China [17]. The topography is characterized by central plains surrounded by mountain ranges. The mountain ranges are mainly composed of the Greater Khingan Mountains in the west, the Lesser Khingan Mountains in the north, and the Changbai Mountains in the east (Figure 1b). NEC is dominated by a temperate continental monsoon climate with hot and rainy summers, as well as cold and dry winters. The annual average precipitation ranges from 300 to 1000 mm, and the annual average temperature varies between −3 and 10 °C, with an uneven spatial distribution. From south to north, NEC spans the warm, middle, and cold temperate zones. From east to west, NEC broadly transitions from humid to subhumid, and semiarid areas. These various hydrothermal conditions result in a variety of climatic regions in NEC. Using the classification criteria of temperature zones and arid/humid regions, NEC can be divided into six climatic regions under the scheme of climate regionalization for the period 1981–2010 [33], which updates the original climatic regionalization. The climate regions in NEC include the cold temperate humid (C-humid, I), middle temperate humid (M-humid, II), warm temperate humid (W-humid, III), middle temperate subhumid (M-subhumid, IV), warm temperate subhumid (W-subhumid, V), and middle temperate semiarid (M-semiarid, VI) regions. The main characteristics of climate regions in NEC are shown in Table 1.

2.2. Methods

2.2.1. Gridded SPEI

The SPEI calculated over a specific timescale represents the cumulative water balance over the total months of the specified time period (e.g., SPEI12 represents the 12-month cumulative water balance) [8,28]. To reflect the monthly, quarterly, and annual drought variation, we calculated SPEI for 1 month (SPEI01), 3 months (SPEI03), and 12 months (SPEI12) using the monthly mean precipitation and potential evapotranspiration data from 1990 to 2018. SPEI decreases indicate drier conditions, and vice versa. A drought occurs when the SPEI value is less than minus one standard deviation. A comprehensive explanation on the SPEI calculation procedure can be found in Vicente-Serrano et al. [28]. The monthly mean precipitation and potential evapotranspiration data at 1 km spatial resolution from 1990 to 2018 were obtained from the Loess Plateau SubCenter, National Earth System Science Data Center, National Science and Technology Infrastructure of China (http://loess.geodata.cn, accessed on 20 March 2021). The monthly mean precipitation data that we downloaded were spatially downscaled to 1 km from the 30′ Climatic Research Unit dataset with the climatology dataset of WorldClim using the delta spatial downscaling method [34]. They were evaluated using observations collected from 496 weather stations across China for the period 1951–2016, and the verification results are credible [34]. The monthly average potential evapotranspiration data that we downloaded were calculated from air temperature data using the Hargreaves method [35].
The drought categories of the SPEI are shown in Table 2. In this study, we extracted the land area of three different drought types that may have detrimental impacts on ecosystems and vegetation growth: monthly severe drought (SPEI01 < −1.5), quarterly moderate drought (SPEI03 < −1), and annual light drought (SPEI12 < −0.5). The drought area of different climate regions and land cover types were further investigated using annual light drought as an example.

2.2.2. Trend Analysis and Significance Testing

The Theil–Sen (TS) estimator [36] and Mann–Kendall (MK) test [37,38,39], which are commonly used to detect trends in hydro-meteorological time series, were performed in this study to examine the magnitude of raster-based annual and quarterly drought trends and their significance. These methods do not require the data to conform to a normal distribution, are insensitive to outliers, and can objectively characterize the overall trend of change. Z values that are positive or negative indicate an increasing or decreasing tendency, respectively. Furthermore, the absolute value of Z > 1.96 indicates a statistically significant trend at the 95% confidence level.
Linear regression was then applied to investigate the quarterly temporal trends based on SPEI03. Meanwhile, the 5-year moving average method was applied to smooth time series fluctuations and to highlight trends.

2.2.3. Mutation Point Detection

The mutation points of the raster-based annual dry–wet trend in NEC from 1990 to 2018 were extracted using piecewise linear regression. The time series is fitted before and after the trend turns assuming that the shortest period for the trend to turn is 5 years. The potential mutation point is determined by the point with the smallest sum of residual squares. It is then assessed whether the trend before and after the mutation point passes the significance test (p < 0.1). If both pass the significance test, the potential mutation point becomes the actual mutation point.
Furthermore, the sequential MK test method was used to determine abrupt changes in the temporal quarterly dry–wet trend. As a result, a forward (UF) and backward (UB) curve will be formed. The time series statistical curve is denoted by UF, and the inverse time series statistical curve is denoted by UB. If UF > 0, the data sequence exhibits an upward trend, and vice versus. The significance level of 0.05 corresponds to a threshold value of ±1.96 for the UF and UB curves. A UB crossing the threshold indicates that the series has a significant trend over this period. The mutation point is determined as the time corresponding to the intersection of the two curves within the threshold [40].

2.2.4. Hurst Exponent

Hurst exponent is an effective statistical method for quantitatively assessing the durability of changes in time series data over long periods and is widely applied in climatology and vegetation studies [41,42,43]. In this study, the Hurst exponent based on the rescaled range (R/S) analysis method was used to calculate the Hurst exponent of SPEI12 from 1990 to 2018, and then to study the spatial distribution and persistence of SPEI12 change trend in the future. The complete calculation procedure is shown in Hurst [41] as well as Mandelbrot and Wallis [42]. Hurst exponent values ranging from 0 to 1 can be classified into three categories: if 0 < H < 0.5, the time series has anti-persistence, and the sequence has an opposite trend in the future. When H equals 0.5, changes in the time series are stochastic, and the trend in the past has no effects on the future. If 0.5 < H < 1, the time series has persistence, and the future trend will be consistent with the changing trend observed during the study period. The closer H is to 0, the more inconsistent the time series; conversely, the closer H is to 1, the more consistent the sequence.

3. Results

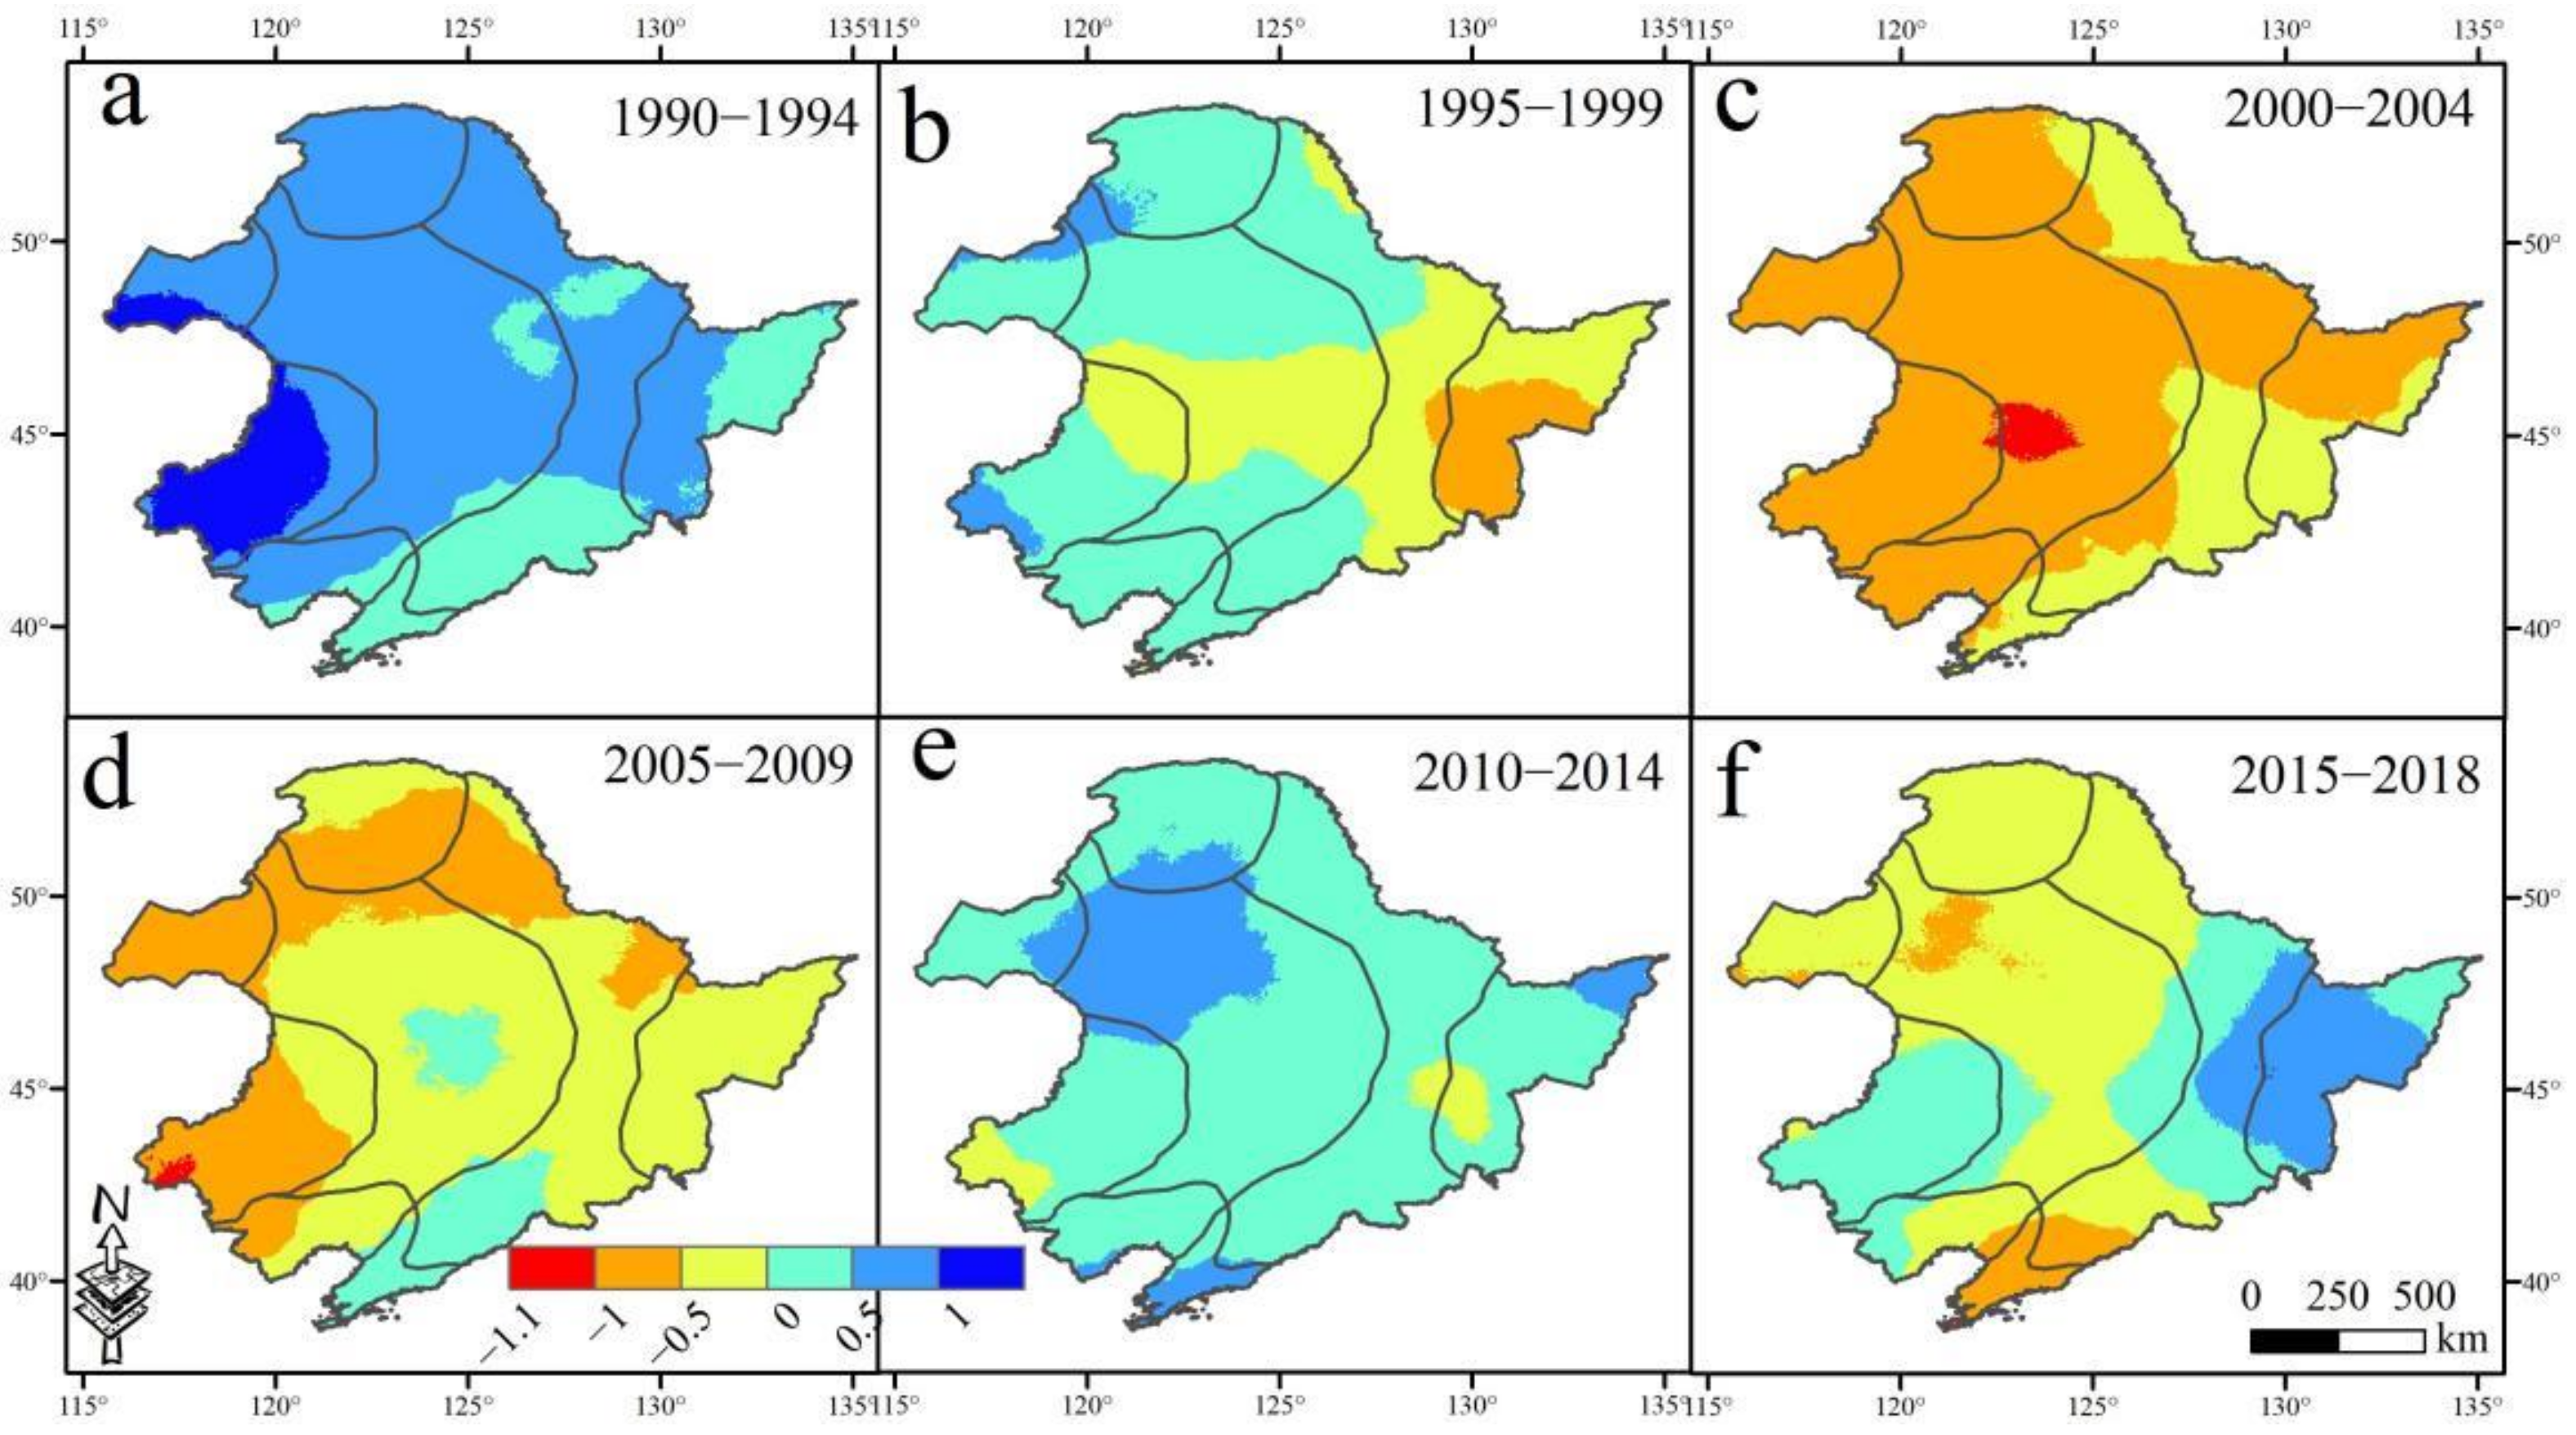
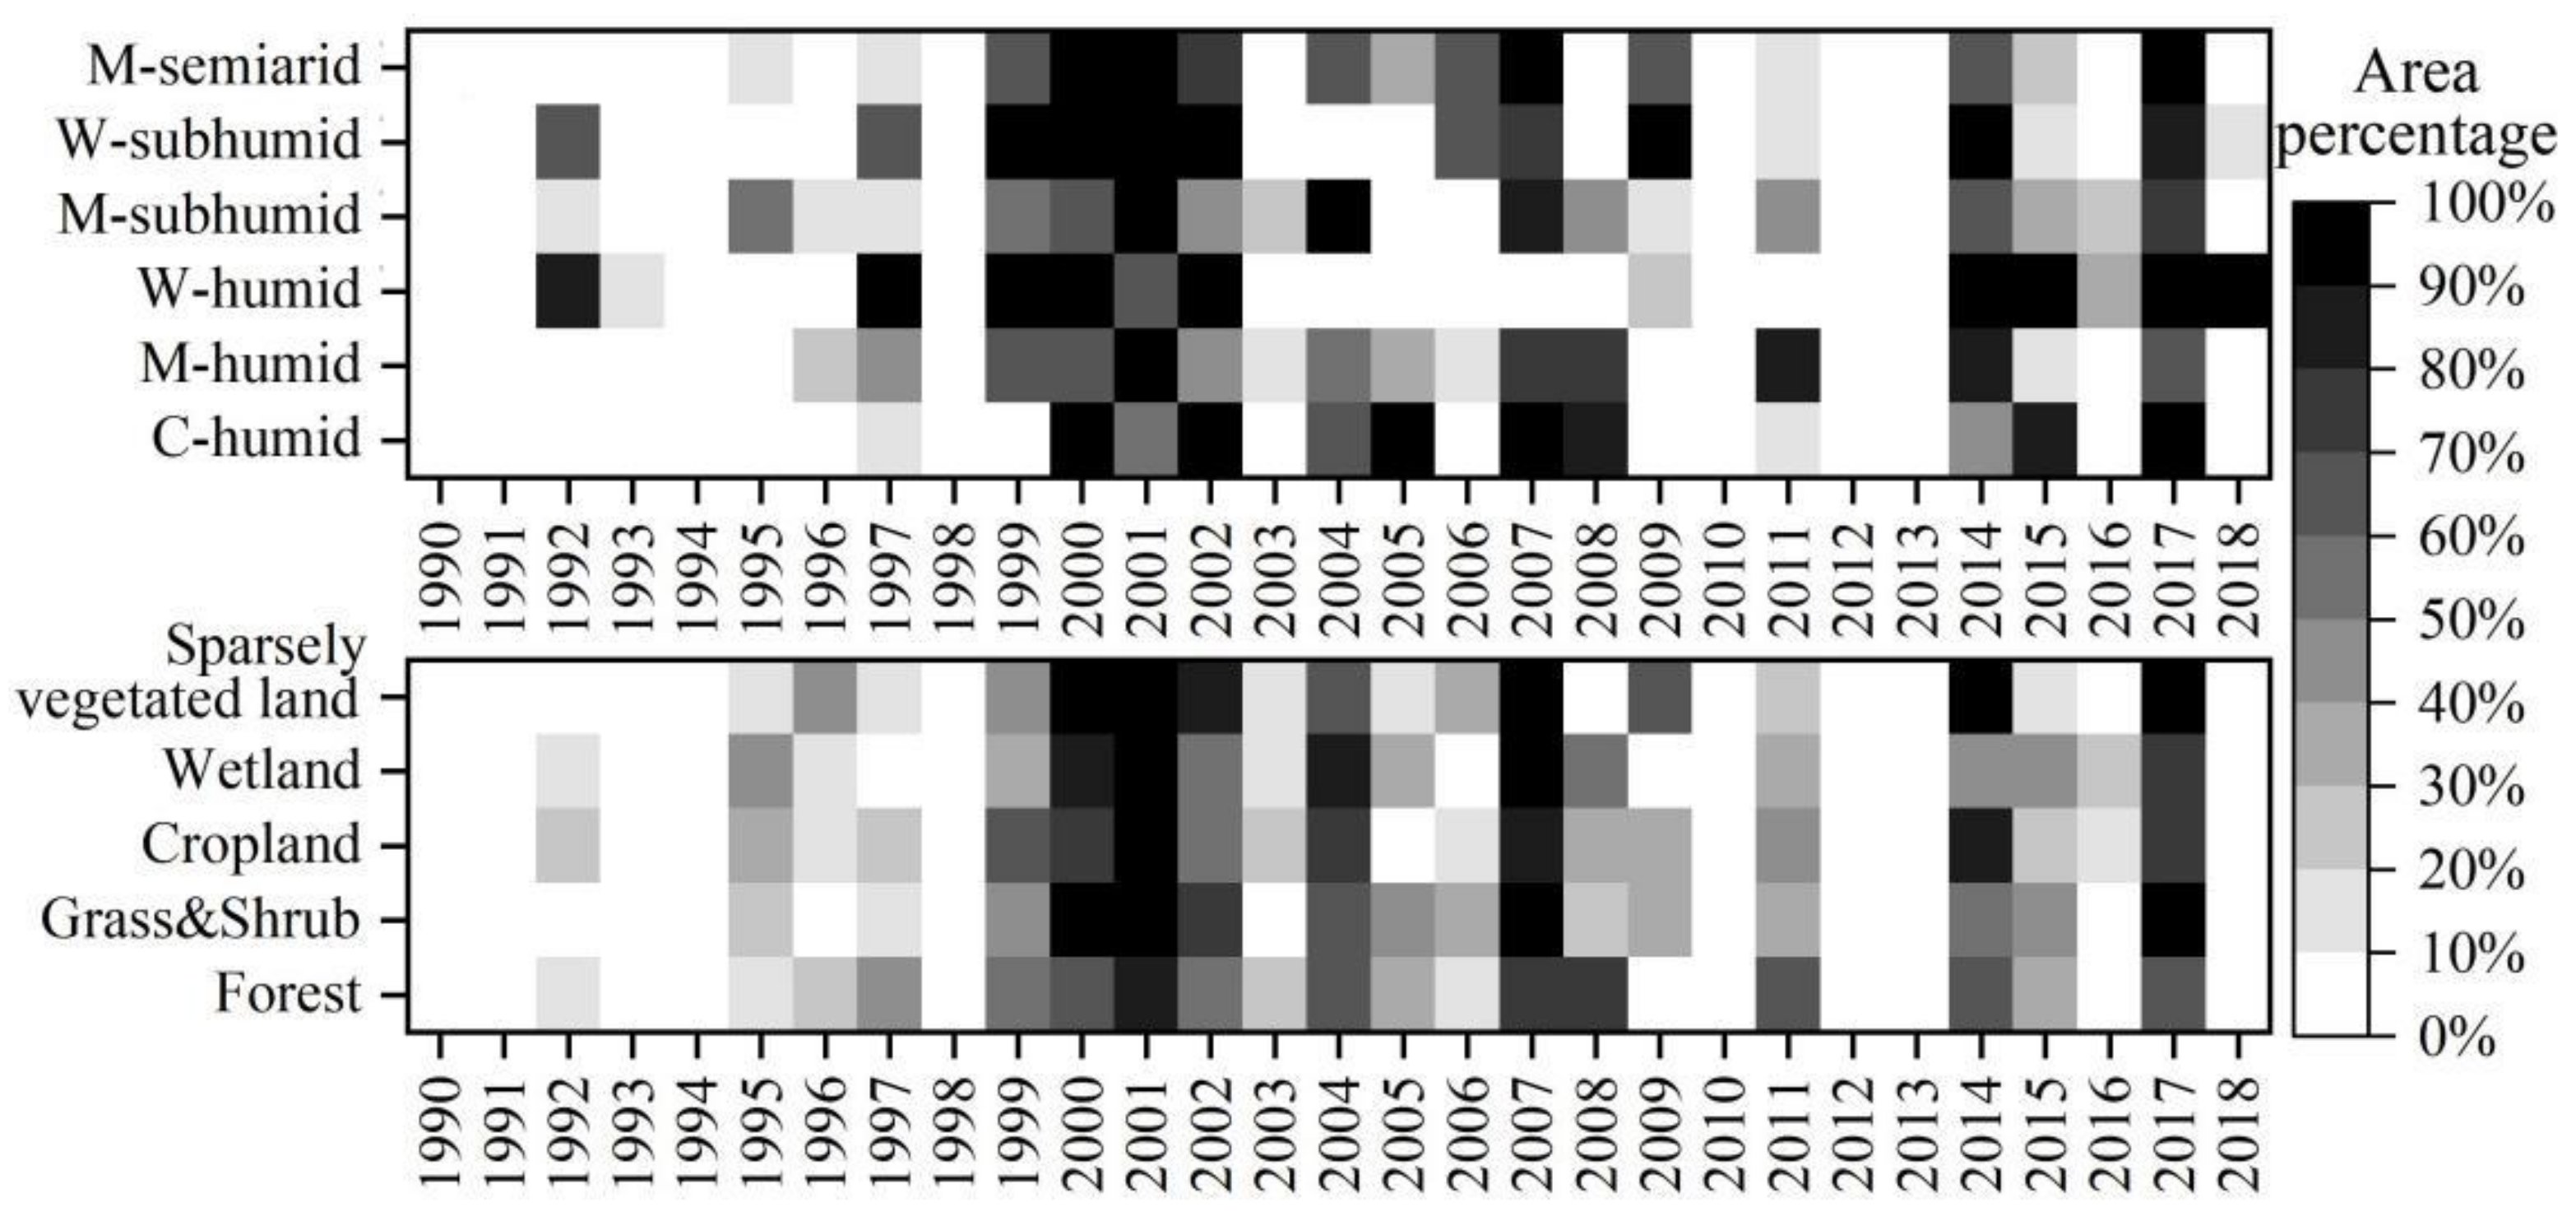
3.1. Spatiotemporal Dynamics of Dry–Wet Conditions in Northeast China

To show the spatial variation of annual dry–wet conditions, the study period was divided into six phases at 5-year intervals. The first phase was the wettest in NEC, with light wet dominating (Figure 2a). NEC transitioned from light wet to near-normal, and then to light and moderate drought from the first to the third phase (Figure 2a–c). The region of light and moderate drought accounted for 78.51% in the third phase, which was the highest compared to the other phases, with moderate drought primarily occurring in the Songliao Plain’s midsection (Figure 2c, Table 3). Drought conditions eased in the fourth stage compared to the previous phase, with light and moderate drought covering 32.31% of the total area, primarily in the west and north (Figure 2d). The drought was clearly relieved from the fourth to the fifth phases, with NEC exhibiting near-normal and light wet conditions (Figure 2d,e). In the last phase, the drought worsened once more, with light and moderate drought covering 6.39% of the total area (Figure 2f).
Figure 3a demonstrates that annual severe drought events were recorded in 2001, 2007, 2014, and 2017, accounting for 31.02%, 28.91%, 20.31%, and 10.08% of the total area, respectively. Annual extreme drought events occurred in 2007 and 2014, affecting 16.16% and 11.77% of NEC, respectively. The linear trend showed that the annual light drought area percentage in NEC climbed by a trend of 0.7%/a during the study period (Figure 3b). The specific performance was increasing (1990–2007), declining (2008–2013), and then increasing again (2014–2018). In addition, the annual light drought events were spaced by 1–2 years (Figure 3a). Among them, the drought area in 1999–2002, 2004, 2007, 2014, and 2017 covered more than half of NEC (Figure 3b).
NEC’s quarterly moderate drought area varied by season each year (Figure 4a). On the timeline of the study period, spring and winter exhibited the earliest drought events, followed by summer, and the last occurred in autumn. When the proportion of drought area for each season during the study period was superimposed, we discovered that summer had the largest proportion, followed by spring and winter, and autumn had the lowest. Moreover, there was generally only one season per year when the proportion of drought area exceeded 50%, but there were two (summer and autumn) and three (summer, autumn, and winter) seasons in 2001 and 2007, respectively.
Similarly, the monthly extreme drought area increased, declined, and then increased again over the last three decades (Figure 4b). Drought conditions with a severe drought percent greater than 40% were most prevalent throughout 2000–2009, notably in May and June (Figure 4b).
We could further differentiate drought areas in percent in different climatic regions and land types using the annual light drought as an example (Figure 5). The warmer the temperature zone was, the more sensitive it was towards drought under the same hydrological conditions. Within the same temperature zone, the drier the land was, the higher the proportion of land experiencing drought was. Forests contained the smallest share of drought area compared to other land cover types, followed by croplands and wetlands, shrub and grass, and sparsely vegetated lands showing the highest drought-affected area.

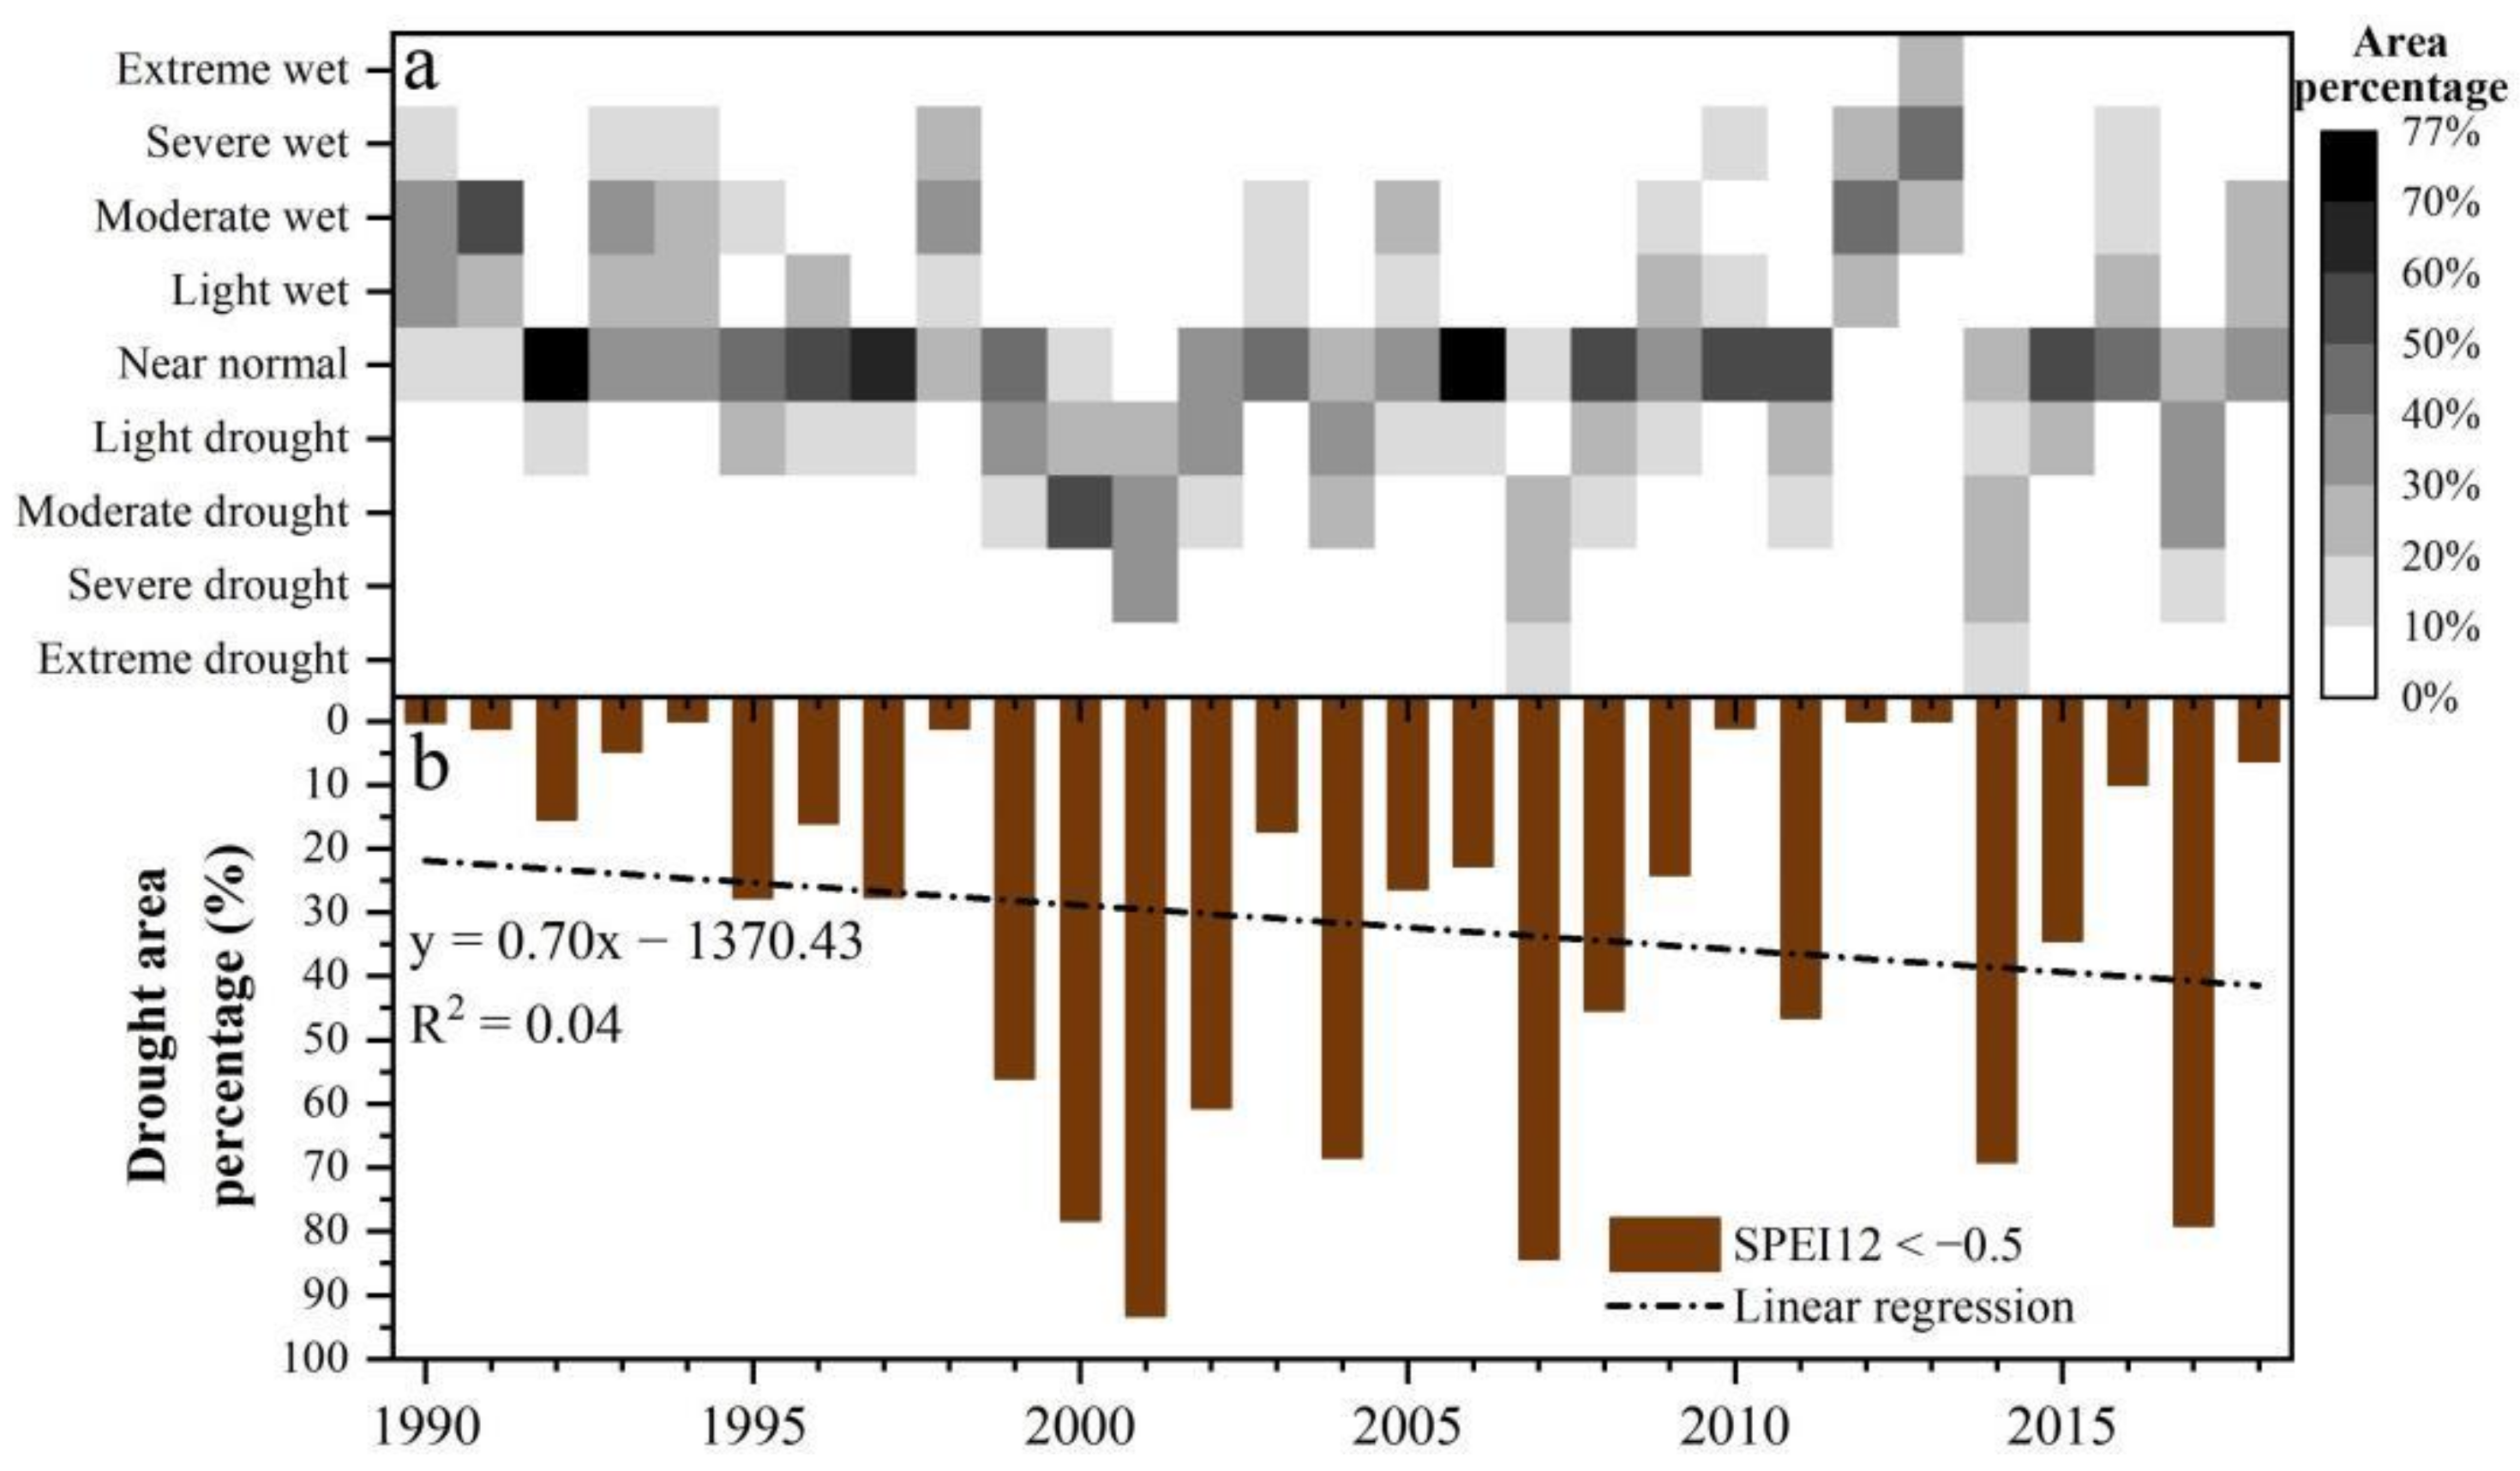
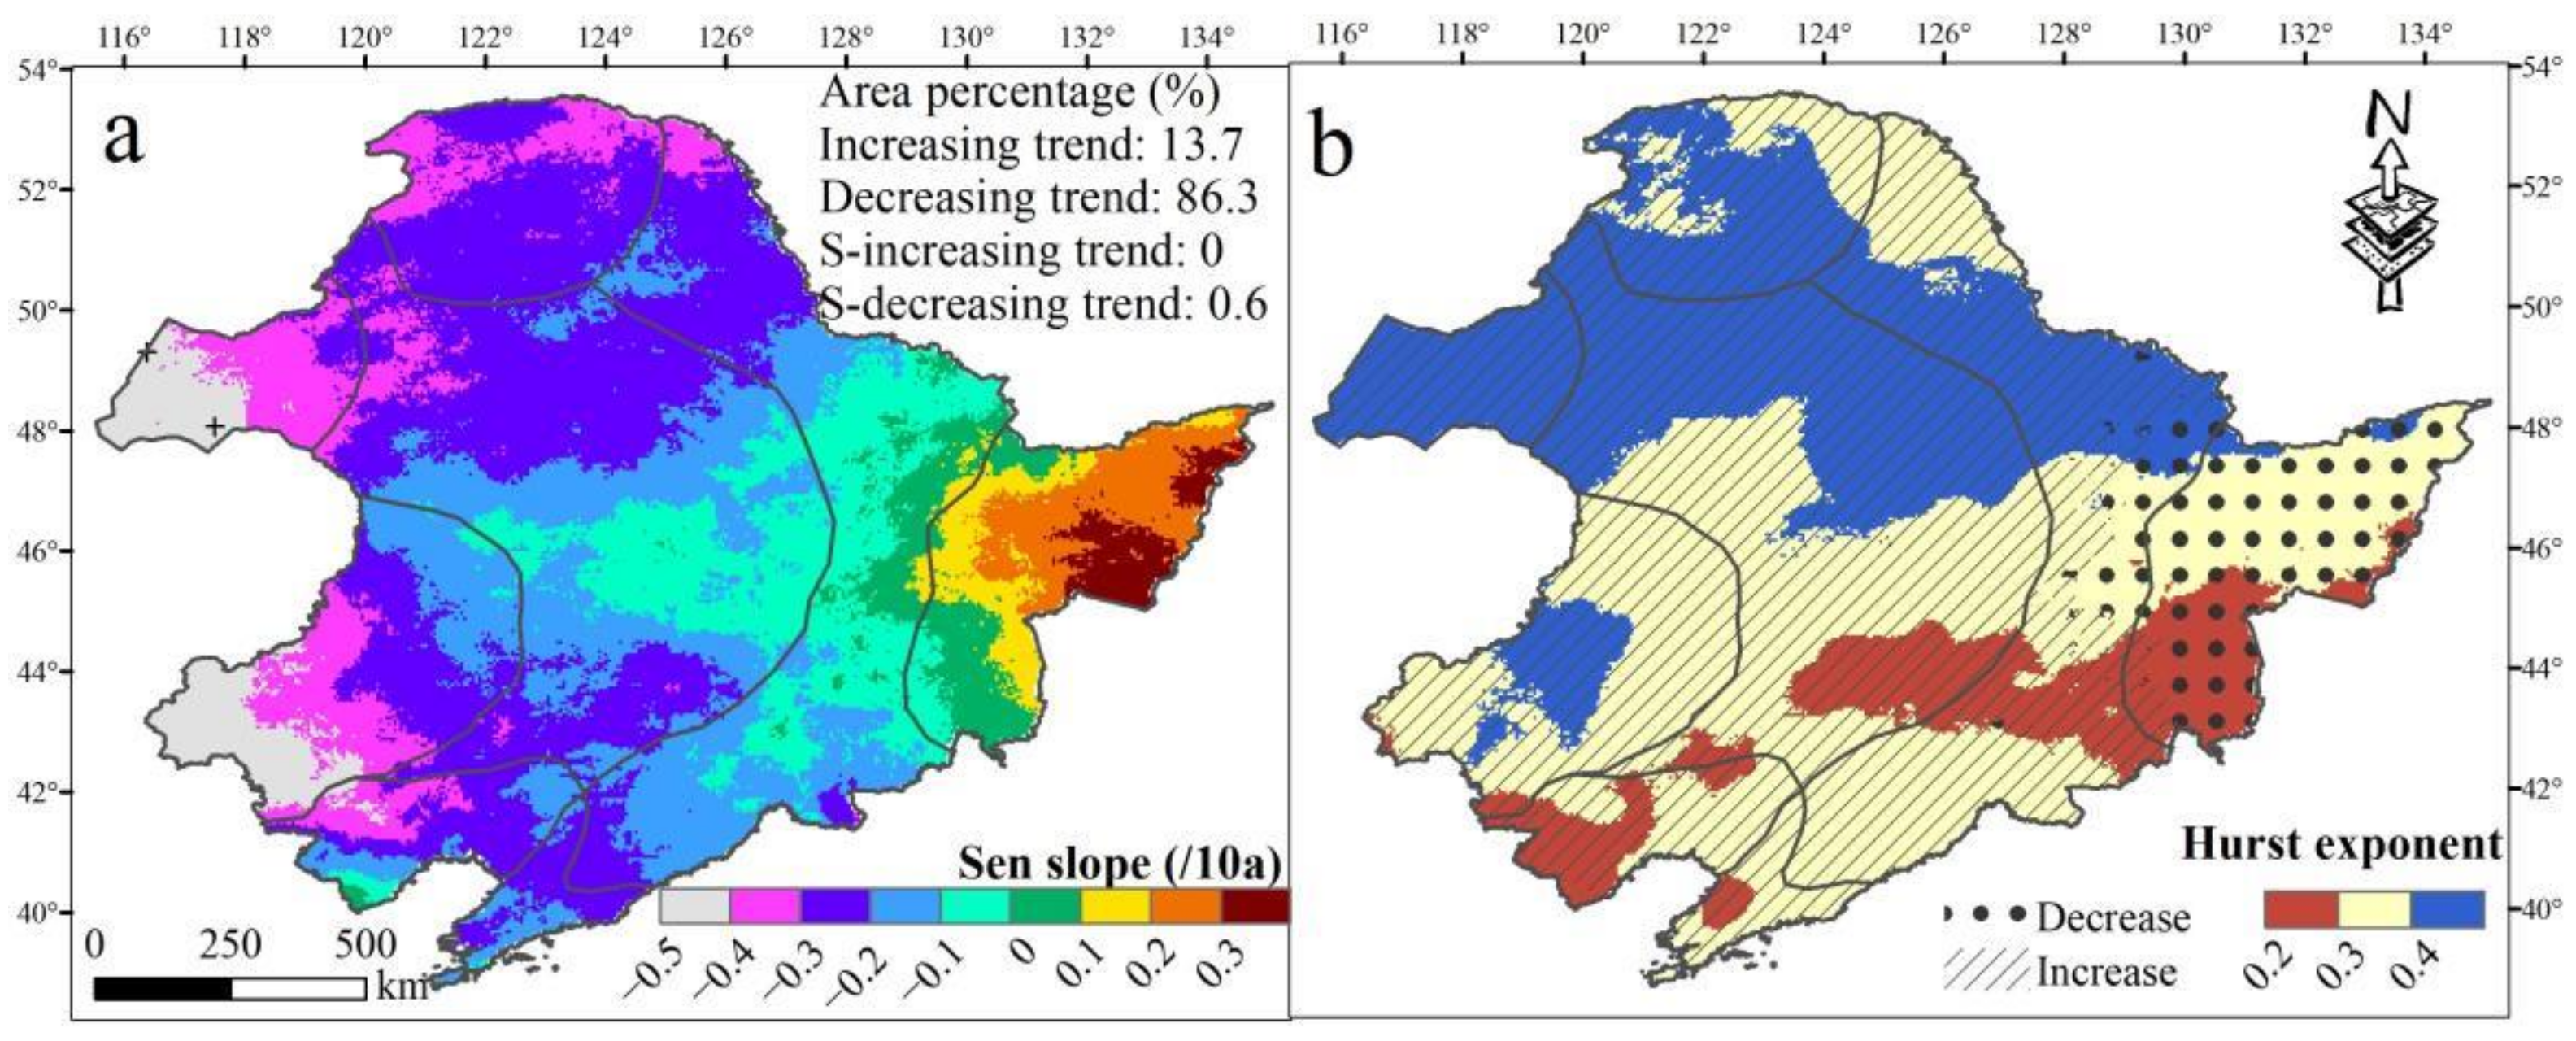
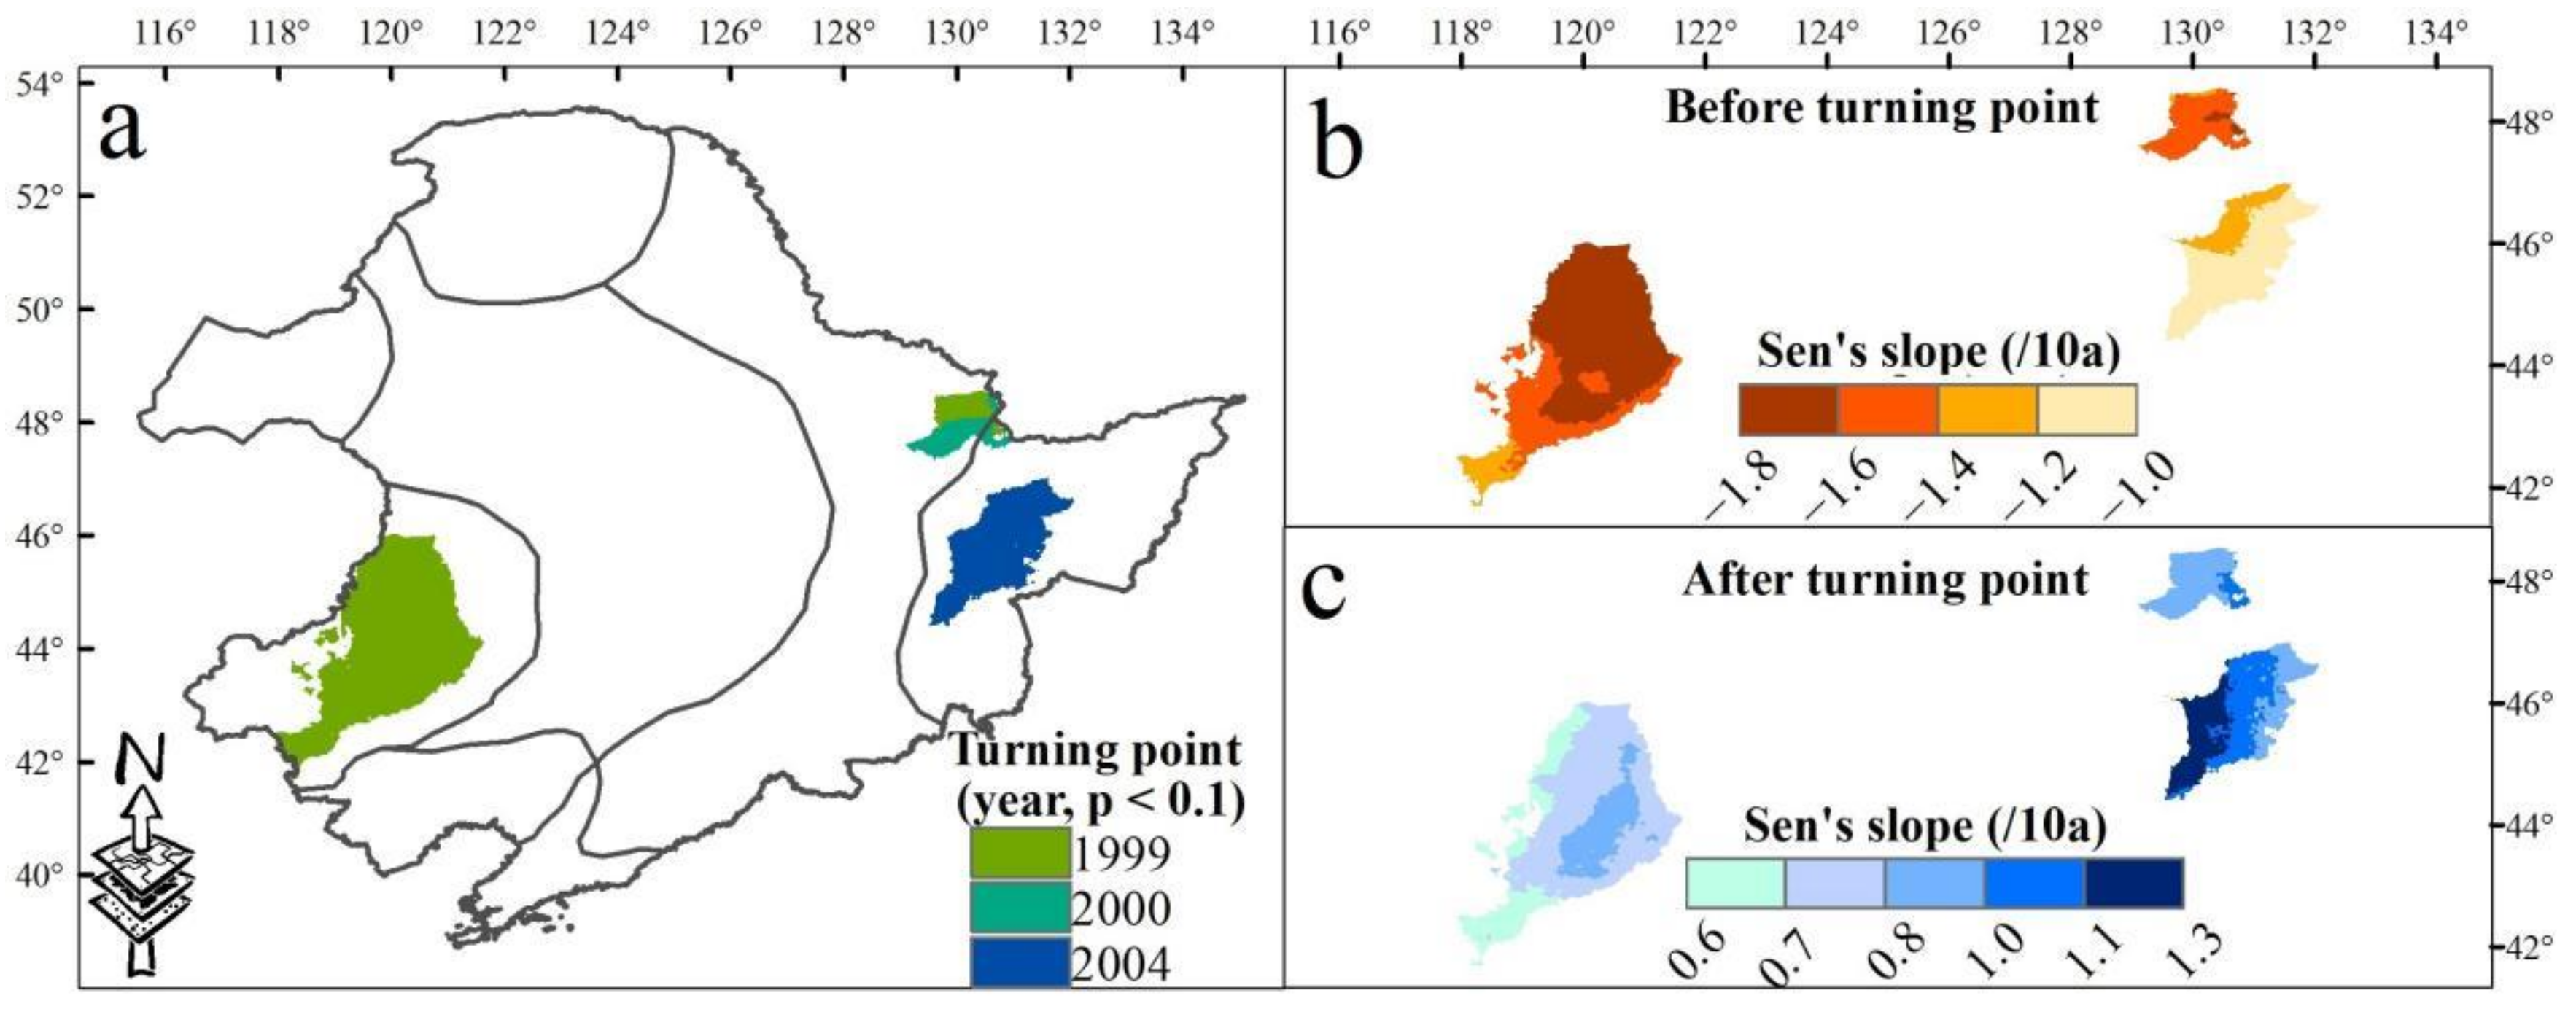
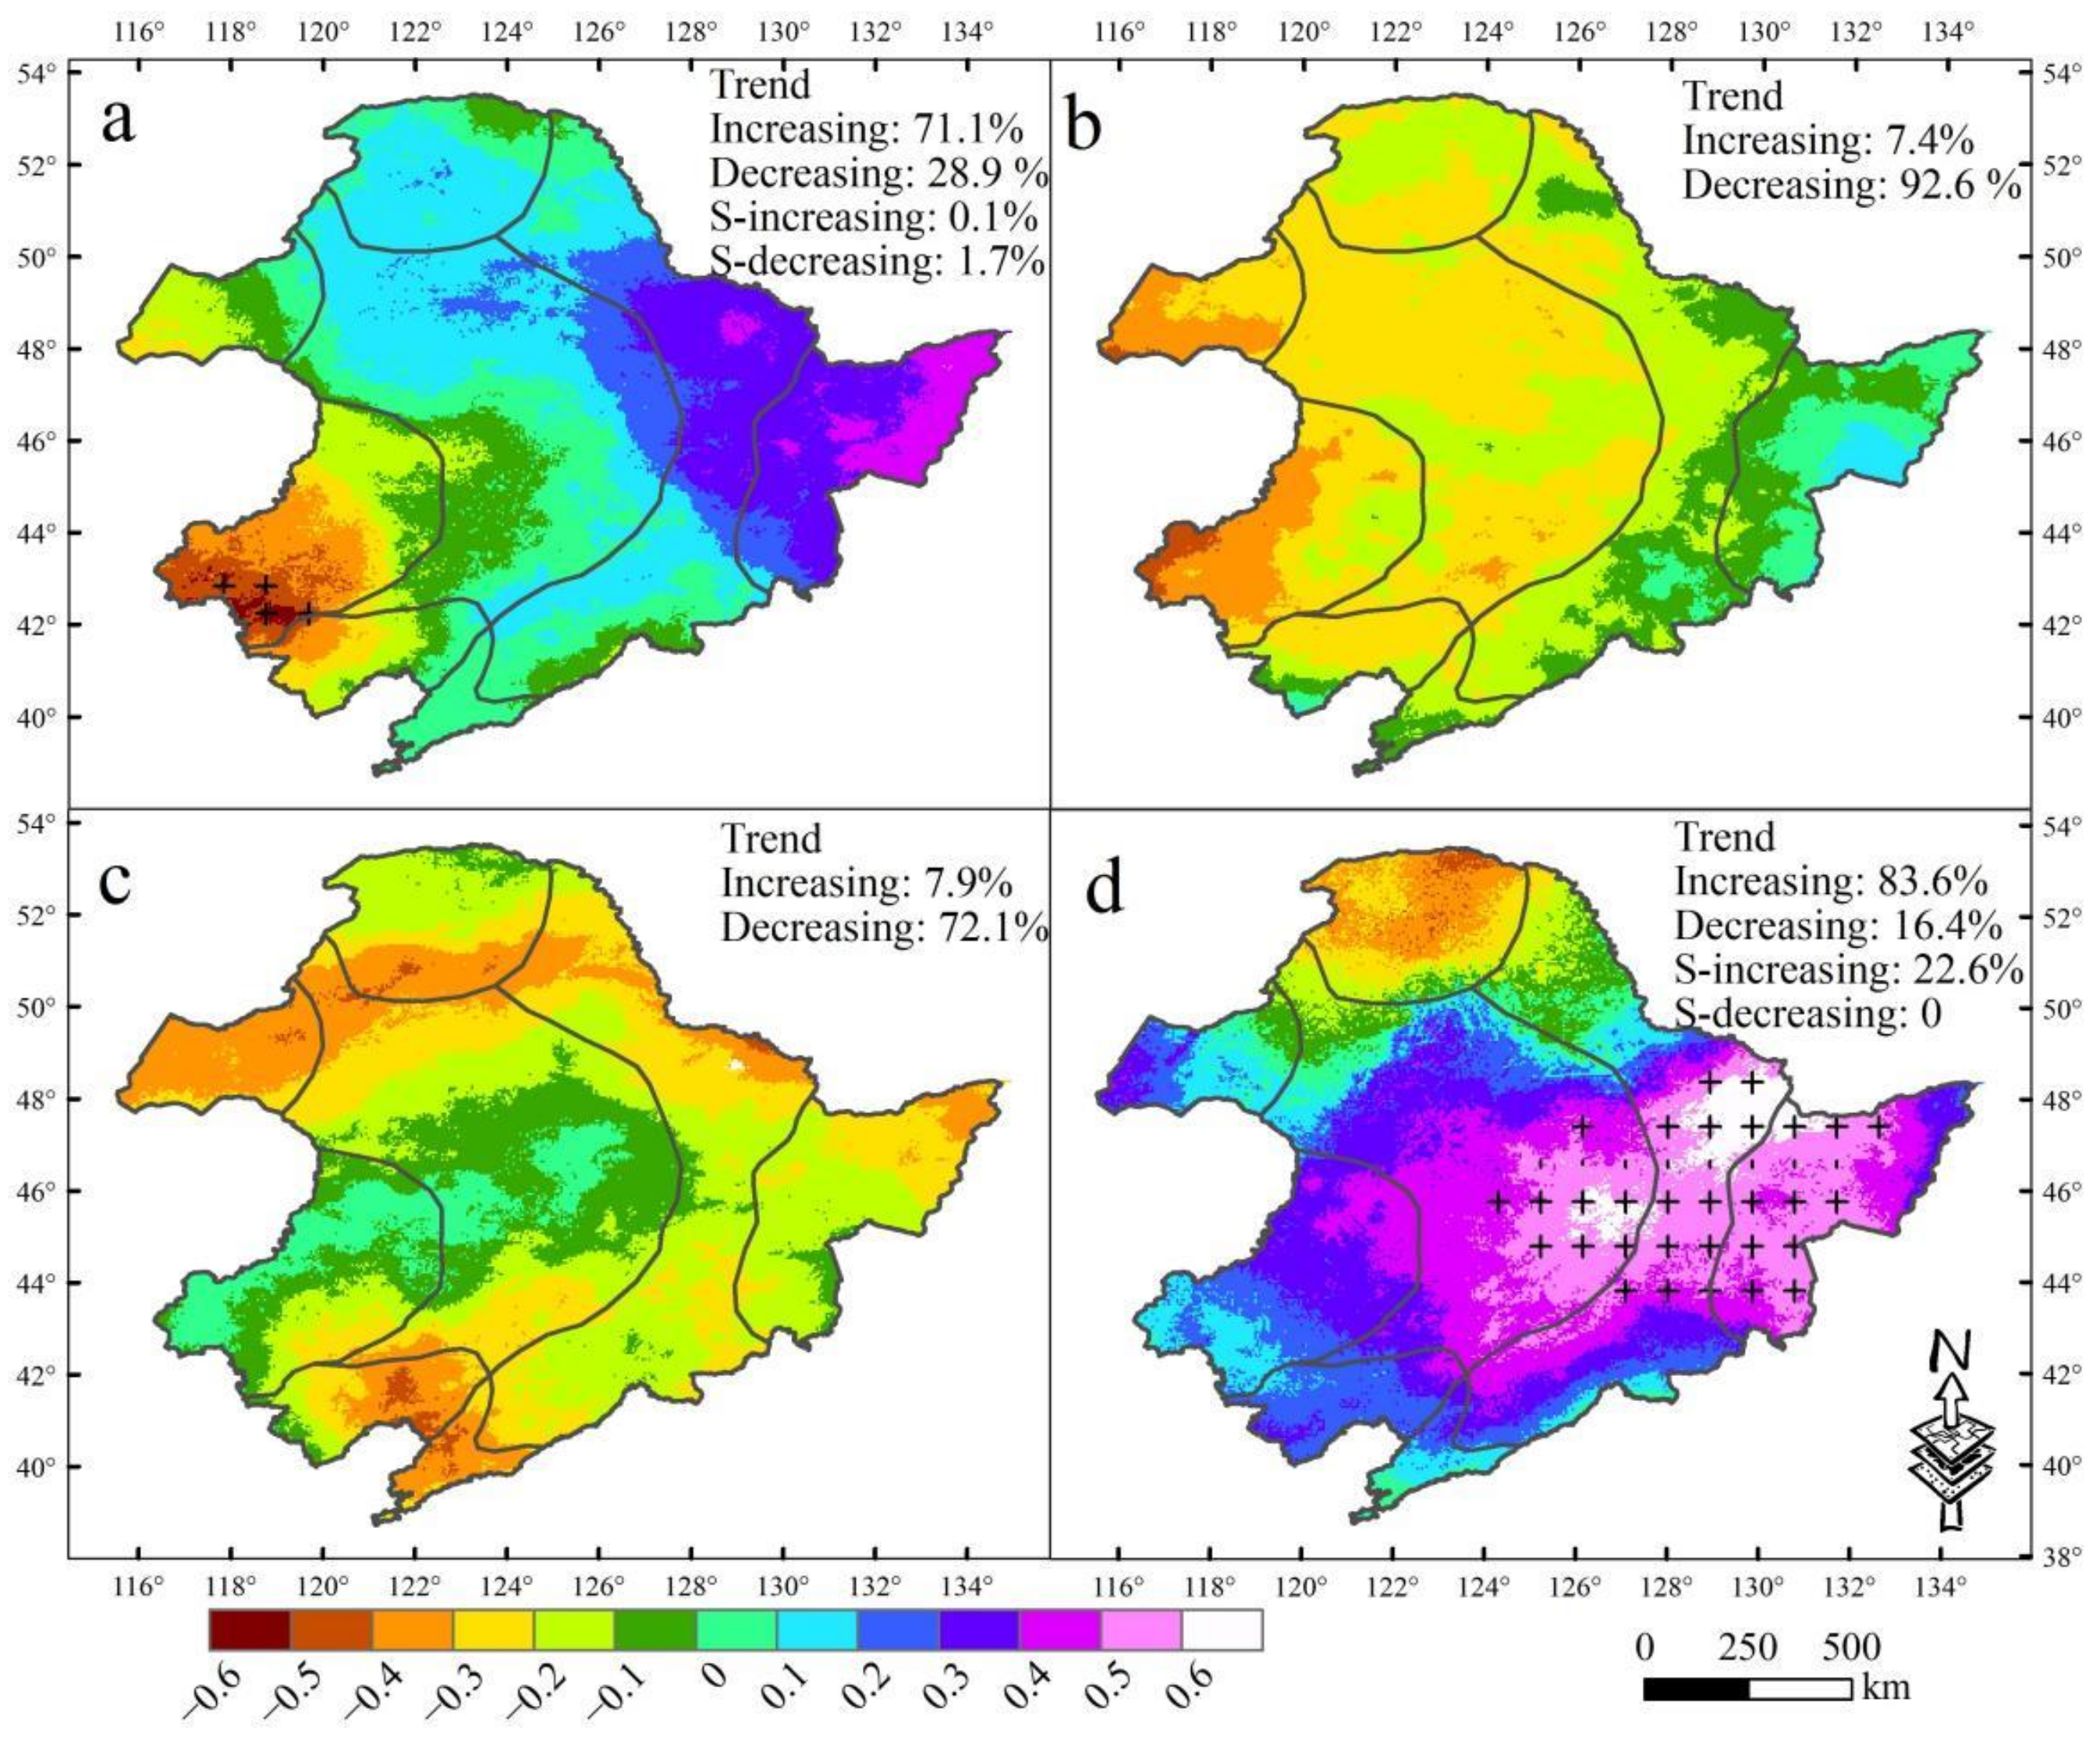
3.2. Annual Dry–Wet Trends and Mutation Points

Spatial patterns of SPEI12 trends can roughly be characterized through their east–west contrasts (Figure 6a). Wetting in the eastern region and drying in the western region were found to be the most significant. A decreasing trend was present in 86.3% of the entire area. Only 13.7% of NEC, mostly concentrated in Sanjiang Plain and its southern mountains, exhibited an increasing tendency. Additionally, the Hurst exponent, which predicts the trend in future dry/wet conditions, was derived based on SPEI12 data from 1990 to 2018. In the entire NEC, the Hurst exponent was less than 0.5 (Figure 6b). The dry–wet trend in the future is therefore inconsistent with the current situation. Sen’s slope analysis and the Hurst exponent results were superimposed to determine the spatial distribution of forthcoming dry–wet trends (Figure 6b). The areas with increased and decreased trends would cover 86.3% and 16.7% of NEC in the future, respectively.
The consistency of dry–wet trends during the study period was examined using a grid-based mutation point extraction method. The trend of SPEI12 in the western Liaohe Plain and eastern part of Lesser Khingan Mountain turned from a drying trend (−1.6/10a and −1.5/10a, respectively) to a wetting trend (0.7/10a and 0.9/10a, respectively) in 1999–2000 (Figure 7a–c). In 2004, the trend in the western Sanjiang Plain changed from a drying trend (−1.1/10a) to a wetting trend (1.1/10a) (Figure 7a–c).

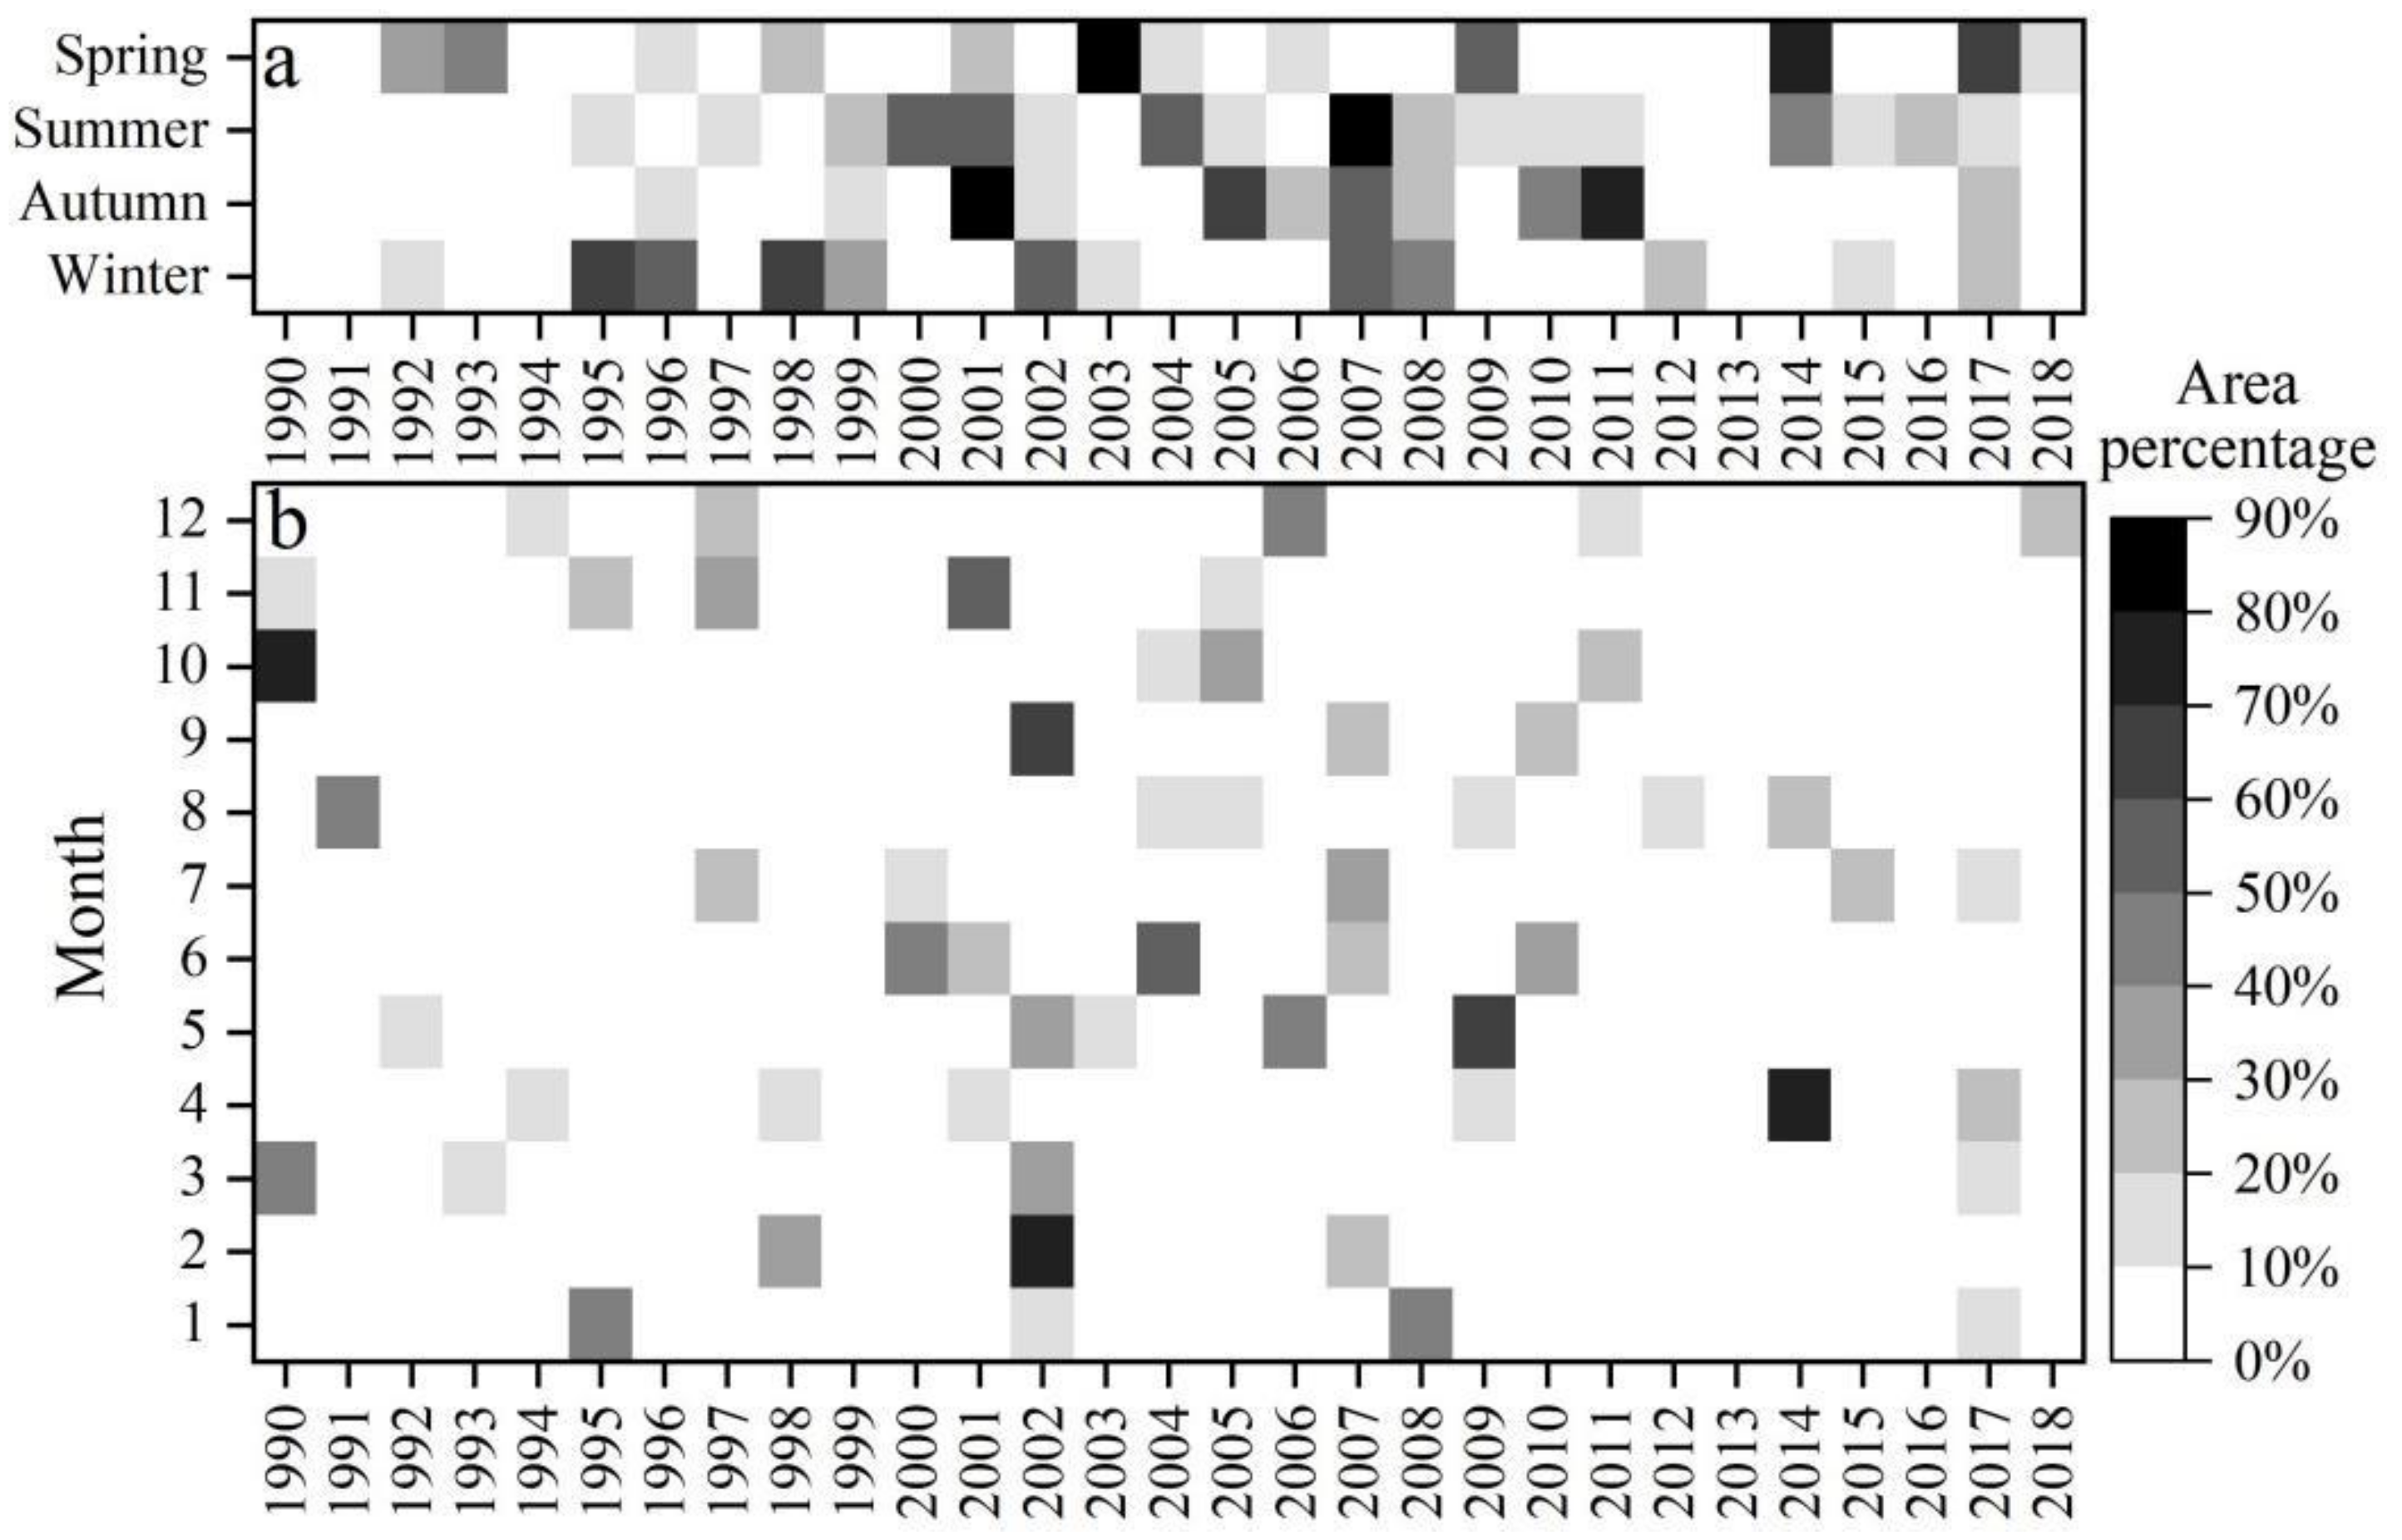
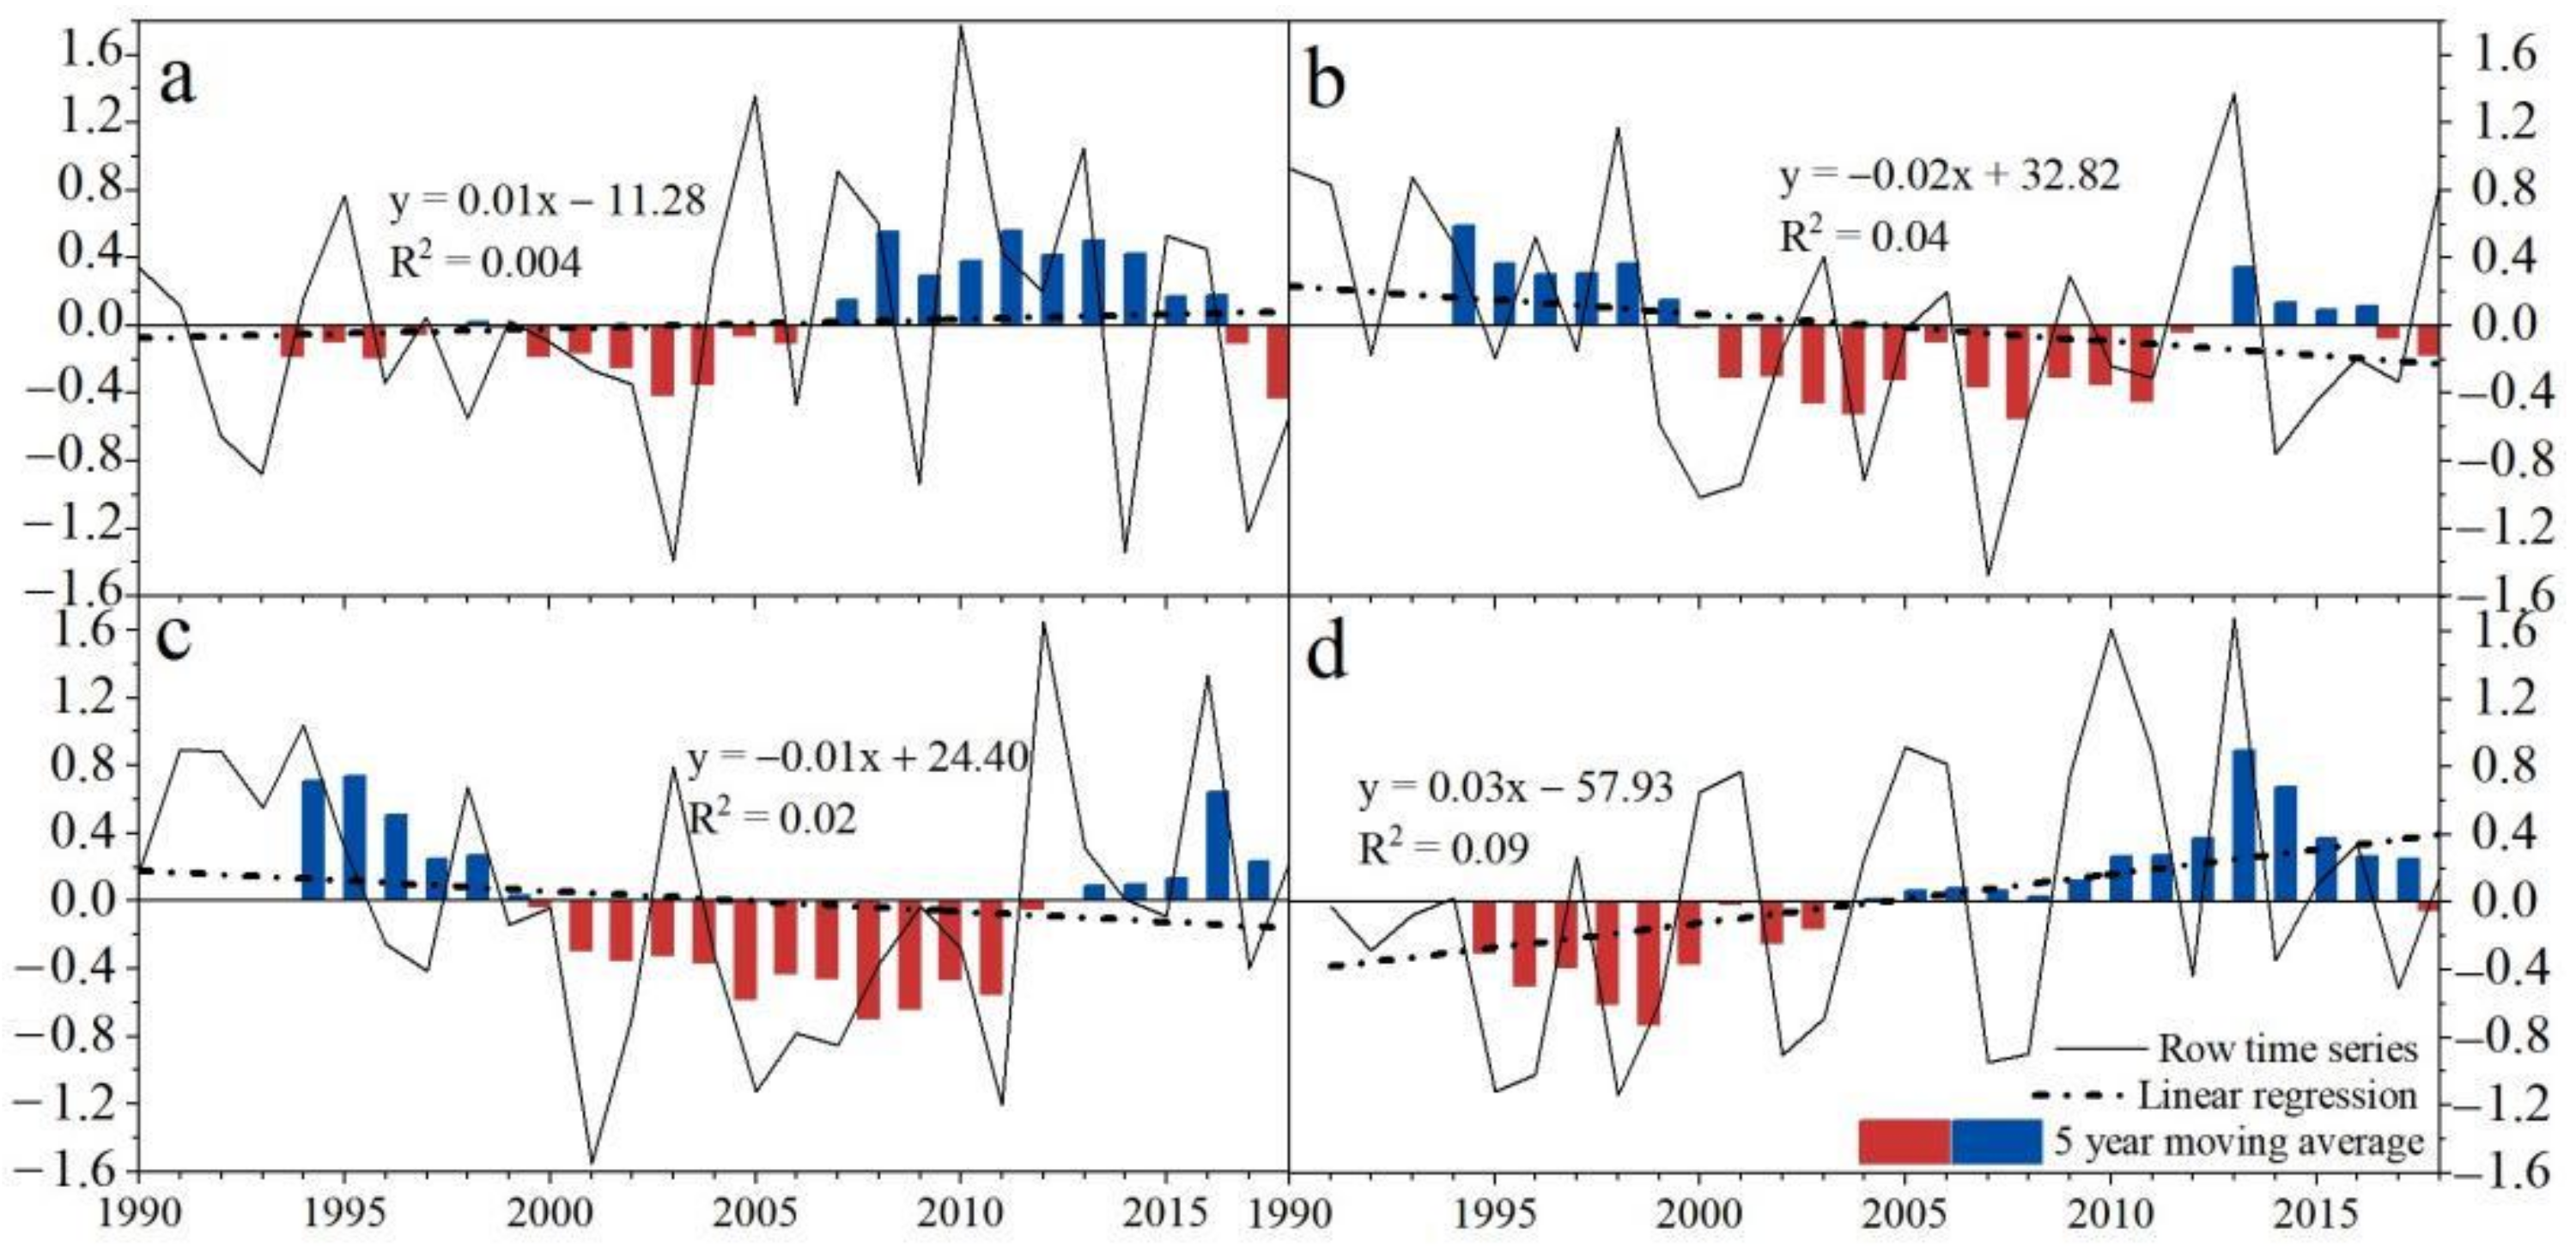
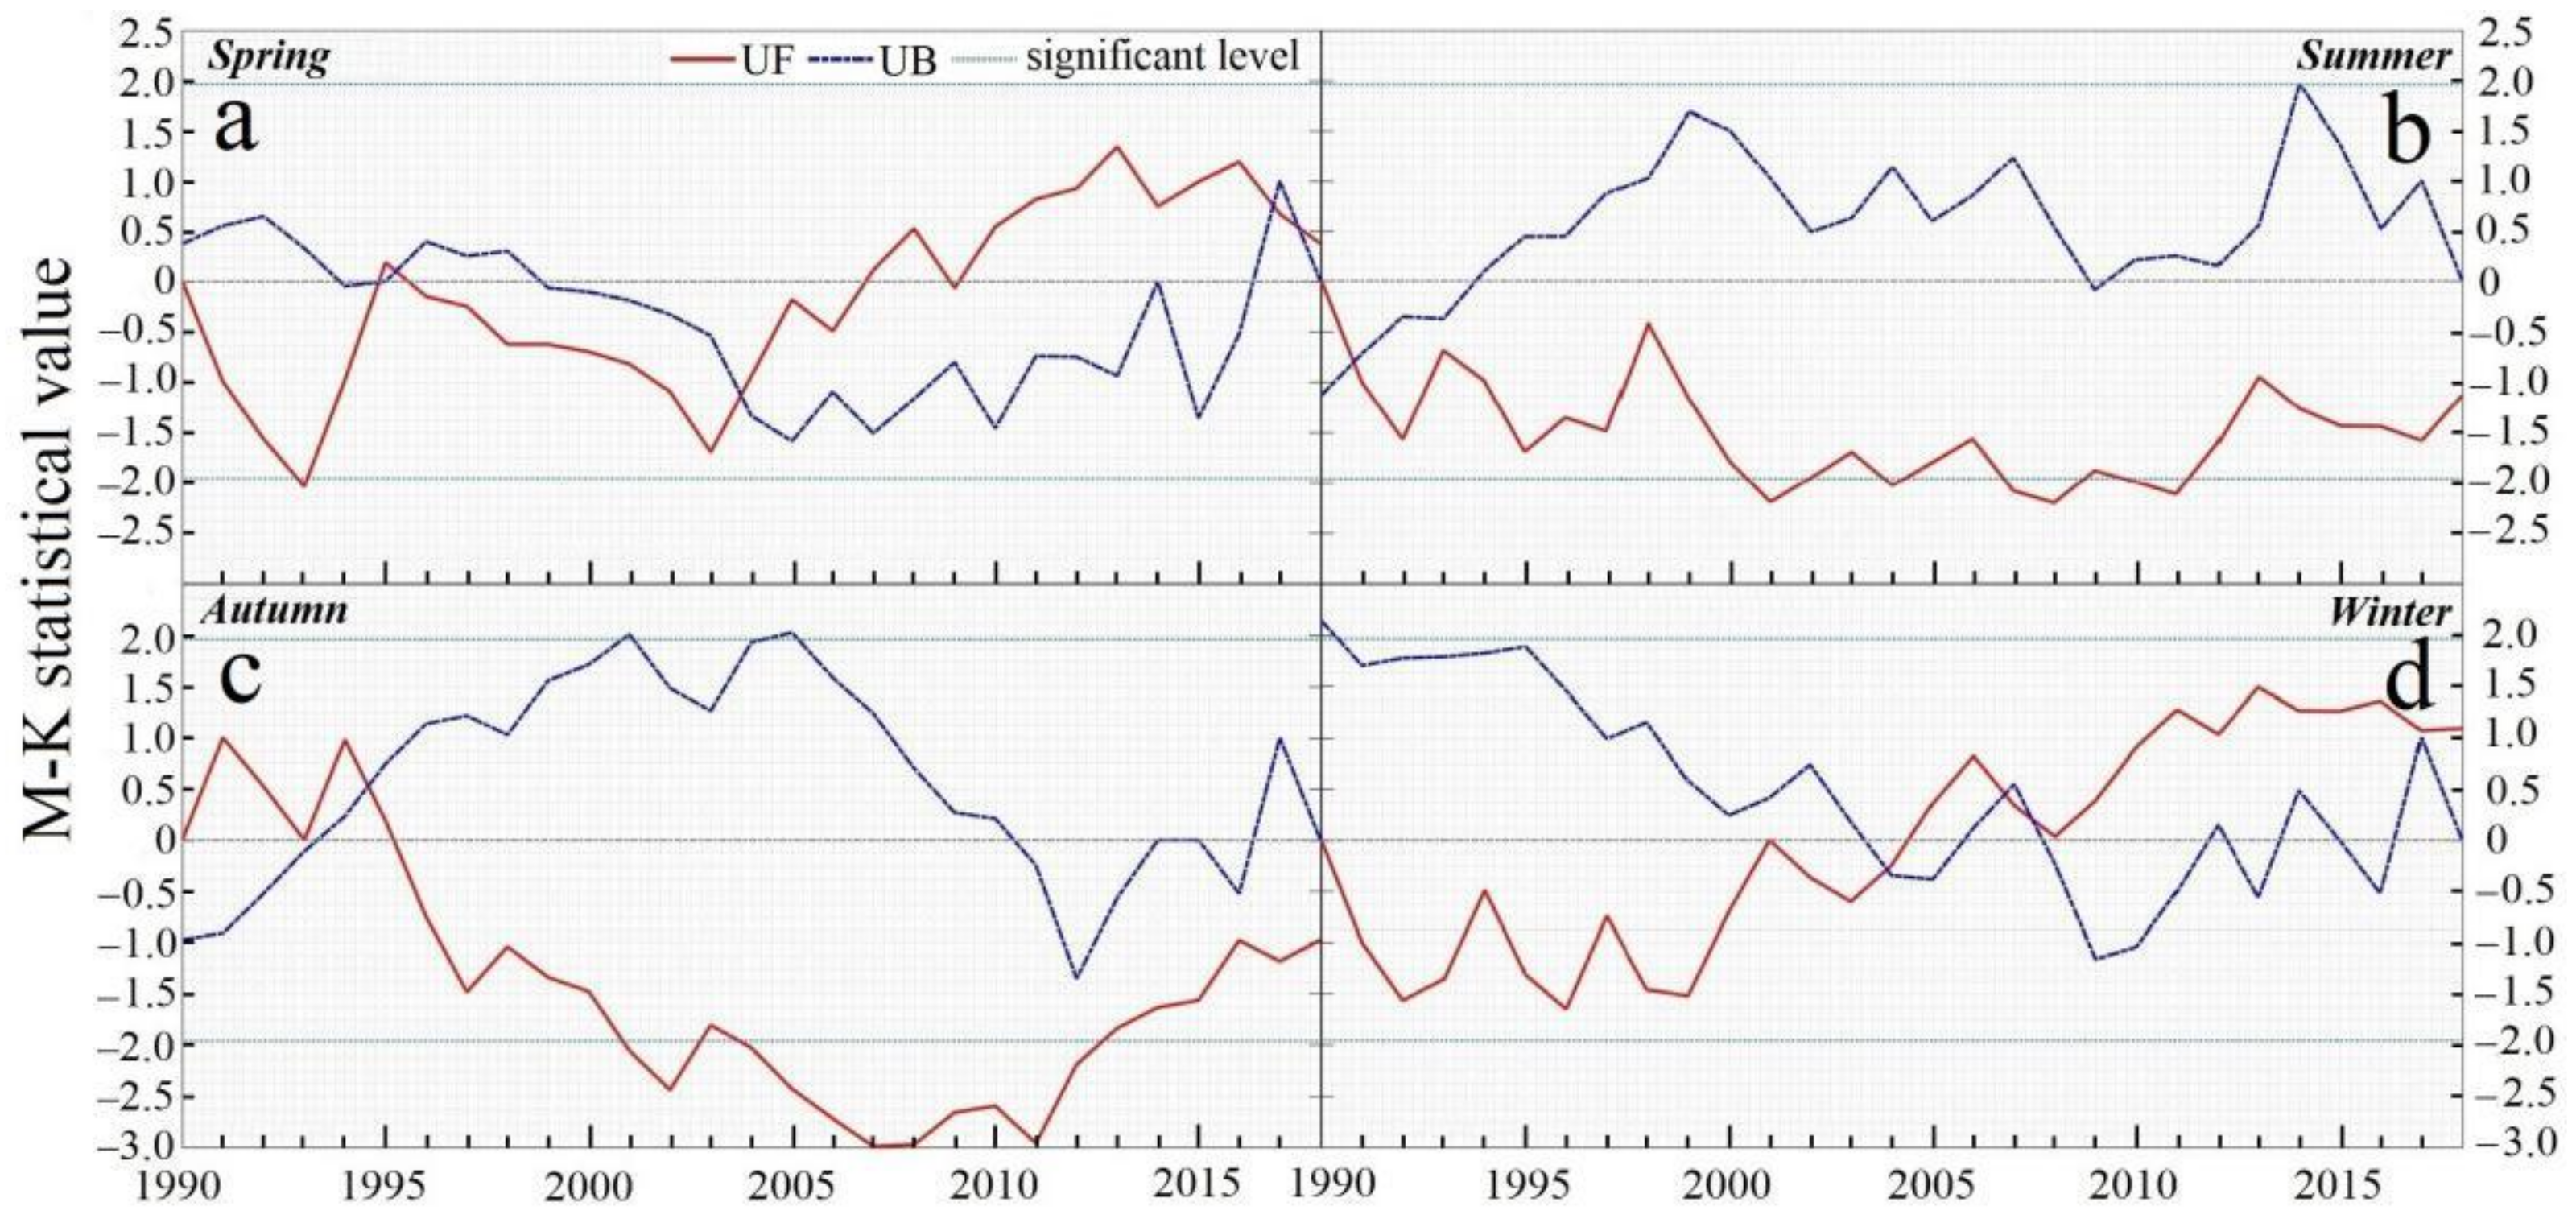
3.3. Quarterly Dry–Wet Trends and Mutation Points

The SPEI of spring and winter increased at a linear rate of 0.1/10a and 0.3/10a from 1990 to 2018, respectively, showing a wetting trend (Figure 8a,d). The SPEI of summer and autumn decreased at a linear rate of −0.2/10a and −0.1/10a, respectively, showing a drying trend (Figure 8b,c). From the UF curve, it can also be seen that the SPEI in spring and winter showed an increasing trend, while that in autumn and winter showed a decreasing trend (Figure 9). Between the critical line at the 0.05 significance level, the UF and UB curves for spring and winter intersected in 2003–2004, which is the onset of the mutation. After 2004, the UF curve rose obviously, but did not exceed the critical line (±1.96) (Figure 9a,d). The UF and UB curves in summer and autumn intersected in 1991 and 1994–1995, respectively, and exceeded the critical line (−1.96) in 2000–2001, with a significant decreasing trend (Figure 9b,c).
The regions with increasing SPEI in spring and winter occupied 71.1% and 83.6% of the entire area, respectively (Figure 10a,d). Moreover, 1.7% of NEC experienced a significant dry trend in spring, mostly in the southwest of NEC, whereas the eastern part of NEC experienced a notable wet trend (Figure 10a). The areas tending to be dry in winter were primarily found in the northern part of NEC, whereas 22.6% of the total area became significantly wetter, primarily in the central and eastern parts of NEC (Figure 10d). In addition, 92.6% and 92.1% of the total area displayed a drying trend in summer and autumn, respectively (Figure 10b,c). NEC demonstrated a transition from a dry trend to a wet trend from west to east during the summer (Figure 10b). In contrast to the wet trend in summer observed in the Sanjiang Plain, the wetter regions in autumn were primarily found in the Songliao Plain’s central region and the Greater Khingan Mountain’s southern region (Figure 10c).
For various climate regions and land cover types, we extracted the average annual and quarterly SPEI trends (Figure 11). Overall, a strong drought trend was visible within shrub and grass and sparsely vegetated lands (mainly in M-semiarid), followed by wetlands, forests, and croplands. For the climate regions, M-semiarid, W-subhumid, and C-humid (primarily forest) showed the highest drought trend. Specifically, spring showed a wet trend except for W-subhumid and M-semiarid. In winter, all climate regions apart from C-humid showed a wet trend. All climate regions and land cover types revealed annual and seasonal drying trends in summer and autumn. In the same temperature zone, the drier the land, the stronger the drought trend in spring and summer.

4. Discussion

4.1. Driving Factors of Drought Dynamics and Mutation Points

NEC has exhibited a general dry tendency over the past three decades, as evidenced by the percentage of annual drought areas increasing by 0.7% per year and 86.3% of the area exhibiting a decreasing trend of SPEI12 (Figure 3b and Figure 6). It is noteworthy that this trend is not constant throughout time and space. Diagnosing mutation points of drought dynamics and exploring their drivers are important for developing strategies to address climate risks. The spatial distribution of SPEI12 at 5-year intervals showed a gradual drying of NEC that peaked in 2000–2004, and then decreased and increased again in 2014–2018. (Figure 2). Additionally, from 2002 to 2013, the annual, quarterly, and monthly drought areas all displayed a tendency for mitigation (Figure 3b and Figure 4). In this study, variations in potential evapotranspiration and precipitation can be directly linked to variations in drought conditions, and temperature has a significant impact on potential evapotranspiration. Pearson correlation analysis (Figure 12) revealed that temperature and potential evapotranspiration correlated negatively with SPEI12 showing values of −0.29 and −0.80, respectively, and precipitation correlated positively (0.93).
More deeply, changes in climate factors are often closely linked to human activities. The enormous demand for food and economic growth since the 1950s has resulted in natural vegetation degradation, the loss of wetlands, and prominent desertification and salinization in NEC [44,45], which may have contributed significantly to the continued drought trend from 1990 to 2001. In response to the massive deforestation and associated ecological issues, NEC implemented the Natural Forest Conservation Project and the Grain to Green Project in 1998 and 1999, respectively. Commercial logging in NEC’s natural forests came to an end with the implementation of these two projects. On the other hand, studies have reported trends in greening and productivity growth in NEC [46,47]. The vegetation impacted by human activities had a degradation trend from 1990 to 2001 and an increase after 2001, with 93% of this improved trend being linked to human activity [48]. Increasing vegetation cover not only increases soil organic carbon and total nitrogen, but also enhances ecosystem services, lessens soil erosion, and modifies regional climate [49,50]. This is supported by the improvement in climatic conditions from 2002 to 2013 [48] and the decreased trend of drought area at multiple time scales (Figure 3b and Figure 4). However, most of the planted trees that are utilized for revegetation are still young, have underdeveloped root systems, and can only draw water from surface soil. The consequent large increase in vegetation greenness could lead to an excessive loss of water from the surface soil. As the trees mature, their deeper root systems may cause excessive evaporation of deep soil water, which would limit the vegetation growth and impact the regional climate [51,52,53]. This might be connected to the drought’s resurgence after 2014. Moreover, greenhouse gas (mostly CO2) emissions, nitrogen deposition, and other adverse human activities are also important causes of warming and drying of the climate [32,54,55].
We identified the moment and region in NEC where the trend of SPEI12 turned (p < 0.01). In 1999–2000, the western Liaohe Plain (dominated by grassland, cropland, and sparsely vegetated land) and the eastern Lesser Khingan Mountain (dominated by forest) underwent a dry to wet transition. Similarly, the western Sanjiang Plain (dominated by forest and cropland) experienced the same shift in 2004 (Figure 7). These regions contain rich natural resources and fertile black soil, and relief from the drought contributes to improved food production and ecosystem functions and enriches biodiversity. The turning point of vegetation trends in the western Liaohe Plain, eastern Lesser Khingan Mountain, and western Sanjiang Plain occurred in 1999, 1998, and 2000, respectively (Figure 13), which is the time when the ecological restoration project started to be implemented. According to Zhang et al. [56], the implementation of ecological restoration projects considerably promoted the growth of vegetation cover in the Horqin sand (mostly in the western Liaohe Plain) and prevented the spread of sandy areas. Mao et al. [46] also reported that the natural ecosystems in the western NEC were greatly improved in terms of sandstorm prevention, habitat provision, and food production between 2000 and 2015. The time lag between vegetation improvement and drought mitigation points to a delayed impact of vegetation on promoting the climate.

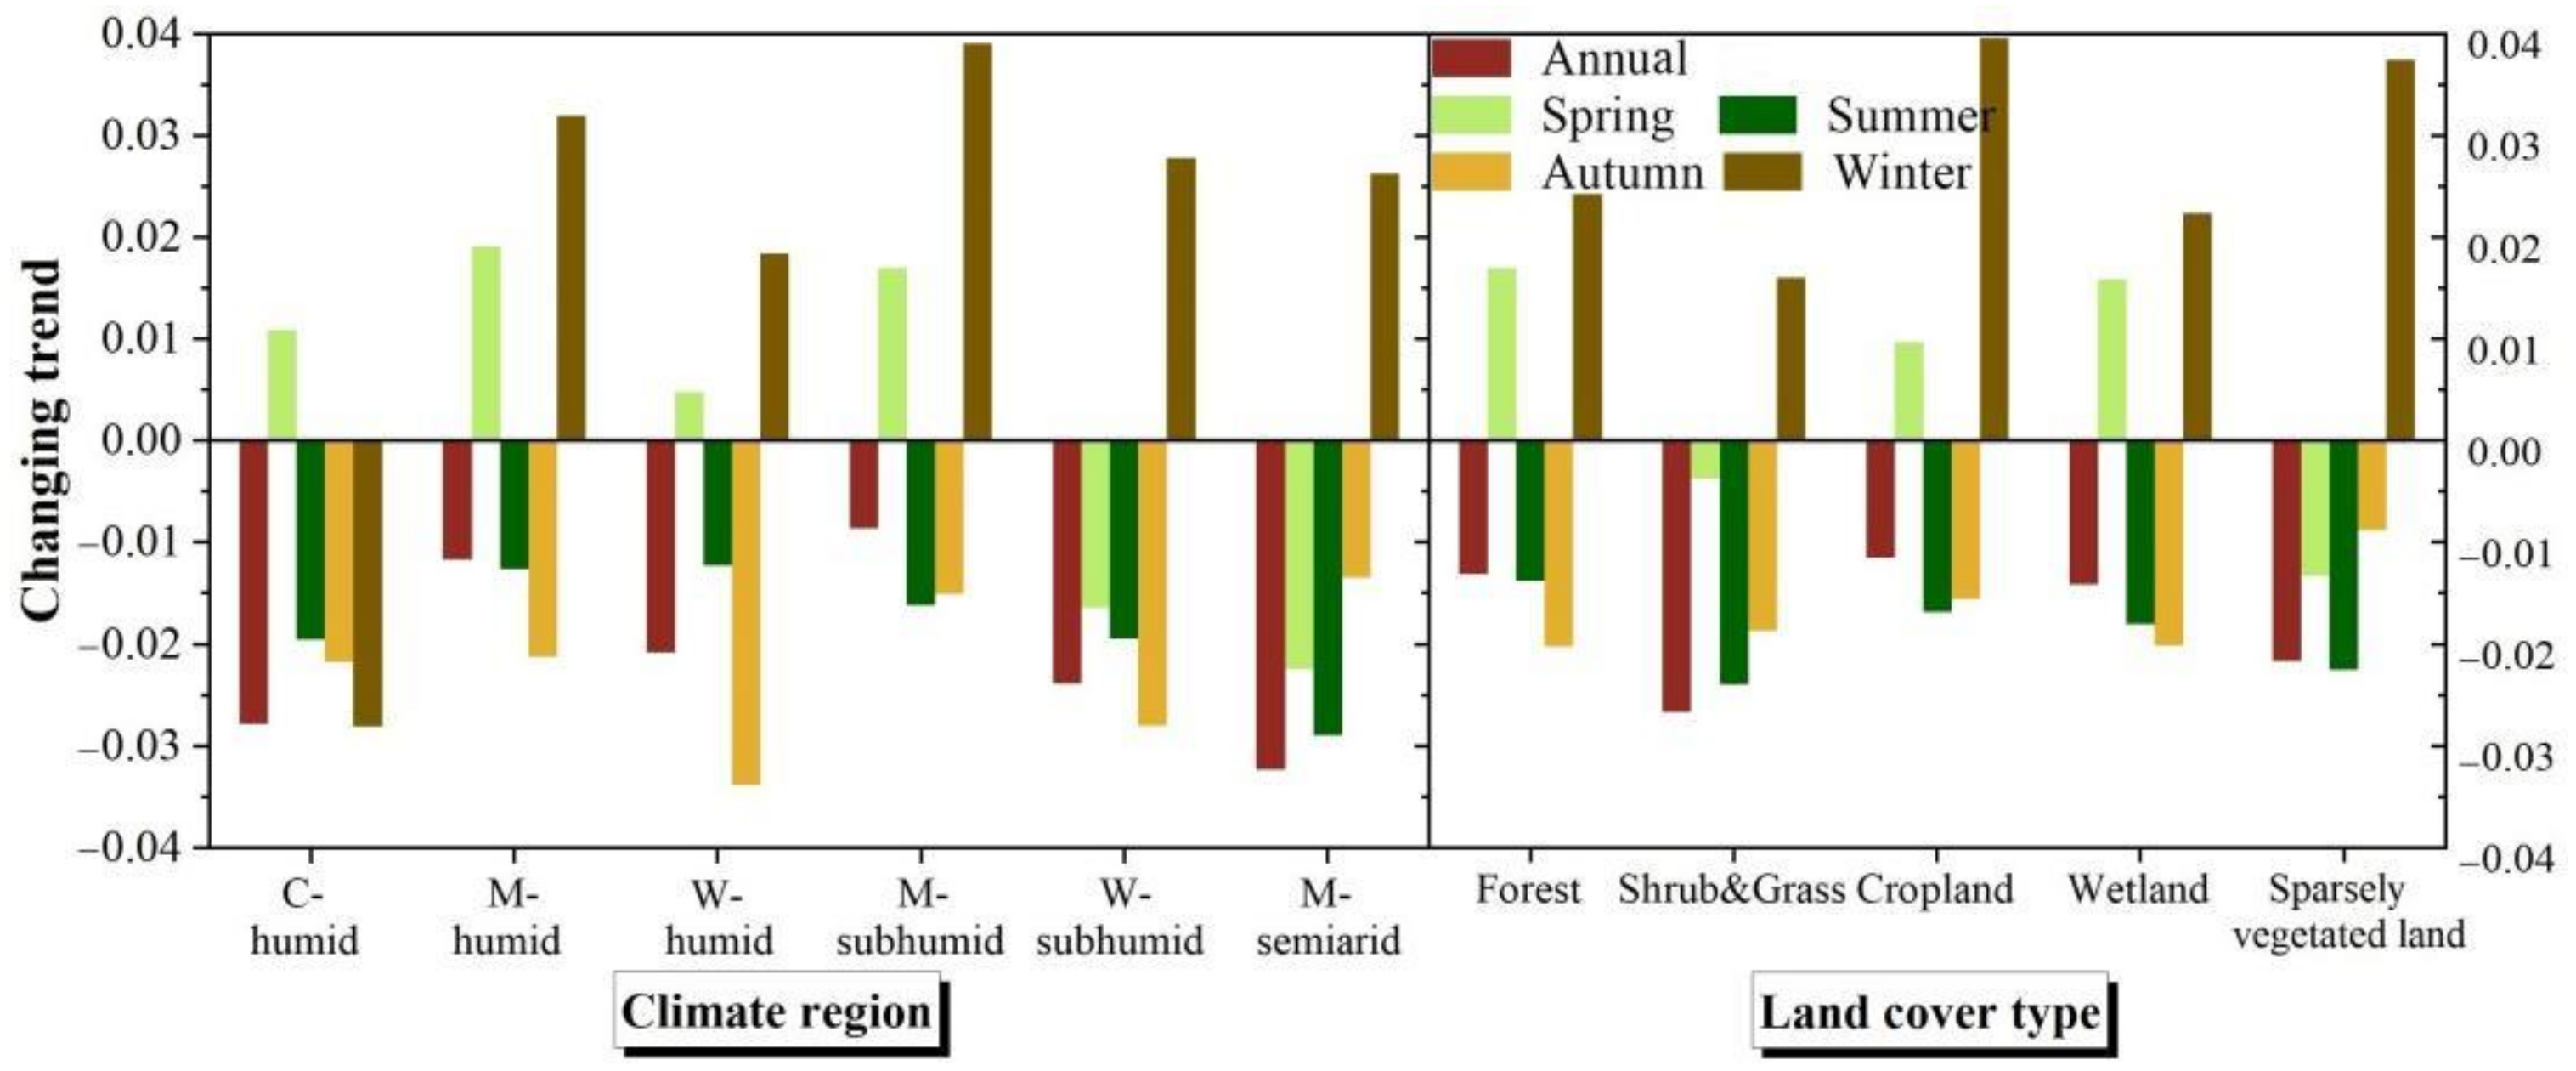
4.2. Quarterly and Monthly Drought Differentiation Characteristics

On the timeline of the study period, spring and winter revealed the earliest drought occurrences (Figure 4a), and wet trends were seen in 71.1% and 83.6% of NEC (Figure 10), respectively, implying a high sensitivity and resilience to drought in spring and winter. Areas with a drought trend in summer and autumn represented 92.6% and 92.1% of NEC, respectively (Figure 10). Nevertheless, in contrast to other seasons, the proportion of drought area was highest in summer and lowest in autumn during the study period (Figure 4a), suggesting that the summer drought is the worst and that, despite the drought trend being widely distributed in autumn, the drought area is the lowest. This can be explained by the fact that plants enter the peak growth period in summer and the evapotranspiration rate is at its highest. Even though there is a certain amount of rainfall (average precipitation within summer from 1990 until 2018 in NEC: 398–2190 mm; data not shown), soil moisture still decreases dramatically. Autumn is characterized by a slowdown in plant growth and a reduction in soil water usage, yet despite this, soil moisture still shows a decreasing trend, since precipitation was less than evapotranspiration. Zhang et al. [57] also reported the persistent summertime drought in northern China since 1990 under anthropogenic warming. In addition, monthly severe drought areas of a percentage greater than 40% were most prevalent in May and June (Figure 4b). This implies that a focus should be laid on the severe droughts in May and June, which are a critical period for vegetation growth, and a response is necessary to develop appropriate drought mitigation measures (e.g., irrigation, artificial rainfall, etc.) in a timely manner, adapted to different vegetation types.

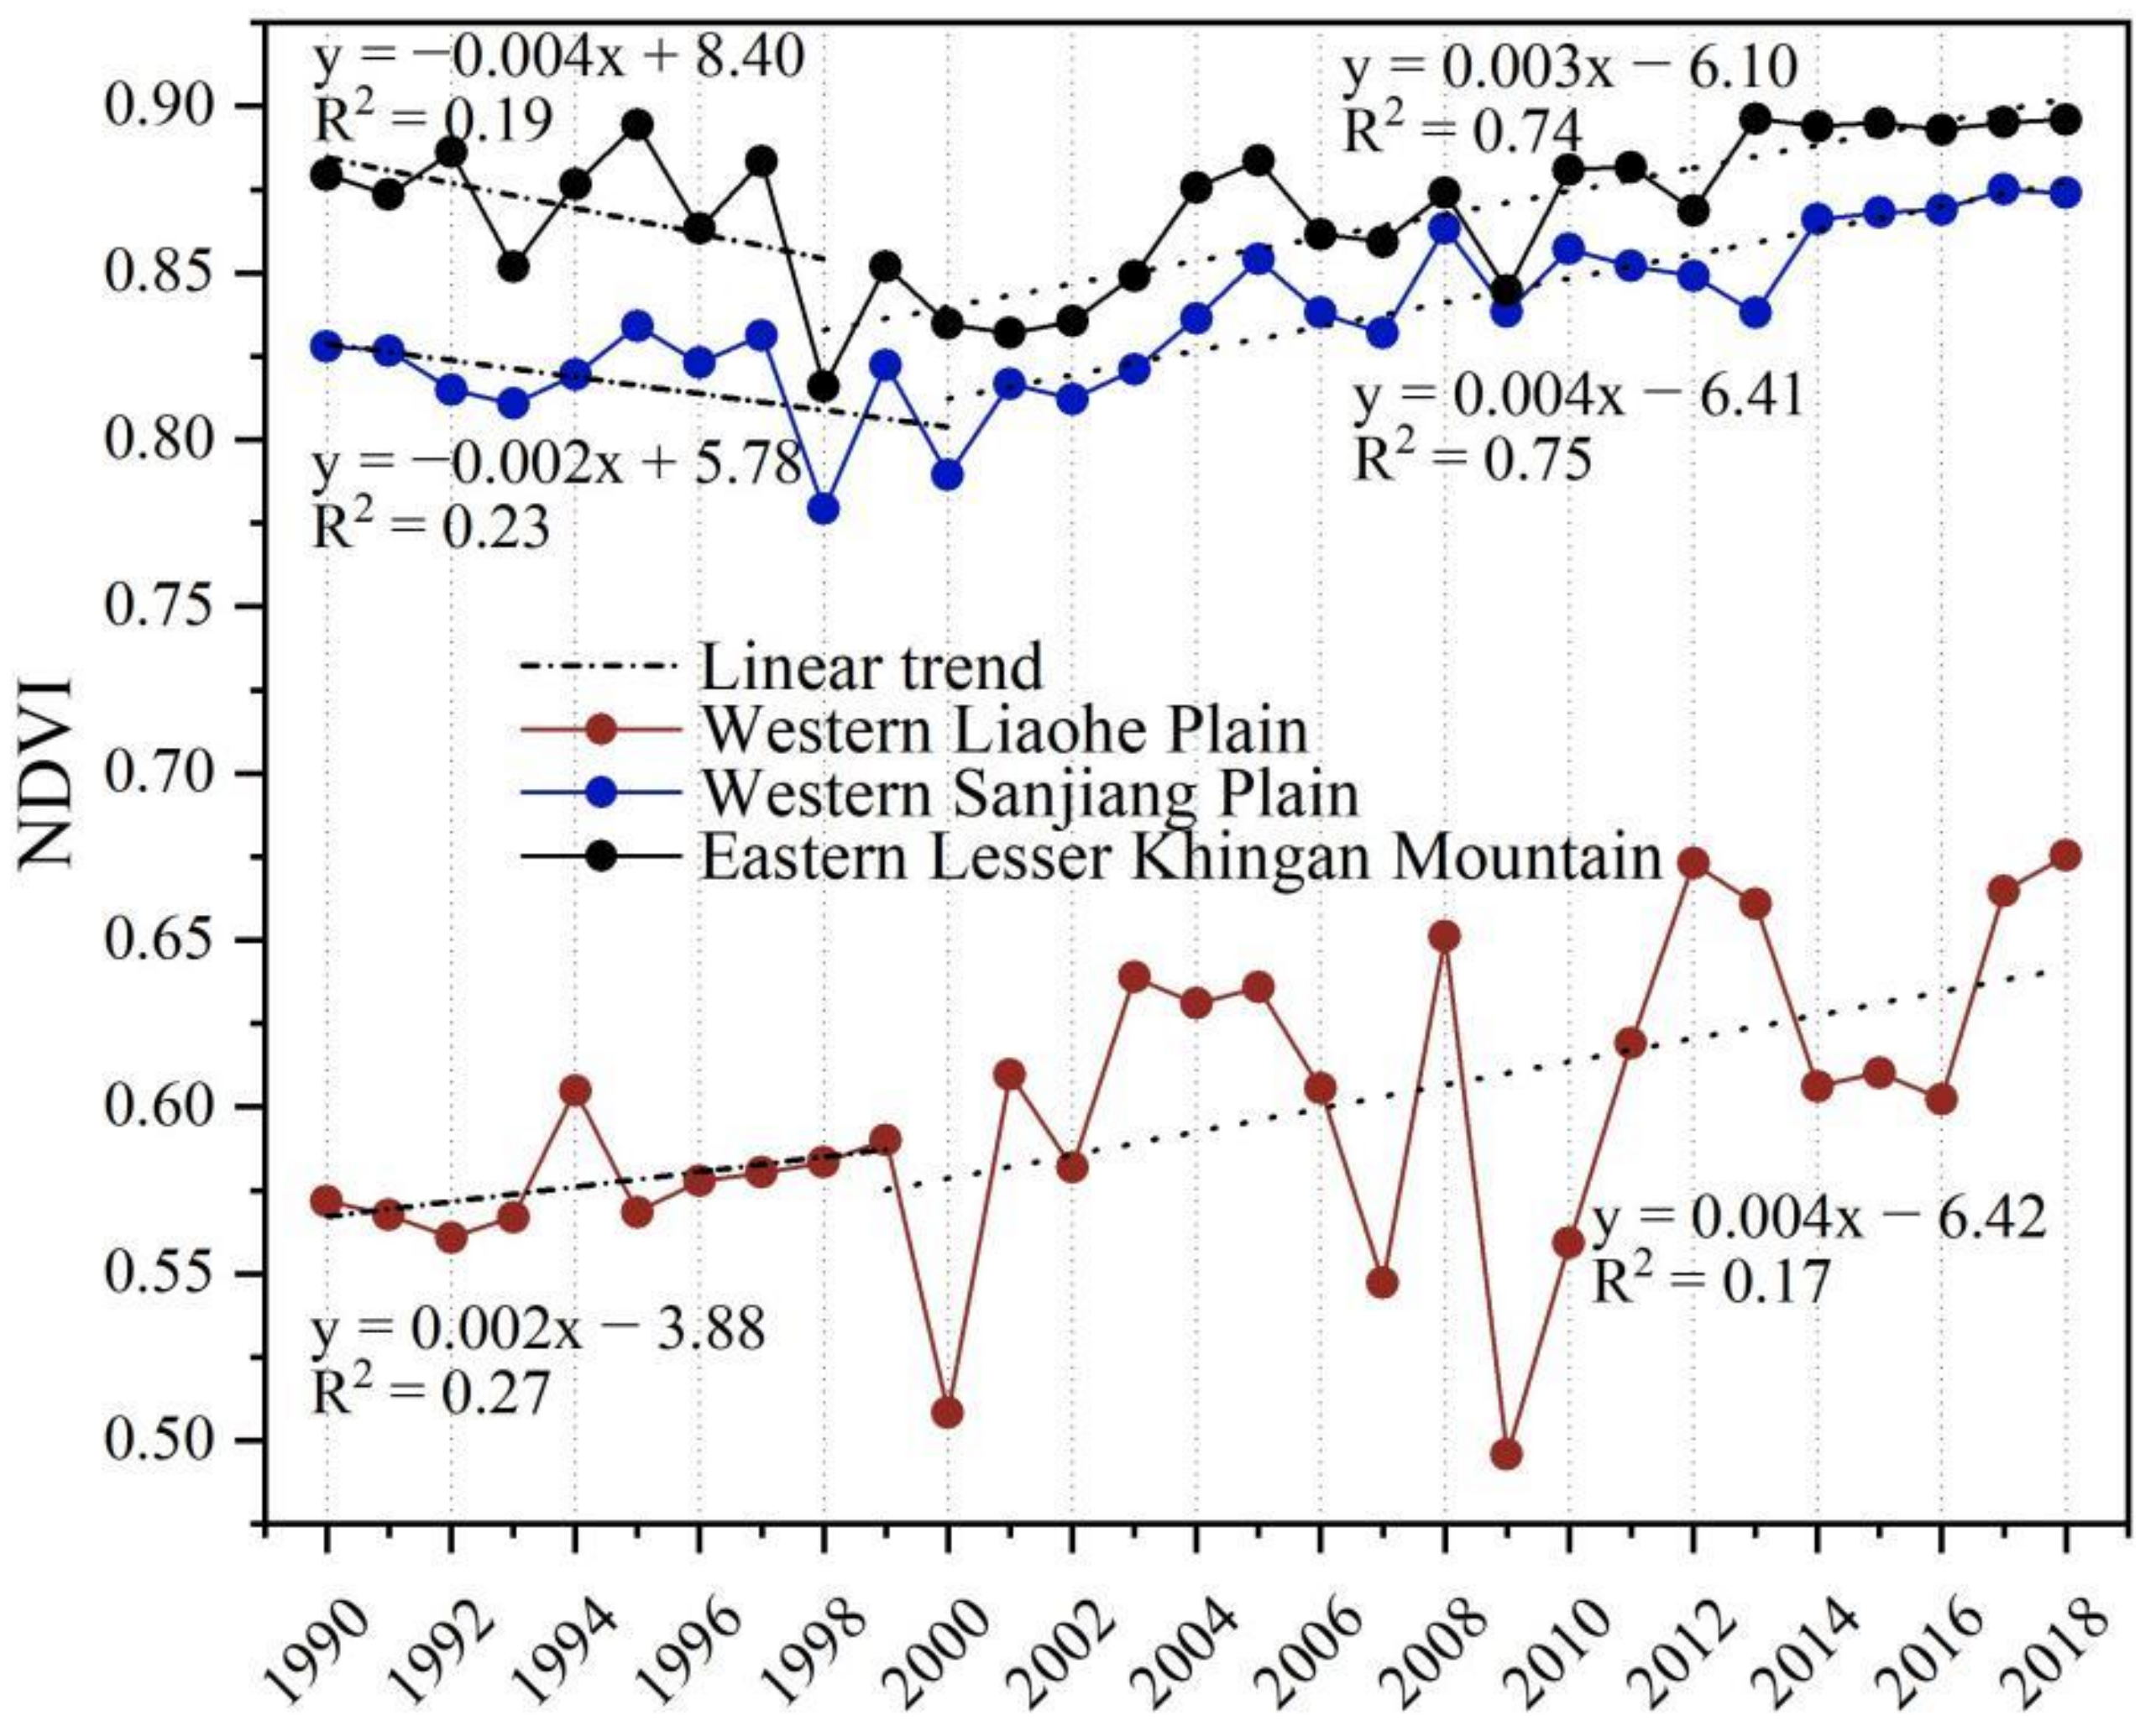
4.3. Spatial Variation of Drought in Northeast China

We provided a spatial meteorological perspective on which regions in NEC have more severe drought conditions (area and trends) and raised awareness on different climate regions and land types facing drought risk. Overall, shrub and grass areas and sparsely vegetated land (mainly in M-semiarid) indicate the highest drought trend, followed by wetlands, croplands, and forests (mainly in humid land) (Figure 11). The proportion of drought areas also indicated that shrub and grass and sparsely vegetated lands had the highest percentage, followed by cropland and wetland, and forests showed the lowest percentages (Figure 5b).
Drought profoundly affects ecohydrological processes along the soil–plant–atmosphere continuum on timescales ranging from hours to years [58], thus affecting both the functioning and structure of ecosystems. Plants in water-stressed areas can adapt to arid conditions by gaining access to groundwater [59]. Groundwater accessibility is determined by root systems (depth and density). As a result, deep-rooted forests have greater access to soil water pools than shrubs and grass. When there is a drought, forests can continue to take up the available water from deep soil [60], making them resistant to water imbalance. Meanwhile, this may cause a prolonged drought period for forests, experiencing a longer drought legacy than shrubs and grass (ranging between 1 and 4 years). This can lead to incomplete and delayed forest growth recovery and/or increased canopy disturbance, which is especially noticeable in regions with scarce water resources [61]. Therefore, drought occurring in forests in M-semiarid regions should be paid attention to and improved, such as by strengthening monitoring and irrigation or developing regional ecological environment restoration strategies to reduce the damage of the effects of drought on the forest ecosystem. However, longer drought legacy effects within forests do not necessarily result in weaker drought resilience. Instead, a stronger drought resilience in forests [62] was observed compared to shrubs and grass at timescales ranging from 1 to 3 years.
In contrast, shallow-rooted plants such as shrubs and grass typically take up water from the top-middle soil, where soil moisture quickly responds to precipitation pulses [63]. When drought occurs, the top-middle soil is quickly depleted. Grass organs store insufficient water and carbon to sustain growth during and after a severe drought, making them vulnerable to drought variations [64]. In the meantime, they would recover quickly from drought, and a drought legacy effect is only detectable in semi-arid regions with a maximum time lag of one year [64,65]. This varying pattern of water use can also account for the documented inverse relationship between plant size and severe drought-induced damage [66]. The different ecohydrological responses of various vegetation types to drought should be considered by governments in developing drought mitigation strategies.
Additionally, NEC has the biggest area of freshwater marshes in China [67,68] and plays an important role in conserving biodiversity and regulating the regional climate in northeast Asia [69,70]. Short-term water shortages may encourage the development of wetland vegetation and lead to the weakening of wetland ecological functions [71]. Long-term drought in wetland ecosystems may degrade them into other ecosystems such as meadows and barelands, completely losing their original ecosystem functions [72]. The relatively low drought trend and area of cropland may benefit from the regulation of human activities.
The C-humid (dominated by forests) regions also exhibited a strong trend of drought in both annual and other seasons, except spring. However, unlike M-semiarid areas, short-term precipitation deficits in C-humid areas may result in higher temperatures, thus promoting vegetation development [73,74], as temperature and solar radiation are limiting factors in humid areas or at high latitudes and altitudes [71]. The government should therefore concentrate on the annual drought trends in C-humid regions. The ratio of drought areas in different climatic regions is expected to reflect the trend of drought severity with warming or drying. Our findings indicate that the warmer the temperature zone, the more sensitive it is to drought under the same hydrological conditions, and the higher the ratio of the drought area. The drier the land, the higher the ratio of the drought area under the same temperature zone (Figure 4a), and the stronger the drought trend in spring and summer (Figure 11). This pattern provides a basis for the development of spatially differentiated drought mitigation strategies. We suggest enhancing drought monitoring in warmer and drier lands, improving and using forecasts for multiple drought types at different time scales, and enhancing regional ecological restoration to improve regional climates.

5. Conclusions

Drought monitoring at multiple spatial and temporal scales is helpful for understanding the inherent mechanism of hydrological extremes and taking corresponding measures to mitigate drought impacts. In this study, we used trend analysis, the Hurst exponent, and mutation point detection methods to determine the spatiotemporal variation in drought status and trends in NEC from 1990 until 2018 based on the Standardized Precipitation Evapotranspiration Index (SPEI). We found that NEC has exhibited a general dry tendency over the past three decades. The percentage of annual drought-affected areas increased by 0.7%/a and 86.3% of the area exhibited a drying trend. Future dry–wet trends are inconsistent with the current situation. The areas with wetting and drying trends would cover 86.3% and 16.7% of NEC, respectively. From the timeline, the drying trend peaked in 2001, and then exhibited a mitigation tendency before drying again after 2013. The implementation of ecological restoration projects is primarily responsible for drought mitigation. Moreover, we identified the moment and region in NEC where the trend of SPEI12 turned. Western Liaohe Plain and eastern Lesser Khingan Mountain experienced a shift from a drought to a humid trend between 1999 and 2000, and western Sanjiang Plain experienced the same shift in 2004. We proved that there is a time lag between improved vegetation and the trend shift.
The multi-spatiotemporal meteorological perspective in this study raised awareness of different climate regions and land types facing drought risk. Our findings highlight that drought in shrub and grass and sparsely vegetated land (mainly in M-semiarid regions) occurring in summer, particularly in May and June, should be paid attention to and improved, such as by strengthening monitoring, irrigation, artificial rainfall, and developing regional ecological environment restoration strategies. Moreover, the government should concentrate on the annual drought trends in C-humid areas and drought occurring in forests in M-semiarid regions to reduce the damage of the effects of drought legacy to the forest ecosystem. In addition, we suggest enhancing drought monitoring in warmer and drier lands and enhancing regional ecological restoration to improve regional climates.

Author Contributions

Conceptualization, L.X. and M.K.; methodology, L.X. and M.K.; software, L.X.; validation, L.X. and M.K.; formal analysis, L.X.; data curation, L.X.; writing—original draft preparation, L.X.; writing—review and editing, M.K., D.W. and B.P.; visualization, L.X.; supervision, M.K. and D.W. All authors have read and agreed to the published version of the manuscript.

Funding

This research received no external funding.

Institutional Review Board Statement

Not applicable.

Informed Consent Statement

Not applicable.

Data Availability Statement

The climate dataset used for this research is publicly available at http://loess.geodata.cn, accessed on 20 March 2021.

Acknowledgments

The authors gratefully acknowledge the China Scholarship Council (CSC) for financial support for Lin Xue.

Conflicts of Interest

The authors declare no conflict of interest.

References

  1. WMO, R. Drought Monitoring and Early Warning: Concepts, Progress and Future Challenges; World Meteorological Organization: Geneva, Switzerland, 2006; p. 1006. [Google Scholar]
  2. Wilhite, D.A.; Svoboda, M.D.; Hayes, M.J. Understanding the complex impacts of drought: A key to enhancing drought mitigation and preparedness. Water Resour. Manag. 2007, 21, 763–774. [Google Scholar] [CrossRef]
  3. Sternberg, T. Regional drought has a global impact. Nature 2011, 472, 169. [Google Scholar] [CrossRef] [PubMed]
  4. Feng, S.; Fu, Q. Expansion of global drylands under a warming climate. Atmos. Chem. Phys. 2013, 13, 10081–10094. [Google Scholar] [CrossRef]
  5. Huang, J.; Yu, H.; Guan, X.; Wang, G.; Guo, R. Accelerated dryland expansion under climate change. Nat. Clim. Change 2016, 6, 166–171. [Google Scholar] [CrossRef]
  6. Nasrollahi, N.; AghaKouchak, A.; Cheng, L.; Damberg, L.; Phillips, T.J.; Miao, C.; Sorooshian, S. How well do CMIP5 climate simulations replicate historical trends and patterns of meteorological droughts? Water Resour. Res. 2015, 51, 2847–2864. [Google Scholar] [CrossRef]
  7. Raziei, T.; Bordi, I.; Pereira, L.S. Regional drought modes in Iran using the SPI: The effect of time scale and spatial resolution. Water Resour. Manag. 2013, 27, 1661–1674. [Google Scholar] [CrossRef]
  8. Vicente-Serrano, S.M.; Gouveia, C.; Camarero, J.J.; Beguería, S.; Trigo, R.; López-Moreno, J.I.; Azorín-Molina, C.; Pasho, E.; Lorenzo-Lacruz, J.; Revuelto, J.; et al. Response of vegetation to drought time-scales across global land biomes. Proc. Natl. Acad. Sci. USA 2013, 110, 5257. [Google Scholar] [CrossRef]
  9. Zhu, Y.; Wang, W.; Singh, V.P.; Liu, Y. Combined use of meteorological drought indices at multi-time scales for improving hydrological drought detection. Sci. Total Environ. 2016, 571, 1058–1068. [Google Scholar] [CrossRef]
  10. Zuo, D.; Cai, S.; Xu, Z.; Li, F.; Sun, W.; Yang, X.; Kan, G.; Liu, P. Spatiotemporal patterns of drought at various time scales in Shandong Province of Eastern China. Theor. Appl. Climatol. 2018, 131, 271–284. [Google Scholar] [CrossRef]
  11. Rippey, B.R. The US drought of 2012. Weather. Clim. Extremes 2015, 10, 57–64. [Google Scholar] [CrossRef] [Green Version]
  12. Mishra, A.K.; Singh, V.P. Drought modeling–A review. J. Hydrol. 2011, 403, 157–175. [Google Scholar] [CrossRef]
  13. Mu, Q.; Zhao, M.; Kimball, J.S.; McDowell, N.G.; Running, S.W. A remotely sensed global terrestrial drought severity index. Bull. Am. Meteorol. Soc. 2013, 94, 83–98. [Google Scholar] [CrossRef]
  14. AghaKouchak, A.; Feldman, D.; Hoerling, M.; Huxman, T.; Lund, J. Water and climate: Recognize anthropogenic drought. Nature 2015, 524, 409–411. [Google Scholar] [CrossRef] [PubMed]
  15. Wang, H.; Chen, A.; Wang, Q.; He, B. Drought dynamics and impacts on vegetation in China from 1982 to 2011. Ecol. Eng. 2015, 75, 303–307. [Google Scholar] [CrossRef]
  16. Mao, D.; Wang, Z.; Luo, L.; Ren, C. Integrating AVHRR and MODIS data to monitor NDVI changes and their relationships with climatic parameters in Northeast China. Int. J. Appl. Earth Obs. Geoinf. 2012, 18, 528–536. [Google Scholar] [CrossRef]
  17. Mao, D.; Wang, Z.; Wu, C.; Song, K.; Ren, C. Examining forest net primary productivity dynamics and driving forces in Northeastern China during 1982-2010. Chin. Geogr. Sci. 2014, 24, 631e646. [Google Scholar] [CrossRef]
  18. Ren, G.; Ding, Y.; Zhao, Z.; Zheng, J.; Wu, T.; Tang, G.; Xu, Y. Recent progress in studies of climate change in China. Adv. Atmos. Sci. 2012, 29, 958–977. [Google Scholar] [CrossRef]
  19. Xu, Y.; Gao, X.; Giorgi, F. Regional variability of climate change hot-spots in East Asia. Adv. Atmos. Sci. 2009, 26, 783–792. [Google Scholar] [CrossRef]
  20. Yu, X.; He, X.; Zheng, H.; Guo, R.; Ren, Z.; Zhang, D.; Lin, J. Spatial and temporalanalysis of drought risk during the crop-growing season over northeast China. Nat. Hazards 2014, 71, 275–289. [Google Scholar] [CrossRef]
  21. Li, K.; Tong, Z.; Liu, X.; Zhang, J.; Tong, S. Quantitative assessment and driving force analysis of vegetation drought risk to climate change: Methodology and application in Northeast China. Agric. For. Meteorol. 2020, 282, 107865. [Google Scholar] [CrossRef]
  22. Guo, E.; Liu, X.; Zhang, J.; Wang, Y.; Wang, C.; Wang, R.; Li, D. Assessing spatiotemporal variation of drought and its impact on maize yield in Northeast China. J. Hydrol. 2017, 553, 231–247. [Google Scholar] [CrossRef]
  23. Zhao, Z.; Wang, H.; Yu, C.; Deng, C.; Liu, C.; Wu, Y.; Yan, J.; Wang, C. Changes in spatiotemporal drought characteristics over northeast China from 1960 to 2018 based on the modified nested Copula model. Sci. Total Environ. 2020, 739, 140328. [Google Scholar] [CrossRef] [PubMed]
  24. Zhou, Z.; Shi, H.; Fu, Q.; Li, T.; Gan, T.Y.; Liu, S. Assessing spatiotemporal characteristics of drought and its effects on climate-induced yield of maize in Northeast China. J. Hydrol. 2020, 588, 125097. [Google Scholar] [CrossRef]
  25. Sherwood, S.; Fu, Q. A drier future? Science 2014, 343, 737–739. [Google Scholar] [CrossRef] [PubMed]
  26. AghaKouchak, A.; Cheng, L.; Mazdiyasni, O.; Farahmand, A. Global warming and changes in risk of concurrent climate extremes: Insights from the 2014 California drought. Geophys. Res. Lett. 2014, 41, 8847–8852. [Google Scholar] [CrossRef]
  27. Shukla, S.; Safeeq, M.; AghaKouchak, A.; Guan, K.; Funk, C. Temperature impacts on the water year 2014 drought in California. Geophys. Res. Lett. 2015, 42, 4384–4393. [Google Scholar] [CrossRef]
  28. Vicente-Serrano, S.M.; Beguería, S.; López-Moreno, J.I. A Multiscalar Drought Index Sensitive to Global Warming: The Standardized Precipitation Evapotranspiration Index. J. Clim. 2010, 23, 1696–1718. [Google Scholar] [CrossRef]
  29. Cook, B.I.; Ault, T.R.; Smerdon, J.E. Unprecedented 21st century drought risk in the American Southwest and Central Plains. Sci. Adv. 2015, 1, e1400082. [Google Scholar] [CrossRef]
  30. Tong, S.; Lai, Q.; Zhang, J.; Bao, Y.; Lusi, A.; Ma, Q.; Li, X.; Zhang, F. Spatiotemporal drought variability on the Mongolian Plateau from 1980–2014 based on the SPEI-PM, intensity analysis and Hurst exponent. Sci. Total Environ. 2018, 615, 1557–1565. [Google Scholar] [CrossRef]
  31. Le, M.H.; Kim, H.; Moon, H.; Zhang, R.; Lakshmi, V.; Nguyen, L.B. Assessment of drought conditions over Vietnam using standardized precipitation evapotranspiration index, MERRA-2 re-analysis, and dynamic land cover. J. Hydrol. Reg. Stud. 2020, 32, 100767. [Google Scholar] [CrossRef]
  32. Chiang, F.; Mazdiyasni, O.; AghaKouchak, A. Evidence of anthropogenic impacts on global drought frequency, duration, and intensity. Nat. Commun. 2021, 12, 2754. [Google Scholar] [CrossRef] [PubMed]
  33. Zheng, J.Y.; Yin, Y.H.; Li, B.Y. The new scheme for climate regionalization in China. Acta Geogr. Sin. 2010, 65, 3–12. [Google Scholar]
  34. Peng, S.; Ding, Y.; Liu, W.; Li, Z. 1 km monthly temperature and precipitation dataset for China from 1901 to 2017. Earth Syst. Sci. Data 2019, 11, 1931–1946. [Google Scholar] [CrossRef]
  35. Hargreaves, G.H.; Samani, Z.A. Reference Crop Evapotranspiration from Temperature. Appl. Eng. Agric. 1985, 1, 96–99. [Google Scholar] [CrossRef]
  36. Sen, P.K. Estimates of the regression coefficient based on Kendall’s tau. J. Am. Stat. Assoc. 1968, 63, 1379–1389. [Google Scholar] [CrossRef]
  37. Kendall, M.G. A new measure of rank correlation. Biometrika 1938, 30, 81–93. [Google Scholar] [CrossRef]
  38. Mann, H.B. Nonparametric tests against trend. Econometrica 1945, 13, 245–259. [Google Scholar] [CrossRef]
  39. Hirsch, R.M.; Slack, J.R. A nonparametric trend test for seasonal data with serial dependence. Water Resour. Res. 1984, 20, 727–732. [Google Scholar] [CrossRef]
  40. Smadi, M.M.; Zghoul, A. A sudden change in rainfall characteristics in Amman, Jordan during the mid 1950s. Am. J. Environ. Sci. 2006, 2, 84–91. [Google Scholar] [CrossRef]
  41. Hurst, H.E. Long-term storage capacity of reservoirs. Trans. Am. Soc. Civ. Eng. 1951, 116, 770–808. [Google Scholar] [CrossRef]
  42. Mandelbrot, B.B.; Wallis, J.R. Robustness of the rescaled range R/S in the measurement of noncyclic long run statistical dependence. Water Resour. Res. 1969, 5, 967–988. [Google Scholar] [CrossRef]
  43. Ndayisaba, F.; Guo, H.; Bao, A.; Guo, H.; Karamage, F.; Kayiranga, A. Understanding the spatial temporal vegetation dynamics in Rwanda. Remote Sens. 2016, 8, 129. [Google Scholar] [CrossRef]
  44. Mao, D.; Wang, Z.; Wu, B.; Zeng, Y.; Luo, L.; Zhang, B. Land degradation and restoration in the arid and semiarid zones of China: Quantified evidence and implications from satellites. Land Degrad. Dev. 2018, 29, 3841–3851. [Google Scholar] [CrossRef]
  45. Mao, D.; Wang, Z.; Wu, J.; Wu, B.; Zeng, Y.; Song, K.; Yi, K.; Luo, L. China’s wetlands loss to urban expansion. Land Degrad. Dev. 2018, 29, 2644–2657. [Google Scholar] [CrossRef]
  46. Mao, D.; He, X.; Wang, Z.; Tian, Y.; Xiang, H.; Yu, H.; Man, W.; Jia, M.; Ren, C.; Zheng, H. Diverse policies leading to contrasting impacts on land cover and ecosystem services in Northeast China. J. Clean Prod. 2019, 240, 117961. [Google Scholar] [CrossRef]
  47. Li, H.; Zhang, H.; Li, Q.; Zhao, J.; Guo, X.; Ying, H.; Deng, G.; Rihan, W.; Wang, S. Vegetation productivity dynamics in response to climate change and human activities under different topography and land cover on Northeast China. Remote Sens. 2021, 13, 975. [Google Scholar] [CrossRef]
  48. Xue, L.; Kappas, M.; Wyss, D.; Wang, C.; Putzenlechner, B.; Thi, N.P.; Chen, J. Assessment of climate change and human activities on vegetation development in Northeast China. Sensors 2022, 22, 2509. [Google Scholar] [CrossRef]
  49. Deng, L.; Shangguan, Z.P. Afforestation drives soil carbon and nitrogen changes in China. Land Degrad. Dev. 2017, 28, 151–165. [Google Scholar] [CrossRef]
  50. Li, T.; Lü, Y.; Fu, B.; Hu, W.; Comber, A.J. Bundling ecosystem services for detecting their interactions driven by large-scale vegetation restoration: Enhanced services while depressed synergies. Ecol. Indic. 2019, 99, 332–342. [Google Scholar] [CrossRef]
  51. Jipp, P.H.; Nepstad, D.C.; Cassel, D.K.; Carvalho, C.J.R.D. Deep soil moisture storage and transpiration in forests and pastures of seasonally-dry Amazonia. Clim. Change 1998, 39, 395–412. [Google Scholar] [CrossRef]
  52. Cao, S.; Chen, L.; Shankman, D.; Wang, C.; Wang, X.; Zhang, H. Excessive reliance on afforestation in China’s arid and semi-arid regions: Lessons in ecological restoration. Earth Sci. Rev. 2011, 104, 240–245. [Google Scholar] [CrossRef]
  53. Feng, X.; Fu, B.; Piao, S.; Wang, S.; Ciais, P.; Zeng, Z.; Lü, Y.; Zeng, Y.; Li, Y.; Jiang, X.; et al. Revegetation in China’s Loess Plateau is approaching sustainable water resource limits. Nat. Clim. Change 2016, 6, 1019–1022. [Google Scholar] [CrossRef]
  54. Held, I.M.; Soden, B.J. Robust responses of the hydrological cycle to global warming. J. Clim. 2006, 19, 5686–5699. [Google Scholar] [CrossRef]
  55. Zhu, Z.; Piao, S.; Myneni, R.B.; Huang, M.; Zeng, Z.; Canadell, J.G.; Ciais, P.; Sitch, S.; Friedlingstein, P.; Arneth, A.; et al. Greening of the Earth and its drivers. Nat. Clim. Change 2016, 6, 791–795. [Google Scholar] [CrossRef]
  56. Zhang, G.; Dong, J.; Xiao, X.; Hu, Z.; Sheldon, S. Effectiveness of ecological restoration projects in Horqin Sandy Land, China based on SPOT-VGT NDVI data. Ecol. Eng. 2012, 38, 20–29. [Google Scholar] [CrossRef]
  57. Zhang, J.; Chen, H.; Zhang, Q. Extreme drought in the recent two decades in northern China resulting from Eurasian warming. Clim. Dyn. 2019, 52, 2885–2902. [Google Scholar] [CrossRef]
  58. Van der Molen, M.K.; Dolman, A.J.; Ciais, P.; Eglin, T.; Gobron, N.; Law, B.E.; Meir, P.; Peters, W.; Phillips, O.L.; Reichstein, M.; et al. Drought and ecosystem carbon cycling. Agric. For. Meteorol. 2011, 151, 765–773. [Google Scholar]
  59. Craine, J.M.; Ocheltree, T.W.; Nippert, J.B.; Towne, E.; Skibbe, A.M.; Kembel, S.W.; Fargione, J.E. Global diversity of drought tolerance and grassland climate-change resilience. Nat. Clim. Change 2013, 3, 63–67. [Google Scholar] [CrossRef]
  60. Davidson, E.A.; Verchot, L.V.; Cattânio, J.H.; Ackerman, I.L.; Carvalho, J.E.M. Effects of soil water content on soil respiration in forests and cattle pastures of eastern Amazonia. Biogeochemistry 2000, 48, 53–69. [Google Scholar] [CrossRef]
  61. Anderegg, W.R.L.; Schwalm, C.; Biondi, F.; Camarero, J.J.; Koch, G.; Litvak, M.; Ogle, K.; Shaw, J.D.; Shevliakova, E.; Williams, A.P.; et al. Pervasive drought legacies in forest ecosystems and their implications for carbon cycle models. Science 2015, 349, 528–532. [Google Scholar] [CrossRef]
  62. Gazol, A.; Camarero, J.J.; Anderegg, W.R.L.; Vicente-Serrano, S.M. Impacts of droughts on the growth resilience of Northern Hemisphere forests. Glob. Ecol. Biogeogr. 2017, 26, 166–176. [Google Scholar] [CrossRef]
  63. Sala, O.E.; Lauenroth, W.K.; Parton, W.J. Long-term soil water dynamics in the shortgrass steppe. Ecology 1992, 73, 1175–1181. [Google Scholar] [CrossRef]
  64. Wu, X.; Liu, H.; Li, X.; Ciais, P.; Babst, F.; Guo, W.; Zhang, C.; Magliulo, V.; Pavelka, M.; Liu, S.; et al. Differentiating drought legacy effects on vegetation growth over the temperate Northern Hemisphere. Glob. Chang. Biol. 2018, 24, 504–516. [Google Scholar] [CrossRef] [PubMed]
  65. Arredondo, T.; Garcìa-Moya, E.; Huber-Sannwald, E.; Loescher, H.W.; Delgado-Balbuena, J.; Luna-Luna, M. Drought manipulation and its direct and legacy effects on productivity of a monodominant and mixed-species semi-arid grassland. Agric. For. Meteorol. 2016, 223, 132–140. [Google Scholar] [CrossRef]
  66. Lloret, F.; Granzow-de la Cerda, I. Plant competition and facilitation after extreme drought episodes in M editerranean shrubland: Does damage to vegetation cover trigger replacement by juniper woodland? J. Veg. Sci. 2013, 24, 1020–1032. [Google Scholar] [CrossRef]
  67. Liu, X.T. Wetlands in Northeast China; Science Press: Beijing, China, 2005. [Google Scholar]
  68. Niu, Z.G.; Gong, P.; Cheng, X.; Guo, J.; Wang, L.; Huang, H.; Shen, S.; Wu, Y.; Wang, X.; Wang, X.; et al. Geographical characteristics of China’s wetlands derived from remotely sensed data. Sci. China Ser. D-Earth Sci. 2009, 52, 723–738. [Google Scholar] [CrossRef]
  69. Song, C.; Zhang, J.; Wang, Y.; Wang, Y.; Zhao, Z. Emission of CO2, CH4 and N2O from freshwater marsh in northeast of China. J. Environ. Manag. 2008, 88, 428–436. [Google Scholar] [CrossRef]
  70. Shen, X.; Xue, Z.; Jiang, M.; Lu, X. Spatiotemporal change of vegetation coverage and its relationship with climate change in freshwater marshes of Northeast China. Wetlands 2019, 39, 429–439. [Google Scholar] [CrossRef]
  71. Cronk, J.K.; Fennessy, M.S. Wetland Plants: Biology and Ecology; CRC Press: Boca Raton, FL, USA, 2016. [Google Scholar]
  72. Wang, Z.; Huang, N.; Luo, L.; Li, X.; Ren, C.; Song, K.; Chen, J.M. Shrinkage and fragmentation of marshes in the West Songnen Plain, China, from 1954 to 2008 and its possible causes. Int. J. Appl. Earth Obs. Geoinf. 2011, 13, 477–486. [Google Scholar] [CrossRef]
  73. Saleska, S.R.; Didan, K.; Huete, A.R.; Da Rocha, H.R. Amazon forests green-up during 2005 drought. Science 2007, 318, 612. [Google Scholar] [CrossRef]
  74. Kreuzwieser, J.; Rennenberg, H. Molecular and physiological responses of trees to waterlogging stress. Plant Cell Environ. 2014, 37, 2245–2259. [Google Scholar] [CrossRef] [PubMed]
Figure 1. Location (a), elevation and climate regions (b), and land cover types (c) of northeast China (NEC). The elevation data in a 30 m spatial resolution was obtained from the Data Center for Resource and Environmental Sciences of the Chinese Academy of Sciences (http://www.resdc.cn/, accessed on 11 March 2021). Land cover data were derived from the “plant functional type map” of China in a 1 km spatial resolution, which was obtained from the National Tibetan Plateau Data Center (https://data.tpdc.ac.cn/, accessed on 11 March 2021).
Atmosphere 13 01506 g001
Figure 2. Maps of dry–wet conditions in northeast China (NEC) from 1990 to 2018 every five years. (a) 1990–1994; (b) 1995–1999; (c) 2000–2004; (d) 2005–2009; (e) 2010–2014; (f) 2015–2018.
Atmosphere 13 01506 g002
Figure 3. Annual dry–wet conditions (a) and annual light drought area percentage (SPEI12 < −0.5), (b) in northeast China (NEC) from 1990 to 2018.
Atmosphere 13 01506 g003
Figure 4. Percentage of monthly light and quarterly moderate drought area SPEI03 < −1, (a); SPEI01 < −1.5, (b) in northeast China (NEC) from 1990 to 2018.
Atmosphere 13 01506 g004
Figure 5. Percentage of annual light drought area (SPEI12 < −0.5) over different climate regions and land cover types in northeast China (NEC) from 1990 to 2018.
Atmosphere 13 01506 g005
Figure 6. Spatial variation trends of SPEI12 (a) and spatial distribution of Hurst exponent value of SPEI12 (b) in northeast China from 1990 to 2018. S- in the figure is the abbreviation for significant. Black crosses indicate significant trends with p < 0.05.
Atmosphere 13 01506 g006
Figure 7. Mutation point (p < 0.1, (a)) of the spatial variation trend of SPEI12 and the change slope before (b) and after (c) the mutation point in northeast China (NEC) from 1990 to 2018.
Atmosphere 13 01506 g007
Figure 8. Quarterly variations of spring (a), summer (b), autumn (c), and winter (d) based on SPEI03 in northeast China (NEC) from 1990 to 2018.
Atmosphere 13 01506 g008
Figure 9. Mann–Kendall statistical test for quarterly variations in spring (a), summer (b), autumn (c), and winter (d) based on SPEI03 in northeast China (NEC) from 1990 to 2018.
Atmosphere 13 01506 g009
Figure 10. Spatial distribution of quarterly trends in spring (a), summer (b), autumn (c), and winter (d) based on SPEI03 in northeast China (NEC) from 1990 to 2018.
Atmosphere 13 01506 g010
Figure 11. Average annual and quarterly changing trend over different climate regions and land cover types in northeast China (NEC) from 1990 to 2018.
Atmosphere 13 01506 g011
Figure 12. Relationship between annual mean temperature (a), potential evapotranspiration (b), precipitation (c) and annual SPEI12.
Atmosphere 13 01506 g012
Figure 13. Annual mean Normalized Difference Vegetation Index (NDVI) of the areas where the SPEI12 trend turned during the period 1990–2018.
Atmosphere 13 01506 g013
Table 1. Main characteristics of climate regions in northeast China (NEC).
Climate RegionArea (×
104 km2)
Average
Elevation (m)
Annual Average Temperature (°C)Annual Average Precipitation (mm)Dominant Land Cover
IC-humid11.25748.69−3.35409.79Forest > Shrub and Grass > Wetland
IIM-humid29.72452.962.45541.71Forest > Cropland > Shrub and Grass
IIIW-humid2.66140.189.34615.94Cropland > Forest > Shrub and Grass
IVM-subhumid52.73344.613.13423.52Cropland > Forest > Shrub and Grass
VW-subhumid6.18254.578.77437.92Cropland > Shruband Grass > Forest
VIM-semiarid21.78660.033.83296.71Shrub and Grass > Cropland > Sparsely vegetated land
Table 2. Drought classification based on SPEI values.
ClassExtreme DroughtSevere DroughtModerate DroughtLight
Drought
Near
Normal
Light WetModerate WetSevere WetExtreme
Wet
Values≤−2(−2, −1.5](−1.5, −1](−1, −0.5](−0.5, 0.5)[0.5, 1)[1, 1.5)[1.5, 2)≥2
Table 3. Proportion of drought areas in northeast China (NEC) every five years from 1990 to 2018.
PhasesArea Percentage (%)
Moderate Drought
(−1.5, −1]
Light Drought
(−1, −0.5]
Near Normal
(−0.5, 0.5)
Light Wet
[0.5, 1)
Moderate Wet
[1, 1.5)
1990–19940020.3770.049.59
1995–199906.5489.573.890
2000–20041.7076.8121.4900
2005–20090.3631.9567.6900
2010–20140081.4218.580
2015–20180.046.3581.0112.590.01
Publisher’s Note: MDPI stays neutral with regard to jurisdictional claims in published maps and institutional affiliations.

