Article

Assessing Impact of Temperature Variability of Climate Change on Mortality Based on Multiple GCM Projections in China

1
Key Laboratory of Environmental Change and Natural Disaster of Ministry of Education, Faculty of Geographical Science, Beijing Normal University, Beijing 100875, China
2
Academy of Disaster Reduction and Emergency Management, Ministry of Emergency Management and Ministry of Education, Beijing Normal University, Beijing 100875, China
3
Beijing Municipal Climate Center, Beijing 100089, China
*
Authors to whom correspondence should be addressed.
Atmosphere 2022, 13(11), 1775; https://doi.org/10.3390/atmos13111775
Submission received: 1 September 2022 / Revised: 15 October 2022 / Accepted: 21 October 2022 / Published: 28 October 2022

Abstract

:
Gradually increasing durations of high temperature caused by climate change harm the health of individuals and then lead to death. This study aimed to investigate the relationship between durations of different daily mean air-temperature categories and mortality in China and forecast future mortality changes in China for 2020–2050 under Representative Concentration Pathways (RCP)4.5 and RCP8.5 scenarios. The daily mean air temperature was divided into 10 categories, and the days under each air-temperature category were counted during the period of 2000–2015. Then, the connection between the days of each of the 10 air-temperature categories and mortality was established using the semi parametric regression model. Results indicate that the days of the >32 °C category have the largest impact on mortality in China, with the death rate increasing by 23‰ for one additional day. Predictions reveal that mortality in China will increase 25.48% and 26.26% under the RCP4.5 and RCP8.5 scenarios, respectively. Moreover, the mortality of 86 regions in western China will increase 30.42%. Therefore, in the future, the increasing duration of days of high temperatures will raise the mortality rate in China and aggravate the mortality gap between developed and underdeveloped regions.

1. Introduction

The Intergovernmental Panel on Climate Change (IPCC) has stated that, “In the future, global warming will further intensify, leading to an increase in extreme weather, which will affect human life” [1]. Under climate change, the life and health of humans are challenged by extreme temperatures [2]. The workers who are exposed to high heat episodes have negative health effects [3]. Furthermore, patients with chronic diseases, such as diabetes, hypertension and coronary heart disease, are more vulnerable to both high and cold ambient temperature [4,5,6]. Based on Wu Y, et al. [7], 3.4% of all deaths globally are associated with extreme temperatures per year, and most regions of Asia and Oceania have a higher proportion of that mortality than the global mean. The extreme temperatures at global scale are significantly associated with the mortality, but varies in different countries [8,9]. Moreover, long-term extreme temperatures have larger effects on mortality than short-term [10]. Therefore, it is vital to explore the association between extreme temperatures and mortality and predict the future variation trend under climate change in China.
Some researchers have studied the impact of temperature change on mortality based on temperature indexes such as daily maximum temperature, daily minimum temperature and daily average temperature. Gasparrini et al., Kim et al. and Guo et al. [11,12,13] used daily average temperature data to assess the relationship between temperature and mortality. Scovronick et al. and Lee et al. [14,15] analyzed the impact of extreme high and low ambient temperature on mortality, based on a two-stage regression. Yang J. et al. and Wu W. et al. [16,17] establish the temperature-mortality model associating daily mean temperature with death rate, using a Poisson regression model and a distributed lag non-linear model. These studies all concentrated on daily maximum, minimum and average temperature. In addition, most studies about the impact of temperature change on mortality have focused on extreme temperature events [18,19].
Furthermore, previous studies mostly pay attention to average temperature indexes, but few have examined all temperature ranges. Greene at al. [20] used a synoptic climatological procedure to value the present relationships between climate and mortality. They found that extreme heat events will cause excessive death. For the years 2020–2029 in scenario A1, there will be 2038 deaths caused by heat events per summertime. Ma et al. [21] combined mortality and meteorological variables to assess the risk of heat wave-related mortality in China. Wang et al. [22] estimated the annual heat-related mortality of densely populated regions in China in the future under conditions of more frequent hot weather. Yang et al. [23] used daily highest temperature data and mortality data to analyze the impact of high temperature on mortality. Extreme temperatures do affect mortality, but there is also a correlation between temperature and mortality in more commonly occurring temperature ranges [24].
The previous papers studied the impact of extreme temperature on the mortality of multiple cities and individual cities in China, such as Shanghai, Suzhou and Nanjing. Jie et al. [25] obtained the relationship between high temperature and cause-specific mortality by adopting a distributed lag non-linear model and meta-analysis for 43 counties in China. Li et al. [26] used the same model to establish the association between ambient temperature and multi-cause mortality in three Tibetan counties. Wang et al. [27] studied the relationship between temperature and mortality in Suzhou, China, by using a Poisson regression model and distribution lag nonlinear model. Their conclusions suggested that exposure to high and low temperatures would lead to increased mortality in Suzhou. Using a wide range of definitions for a heat wave, Chen et al. [28] explored the relationship between heat waves and mortality in Nanjing, China. At present, research still lacks the establishment of relation between different temperature durations and mortality in China. Additionally, this paper has important implications for predicting the future impact of temperature durations on mortality in China.
This study investigates the relationship between durations of different air temperature categories and mortality all over China. The effect of diverse air temperature days on mortality is estimated in spatial and temporal patterns. We aim to forecast and analyze future mortality trend changes in China for 2020–2050 under climate change, namely the Representative Concentration Pathway (RCP)4.5 and RCP8.5 scenarios.

2. Materials and Methods

In this paper, air temperature was divided into 10 temperature categories, based on a semi parametric regression model and panel data. For the purpose of brief expression, we use “temperature” as shorthand for “air temperature” later in this paper. The number of days which fell into each temperature category were counted, and the relationship between temperature and mortality in all regions of China was built using the temperature day (TD). Using the derived relationship, the NEX-GDDP dataset (data from 21 GCMs under the RCP4.5 and RCP8.5 scenarios) was used to project mortality in all regions of China from 2006 to 2050, and to analyze changes in mortality under future different climate change scenarios. The purpose of this paper is to study the impact of TDs on mortality and predict the impact of climate change in the future.

2.1. Methods

Parametric regression and nonparametric regression each have advantages and disadvantages. The method combining parametric regression and nonparametric regression is called semi parametric regression.
We established a semi parametric regression model and used the correlation analysis method to study the relationship between TD and mortality. The semi parametric regression model used in this paper is as follows:
Y i j = f i t i j ,   θ i + ε i j , i = 1 , , n ,   j = 1 , , n
where f i C R 2 and f may depend on the known independent variable t i j   nonlinearly ε i j is the random error term, with a mean of 0.
At present, in the analysis of small sample data from hospitals, there will be such a conclusion that the impact on mortality is mainly concentrated on high temperatures and low temperatures [27]. They found significant non-linear effects of temperature on total and cardiovascular mortality. Heat effects were immediate and lasted for 1–2 days, whereas cold effects persisted for 10 days. The relative risk of total mortality associated with extreme cold temperature (1st percentile of temperature, −0.3 °C) over lags 0–14 days was 1.75 [95% confidence interval (CI): 1.43, 2.14)], compared with the minimum mortality temperature (26 °C). This paper is based on large sample data from China, and it is impossible to get such a conclusion. Because natural environmental factors such as temperature are complex and diverse, and the structure of a large sample population is also diverse, the relationship between the two is bound to be complex. In terms of the impact of temperature on humans, it is not only affected by the temperature but also by the duration time. For example, when the days with an average daily temperature of more than 35 °C last for more than three days, it is different from lasting for more than one day. Therefore, the definition of a heat wave in many countries also takes the duration of high temperatures into account. For instance, on the one hand, the threshold for a heat wave is different in every region of China [29]. On the other hand, the thresholds for temperatures affecting the human body will be different. However, there is almost no difference between the daily average temperature of 25 °C and 26 °C.
The temperature days has been applied to these areas before, for example, to explore trends in the frequency and intensity of extreme temperatures based on the extreme temperature days during the period 1951 to 2000 in the arid and semiarid areas of northern China [30], and to discuss the potential impact of more frequent high-temperature days on the environment and energy demand [31]. Notably, Deschênes and Greenstone [32] defined 10 temperature categories and counted the number of days falling into each temperature category, and then studied the relationship between temperature days and mortality in the United States and found a V-shaped connection. As seen in the above studies, temperature days can factually reflect the temperature distribution, which allows us to establish a relationship between diverse durations of temperature and mortality in China.
Therefore, this paper uses the ten temperature categories to analyze the relationship between temperature and mortality, but not daily maximum, minimum and average temperature.

2.2. Data

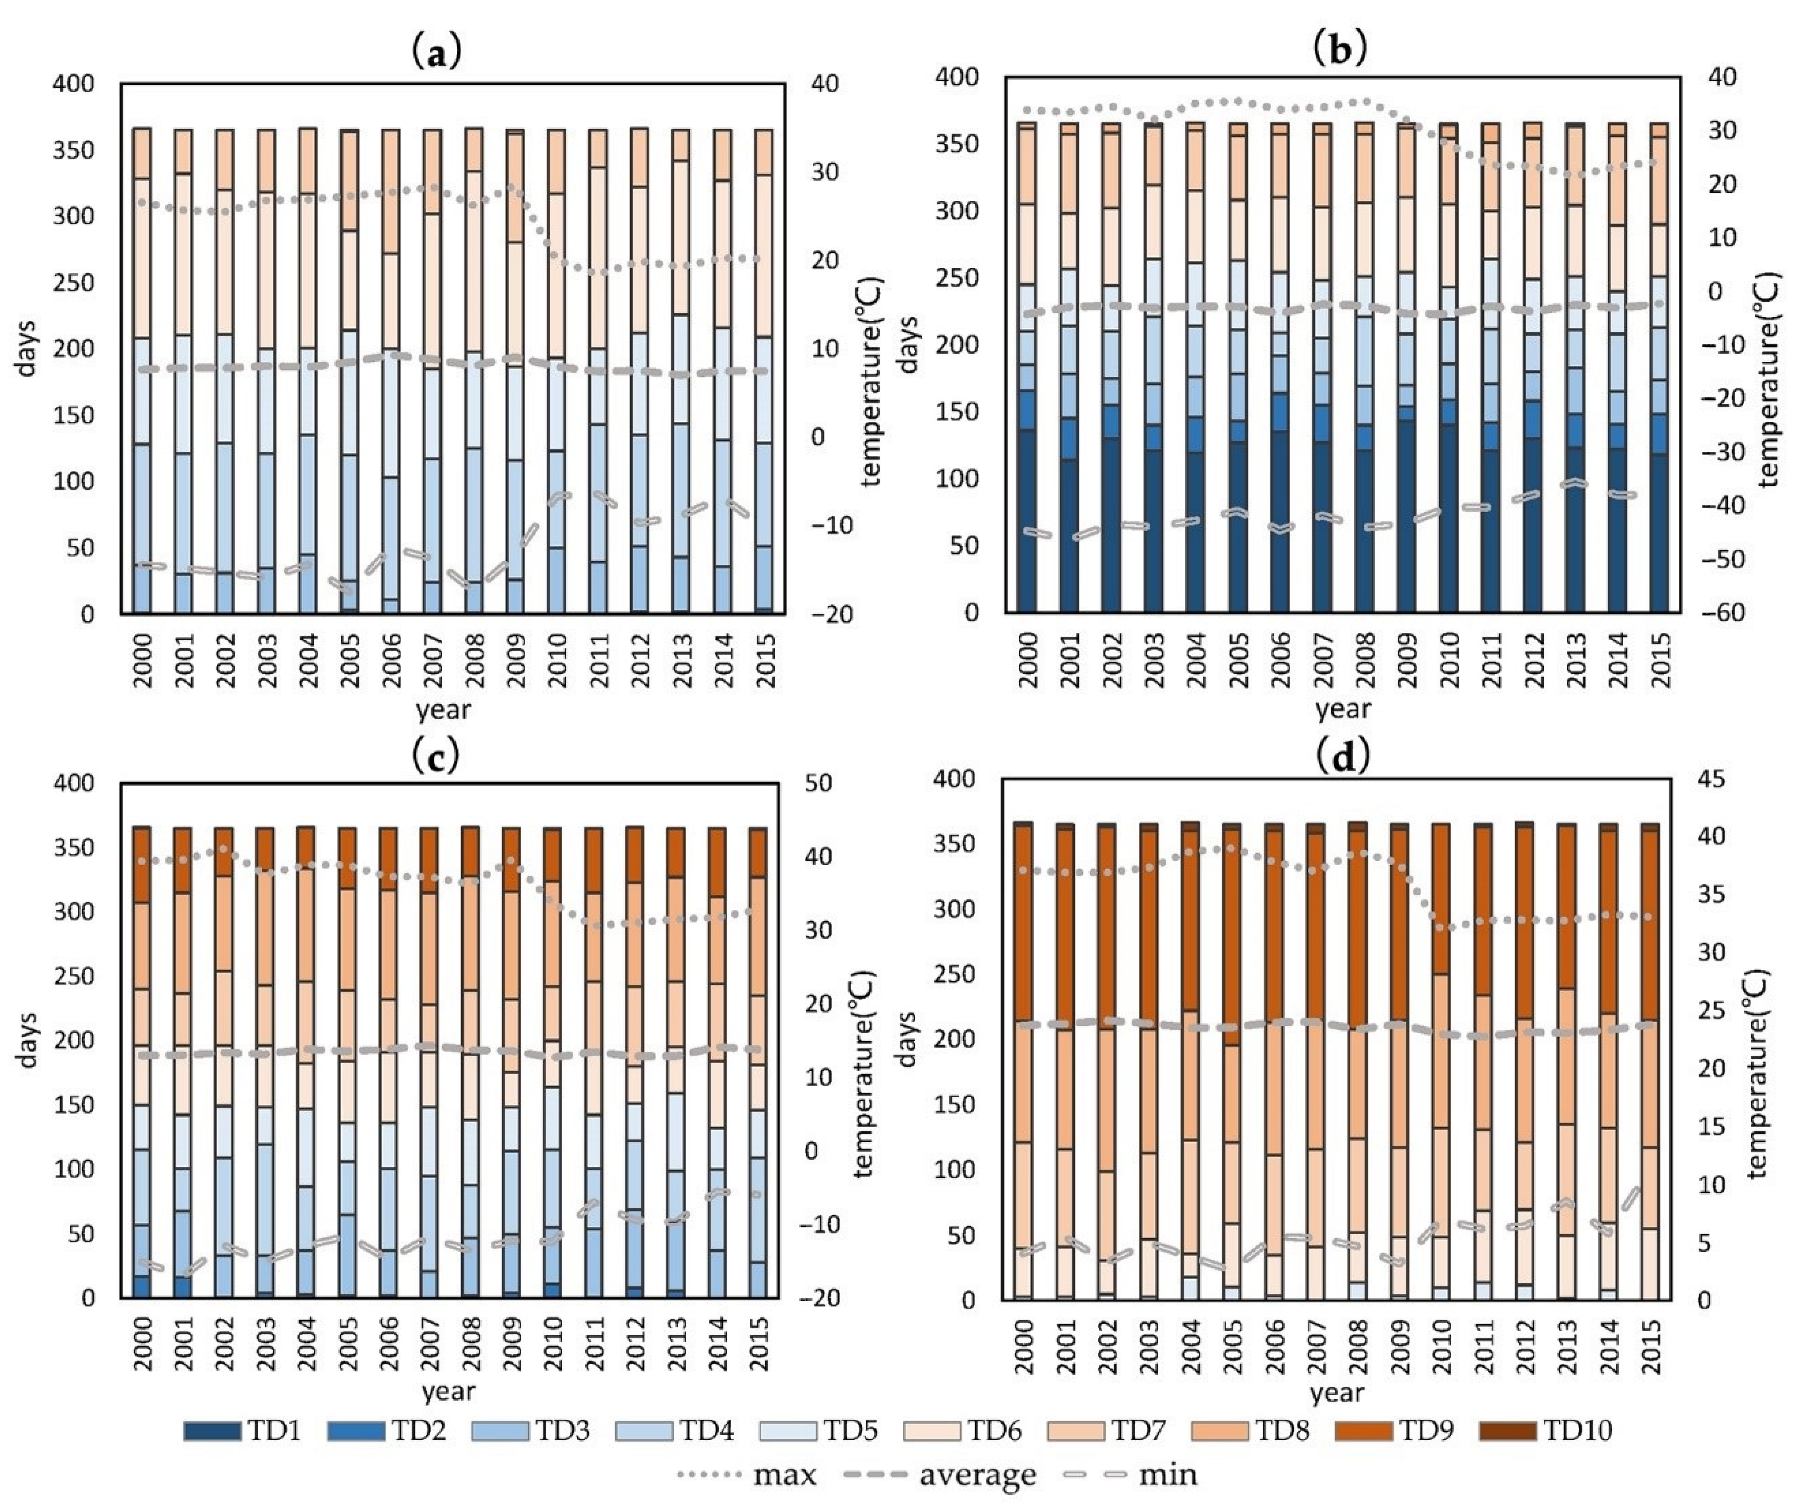
2.2.1. Historical Temperature Data

The temperature data in this paper were taken from the records of 2142 stations published by the China Meteorological Administration (CMA), including the daily maximum temperature and the daily minimum temperature (°C), during the period 2000–2015. We average the daily maximum and daily minimum temperature to get the daily average temperature data at the station level. Then, we count the daily average temperature of stations located in each region, and average these to get the daily average temperature data at the regional level. We calculate the average temperature of several stations in every region. There are 2412 meteorological observation stations in the 343 regions of China, with an average number of 7 in each region. The region (they are called “dijishi” in China) is the third level of administrative units in China, between provinces and counties. There are 343 regions in China, most of which have an area below 10 thousand km2. Therefore, the temperature differences in the same region are small, which helps avoid the situation where a region’s area is too large and the temperatures in one region have differences. The mortality data in this paper is also based on all 343 regions. That is, each region has its own mortality statistics.
Based on the daily average temperature data, the number of days falling into the categories of <−12 °C, −12~−7 °C, −7~−1 °C, −1~4 °C, 4~10 °C, 10~16 °C, 16~21 °C, 21~27 °C, 27~32 °C, and >32 °C in each year are calculated. We define them as temperature days (TD), which are expressed as TD1, TD2, …, TD10, respectively. Every region gets such days of the 10 temperature categories for every year. Moreover, the division of the 10 temperature categories is based on several attempts. We tried different temperature categories, such as −10~5 °C, 5~10 °C, and so on, but when constructing the semi parametric regression model, some temperature categories cannot pass the significance test of 5% level (sig > 0.05). The 10 categories classification of temperature had the best results on various statistical tests.
According to the climatic zoning of China [33], we selected representative stations: Guangzhou station, Beijing station, Daxinganling station, and Lasa station. Then, the annual highest temperature, annual lowest temperature, annual average temperature and 10 TD per year for each station were calculated, as shown in Figure 1. Taking the Guangzhou station in Figure 1a as an example, 2005 was the year with the lowest temperature measured during 2000–2015, but the number of TD1 was not the greatest for any year in that category, and many high-temperature days (TD9, TD10) occurred in that year. The highest temperature in the 16 years occurred during 2008, and many high-temperature days (TD9, TD10) occurred in that year. However, low temperature days also occurred frequently. From the perspective of annual average temperature, the gap between these two years and other years is very small. Similar results were found at other stations, which shows that the TD can more sensitively reflect the temperature information for each year than the annual highest temperature, annual lowest temperature and annual average temperature.

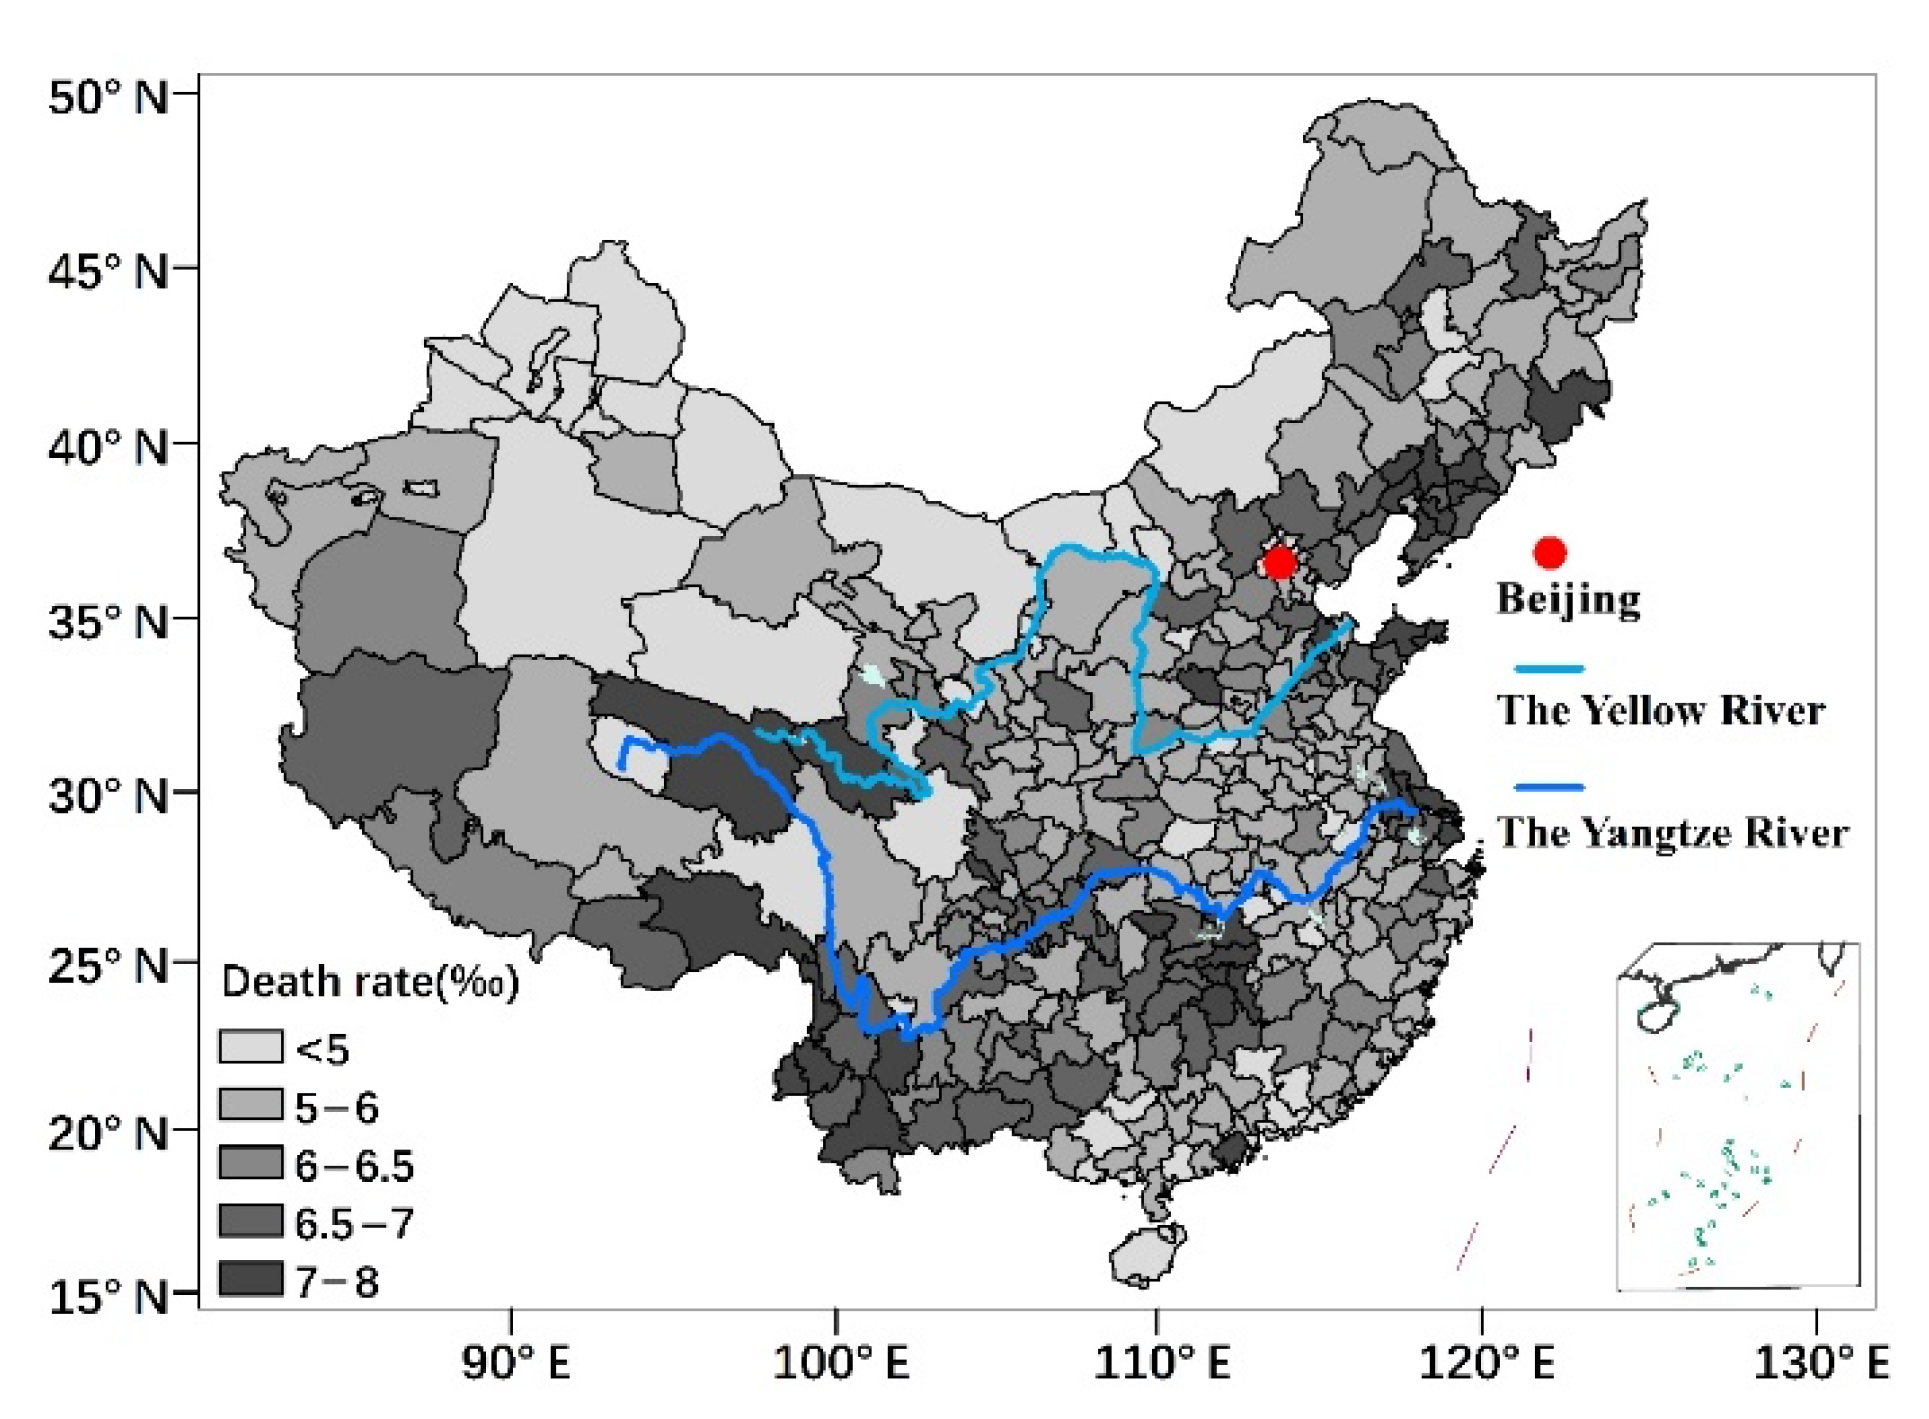
2.2.2. Mortality Data

The mortality (D) data at the regional level in this paper are taken from statistical yearbooks. The definition of D is as follows:
D = M / P
where M is the number of deaths in a year, and P is the total population during that year. We collected the annual mortality data of 343 regions for 16 years (2000–2015). The average mortality for the study period of 16 years in each region of China is shown in Figure 2.
Mortality varies significantly from region to region. The regions with high mortality rates are mainly located in Tibet, Qinghai and Yunnan, most of which show mortalities greater than 7‰. The regions with low mortality rates are mainly located in the southeastern coastal areas and Xinjiang, most of which show mortality rates of less than 6‰.

2.2.3. Future Temperature Data

The future temperature data is taken from the NASA Earth Exchange Global Daily Downscaled Projections (NEX-GDDP) dataset (dataset URL: http://ds.nccs.nasa.gov/thredds/catalog/bypass/NEX-GDDP/catalog.html, accessed on 20 October 2022), which compiles climate prediction data from 21 Global Circulation Models (GCM) under the RCP4.5 and RCP8.5 scenarios for the period 2006–2100, and the historical tests of each GCM for the period 1950–2005. The spatial resolution of the dataset is 0.25° (25 km × 25 km). The model name, modeling center, simulation period and resolution of the 21 GCMs used in this paper are shown in Table 1. RCP4.5 and RCP8.5 are two radiative forcing paths, reaching 4.5 w/m−2 (equivalent to 650 ppm CO2 concentration) and 8.5 w/m−2 (equivalent to 1370 ppm CO2 concentration), respectively, in 2100. These represent the most likely and the most severe predicted scenarios that are widely used in the analysis of climate change [34].
Only 1° × 1° spatial resolution from CMIP6 had been shared when this research was carried out. However, high-resolution climate model data were needed to match the death rate data, for which the resolution of the data is nearly 0.15° × 0.15°. Therefore, the 0.25° × 0.25° resolution data of the CMIP5 model from NEX-GDDP were used for this paper. In fact, the difference in interannual temperatures between CMIP5 and CMIP6 is indistinctive for China [35], so the conclusions of this research are reliable. In June 2022, the high-resolution data of the CMIP6 model were shared by NEX-GDDP [36]. The research will be updated with the combination of SSP and the RCP scenarios from CMIP6 in the future.
In this study, we use the temperature data of 21 GCMs under the above two scenarios as future climate data. Daily lowest temperature and highest temperature data can be acquired for the corresponding grid points of 2142 stations in China, and the daily average temperature of these stations using different GCMs under different scenarios can be calculated. The daily average temperature is the average value of the daily lowest and highest temperatures. The daily average temperatures of stations are then averaged to obtain the daily average temperature data for each region. Finally, we obtain daily average temperature data for 343 regions from 2000 to 2050.
Based on the historical daily average temperature for the period 2000–2005, we calculate the average temperature days in each temperature category in 2000–2005 and compare this with the corresponding observed average temperature days in 2000–2005. The results show an error (E) between the historical value and the observed value, as shown in Equation (3):
E = 1 6 T D T D / 6
where T D is the number of temperature days in a temperature category for each region in a year according to modeled historical data, T D is the number of temperature days in a temperature category for each region according to the observed dataset, and E is the annual average error of a temperature category for each region.
We did not use the original NEX-GDDP dataset directly for our modeled future results, but added the calculated error (E) to the future temperature days in order to correct them.

3. Results

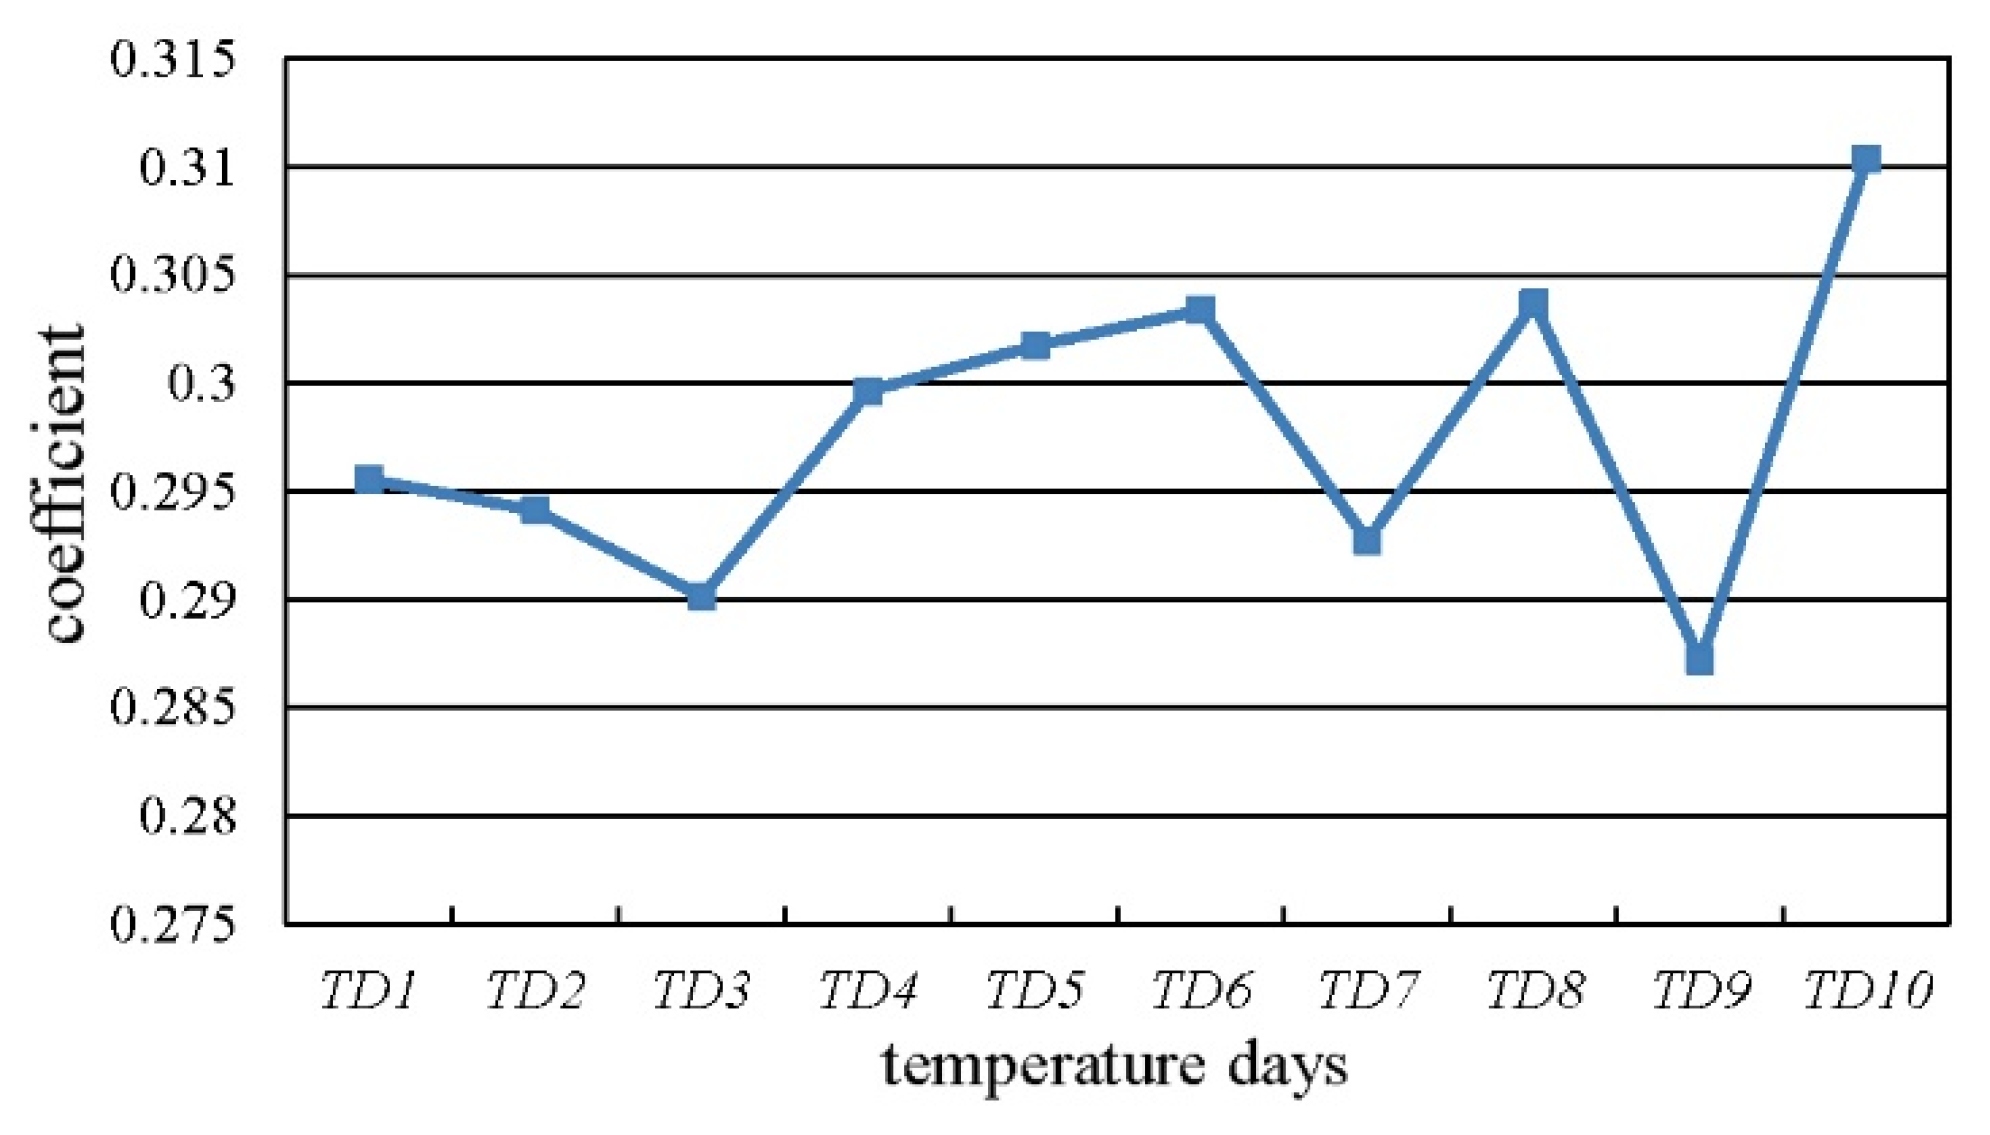
3.1. Regression Results

A semi parametric regression model of 10 categories of temperature days and annual mortality rates was established for all regions in China. The explanatory variables of all temperature categories passed the significance test with a significance level of 5%. The results are as follows:
D = 0.284 T D 1 + 0.286 T D 2 + 0.280 T D 3 + 0.291 T D 4 + 0.292 T D 5 + 0.293 T D 6 + 0.284 T D 7 + 0.294 T D 8 + 0.277 T D 9 + 0.300 T D 10 99.489
where D is the mortality rate of a region in a year, TD1,2,3…10 is the number of temperature days for the 10 temperature categories, and −99.489 is the random error term, which acts as a fixed effect vector and represents the differences among regions that do not change with time.
The coefficient of each TD presents the preferred estimates of the impact of temperature days on annual mortality from the estimation of Equation (1). The coefficient value of each TD has only relative significance and not absolute significance. The larger the coefficient of a TD is, he stronger is the impact this temperature category has on mortality. In Equation (1), there are 10 independent variables standing for days of 10 temperature categories. Therefore, it is more accurate to understand the impact as a relative influence. Figure 3 shows 10 temperature days as the horizontal axis, and the coefficients of each TD as the vertical axis.
The coefficient of TD10 is the largest, with a value of 0.300, which suggests high-temperature days have the largest influence on mortality. TD9 has the smallest coefficient, with a value of 0.277, suggesting that the temperature days in the 27~32 °C range have the smallest influence on mortality. This result implies that for each additional day occurring in the TD10 category, the annual mortality rate will increase by 23%.
In addition, TD6 and TD8 also have a large impact on mortality, with coefficients of 0.293 and 0.294, respectively. The daily average temperature typically reaches 10~16 °C or 21~27 °C mainly in May when summer begins and in September when autumn begins. During this period, the temperature changes greatly from day to day, so the coefficients of these two temperature categories are relatively large. However, the coefficients of TD3 and TD7 are small. Daily average temperature typically falls within these temperature categories during January and October. January is the middle of winter, and October is the middle of autumn. In these months, the temperature remains relatively stable, and the change is very small. Therefore, such days are beneficial to human health and the coefficients of these two temperature categories are the smallest.
In conclusion, the coefficient of TD in formula 4 shows that the increase of TD10 has the greatest impact on mortality. In China, the average daily temperatures between 10~16 °C and 21~27 °C are during the season alternations when the daily temperature changes greatly and people can easily get sick. Therefore, the impact of TD6 and TD8 on mortality is the second highest.

3.2. Model Validations

According to the above regression result, differing temperature days in the 10 categories have diverse influences on mortality. Therefore, two corollaries were investigated: (1) in a region where the mortality rate changed greatly, the temperature days also changed greatly; and (2) in a year when the temperature days were abnormal, the mortality rate was also relatively abnormal.
To verify corollary (1), we calculated the relative variability of mortality rate (RVD) as follows:
R V D = D D ¯ D ¯ / m
where D is the mortality rate in a year, D ¯ is the multiyear average mortality rate, and m is the number of years (m = 16).
The equation to calculate the relative variability of temperature days (RVTn) is as follows:
R V T n = T D n T D n ¯ T D n ¯ / m ,   n = 1 ,   2 , 3   10  
where TDn is the number of temperature days in one temperature category for a year, T D n ¯ is the multiyear average temperature days in one temperature category, and n is the temperature category. For n, 1 represents the <−12 °C temperature category, 2 represents the −12~−7 °C temperature category, and so on for the remaining categories. As before, m is the number of years (m = 16).
In Equations (5) and (6), if D ¯ = 0, RVD = 0. If T D n ¯ = 0, RVTn = 0.
The RVD for the period 2000–2015 (Figure 4a) shows that northeastern China, northwestern China and some regions in southern China show high RVD values, with a maximum of 55.09%.
The RVT6, RVT8 and RVT10 are shown in Figure 4b–d. Regions with high RVT6 (Figure 4b) are located in Qinghai, southern Yunnan and southeastern coastal areas. Regions with high RVT8 (Figure 4c) are located in Southeast Tibet, Qinghai, etc. Regions with high RVT10 values (Figure 4d) are located in Xinjiang, Henan, Shandong and southeastern coastal areas. These regions of higher relative variability are almost identical to the regions with high RVD in Figure 4a, demonstrating that corollary (1) is correct.
If the TD in one category of a year fell between the upper quartile and the maximum value of all years in that category, this year was considered to be an abnormal year. If the TD in one category of a year fell between the lower quartile and the upper quartile of all years in that category, this year was considered to be a normal year. Using the box-plot method, we identified the year with the greatest number of temperature days in each region (referred to as an abnormal year). U was used to reflect the change of morality rate in an abnormal year as follows:
U = D ¯ u D ¯ n
where D ¯ u is the average mortality rate for the abnormal year and D ¯ n is the average mortality rate for the normal year. Positive U indicates that the mortality rate is higher in the year which has a higher number of temperature days. Negative U indicates the opposite.
According to Equation (4), TD6, TD8 and TD10 had larger influences on mortality than other temperature categories. Therefore, the abnormal and normal years of all regions were identified in TD6, TD8 and TD10. U values for the three temperature categories were calculated, with results shown in Figure 5.
In the TD6 abnormal year, mortality is higher than that of a normal year in 55.35% of the studied regions. In the TD8 abnormal year, mortality is higher than that of a normal year in 53.52% of the studied regions. In the TD10 abnormal year, mortality is higher than that of a normal year in 66.36% of the studied regions. Therefore, more than half of the regions showed higher mortality in TD6, TD8 and TD10 abnormal years than in normal years. This result verifies that corollary (2) is correct and temperature days show a great correlation with mortality.

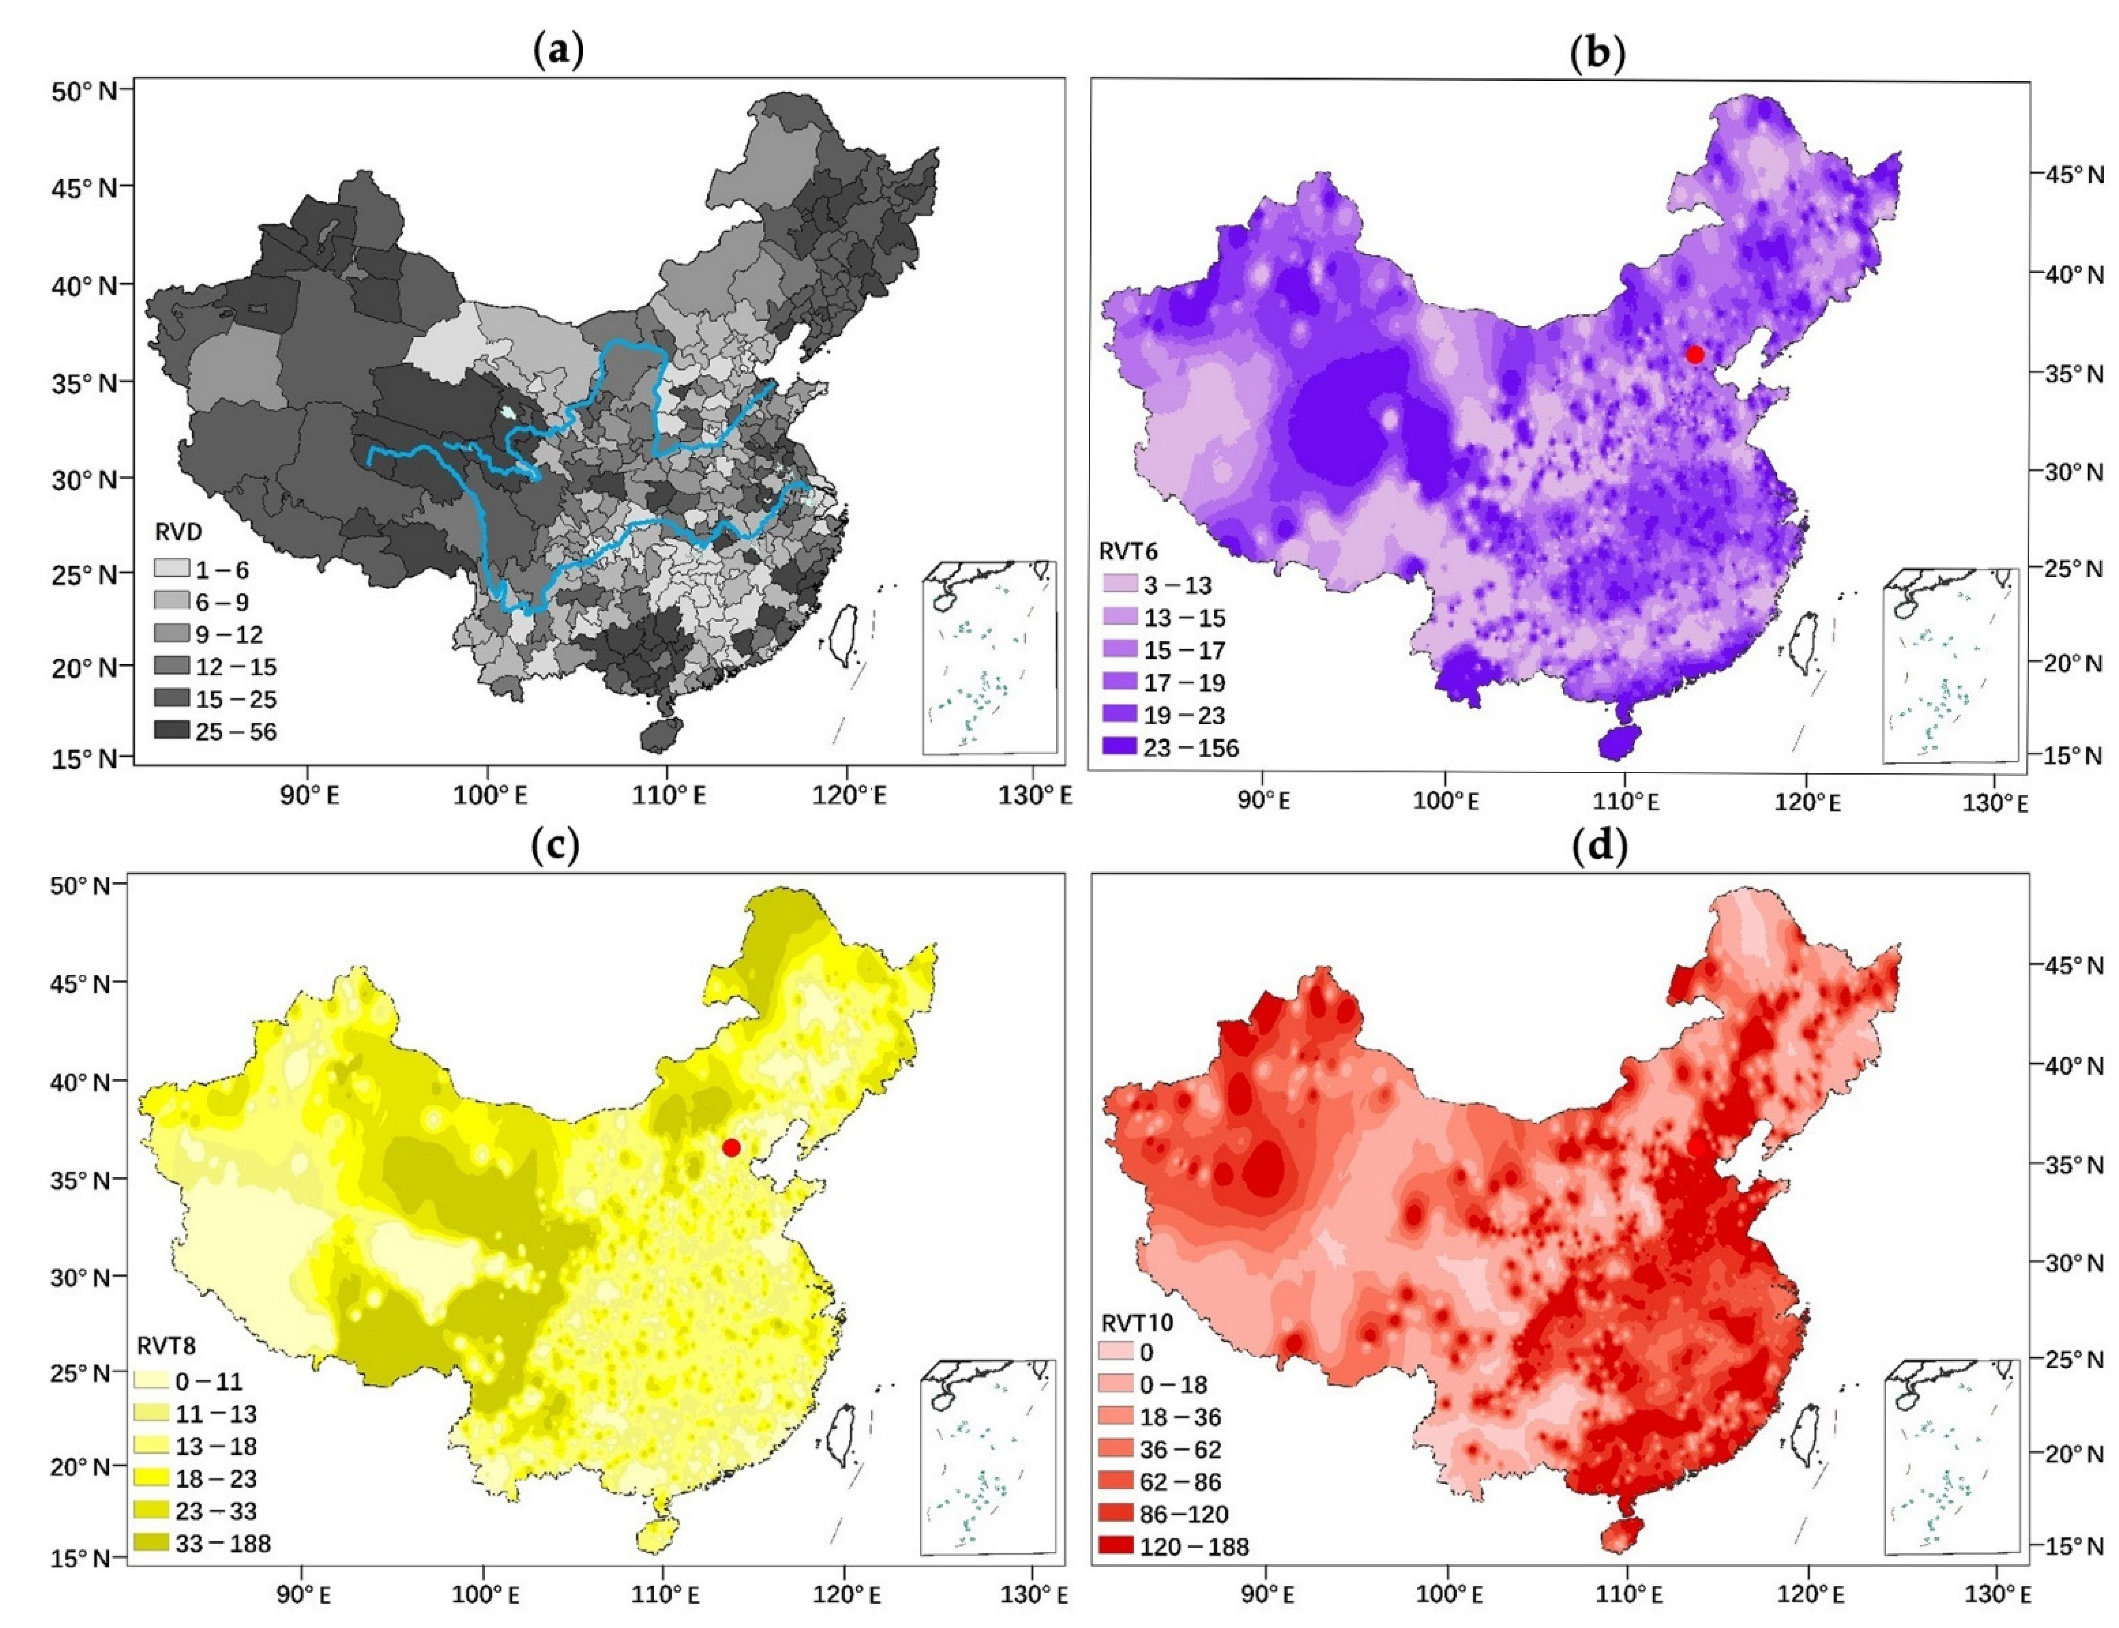
3.3. Estimated Results

We counted the TDs falling within the 10 temperature categories for all regions in each scenario of each GCM. In 2050, compared to 2015, under the RCP4.5 and RCP8.5 scenarios, TD10 will increase from 2.12 days to 4.30 days and to 7.42 days, respectively (Figure 6). In addition, TD9 will increase from 47.62 days to 62.96 days and from 49.02 days to 66.92 days, respectively. Then, according to Equation (4), the mortality of all regions was predicted for 2020–2050. The mortality range for all regions is 3.518‰ to 7.356‰ under the RCP4.5 scenario, and the mortality range for all regions is 3.524‰ to 7.417‰ under the RCP8.5 scenario. A conformity assessment for all GCMs was performed. Compared with the base period (2000–2005), more than 2/3 of the GCMs predicted an increase or decrease in mortality. This indicated that the GCMs’ predictions were consistent, whereas, if more than 1/3 of the GCMs’ change trends were inconsistent, this would be considered uncertain. These results are shown in Figure 7.
As seen in Figure 7, under the RCP4.5 scenario, 89.8% of regions show consistent assessment, and 86 regions show increasing mortality. These regions of increasing mortality (RIM) are mostly located in western China, to the west of the Hu Line, and in Heilongjiang and Yunnan. The regions of decreasing mortality (RDM) are mainly located to the east of the Hu Line and in most of Xinjiang. Regions of uncertain mortality (RUM) are located in parts of western China. Under the RCP8.5 scenario, 91.5% of regions show consistent assessment. The distribution pattern is consistent with that of RCP4.5, except that the number of regions with increasing mortality decreases to 79.
During 2000–2050, the maximum, minimum and average mortality for RDM and RIM under the two scenarios for each year are shown in Figure 8. The black line represents the maximum, average and minimum mortality for the period 2000–2005 and the red line represents the average mortality for the period 2006–2050. The colored lines indicate the maximum and minimum mortality for each model from 2006 to 2050.
As shown in Figure 8a,c, under the RCP4.5 scenario, the mortality range of RIM is 5.116‰ to 7.356‰ and the mortality range of RDM is 3.518‰ to 7.267‰. Under the RCP8.5 scenario (Figure 8b,d), the mortality range of RIM is 5.037‰ to 7.417‰ and the mortality range of RDM is 3.524‰ to 7.315‰. It can be seen that under the RCP8.5 scenario, the future mortality of RIM and RDM will be greater. This high emissions scenario has a much larger impact on mortality in China.

4. Discussion

In this paper, the relationship between temperature days and mortality was revealed for China. Deschênes and Greenstone [32] explored the relationship between these variables in the nine US census divisions (New England, Middle Atlantic, East North Central, West North Central, South Atlantic, East South Central, West South Central, Mountain, Pacific) from 1968 to 2002, dividing temperatures into 10 temperature categories, as we have done. However, using the mortality rates of four age groups, they gave the different groups varying weights to determine comprehensive mortality.
Comparing their relationship (Table 2), the temperature days have more influence on mortality in the United States, showing a V-shaped relationship between the two. For conditions of extreme low and high temperatures, the mortality is more affected by temperature days, while the temperature days in the middle category have almost no impact on mortality; in this temperature category, whether temperature days increase or decrease, mortality is unaffected. In the extreme high temperature category, one additional temperature day will increase the comprehensive mortality rate by 9.4 per 100,000. In the extreme low temperature category, one additional temperature day will increase the comprehensive mortality rate by 7 per 100,000.
In China, the extreme high temperature days have a large influence on mortality and one additional day in this category will increase the mortality rate by 31 per 100,000. In addition, one more day in the extreme low temperature category will increase the mortality rate by 29 per 100,000.
Overall, an increase in the number of temperature days in the extreme high temperature category has a large influence both in China and in the United States. This is because within a particular temperature category, the human body can balance the influence of temperature change through normal temperature regulation. Nevertheless, when people are exposed to extreme high temperatures, the ability to regulate temperature and sensitivity to temperature worsen, leading to a reduction in the ability to maintain a normal temperature and an increase in mortality. Moreover, people with cardiovascular and cerebrovascular diseases, circulatory system disorders and other diseases are more likely to experience an overload state in the thermoregulatory system, increasing the risk of death. Thus, high temperature often causes excessive mortality [37,38].
In China, during seasonal transitions (10~16 °C and 21~27 °C), the human body may adapt poorly to the alternation of warm and cold temperatures, causing increased susceptibility to illness and possibly death. However, in the United States, temperature increases mortality rates in the extreme low temperature and −7~−1 °C category while mortality is nearly unaffected by temperature in the middle temperature category. Due to the lack of mortality data for different age groups, we could not calculate population structure mortality for the moment. The above differences between China and United States are probably related to this fact and call for more detailed data and study in the future.
Elderly people are the group most threatened by high temperatures [39,40,41]. Based on Equation (4), the mortality in all regions was predicted for China from 2006 to 2050. Without considering future changes in the age structure, we may underestimate the impact of high temperature on mortality in the future. China has been considered an aging country since 1999. Although the population from 2000 to 2015 was still dominated by young and middle-aged people (18–50 years old), the aging population in China has reached 18.54% of the total population in 2020, and it is expected to exceed 35% in 2035 [42]. However, it is undeniable that improvements in medical care in the future will greatly increase life expectancy and reduce the mortality rate. Therefore, if the positive and negative aspects offset each other, the future mortality rate of all regions predicted by this paper in 2006–2050 may be appropriate. In addition, a decreasing mortality trend in China can also be found in the study of Zhang et al. [43].
Compared with Deschênes and Greenston [32], although we used the same method, the results from the two countries were different (the temperature days have more influence on mortality in the United States). From this, it seems that the influence of temperature on mortality is also restricted by many factors such as the demographic and economic.
Regarding the impact of economic factors on mortality, many people have carried out this type of research before. Benos et al. [44] investigated the determinants of gender-specific life expectancy across US states over the period 1995–2007. They found that the growing economy had positive effects on life expectancy. However, whether for male or female, the economic impact on mortality is small and the coefficients are 0.047 and 0.089, respectively. Benmarhnia et al. [45] used interrupted time series analyses and the “difference in differences” method to study the relationship between the economic crisis starting in 2008 and the health status of older adults in Spain. They found that the effect of the economic crisis on the mortality of older adults is 0.040. Ariizumi and Schirle [46] investigated the relationship between business cycle fluctuations and health in Canada and they found that a one percentage point increase in the unemployment rate lowered the predicted mortality rate of individuals in their 30s by nearly 2 percent. These studies all showed that positive economic growth helped reduce mortality. However, their study results showed a small impact of the economy on mortality compared to the temperature factor. Hence, the impact of the economy on mortality was little and the economic factor is not considered in the prediction. Compared with the United States and other countries, China’s population statistics are relatively scarce. The data such as the age structure of the population used in the above research can only be obtained through the census every 10 years in China. Therefore, it is difficult for us to carry out the research on human adaptations covering the whole country.
The innovation of this paper lies in finding that there is a relationship between temperature days and mortality in China. More importantly, the impact of extreme high temperature days on mortality was found for China, and it was totally different from the impact in the United States.
Since the study of Deschênes and Greenstone [32], there has been no similar study in other countries in the past 10 years. This study is a beneficial supplement to the study of Deschênes and Greenstone [32]. It shows that no matter in which country, the temperature days have an impact on the mortality of the population, and the specific impact can be calculated by semi parametric regression model. According to the research results, the influence of temperature on mortality can also be considered in other countries, so as to improve the prediction accuracy for future populations. Different temperature classification methods will also affect the establishment of a semi parametric regression model, which shows from another point of view that the impact of temperature on mortality is complex, and more population data, more national data and more statistical models are needed to study it, so as to discover the impact of temperature on mortality from the mechanism.
From Table 3 it can be seen that, in regions of decreasing mortality (RDM), the average of the difference in TD8 is decreasing and the average of the difference in TD9 is increasing under the two scenarios. In regions of increasing mortality (RIM), the average difference in TD8 is largely increasing under the two scenarios. With one additional temperature day in the >32 °C category, the death toll will increase by 23‰. Therefore, under the RCP4.5 and RCP8.5 scenarios, future global warming has little impact on the mortality rate in densely populated eastern China, but will cause mortality rates to rise mainly in the western China.

5. Conclusions

This paper investigated the relationship between temperature days and mortality in China during the period 2000–2015. The impact index values for TD categories 1 to 10 on mortality are 0.284, 0.286, 0.280, 0.291, 0.292, 0.293, 0.284, 0.294, 0.277 and 0.300, respectively. This reveals that high-temperature days (>32 °C) will cause the mortality rate to increase. Seasonal temperature alternations (10~16 °C and 21~27 °C) will also increase mortality rates. However, low temperature days (<−12 °C) have little influence on mortality. Compared with the days of TD9, with one additional temperature day at TD10, the death toll will increase by 23‰.
Based on the NEX-GDDP dataset and the relationship between temperature days and mortality, the temperature days and mortality rate of China were predicted for the period of 2020–2050. It was found that changes in TDs and mortality are obvious in the future. Compared with 2015, under the RCP4.5 scenario and the RCP8.5 scenario, TD10 will increase from 2.12 days to 4.30 days and from 2.18 days to 7.42 days, respectively. Similarly, TD9 will increase from 47.62 days to 62.96 days and from 49.02 days to 66.92 days, respectively.
The results suggest that under the RCP4.5 scenario the range of mortality will be 3.518‰ to 7.356‰ during 2020–2050, and the mortality rate will increase in 86 regions. Under the RCP8.5 scenario, the range of mortality will be 3.524‰ to 7.417‰ during 2020–2050 and the distribution pattern is almost identical to that of the RCP4.5 scenario.
Generally, the increase in greenhouse gas emissions will make the TD10 multiply and cause an increase in mortality. However, the imbalance of economic development among regions will aggravate the mortality difference. In the future, the mortality difference between the economically developed regions of eastern China and the less developed regions of western China will become more and more obvious.

Author Contributions

Conceptualization, Y.W. and Q.M.; methodology, Q.M.; software, Q.M.; validation, X.W., X.Z. (Xinren Zhang) and Q.M.; formal analysis, X.Z. (Xinren Zhang); investigation, Q.M.; resources, Y.W.; data curation, Q.L.; writing—original draft preparation, Q.M.; writing—review and editing, X.Z. (Xiangyi Zheng); visualization, X.Z. (Xiangyi Zheng); supervision, Y.W.; project administration, Y.W.; funding acquisition, Y.W. All authors have read and agreed to the published version of the manuscript.

Funding

This research and the APC was funded by the Second Tibetan Plateau Scientific Expedition and Research Program (STEP No. 2019QZKK0906 and 2019QZKK0606) and China Meteorological Administration through the Feng-Yun III Satellite Ground Application Project (FY-3(03)-AS-12.09, FY-APP-2021.0408).

Institutional Review Board Statement

Not applicable.

Informed Consent Statement

Not applicable.

Data Availability Statement

The NASA Earth Exchange Global Daily Downscaled Projections (NEX-GDDP) dataset is published on the website of https://www.nccs.nasa.gov/services/data-collections/land-based-products/nex-gddp (accessed on 16 May 2021). The mortality data of China is supplied on the website of http://www.stats.gov.cn/tjsj./ndsj/ (accessed on 1 April 2021).

Acknowledgments

The authors thank the NASA Center for Climate Simulation for making the NASA Earth Exchange Global Daily Downscaled Projections (NEX-GDDP) dataset available and thank the National Bureau of Statistic for providing the mortality data. We also thank the Beijing Municipal Climate Center for providing the national meteorology station data.

Conflicts of Interest

The authors declare no conflict of interest.

References

  1. IPCC. Climate Change 2021—The Physical Science Basis; Cambridge University Press: Cambridge, UK; New York, NY, USA, 2021. [Google Scholar]
  2. Mora, C.; Dousset, B.; Caldwell, I.; Powell, E.F.; Geronimo, R.C.; Bielecki, R.C.; Counsell, W.W.C.; Dietrich, S.B.; Jhonstone, T.E.; Louis, V.L.; et al. Global risk of deadly heat. Nat. Clim. Chang. 2017, 7, 501–506. [Google Scholar] [CrossRef] [Green Version]
  3. Ebi, K.L.; Capon, A.; Berry, P.; Broderick, C.; de Dear, R.; Havenith, G.; Honda, Y.; Kovats, R.S.; Ma, W.; Malik, A.; et al. Hot weather and heat extremes: Health risks. Lancet 2021, 398, 698–708. [Google Scholar] [CrossRef]
  4. Hajat, S.; Haines, A.; Sarran, C.; Sharma, A.; Bates, C.; Fleming, L.E. The effect of ambient temperature on type-2-diabetes: Case-crossover analysis of 4+ million GP consultations across England. Environ. Health 2017, 16, 73. [Google Scholar] [CrossRef] [Green Version]
  5. Yildirim, C.A.; Metem, S.; Kamber, D. Blood viscosity and blood pressure: Role of temperature and hyperglycemia. Am. J. Hypertens. 2001, 14, 433–438. [Google Scholar]
  6. Cui, J.; Sinoway, L.I. Cardiovascular responses to heat stress in chronic heart failure. Curr. Heart. Fail Rep. 2014, 11, 139–145. [Google Scholar] [CrossRef] [PubMed]
  7. Wu, Y.; Li, S.; Zhao, Q.; Wen, B.; Gasparrini, A.; Tong, S.; Overcenco, A.; Urban, A.; Schneider, A.; Entezari, A.; et al. Global, regional, and national burden of mortality associated with short-term temperature variability from 2000–2019: A three-stage modelling study. Lancet Planet. Health 2022, 6, e410–e421. [Google Scholar] [CrossRef]
  8. Gasparrini, A.; Guo, Y.; Hashizume, M.; Lavigne, E.; Zanobetti, A.; Schwartz, J.; Tobias, A.; Tong, S.; Rocklöv, J.; Forsberg, B.; et al. Mortality risk attributable to high and low ambient temperature: A multicountry observational study. Lancet 2015, 386, 369–375. [Google Scholar] [CrossRef]
  9. Bressler, R.D.; Moore, F.C.; Rennert, K.; Anthoff, D. Estimates of country level temperature-related mortality damage functions. Sci Rep. 2021, 11, 20282. [Google Scholar] [CrossRef]
  10. Yang, Z.; Wang, Q.; Liu, P. Extreme temperature and mortality: Evidence from China. Int. J. Biometeorol. 2019, 63, 29–50. [Google Scholar] [CrossRef]
  11. Gasparrini, A.; Guo, Y.; Hashizume, M.; Kinney, P.; Petkova, E.P.; Lavigne, E.; Zanobetti, A.; Schwartz, D.J.; Tobias, A.; Leone, M.; et al. Temporal Variation in Heat–Mortality Associations: A Multicountry Study. Environ. Health Perspect. 2015, 123, 1200–1207. [Google Scholar] [CrossRef] [Green Version]
  12. Kim, H.; Kim, H.; Byun, G.; Choi, Y.; Song, H.; Lee, J.-T. 2019: Difference in temporal variation of temperature-related mortality risk in seven major South Korean cities spanning 1998–2013. Sci. Total Environ. 2015, 656, 986–996. [Google Scholar] [CrossRef]
  13. Guo, Y.; Gasparrini, A.; Armstrong, G.B.; Tawatsupa, B.; Tobias, A.; Lavigne, E.; Coelho, M.S.; Pan, X.; Kim, H.; Hashizume, M.; et al. Temperature Variability and Mortality: A Multi-Country Study. Environ. Health Perspect. 2016, 124, 1554–1559. [Google Scholar] [CrossRef] [PubMed] [Green Version]
  14. Scovronick, N.; Sera, F.; Acquaotta, F.; Garzena, D.; Fratianni, S.; Wright, C.Y.; Gasparrini, A. The association between ambient temperature and mortality in South Africa: A time-series analysis. Environ. Res. 2018, 161, 229–235. [Google Scholar] [CrossRef] [PubMed]
  15. Lee, W.-H.; Lim, Y.-H.; Dang, T.N.; Seposo, X.; Honda, Y.; Guo, Y.-L.L.; Jang, H.-M.; Kim, H. An Investigation on Attributes of Ambient Temperature and Diurnal Temperature Range on Mortality in Five East-Asian Countries. Sci. Rep. 2017, 7, 10207. [Google Scholar] [CrossRef] [PubMed] [Green Version]
  16. Yang, J.; Ou, C.-Q.; Ding, Y.; Zhou, Y.-X.; Chen, P.-Y. Daily temperature and mortality: A study of distributed lag non-linear effect and effect modification in Guangzhou. Environ. Health 2012, 11, 63. [Google Scholar] [CrossRef] [Green Version]
  17. Wu, W.; Xiao, Y.; Li, G.; Zeng, W.; Lin, H.; Rutherford, S.; Xu, Y.; Luo, Y.; Xu, X.; Chu, C.; et al. Temperature–mortality relationship in four subtropical Chinese cities: A time-series study using a distributed lag non-linear model. Sci. Total Environ. 2013, 449, 355–362. [Google Scholar] [CrossRef]
  18. Kinney, P.L.; Schwartz, J.; Pascal, M.; Petkova, E.; Tertre, A.L.; Medina, S.; Vautard, R. Winter Season Mortality: Will Climate Warming Bring Benefits? Environ. Res. Lett. 2015, 10, 064016. [Google Scholar] [CrossRef]
  19. Shaposhnikov, D.; Revich, B. Toward meta-analysis of impacts of heat and cold waves on mortality in Russian North. Urban Clim. 2016, 15, 16–24. [Google Scholar] [CrossRef]
  20. Greene, S.; Kalkstein, L.S.; Mills, D.M.; Samenow, J. An Examination of Climate Change on Extreme Heat Events and Climate–Mortality Relationships in Large, U.S. Cities. Wea. Clim. Soc. 2011, 3, 281–292. [Google Scholar] [CrossRef]
  21. Ma, W.; Zeng, W.; Zhou, M.; Wang, L.; Rutherford, S.; Lin, H.; Liu, T.; Zhang, Y.; Xiao, J.; Zhang, Y.; et al. The short-term effect of heat waves on mortality and its modifiers in China: An analysis from 66 communities. Environ. Int. 2015, 75, 103–109. [Google Scholar] [CrossRef]
  22. Wang, Y.; Wang, A.; Zhai, J.; Tao, H.; Jiang, T.; Su, B.; Yang, J.; Wang, G.; Liu, Q.; Gao, C.; et al. Tens of thousands additional deaths annually in cities of China between 1.5  °C and 2.0  °C warming. Nat. Commun. 2019, 10, 3376. [Google Scholar] [CrossRef]
  23. Yang, J.; Yin, P.; Sun, J.; Wang, B.; Zhou, M.; Li, M.; Tong, S.; Meng, B.; Guo, Y.; Liu, Q. Heatwave and mortality in 31 major Chinese cities: Definition, vulnerability and implications. Sci. Total Environ. 2019, 649, 695–702. [Google Scholar] [CrossRef] [PubMed]
  24. Denpetkul, T.; Phosri, A. Daily ambient temperature and mortality in Thailand: Estimated effects, attributable risks, and effect modifications by greenness. Sci. Total Environ. 2021, 791, 148373. [Google Scholar] [CrossRef]
  25. Ban, J.; Xu, D.; He, M.Z.; Sun, Q.; Chen, C.; Wang, W.; Zhu, P.; Li, T. The effect of high temperature on cause-specific mortality: A multi-county analysis in China. Environ. Int. 2017, 106, 19–26. [Google Scholar] [CrossRef] [PubMed] [Green Version]
  26. Bai, L.; Cirendunzhu; Woodward, A.; Liu, Q. Temperature and mortality on the roof of the world: A time-series analysis in three Tibetan counties, China. Sci. Total Environ. 2014, 485–486, 41–48. [Google Scholar] [CrossRef] [PubMed] [Green Version]
  27. Wang, C.; Chen, R.; Kuang, X.; Duan, X.; Kan, H. Temperature and daily mortality in Suzhou, China: A time series analysis. Sci. Total Environ. 2014, 466, 985–990. [Google Scholar] [CrossRef]
  28. Chen, K.; Bi, J.; Chen, J.; Chen, X.; Huang, L.; Zhou, L. Influence of heat wave definitions to the added effect of heat waves on daily mortality in Nanjing, China. Sci. Total Environ. 2015, 506-507, 18–25. [Google Scholar]
  29. Lin, Q.X.; Wang, L.J.; Lin, Z.Q.; Yin, P.; Huang, Z.J.; Liu, T.; Xiao, J.P.; Li, X.; Zeng, W.L.; Lin, S.; et al. Definition of heat wave based on mortality risk assessment in different regions of China Chinese. J. Prev. Med. 2019, 1, 97–102. [Google Scholar]
  30. Ma, Z.G.; Fu, C.B.; Ren, X.B.; Yang, C. Trend of Annual Extreme Temperature and Its Relationship to Regional Warming in Northern China. Acta Geogr. Sin. 2003, 58, 11–20. (In Chinese) [Google Scholar]
  31. Cardil, A.; Molina, D.M.; Kobziar, L.N. Extreme temperature days and their potential impacts on southern Europe. Nat. Hazards Earth Syst. Sci. 2014, 14, 3005–3014. [Google Scholar] [CrossRef] [Green Version]
  32. Deschênes, O.; Greenstone, M. Climate Change, Mortality, and Adaptation: Evidence from Annual Fluctuations in Weather in the US. Am. Econ. J. Appl. Econ. 2011, 3, 152–185. [Google Scholar] [CrossRef]
  33. Domrös, M.; Gongbing, P. Climate Zones of China. In The Climate of China; Springer: Berlin/Heidelberg, Germany, 1988. [Google Scholar]
  34. Xu, Y.; Xu, C.H. The Projection of Temperature and Precipitation over China under RCP Scenarios using a CMIP5 Multi-Model Ensemble. Atmos. Ocean. Sci. Lett. 2012, 5, 527–533. [Google Scholar]
  35. Jiang, D.; Hu, D.; Tian, Z.; Lang, X. Differences between CMIP6 and CMIP5 Models in Simulating Climate over China and the East Asian Monsoon. Adv. Atmos. Sci. 2020, 37, 1102–1118. [Google Scholar] [CrossRef]
  36. Thrasher, B.; Wang, W.; Michaelis, A.; Melton, F.; Lee, T.; Nemani, R. NASA Global Daily Downscaled Projections, CMIP6. Sci. Data 2022, 9, 1–6. [Google Scholar] [CrossRef] [PubMed]
  37. Kilbourne, E.M. Heat Waves and Hot Environments; Oxford University Press: Oxoford, UK, 1997. [Google Scholar]
  38. Kinney, P.L. A new measure of health effects. Nat. Clim. Chang. 2012, 2, 233–234. [Google Scholar] [CrossRef]
  39. Huang, W.; Kan, H.; Kovats, S. The impact of the 2003 heat wave on mortality in Shanghai, China. Sci. Total Environ. 2010, 408, 2418–2420. [Google Scholar] [CrossRef]
  40. Ma, W.; Yang, C.; Tan, J.; Song, W.; Chen, B.; Kan, H. Modifiers of the temperature–mortality association in Shanghai, China. Int. J. Biometeorol. 2012, 56, 205–207. [Google Scholar] [CrossRef]
  41. Péres, W.E.; Ribeiro, A.F.S.; Russo, A.; Nunes, B. The Association between Air Temperature and Mortality in Two Brazilian Health Regions. Climate 2020, 8, 16. [Google Scholar] [CrossRef] [Green Version]
  42. Xi, W.; Yu, X.T. Prediction and Analysis of the Population Age Structure in China. Stat. Decis. 2015, 5, 112–116. (In Chinese) [Google Scholar]
  43. Zhang, Z.; Dai, Z.J.; Yang, J. Evaluating the Two-dimensional Mortality Model for Mortality Study in China. Chin. J. Popul. Sci. 2017, 1, 81–91. [Google Scholar]
  44. Benos, N.; Karkalakos, S.; Zotou, S. Spatial and economic patterns in life expectancy among us states. Appl. Econ. 2019, 51, 5856–5869. [Google Scholar] [CrossRef]
  45. Benmarhnia, T.; Zunzunegui, M.V.; Llácer, A.; Béland, F. Impact of the economic crisis on the health of older persons in spain: Research clues based on an analysis of mortality. sespas report 2014. Gac. Sanit. 2014, 28, 137–141. [Google Scholar] [CrossRef] [PubMed] [Green Version]
  46. Ariizumi, H.; Schirle, T. Are recessions really good for your health? Evidence from Canada. Soc. Sci. Med. 2012, 74, 1224–1231. [Google Scholar] [CrossRef] [PubMed]
Figure 1. Temperature days, annual maximum, minimum and average temperatures of 4 representative stations (2000–2015) ((a) Guangzhou station; (b) Beijing station; (c) Daxinganling station; (d) Lasa station.
Atmosphere 13 01775 g001
Figure 2. The average mortality for 343 regions in China (2000–2015).
Atmosphere 13 01775 g002
Figure 3. The relationship between temperature days and mortality in China.
Atmosphere 13 01775 g003
Figure 4. The relative variabilities for mortality and temperature days in China. (a) RVD; (b) RVT6; (c) RVT8; (d) RVT10.
Atmosphere 13 01775 g004
Figure 5. The mortality change for an abnormal year relative to a normal year in TD6, TD8, TD10.
Atmosphere 13 01775 g005
Figure 6. TD10 for 2050 ((a) RCP4.5; (b) RCP8.5).
Atmosphere 13 01775 g006
Figure 7. The conformity assessment for future mortality change in China (2020–2050) ((a) RCP4.5; (b) RCP8.5).
Atmosphere 13 01775 g007
Figure 8. The maximum, minimum and average mortality of regions in China (2000–2050) ((a) RIM(RCP4.5); (b) RIM(RCP8.5); (c) RDM(RCP4.5); (d) RDM(RCP8.5)).
Atmosphere 13 01775 g008
Table 1. Information on 21 GCMs from NEX-GDDP dataset.
Model NameModeling CenterSimulation PeriodResolution
Australian Community Climate and Earth System Simulator version 1 (ACCESS1-0)Australia2006–20500.25° × 0.25°
Beijing Climate Center Climate System Model version 1 (BCC-CSM1-1)China2006–20500.25° × 0.25°
Beijing National University Earth System Model (BNU-ESM)China2006–20500.25° × 0.25°
Canadian Earth System Model version 2 (CanESM2)Canada2006–20500.25° × 0.25°
Community Climate System Model version 4 (CCSM4)USA2006–20500.25° × 0.25°
Community Earth System Model, version 1-Biogeochemistry (CESM1-BGC)USA2006–20500.25° × 0.25°
Centre National de Recherches Météorologiques Climate Model version 5 (CNRM-CM5)France2006–20500.25° × 0.25°
Australian Commonwealth Scientific and Industrial Research Organization MK3 version 6 (CSIRO-MK3-6-0)Australia2006–20500.25° × 0.25°
Geophysical Fluid Dynamics Laboratory Climate Model version 3 (GFDL-CM3)USA2006–20500.25° × 0.25°
Geophysical Fluid Dynamics Laboratory Earth System Model (GFDL-ESM2G)USA2006–20500.25° × 0.25°
Geophysical Fluid Dynamics Laboratory Earth System Model (GFDL-ESM2M)USA2006–20500.25° × 0.25°
Institute of Numerical Mathematics climate model version 4 (INMCM4)Russia2006–20500.25° × 0.25°
Institute Pierre-Simon Laplace Climate Model version 5A Low Resolution (IPSL-CM5A-LR)France2006–20500.25° × 0.25°
Institute Pierre-Simon Laplace Climate Model version 5A Middle Resolution (IPSL-CM5A-MR)France2006–20500.25° × 0.25°
Model for Interdisciplinary Research on Climate-Earth System version 5 (MIROC5)Japan2006–20500.25° × 0.25°
Model for Interdisciplinary Research on Climate-Earth System (MIROC-ESM)Japan2006–20500.25° × 0.25°
Atmospheric Chemistry Coupled Version of Model for Interdisciplinary Research on Climate-Earth System (MIROC-ESM-CHEM)Japan2006–20500.25° × 0.25°
Max-Planck Institute Earth System Model-Low Resolution (MPI-ESM-LR)Germany2006–20500.25° × 0.25°
Max-Planck Institute Earth System Model-Middle Resolution (MPI-ESM-MR)Germany2006–20500.25° × 0.25°
Meteorological Research Institute Coupled General Circulation Model version 3 (MRI-CGCM3)Japan2006–20500.25° × 0.25°
Norwegian Earth System Model version 1 with Intermediate Resolution (NorESM1-M)Norway2006–20500.25° × 0.25°
Table 2. The coefficients of ten temperature categories.
CategoryTD1TD2TD3TD4TD5TD6TD7TD8TD9TD10
China0.2840.2860.2800.2910.2920.2930.2840.2940.2770.300
United States0.6900.5900.6400.3600.2700.0000.1200.2300.3300.940
Table 3. Average of the difference in TD between 2000–2005 and 2020–2050 under two scenarios.
CategoryTD1 TD2TD3TD4TD5TD6 TD7TD8 TD9 TD10
RCP4.5RDM−0.5−0.4−1.6−5.1−2.4−1.7−2.8−4.817.22.0
RUM−5.3−2.4−0.2−0.2−1.6−2.6−1.97.56.50.2
RIM−4.4−3.6−1.0−0.5−3.70.3−4.414.72.40.2
RCP8.5RDM−0.7−0.5−2.1−6.1−3.1−1.7−3.0−6.820.43.6
RUM−6.8−3.3−0.20.1−1.7−3.3−2.77.89.50.5
RIM−5.8−4.5−1.2−0.1−4.00.2−5.316.83.70.2
Publisher’s Note: MDPI stays neutral with regard to jurisdictional claims in published maps and institutional affiliations.

