1. Introduction
This paper is based on the work carried out in response to the need of extending capability development and integration of emissions inventory data for air pollution modelling, in a programme entitled DUKEMS (Developing a UK Community Emissions Modelling System) carried out as part of the wider UK Strategic Priorities Fund Clean Air activities.
Emerging requirements from user engagement have highlighted particular data needs around emissions from road dust resuspension (RDS), which is not very well constrained in current emission inventories. Several measurement studies and campaigns focusing on RDS [
1,
2,
3,
4,
5,
6,
7], have shown this to be an important source of ambient particulate matter (PM) concentrations; however, there are not well established or recently developed methods for measuring or modelling this source of emissions. Moreover, conventional inventory methodologies are not available for this source of emissions and it is not yet covered in the UK’s National Atmospheric Emissions Inventory (NAEI) or inventory guidebooks provided for inventory development across Europe.
This paper provides a comprehensive and updated review of the main approaches and methods for estimating suspension of PM that were developed in early 2000 in the US, and some other recent models that have been developed in Europe. In addition, building on those identified models, this paper provides some preliminary analysis on whether an approach can be tailored for the UK in the Emissions Modelling System (UK-EMS) developed as part of the objectives of the DUKEMS project. A modelling exercise has been performed using a UK-based case study and an air quality modelling suite, namely RapidAir®, completing the review with some recommendations for longer-term implementation.
1.1. RDS and Impact on PM Emissions and Air Quality Levels
Four main processes are responsible for the bulk of non-exhaust PM emissions to air: the wearing down of brakes, tyres, road surfaces, and the resuspension of road dust. The amount of PM emissions that a vehicle emits is determined by many factors, including vehicle weight; the types of technologies (e.g., regenerative braking) and material composition of brakes, tyres, and roads; the amount of dust on road surfaces; weather conditions; and driving styles. Although uncertainty remains with respect to the amount of PM emitted from non-exhaust sources under real-world driving conditions [
1], non-exhaust emissions will increase in the coming years along with increases in the demand for urban passenger travel that is projected to more than double by 2050 [
2].
It is important to acknowledge that both at UK level and worldwide, non-exhaust sources of PM (and Volatile Organic Compound (VOC)) now frequently exceed exhaust emissions [
3] to become the major source of PM from road transport. Moreover, according to a European Environmental Agency report [
1], non-exhaust particulate emission of PM
10 overtook exhaust emissions to become the dominant source already back in 2012 for the PM
10 fraction. As of 2018, non-exhaust emissions of PM
2.5 were also on a par with exhaust emissions. This trend is expected to continue as exhaust emissions further reduce with the fleet penetration of newer and cleaner vehicles, meeting tighter emission standards achieved through the fitting of particulate filters on new diesel vehicles and the increasing share of electric vehicles in the fleet. It is estimated that non-exhaust sources currently included in emissions inventories (from brake, tyre wear and road abrasion) will be responsible for 90% of PM
2.5 emissions from road transport in the UK by 2030 [
4]. However, the resuspended component of PMs is emerging as another very important source.
Definition of Road Dust Suspension (RDS) or Resuspension: RDS are the particles already present on road surfaces that are suspended/uplifted in the air by vehicle movement, mediated for example via tyre shear stress or vehicle wake turbulence. Resuspended particles comprise of particles generated from the other primary non-exhaust emissions—brake wear, tyre wear, road surface wear—as well as particles from other sources that have also deposited onto the road surface, for example exhaust emission particles, particles from de-icing and gritting, wind-blown dust and biogenic particles. Consequently, the composition of resuspension particles comprises all the components described above, with different chemical nature.
1.2. Evidence of Measured Contributions and Size Distributions
Several studies over the last decade have looked at the RDS component in urban areas and tried to quantify the contribution to PM levels and for different size distribution (PM10, PM2.5).
Based on tracer-derived data originally presented by [
3] in 2012, [
5] in 2021 reported the kerbside PM
10 increment at the London Marylebone Road site due to brake wear, tyre wear and resuspension to be 2.8, 0.5 and 1.5 μg/m
3, respectively. During a later study at the same site, [
6] used combined factorisation to estimate the total contribution of vehicle wear and resuspension to PM
2.5–10 to be 1.3 and 3.1 μg/m
3, respectively. Through the analysis and classification of samples analysed using electron microscopy, [
7] estimated a PM
10 kerbside increment in Ruhr (Germany) due to abrasion and resuspension of 0.8 and 4.2 μg/m
3, respectively. In contrast, estimates of the contribution to PM
2.5 tend to be more minor. In Toronto, [
8] used combined factorisation to estimate the average brake wear and resuspension contributions to be 0.2 μg/m
3 each at a downtown site and 0.6 and 0.3 μg/m
3, respectively, at a highway site.
Around the world, other studies and research have quantified the overall contribution of RDS at country level. In the US, based on US Environmental Protection Agency (USEPA) inventories in 2017, it was clear that resuspension alone made a large contribution to area-wide emissions of PM
2.5 and PM
10 from road transport. Emissions from resuspension on paved roads were 209 kilotons [
9].
In 2014, the Organisation for Economic Co-operation and Development [
2] concluded that globally at least 50% of total traffic emissions of PM
10 and 5% of primary PM
10 from all sources were non-exhaust emissions, even when resuspension is excluded. Corresponding figures for PM
2.5 are 34% and 4%, respectively. However, in one of the most recent studies [
4], when RDS is taken into account, non-exhaust emissions represent 95% of all road traffic emissions and 15% of all source emissions.
Moreover, according to [
2] Inventories for Mexico, Bogota in Colombia, and Santiago in Chile, all highlight the importance of road dust resuspension with contributions to total primary emissions from all sources ranging from 16% to 54% (PM
10) and from 9 to 56% (PM
2.5) in these regions.
1.3. Significant Factors Impacting RDS
As highlighted in previous section, RDS has been found in the literature to contribute a significant proportion of PM
10 and PM
2.5 concentrations, and in addition to factors related to vehicles and road infrastructure widely covered in [
10], RDS has been shown to vary seasonally. For example, the use of salt on roads in the winter can lead to high resuspension in winter/spring. The type of road surface can also impact the resuspension. Climate can also impact resuspension with dry climates more prone to higher road dust, and higher levels have also been associated with type of tyre (for example higher non-exhaust emissions in Scandinavian countries due to studded tyres [
11]).
Rainfall can also change the dust resuspension by aggregating smaller particles to larger ones and causing particle run off. The USEPA set a precipitation threshold (0.254 mm/h) above which resuspension no longer occurs as a result of the above processes. They estimate that rainfalls greater than the threshold value will impact resuspension after 2 h of rainfall for total suspended particles (TSP) and 4 h of rainfall for PM
10. An RDS study conducted in Madrid assumed a linear decrease in the impact of rainfall with time [
12]. The consideration of hourly rainfall is clearly important when considering short-term PM emissions and concentrations, however, further research should be carried out to establish the impact of rainfall when annual emissions and concentrations are being considered.
Dust can be resuspended by two main factors:
- (1)
Abrasion (traffic moving over the road surface resuspending particles already present on the road, such as silt);
- (2)
By the wind.
Abrasion should take into consideration the number of vehicles travelling on a road as well as the vehicle speeds (although several studies mention that this is not commonly used in many resuspension emission calculations, which is a limitation of these methods).
Wind can physically blow particles along the road leading to their resuspension—whether this variable is appropriate at an annual mean calculation remains to be demonstrated, and in the literature this has been applied at hourly levels [
12,
13].
The above factors could have a significant impact when calculating hourly resuspension emissions and further work would be needed to determine if these factors are also significant when modelling annual average emissions/concentrations.
For the above reasons, and for other factors such as the risk of double counting the contribution of these sources in emission inventories, the inclusion of PM from resuspension in the development of the emission inventory is the subject of an ongoing debate.
2. Materials and Methods
2.1. Double-Counting Issue
The field of double counting is a commonly encountered issue in emission inventories and primarily results from using different methodologies to measure the particles emitted from different sources [
14]. Some authors claim that insofar as the particles from direct brake, tyre, and road wear can be deposited on road surfaces and resuspended, the inclusion of these particles as resuspended dust in emission inventories implies double counting.
However, other reasoning argues that resuspension should be counted somehow in emission inventories for several reasons [
2]:
First, double counting may be confused with the concept of re-emissions, which occur at a different time than initial emissions. A brake wear particle is, for example, considered an initial emission when generated and measured, then this particle is considered a re-emission when it is deposited on the road surface and later resuspended and measured again [
8]. Re-emissions are present in road dust, but also consist of particles that are not re-emitted, or were not originally generated from vehicle brake, tyre, or road wear. This includes wind-blown dust particles coming from surroundings of roads, construction sites, and those generated by further fragmentation of larger particles from road surfaces and traffic.
For this reason, double counting becomes problematic in emissions inventories when the calculation of emission factors for resuspension do not deduct re-emissions.
Second, evidence from studies of PM source apportionment demonstrates that resuspension contributes significantly to PM levels even when direct wear emissions are excluded [
2,
3,
15,
16,
17,
18,
19]. Other studies using dispersion modelling techniques demonstrated that including RDS in emission inventories significantly improves both mass closure and the correlation between simulated and observed PM data [
20,
21,
22].
Moreover, since ambient PM from resuspension exists even in the absence of road traffic (e.g., wind naturally blows and moves fine dust material on the roads), the inclusion of RDS emissions as a component of non-exhaust traffic emissions may not reflect the full resuspension emissions; however, several experiments suggests that although the wind lifts deposited dust, it is not responsible for all of the PM emissions from road dust that are measured on roadways [
2].
A final point is that resuspension does not depend fully on traffic itself but is dependent on pre-existing dust present on road surfaces. However, even in the absence of dust on road surfaces, vehicle traffic generates the fragmentation of very large particles that had not previously been airborne into smaller particles that can then be suspended.
The argument generally centres on the intended purpose of an emissions inventory in the first place, e.g., whether simply for official reporting to show progress against internationally agreed emission reduction targets or for source apportionment of measured PM concentrations. Given these considerations, at least for understanding its contribution to concentrations in ambient air, including resuspension as a source of non-exhaust emissions in emission inventories is therefore recommended [
2].
2.2. Methods to Calculate RDS Emissions in the Literature
Emissions factors have been derived by various research groups worldwide, but as these are based on different measurement methodologies and the large spatial differences in road dust between countries, these factors are variable. Three main groupings of emissions factors calculations were described as follows [
23]:
Emissions factors calculated from real-world ambient measurement data, e.g., traffic vs. background, upwind vs. downwind, and comparing NOx to PM10 ratios;
Emission factors based on resuspension fluxes or correlation between emission rates and dust loading;
Emission factors based on real-time emission rates measured on mobile systems.
2.2.1. Emission Factors Estimated from Real-World Measurements
Emissions Factors from Air Quality (AQ) Measurements
In this approach, concentrations from background sites are subtracted from roadside site concentrations for both NOx and PM10. This leaves the roadside increment for each pollutant which, using vehicle emission factors for an average fleet with vehicle activity and dispersion, can then be used to estimate road resuspension concentrations. These can then be converted to emissions, for example by multiplying the concentrations by the NOx emission rate, all divided by the difference in NOx concentrations between the road and background site. While this approach ensures local dust emissions are represented, a limitation of this approach is the need for measurement sites measuring concurrently for both pollutants for both site types. There is clearly a lot of uncertainty in this technique due to uncertainty associated with measurement data, and different siting of measurement stations could lead to different emissions factors for dust resuspension.
London Case Study of AQ Measurements Approach
A measurement-based approach to estimate resuspension (coarse) particle emission factors has been published for Marylebone Road, London [
24]. Concentrations at roadside and background stations for PM
10, PM
2.5, NO
x and PM
10–2.5 were calculated, and roadside increment concentrations were established by roadside–background concentrations. The ratio of roadside increment NO
x and PM
10 was established within a set of bounds (established from scatter plots). Total PM
10 emissions were calculated from the NO
x emissions (calculated using traffic information and emission factors) and the ratio between PM
10 and NO
x concentrations. It is assumed that the non-exhaust emissions were all in the PM
2.5–10 fraction, e.g., coarse particles. The ratio between PM
2.5–10 and PM
10 was used to estimate the coarse fraction, PM
10 emissions. The road resuspension emissions were determined by subtracting the sum of abrasion emissions (brake, tyre and road) from the total PM
2.5–10 emissions. The emissions per vehicle were calculated by dividing the resuspension emissions by the number of vehicles travelling along the road. Additionally, simultaneous equations were used to solve the contribution of light and heavy goods vehicles (LGVs and HGVs, respectively) to the resuspension emission factors—this found that HGVs were almost entirely responsible for resuspension (emission factors for resuspension from HGVs were approx. 30 times larger than LGVs). Multiple regression analysis was used to establish the contribution of wind speed, rainfall (specifically hours since last rainfall) and HGV traffic to the resuspension emissions. This found an increase in resuspension with wind speed, with the gradient diminishing at higher wind speeds; using meteorology gathered at the Bexley Met Station (Greater London) the resuspension decreased for low wind speeds before increasing with higher wind speeds. Plotting rainfall against resuspension shows no correlation—they suggest that looking at precipitation total and number of hours since last rainfall is insufficient to determine the impact of rainfall—e.g., rainfall intensity, duration and evaporation may also need to be considered. Alternatively, the impact of rainfall is masked by the HGV and wind speed impacts. Multilinear regression found HGVs are the dominant variables with little impacts from wind speed and hours since last rainfall [
25].
2.2.2. Models to Calculate Road Dust Resuspension
This section covers and describes the most used and recent modelling approaches for calculating road dust resuspension emissions.
EPA—AP-42
Emissions from resuspension in the U.S. inventory, categorised under the term “paved road dust”, are calculated in a method described in the USEPA’s AP-42 compilation manual [
26]. The EPA has a near-linear empirical equation to calculate dust resuspension which has been used internationally to increase PM emissions to account for resuspension. The main rule used relates an emission factor in g/km (E) to vehicle weight (W), silt loading of the road surface (sL), a particle size multiplier for PM
2.5 or PM
10 (k), and the emission factor for 1980s vehicle exhaust, brake and type wear. A correction is then made for the number of precipitation days in the model period. Road surface and environmental conditions are highly variable, and the factors from this approach are highly uncertain and not necessarily universal as it applies only to the range of variables from which the equation was derived. Moreover, this model does not take into account vehicle speed, which has been suggested in the literature to be a severe limitation of the AP-42 method.
An alternative equation is provided for unpaved road [
27].
HERMES
The HERMES model was developed in Spain and has been used to model regional resuspension emission for road segments or regions in Spain [
25]. The resuspension emission rate (
Eresuspension) is calculated based on the length of road (L), traffic flow (AADT) and empirical resuspension emissions factors (
EFv). Emission factors are provided for passenger cars, heavy and light duty vehicles and motorcycles from a measurement campaign carried out in Barcelona. Additionally, a correction factor is applied to account for rainfall effects (
S(
Hrain)), and temporal scaling factors to represent the month, day and hour being modelled (
FM(
m),
FM(
d) and
FM(
h), respectively).
For the purpose of the application carried out in this paper, in the selected case study in the UK the following parameterisation (
Table 1) has been used for testing, that assuming a model year of 2018:
NORTRIP
The NORTRIP model has been developed by the Norwegian Institute for Air Research [
28,
29] and is a more detailed calculation to model resuspension emissions; it takes into account several factors in the calculation including vehicle speed and flow, and wet vs. dry in terms of resuspension. There are many different equations within this model to capture PM mass balance, wear rates (separated by brake, tyre and road), sink rate, etc. The NORTRIP model relies on a large amount of input data which may not be readily or locally available, e.g., pavement coating, maximal size grains, number of grains in the surface, the hardness of the surface, and the liquid water mass on the surface. The NORTRIP model does not account for wind-blown suspension as this was deemed to have a non-significant impact on resuspension emissions.
The HERMES, NORTRIP and measurement-based emission factors were compared in air quality modelling conducted by [
30]. They found the NORTRIP model generally producing more representative emissions estimates for resuspension but noted that the model was more complex than HERMES (note: an updated version of HERMES has been published since this intercomparison and the HERMES equations are more detailed now).
NORTRIP has also been used to assess impacts of different studded tyres, with the tyres with most studs (190) generating significantly higher PM
10 levels and impacting in net (only the local contribution of PM
10 from the street environment) and mean total (including background) PM
10 concentration in the order of 41% and 22%, respectively [
31].
Empirical Model by Padoan [32]
The Padoan et al. model has derived a multiple linear regression model to predict the maximum road dust suspensible fraction smaller than 10 µm (MF10) at a generic location
i. Specifically, influence of road characteristics such as pavement macro-texture, traffic intensity and distance to braking zones on real-world road dust loading that can be mobilized and resuspended (e.g., emission factor) were derived in two contrasting environments such as the cities of Turin and Barcelona. Results showed good inverse relationship between MF10 and: (i) macro-texture, (ii) traffic intensity and (iii) distance from braking zone, although with a lower correlation. These results allowed the building of an empirical model able to predict suspendable road dust and emission factors based on the aforementioned road data.
where MF10i is the road dust suspensible fraction at the ith location, and a and b are empirically determined coefficients. In the case of Barcelona sites, the coefficients (a = 52.9; b = 0.82) were used, obtained in the same city by [
33], while for Turin an average value (a = 45.9; b = 0.81) between Barcelona and Zurich was used due to the climatic conditions of Turin.
The multiple linear regression model developed to predict the maximum MF10 loading from the Correct Aggregate Mode (CAM), according to the formula proposed by [
34]; the traffic intensity (TR) and the distance (DIST) from the closest braking zone is reported below:
According to [
32], this model can significantly improve a bottom-up emission inventory for spatial allocation of emissions and air quality management to select those roads with higher emissions for mitigation measures.
2.2.3. Use of Empirical Emissions Factors, Scaled to Local Data
In 2015, [
12] used resuspension emissions factors calculated from the US EPA AP-42 model (discussed later) and localised these to the Madrid traffic fleet prior to including these emissions in an air quality modelling study. For each vehicle type, a ratio is applied to the emission factor from the average of its weight classes and this adjusted emission factor is further adjusted based on the local fleet composition in Madrid. The raw resuspension emission factor was 0.082 g/veh/km.
Link-based resuspension emissions could be calculated using traffic on each road link. Additionally, national (4 km × 4 km) resuspension emissions were estimated for use in a regional model using a scaling factor to adjust the total PM emissions to account for rainfall and the contribution of resuspension to total PM10 emissions. The resuspension emissions are added to the exhaust emissions prior to running the model.
Emission factors for resuspension were weighted by the hourly traffic flows and vehicle composition. For each vehicle category, the PM10 emissions were estimated using the particle size multiplier, silt load and average vehicle weight. A ratio between the emissions derived for cars and each of the other vehicle categories was calculated, which was then applied to the global resuspension factor to produce vehicle-specific resuspension emissions factors. In this study, the resuspension emission factors for light and heavy-duty vehicles were estimated to be 3.6 and 19.9 times greater, respectively, than the car emissions factors. The resuspension emissions from motorcycles were estimated to be 0.09 times the car resuspension emission factors.
2.2.4. Summary of Review Findings on Modelling RDS
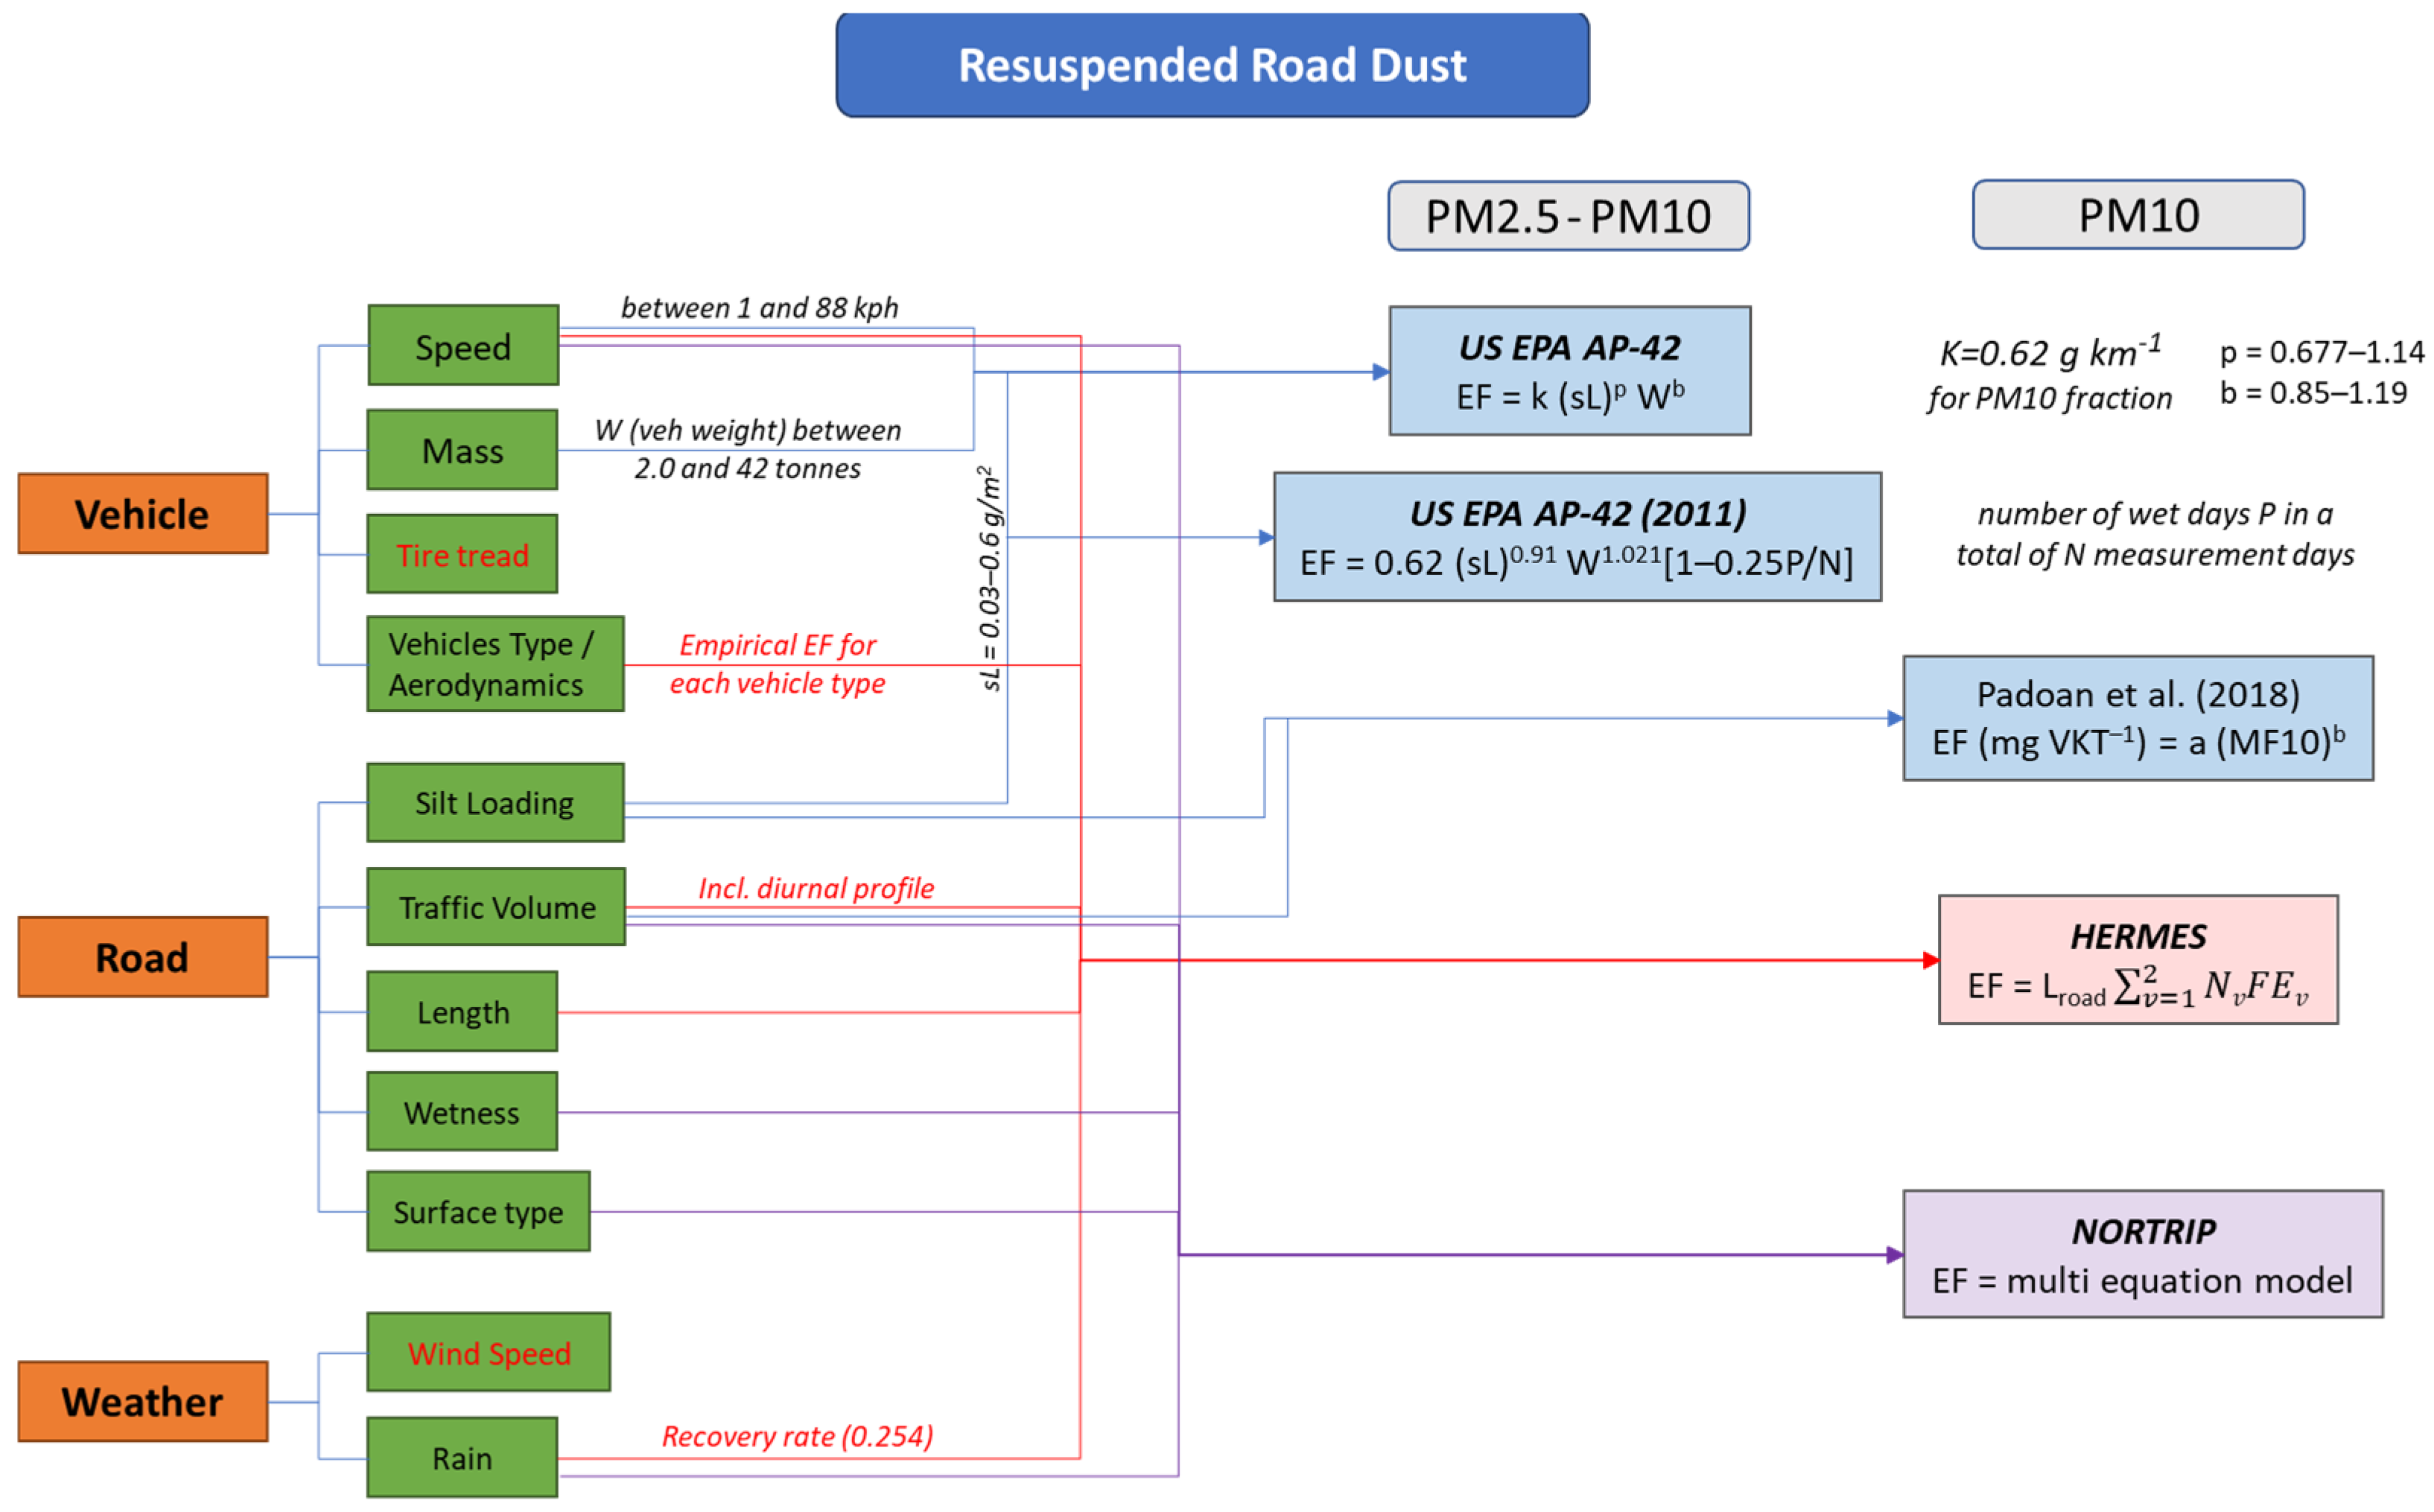
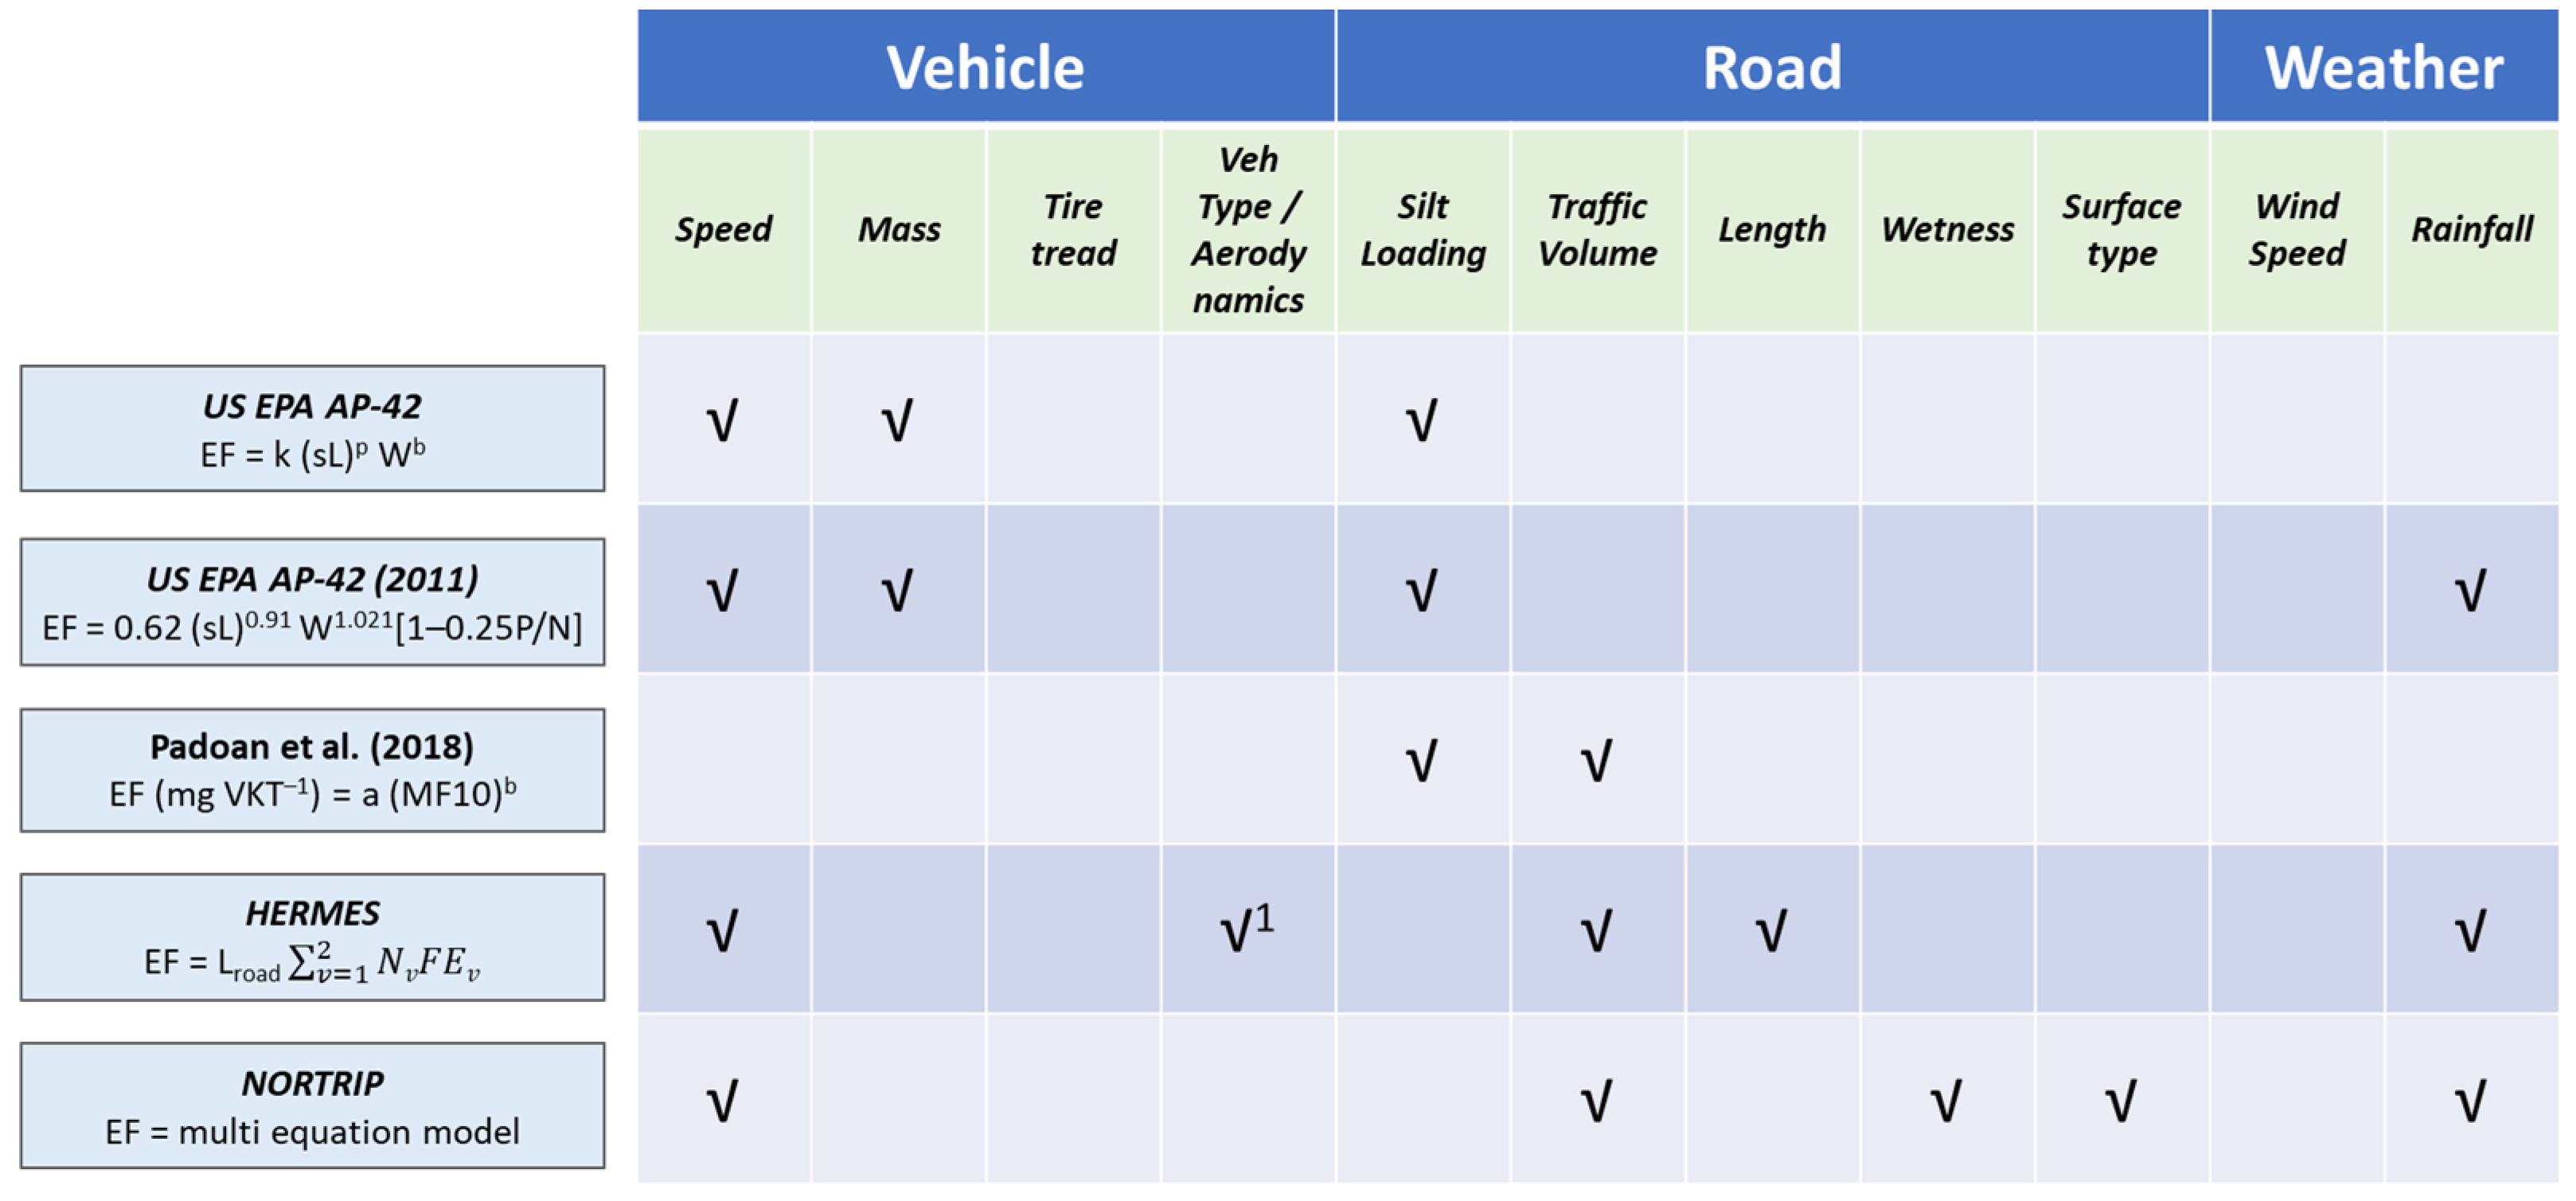
By reviewing the available literature and the existing and most recognised modelling approaches, we can summarise the different methods into a simplified layout (
Figure 1) and a summary grid (
Figure 2).
In
Figure 1 the models have been classified for the PM resuspended components that they are able to model, PM
2.5 and PM
10, respectively. Each model is linked to the different variables upon which the RDS emissions factors are calculated; for some models, indications on ranges of validity have been included in the link to individual variables (e.g., AP-42 is valid for speeds between 1 and 88 km per hour).
Figure 2 represents the main variables that each model uses to calculate RDS emissions factors, classifying them into three main categories: vehicle, road and weather. Additionally, it highlights that a couple of variables have not been used, namely tyre tread and wind speed. The main difference between the US and other approaches, mainly based on findings from studies in the EU, is the use of road silt-loading for the former and empirical emissions factors for the latter.
2.2.5. Preliminary Transferability Check for a UK Tailored Approach
In terms of modelling RDS, there is scope in the short-term to add emissions from dust resuspension, based on existing available methods (non-UK tailored), to the tailpipe and other non-exhaust PM emissions. We have used an in-house model suite RapidAir
® [
35], which can model both link-based emissions (RapidEMS module [
36]) and concentrations, and will enable a subsequent step to fully model the impacts in terms of dispersion modelling and result in a detailed spatial allocation of the RDS to the locations of the road network. However, the method is adopted to combine exhaust and RDS emissions and using these inputs to air quality models would be applicable to other dispersion modelling suites.
Alternatively, the resuspension emissions could be modelled as a separate area source in the dispersion model—in this case further research would need to be conducted to establish an appropriate spatial allocation of resuspension emissions and applicable dispersion model parameters.
The remainder of this paper focuses on examining the potential for an existing and readily available emissions model like RapidEMS to implement an existing RDS modelling approach identified in the above current state of literature. This is to estimate and account for PM emissions from resuspension, rather than modelling these emissions directly at the end of the process in a dispersion model. Moreover, this would then prove whether there was potential for such an approach to be implemented for wider use in UK-EMS.
RapidAir® Suite of Models
RapidAir
® is Ricardo’s in-house model suite [
35] which incorporates various modules for specific tasks, each of which possesses targeted innovations. In addition to RapidAir
® (Roads Dispersion Module), it includes also RapidEMS (Traffic emissions module), Met (Meteorological module) and Canyons (Street canyon model).
RapidAir
® is considered a state-of-the-art air quality diagnostics and decision support tool and builds on 10 years of research and development to address the inability of traditional modelling systems to model air quality across large domains, at high spatial resolutions within acceptable timeframes (
https://www.rapidair.co.uk/, accessed on 25 August 2022). If fact, utilising convolution routines and open-source python libraries rapidly (run times in minutes) estimates air pollution concentrations at high spatial resolution (typically from 1 m to 5 m) over extended geographical areas of interest, typically cities or regions, as recently demonstrated in other independent studies [
36,
37]. This facilitates fast and efficient scenario testing for a comprehensive range of emission sources and pollutants, which was ideal for the exercise we had planned to assess the RDS impacts of different modelling approaches. Further information about RapidAir
® can be found in the Data Availability Statement.
Specifically for this study RapidEMS (Rapid Emissions Modelling System, based on COPERT emissions factors which are widely used across Europe for estimating road transport emissions in national inventories) was used for calculating the PM emissions from road sources in a location in the UK at Atholl Street in Perth (Scotland), where several existing datasets were available, including a Roadside air quality monitoring station that is part of the Scottish Automatic Urban Network (
https://www.scottishairquality.scot/latest/site-info/PET2, accessed on 25 August 2022). The results were enriched to include the Road dust resuspension component.
RapidEMS can currently calculate tail pipe emissions of particulate matter as well as brake, tyre and road wear for road transport sources, but has no calculation/estimation of road dust resuspension. This exercise was designed to assess the feasibility, benefits and barriers in adding the resuspension of road dust within the overall calculation of PM emissions. Moreover, RapidEMS also links to the RapidAir® air pollution dispersion model (also in-house developed), which adds in a future step with the advantage of being able to verify and validate any new method and related assumption against real-world air quality measurements, both historic but more importantly in anticipation of future comprehensive monitoring campaigns of silt-load and other parameters (specifically in the UK).
3. Results
In order to understand the potential to include the above reviewed modelling approaches for RDS in an existing emission model like RapidEMS, we have made a preliminary transferability analysis of existing modelling approaches and models investigated in the first part of this paper, with the objectives to provide useful insights and any recommendations for required further work and investigation to be fully carried out in order to implement a comprehensive modelling approach in an existing modelling suite such as RapidAir®.
When considering the addition within the emissions model RapidEMS of the resuspension of road dust, this represents a very important step forward since it is likely, based on evidence from several studies explored previously as part of this review paper, that RDS will make up an increasing proportion of PM emissions in the coming years as the tail pipe emissions from vehicles are reduced (e.g., through introduction of electric vehicles). For example, from [
23]—“recent studies have reinforced that non-tailpipe emissions from road traffic contribute to airborne concentrations of PM at least equally or even more than exhaust emissions”. The European Commission outlines the three categories of non-exhaust emissions, conferring to road dust resuspension a range of between 28–59% of PM
10 mass, followed by brake wear (16–55% in urban roads, 3% on freeways) and tyre wear (5–30%).
Based on a review of the most recognised existing modelling options for RDS, we report the results of the calculation of RDS for the selected UK case study in Perth (Scotland).
3.1. Calculation of Resuspension Emissions in Perth Atholl Street Using the HERMES Model
The equations from the HERMES model have been coded in Python in a Jupyter notebook, with the updated equations including speed discussed in the previous sections.
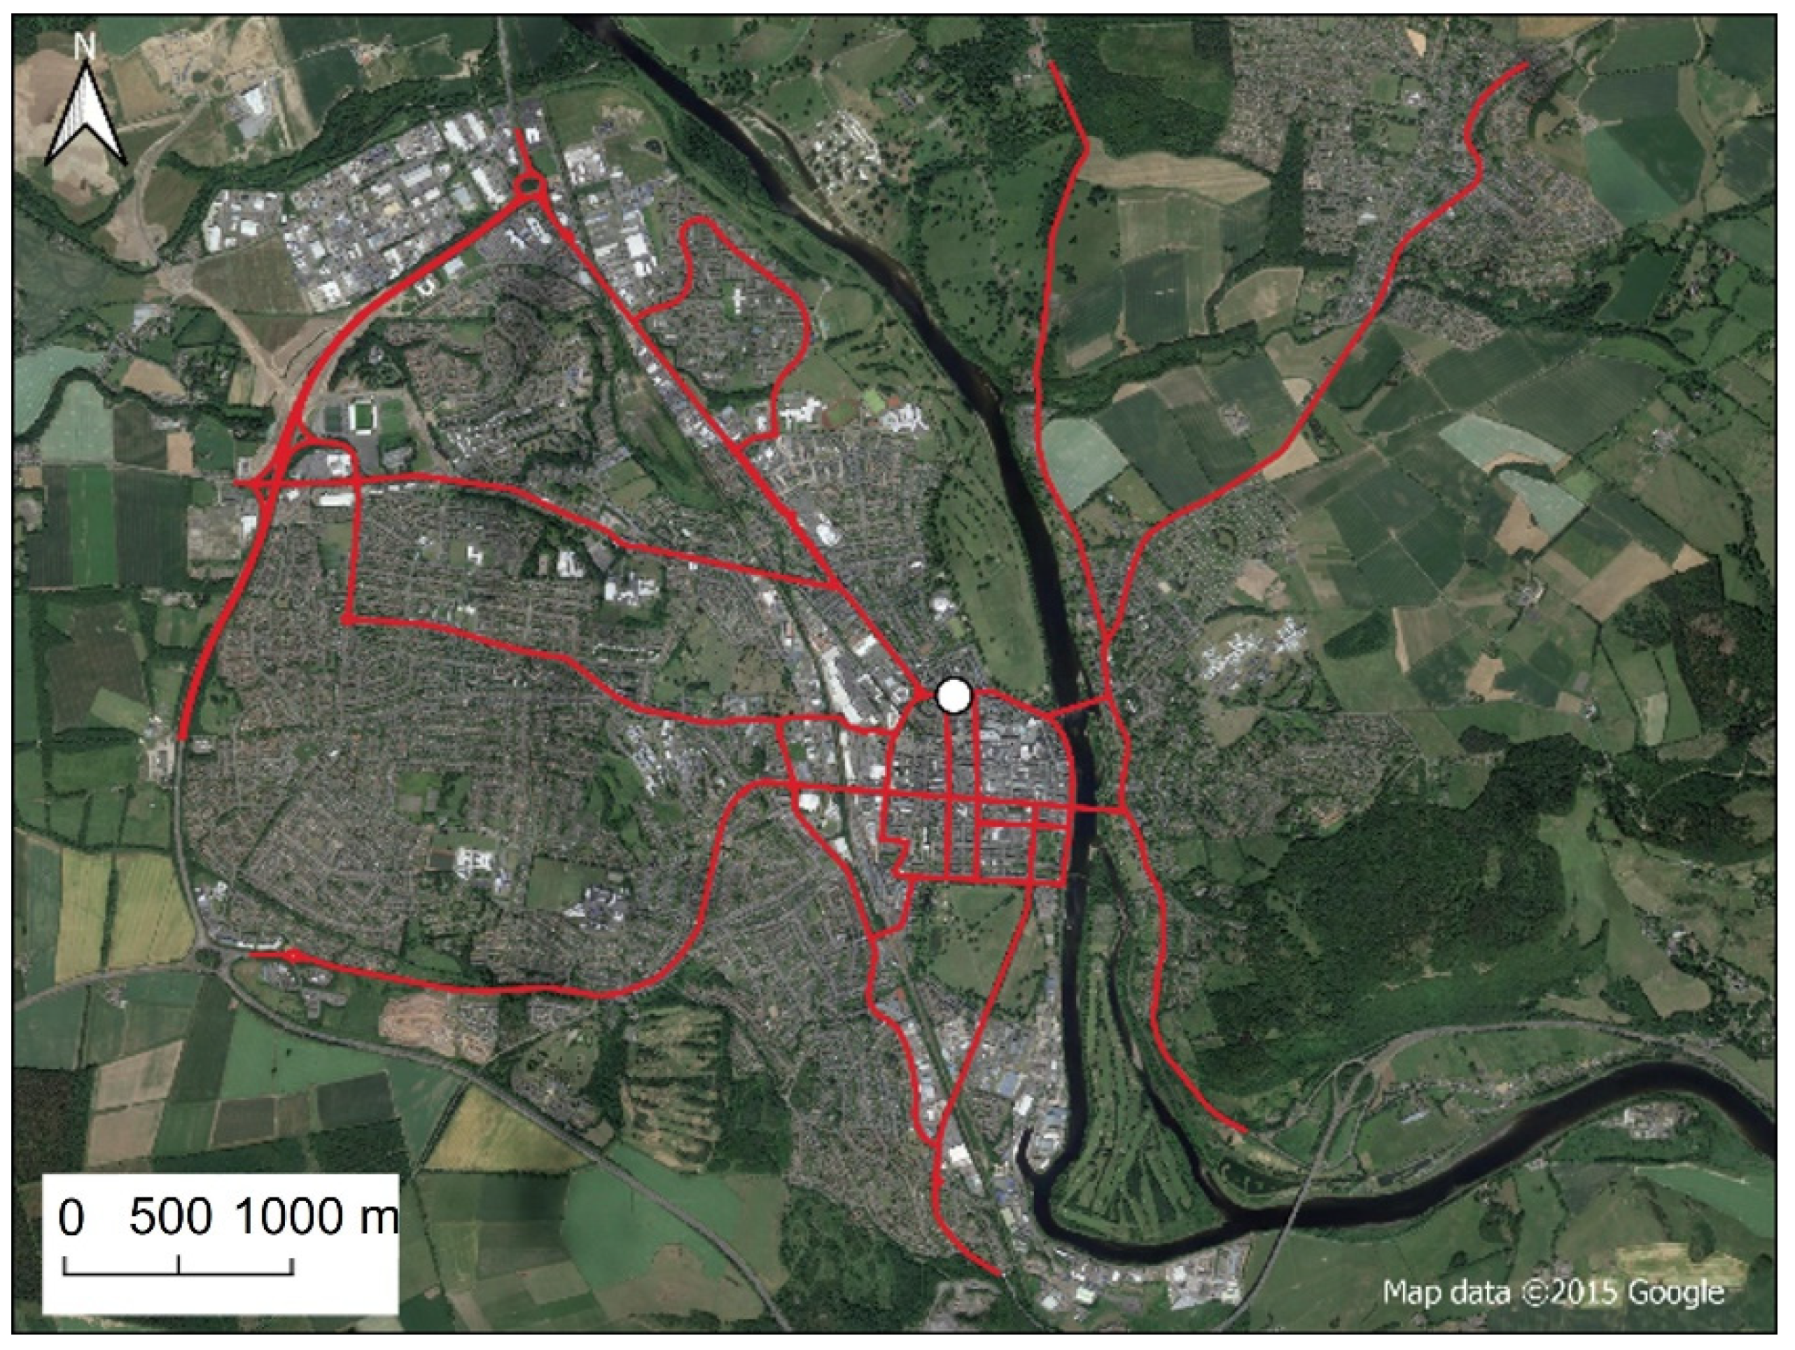
Perth Atholl Street has been used as a case study to test the HERMES model by determining the emissions HERMES estimates for resuspension emissions on this road link (traffic data provided for Perth, by Perth & Kinross Council in Perth, Scotland).
The emission factor values used are those presented in
Table 1 and were calculated according to average PM
10 resuspension emission factor from Barcelona, taken from [
38]. This is broadly in line with the emission values published by [
24] for PM
10 in London (20.2–22.8 mg/vkm). The impact of applying emission factors for different vehicle types has also been tested—the emission factors for different vehicle types are the average from the five tests reported in the paper above for each vehicle type.
Hourly rainfall data have been downloaded from the Midas section of the CEDA website (
https://catalogue.ceda.ac.uk/uuid/dbd451271eb04662beade68da43546e1, accessed on 25 August 2022) for a nearby measurement location (Glasgow Bishopton). These data have been used to calculate the resuspension factors for the analysis. Further work should investigate if annual average rainfall could be used instead of hourly data. The recovery rate constant (used to calculate S(Hrain) in the HERMES model formulation) used in the analysis is the value presented for Utrecht in the Netherlands (0.0252) in [
25]. Further work could investigate if this value is appropriate for use in the UK.
The resuspension emissions calculated from the average fleet emission factor resulted in a 12.4% increase in PM10 emissions on Atholl Street. When vehicle-specific resuspension emissions factors were used, this resulted in a 12.3% increase in PM10 emissions on Atholl Street.
3.2. Calculation of Resuspension Emissions in Perth Atholl Street Using the AP-42 Model
The silt loading values required for the calculation have been taken from the literature—the review paper by [
23] provides a table of silt loading values. The silt loading value for the nearest road links to the UK was 0.006–0.066, which was related and derived for Italy. The lower end of the range is broadly in line with values presented in other locations and has therefore been selected.
The resuspension emissions calculated from the AP-42 method on Atholl Street are 20.9 mg/vkm. This is slightly lower than the vehicle average resuspension emissions used in the HERMES model, and the values calculated from measurement station data following the method published by [
24] at Atholl Street (discussed below).
3.3. Calculation of Resuspension Emission Factors in Perth Atholl Street Using NORTRIP Model
As discussed in
Section 2, the NORTRIP model is the most demanding in terms of input data required for the calculation of RDS. For example, pavement coating and wetness of the surface. These data are not readily available for the Perth study area and estimating the values would lead to significant uncertainty in the model results. Therefore, no calculation of resuspension emissions using NORTRIP has been undertaken in this analysis.
3.4. Calculation of Resuspension Emission Factors in Perth Atholl Street Using Padoan Model
The PM
10 resuspension emissions on Perth Atholl Street have been calculated using the equations published by Padoan [
32]. Initially we have calculated the resuspension emissions using the empirical model—this approach requires an estimate of the road dust suspensible fraction in the model domain (
MF10), and also coefficients
a and
b. The MF10 values in the literature have been calculated from measurement campaigns, and similar campaigns are not available for our study area. We have therefore utilised published values for MF10 for Paris [
20], with the average of the asphalt streets being used (MF10 = 1.452 mg/m
2). Values for coefficients a and b have been published for Barcelona and Zurich [
39], and we have selected to use the coefficients published for Zurich due to the greater similarities in climate with Perth than Barcelona (a = 41.281, b = 0.7722). The resuspension emission calculated using the above assumptions is 23.59 mg/vkm. This is similar in magnitude to the vehicle average resuspension emissions calculated using the AP-42 and HERMES methods.
Padoan et al. also published a predicting model that utilises traffic flows and distances to junctions to provide more local estimates of resuspension emission factors. The published regression equation was applied using the average daily traffic flow on Atholl Street (
Table 2), the distance to the nearest junction (25 m) and the Corrected Aggregate Model (CAM). CAM values were taken from measurements made on the road surface related to the aggregate surface. Such measurements are unavailable in our study area, and we have therefore assumed a CAM value of 0.8; the median of published CAM data in China and James [
34] was selected to test the predicting model. The predictive model estimates a MF10 value of 1.397 mg/m
2 in Atholl Street, which gives a resuspension emission of 22.9 mg/vkm when passing this into the empirical equation. This resuspension emission is also similar to those from AP-42, HERMES and the direct empirical Padoan equation.
3.5. Calculation of Resuspension Emission Factors in Perth Atholl Street from Measurements
In order to test if the resuspension emissions in Perth are different from those measured in Barcelona, the method outlined by [
24] to calculate resuspension emissions from measurement sites has been followed. The roadside site used in this analysis is Perth Atholl Street, while the background station was Dundee Mains Loan (
https://www.scottishairquality.scot/latest/site-info/DUN1, accessed on 25 August 2022)—this was the closest background monitoring station measuring the required pollutants. Daily average concentrations in 2018 were downloaded for each station from the Scottish Air Quality Database website (
https://www.scottishairquality.scot/, accessed on 30 August 2022).
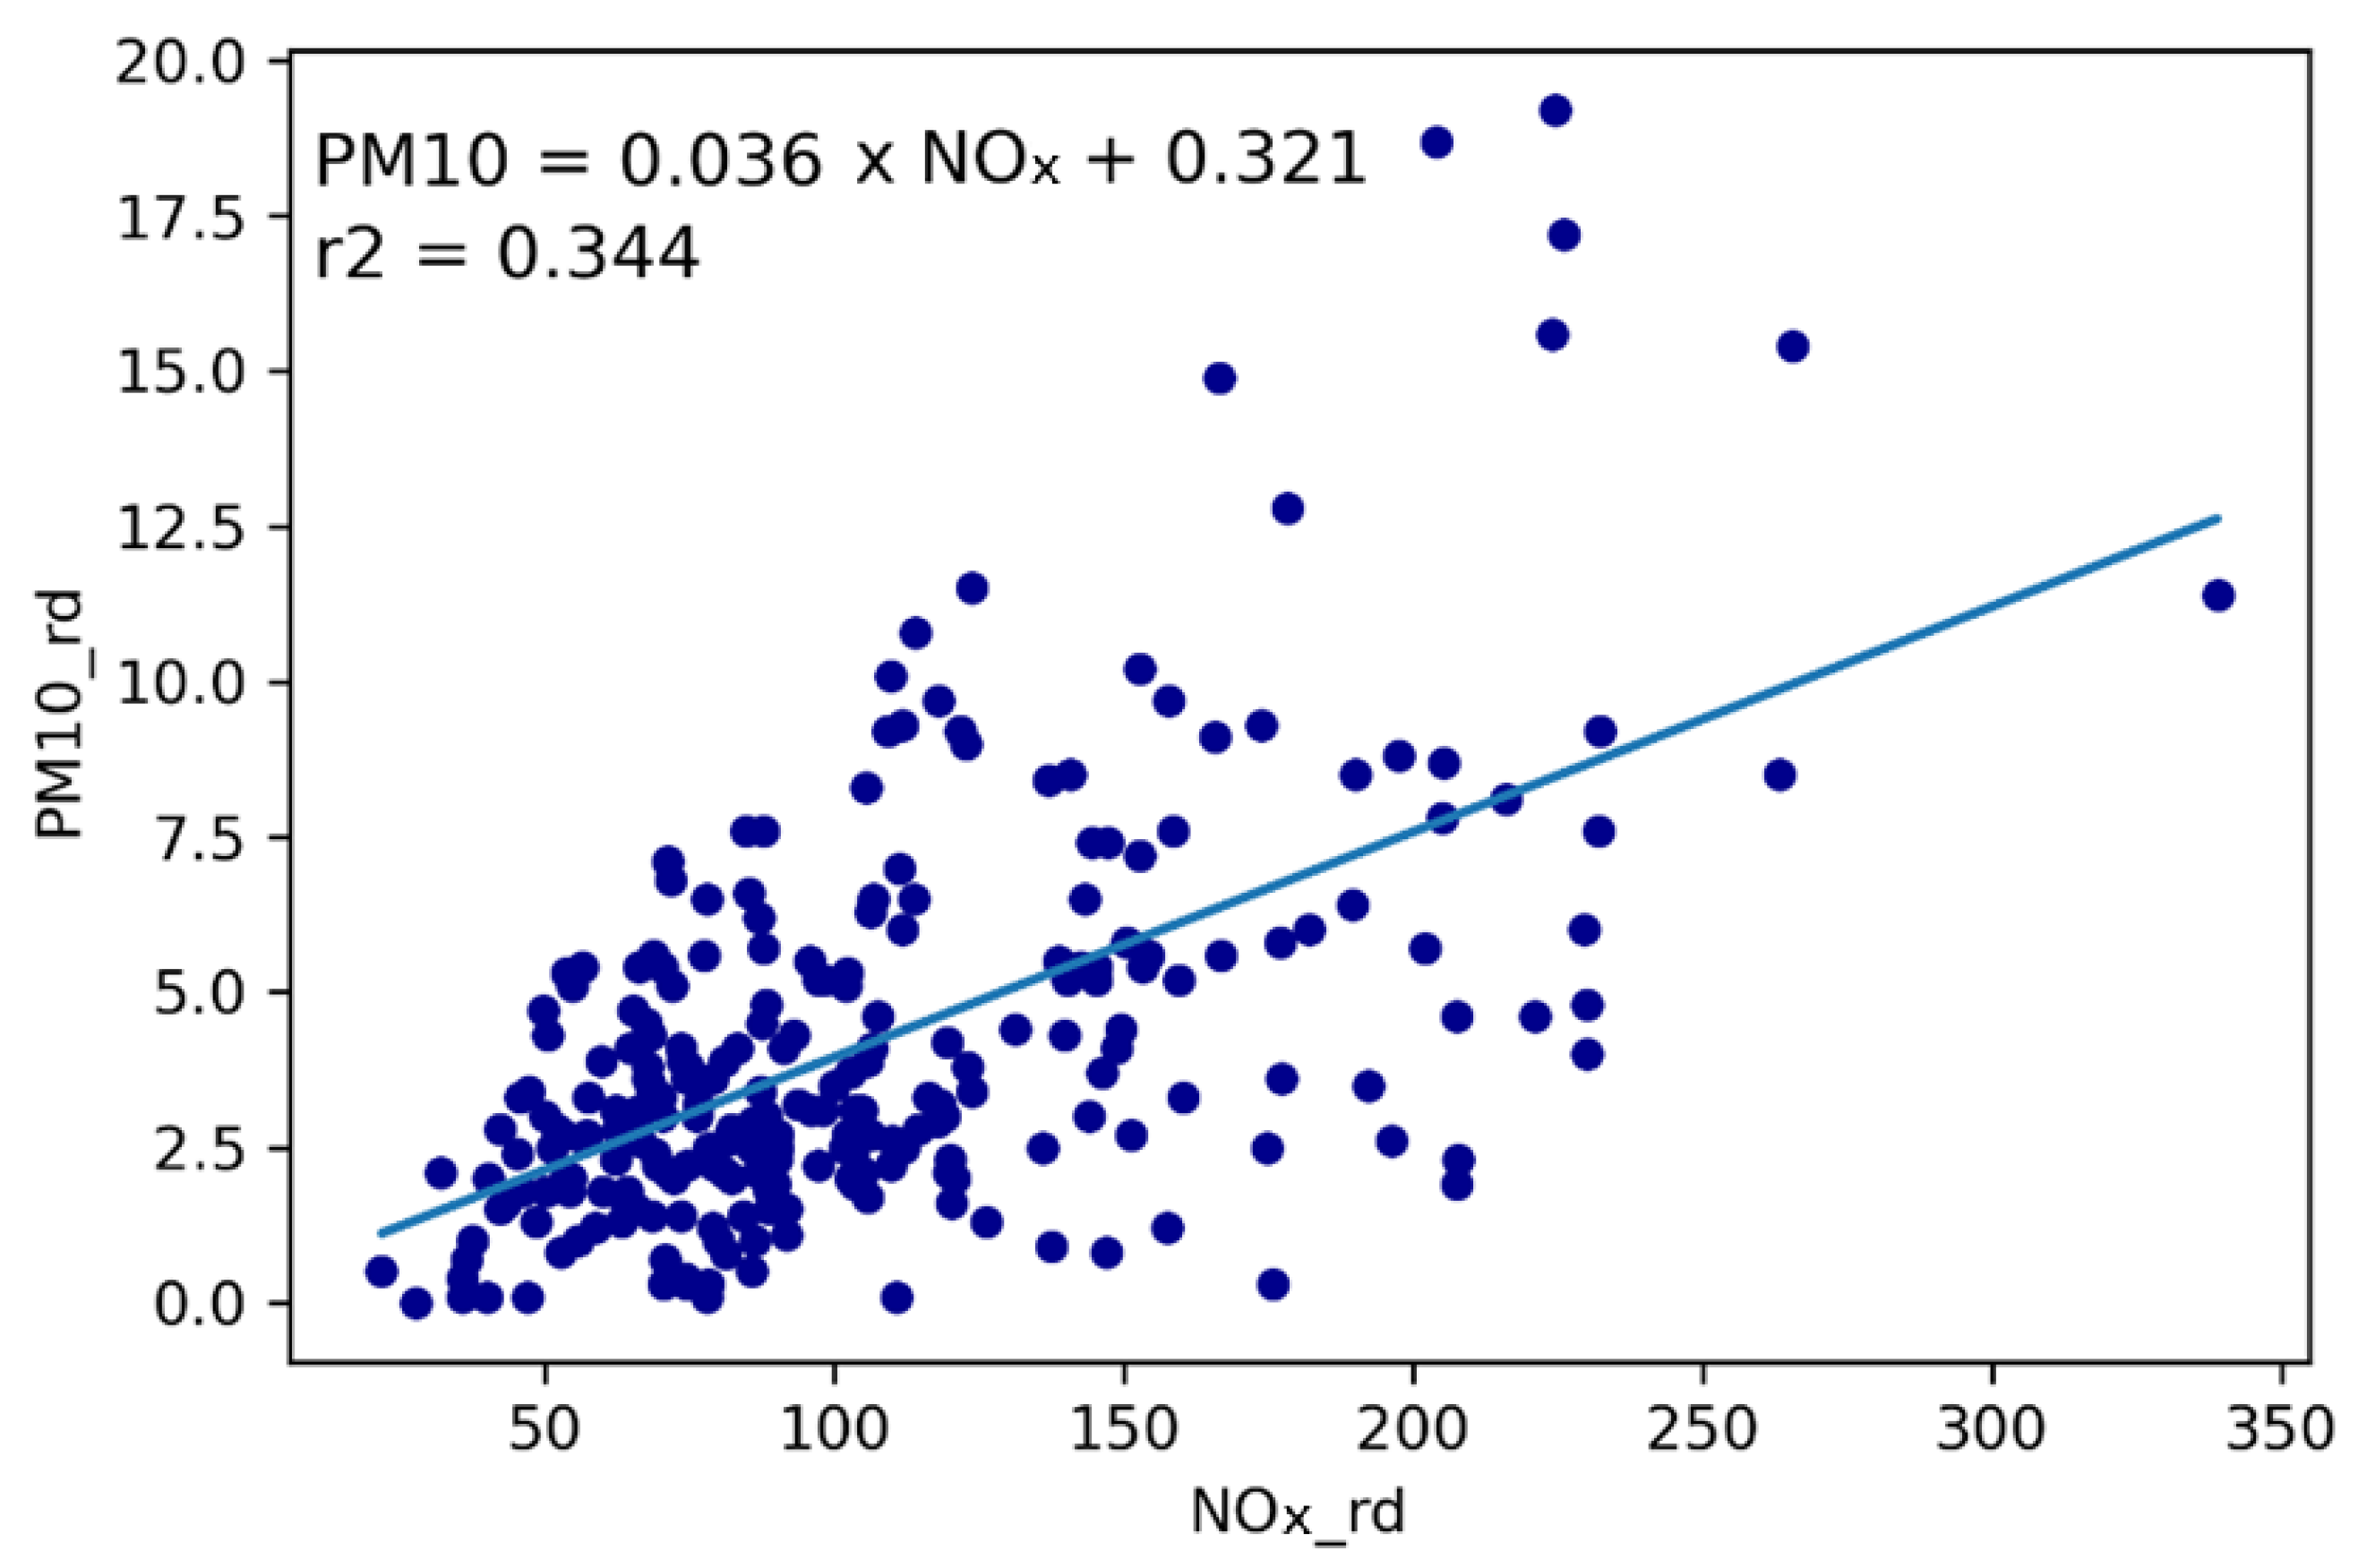
Figure 3 below shows the plot between PM
10 roadside concentrations and NO
x roadside concentrations measured at Atholl Street—the resulting relationship PM
10 = 0.036 × NO
x + 0.321, has a lower coefficient of determination R
2 (0.344) than that reported by [
24] in the relationships observed at Marylebone Road were R
2 was 0.88.
The mean ratio of coarse total PM
10 was calculated from the measurement data. This showed that a greater proportion of PM
10 was from coarse particles than the analysis by [
24] (0.7 vs. 0.4). This could, for example, be a result of the distance between the roadside and background site resulting in different local sources. The coarse ratio from [
24] (0.4) has therefore been adopted—further work will analyse this relationship at other stations in the UK to establish if this is an anomaly related to Perth.
The PM
10 emissions from resuspension predicted from the measurements at Perth Atholl Street were 0.121 g/km/s, which is equivalent to 21.9 mg/vkm. This is similar to the values published in the literature from [
24], the HERMES model and AP-42.
The vehicle fleet breakdown on Atholl Street has been used to estimate emissions factors for each vehicle type. In order to calculate this, the following assumptions have been made about the average weight of each vehicle as stated previously. This results in the following resuspension emissions—the HGV emissions predicted are lower than those published by [
24]. This analysis is limited to a single location, and further work should repeat this at other sites in the UK to establish an average resuspension emission value.
3.6. Derivation of Resuspension Emission Factors from Measurements at AURN Sites
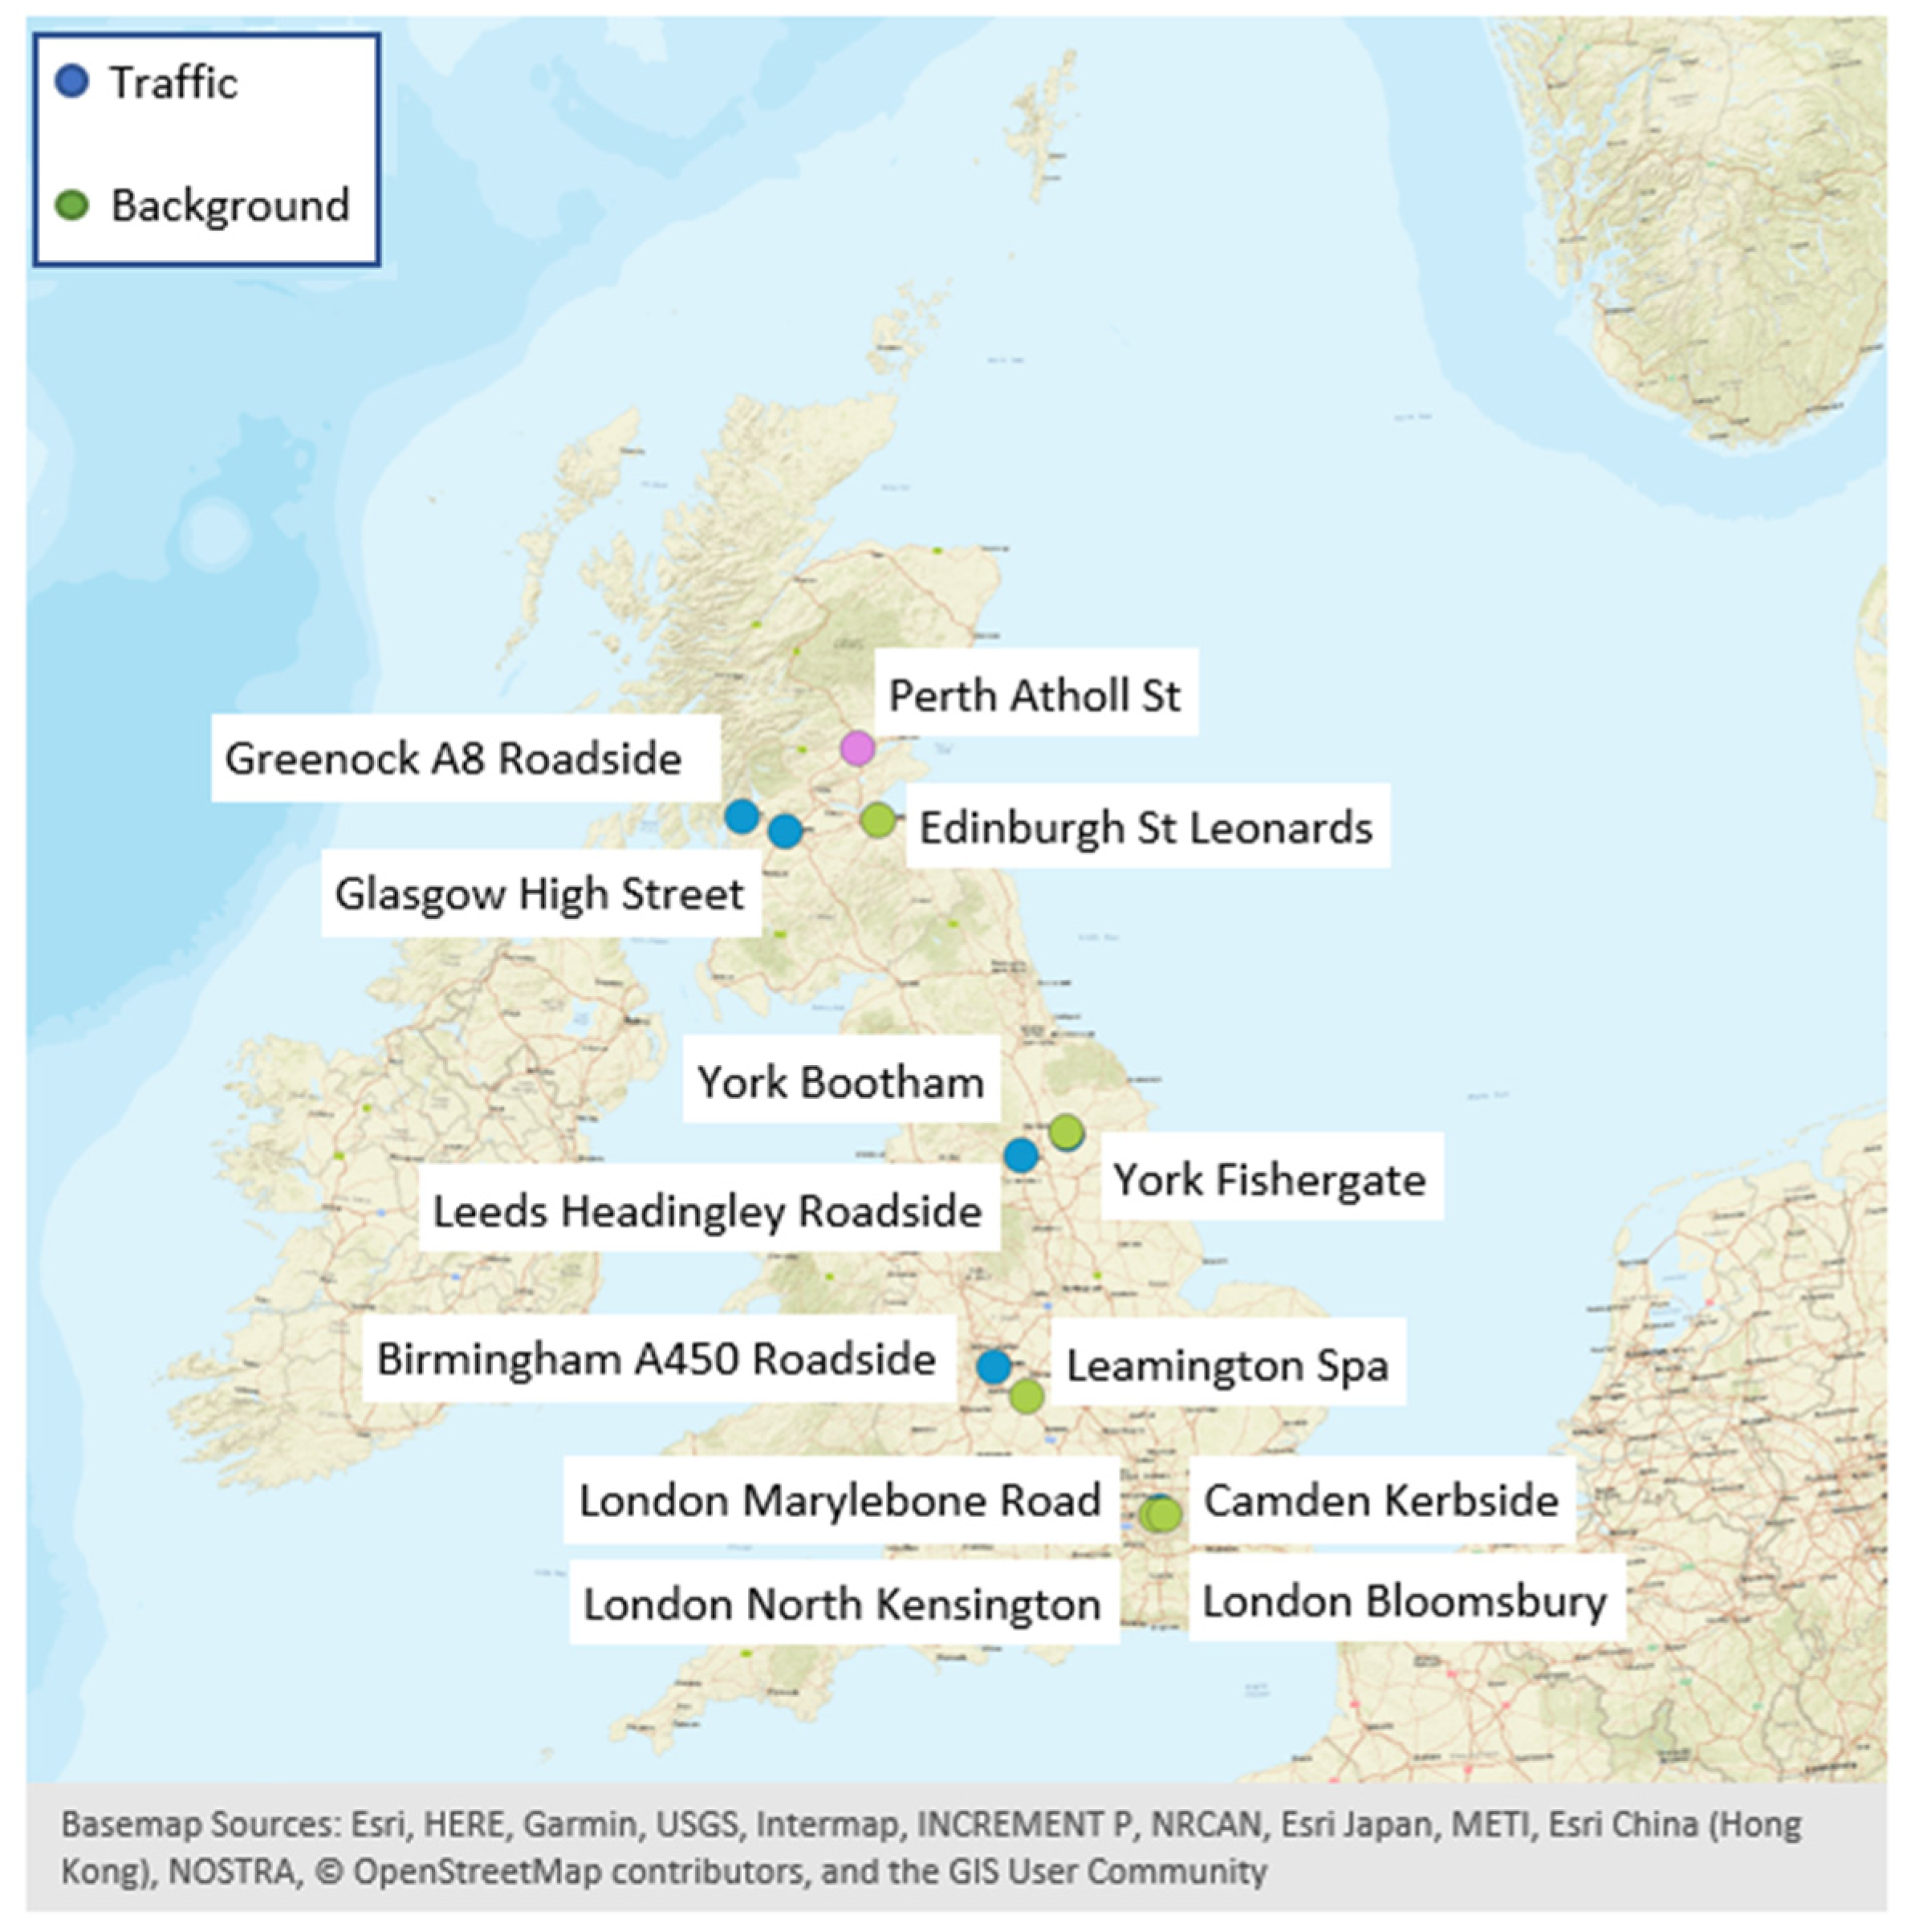
The method based on measurements at Perth Atholl Street above has been repeated for AURN stations measuring PM10, PM2.5 and NO2 in 2018, to get more resuspension emissions estimates for the UK to establish if the results at Perth Atholl Street hold true across wider geographical regions. Some AURN stations have been excluded from the analysis for the following reasons:
- -
Those sites located on hills have been excluded to remove any confounding effects as a result of gradient impacts on exhaust emissions;
- -
Any locations where, after removing concentrations equal to 0, the coarse fraction of PM was <0 and the PM10:NOx > 0.1, had less than 10% data capture (e.g., <36 sites (365 × 10%)).
Figure 4 shows the location of the monitoring stations used in this analysis, along with the location of Perth Atholl Street for the analysis in the previous sections for reference.
Traffic data (AADT and vehicle breakdown) have been sourced from the nearest DfT count point location. The speed of the roads has been assumed to be 40 kph (=25 mph), with the exception of one of the London sites (Camden Kerbside) where the site location is adjacent to a junction and the speeds are likely to be slower and therefore emissions for this location have been calculated assuming a 15 kph speed. No gradient effects have been applied to the calculations. Emissions calculations have been conducted using the Defra Emission Factor Toolkit (EFT v.11, [
40], and are also based on COPERT emissions factors) using either London Inner, or England (not London) traffic splits as appropriate (note the traffic splits assumed have minimal impact on emissions and the ratios between NO
x and PM
10 used in the calculations).
The following sites meet the criteria for inclusion in this analysis—the sites in square brackets denote the background locations selected for the analysis:
- -
Birmingham A450 Roadside [Leamington Spa]
- -
Camden Kerbsite [London North Kensington]
- -
Glasgow High Street [Edinburgh St Leonards]
- -
Greenock A8 Roadside [Edinburgh St Leonards]
- -
Leeds Headingley Kerbside [York Bootham]
- -
London Marylebone Road [London Bloomsbury]
- -
York Fishergate [York Bootham]
The hourly measurement data for the sites have been downloaded using the importAURN function in openair [
41]. The daily average concentrations have been calculated using openair timeAverage function, with only days with 75% hourly data capture used to calculate daily averages.
3.6.1. Mean Coarse Fraction at Each Site
The mean coarse fraction has been calculated at each site to determine if this value falls close to the value of 0.4 used by [
24]. The
Table 3 below shows the calculated mean coarse values from the measurement data—it also provides the regression equation describing the relationship between PM
10 and NO
x identified at each site.
The mean coarse fraction calculated at the measurement sites are (with the exception of Marylebone Road) much larger than the value of 0.4 referenced by [
24]. The larger mean coarse fraction will result in a greater proportion of the PM
10 concentrations being allocated as coarse emissions and potentially leading to greater resuspension emission rates.
3.6.2. Resuspension Emissions Using Calculated Mean Coarse Fraction at Each Site
The resuspension emission per vehicle (mg/vkm) are provided in the
Table 4 below for the average vehicle. These have been calculated assuming the coarse value fraction calculated from the measurement data.
The resuspension emissions from Marylebone Road and Birmingham A450 are broadly consistent with the values from the HERMES and AP-42 models, also those values from the literature and those calculated above in Perth Atholl Street. The other sites have much greater resuspension emissions calculated in mg/vkm. This could be attributed to differences in vehicle composition on the road links, for example.
The vehicle-specific emissions factors (mg/vkm) for each site are provided in the
Table 5 below (as calculated using the AADTs for the different vehicle types). These show large variations between the sites, again with Birmingham and London Marylebone Road emission factors being of similar magnitudes of emissions as presented in the literature.
3.6.3. Resuspension Emissions Calculated Using Mean Coarse Fraction Value of 0.4
Given the large variations in the mean coarse fraction calculated and the uncertainty associated with the measurement data, the calculation of resuspension emission factors has been run for all sites assuming a mean coarse fraction value of 0.4 (from [
24]) as presented in the literature.
Table 6 below provides the resuspension emissions (mg/vkm) for average vehicles and individual vehicle types for each site.
3.6.4. Impact of Including RDS Emissions on Modelled Roadside Concentrations
We have shown above that including RDS emissions results in increased emissions from road transport, e.g., 12% increase in emissions due to resuspension when average vehicle RDS emissions are used. It is important to consider the overall impact of including RDS emissions on urban pollution concentrations. We have used the RapidAir® model to test the impact of including RDS emissions calculated using the HERMES model on predicted roadside concentrations at Perth Atholl Street.
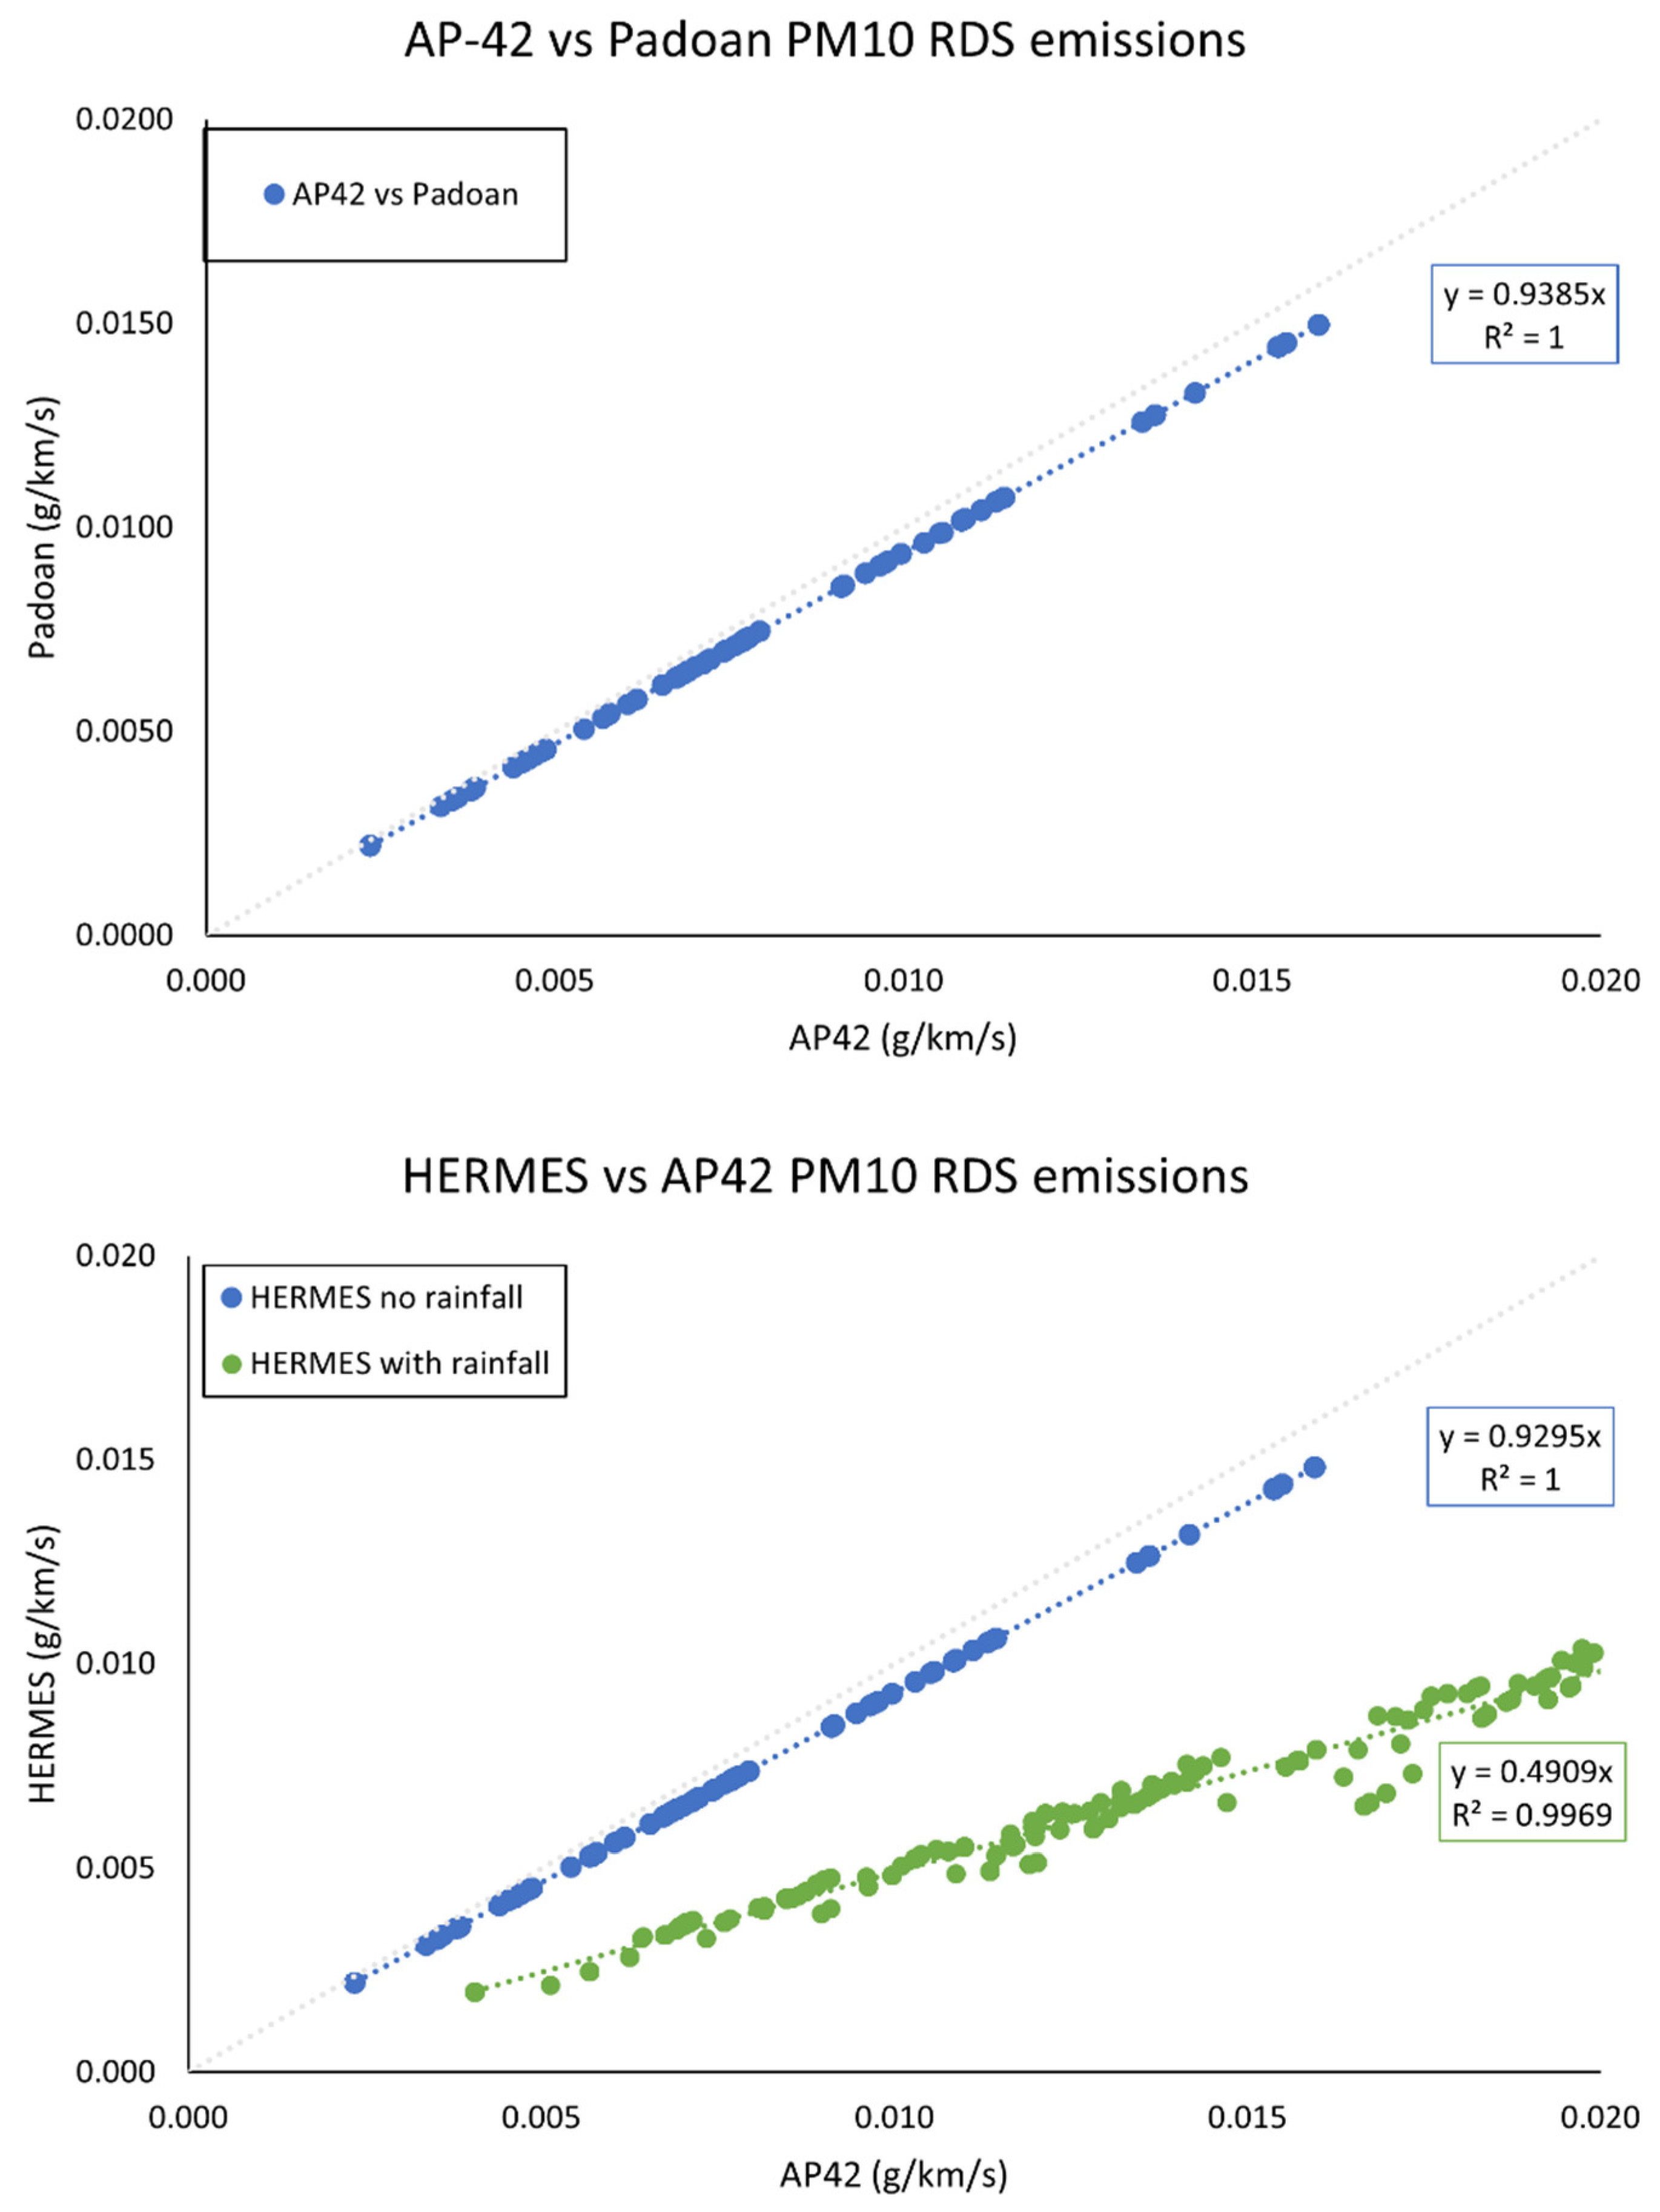
Link-based emissions for the major road links in Perth (
Figure 5) were calculated using RapidEMS for PM
10, with and without RDS emissions calculated, using the factors derived from both the AP-42 (24.4 mg/vkm), the HERMES model (22.7 mg/vkm) and Padoan model (22.9 g/vkm). For reasons discussed previously, the NORTRIP model has not been evaluated in this work. A comparison of the emissions on all modelled road links in Perth shows a linear relationship between the AP-42 and HERMES emissions (the latter was calculated without and with the influence of rainfall to allow direct comparison between the methods) (
Figure 6). The emission rate was calculated with and without the impact of rainfall in the HERMES model in Atholl Street (0.0144 g/km/s and 0.0018 g/km/s, respectively). The ratio between the emission rates on Atholl Street, with and without rainfall, was used to scale the resuspension emissions on the other road links across the full study domain to provide an estimate of the impact of excluding rainfall on the resuspension emissions; this allowed a direct comparison with the AP-42 emissions. The calculated HERMES emissions with and without rainfall therefore have similar correlation with the AP-42 emissions, but the regression coefficients differ due to the change in magnitude of the resuspension emissions as a result of the rainfall. The influence of rainfall resulted in a reduction in the RDS emissions predicted by HERMES of 87.5%. Perth has significant rainfall, with an average of 0.14 mm of rain/hour in 2018, which leads to a reduction in the predicted resuspension emissions due to run-off of particles, for example. There is a linear relationship between the emissions predicted by the models as the RDS emissions included are derived by applying the resuspension emissions (mg/vkm) predicted by each model to the same traffic dataset. We selected to use the HERMES emissions in the dispersion modelling, and after accounting for rainfall as previously mentioned this is a key contributor to resuspension, as the method is more complex and, as discussed previously, the inclusion of rainfall impacts in the calculation of RDS has been suggested elsewhere in the literature [
12,
25,
33] to produce more accurate RDS emissions.
Average concentrations of PM
10 from traffic sources only in 2018 were predicted for a 1 m grid across the city using emissions inputs with and without RDS. No street canyons were included in the dispersion modelling to simplify the analysis and findings.
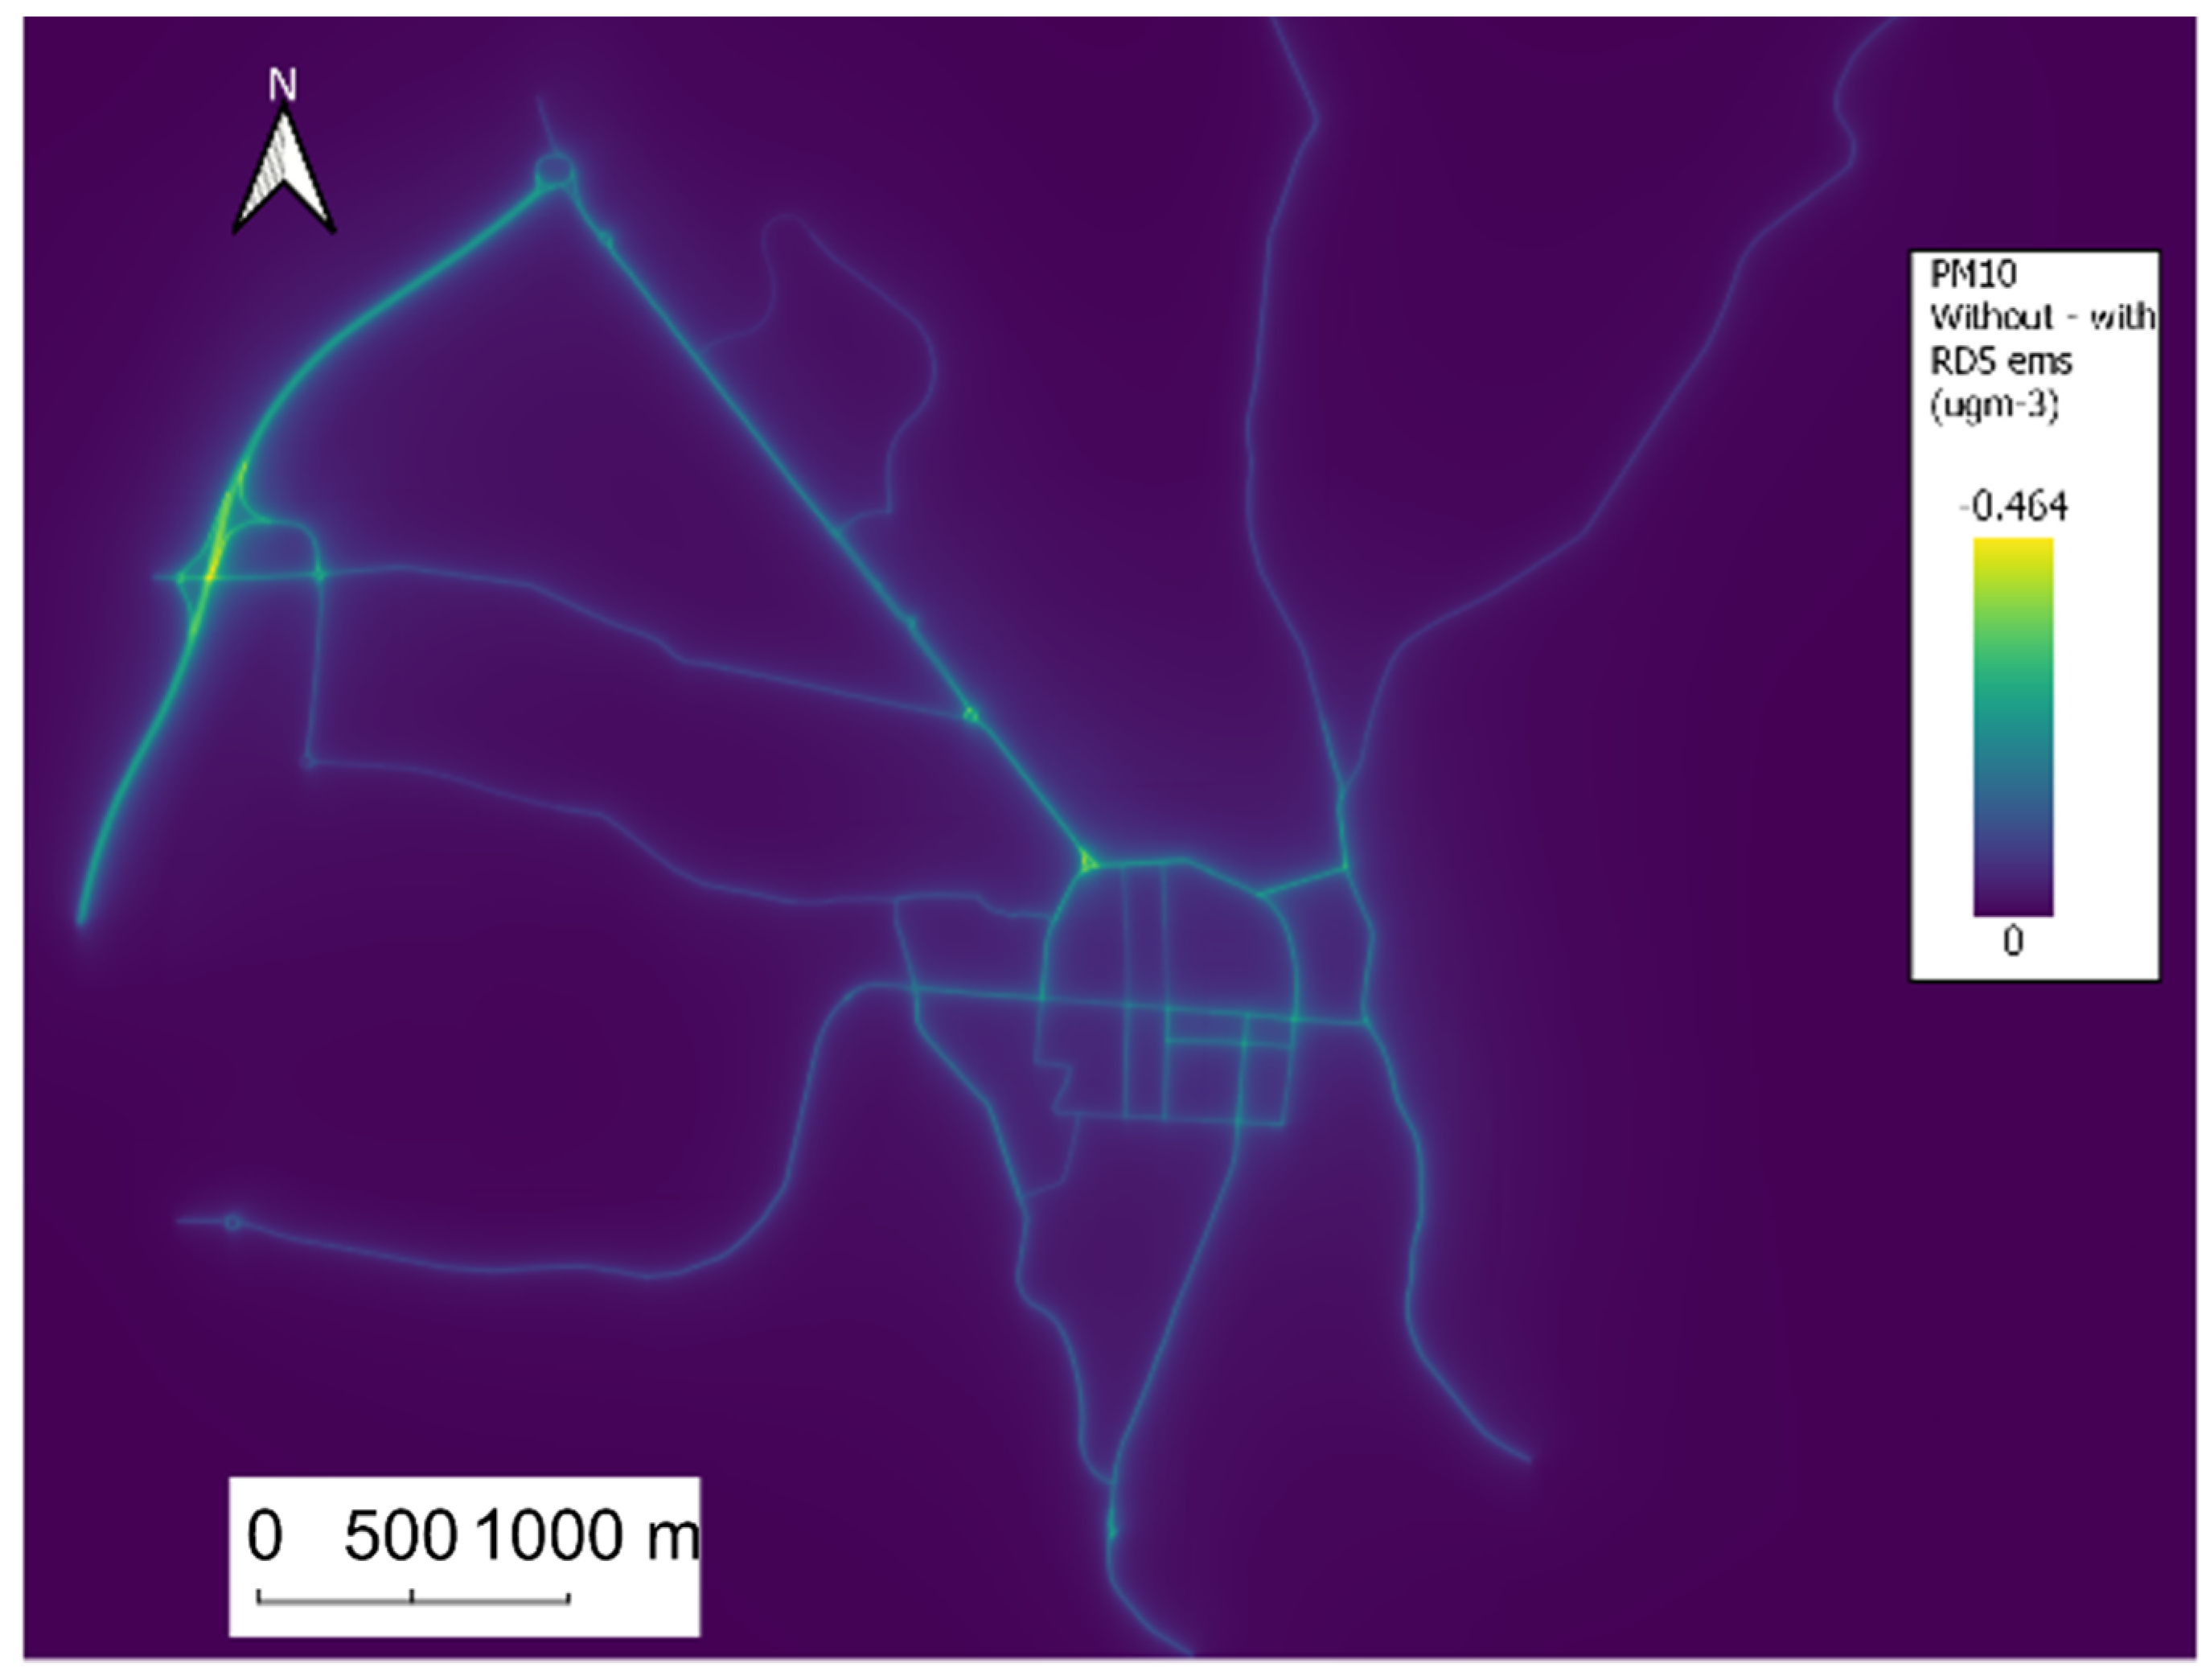
Figure 7 below illustrates the change in modelled PM
10 traffic concentrations when RDS emissions are included (the figure shows modelled PM
10 concentrations without RDS emissions—modelled PM
10 with RDS emissions included. Negative concentrations show that the concentrations calculated when RDS emissions were included are larger than those when RDS emissions were omitted)—the greatest difference in concentration is observed close to the road emission sources. The average increase in emissions across the full domain as a result of including RDS is 0.02 ug/m
3, with a maximum change of 0.47 ug/m
3. Extracting traffic concentrations at the Perth Atholl Street monitoring site, the concentrations are 15% higher when RDS emissions are included (without RDS: 1.05 ug/m
3, with RDS: 1.21 ug/m
3). This is a similar magnitude to the difference in emissions with and without accounting for RDS illustrated previously.
4. Discussion
From the review of the different methods for the quantification of the road dust resuspension, it is clear that over the past decades there have been several attempts to determine this component of the non-exhaust emissions on roads, and that the US AP-42 method has been probably the one most used/applied. However, the US AP-42 method is heavily dependent on the silt loading parameter and does not account for other factors like other more recent models such as HERMES and NORTRIP do. Moreover, unless the conditions of the roads are similar to those from which the AP-42 formula has been derived, the application of the AP-42 method may not provide correct values.
On the other hand, the recently developed models also present limitations. The HERMES model is very much dependent on the empirical emissions factors determined for different types of vehicles, making this approach dependent on the specific measurement and location where they were made, hence it is not clear how easily transferable or accurate it may be when applied to other countries or different regions (with different weather conditions, for example). NORTRIP seems to be recognised as one of the most complete models for RDS calculations; however, it is also very complex and not many applications have been found to enable full assessment of its superiority. The other methods identified, based mainly on field measurements carried out on street for ambient PM levels, have provided very useful information on the potential impact of RDS and its contribution (either as % or as concentration component) to the total PM; however, they do not provide a clear definition of a transferable model since they are heavily dependent on the air pollution levels monitored on the specific location/s and case studies.
In
Table 7 are summarized the main characteristics, advantages and differences in the models identified.
4.1. Limitations
Other areas not particularly well covered by the existing modelling approaches are related to:
The temporal effects of RDS on PM levels, especially when considering short-term impacts on PM concentration (hourly or daily) rather than long-term exposure (annual average);
Influence of type of tyre material and design;
Influence of new road surface types, and particularly of alternative sustainable pavements (such as those based on recycled rubber from used tyres), on reducing RDS and related PM emissions. We are not aware of any studies on the impact on RDS, but we could expect that the different and softer material used could actually function as a trap for road wear and dust, thanks to the high pressure developed by each single vehicle passage;
Influence of different existing pavements, such as porous pavements. Although mainly used to reduce tyre–pavement noise and to increase water drainage from the surface, a few early studies [
16,
17] have reported such pavements to have an additional benefit, with the potential to decrease resuspension of road dust through reducing the amount of dust on the road surface in a cheaper and more effective way without affecting direct wear emissions.
4.2. Recommandations
Despite the limitations identified above, we recommend that an approach should be used in air quality models now to avoid the underestimation of PM emissions from this important source. Which approach should be used depends on the information available for the situation/area to be modelled, e.g., the availability of silt loading or rainfall data. If a direct estimation of emissions from this source is required, rather than an estimate of concentrations due to resuspension from analysis of ambient air quality data, we recommend using either the HERMES or USEPA AP-42 method. It is acknowledged that certain assumptions will need to be made such as silt loading, but these methods have been demonstrated to produce similar emission factors for resuspension in the Perth Atholl Street Case Study, performed in this paper.
Moreover, this review and the application of the methods in the specific case study in the UK have been very important to better understand and assess the models in terms of their practical application and transferability to other sites. This is particularly relevant considering the nature of the RDS emissions, which among the many models explored show a recurrent and common message, “RDS emissions are very dependent on local conditions and their spatial and temporal components”. Although the spatial variability has been assessed to a certain extent in the past and still needs further investigation, the temporal variability is still underrepresented in models and lacking comprehensive research studies.
4.3. Findings of the Application of RDS Methods in the UK Case Study
In all the methods analysed and applied in this study, resuspension emissions have been shown to increase total PM10 emissions; for example, when average fleet emission factors for RDS were used the total emissions increased by 12% compared with when RDS was omitted from emission calculations altogether. The HERMES, AP-42 and Padoan et al. methods produce RDS concentrations that are highly correlated with each other, however, AP-42 predicts larger resuspension emissions that could be due to factors such as accounting for vehicle speed and rainfall for example.
Using measurement-based methods to estimate resuspension emissions appears to be highly influenced by the choice of measurement station and mean coarse fraction. For the AURN stations included in this analysis, the resuspension emissions ranged from 21.6 mg/vkm to 321 mg/vkm depending on the site and coarse fraction used. The analysis at AURN stations has been conducted for a single year, and further analysis is required over a longer time period to provide further evidence for the RDS emissions calculated. The greatest RDS emissions (mg/vkm) were from heavy goods vehicles, irrespective of the measurement station or coarse fraction used in the analysis. We have tested the impact of including resuspension emissions from the HERMES model on roadside concentrations modelled using RapidAir® in the city of Perth. The greatest increases in modelled road PM10 concentrations were observed on or near the road surface, which is unsurprising given that this is the emission source. Concentrations modelled from road transport at the Perth Atholl Street monitoring station increased by 15% as a result of including RDS, which is broadly in line with the changes in emissions calculated earlier in this paper.
5. Conclusions
In summary, each individual model and method identified so far has probably addressed the RDS emissions focusing on different important aspects and variables explaining the phenomena; however, it seems that the complexity of the RDS phenomenon is high and further investigation, analysis and modelling are needed as well as validation and verification.
It is also recognised that by not embedding the RDS emission component into inventories intended for use in air quality models, this can result in many cases in the underestimation of concentrations of PM
10 and PM
2.5. This is especially significant as we head towards more stringent ambient PM concentration limits, driven by the new 2021 World Health Organization (WHO) global air quality guidelines [
42]. With overall non-exhaust emissions expected to become almost the entire source of transport-related PM emissions, that will put more and more pressure on better addressing and correctly quantifying the RDS component.
Author Contributions
Conceptualization, T.M. and F.G.; methodology, F.G., T.M. and N.M.; software, N.M. and S.H.; validation, T.M. and S.H.; formal analysis, F.G. and N.M.; investigation, F.G., N.M. and T.M.; resources, M.P., T.M. and F.G.; data curation, N.M.; writing—original draft preparation, F.G. and N.M.; writing—review and editing, F.G., T.M., N.M., S.H. and M.P.; visualization, F.G. and N.M.; supervision, T.M.; project administration, M.P.; funding acquisition, T.M. and M.P.. All authors have read and agreed to the published version of the manuscript.
Funding
This research was part of the project “Developing a UK Community Emission Modelling System (DUKEMS)” funded by UK Research and Innovation (UKRI) Strategic Priorities Fund (SPF) Clean Air programme, Wave 1, grant number CA19/3.
Institutional Review Board Statement
Not applicable.
Informed Consent Statement
Not applicable.
Data Availability Statement
Data supporting the reported results in this study can be found at the following sources namely traffic data (Department for Transport UK; Personal correspondence with Perth & Kinross Council); Meteorology for AQ modelling (National Oceanic and Atmospheric Administration); Rainfall data (Centre for Environmental Data Analysis); Pollutant concentrations (Scottish Air Quality Database and R openair package). Links (weblinks) to publicly archived datasets analyzed have been provided within the appropriate section of the paper text of the study. More detailed software information, data, other case studies and demo can be found at
https://www.rapidair.co.uk/ and
https://www.slideshare.net/scotthamilton33234/rapidair-a-new-urban-dispersion-modelling-platform-for-air-quality-analysis-in-cities (accessed on 25 August 2022).
Acknowledgments
The authors acknowledge support from the UKRI Strategic Priorities Fund Clean Air programme for funding this research. The Clean Air programme is jointly delivered by the Natural Environment Research Council (NERC) and the Met Office, with the Economic and Social Research Council (ESRC), Engineering and Physical Sciences Research Council (EPSRC), Innovate UK, Medical Research Council (MRC), National Physical Laboratory (NPL), Science and Technology Facilities Council (STFC), Department for Environment, Food and Rural Affairs (Defra), Department for Health and Social Care (DHSC), Department for Transport (DfT), Perth and Kinross Council, Scottish Government and Welsh Government.
Conflicts of Interest
The authors declare no conflict of interest. The funders had no role in the design of the study; in the collection, analyses, or interpretation of data; in the writing of the manuscript; or in the decision to publish the results.
Abbreviations
The Automatic Urban and Rural Network (AURN) is the UK’s largest automatic monitoring network and is the main network used for compliance reporting against the Ambient Air Quality Directives. Each AURN site, where a monitoring station is located, provide high resolution hourly information which is communicated rapidly to the public, using a wide range of electronic, media and web platforms.
References
- EEA. Transport Non-Exhaust PM-Emissions. An Overview of Emission Estimates, Relevance, Trends and Policies. European Environment Agency. 2021, Eionet Report—ETC/ATNI 2020/5. March 2021. Available online: https://www.eionet.europa.eu/ (accessed on 25 August 2022).
- OECD. Non-Exhaust Particulate Emissions from Road Transport: An Ignored Environmental Policy Challenge; OECD Publishing: Paris, France, 2020. [Google Scholar] [CrossRef]
- Harrison, R.M.; Jones, A.M.; Gietl, J.; Yin, J.; Green, D.C. Estimation of the contributions of brake dust, tire wear, and resuspension to non-exhaust traffic particles derived from atmospheric measurements. Environ. Sci. Technol. 2012, 46, 6523–6529. [Google Scholar] [CrossRef] [PubMed]
- Harrison, R.M.; Allan, J.; Carruthers, D.; Heal, M.R.; Lewis, A.C.; Marner, B.; Murrells, T.; Williams, A. Non-exhaust vehicle emissions of particulate matter and VOC from road traffic: A review. Atmos. Environ. 2021, 262, 118592. [Google Scholar] [CrossRef]
- Beddows, D.C.; Harrison, R.M. PM10 and PM2.5 emission factors for non-exhaust particles from road vehicles: Dependence upon vehicle mass and implications for battery electric vehicles. Atmos. Environ. 2021, 244, 117886. [Google Scholar] [CrossRef]
- Crilley, L.R.; Lucarelli, F.; Bloss, W.J.; Harrison, R.M.; Beddows, D.C.; Calzolai, G.; Nava, S.; Valli, G.; Bernardoni, V.; Vecchi, R. Source apportionment of fine and coarse particles at a roadside and urban background site in London during the 2012 summer ClearfLo campaign. Environ. Pollut. 2017, 220, 766–778. [Google Scholar] [CrossRef] [PubMed]
- Weinbruch, S.; Worringen, A.; Ebert, M.; Scheuvens, D.; Kandler, K.; Pfeffer, U.; Bruckmann, P. A quantitative estimation of the exhaust, abrasion and resuspension components of particulate traffic emissions using electron microscopy. Atmos. Environ. 2014, 99, 175–182. [Google Scholar] [CrossRef]
- Jeong, C.H.; Wang, J.M.; Hilker, N.; Debosz, J.; Sofowote, U.; Su, Y.; Noble, M.; Healy, R.M.; Munoz, T.; Dabek-Zlotorzynska, E.; et al. Temporal and spatial variability of traffic-related PM2.5 sources: Comparison of exhaust and non-exhaust emissions. Atmos. Environ. 2019, 198, 55–69. [Google Scholar] [CrossRef]
- USEPA. United States Environmental Protection Agency, 2017 National Emissions Inventory (NEI) Data. 2017. Available online: https://www.epa.gov/air-emissions-inventories/2017-national-emissions-inventory-nei-data (accessed on 30 August 2022).
- Gulia, S.; Goyal, P.; Goyal, S.K.; Kumar, R. Re-suspension of road dust: Contribution, assessment and control through dust suppressants—A review. Int. J. Environ. Sci. Technol. 2019, 16, 1717–1728. [Google Scholar] [CrossRef]
- AQEG—Air Quality Expert Group. Non-Exhaust Emissions from Road Traffic. 2019. Available online: https://uk-air.defra.gov.uk/assets/documents/reports/cat09/1907101151_20190709_Non_Exhaust_Emissions_typeset_Final.pdf (accessed on 30 August 2022).
- De la Paz, D.; Borge, R.; Vedrenne, M.; Lumbreras, J.; Amato, F.; Karanasiou, A.; Boldo, E.; Moreno, T. Implementation of road dust resuspension in air quality simulations of particulate matter in Madrid (Spain). Front. Environ. Sci. 2015, 3, 72. [Google Scholar] [CrossRef]
- Kauhaniemi, M.; Kukkonen, J.; Härkönen, J.; Nikmo, J.; Kangas, L.; Omstedt, G.; Ketzel, M.; Kousa, A.; Haakana, M.; Karppinen, A. Evaluation of a road dust suspension model for predicting the concentrations of PM10 in a street canyon. Atmos. Environ. 2011, 45, 3646–3654. [Google Scholar] [CrossRef]
- Pulles, T.; Heslinga, D. The Art of Emission Inventorying: A Pragmatic Approach to Emission Inventories for Various Applications. TNO Innovation for Life. 2007. Available online: https://webdosya.csb.gov.tr/db/necen/editordosya/file/NEC/CollectER_Training/The_Art_of_Emission_Inventorying.pdf (accessed on 25 August 2022).
- Amato, F.; Alastuey, A.; de la Rosa, J.; Castanedo, Y.G.; Sánchez de la Campa, A.M.; Pandolfi, M.; Lozano, A.; González, J.C.; Querolet, X. Trends of road dust emissions contributions on ambient air particulate levels at rural, urban and industrial sites in southern Spain. Atmos. Chem. Phys. 2014, 14, 3533–3544. [Google Scholar] [CrossRef]
- Costabile, F.; Alas, H.; Aufderheide, M.; Avino, P.; Amato, F.; Argentini, S.; Barnaba, F.; Berico, M.; Bernardoni, V.; Biondi, R.; et al. First results of the “Carbonaceous Aerosol in Rome and Environs (CARE)” Experiment: Beyond current standards for PM 10. Atmosphere 2017, 8, 249. [Google Scholar] [CrossRef]
- Gehrig, R.; Hüglin, C.; Hofer, P. Contributions of Road Traffic to Ambient PM10 and PM2.5 Concentrations. Swiss Transport Research Conference 2001, Monte Verità, Ascona, Switzerland, March 1–3. Available online: http://www.strc.ch/2001/gehrig.pdf (accessed on 25 August 2022).
- Lawrence, S.; Sokhi, R.; Ravindra, K. Quantification of vehicle fleet PM10 particulate matter emission factors from exhaust and non-exhaust sources using tunnel measurement techniques. Environ. Pollut. 2016, 210, 419–428. [Google Scholar] [CrossRef] [PubMed]
- Wåhlin, P.; Berkowicz, R.; Palmgren, F. Characterisation of traffic-generated particulate matter in Copenhagen. Atmos. Environ. 2006, 40, 2151–2159. [Google Scholar] [CrossRef]
- Amato, F.; Favez, O.; Pandolfi, M.; Alastuey, A.; Querol, X.; Moukhtar, S.; Bruge, B.; Verlhac, S.; Orza, J.A.G.; Bonnaire, N.; et al. Traffic induced particle resuspension in Paris: Emission factors and source contributions. Atmos. Environ. 2016, 129, 114–124. [Google Scholar] [CrossRef]
- Denier van der Gon, H.; Jozwicka, M.; Hendriks, E.; Gondwe, M.; Schaap, M. Mineral Dust as a Component of Particulate Matters. 2010; pp. 1–77. ISSN 1875-2314. Available online: https://www.pbl.nl/sites/default/files/downloads/500099003.pdf (accessed on 30 August 2022).
- Schaap, M.; Manders, A.M.M.; Hendriks, E.C.J.; Cnossen, J.M.; Segers, A.J.S.; van der Gon, H.D.; Jozwicka, M.; Sauter, F.; Velders, G.; Matthijsen, J.; et al. Regional Modelling of Particulate Matter for the Netherlands. January 2009, pp. 1–99. Available online: https://www.pbl.nl/sites/default/files/downloads/500099008_0.pdf (accessed on 30 August 2022).
- Rienda, I.C.; Alves, C.A. Road dust resuspension: A review. Atmos. Res. 2021, 261, 105740. [Google Scholar] [CrossRef]
- Thorpe, A.J.; Harrison, R.M.; Boulter, P.G.; McCrae, I.S. Estimation of particle resuspension source strength on a major London Road. Atmos. Environ. 2007, 41, 8007–8020. [Google Scholar] [CrossRef]
- Guevara, M.; Tena, C.; Porquet, M.; Jorba, O.; Pérez García-Pando, C. HERMESv3, a stand-alone multi-scale atmospheric emission modelling framework—Part 2: The bottom–up. Geosci. Model. Dev. 2020, 13, 873–903. [Google Scholar] [CrossRef]
- USEPA, Emission Factor Documentation for AP-42, Section 13.2.1 Paved Roads. 2011. Available online: https://www.epa.gov/sites/default/files/2020-10/documents/emission_factor_documentation_for_ap-42_section_13.2.1_paved_roads_.pdf (accessed on 25 August 2022).
- USEPA, Emission Factor Documentation for AP-42, Section 13.2.2 Unpaved Roads. Available online: https://www3.epa.gov/ttnchie1/ap42/ch13/final/c13s0202.pdf (accessed on 30 August 2022).
- Denby, B.R.; Sundvor, I.; Johansson, C.; Pirjola, L.; Ketzel, M.; Norman, M.; Kupiainen, K.; Gustafsson, M.; Blomqvist, G.; Omstedt, G. A coupled road dust and surface moisture model to predict non-exhaust road traffic induced particle emissions (NORTRIP)—Part 1: Road dust loading and suspension modelling. Atmos. Environ. 2013, 77, 283–300. [Google Scholar] [CrossRef]
- Denby, B.R.; Sundvor, I.; Johansson, C.; Pirjola, L.; Ketzel, M.; Norman, M.; Kupiainen, K.; Gustafsson, M.; Blomqvist, G.; Omstedt, G. A coupled road dust and surface moisture model to predict non-exhaust road traffic induced particle emissions (NORTRIP). Part 2: Surface moisture and salt impact modelling. Atmos. Environ. 2013, 81, 485–503. [Google Scholar] [CrossRef] [Green Version]
- Thouron, L.; Seigneur, C.; Kim, Y.; Mahé, F.; André, M.; Lejri, D.; Villegas, D.; Bruge, B.; Chanut, H.; Pellan, Y. Intercomparison of three modeling approaches for traffic-related road dust resuspension using two experimental data sets. Transp. Res. Part D Transp. Environ. 2018, 58, 108–121. [Google Scholar] [CrossRef]
- Gustafsson, M.; Eriksson, O.; Gjerstad, K.I.; Juneholm, M.; Snilsberg, B.; Denby, B. PM10 Emission Effects of New Studded Tyre Regulations. J. Earth Sci. Geotech. Eng. 2017, 7, 1–9. Available online: http://www.scienpress.com/Upload/GEO/Vol%207_1_1.pdf (accessed on 30 August 2022).
- Padoan, E.; Ajmone-Marsan, F.; Querol, X.; Amato, F. An empirical model to predict road dust emissions based on pavement and traffic characteristics. Environ. Pollut. 2018, 237, 713–720. [Google Scholar] [CrossRef] [PubMed]
- Amato, F.; Schaap, M.; Denier van der Gon, H.A.C.; Pandolfi, M.; Alastuey, A.; Keuken, M.; Querol, X. Effect of rain events on the mobility of road dust load in two Dutch and Spanish roads. Atmos. Environ. 2012, 62, 352–358. [Google Scholar] [CrossRef]
- China, S.; James, D.E. Influence of pavement macrotexture on PM10 emissions from paved roads: A controlled study. Atmos. Environ. 2012, 63, 313–326. [Google Scholar] [CrossRef]
- Masey, N.; Hamilton, S.; Beverland, I.J. Development and evaluation of the RapidAir® dispersion model, including the use of geospatial surrogates to represent street canyon effects. Environ. Model. Softw. 2018, 108, 253–263. [Google Scholar] [CrossRef]
- Yang, D.; Zhang, S.; Niu, T.; Wang, Y.; Xu, H.; Zhang, K.M.; Wu, Y. High-resolution mapping of vehicle emissions of atmospheric pollutants based on large-scale, real-world traffic datasets. Atmos. Chem. Phys. 2019, 19, 8831–8843. [Google Scholar] [CrossRef]
- Degraeuwe, B.; Pisoni, E.; Christidis, P.; Christodoulou, A.; Thunis, P. SHERPA-city: A web application to assess the impact of traffic measures on NO2 pollution in cities. Environ. Model. Softw. 2021, 135, 104904. [Google Scholar] [CrossRef]
- Amato, F.; Karanasiou, A.; Moreno, T.; Alastuey, A.; Orza, J.A.G.; Lumbreras, J.; Borge, R.; Boldo, E.; Linares, C.; Querol, X. Emission factors from road dust resuspension in a Mediterranean freeway. Atmos. Environ. 2012, 61, 580–587. [Google Scholar] [CrossRef]
- Amato, F.; Pandolfi, M.; Moreno, T.; Furger, M.; Pey, J.; Alastuey, A.; Bukowiecki, N.; Prevot, A.S.H.; Baltensperger, U.; Querol, X. Sources and variability of inhalable road dust particles in three European cities. Atmos. Environ. 2011, 45, 6777–6787. [Google Scholar] [CrossRef]
- EFT, Emissions Factors Toolkit, LAQM. Version 11. November 2021. Available online: https://laqm.defra.gov.uk/air-quality/air-quality-assessment/emissions-factors-toolkit/ (accessed on 25 August 2022).
- Carslaw, D.C.; Ropkins, K. Openair—An R package for air quality data analysis. Environ. Model. Softw. 2012, 27–28, 52–61. [Google Scholar] [CrossRef]
- World Health Organization. WHO Global Air Quality Guidelines: Particulate Matter (PM2.5 and PM10), Ozone, Nitrogen Dioxide, Sulfur Dioxide and Carbon Monoxide. 2021. Available online: https://apps.who.int/iris/handle/10665/345329 (accessed on 25 August 2022).
| Publisher’s Note: MDPI stays neutral with regard to jurisdictional claims in published maps and institutional affiliations. |
© 2022 by the authors. Licensee MDPI, Basel, Switzerland. This article is an open access article distributed under the terms and conditions of the Creative Commons Attribution (CC BY) license (https://creativecommons.org/licenses/by/4.0/).


