Article

Parameterization of Mean Terminal Velocity of Hydrometeors in Convective Clouds

1
Collaborative Innovation Center on Forecast and Evaluation of Meteorological Disasters, and Key Laboratory for Aerosol-Cloud-Precipitation of the China Meteorological Administration, Nanjing University of Information Science and Technology, Nanjing 210000, China
2
Liaoning Meteorological Disaster Monitoring and Early Warning Centre, Shenyang 110000, China
3
Fujian Climate Center, Fuzhou 350000, China
*
Author to whom correspondence should be addressed.
Atmosphere 2022, 13(9), 1404; https://doi.org/10.3390/atmos13091404
Submission received: 10 August 2022 / Revised: 26 August 2022 / Accepted: 29 August 2022 / Published: 31 August 2022

Abstract

:
The relationships between mean terminal velocity and volume mean diameter of different hydrometeors, as well as how they change with different background aerosol concentrations have been investigated with numerical simulations of tropical deep convection from the Weather Forecast and Research Model (WRF), coupled with spectral bin microphysics. The results showed a positive correlation between either the mass-weighted mean terminal velocity (Vm) or the number-weighted mean terminal velocity (Vn) and the volume-mean diameter (Dv), with a correlation coefficient greater than 0.8. The number concentrations of both large and small hydrometeors increase with enhanced aerosol loading, resulting in increased Vm and decreased Vn. The parameterizations of Vm (Vn) were established under different aerosol conditions. The parameterized Vm (Vn) was then compared with default values used in the model when a fixed shape parameter (gamma distribution) was used in the bulk microphysics, which suggests smaller Vm and larger Vn values from the parameterizations. Moreover, the proposed parameterizations were further applied to the Morrison microphysical scheme for the simulation of a convective cloud. Changes in Vm and Vn as mentioned above directly affect the sedimentation of precipitating hydrometeors, such as raindrops, snow, and graupel, which lead to increased (decreased) mass (number) concentration of hydrometeors.

1. Introduction

An accurate description of microphysical processes is important in improving the characterization of precipitation and the horizontal and vertical structures of cloud systems (as well as their evolution with time) in climate models [1,2]. The terminal velocity of hydrometeors is one of the most important parameters affecting precipitation [3], and it varies with their size and shape. If a group of hydrometeors (such as those located in the same voxel of model grids) can be taken as an object, we can calculate their mean terminal velocity. Mean terminal velocity can reflect the sedimentation of the gravity center of the hydrometeor group [4,5].
The magnitudes of the terminal velocity affect the relative motion among the hydrometeors [6], thus changing the collision frequency among different types or sizes of hydrometeors, the precipitation rate, as well as macro- and microphysical processes of cloud systems [7]. Ouyang [8] found that different parameterization schemes of terminal velocity affect the vertical distribution of hydrometeors in clouds. Ice particles play an important role in the formation of precipitation in convective clouds [9]. An increase in terminal velocity of graupel particles led to the enhanced drag force of hydrometeors. Xu et al. [10] found that smaller terminal velocities of graupel and hail would lead to an increase in upward-moving graupel. Therefore, reducing terminal velocities of graupel and hail at mid- and lower tropospheric levels would increase sources of upward-moving graupel and hail and reduce local maximum rainfall intensity. Wang [11] found that larger terminal velocity of snow and hail used in bulk microphysical schemes lead to the overestimation of precipitation intensity. Lou et al. [12] found that the modified mean terminal velocity of graupel affected the collision of graupel with other hydrometeors, as well as graupel melting. Franklin et al. [13] found that the increase in the terminal velocity of graupel increased the rain in the precipitation center of a tropical cyclone and decreased the coverage of precipitation. Wang and Qiao [14] discussed the influence of terminal velocities of rain, snow, and hail on precipitation and found that the maximum precipitation intensity is more sensitive to the terminal velocity of rain, while the precipitation range is more sensitive to terminal velocity of ice particles such as snow and hail. Therefore, the change of mean terminal velocity not only affects the cloud and precipitation-related microphysical processes but also affects cloud dynamics.
The larger the difference in terminal velocity among hydrometeors, the larger the collision efficiency [15]. As such, accurate calculation of terminal velocity plays a significant role in predicting the number and mass concentration of hydrometeors in cloud microphysical schemes. Several climate models, such as the Community Earth System Model [16,17], employ the two-moment Morrison scheme [18], which assumes the hydrometeors obey the gamma distribution function. They calculate the mass-weighted mean terminal velocity (Vm) and number-weighted mean terminal velocity (Vn) based on the shape parameter (α), slope parameter (β), and the empirical coefficient (Q, k). The two-moment bulk scheme generally calculates both Vm and Vn. Compared with the single-moment bulk scheme, which predicts only Vm (considering only hydrometeor mass-weighted mean terminal velocity), the two-moment scheme can simultaneously consider the settlement of both large and small particles, which can better reflect the effect of size sorting [19]. The Vm is larger than Vn [20], in that Vm is mostly affected by those hydrometeors with large sizes, whereas Vn is mostly affected by those small hydrometeors with larger numbers [6,21].
The shape parameter α of the gamma distribution is usually fixed when calculating the mean terminal velocity of hydrometeors, varying from 1 to 6 [1,19,22,23,24]. However, the size of the hydrometeors change with time and location. Hence, setting α to a fixed constant cannot provide an accurate calculation of the mean terminal velocity [25].
Moreover, the mean terminal velocity of the hydrometeors in a cloud may vary under different background aerosol concentrations. Aerosols can be activated as cloud condensation nuclei to participate in the formation of cloud droplets. The number of cloud droplets increases with the initial aerosol concentration. Due to the competition of water vapor during condensational growth [26], the effective radius of cloud droplets decreases, and the cloud droplet size distribution becomes narrower, thus affecting the size distribution of other types of hydrometeors [27]. Aerosols can affect the mean terminal velocity of hydrometeors through the above process, and then influence the movement trend of hydrometeors with updraft (mobility). Koren et al. [5] proposed that aerosol effects on cloud droplet mobility are one of the most important factors to promote the early development of convection. Koren et al. [28] found that the change in aerosol concentration affected the mass-weighted mean terminal velocity of precipitation particles. Under the premise that aerosols promotes convection, the higher the background aerosol concentration is, the greater the drop mass-weighted mean terminal velocity in the mature stage of cloud development. The different aerosol concentrations not only change the number concentration of cloud droplets but also have a non-negligible impact on the spectrum shape of cloud droplets [27]. In most bulk schemes, the premise of calculating the mean terminal velocity is that the hydrometeors obey a gamma distribution, and the parameters of the gamma distribution determine the parameterization of the mean terminal velocity [28], which can directly affect the forecasting ability of precipitation by a numerical model [25].
The volume-mean diameter (Dv) can be used to represent the mean volume or mass of the hydrometeors [24]. Zou et al. [29] and Seifert [30] fitted the dispersion of different hydrometeors and droplet spectrum shape parameters, respectively. Based on this previous research, this study aims to analyze the relationship of Dv and Vm (Vn) to establish parameterizations of Vm and Vn and explore their sensitivity to the background aerosol concentration.

2. Model and Methods

2.1. Numerical Model Experiments

This study used the Weather Forecast and Research Model coupled with a fast version of spectral bin microphysics (WRF-SBM), which is based on a two-dimensional non-static cloud model developed by researchers at Hebrew University [31]. The scheme uses spectral bin microphysics to describe the size distribution of hydrometeors, each size distribution function contains 33 mass bins, and the mass of particle mk in bin k is determined as mk = 2 × mk−1. The WRF-SBM fast-bin scheme outputs the size distribution information of the three types of hydrometeors, including droplets (cloud droplet/raindrop, separated by a radius of 80 μm), snow (ice crystal/snow, separated by a radius of 250 μm), and graupel. Compared with bulk microphysical scheme, the bin microphysics can describe the evolution of the particles in more detail, and the simulated results can compensate for the lack of observational data [20].
The simulation results used in this paper are the same as those of Chen et al. [32]. Chen et al. [32] found the simulated radar reflectivity and precipitation were consistent with empirical observations. The simulation area is around the Marshall Islands in tropical climates, using three nested domains (D01, D02, and D03) with horizontal resolutions of 12, 2.4, and 0.48 km, with simulated regions of 1320 × 1080, 600 × 480, and 300 × 300 km, respectively. The simulation results of the innermost grid (D03) are analyzed below. Three experiments with initial aerosol concentrations of 100, 500, and 2000 cm−3 are analyzed to explore the parameterizations of the mean terminal velocity of different hydrometeors and their response to aerosols. Three types of background aerosol concentration represent clean, semi-polluted, and polluted conditions and are referred as “Clean”, “Smplu”, and “Pollu” experiment respectively in the following text. More detail on experiment settings can be found in Chen et al. [32].
We analyzed the outputs of model simulations every ten minutes from 16:00 UTC, 19 August 1999 to 00:00 UTC, 20 August 1999. Sampling was performed over the entire domain and the simulation period according to the mass concentration and number concentration thresholds used in Zou et al. [29], where the sum of cloud, rain, ice, snow, and graupel mass exceeding 0.01 g kg−1 was considered as a cloud point. On this basis, for different types of hydrometeors, they were selected by qx exceeding 0.01 g kg−1 and qn exceeding 10 m−3 (where the cloud droplet number concentration threshold is 106 m−3); qx and qn represent the mass concentrations and number concentrations of different hydrometeors, respectively. The threshold of the cloud droplet number concentration was lower compared to Zou et al. [29] due to very clean conditions over the tropical ocean. The number of voxels of different types of hydrometeors sampled under different aerosol conditions is shown in Table 1.
Moreover, the Morrison scheme in the WRF model (version 4.2.2) was used to explore the effects of different parameterizations of Vm and Vn on the vertical profiles of different precipitation particles in a convective cloud system. The nested domains, horizontal/vertical resolutions, and start/end time settings are consistent with the above simulation test.

2.2. Theoretical Calculation of the Volume-Mean Diameter

The gamma function is a commonly used method for describing the size distribution of hydrometeors:
n ( D ) = N 0 D α 1 e D β ,
where D is the diameter, N0 is the intercept parameter, α is the shape parameter, and β is the slope parameter.
The calculation method of the n-th moments is introduced here:
M ( n ) = D min D max D n n ( D ) d D ,
Therefore, the n-th moment can be represented by the parameters of the gamma function:
M ( n ) = N β n Γ ( α + n ) Γ ( α ) ,
The volume-mean diameter is calculated as follows:
D v = D min D max D 3 n ( D ) d D D min D max n ( D ) d D 1 3 = M ( 3 ) M ( 0 ) 1 3 ,
The combination of Equations (2)–(4) results in:
D v = β 3 Γ ( α + 3 ) Γ ( α ) 1 3 ,

2.3. Calculation of Mean Terminal Velocity

The terminal velocity of a single hydrometeor can be written as [18]:
V t = Q r k ,
where Vt is the terminal velocity for an individual particle with diameter r, and Q and k are coefficients for each hydrometeor species. The coefficients (Table 2) used in this paper refer to the parametric parameters used by Morrison and Gettelman [18], Tao et al. [33], and Ferrier [4] to facilitate the calculation of the theoretical values of mean terminal velocity in Section 3.3.
Koren et al. [5] proposed mass-weighted mean terminal velocity:
V m = Q r ¯ α k α + 2 + k ! α + 2 ! ,
where the average radius is:
r ¯ = 0 r β α Γ ( α ) r α 1 e r β d r 0 β α Γ ( α ) r α 1 e r β d r = α β ,
Combining Equations (7) and (8) yields:
V m = Q β k α + 2 + k ! α + 2 ! ,
Combining Equations (5) and (9) yields:
V m = Q α + 2 + k ! α + 2 ! Γ ( α + 3 ) Γ ( α ) k 3 D v k ,
The formula for number-weighted mean terminal velocity calculation is similar to Equation (7):
V n = Q r ¯ α k α 1 + k ! α 1 ! ,
Combining Equations (5), (8), and (11) provides:
V n = Q α 1 + k ! α 1 ! Γ ( α + 3 ) Γ ( α ) k 3 D v k ,
The shape parameters α in the gamma distribution are often assumed to be fixed values in the model, but observations suggest that they are not constant [24]. Therefore, to optimize the calculation of the mean terminal velocity of the hydrometeors, this paper fits the simulation results of the bin microphysics to obtain the parameterizations of the mass-weighted and number-weighted mean terminal velocity of different hydrometeors, which may provide a reference for improving the prediction of precipitation and related processes by bulk microphysics.

3. Results and Discussion

3.1. Relationship between Vm and Dv

Modern bulk microphysics in mesoscale models and climate models typically uses the mass-weighted mean terminal velocity of different hydrometeors for the description of sedimentation [18]. In this paper, the hydrometeors are assumed as spherical particles, and the equivalent volume-mean diameter is calculated using their mass and density. For each selected voxel as listed in 
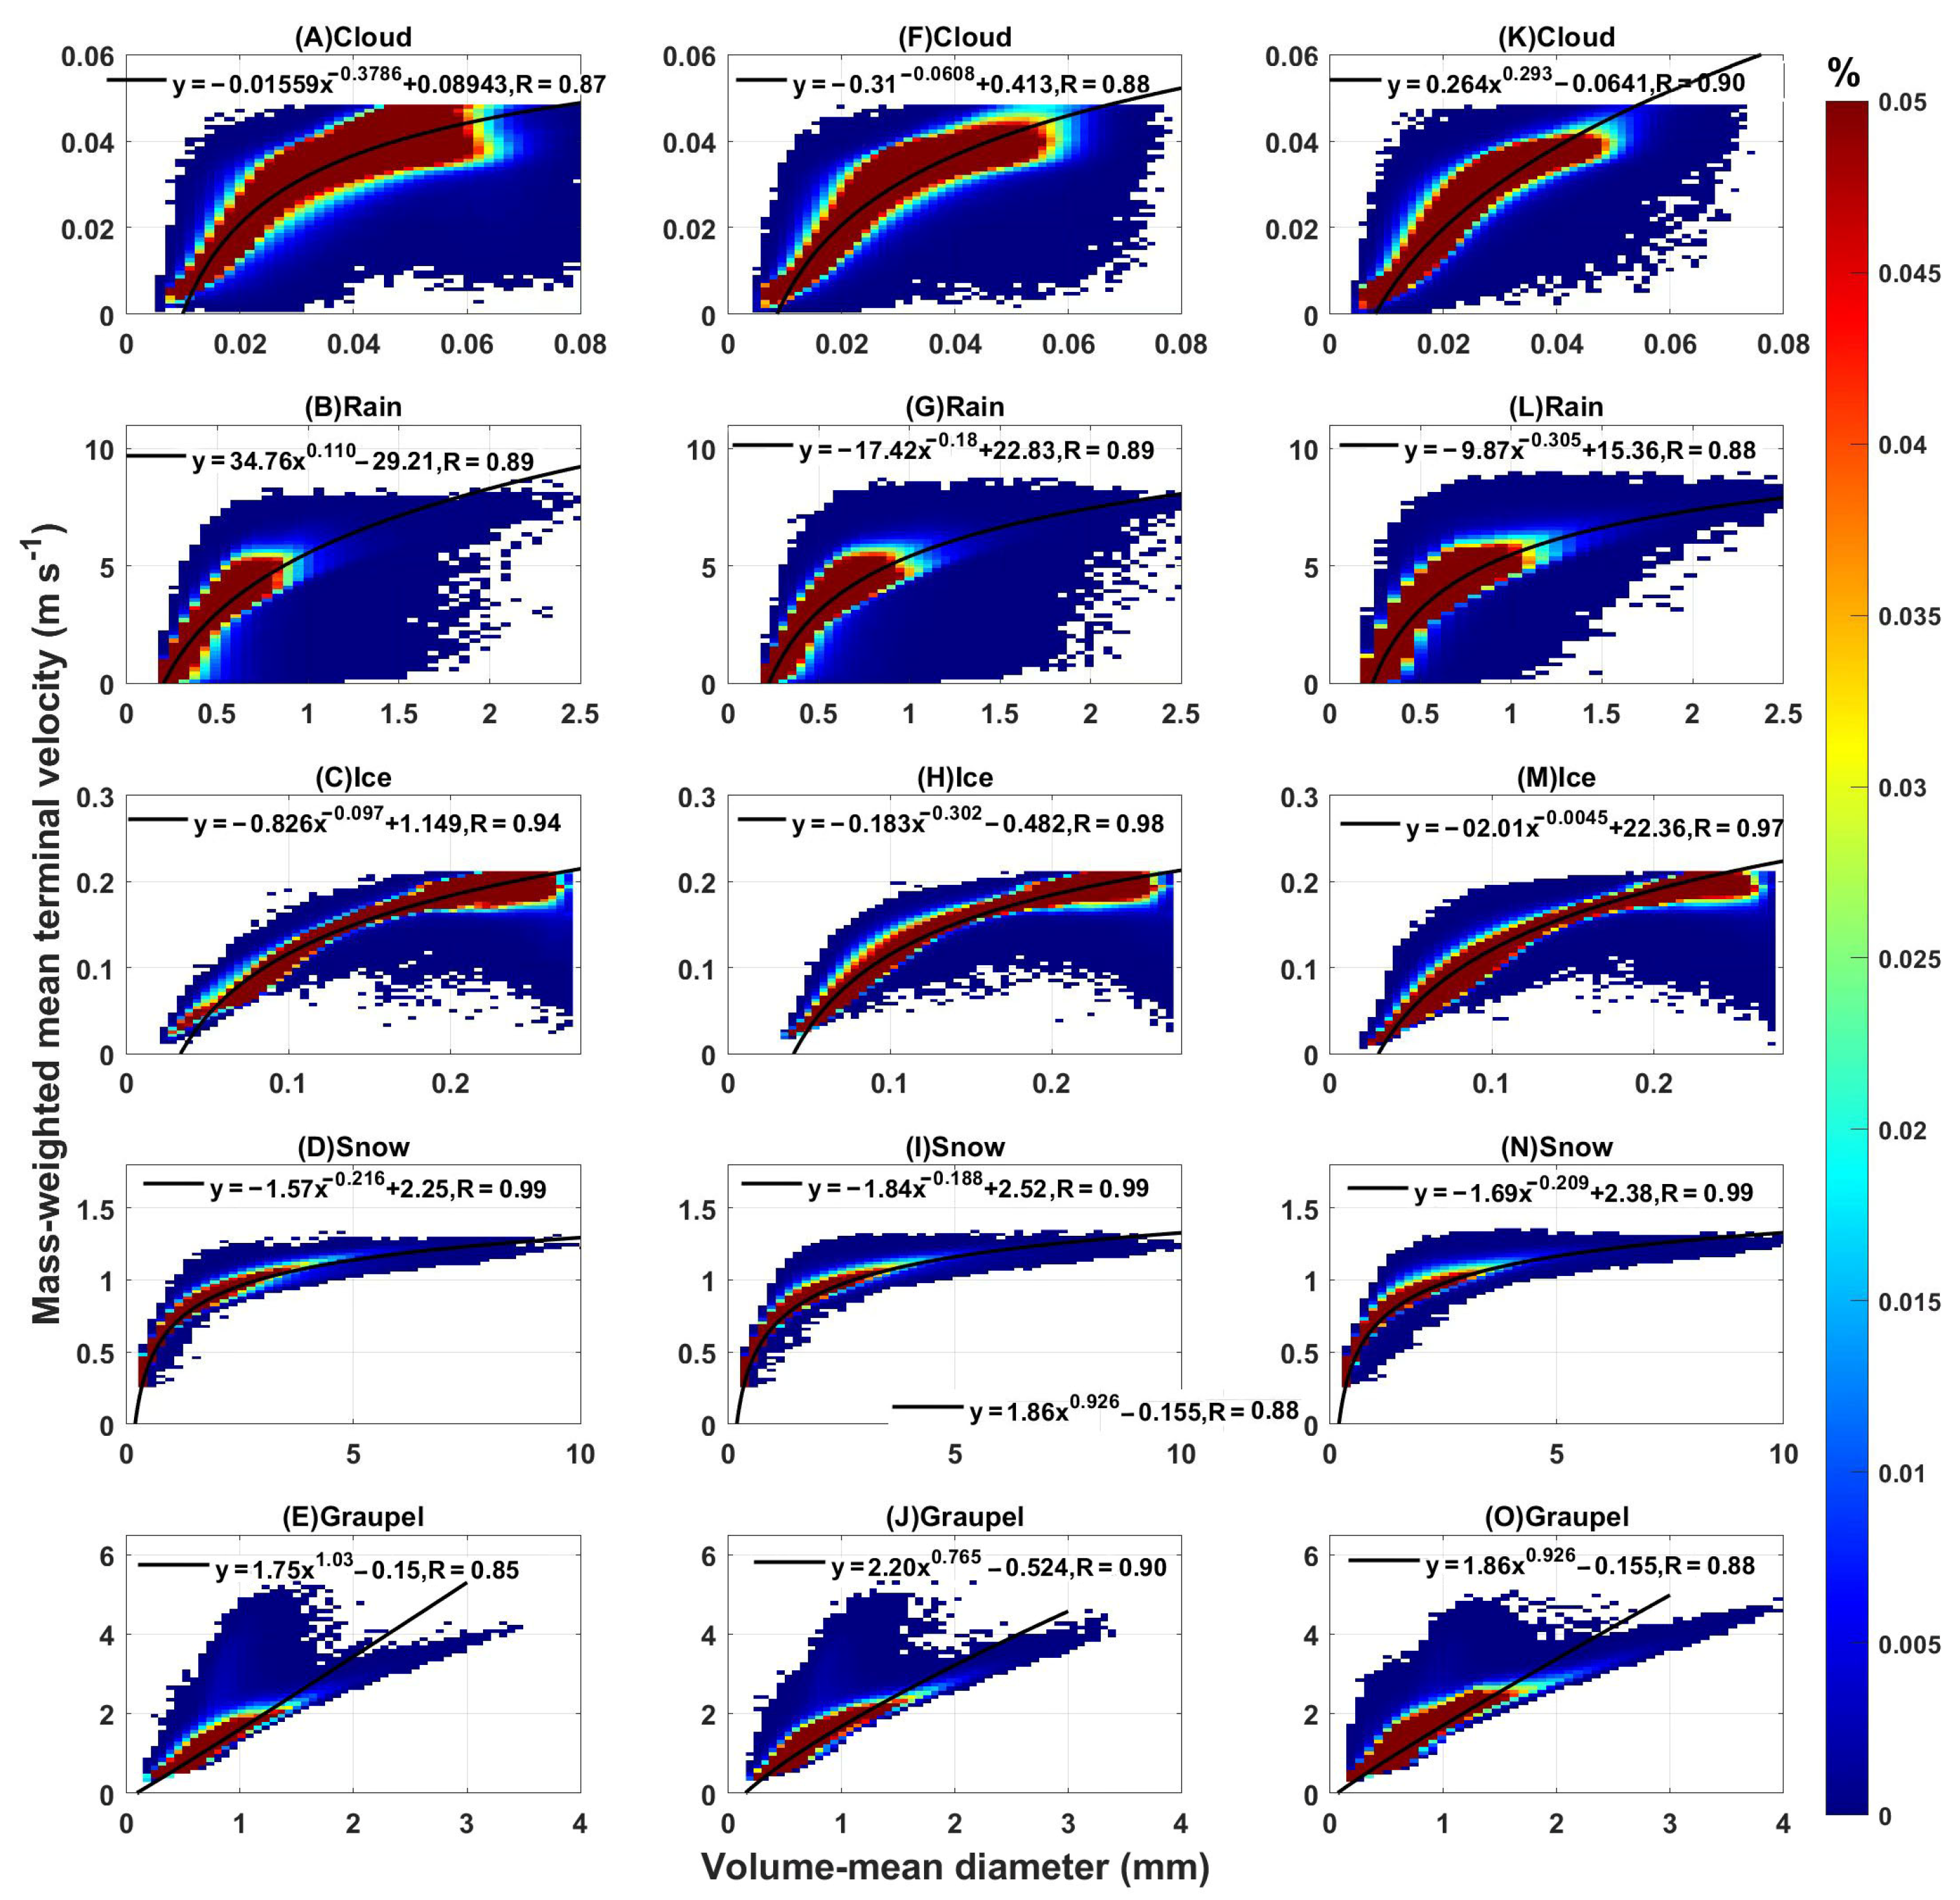
Table 1, the mass-weighted mean terminal velocity and volume-mean diameter of the group of particles within the given voxel were calculated for all types of hydrometeors. Then the joint probability density function of the relationship between Vm and Dv are presented in Figure 1. A larger volume-mean diameter means a greater mass of the hydrometeors, therefore greater mass-weighted mean terminal velocity. It shows that there is a positive correlation between mass-weighted mean terminal velocity and volume-mean diameter (Figure 1) for all types of hydrometeors. The correlation coefficients R are greater than 0.8.
The relationship between the mass-weighted mean terminal velocity and the volume-mean diameter is closely related to the growth of cloud droplets and raindrops. The mass-weighted mean terminal velocity is more susceptible to large-sized particles, thus the larger the cloud drop size is, the larger the mass-weighted mean terminal velocity of the hydrometeors. The increased aerosol concentration leads to a higher number concentration of cloud droplets with reduced effective radius, and a lower occurrence of collisions [32]. It can be seen in 
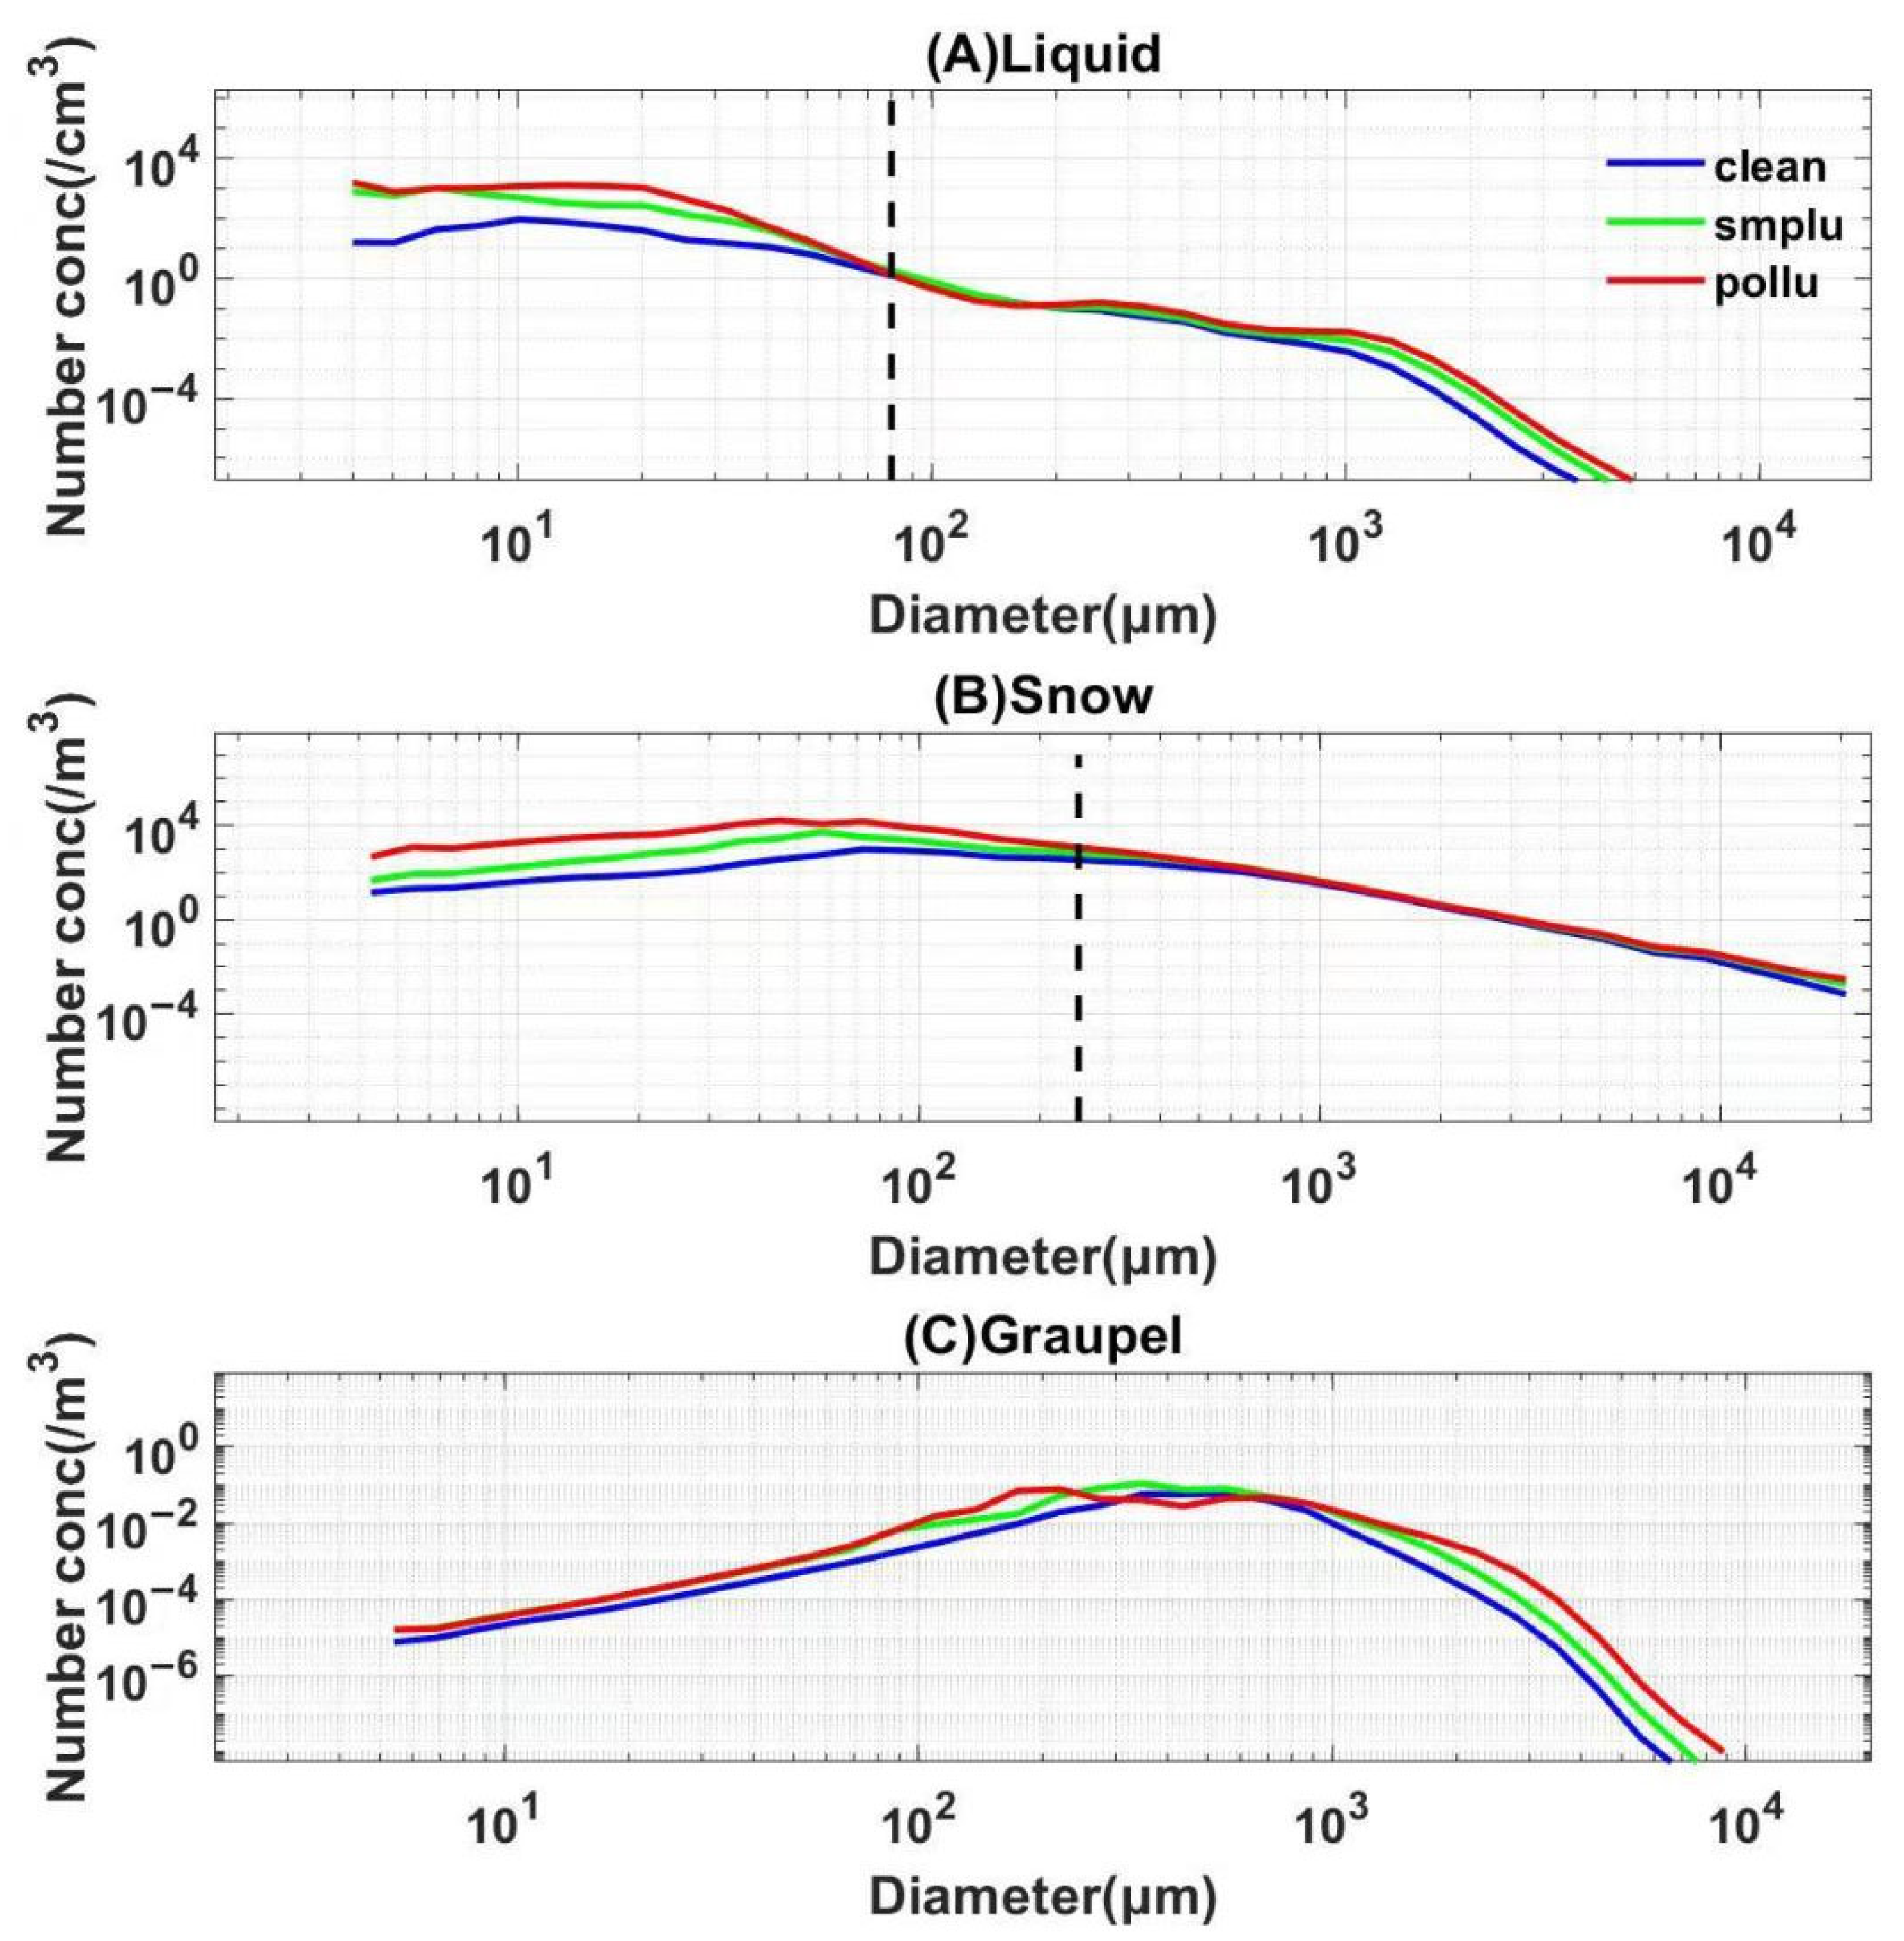
Figure 1 that the maximum value of the volume-mean diameter of the cloud droplet decreases with enhanced aerosol loading. In the polluted condition, the number concentration of cloud droplets with smaller sizes tends to be higher than that in clean conditions. The number of large droplets in the polluted cloud is also greater than that in the clean cloud (Figure 2). The mass-weighted mean terminal velocity is more affected by large-sized droplets, so Vm is larger for a given volume-mean diameter (the slope of the fitting curve is larger).
The Vm of the ice-phase hydrometeors is also positively associated with Dv. The more common the large ice crystals in the particle swarm are, the greater the mass-weighted mean terminal velocity and the larger the volume-mean diameter [21]. The ice crystals can collide with each other and grow into the snow, and they can also rime as the supercooled liquid falls and forms graupel. Snow and graupel increase with the development of the cloud system, and the volume-mean diameter also gradually increases. The existence of large ice particles will accelerate the process of aggregation and riming, then the large particles will become larger, resulting in greater mass-weighted mean terminal velocity. In the polluted cloud, affected by rising airflow, more small cloud droplets can be carried upward by the updrafts and reach high altitudes above 0 °C, where they can freeze into small ice crystals [32]. Therefore, the size distribution of ice crystals shifts to smaller sizes, changing the mass-weighted mean terminal velocities of ice crystals, snow, and graupel.
According to Equation (10), when the shape parameter is a fixed value, the relationship between Vm and Dv should be V m = a D v k , where a is the constant value and k is the effective terminal velocity parameter of the corresponding falling particle. Because the shape parameters are not fixed values, we consider fitting the function using the formula V m = a D v b + c . The intercept (c) appears in the fitting equation, probably because the viscous flow dominates in regions of smaller particle size [21]. The values of coefficients a, b, and c are shown in Figure 1, and all fitting functions passed a two-tailed t-test with a significance level of 95%. The size distribution of different hydrometeors changes with different aerosol loading, with more large hydrometeors appearing in more polluted clouds, which is crucial for calculating Vm. The slope of the Vm parameterization changes accordingly, resulting in different mass-weighted mean terminal velocities (Figure 1). Hence, it is necessary to establish specific parameterization under different aerosol conditions to improve the accuracy of bulk microphysics.

3.2. Relationship between Vn and Dv

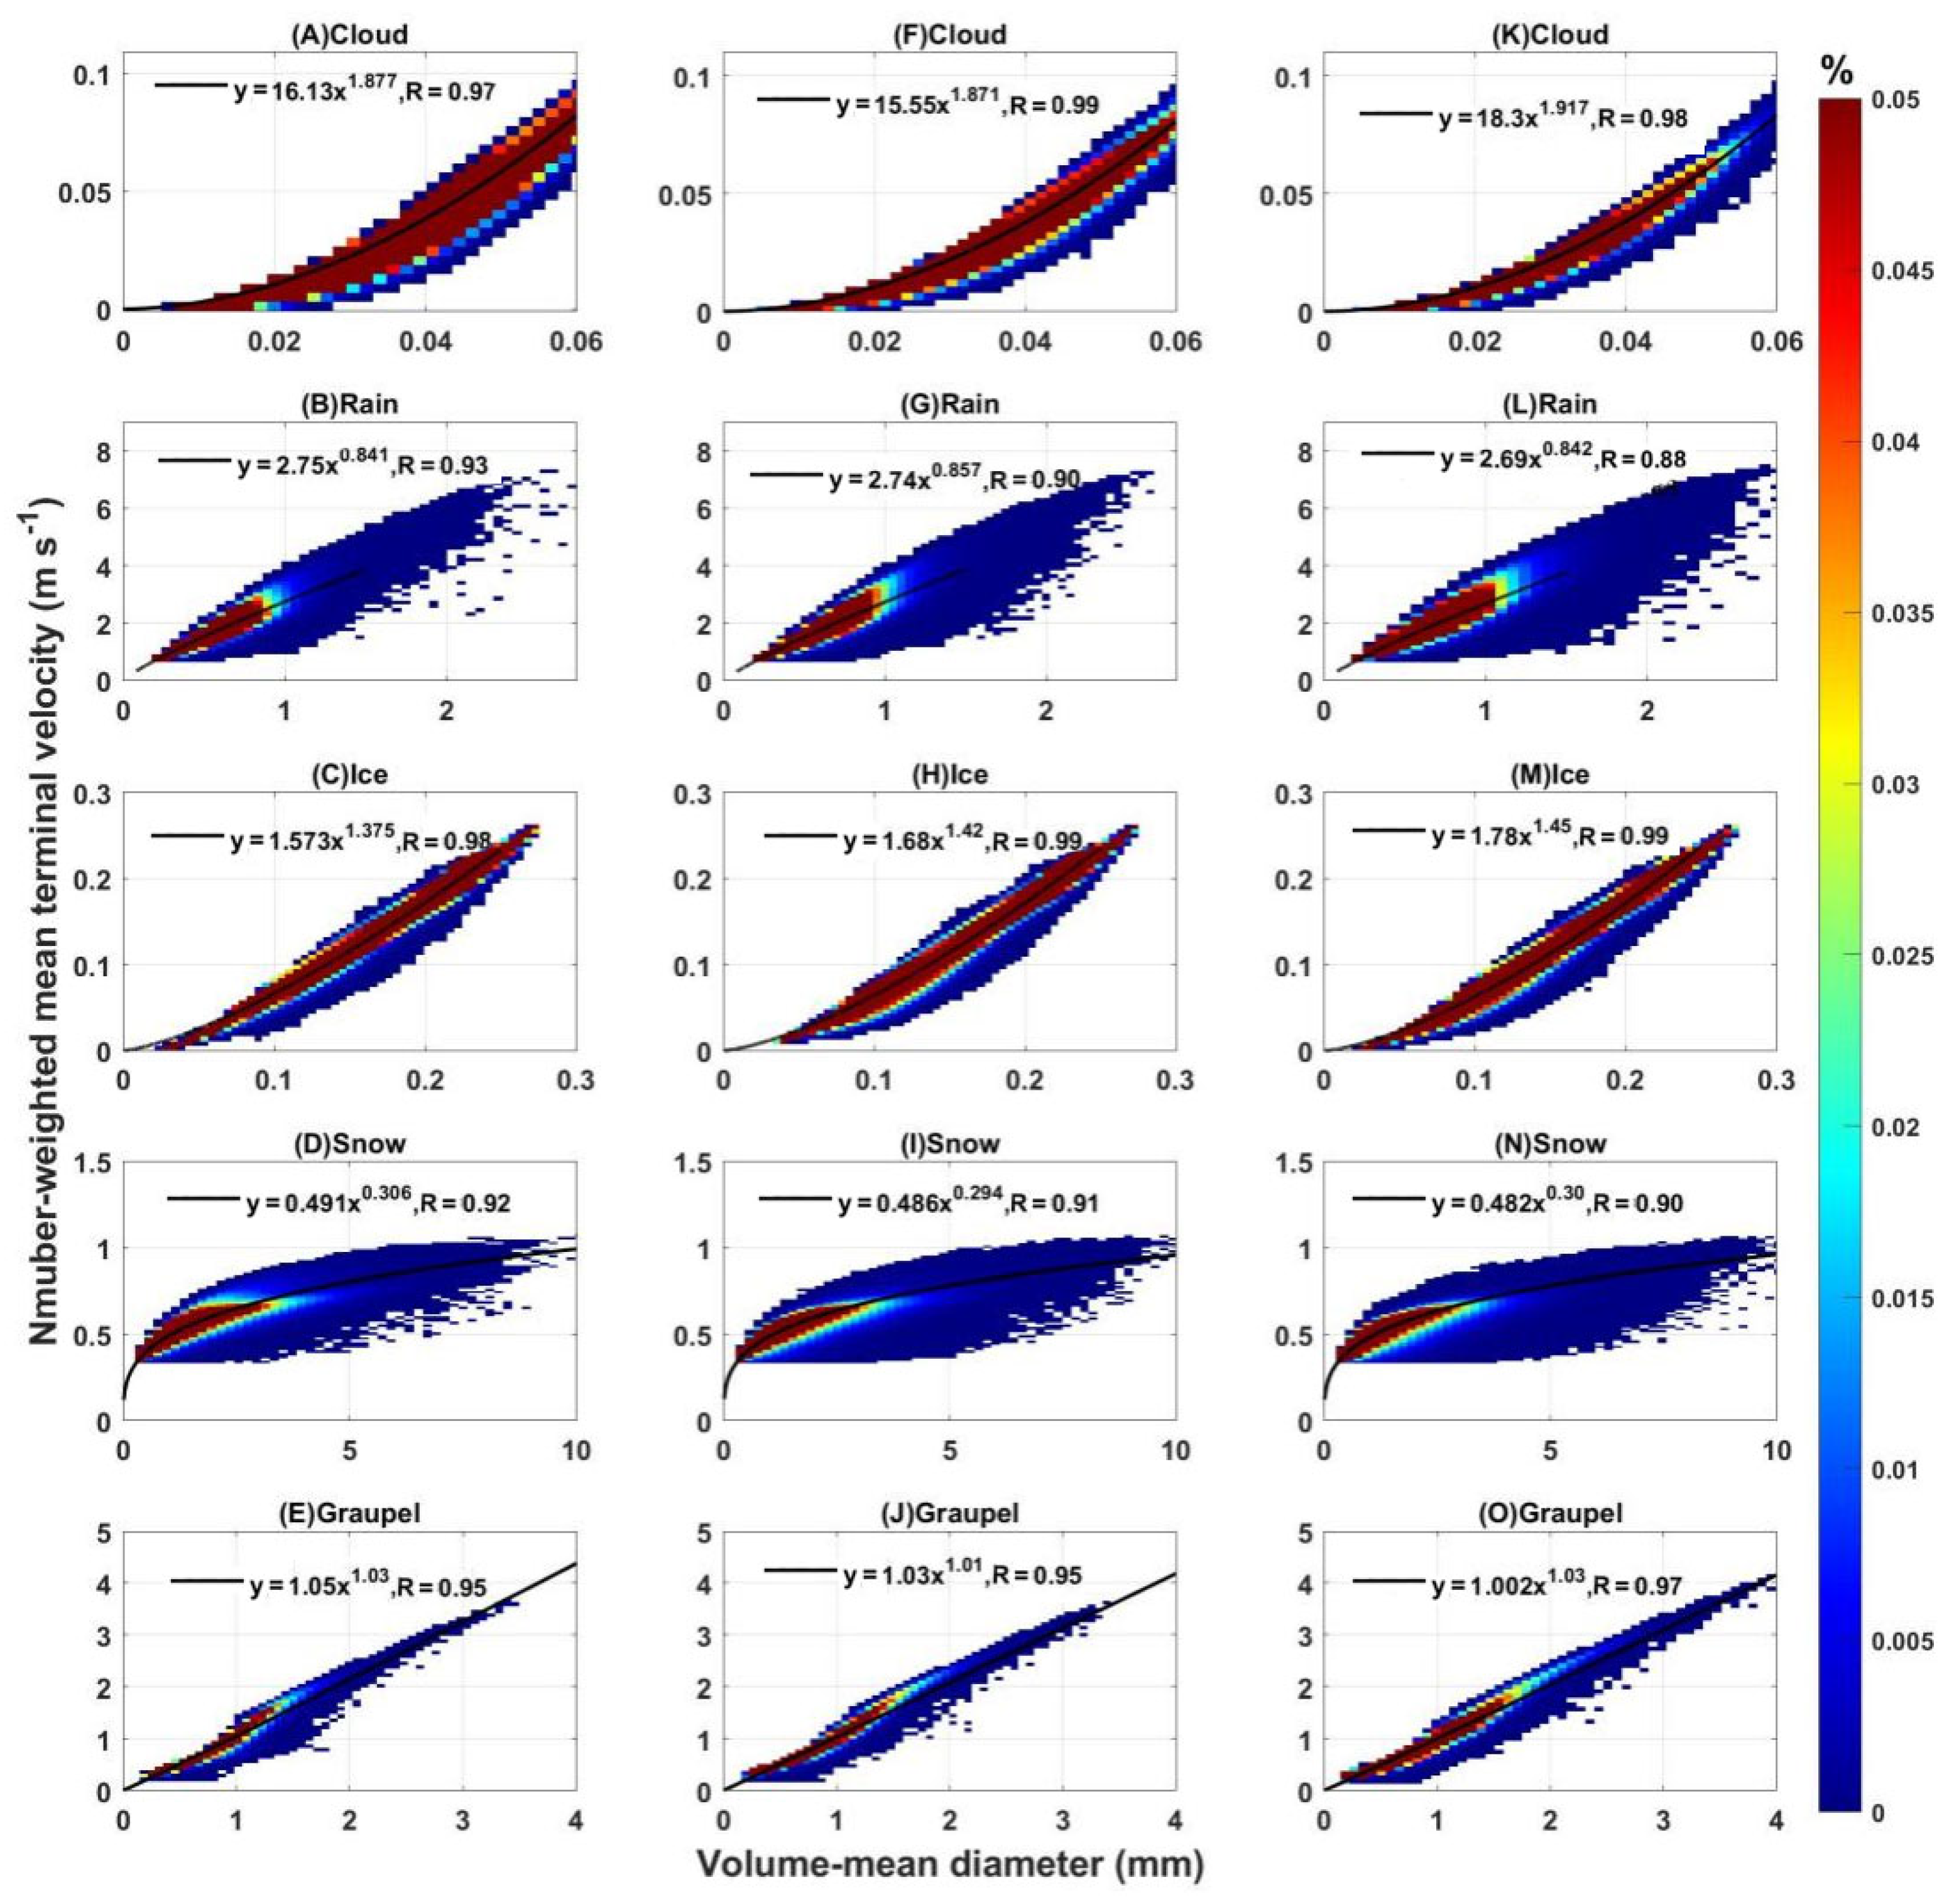
Figure 3 shows the joint probability density distribution of the relationship between volume-mean diameter and number-weighted mean terminal velocity, which also displays a positive correlation. Because both Dv and Vn are number-weighted terms, there is a strong correlation between them, with the correlation coefficient R greater than 0.9. Based on the derived Equation (11), V n = a D v b is used for fitting, which is similar to that for mass-weighted mean terminal velocity. The values of coefficients a and b are shown in Figure 3, and all the fitting functions passed the two-tailed t-test with a significance level of 95%.
Compared with Vm, the number-weighted mean terminal velocity is more sensitive with smaller-sized hydrometeors, hence the values of Vm are greater than that of Vn. During the development of a convective cloud, the smaller-sized cloud droplets gradually grow through condensation, and the large-sized particles lead to the larger Dv and Vn of cloud drops, so Vn of the cloud drops is positively correlated with Dv. Small-sized raindrops also grow with the collisions, but the collection is slower and less efficient than for large-sized raindrops, so the slope of the Vm parameterization is greater than that of Vn. Vn of ice-phase hydrometeors also has a positive correlation with Dv, and small ice crystals are mainly formed by the freezing of small cloud droplets carried up by updraft. Both volume-mean diameter and number-weighted mean terminal velocity increase with condensation. Similar to raindrops, the collection of smaller-sized snow and the sedimentation of small graupels is slower than that of larger-sized ones, so the slope of the Vn parameterization for ice particles is smaller relative to that of Vm.
The parameterization of Vn is also different under different background aerosol concentrations. Unlike Vm, which is affected mainly by an increased number of large particles, Vn is susceptible to a much larger number of small particles (Figure 2). With enhanced aerosol loading, the number concentration of small cloud droplets increases, resulting in the lower number-weighted mean terminal velocity, and the slope of Vn parameterization is smaller than that in clean air conditions. Ice crystals are affected by aerosols indirectly, and more small-sized ice crystals are formed due to the freezing of small cloud droplets. Consequently, the Vn of ice crystals is smaller in polluted conditions for a given volume-mean diameter. According to the size distribution of the ice hydrometeors, it can be found that the proportion of the number of small particles increased more, so the Vn parameterization results of snow and graupel decrease compared with the clean air situation. It is found that the Vn of different hydrometeors is affected mostly by the increasing proportion of small particles under polluted conditions, hence the slope of parameterization decreases.

3.3. Comparison of Different Parameterized Schemes

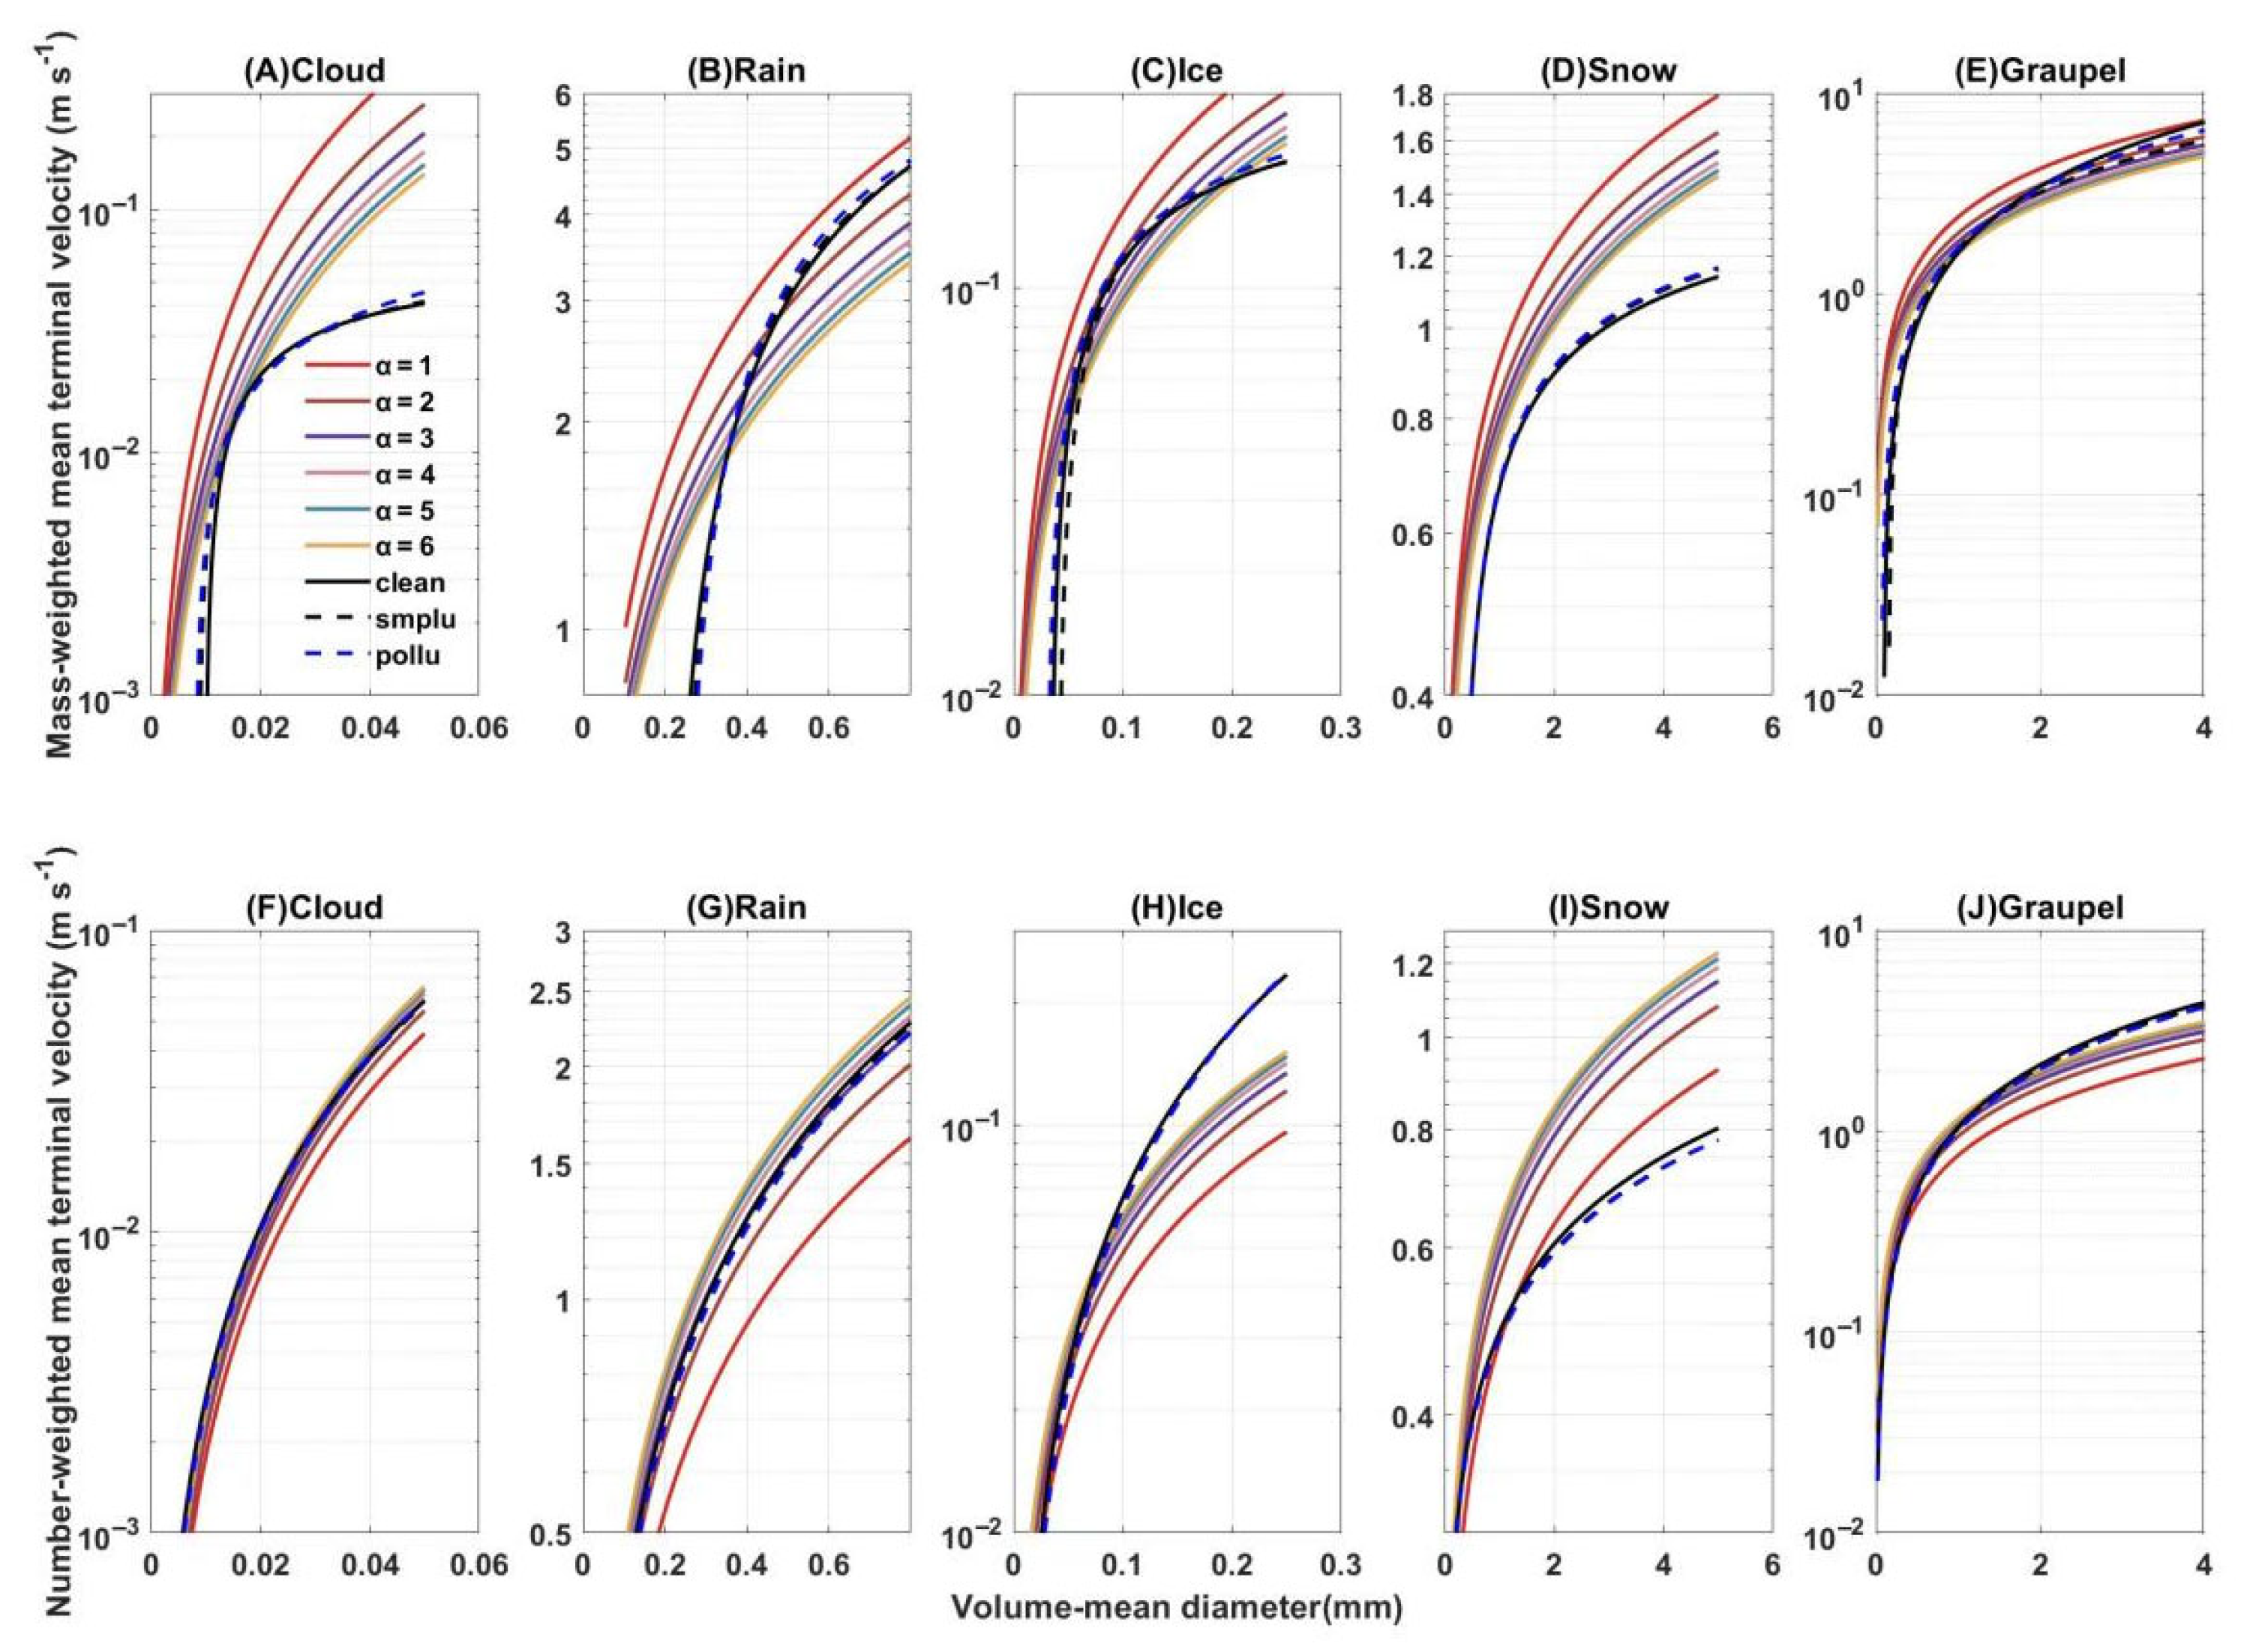
In many climate models, the gamma distribution shape parameter is calculated as a constant value for the mass-weighted mean terminal velocity and the number-weighted mean terminal velocity with Equation (10) and Equation (12), respectively. However, Vm and Vn cannot be reasonably set to the fixed constants. Therefore, we compared the above fitting results with the commonly used parameterizations of the mass-weighted mean and number-weighted mean terminal velocities when the shape parameter is set to a fixed value. This provides a reference for the selection of the shape parameter values in those models.
Overall, the mass-weighted mean terminal velocity is larger than the number-weighted mean terminal velocity, which is consistent with the expected results. For the fixed-shape parameterization tests, both Vm and Vn increase with the Dv, and Vm decreases and Vn increases with shape parameter values. According to Figure 4, it can be found that the arc trend of the curve of the number-weighted mean terminal velocity is consistent with the ones when α is constant, so Vn can be reasonably described if the appropriate constant is selected. However, the mass-weighted mean terminal velocity is different between our fitting curve and that calculated from a constant α, especially for the cloud and rain, hence Vm is less reliable than Vn when α is assumed to be constant.
Except for cloud droplets, parameterizations of other hydrometeors calculated using fixed α value will overestimate Vm of small volume-mean diameter particles, which may make small particles fall faster and reduce their relative speed, resulting in lower collision efficiency of large particles, delaying the onset of precipitation. For cloud droplets, parameterization of Vm using a fixed α value will lead to overestimation for the entire size distribution, which is more significant for the droplets with larger volume-mean diameter. This can increase the collection efficiency of large cloud droplets.
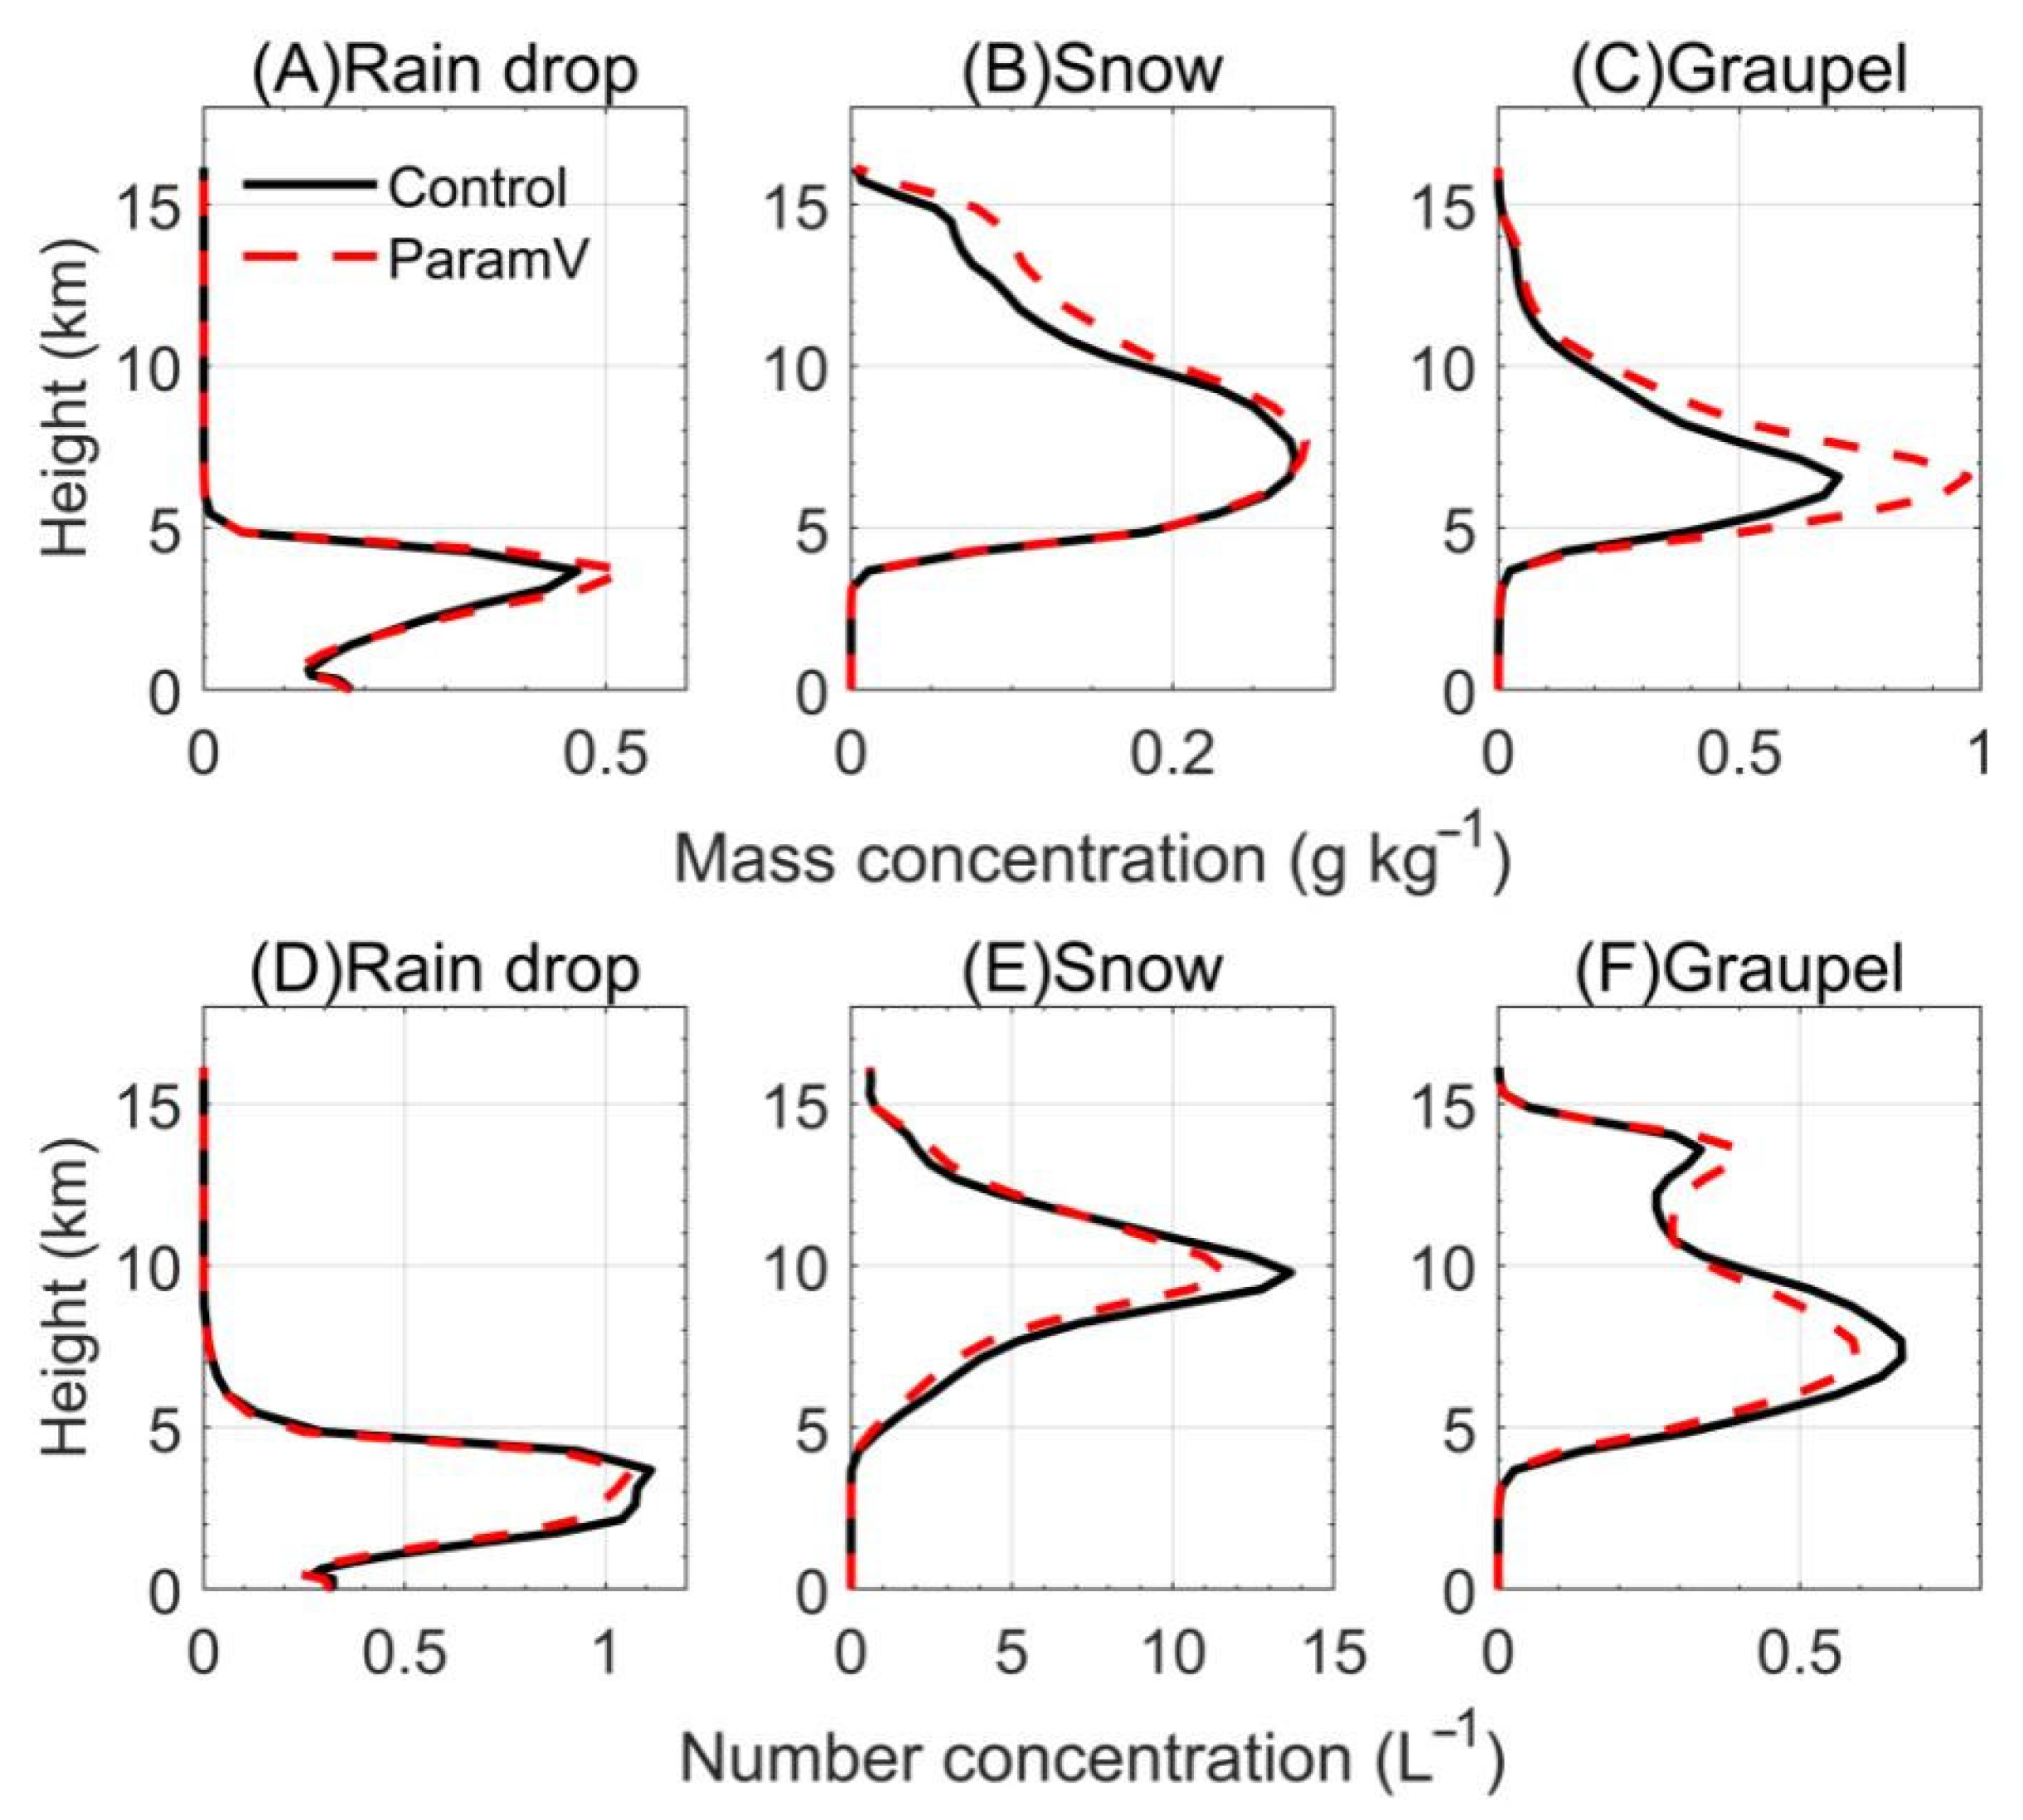
To further explore the impact of the new parametrization of mean terminal velocity on the vertical structure of the microphysics, the convective system was simulated using the WRF model with the default Morrison scheme (Control) and the modified Morrison scheme with new parameterization of Vm and Vn (ParamV), respectively (Figure 5). The default Morrison scheme calculates Vm and Vn with shape parameter α = 3 of the cloud droplets and α = 1 of the other hydrometeor species. Considering that the simulation area is around the Marshall Islands in a tropical region, the ParamV test uses the terminal velocity parameterizations obtained under clean condition. Based on the discussion in Figure 4, we can expect that the ParamV experiment predicts reduced Vm and increased Vn.
The prediction of the mass concentration and the number concentration of different hydrometeors in the Morrison scheme is determined jointly by the advection, the turbulent diffusion, and the source and sink of the microphysical process [18]:
N t + 1 ρ . ρ uN = N t nuc + N t evap + N t auto + N t accr + N t accs + N t het + N t hom + N t mlt + N t sed + N t det + D N
q t + 1 ρ . ρ uq = q t nuc + q t evap + q t auto + q t accr + q t accs + q t het + q t hom + q t mlt + q t sed + q t det + D q
Among them, the mass- and number-weighted mean terminal velocity affects the mass concentration and the number concentration by directly affecting sedimentation, N t sed and q t sed , and indirectly impacting microphysical processes.
According to Figure 5, it can be found that due to the decreasing Vm of the raindrops, sedimentation is inhibited, resulting in an increased mass concentration of the raindrops. The Vn of raindrops increases, which reduces the concentrations at different altitudes. Snow can exist from 4 km at lower levels to 15 km in the upper troposphere. With decreased Vm in the ParamV experiment, the settlement slows, resulting in the mass concentration of snow increasing at higher altitudes (8–15 km), and only changing slightly at lower altitudes (0–8 km). Snow sedimentation is faster with increased Vn, resulting in smaller number concentrations. A similar trend can be found for graupels. At higher altitudes (11–15 km), the increase of Vn for graupel may enhance the collection of ice crystals, leading to a reduced number concentration of ice crystals. The results show that using the modified parametric scheme of Vm and Vn increases the average mass concentration of raindrops, snow, and graupel, and the total amount of all precipitation particles in the whole cloud area increases accordingly, which is consistent with the research results of Tao et al. [33].
The sedimentation of cloud droplets and ice crystals is slow due to their low terminal velocities (<<1 m/s). Therefore, cloud droplets and ice crystals are mainly affected by the changing microphysical processes due to different Vm and Vn parameterizations (an indirect mechanism). Due to the complexity of cloud microphysical processes, the changes in number and mass concentration of cloud droplets and ice crystals are not discussed here further, and only that of precipitating particles, such as raindrops, snow, and graupel, are presented in Figure 5.

4. Conclusions

The WRF-SBM simulations of a convective system over the Marshall Islands were used to explore the relationship between the volume-mean diameter and the mean terminal velocity of different hydrometeors, and the mass-weighted and number-weighted mean terminal velocity parameterizations were established under different background aerosol concentration conditions.
It was found that the mean terminal velocity of hydrometeors and the volume-mean diameter showed a positive correlation for different aerosol scenarios, and the correlation coefficient was greater than 0.8. The Vm was affected mostly by the large hydrometeors, so Vm was much larger than Vn for a given volume-mean diameter. The larger volume-mean diameter of the hydrometeors increased the collection efficiency of large particles in the cloud, which further increased the slope of Vm.
Because the aerosol concentration affects the mean terminal velocity of hydrometeors through microphysical processes, the parameterizations under the clean and polluted conditions are established separately. Under polluted conditions, enhanced aerosol loading increases the concentration of both small and large hydrometeors. The Vm is mainly determined by the increased number of large particles, and more aerosols lead to larger Vm. The Vn is affected mostly by the increase of small particles, and Vn is smaller in polluted conditions.
The Vm and Vn parameterizations usually use fixed shape parameters. It is found that using a fixed shape parameter generally underestimates the Vm of the hydrometeors when the volume-mean diameter is small. With a newly established parameterization of Vm and Vn, we find that the changes in Vm and Vn directly affect sedimentation, and indirectly affect microphysical processes. For precipitating hydrometeors, such as raindrops, snow, and graupels, the mass concentration increases due to the reduced Vm which inhibits sedimentation, whereas the number concentration decreases with increased Vn. The differences in the mean terminal velocity parameterization scheme impact the vertical distribution of different hydrometeors. The parametric schemes obtained in this study can be used to improve sedimentation in bulk microphysics, which provides a reference for other climate models and can improve precipitation forecasts.
Due to the complexity of the microphysical processes, the responses of cloud droplets and ice crystal number concentration and mass concentration are not the same. Moreover, the influence of the mean terminal velocity parameterization scheme under different background aerosol concentration conditions on cloud microphysical processes and precipitation warrants further investigation.

Author Contributions

Z.Z. and Q.C. designed the research; Z.Z., Q.C., Q.Z., B.S., L.Y. and C.L. conducted the simulations; Q.C. contributed to model development and configuration. All authors have read and agreed to the published version of the manuscript.

Funding

This study was supported by the National Key Research and Development Program of China (grant 2017YFA0604001), the National Science Foundation of China (grant 41775136), the Bohai Bay Technology Collaborative Innovation Project of China (grant QYXM202202), and the National Key Scientific and Technological Infrastructure project “Earth System Science Numerical Simulator Facility” (EarthLab).

Institutional Review Board Statement

Not applicable.

Informed Consent Statement

Not applicable.

Data Availability Statement

The simulation data can be obtained by contacting the corresponding author, Qian Chen.

Acknowledgments

We acknowledge the High-Performance Computing Center of Nanjing University of Information Science & Technology for their support of this work.

Conflicts of Interest

The authors declare no conflict of interest.

References

  1. Yin, J. The Study on Observation and Parameterization of Cloud-Precipitation Microphysical Properties over East Asia. Ph.D. Thesis, Zhejiang University, Hangzhou, China, 2013. [Google Scholar]
  2. Morrison, H.; van Lier-Walqui, M.; Fridlind, A.M.; Grabowski, W.W.; Harrington, J.Y.; Hoose, C.; Korolev, A.; Kumjian, M.R.; Milbrandt, J.A.; Pawlowska, H.; et al. Confronting the Challenge of Modeling Cloud and Precipitation Microphysics. J. Adv. Modeling Earth Syst. 2020, 12, e2019MS001689. [Google Scholar] [CrossRef] [PubMed]
  3. Dagan, G.; Koren, I.; Altaratz, O.; Lehahn, Y. Shallow Convective Cloud Field Lifetime as a Key Factor for Evaluating Aerosol Effects. iScience 2018, 10, 192–202. [Google Scholar] [CrossRef] [PubMed]
  4. Ferrier, B.S. A Double-Moment Multiple-Phase Four-Class Bulk Ice Scheme. Part I: Description. Atmos. Sci. 1994, 52, 1001–1033. [Google Scholar] [CrossRef]
  5. Koren, I.; Altaratz, O.; Dagan, G. Aerosol effect on the mobility of cloud droplets. Environ. Res. Lett. 2015, 10, 104011. [Google Scholar] [CrossRef]
  6. Xu, H.; Duan, Y. Some questions in studying the evolution of size-distribution spectaum of hydrometor particles. Acta Meteorol. Sin. 1999, 57, 450–460. (In Chinese) [Google Scholar]
  7. Zhang, Y.; Wang, D.; Yin, J.; Xu, H. Impacts of Terminal Velocity and Drop Size Distribution Shape on the Numerical Simulation of Precipitation. Chin. J. Atmos. Sci. 2016, 40, 841–852. (In Chinese) [Google Scholar]
  8. Ouyang, X. Effects of Melting and Fall Speed Parameterizations for Ice-Phase Particles on Physical Processes in Idealized Convective Clouds: Numerical Studies. Ph.D. Thesis, Nanjing University of Information Science and Technology, Nanjing, China, 2020. [Google Scholar]
  9. Zhao, P.; Xiao, H.; Liu, J.; Zhou, Y. Precipitation efficiency of cloud and its influencing factors over the Tibetan plateau. Int. J. Climatol. 2022, 42, 416–434. [Google Scholar] [CrossRef]
  10. Xu, H.; Zhang, D.; Li, X. The Impacts of Microphysics and Terminal Velocities of Graupel/Hail on the Rainfall of Typhoon Fitow (2013) as Seen from the WRF Model Simulations with Several Microphysics Schemes. J. Geophys. Res.-Atmos. 2021, 126, e2020JD033940. [Google Scholar] [CrossRef]
  11. Wang, S.; Qiao, X.; Min, J. Impact of Stochastically Perturbed Terminal Velocities on Convective-Scale Ensemble Forecasts of Precipitation. Adv. Meteorol. 2020, 2020, 4234361. [Google Scholar] [CrossRef]
  12. Lou, X.; Sun, J.; Shi, Y.; Shi, Y. Numerical simulation study of the impacts of graupel parameters on strong convective rainfall and seeding effects. Chin. J. Atmos. Sci. 2015, 39, 474–488. (In Chinese) [Google Scholar] [CrossRef]
  13. Franklin, C.; Holland, G.; May, P. Sensitivity of tropical cyclone rainbands to ice-phase microphysics. Mon. Weather Rev. 2005, 133, 2473–2493. [Google Scholar] [CrossRef]
  14. Wang, S.; Qiao, X. Impacts of terminal velocity on precipitation prediction and the error representation of terminal velocity in ensemble forecasts. Atmos. Sci. Lett. 2020, 21, e974. [Google Scholar] [CrossRef] [Green Version]
  15. Pinsky, M.; Khain, A.P. Fine Structure of Cloud Droplet Concentration as Seen from the Fast-FSSP Measurements. Part I: Method of Analysis and Preliminary Results. J. Appl. Meteorol. Climatol. 2001, 40, 1515–1537. [Google Scholar] [CrossRef]
  16. Hurrell, J.W.; Holland, M.M.; Gent, P.R.; Ghan, S.; Marshall, S. The Community Earth System Model: A Framework for Collaborative Research. Bull. Am. Meteorol. Soc. 2013, 94, 1339–1360. [Google Scholar] [CrossRef]
  17. Lin, Y.; Huang, X.; Liang, Y.; Qin, Y.; Xu, S.; Huang, W.; Xu, F.; Liu, L.; Wang, Y.; Peng, Y.; et al. Community Integrated Earth System Model (CIESM): Description and Evaluation. J. Adv. Model. Earth Syst. 2020, 12, e2019MS002036. [Google Scholar] [CrossRef]
  18. Morrison, H.; Gettelman, A. A New Two-Moment Bulk Stratiform Cloud Microphysics Scheme in the Community Atmosphere Model, Version 3 (CAM3). Part I: Description and Numerical Tests. J. Clim. 2008, 21, 3642–3659. [Google Scholar] [CrossRef]
  19. Milbrandt, J.A.; Mctaggart-Cowan, R. Sedimentation-Induced Errors in Bulk Microphysics Schemes. J. Atmos. Sci. 2010, 67, 3931–3948. [Google Scholar] [CrossRef]
  20. Khain, A.P.; Beheng, K.D.; Heymsfield, A.; Korolev, A.; Krichak, S.O.; Levin, Z.; Pinsky, M.; Phillips, V.; Prabhakaran, T.; Teller, A. Representation of microphysical processes in cloud-resolving models: Spectral (bin) microphysics versus bulk parameterization. Rev. Geophys. 2015, 53, 247–322. [Google Scholar] [CrossRef]
  21. Mishra, S.; Mitchell, D.L.; Turner, D.D.; Lawson, R.P. Parameterization of ice fall speeds in midlatitude cirrus: Results from SPartICus. J. Geophys. Res. Atmos. 2014, 119, 3857–3876. [Google Scholar] [CrossRef]
  22. Lin, Y.L.; Farley, R.D.; Orville, H.D. Bulk Parameterization of the Snow Field in a Cloud Model. J. Appl. Meteorol. Climatol. 1983, 22, 1065–1092. [Google Scholar] [CrossRef]
  23. Milbrandt, J.A.; Yau, M.K. A Multimoment Bulk Microphysics Parameterization. Part II: A Proposed Three-Moment Closure and Scheme Description. J. Atmos. Sci. 2005, 62, 3065–3081. [Google Scholar] [CrossRef]
  24. Yang, J.; Chen, B.; Yin, Y. Physics of Clouds and Precipitation; China Meteorological Press: Beijing, China, 2011. [Google Scholar]
  25. Yin, J.; Wang, D.; Zhai, G. Long-term in situ measurements of the cloud-precipitation microphysical properties over East Asia. Atmos. Res. 2011, 102, 206–217. [Google Scholar] [CrossRef]
  26. Rosenfeld, D.; Lohmann, U.; Raga, G.B.; O’Dowd, C.D.; Kulmala, M.; Fuzzi, S.; Reissell, A.; Andreae, M.O. Flood or Drought: How Do Aerosols Affect Precipitation? Science 2008, 321, 1309–1313. [Google Scholar] [CrossRef] [PubMed]
  27. Xue, Y. Effect of Cloud Droplet Spectrum Dispersion on Aerosol Indirect Effect and Its Influencing Factors. Master’s Thesis, Nanjing University of Information Science and Technology, Nanjing, China, 2021. [Google Scholar]
  28. Koren, I.; Altaratz, O.; Dagan, G. From aerosol-limited to invigoration of warm convective clouds. Science 2014, 344, 1143–1146. [Google Scholar] [CrossRef] [PubMed]
  29. Zou, Q.; Zhu, L.; Lu, C.; Zhang, G.J.; Xu, X.; Chen, Q.; Li, D. Parameterizations of different hydrometeor spectral relative dispersion in the convective clouds. Atmos. Ocean. Sci. Lett. 2022, 15, 100141. [Google Scholar] [CrossRef]
  30. Seifert, A. On the Parameterization of Evaporation of Raindrops as Simulated by a One-Dimensional Rainshaft Model. J. Atmos. Sci. 2008, 65, 3608–3619. [Google Scholar] [CrossRef]
  31. Khain, A.; Pokrovsky, A.; Pinsky, M.; Seifert, A.; Phillips, V. Simulation of Effects of Atmospheric Aerosols on Deep Turbulent Convective Clouds Using a Spectral Microphysics Mixed-Phase Cumulus Cloud Model. Part I: Model Description and Possible Applications. J. Atmos. Sci. 2004, 61, 2963–2982. [Google Scholar] [CrossRef]
  32. Chen, Q.; Koren, I.; Altaratz, O.; Heiblum, R.H.; Dagan, G.; Pinto, L. How do changes in warm-phase microphysics affect deep convective clouds? Atmos. Chem. Phys. 2017, 17, 9585–9598. [Google Scholar] [CrossRef] [Green Version]
  33. Tao, Y.; Qi, Y.; Hong, Y. Numerical simulations of the influence of the graupel fall terminal velocity on cloud system and precipitation development. Acta Meteorol. Sin. 2009, 67, 370–381. (In Chinese) [Google Scholar]
Figure 1. Joint probability density function of the relationship between mass-weighted mean terminal velocity (m s−1) and volume-mean diameter (mm) based on clean (left), moderate pollution (middle), and polluted (right) conditions for different types of hydrometeors: (A,F,K), cloud droplets, (B,G,L) raindrops, (C,H,M) ice crystals, (D,I,N) snow, and (E,J,O) graupel particles. The black curves indicate the fitting function, and R represents the correlation coefficient. In the fitting function, x and y represent the volume-mean diameter and the mass-weighted mean terminal velocity, respectively.
Atmosphere 13 01404 g001
Figure 2. Size distribution of (A) cloud droplets/raindrops, (B) ice crystals/snow, and (C) graupel particles in clean (blue solid line), moderate pollution (green solid line), and polluted (red solid line). The black dashed line is the threshold of (A) cloud droplets/raindrops (80 μm) and (B) ice crystals/snow (250 μm).
Atmosphere 13 01404 g002
Figure 3. Joint probability density function of the relationship between number-weighted mean terminal velocity (m s−1) and volume-mean diameter (mm) based on clean (left), moderate pollution (middle), and polluted (right) conditions for different types of hydrometeors: (A,F,K), cloud droplets, (B,G,L) raindrops, (C,H,M) ice crystals, (D,I,N) snow, and (E,J,O) graupel particles. The black curves indicate the fitting function, and R represents the correlation coefficient. In the fitting function, x and y represent the volume-mean diameter and the number-weighted mean terminal velocity, respectively.
Atmosphere 13 01404 g003
Figure 4. Mass-weighted (top) and number-weighted mean terminal velocity (below) of different hydrometeors as a function of volume-mean diameter when assuming the shape parameters as a different fixed value (colored solid line) and using clean (solid black line), moderate pollution (smplu, black dashed line), and polluted (pollu, blue dashed line) parametrizations: (A,F) cloud droplets, (B,G) raindrops, (C,H) ice crystals, (D,I) snow, and (E,J) graupel.
Atmosphere 13 01404 g004
Figure 5. The vertical profiles of mass concentration (AC) and number concentration (DF) of the experiment with default parameterization of mean terminal velocity (Control, α = 1, black curve) and one with new parameterization (ParamV, red dashed curve): (A,D) raindrops, (B,E) snow, and (C,F) graupel.
Atmosphere 13 01404 g005
Table 1. Number of voxels of different types of hydrometeors sampled under clean, semi-polluted, and polluted conditions.
CloudRainIceSnowGraupel
Clean9,164,670115,500,45025,443,59543,971,39328,565,141
Smplu21,427,214104,214,52048,492,14661,310,10743,210,748
Pollu36,257,558107,539,91687,256,21269,375,91243,979,449
Table 2. The coefficients in the equation for the terminal velocity of different hydrometeors.
CloudRainIceSnowGraupel
Q (m1-b s−1)3 × 107700841.99711.72351.2
k210.80.410.37
Publisher’s Note: MDPI stays neutral with regard to jurisdictional claims in published maps and institutional affiliations.

