Article

The Impacts of Urban Form on PM2.5 Concentrations: A Regional Analysis of Cities in China from 2000 to 2015

1
College of Resources and Environmental Science, Quanzhou Normal University, Quanzhou 362000, China
2
School of Geographical Sciences, Fujian Normal University, Fuzhou 350007, China
3
Guangdong Provincial Key Laboratory of Urbanization and Geo-Simulation, School of Geography and Planning, Sun Yat-sen University, Guangzhou 510275, China
4
Land Consolidation and Rehabilitation Center, MNR, Beijing 100035, China
*
Author to whom correspondence should be addressed.
Atmosphere 2022, 13(6), 963; https://doi.org/10.3390/atmos13060963
Submission received: 7 April 2022 / Revised: 23 May 2022 / Accepted: 11 June 2022 / Published: 14 June 2022
(This article belongs to the Special Issue Urban Aerosols in China: Current Understanding and Future Directions)

Abstract

:
The urban form (e.g., city size, shape, scale, density, etc.) can impact the air quality and public health. However, few studies have been conducted to assess the relationship between the urban form and PM2.5 concentrations on a regional scale and long-term basis in China. In this study, we explored the impact of the urban form on the PM2.5 concentrations in four different regions (i.e., northeast, central, east, western) across China for the years 2000, 2005, 2010, and 2015. Five landscape metrics were classified into three characteristics of the urban form (compactness, shape complexity, and urban expansion) using high-resolution remote-sensing data. With considerations given to regional differences, panel-data models and city-level panel data were used to calculate the impact of the urban form on the PM2.5 concentrations. The results of the study indicate that urban expansion is positively correlated with the PM2.5 concentrations across China, with the only exception being the country’s western region, which suggests that urban extension is conducive to increasing the PM2.5 levels in relatively developed regions. Meanwhile, the positive relationship between the irregularity of cities and the PM2.5 concentrations indicates that reducing the urban shape complexity will help to mitigate PM2.5 pollution. Moreover, urban compactness, which mainly refers to the landscape-division-index values, proved to have a negative effect on the PM2.5 concentrations, suggesting that the optimization of urban spatial compactness could reduce PM2.5 levels. The findings of this study are beneficial for a better understanding of the intensity and direction of the effect of the urban form on PM2.5 concentrations.

1. Introduction

Air pollution has become one of the most severe environmental issues across the world, increasing health risks and anomalous climatic events. Rising PM2.5 concentrations—which have caused a host of problems, including increased death rates, reduced visibility, and damage to ecosystems—is believed to be one of the greatest contributors to the air problem [1,2,3]. Recent studies have demonstrated that PM2.5 concentrations can be influenced by urban forms (e.g., the city size, shape, scale, density, land uses, building types, urban block layout, and distribution of green space) [4,5,6,7,8,9]. For example, the urban-heat-island effect can affect the production and aggravation of the PM2.5 concentrations in urban areas [10,11]. The urban landscape pattern can be reflected by the NDVI (normalized difference vegetation index), and a higher NDVI value was reported to have a negative effect on the PM2.5 levels in a study conducted in East Asia [12]. This is because the NDVI has negative effects on the land surface temperature [13]. Existing studies have demonstrated that road greenbelts and the vertical distribution of biomass and diversified vegetation species assist in mitigating PM2.5 levels [14]. Deng et al. [15] also posit that green spaces with different structures have different influences on reducing PM2.5 levels. However, other indices (e.g., area, compactness, and shape complexity [16]) should also be considered when assessing the impact of urban forms on PM2.5 concentrations. Currently, only a handful of articles have addressed the influence of urban forms on PM2.5 concentrations, with most previous studies focusing on CO2 [17]. For instance, a study on the relationship between urban forms and PM2.5 concentrations based on 111 U.S. cities suggests that the higher population centrality is associated with lower PM2.5 concentrations, but higher urban sprawl created heavier PM2.5 concentrations [18,19]. In China, the findings indicate that large urban areas had a positive impact on the PM2.5 concentrations in cities with built-up areas <300 km2 [20]. The results of the research by Shi et al. [4] also suggest that urban expansion had a positive influence on the PM2.5 concentrations in Chinese cities. Meanwhile, they further argue that urban-form compactness is beneficial for reducing PM2.5 concentrations. Su et al. [21] analyzed the implications of urban landscape patterns for the PM2.5 levels in Nanchang and found that the SHDI (Shannon’s diversity index) value of the construction land could increase the PM2.5 levels [21]. Lu et al. [22] took the Yangtze River Delta as a sample and also found that the irregular shape of a landscape patch was associated with an increase in PM2.5 levels. It has also been found that the irregularity of urban land-use patterns can increase energy consumption and, therefore, is positively correlated with PM2.5 levels [23,24]. The results of the research by Yuan et al. [25] further suggest that sprawling urban forms are associated with higher PM2.5 levels. Similar findings can also be seen from the study by Marttins [26]. The results of a study by Lu and Liu [27] also suggest that compact urban forms can reduce air pollution due to the higher rate of clustering among industrial enterprises. Above all, these studies were conducted for one specific city/region or over a short period, which limits our understanding of the impact of the city form on the PM2.5 levels at the national level. However, regional differences between urban forms and PM2.5 concentrations at the national level are far from explained. Therefore, this paper will focus on this topic from the perspective of regional differences in China.
In this study, 343 cities were selected from 31 provinces in China to analyze the influence of the urban form on PM2.5 concentrations. Firstly, the cities were divided into four regions (namely, northeast, central, eastern, western) across China. Secondly, five landscape metrics (i.e., total landscape area (TA), mean perimeter/area ratio (PARA_MN), landscape shape index (LSI), largest patch index (LPI), landscape division index (DIVISION)) were utilized to quantify and analyze the urban landscape patterns of the various cities. Thirdly, in this study, after completing all estimates, we employed panel-data models to estimate the associations between the urban landscape patterns and the PM2.5 levels. Through the above analysis, we believe that the results are beneficial for us to better understand the intensity and direction of the effect of the urban form on PM2.5 concentrations.

2. Materials and Methods

2.1. Study Area

To deal with the regional heterogeneity in the influences of a range of factors on the PM2.5 levels, 343 cities, which are located in 31 provinces in mainland China, were selected. These were divided into four geographical research units: the northeast region, central region, western region, and eastern region. The northeast region covers 3 provinces (Liaoning <1>, Jilin <2>, and Heilongjiang <3>), the central region covers 6 provinces (Hunan <4>, Hubei <5>, Henan <6>, Shanxi <7>, Anhui <8>, and Jiangxi <9>), the western region covers 12 provinces (Chongqing <10>, Guangxi <11>, Guizhou <12>, Gansu <13>, Qinghai <14>, Shannxi <15>, Sichuan <16>, Tibet <17>, Inner Mongolia <18>, Ningxia <19>, Xinjiang <20>, and Yunnan <21>), and the eastern region involves 10 provinces (Fujian <22>, Beijing <23>, Hainan <24>, Guangdong <25>, Jiangsu <26>, Hebei <27>, Shanghai <28>, Shandong <29>, Tianjin <30>, and Zhejiang <31>). The geographic locations of each region are described in Figure 1.

2.2. Dataset

This study utilized data from the China Land Use/Cover Dataset (CLUD) to obtain the urban land-use areas in each study area for the years 2000, 2005, 2010, and 2015. The CLUD dataset is calculated by the Chinese Academy of Sciences with scenes data, such as Landsat ETM scenes and Landsat TM scenes, with a spatial resolution of 1 km × 1 km. The detailed methods for acquiring the areas of urban land use are available in Fang et al. [28]. The data on the PM2.5 concentrations (denoted by the annual concentration) used in this paper are freely available as a public good from the Dalhousie University Atmospheric Composition Analysis Group, at a high spatial resolution of 1 km × 1 km, and were estimated by combining the data retrieved from the aerosol optical depth (AOD) of the moderate resolution imaging spectroradiometer (MODIS) products of the National Aeronautics and Space Administration (NASA), and multiangle imaging spectroradiometer (MISR) instruments with aerosol vertical profiles and scattering properties that were simulated by the GEOS-Chem chemical transport model [29]. Published articles have demonstrated that satellite products can provide data and technical support for the government in atmospheric environmental governance [30].
Landscape metrics are important in the effective evaluation of urban landscape patterns [31,32]. This study employed five frequently utilized landscape metrics to describe the urban landscape patterns of urban areas by describing their extension, shape complexity, and compactness [33,34,35]. The extension is calculated from the means of the total landscape areas (TAs). The TA, which is the foundation for calculating the other landscape metrics, refers to the total areas of all patches and is used to represent the size (or extent) of the urban land use. The landscape shape index (LSI) and the mean perimeter/area ratio (PARA_MN) are generally employed to denote the shape complexity of patches. The PARA_MN is utilized to calculate the ratio of the patch perimeter to the total area, and this measure increases as the irregularity of the landscape shape increases. The LSI is obtained by modifying the perimeter/area ratio of the total areas. When the LSI is equal to 1, this indicates that the landscape has the most regular shape possible, or that a specific patch type is regular [36]. Compactness, which is employed to measure the agglomeration of the landscape, was represented in this study by way of the division index (DIVISION) and the largest patch index (LPI). The DIVISION denotes the fragmentation of the landscape. The DIVISION has a negative relationship with the compactness of the urban landscape. The LPI denotes the proportion of the largest patch to the total landscape area, thereby denoting the size of the urban core. The LPI ranges from 0 to 100, representing a small to large core [37]. The five selected landscape metrics listed above were calculated using Fragstats4.2. The specific description and mathematical equation for each of the five metrics are presented in Table 1.

2.3. The Panel-Data Model

A panel-data model was utilized to measure the influence of the urban form on the PM2.5 concentrations. The panel-data model can better control individual heterogeneity, reduce the collinear problem between variables, increase the degree of freedom, and increase the stability and reliability of the estimated coefficients in comparison with other data models, such as cross-section data and timeseries data [35]. The fixed-effects model and the random-effects model are the two main kinds of panel-data-regression models. The fixed-effects model is a special type of the least-squares dummy-variable model compared to the random-effects model. In the random-effects method, unobservable and time-invariant factors for each observation unit are treated as part of the disturbances, and it thereby assumes that their correlation with the regressors is zero: this is the null hypothesis of the Hausman test [38]. If the Hausman test result rejects the null hypothesis, then the random-effects model confers the advantage of greater efficiency over the fixed-effects model. Otherwise, the fixed-effects model should be applied. The purpose of this study was to analyze the effects of the five landscape metrics on the PM2.5 concentrations in China. In this paper, the results of the random-effects model by the Hausman test rejected the null hypothesis at 1% levels. The model can be specified as follows:
P M i t = α 0 + α 1 T A i t + α 2 L S I i t + α 3 P A R A _ M N i t + α 4 L P I i t + α 5 D I V I S I O N i t + ε i t
where PMit denotes the PM2.5 levels of city i in year t, the intercepts are denoted by α0, and α1 to α5 stand for the coefficients. TA denotes total landscape area, LSI stands for landscape shape index, PARA_MN represents mean perimeter/area ratio, LPI stands for the proportion of the largest patch to the total landscape area, and DIVISION denotes the landscape division index. ε represents the random error, and t and i denote the year and city, respectively.

3. Results

3.1. Statistical Characteristics

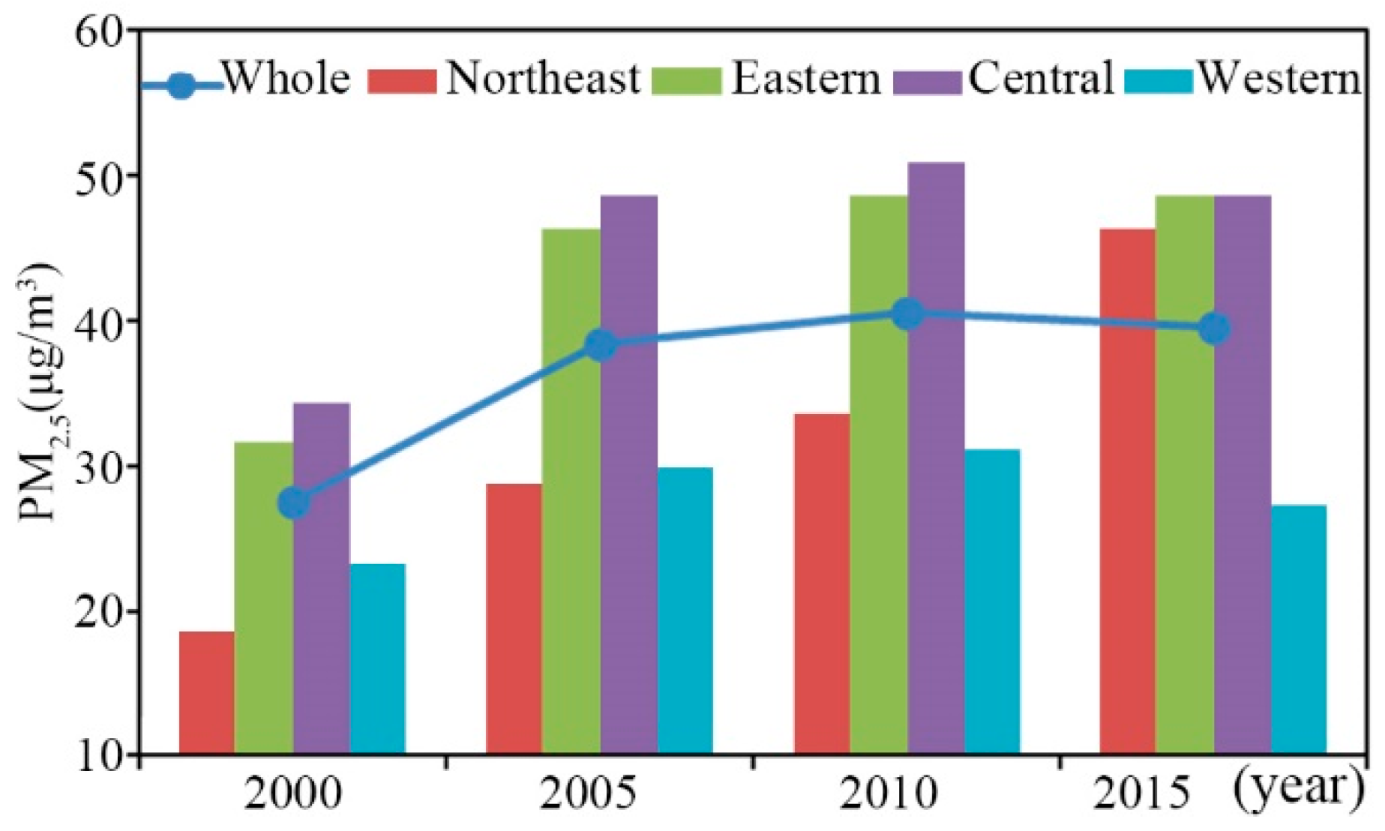
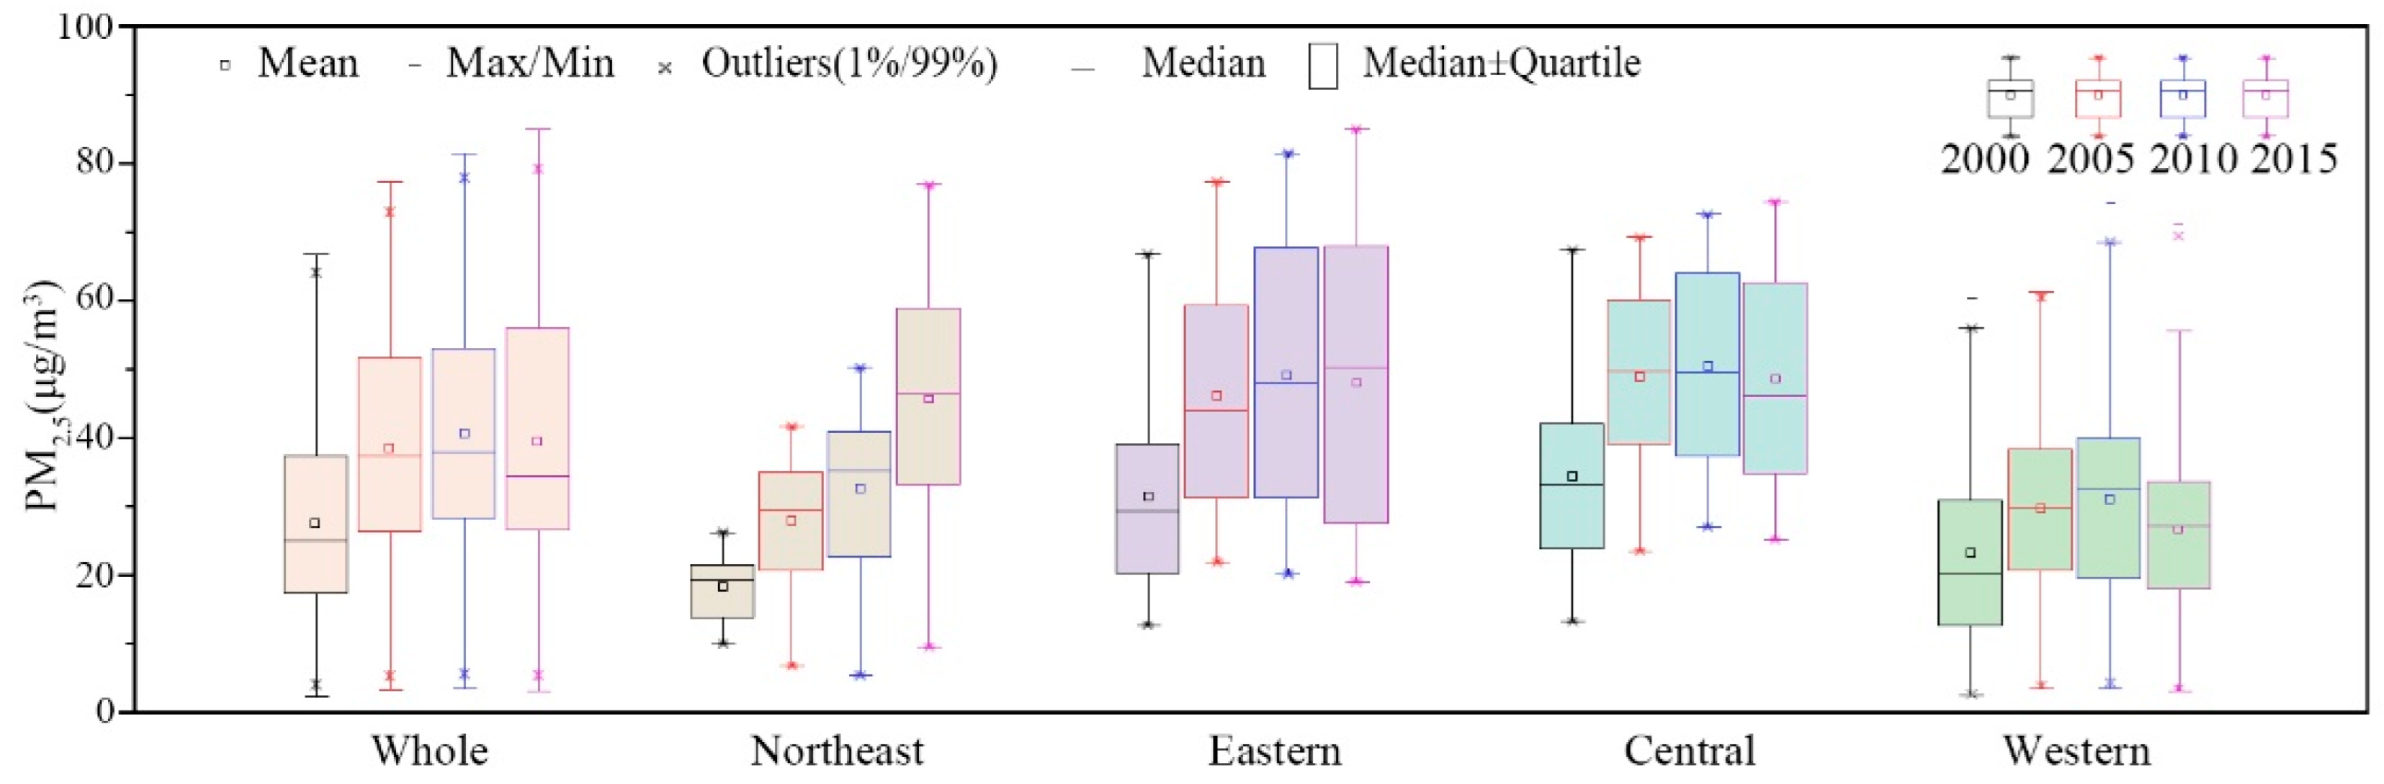
3.1.1. PM2.5 Concentrations

As shown in Table 2, the middle of the PM2.5 concentrations averaged over the 343 cities increased from 25.0 μg/m3 to 34.4 μg/m3 over 16 years. From 2000 to 2010, the mean of the annual average of the PM2.5 concentrations continued to rise, but it declined from 2010 to 2015. The reason may be China’s new ambient air quality standards in 2012 (the name of this GuoBiao is the GB3095-2012 Ambient Air Quality Standards), in which the PM2.5 concentrations were also assessed. The measure is beneficial to limiting the rise in the PM2.5 concentrations. The standard-deviation increase from 13.5 to 18.7 indicates that the differences in the PM2.5 levels across the country increased over the period, and the imbalance between the regions in terms of the PM2.5 levels widened.
Figure 2 shows the averaged PM2.5 concentrations for the different regions from 2000 to 2015. For central China, the averaged PM2.5 concentrations increased from 33.47 μg/m3 in 2000 to 47.20–50.00 μg/m3 in 2005 and 2010, and they stayed at a similar level or even slightly decreased in 2015 (48.03 μg/m3). For eastern and western China, the averaged PM2.5 concentrations had a similar trend as central China, growing from 2000 to 2010, and falling in 2015, while, for northeastern China, the PM2.5 concentrations increased almost linearly, from 18.50 μg/m3 in 2000 to 45.89 μg/m3 in 2015. Among the four regions, central China maintained the highest PM2.5 levels, followed by eastern China. Before 2005, the western region had higher PM2.5 levels than the northeast region; however, after 2010, the western region was the lowest out of all four regions. In contrast, the PM2.5 levels were characterized by an increasing trend between 2000 and 2015, and especially after 2010 in the northeast region. This reflects the launch of a national strategy to revitalize the old industrial base of northeast China in 2003, which promoted the development of the northeast region, and prompted economic growth to rise in 2008. As a region characterized by a development mode that is dominated by heavy industry, the revitalization of northeast China led to increases in the resource and energy consumption, which eventually led to a rapid rise in the PM2.5 levels.
The results illustrated in Figure 3 show that the PM2.5 levels in China continued to increase from 2000 to 2015 in all of China. The degree of the dispersion of the PM2.5 levels in 2015 was much higher than it was in 2000 for all regions, indicating that regional differences were becoming increasingly large. For example, in the northeast region, the annual average peak level of PM2.5 was 26.50 μg/m3 in 2000, compared with 77.03 μg/m3 in 2015; this means that the differences within the northeast region were constantly increasing. The eastern region was revealed to have the highest annual average PM2.5 levels during the period from 2000 to 2015, and the annual average peak levels were 66.85 μg/m3 and 84.99 μg/m3, respectively. The PM2.5 levels of the central region, which were only lower than the eastern region, remained at a high level throughout the study period, and the annual average peak levels of PM2.5 were 67.4 μg/m3 and 74.45 μg/m3 from 2000 to 2015. According to the dispersion degree, which is represented by the value of the median±quartile, the eastern and central regions not only had increased PM2.5 levels, but they also demonstrated an obvious imbalance in the PM2.5 concentrations within their regions. In comparison, the annual average peak levels of PM2.5 in the western region actually decreased from 2010 (74.27 μg/m3) to 2015 (60.06 μg/m3), which was similar to the annual average peak in 2000 (60.29 μg/m3), which demonstrates that the PM2.5 levels were relatively stable in the western region.

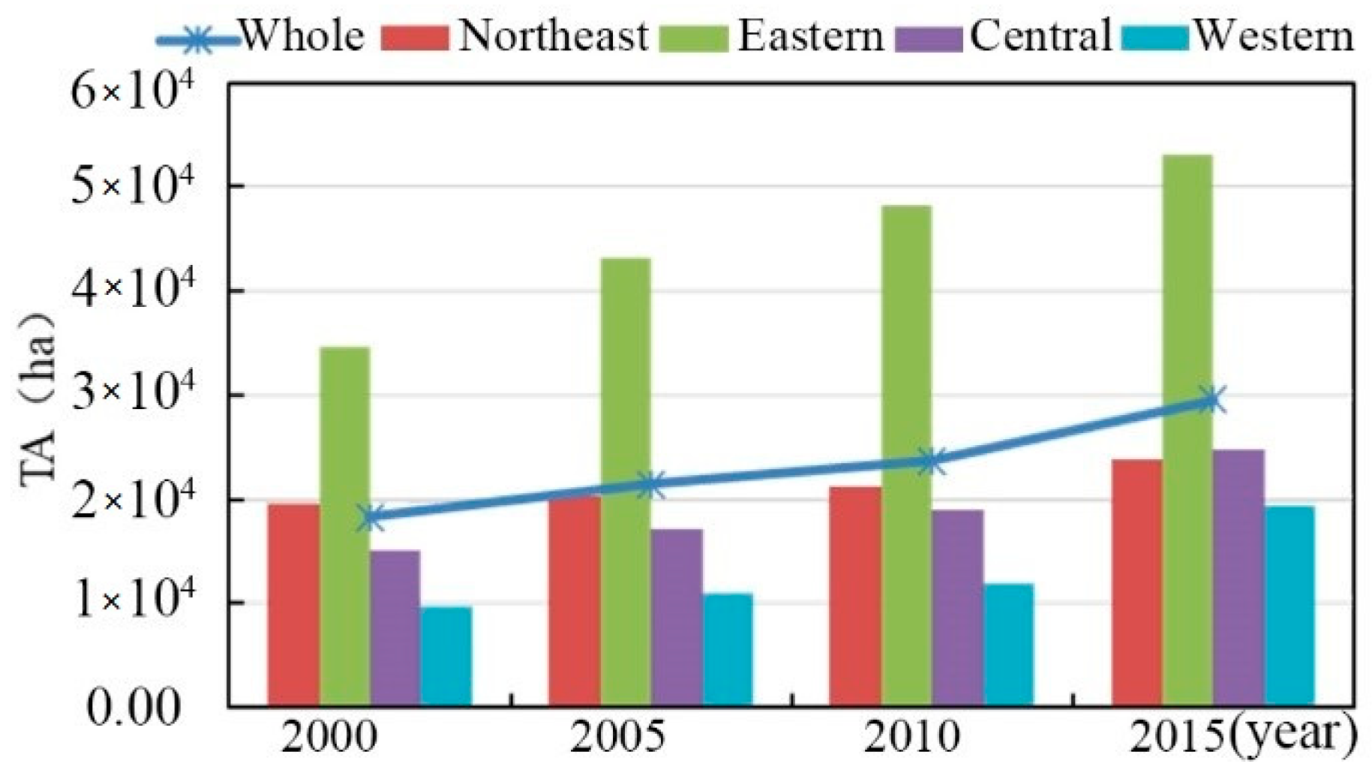
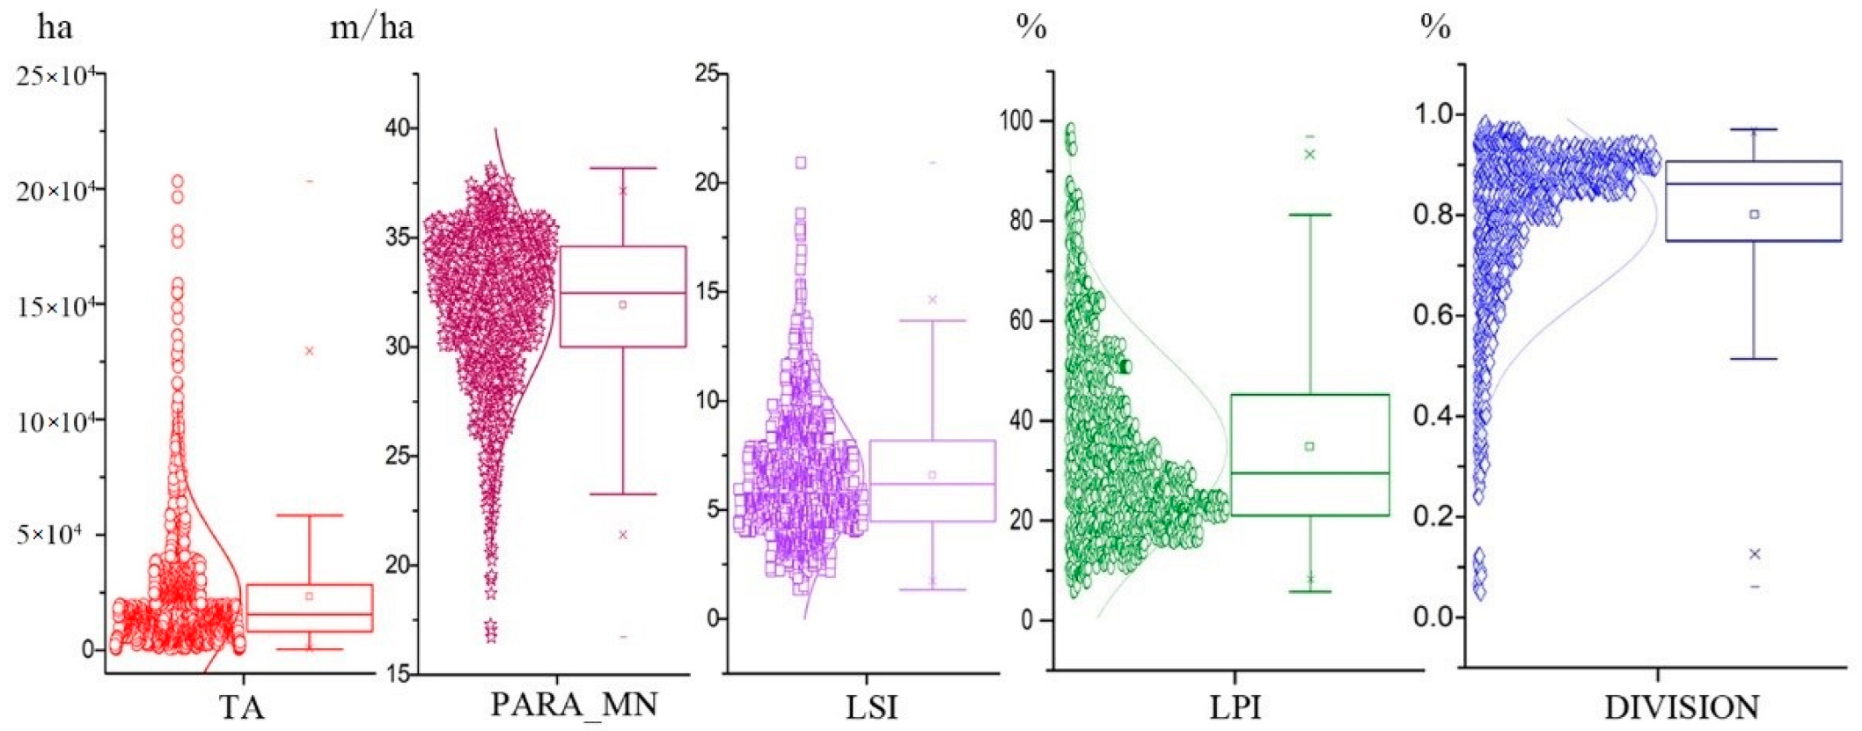
3.1.2. Statistical Characteristics of Urban Landscape Pattern

In this paper, we employed the TA metric to represent the urban extension. As is shown in Table 3, the mean value of the urban extension for the whole study sample was from 18,292.1 km2 to 29,597.9 km2, which is a significant 1.6-fold increase. Meanwhile, the level of growth in 2010–2015 was the highest from 2000 to 2015. According to the evolution of the standard deviation, which increased from 19,720.2 to 28,554.0, a great deal of heterogeneity existed in the urban extension values nationwide, and the range of this difference widened during the study period, indicating that the variations in the urban landscape patterns continued to grow.
In Figure 4, the highest average TA values were in 2015 for all regions. They were 53,094 ha in eastern China, 24,809 ha in central China, 23,861 ha in northeast China, and 19,420 ha in western China.
The eastern region maintained a higher average TA value than the other three regions from 2000 to 2015, while the lowest average TA values were in the western region, with 9714 ha in 2000 and 19,420 ha in 2015. In terms of the change trends, the growth in the average TA value of the nation from 18,292 ha in 2000 to 29,597 ha in 2015 is characterized by continuous increase. Central and northeast China are in the middle and are slightly below the national average TA value. Notably, the average TA value in the central region (15,047 ha) was lower than that in the northeast region (19,522 ha) in 2000; however, in 2015, the average TA value in the central region was 24,809 ha, which was 948 ha higher than the northeast region. From the perspective of the relative differences in the average expansion of each region, the rate of expansion in the eastern region during the period of 2010–2015 decreased compared with the previous five years, during which it was 24.26%, while it was 10.29% during the period of 2010–2015. In contrast, the growth rates of the TA in the other three regions were higher in the period of 2010–2015 (e.g., northeast was 3.71%, central region was 13.48%, western region was 12.60%) than they were in the period from 2000 to 2005 (e.g., northeast was 12.20%, central region was 31.27%, western region was 62.60%). This means that the differences between the four regions were narrowing.
Figure 5 shows the box charts of the five selected landscape metrics (TA, PARA_MN, LSI, LPI, and DIVISION), with scatter plots and distribution overlays, wherein the top and bottom of each box represent the 75th and 25th centiles, respectively. The TAs of most Chinese cities were less than 10 × 104 ha, while only a few cities had TAs greater than 10 × 104 ha. The PARA_MN was distributed, with a maximum of 38.19 m/ha and a minimum of 16.72 m/ha, indicating the considerable regional differences in China’s urban shape complexity. The distribution of the LSI was found to be below 20, and the highest was for Chongqing, which is a relatively complex mountain city. The LPI was distributed between 95.79% (Dongguan, with many kinds of factories in the city) and 5.19% (Yulin, a resource-based city). The DIVISION of most of the Chinese cities was more than 0.2%, while only Shihezi, Shenzhen, and Tongling had around 0.1%.

3.2. Estimation Results for Different Panel Models

Before building the panel-data models, we undertook a multicollinearity test. In Table 4, the correlation coefficient of the factors by Pearson were less than 0.5, which indicates that there was no multicollinearity in the data between any of the five landscape metrics. As such, the panel-data-model parameters could be estimated.
We employed Hausman tests to identify which estimator was more appropriate for which model. The results in Table 5 show that all of the models’ p-values were less than 0.05 (e.g., p-values were 0.0000 in four models; meanwhile, they were 0.0013 in the western China model). This means that the fixed-effects estimator was better than the random-effects estimator for Models 1 through 5, as the null hypothesis was rejected. Therefore, we selected the fixed-effects model to calculate the models.
In this study, we calculated five panel models to identify the different impacts of the urban form on the PM2.5 levels in the different regions making up the study area. Table 6 displays the findings of the estimation, which detail the influence of the urban landscape pattern on the PM2.5 concentrations in each of the four regions. A model of all of China was employed to examine the impacts of the urban form on the PM2.5 levels for the whole of China. The findings indicate that the TA, the p-value for which was significant at the 1% level, had a positive effect on the PM2.5 concentrations. The estimated coefficients of the PARA_MN and LSI are 1.389 and 0.541, respectively; this means that the two urban-shape-complexity indicators shown had a positive impact on the PM2.5 concentrations, which is a result that is similar to that in the existing literature [19]. The higher the LSI and PARA_MN, the more irregular the shape of the urban landscape—as such, the results from the whole China model can be interpreted as indicating that a more regular shape within the urban landscape pattern leads to lower PM2.5 concentrations. This is because complex urban shapes lead to duplication in the construction of infrastructure and an increase in the complexity of roads, which can bring about traffic jams. Traffic jams, in turn, have the unfortunate effect of increasing fuel consumption, which is an important source of PM2.5 levels [39]. The LPI and DIVISION are indicators that measure the urban compactness. In the whole China model, the LPI failed the significance test. The directions of the other indicator of compactness—DIVISION—were found to be positive, indicating that a compact urban landscape pattern was better at reducing the PM2.5 concentrations. This is because a compact structure improves accessibility and the travel efficiency of residents, reduces motor-vehicle dependence among residents, and, in turn, alleviates traffic congestion, which reduces incomplete combustion and improves the air quality [19,40].
Through the northeast China model, the TA with the estimated coefficient of 2.514, which denotes urban extension, maintained a positive effort in increasing the PM2.5 levels. Because of spatial mismatches between home and work, the lower job accessibility made a longer commute for suburban residents. The PARA_MN, whose estimated coefficient is 1.370, showed a positive impact on the PM2.5 levels, indicating that complex urban shapes heavily increase the PM2.5 levels. This can be attributed to the positive effect of irregular urban land use on energy consumption, which then increases the PM2.5 levels. The northeast region of China constitutes the old industrial base within China. Here, the development of industrial enterprises has accelerated the complexity of the urban landscape. A study by Xie et al. [41] also demonstrated the tendency for rapidly industrializing regions in Asia to be characterized by complex urban land-use patterns, which raises energy consumption. The indicator DIVISION denotes that the urban compactness had an estimated coefficient of 1.512, and this is shown to have exerted a positive impact on the PM2.5 concentrations. The estimation findings suggest that the compact urban landscape pattern has benefits for reducing the PM2.5 concentrations by improving the infrastructure utilization and reducing traffic times [42,43].
In the central China model, the TA had an estimated coefficient of 0.478, which signifies that the larger the extension of the urban land-use area, the higher the PM2.5 levels are likely to be. The PARA_MN and LSI, with estimated coefficients of 0.643 and 0.419, respectively, were found to have a positive influence on the PM2.5 levels at the 10% p-value significance; this means that the irregular urban landscape pattern increased the value of the PM2.5 concentrations. This is also observed in the existing literature, which has demonstrated that complex urban boundaries may reduce the accessibility to public transportation [44]. The daily living patterns between residences, workplaces, and shopping malls, and the traveling distances and times, may also increase. The estimated coefficients of the LPI and DIVISION are 0.353 and 0.309, respectively; this demonstrates that a compact urban landscape pattern is better at lowering the PM2.5 concentrations. Large volumes of research have posited that population density, compact dwellings, and job density are likely to save on energy consumption, electricity consumption, and travel times. Scholars have also found that a larger urban core can produce higher PM2.5 levels due to the tendency of traffic jams to occur in monocentric city forms [45]. Therefore, it can be concluded that compact urban landscapes with pedestrian-friendly street plans are of benefit to reducing vehicles and motorized travel [46,47,48].
From the eastern China model, we found that the TA, PARA_MN, LSI, and DIVISION were all positively correlated with the PM2.5 concentrations, and the estimated coefficients are 0.295, 3.034, 0.625, and 0.323, respectively. The results in the eastern China model show that urban extension had a positive effect on increasing the PM2.5 levels by increasing the resource consumption. As mentioned above, the higher the values of the PARA_MN and LSI, the more irregular the urban shape. Furthermore, irregular urban landscape patterns contribute to increasing PM2.5 concentrations. Meanwhile, the DIVISION denotes urban compactness: the lower the values of this indicator, the more compact the spatial pattern of an urban area. This means that compact urban patterns are of benefit in mitigating the PM2.5 levels in China’s eastern region. These results can be attributed to the fact that compact urban areas imply spatial patterns with mixed land use and efficient infrastructure use [49]. In addition, compact cities can encourage a decline in private car use due to the ability to provide efficient public transportation systems, developed walking networks, and convenient housing and employment connections, which, in turn, can save energy and reduce PM2.5 levels [35].
According to the results from the western China model, the PARA_MN and LSI, with estimated coefficients of 0.691 and 0.454, respectively, were shown to have a positive impact on the PM2.5 levels in the western region. The disorderly urban boundaries of the country’s western cities can further aggravate the damage to vegetation coverage, making the already loose surface structure more exposed, and aggravating the PM2.5 concentration caused by dust. The coefficients of the DIVISION, with the estimated coefficient of 0.146, exerted a positive influence, again reiterating the finding that cities with compact urban patches negatively impact the PM2.5 concentrations. As mentioned above, the higher the DIVISION, the more fragmented the urban landscape is. Hence, in the western region, the more compact the urban area, the greater the reduction in the PM2.5 concentrations. Due to the low technological level and limited foreign investment that characterize the western region of China, enterprises are not efficient, and resource development and utilization tend to not be rationalized. As a result, the decentralization of economic activities will further lead to aggravating environmental pressures and the deterioration of fragile land environments, and increase the infrastructure supply, all of which will increase the PM2.5 concentrations as a result.

4. Discussion

Our results suggest that the urban landscape pattern existed in the determinants of the PM2.5 concentrations of Chinses cities. For example, the indicator TA exerted a positive influence on the PM2.5 concentrations and was shown to have exerted the most force in the northeast region of China. This may be because northeast China developed by way of heavy industry, meaning that more industries were built in this part of the country. The presence of industries, in turn, exerts a strong effect on the PM2.5 levels [3]. However, there was no significant relationship between the TA and PM2.5 concentrations in western China. The possible reason is that the cities in the western region have low soil-water contents and extensive alluvial deposits, which is a complementary condition to the wind erosion of dust storms and increases the PM2.5 levels. The increased hard-bottoming area may reduce the occurrence of dust to reduce PM2.5 concentrations. Moreover, the indicators PARA_MN or LSI were found to positively impact the PM2.5 concentrations in all of the models except for the northeast China model, which demonstrates that an urban form with an irregular shape can increase the PM2.5 concentrations. For instance, in the eastern region, the strength of the coefficients was found to differ across the country, with the urban shape maintaining a greater influence on the variations in the PM2.5 levels (regression coefficient: 3.034) than in the other factors. The variables LPI and DIVISION, which denote urban compactness, exerted a positive influence on the PM2.5 levels in all the panel models, implying that an urban landscape with a compact structure is an effective asset in mitigating PM2.5 levels. A similar result can also be seen in the study by Clark et al. [18], which argues that the increasing percentage of the population living near the CBD was conducive to reducing the PM2.5 concentrations. Similar findings have also been demonstrated by Song et al. [50], who argue that “smart growth” is of benefit to reducing HC, CO, and NOx, which are the main substances that affect PM2.5 concentrations. The reason for this may be due to better accessibility, less driving time, less use of private cars, and a fuller utilization of infrastructures, all of which are obtained by means of a compact spatial pattern [51,52]. In addition, economic theories of agglomeration suggest that enterprises in compact cities are more conducive to technological progress and, thus, to the mitigation of PM2.5 levels [35].

5. Conclusions and Policy Implications

PM2.5 concentrations, which threaten ecosystems, visibility, and health, have been recognized as serious air pollution for the whole world. Despite a range of literature that addresses the determining influences of a range of factors, the correlation between the urban form and PM2.5 levels is not yet fully understood. The goal of this paper was to exam the nature of the relationship between the urban form and PM2.5 levels by employing panel data for four regions of China for the years 2000, 2005, 2010, and 2015. From the preceding statistical analysis, it was found that China’s PM2.5 levels transitioned from a period of rapid growth to a gradual flattening in the years 2000, 2005, 2010, and 2015, while, in the northeast of China, these levels continued to rapidly increase across the study period. Moreover, the urban landscape pattern was shown to experience significant changes across the study period, with differences being evident between the regions for the years 2000, 2005, 2010, and 2015. The parameter estimation from the panel-data models revealed that the urban landscape pattern has a significant influence on the PM2.5 concentrations of Chinses cities. For instance, in terms of the urban landscape pattern, in central China, eastern China, and western China, the key factor was the shape of urban areas, while, in northeast China, the most powerful indicator of interpretation was the TA, which was employed to denote urban expansion. However, there was no significant relationship between the TA and PM2.5 concentrations in western China. Although the strength and direction of the correlation coefficient was varied between the four regions, the results also highlight the important contributions made by urban planning and the optimization of spatial structures in mitigating PM2.5 levels. The empirical results of this paper may be beneficial for policymakers in planning new cities from the ground up in different ways.
Thus, a range of targeted policies can be drawn up on the basis of the findings of this empirical analysis for different regions. They are as follows. Firstly, in the central, eastern, and western regions, improving the regular geometries of cities can reduce the PM2.5 levels by improving the transportation efficiency and lowering energy consumption. Thus, planners in these regions should pay attention to the shape of urban areas on the basis of the strength of each estimation coefficient. Secondly, urban areas should not be expanded in a disorderly manner due to the positive-impact relationship between urban expansion and PM2.5 levels, and especially in the northeast region. Given this, urban planners should estimate optimal city sizes to mitigate PM2.5 levels. Furthermore, city authorities ought to prioritize the conservation of green areas and increase the green-area coverage, which could absorb PM2.5. Thirdly, our results suggest that compact structures assist in reducing PM2.5 levels. Thus, planners could employ the concepts of the “compact city” in their urban-planning activities, thereby highlighting mixed land uses, higher density, efficient infrastructures, and reduced energy consumption due to shorter travel times and easier access to local services and jobs. For example, cities in China’s central, eastern, and western regions should avoid disorderly development models, strengthen their urban development and planning-management capacities, and curb the air pollution caused by disorderly development. Cities in the northeast region should control the urban development boundaries and establish green belts outside the cities in order to adjust the extents of urban expansion. Moreover, all regions should avoid overly scattered urban development models, enhance urban compactness, develop compact urban spatial patterns by enhancing the connectivity and aggregation within cities, and thereby reduce the PM2.5 levels.
One of the limitations of this study is that the results may be affected by the brevity of the study period (2000, 2005, 2010, and 2015), which was ascribed to the fact that the PM2.5 concentration data and CLUD dataset were difficult to obtain for the year 2020. We also note that PM2.5 concentrations may, in turn, be drivers of the changes in urban forms, which was the challenge in exploring the relationship between PM2.5 concentrations and the urban form. Notwithstanding these restrictions, we believe that our results are beneficial for a better understanding of the impact of urban forms on PM2.5 concentrations, and can help achieve the task of establishing strategies in terms of planning new cities from the ground up in different ways. Clearly, beyond these benefits, additional work is needed. For example: What is the relationship between the PM2.5 concentrations and urban form in a single city? How do the PM2.5 concentrations affect urban forms?

Author Contributions

Conceptualization, S.W. and Z.W.; methodology, M.L. and J.C.; writing, Z.W. and J.C.; project administration, C.Z. All authors have read and agreed to the published version of the manuscript.

Funding

This work was supported by the National Social Science Foundation of China [17BRK010]; the Ministry of education humanities and social science research youth fund projects [20YJCZH009]; the Guangdong Special Support Group; the Pearl River S&T Nova Program of Guangzhou (201806010187); and the China Scholarship Council (201806385014).

Institutional Review Board Statement

Not applicable.

Informed Consent Statement

Not applicable.

Data Availability Statement

The raw data can be found on the following web sites: http://fizz.phys.dal.ca/~atmos/martin/?page_id=140 and http://www.resdc.cn/ (accessed on 10 March 2022).

Conflicts of Interest

The authors declare no conflict of interest.

References

  1. Cohen, A.J.; Anderson, H.R.; Ostro, B.; Pandey, K.D.; Krzyzanowski, M.; Kunzli, N.; Gutschmidt, K.; Pope, A.; Romieu, I.; Samet, J.M.; et al. The Global Burden of Disease due to Outdoor Air Pollution. J. Toxicol. Environ. Health A 2005, 68, 1301–1307. [Google Scholar] [CrossRef]
  2. Guo, Y.; Jia, Y.; Pan, X.; Liu, L.Q.; Wichmann, H.E. The association between fine particulate air pollution and hospital emergency room visits for cardiovascular diseases in Beijing, China. Sci. Total Environ. 2009, 407, 4826–4830. [Google Scholar] [CrossRef]
  3. Chen, J.; Zhou, C.S.; Wang, S.J.; Hu, J.C. Identifying the socioeconomic determinants of population exposure to particulate matter (PM2.5) in China using geographically weighted regression modeling. Environ. Pollut. 2018, 241, 494–503. [Google Scholar] [CrossRef]
  4. Shi, K.F.; Wang, H.; Yang, Q.Y.; Wang, L.; Sunl, X.F.; Li, Y.Q. Exploring the relationships between urban forms and fine particulate (PM2.5) concentration in China: A multi-perspective study. J. Clean Prod. 2019, 231, 990–1004. [Google Scholar] [CrossRef]
  5. Tao, Y.; Zhang, Z.; Ou, W.X.; Guo, J.; Pueppke, S.G. How does urban form influence PM2.5 concentrations: Insights from 350 different-sized cities in the rapidly urbanizing Yangtze River Delta region of China, 1998-2015. Cities 2020, 98, 102581. [Google Scholar] [CrossRef]
  6. Feng, Q.; Gauthier, P. Untangling Urban Sprawl and Climate Change: A Review of the Literature on Physical Planning and Transportation Drivers. Atmosphere 2021, 12, 547. [Google Scholar] [CrossRef]
  7. Huang, Q.Y.; Xu, C.; Jiang, W.Y.; Yue, W.C.; Rong, Q.Q.; Gu, Z.H.; Su, M.R. Urban compactness and patch complexity influence PM2.5 concentrations in contrasting ways: Evidence from the Guangdong-Hong Kong-Macao Greater Bay Area of China. Ecol Indic. 2021, 133, 108407. [Google Scholar] [CrossRef]
  8. Aguilera, A.; Bautista-Hernandez, D.; Bautista, F.; Goguitchaichvili, A.; Cejudo, R. Is the Urban Form a Driver of Heavy Metal Pollution in Road Dust? Evidence from Mexico City. Atmosphere 2021, 12, 266. [Google Scholar] [CrossRef]
  9. Zhao, X.L.; Zhou, W.Q.; Wu, T.; Han, L.J. The impacts of urban structure on PM2.5 pollution depend on city size and location. Environ. Pollut. 2022, 292, 118302. [Google Scholar] [CrossRef]
  10. Huang, R.J.; Zhang, Y.L.; Bozzetti, C.; Ho, K.F.; Cao, J.J.; Han, Y.M.; Daellenbach, K.R.; Slowik, J.G.; Platt, S.M.; Canonaco, F.; et al. High secondary aerosol contribution to particulate pollution during haze events in China. Nature 2014, 7521, 218–222. [Google Scholar] [CrossRef] [Green Version]
  11. Battaglia, M.A.; Douglas, S.; Hennigan, C.J. Effect of the urban heat island on aerosol pH. Environ. Sci. Technol. 2017, 22, 3095–13103. [Google Scholar] [CrossRef]
  12. Larkin, A.; van Donkelaar, A.; Geddes, J.A.; Martin, R.V.; Hystad, P. Relationships between changes in urban characteristics and air quality in East Asia from 2000 to 2010. Environ. Sci. Technol. 2016, 17, 9142–9149. [Google Scholar] [CrossRef] [Green Version]
  13. Ullah, M.; Li, J.; Wadood, B. Analysis of Urban Expansion and its Impacts on Land Surface Temperature and Vegetation Using RS and GIS, A Case Study in Xi’an City, China. Earth Syst. Environ. 2020, 4, 583–597. [Google Scholar] [CrossRef]
  14. Sheng, Q.Q.; Zhang, Y.L.; Zhu, Z.L.; Li, W.Z.; Xu, J.Y.; Tang, R. An experimental study to quantify road greenbelts and their association with PM2.5 concentration along city main roads in Nanjing, China. Sci. Total Environ. 2019, 667, 710–717. [Google Scholar] [CrossRef]
  15. Deng, S.X.; Ma, J.; Zhang, L.L.; Jia, Z.K.; Ma, L.Y. Microclimate simulation and model optimization of the effect of roadway green space on atmospheric particulate matter. Environ. Pollut. 2019, 246, 932–944. [Google Scholar] [CrossRef]
  16. Forman, R.; Godron, M. Landscape Ecology; Wiley: New York, NY, USA, 1986. [Google Scholar]
  17. Wang, S.J.; Wang, J.Y.; Fang, C.L.; Li, S.J. Estimating the impacts of urban form on CO2 emission efficiency in the Pearl River Delta, China. Cities 2019, 85, 117–129. [Google Scholar] [CrossRef]
  18. Clark, L.P.; Millet, D.B.; Marshall, J.D. Air Quality and Urban Form in U.S. Urban Areas: Evidence from Regulatory Monitors. Environ. Sci. Technol. 2011, 45, 7028–7035. [Google Scholar] [CrossRef]
  19. Bereitschaft, B.; Debbage, K. Urban form, air pollution, and CO2 emissions in large U.S. metropolitan areas. Prof. Geogr. 2013, 65, 612–635. [Google Scholar] [CrossRef]
  20. Liu, Y.P.; Wu, J.G.; Yu, D.Y.; Ma, Q. The relationship between urban form and air pollution depends on seasonality and city size. Environ. Sci. Pollut. Res. 2018, 25, 15554–15567. [Google Scholar] [CrossRef]
  21. Su, W.; Lai, X.Y.; Lai, S.N.; Gu, X.R.; Zhang, Z.J.; Zhang, S.J.; Huang, G.X.; Liu, Y.Q. Spatiotemporal variations of atmospheric PM2.5 and PM10 in Nanchang and its correlation with landscape pattern. Acta Sci. Circumstantiate 2017, 7, 2431–2439. [Google Scholar]
  22. Lu, D.B.; Mao, W.L.; Yang, D.Y.; Zhao, J.N.; Xu, J.H. Effects of land use and landscape pattern on PM2.5 in Yangtze River Delta, China. Atmos. Pollut. Res. 2018, 9, 705–713. [Google Scholar] [CrossRef]
  23. Chen, Y.M.; Li, X.; Zheng, Y.; Guan, Y.Y.; Liu, X.P. Estimating the relationship between urban forms and energy consumption: A case study in the Pearl River Delta, 2005–2008. Landsc. Urban Plan. 2011, 102, 33–42. [Google Scholar] [CrossRef]
  24. Xu, S.C.; Zhang, W.W.; Li, Q.B.; Zhao, B.; Wang, S.X.; Long, R.Y. Decomposition analysis of the factors that influence energy related air pollutant emission changes in China Using the SDA Method. Sustainability 2017, 9, 1742. [Google Scholar] [CrossRef] [Green Version]
  25. Yuan, M.; Song, Y.; Huang, Y.P.; Hong, S.J.; Huang, L.J. Exploring the Association between Urban Form and Air Quality in China. J. Plan. Educ. Res. 2018, 38, 413–426. [Google Scholar] [CrossRef]
  26. Martins, H. Urban compaction or dispersion? An air quality modelling study. Atmos. Environ. 2012, 54, 60–72. [Google Scholar] [CrossRef]
  27. Lu, C.; Liu, Y. Effects of China’s urban form on urban air quality. Urban Stud. 2016, 12, 2607–2623. [Google Scholar] [CrossRef]
  28. Fang, C.L.; Wang, S.J.; Li, G.D. Changing urban forms and carbon dioxide emissions in China: A case study of 30 provincial capital cities. Appl. Energy 2015, 158, 519–531. [Google Scholar] [CrossRef]
  29. Van, D.A.; Martin, R.V.; Brauer, M.; Hsu, N.C.; Kahn, R.A.; Levy, R.C.; Lyapustin, A.; Sayer, A.M.; Winker, D.M. Global estimates of fine particulate matter using a combined geophysical-statistical method with information from satellites, models, and monitors. Environ. Sci. Technol. 2016, 50, 3762–3772. [Google Scholar]
  30. Zhang, Z.; Zhang, M.; Bilal, M.; Su, B.; Zhang, C.; Guo, L. Comparison of MODIS- and CALIPSO-Derived Temporal Aerosol Optical Depth over Yellow River Basin (China) from 2007 to 2015. Earth Syst. Environ. 2020, 4, 535–550. [Google Scholar] [CrossRef]
  31. Huang, J.; Lu, X.X.; Sellers, J.M. A global comparative analysis of urban form: Applying spatial metrics and remote sensing. Landsc. Urban Plan. 2007, 82, 184–197. [Google Scholar] [CrossRef]
  32. Su, S.L.; Xiao, R.; Jiang, Z.L.; Zhang, Y. Characterizing landscape pattern and ecosystem service value changes for urbanization impacts at an eco-regional scale. Appl. Geogr. 2012, 34, 295–305. [Google Scholar] [CrossRef]
  33. Luck, M.; Wu, J. A gradient analysis of urban landscape pattern: A case study from the Phoenix metropolitan region, Arizona, USA. Landsc. Ecol. 2002, 17, 327–339. [Google Scholar] [CrossRef]
  34. Tv, R.; Aithal, B.H.; Sanna, D.D. Insights to urban dynamics through landscape spatial pattern analysis. Int. J. Appl. Earth Obs. 2012, 18, 329–343. [Google Scholar] [CrossRef]
  35. Li, S.J.; Zhou, C.S.; Wang, S.J.; Hu, J.C. Dose urban landscape pattern affect CO2 emission efficiency? Empirical evidence from megacities in China. J. Clean. Prod. 2018, 203, 164–178. [Google Scholar] [CrossRef]
  36. Wu, J.G.; Jenerette, G.D.; Buyantuyev, A.; Redman, C.L. Quantifying spatiotemporal patterns of urbanization: The case of the two fastest growing metropolitan regions in the United States. Ecol. Complex. 2011, 1, 1–8. [Google Scholar] [CrossRef]
  37. Liu, X.P.; Ou, J.P.; Chen, Y.M.; Wang, S.J.; Li, X.; Jiao, L.M.; Liu, Y.L. Scenario simulation of urban energy-related CO2 emissions by coupling the socioeconomic factors and spatial structures. Appl. Energy 2018, 238, 1163–1178. [Google Scholar] [CrossRef]
  38. Baltagi, B.H.; Bresson, G.; Pirotte, A. Fixed effects, random effects or Hausman–Taylor? Econ. Lett. 2003, 79, 361–369. [Google Scholar] [CrossRef]
  39. Hua, Y.; Cheng, Z.; Wang, S.X.; Jiang, J.K.; Chen, D.; Cai, S.Y.; Fu, X.; Fu, Q.Y.; Chen, C.H.; Xu, B.Y.; et al. Characteristics and source apportionment of PM2.5 during a fall heavy haze episode in the Yangtze River Delta of China. Atmos. Environ. 2015, 123, 380–391. [Google Scholar] [CrossRef]
  40. Cao, X.S.; Yang, W.Y.; Huang, X.Y. Accessibility and CO2 emissions from travel of smart transportation: Theory and empirical studies. Prog. Geog. 2015, 4, 418–429. [Google Scholar]
  41. Xie, Y.; Yu, M.; Bai, Y.; Xing, X. Ecological analysis of an emerging urban landscape pattern—Desakota: A case study in Suzhou China. Landsc. Ecol. 2006, 8, 1297–1309. [Google Scholar] [CrossRef]
  42. Liu, X.; Sweeney, J. Modelling the impact of urban form on household energy demand and related CO2 emissions in the Greater Dubin Region. Energy Policy 2012, 46, 359–369. [Google Scholar] [CrossRef]
  43. de Andrade, C.E.S.; D’Agosto, M.D. Energy use and carbon dioxide emissions assessment in the lifecycle of passenger rail system: The case of the Rio de Janeiro Metro. J. Clean. Prod. 2016, 126, 526–536. [Google Scholar] [CrossRef]
  44. Ma, J.; Liu, Z.; Chai, Y. The impact of urban form on CO2 emission from work and non-work trips: The case of Beijing, China. Habitat Int. 2015, 47, 1–10. [Google Scholar] [CrossRef]
  45. Makido, Y.; Dhakal, S.; Yamagata, Y. Relationship between urban form and CO2 emissions: Evidence from fifty Japanese cities. Urban Clim. 2012, 2, 55–67. [Google Scholar] [CrossRef] [Green Version]
  46. Krizek, K.J. Neighborhood services, trip purpose, and tour-based travel. Transportation 2003, 30, 387–410. [Google Scholar] [CrossRef]
  47. Khattak, A.J.; Rodriguez, D. Travel behavior in neo-traditional neighborhood developments: A case study in USA. Transport. Res. A 2005, 39, 481–500. [Google Scholar] [CrossRef]
  48. Wilson, B. Urban form and residential electricity consumption: Evidence from Illinois, USA. Landsc. Urban Plan. 2013, 115, 62–71. [Google Scholar] [CrossRef]
  49. Ye, H.; He, X.; Song, Y.; Li, X.; Zhang, G.; Lin, T.; Xiao, L. A sustainable urban form: The challenges of compactness from the viewpoint of energy consumption and carbon emission. Energy Build. 2015, 93, 90–98. [Google Scholar] [CrossRef]
  50. Song, Y.; Zhong, S.P.; Zhang, Z.T.; Chen, Y.P.; Rodriguez, D.; Morton, B. The relationship between urban spatial structure and PM2.5: Lessons learnt from a modeling project on vehicle emissions in Charlotte, USA. City Plan. Rev. 2014, 5, 9–14. [Google Scholar]
  51. Dieleman, F.; Dijst, M.; Burghouwt, G. Urban form and travel behaviour: Micro-level household attributes and residential context. Urban Stud. 2002, 3, 507–527. [Google Scholar] [CrossRef]
  52. Ewing, R.; Bartholomew, K.; Winkelman, S.; Walters, J.; Chen, D. Growing Cooler: The Evidence on Urban Development and Climate Change; Urban Land Institute: Chicago, IL, USA, 2007. [Google Scholar]
Figure 1. The spatial distribution of the four economic zones studied in China.
Atmosphere 13 00963 g001
Figure 2. The variation trend of PM2.5 concentrations in four economic zones and all of China (2000, 2005, 2010, 2015).
Atmosphere 13 00963 g002
Figure 3. The statistical characteristics of PM2.5 concentrations in the four regions (2000, 2005, 2010, 2015).
Atmosphere 13 00963 g003
Figure 4. The averages of the TAs (2000, 2005, 2010, 2015).
Atmosphere 13 00963 g004
Figure 5. Box charts of the five landscape metrics with scatter plots and distribution overlays.
Atmosphere 13 00963 g005
Table 1. Description of landscape metrics.
Category Landscape MetricEquationDescription
Urban extensionTotal (class) area (TA) T A = j = 1 n a i j ( 1 / 10000 ) αij = area (m2) of patch (ij)
(Range > TA > 0)
Urban shape complexity Mean perimeter/area
ratio (PARA_MN)
P A R A _ M N = i = 1 m j = 1 n ( P i j / α i j ) / m n Pij = perimeter (m) of patch (ij)
αij = area (m2) of patch (ij)
mn = the number of all landscape patch types
(range: PARA_MN > 0)
Landscape shape index (LSI) L S I = 0.25 k = 1 m E i k / T A Eik* = total length (m) of edge in landscape between class i and k, TA = total landscape area (m2)
(range: LSI ≥ 1)
Urban compactnessLargest patch index (LPI) L P I = m a x ( a i j ) / T A ( 100 ) αij = area (m2) of patch (ij)
TA = total landscape area (m2)
(range: 0 < LPI ≤ 100)
Landscape division index
(DIVISION)
D I V I S I O N = 1 i = 1 m j = 1 n ( a i j / T A ) 2 αij* = areas (m2) of patch (ij),
TA = total landscape area (m2)
(range: 0 ≤ DIVISION < 1)
Table 2. PM2.5 concentrations in main years, 2000, 2005, 2010, and 2015, averaged over the 343 cities.
YearMean
μg/m3
Median
μg/m3
Max
μg/m3
Min
μg/m3
Std. Dev.
μg/m3
SkewnessKurtosis
200027.5225.0267.402.3413.500.642.87
200538.4337.4377.323.3316.170.162.34
201040.6038.0081.473.3417.800.282.37
201539.5134.4284.992.9418.750.402.17
Table 3. TAs in main years: 2000, 2005, 2010, and 2015.
YearMean
ha
Median
ha
Max
ha
Min
ha
Std. Dev.
ha
SkewnessKurtosis
200018,292.1313,000154,90040019,720.233.0315.86
200521,451.6014,600181,40040023,639.752.8814.46
201023,656.8515,700196,30040025,991.402.7213.03
201529,597.9620,500203,10080028,553.962.4210.99
Table 4. Correlation coefficients of the factors by Pearson.
TALPIPARALSIDIVISION
TA1
LPI−0.069 **1
PARA0.021−0.129 ***1
LSI0.380 ***0.400−0.401 ***1
DIVISION0.089−0.410 ***0.116 ***−0.321 ***1
Note: *** p < 0.01, ** p < 0.05.
Table 5. Hausman test results.
Chi-Sq statisticp-Values
The whole China model (Model 1)38.390.0000
The northeast China model (Model 2)93.050.0000
The central China model (Model 3)71.250.0000
The eastern China model (Model 4)101.090.0000
The western China model (Model 5)64.600.0013
Table 6. Summary of the significant correlations between the PM2.5 concentrations and the five urban-form indicators derived from the different panel models.
Independent VariablesThe Whole China Model The Northeast China Model The Central China Model The Eastern China Model The Western China Model
TA0.145 ***2.514 ***0.478 ***0.295 ***0.054
(6.015)(5.743)(7.444)(4.476)(1.335)
PARA_MN1.389 ***1.370 ***0.653 **3.034 ***0.691 ***
(8.885)(3.041)(1.663)(5.159)(2.855)
LSI0.541 ***1.2310.419 **0.625 **0.454 ***
(5.590)(0.900)(1.842)(2.029)(3.152)
LPI0.7780.5960.353 ***0.1130.0.26
(1.548)(1.309)(2.771)(0.978)(0.319)
DIVISION0.162 ***1.512 ***0.309 ***0.323 **0.146 **
(2.631)(8.650)(2.581)(2.541)(1.981)
Estimation method
R-squared
FEFEFEFEFE
0.7810.8200.7770.7720.662
Note: *** p < 0.01, ** p < 0.05.
Publisher’s Note: MDPI stays neutral with regard to jurisdictional claims in published maps and institutional affiliations.

