Article

Hygroscopic Ground-Based Generator Cloud Seeding Design; A Case Study from the 2020 Weather Modification in Larona Basin Indonesia

National Research and Innovation Agency (Indonesia), B.J. Habibie Building 15th–24th Floor, Jl. M.H. Thamrin No. 8, Jakarta Pusat 10340, Indonesia
*
Authors to whom correspondence should be addressed.
Atmosphere 2022, 13(6), 968; https://doi.org/10.3390/atmos13060968
Submission received: 10 May 2022 / Revised: 9 June 2022 / Accepted: 12 June 2022 / Published: 15 June 2022

Abstract

:
Cloud seeding activities have been carried out in the form of experiments and operation activities as part of water resource management in some parts of the world. Recently, a new method of cloud seeding using a ground-based generator (GBG) was introduced in Indonesia. This method is used to seed orographic clouds with the aid of a 50 m GBG tower located in a mountainous area. By taking advantage of the topography and local circulation, the GBG tower will introduce hygroscopic seeding materials into orographic clouds to accelerate the collision and coalescence process within the clouds, increasing the cloud’s rainfall amount. The hygroscopic ground-based cloud seeding was conducted over the Larona Basin in Sulawesi, Indonesia, from December 2019 to April 2020. There were five towers installed around Larona Basin, located over 500 m above sea level. The results show that there was an increase in monthly rainfall amount from the GBG operation period in January, February, and March compared to its long-term average of as much as 79%, 17%, and 46%, respectively. Meanwhile, despite an increase of 0.4% in Lake Towuti water level, it is still not concluded that the GBG cloud seeding operation was involved in the lake water level raise. Therefore, more studies need to be performed in the future to answer whether the cloud seeding affected the lake water level.

1. Introduction

Understandably, water resources are principal in the mining industries. As one of the world’s largest laterite nickel mining operations, nickel production in Sorowako, Indonesia, is reliant on the availability of water from the lakes around Sorowako in Sulawesi to drive its hydropower facilities. However, low water levels in the lakes feeding the hydropower stations can limit the amount of hydropower produced. For this reason, rain enhancement using cloud seeding is something to consider to maintain the water levels in the lakes surrounding Sorowako. Previous studies on the precipitation efficiency of clouds show that cloud capacity to produce rainfall is affected by different factors. A study over an arid and semi-arid area (ASA) in Central and East Asia found that despite the significant increasing trend of the Liquid Water Path (LWP) and the Ice Water Path (IWP), the precipitation efficiency showed a decreasing trend. The researchers explained this problem as due to the abundant aerosols suspending over the ASA region, which acted as the ice nuclei that could suppress precipitation where the atmospheric moisture is extremely deficient [1]. Study of the cloud precipitation efficiency over the Tibetan Plateau showed that the IWP affected the precipitation more than the LWP. The study results also noted that higher CAPE and RH also played a significant role in the precipitation efficiency, which indicates it is directly affected by the convective precipitation [2].
In both the experiment and operation stages, cloud seeding has been applied to increase snowfall and rainfall and reduce the size of hail in many countries. By introducing a large amount of artificial aerosol particles into the clouds, two different seeding methods (hygroscopic and glaciogenic seeding) can be performed depending on the type of cloud and the objective of the cloud seeding [3]. Hygroscopic cloud seeding refers to dispersing hygroscopic seeding materials to warm-type clouds. Warm clouds are clouds with top heights below the 0 °C isotherm, where the dominant precipitation mechanism within the clouds is collision and coalescence. These clouds are primarily found in tropical regions. In a collision and coalescence process, hygroscopic seeding materials (e.g., hygroscopic flares or salts with sizes from 1 to >10 μm) are introduced as artificial cloud condensation nuclei (CCN) within the cloud base level [3,4,5,6,7]. This method broadens the cloud’s droplet size distribution by making the cloud’s natural CCN compete for vapor with the artificial CCN.
Ground-based hygroscopic cloud seeding is typically done with ground-based generators (GBG); this can be in the form of an air-based dispersion system for hygroscopic powders or a pyrotechnic hygroscopic flare [8,9,10,11,12,13,14,15]. A tower frame structure usually supports both methods. As mentioned, the seeding materials can either be hygroscopic flares or 1 to >10 μm-sized salt powders. The primary requirements for ground-based hygroscopic seeding operations are that they must be deployed in a mountainous region to target orographic clouds in the area, with the area’s relative humidity (RH) condition being >50%. In addition, the presence of significant valley winds with speeds > 2 m/s helps disperse seeding materials into the cloud base level [16,17,18,19,20].
A well-designed measurement program was then conducted to assess the feasibility of precipitation enhancement potential in the Sorowako region [21]. The feasibility study was carried out in the Sorowako region in 2005. It was a collaboration between the Agency for the Assessment and Application of technology/BPPT (Indonesia), International Nickel Indonesia (INCO), Weather Modification Inc. (WMI), North Dakota, USA, and the National Center for Atmospheric Research—Research Application Laboratory (NCAR/RAL), USA. The study aimed to obtain aerosol and microphysical measurements to see if cloud seeding could be beneficial and determine the optimal seeding method that might have the potential for enhancing precipitation in clouds in the region. The aerosol measurements showed that the total concentration of aerosol particles for clean background air was 750 cm−3, indicating moderately polluted air and the concentration peak near the plume. The cloud droplet concentration was around 140 and 400 cm3, with the highest near the cloud base. The results indicate that the warm rain precipitation process is effective in these clouds. The situations with warm cloud bases and a clean aerosol environment with small hygroscopic particles could potentially increase precipitation in Sorowako even with a small effect.
Weather modification research in Indonesia was started in 1979 to support the agricultural sector in Indonesia. Over time, the use of weather modification has grown in Indonesia, which includes the agriculture/irrigation sector, energy (filling power plant reservoirs), and the hydrometeorological disaster mitigation sector. During the last decade, the use of weather modification technology in Indonesia’s forest fire disaster management sector has multiplied, taking up aircraft resources that have disrupted other sectors of weather modifications. Therefore, research on alternative seedling materials was developed and applied. A ground-based generator is one alternative technology that has been developed and successfully applied in Indonesia. Among recent examples of ground-based seeding, one example was in the Larona Basin, Sorowako, in Sulawesi Indonesia, in 2019 [22] and 2020, which will be discussed in this paper.

2. Operational Design and Methods

As mentioned in the previous section, ground-based hygroscopic cloud seeding using a ground-based generator was developed in Indonesia for rain enhancement operations. The relatively low-cost ground-based cloud seeding can reach orographic clouds in mountainous regions and can be operated remotely, especially compared to aircraft-based cloud seeding. One of the weaknesses of ground-based seeding is that its operational effectiveness is limited by its effective operational range; hence, target clouds outside the GBG operational range cannot be seeded.
The GBG tower developed in Indonesia [23] is 50 m high and built from a galvanized iron metal triangle structure. The tower’s height is useful to reduce the effect of the wind vortex caused by the vegetation variety. Some vegetation can reach up to 25 m in height, such as pine trees, rubber trees, and teak trees. The galvanized iron was chosen as the tower material because it is strong and not easy to rust. The triangle structure with a side length of 30 cm is believed to be a simple and robust structure applied in tower GBG design.
GBG towers must be able to withstand a minimum weight of 26 kg. The weight of the load consists of a 15 kg flare basket structure, eight flares weighing 1 kg each, and a telecommand controller of about 3 kg. The bucket flare structure material is made from stainless iron. With the flares installed in the bucket and the assumption that only about two flares burn every day, the bucket can be reinstalled every four days, which means this is effective because most of the GBGs are installed in remote areas. The weight of the battery dominates the weight of the telecommand control; the battery used must last at least up to four days with one day being charged with a solar panel. The burning command is sent by short message service (SMS). This service was chosen because the internet service is difficult to find in remote areas. Figure 1 shows the GBG’s technical design, flare bucket, and electronic schematic ignition.
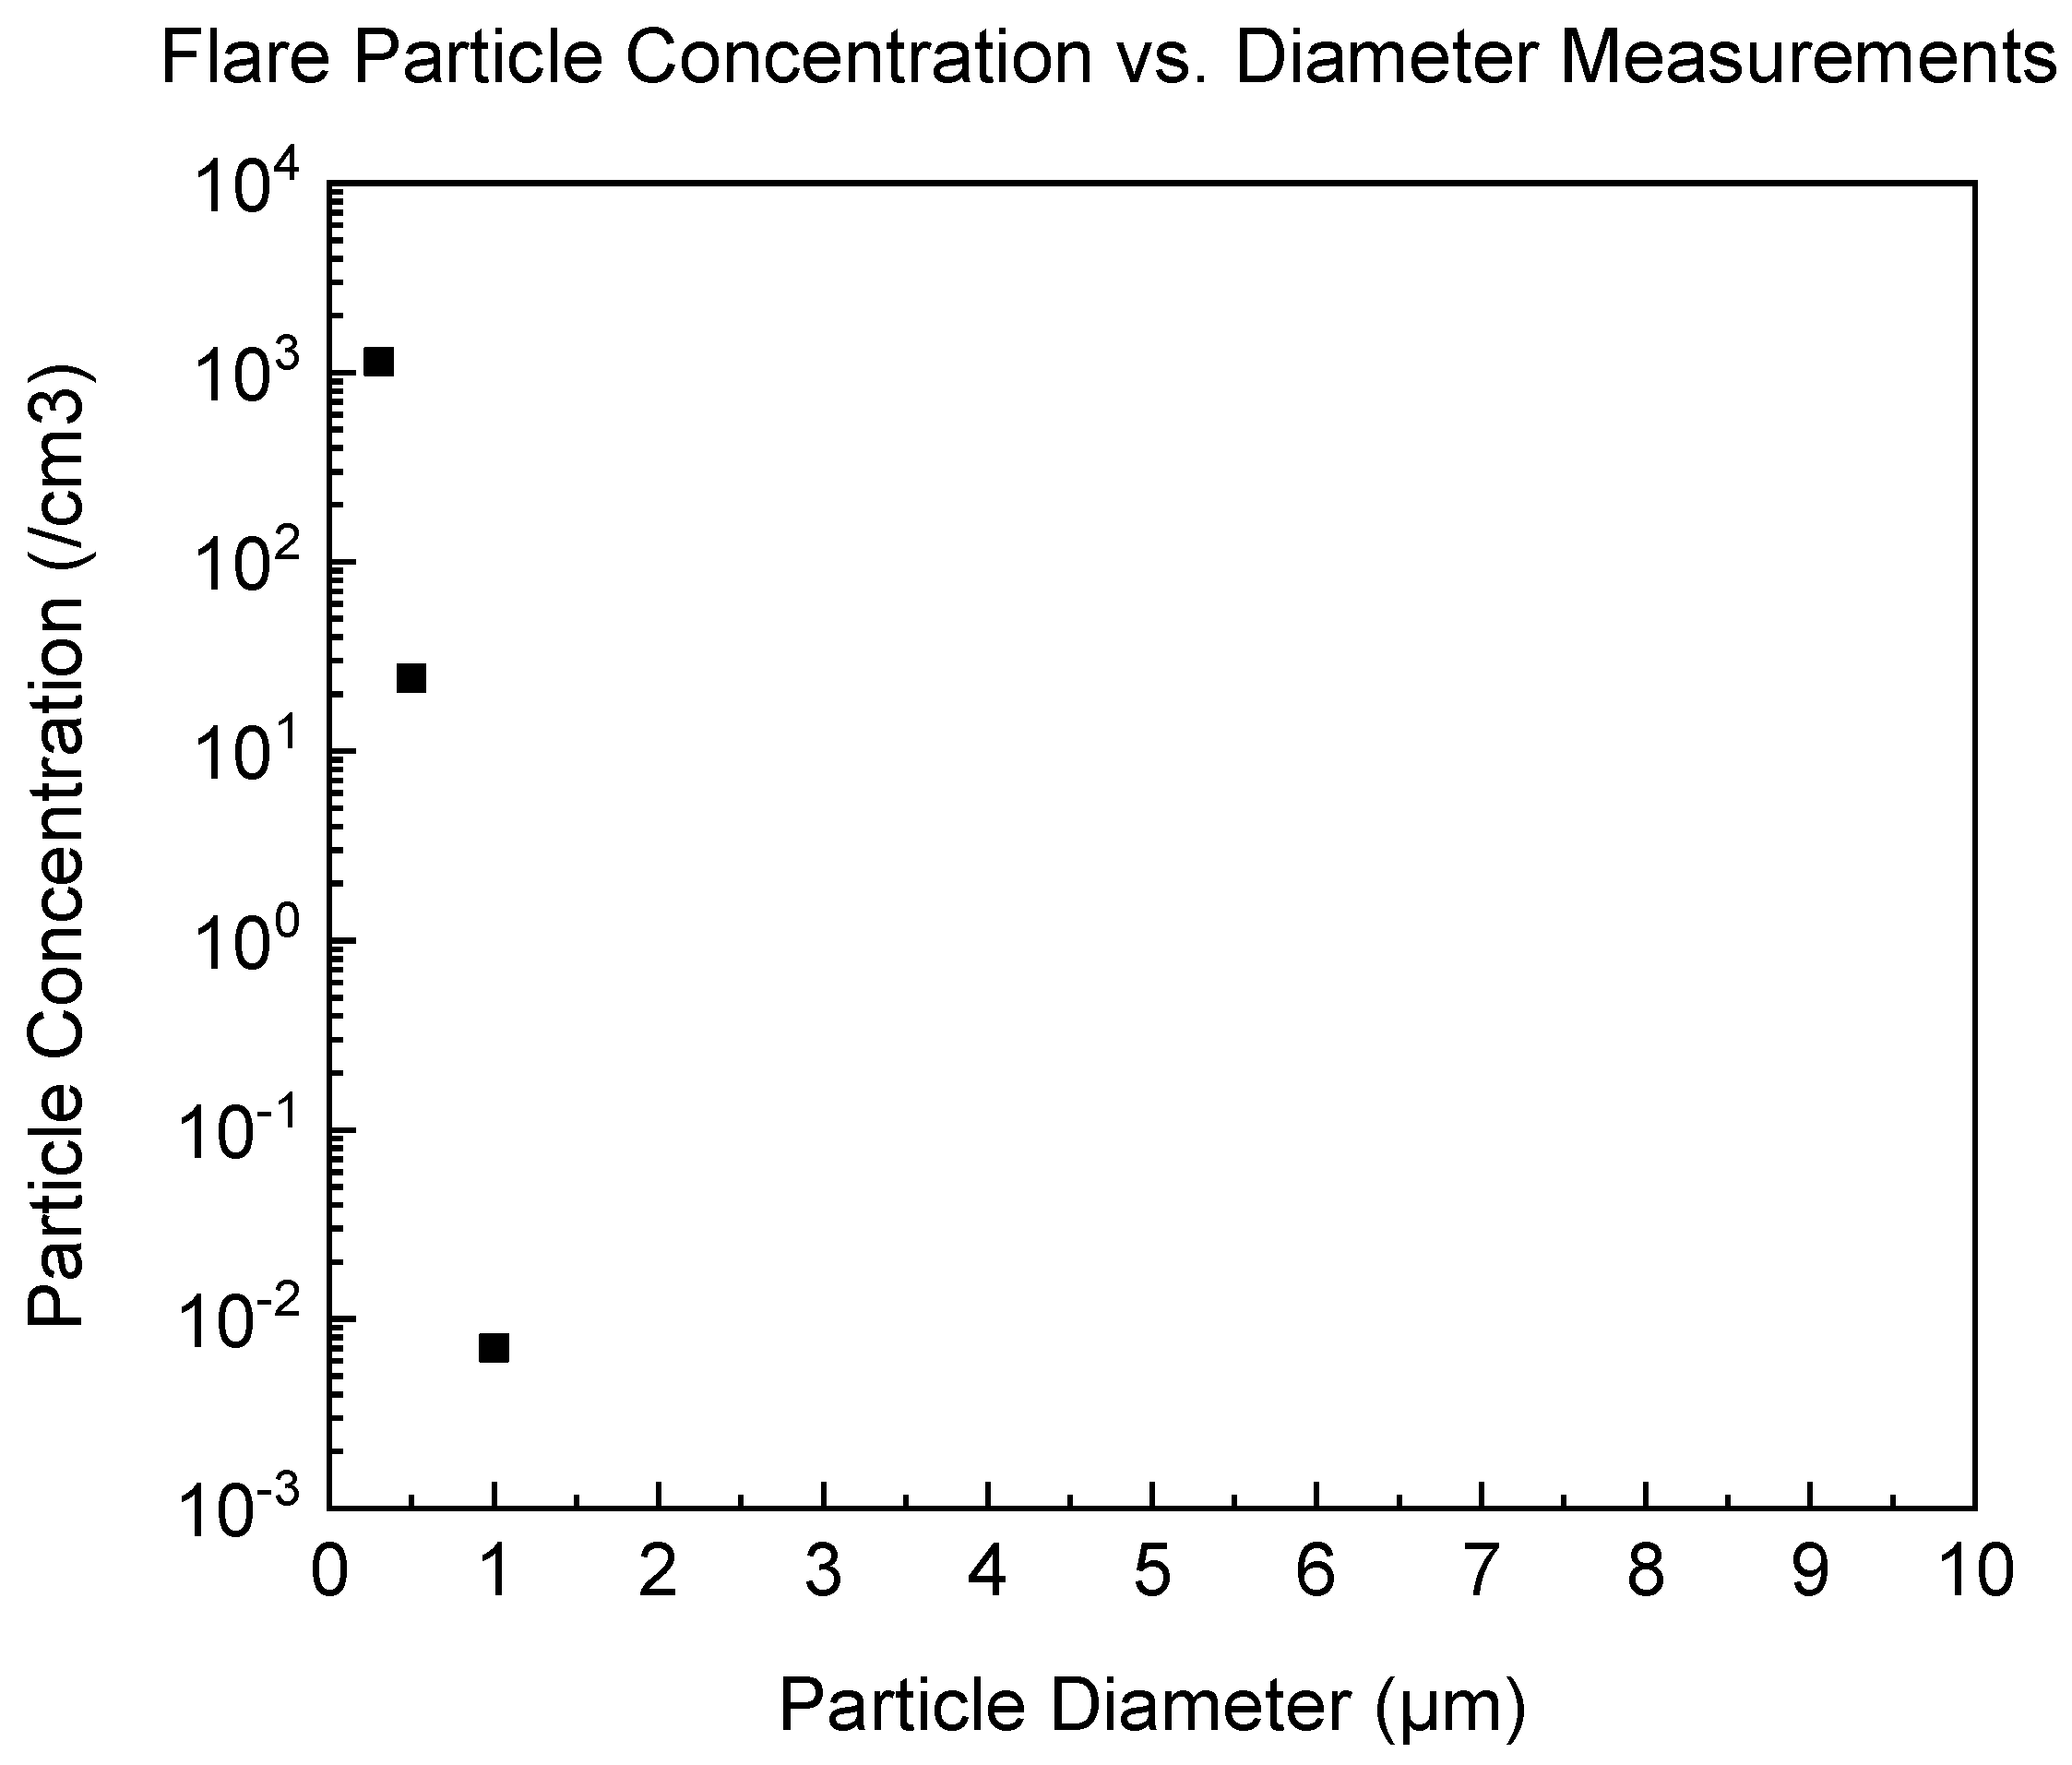
All of the GBGs use NaCl-based hygroscopic flares; this means that the flares use NaCl as hygroscopic seeding material [24]. Other materials contained within the flares are KClO4 and BaClO3-Ba(NO3)2 as oxidizing agents, together with Mg powders to ignite the flare. A measurement of the flare particle concentration with respect to its 0.3, 0.5, 1, 2.5, 5, and 10 μm diameters is shown in Figure 2 below. The measurement was performed with a Lighthouse Handheld 3016 airborne particle counter. The selected measurement diameters, i.e., 0.3, 0.5, 1, 2.5, 5, and 10 μm, were based on typical hygroscopic flare particle diameter measurements [3].
From Figure 2, it can be seen that the highest concentration of flare particles has a diameter of 0.3 μm, followed by 0.5 and 1 μm. However, the flare does not have particles with 2.5, 5, and 10 μm diameters.
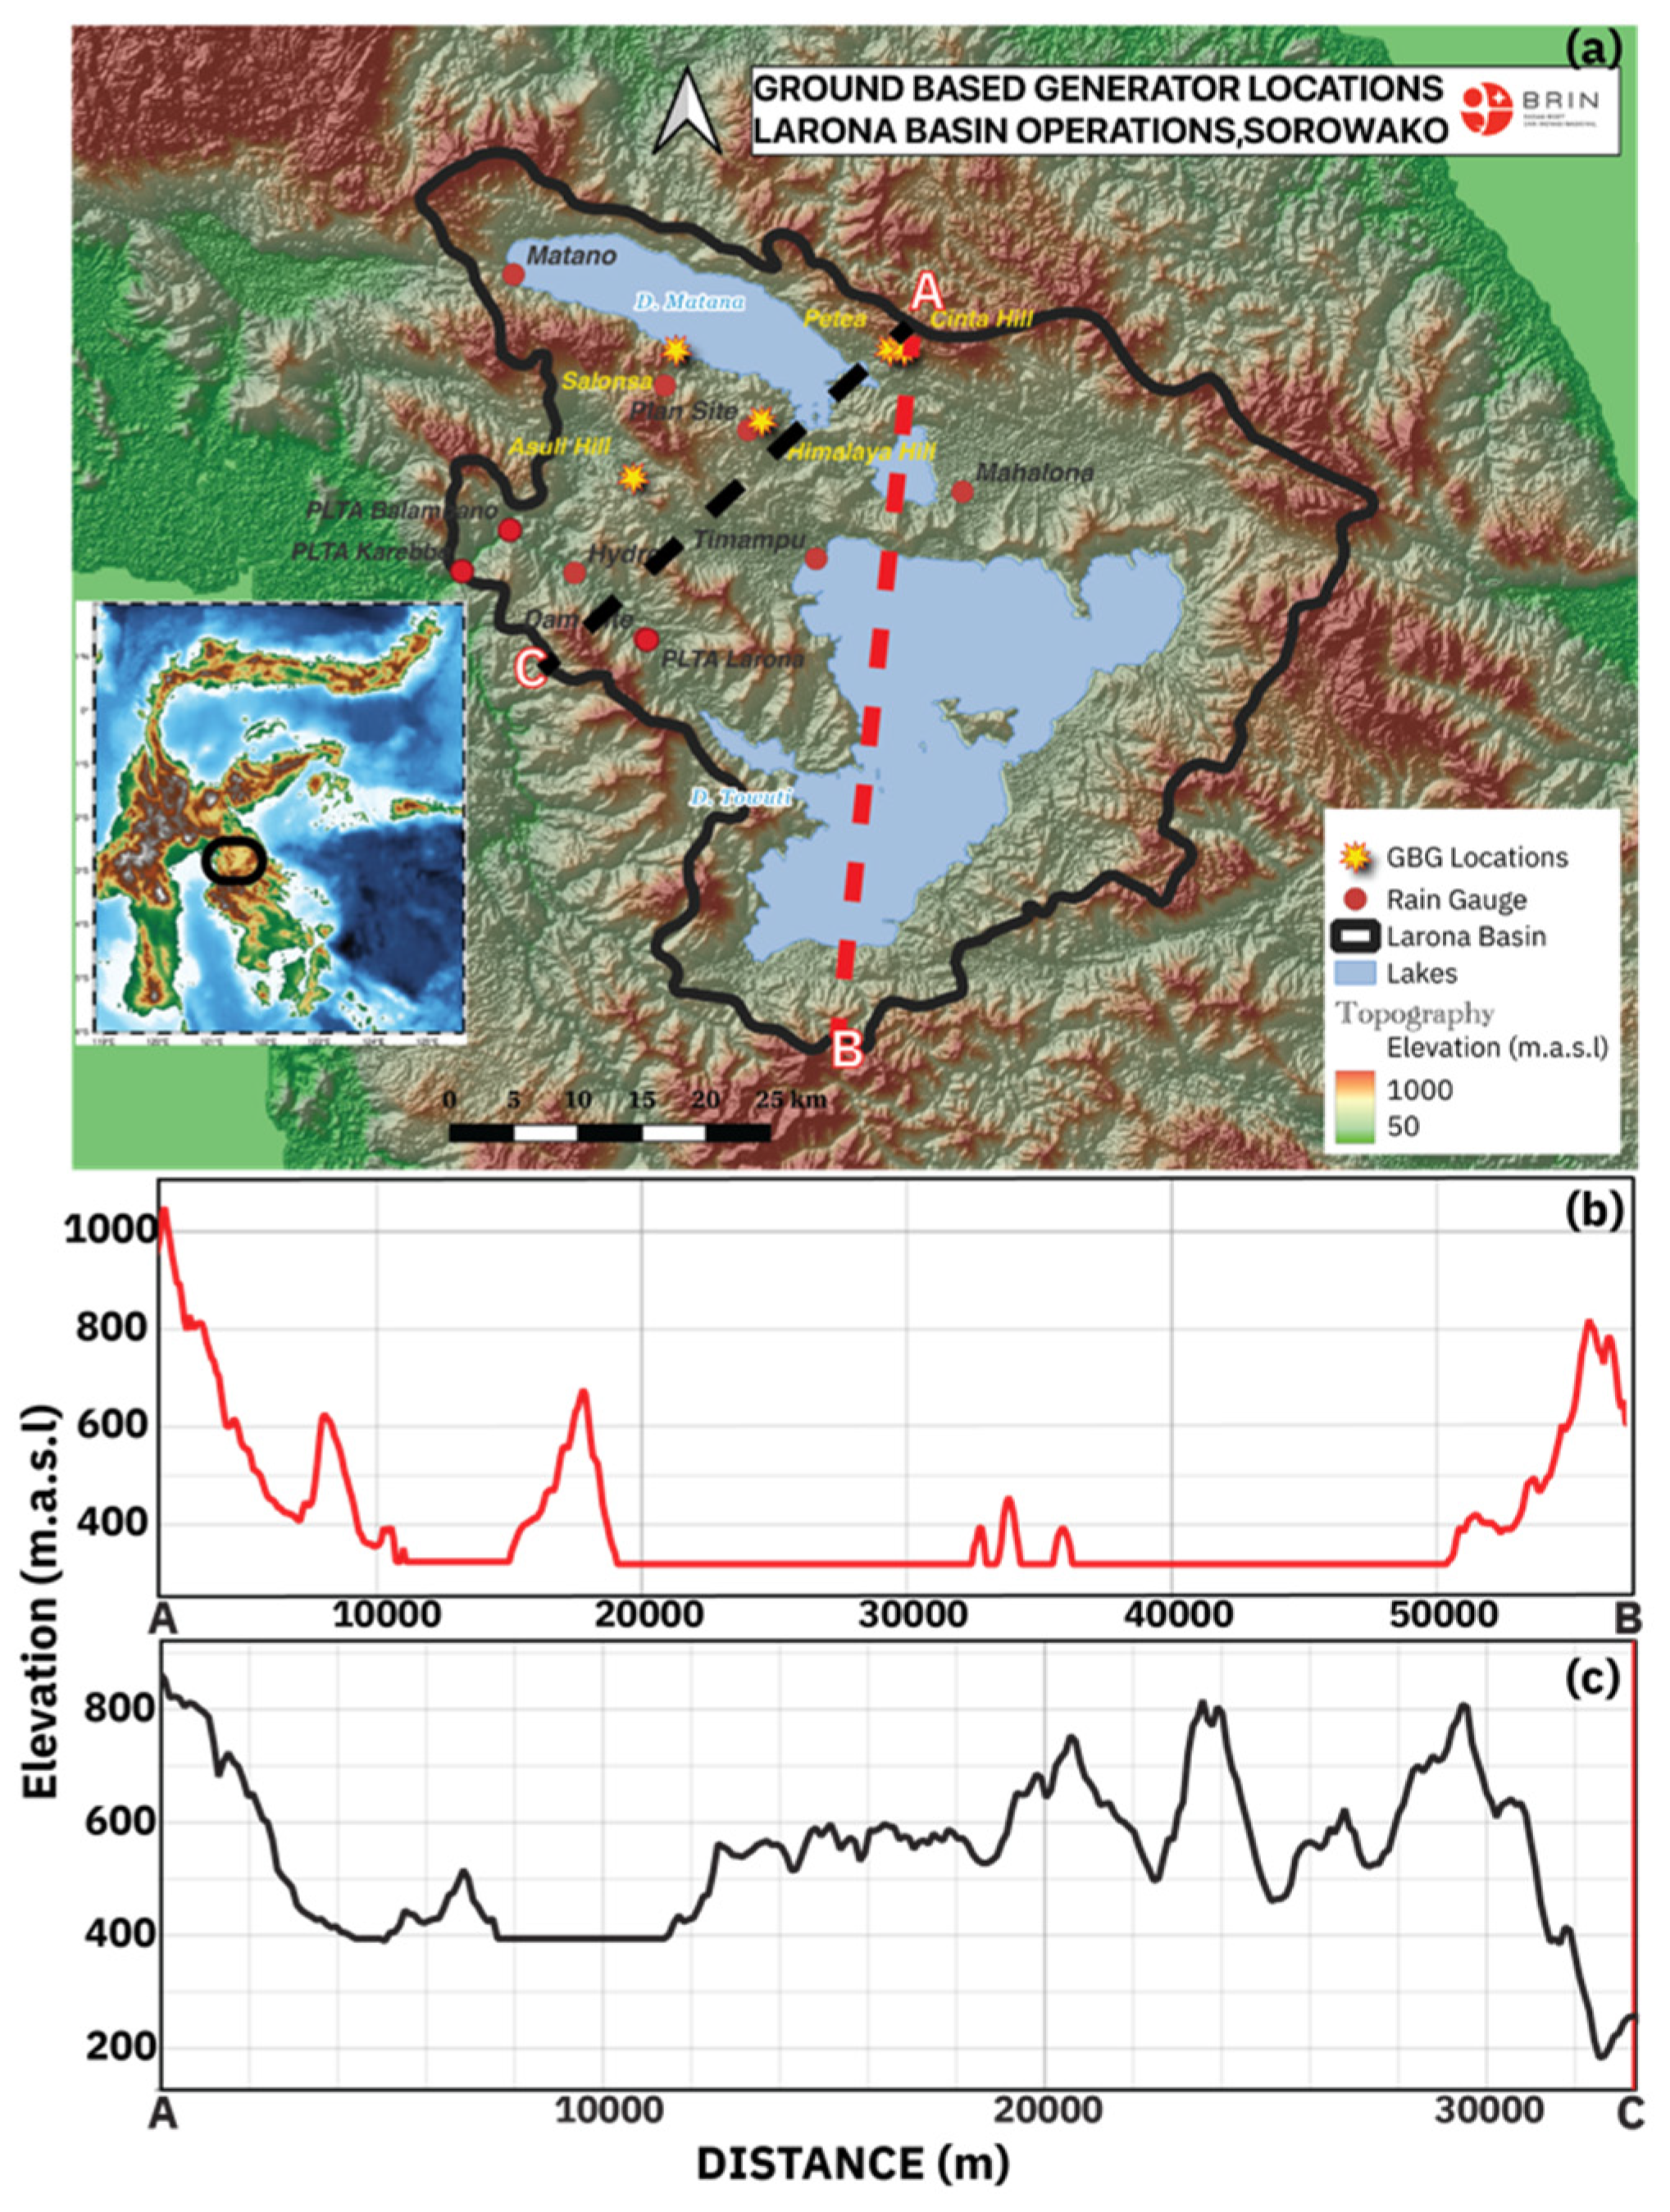
The first project for the GBG operation development was at Larona River Basin in Sulawesi, Indonesia. Larona River Basin covers a 2477 km2 area. The Larona River has three large cascade lakes: Matano Lake, Mahalona Lake, and Towuti Lake (Figure 3a). Locations of the towers within the basin are shown with yellow star symbols. Rain gauges were installed over the basin for rainfall monitoring, as shown by the red circle symbol. The Larona Basin is on a mountainous range with an altitude of between 500 to 1300 m above sea level. Five GBG towers were built in Sorowako for the above purpose. Figure 3b shows the cross sections of points (A)–(B) and (A)–(C) in Figure 3c. The locations and names of GBG towers are presented in Table 1.
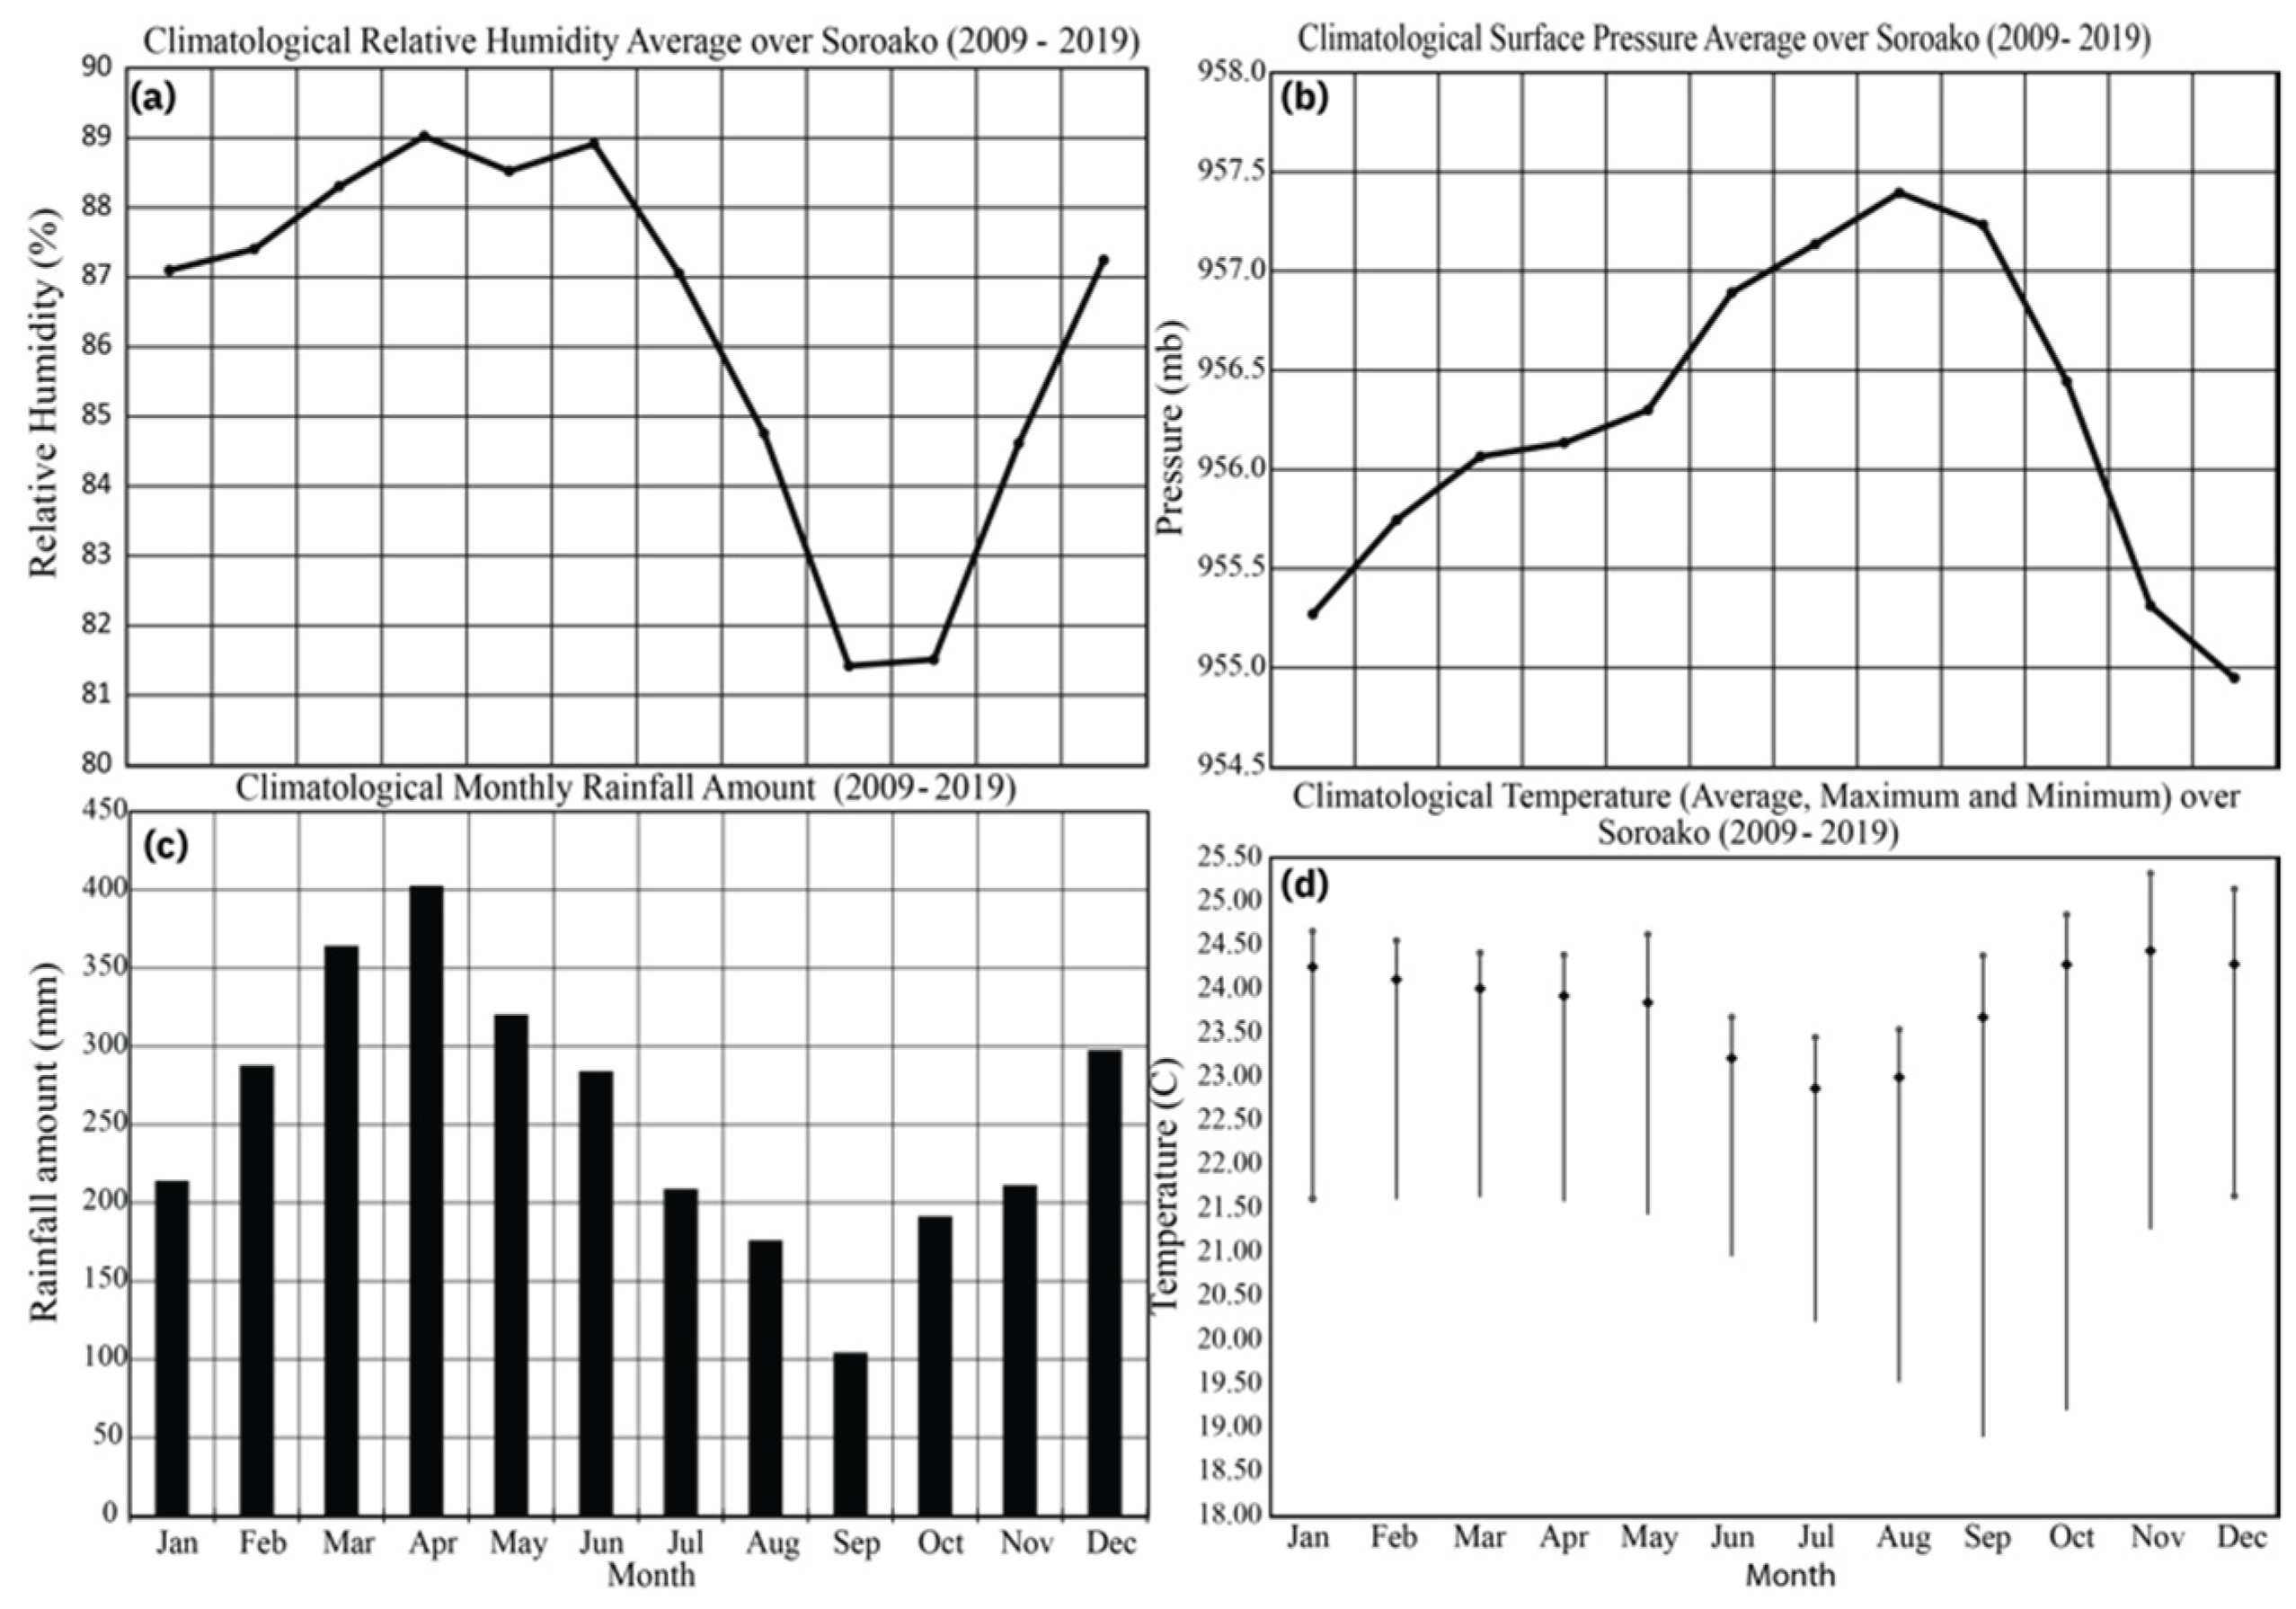
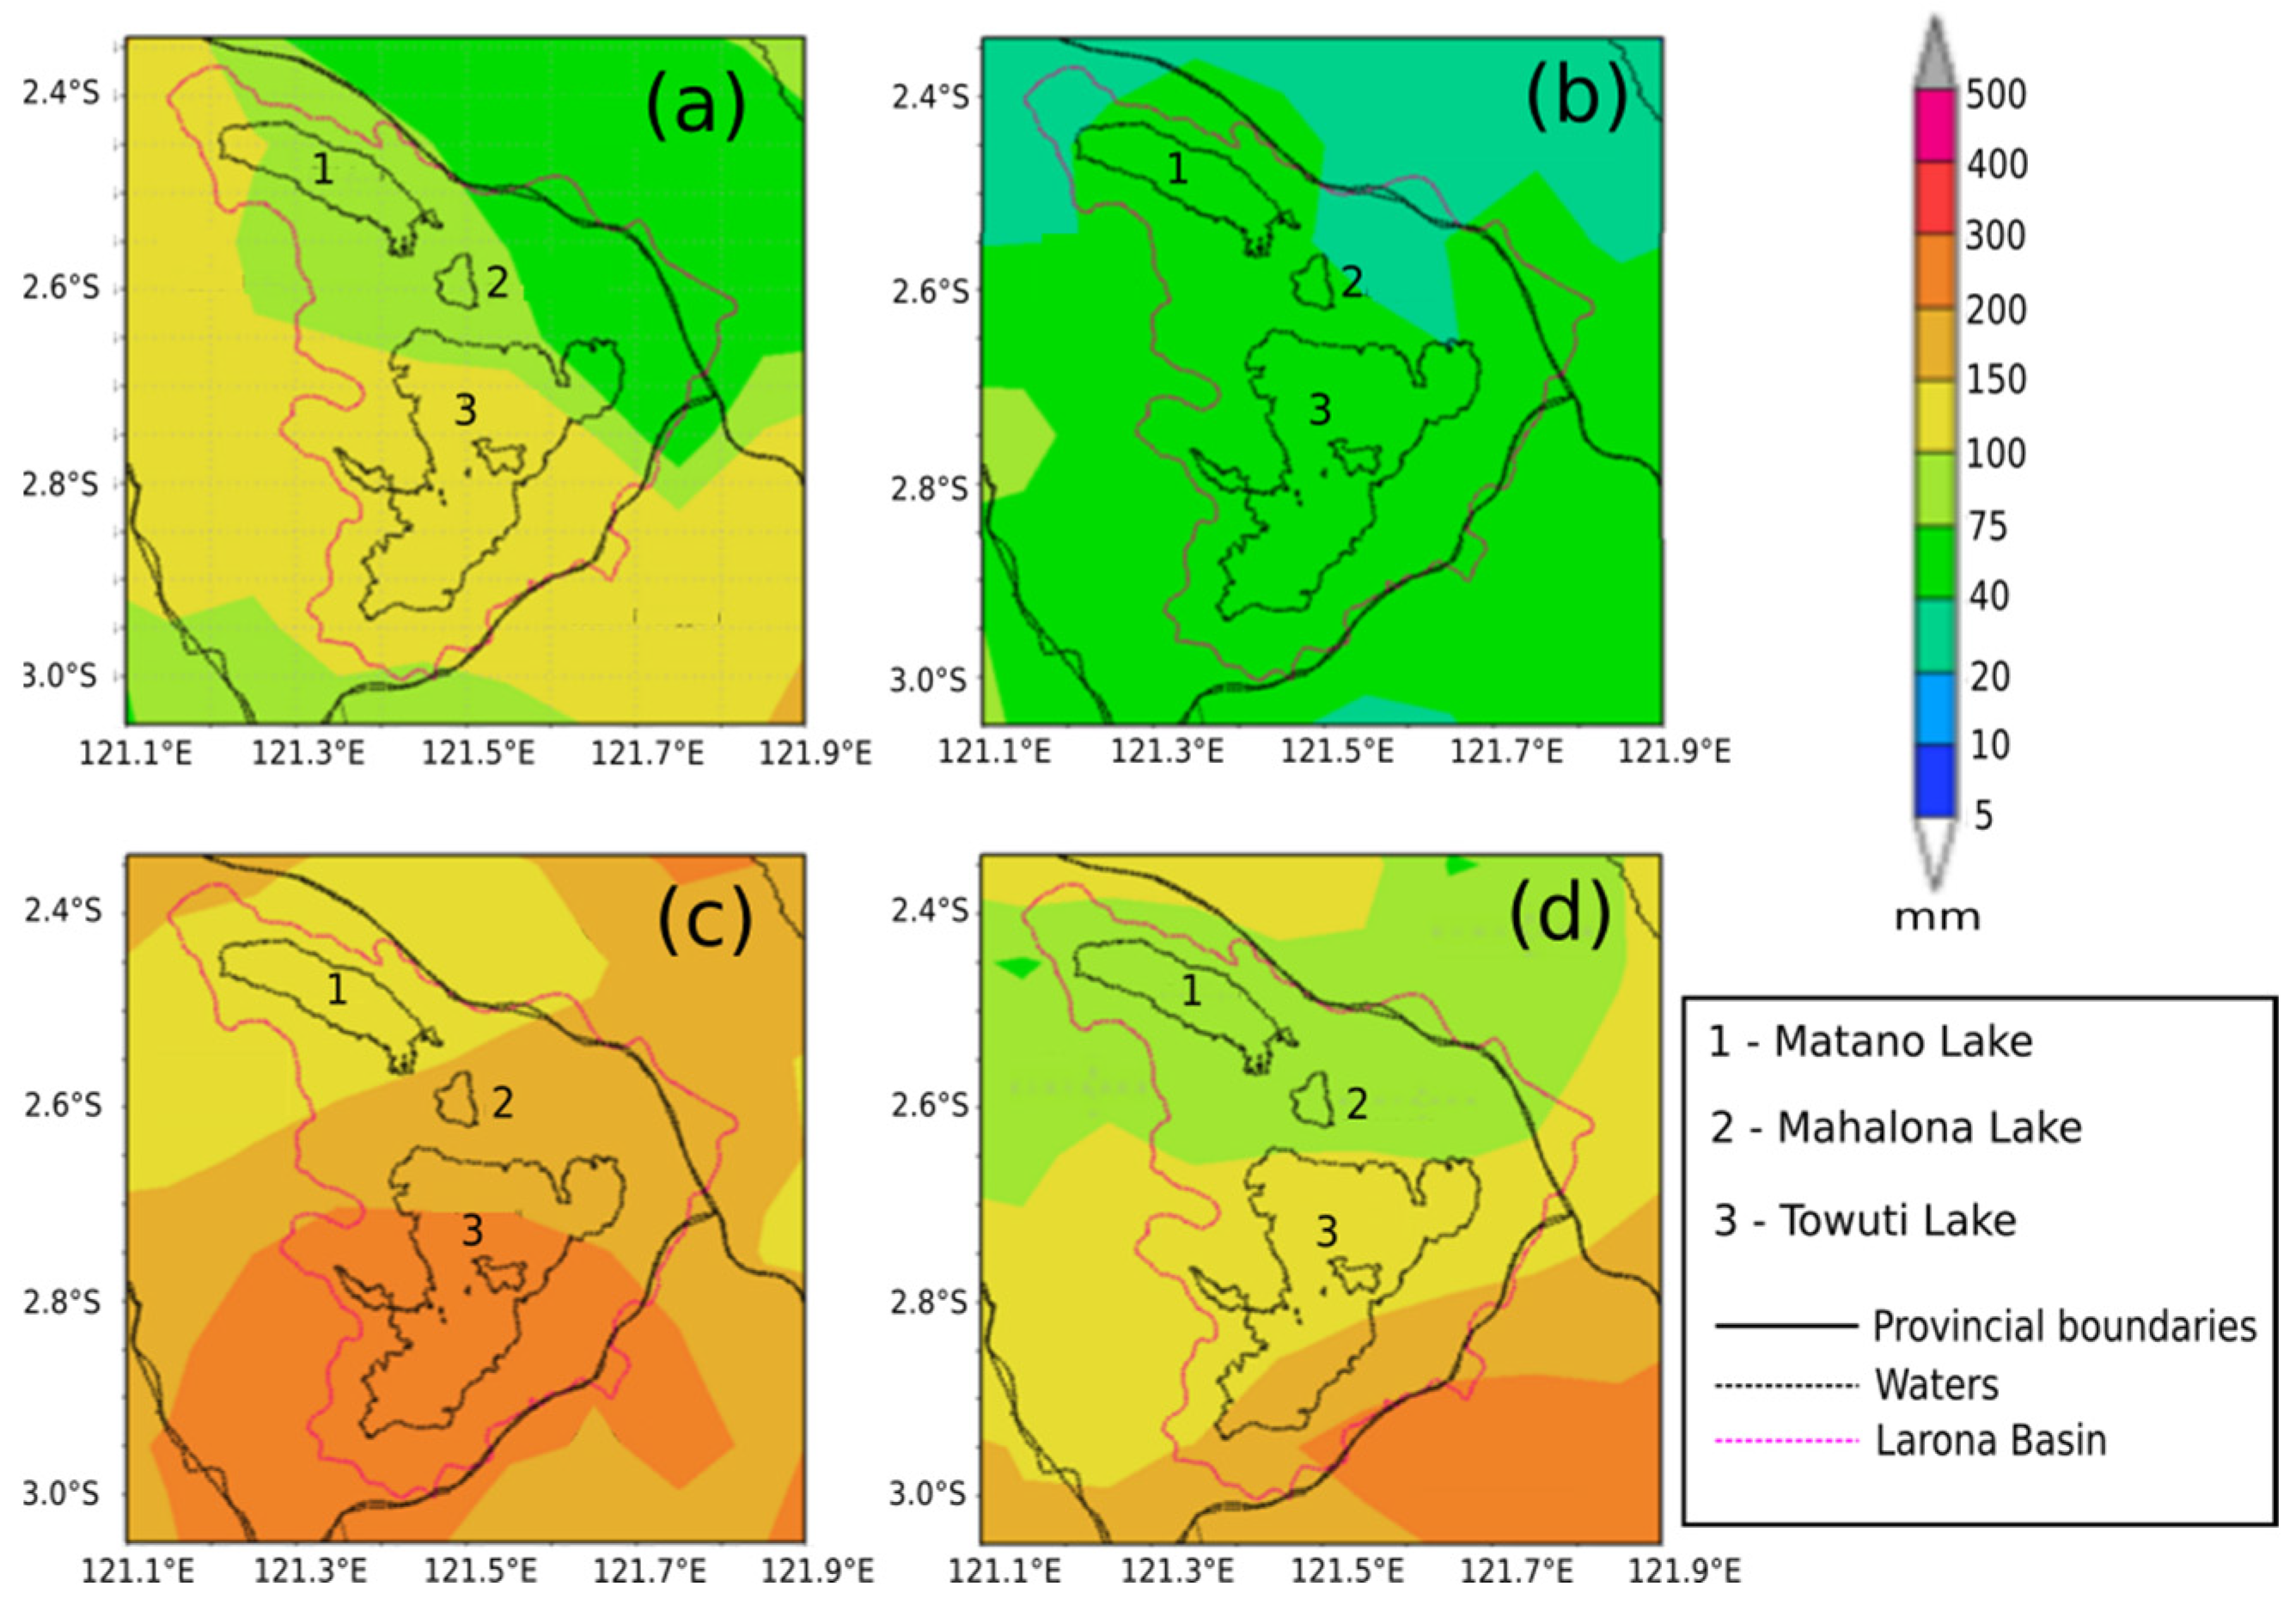
The climatological conditions of the Larona Basin vicinity from 2009 to 2019 were analyzed from global reanalysis data (ERA5) for Relative Humidity (RH), surface pressure, and surface temperature; meanwhile, rainfall amount was derived from rain-gauge observations, as shown in Figure 4. The average RH was above 80% all year (Figure 4a). Meanwhile, the average surface pressure was 955.0 to 957.5 (Figure 4b). The average monthly rainfalls for this area are between 100 and 400 mm, where the peak of the wet season is in April (Figure 4c). There were two peaks of rainfall amount in Larona Basin; the first peak was in April but started to increase in February, and the second peak was in December. Climatologically, the average temperature was around 24 °C, with the maximum and minimum temperatures being 25.4 °C and 19.0 °C, respectively (
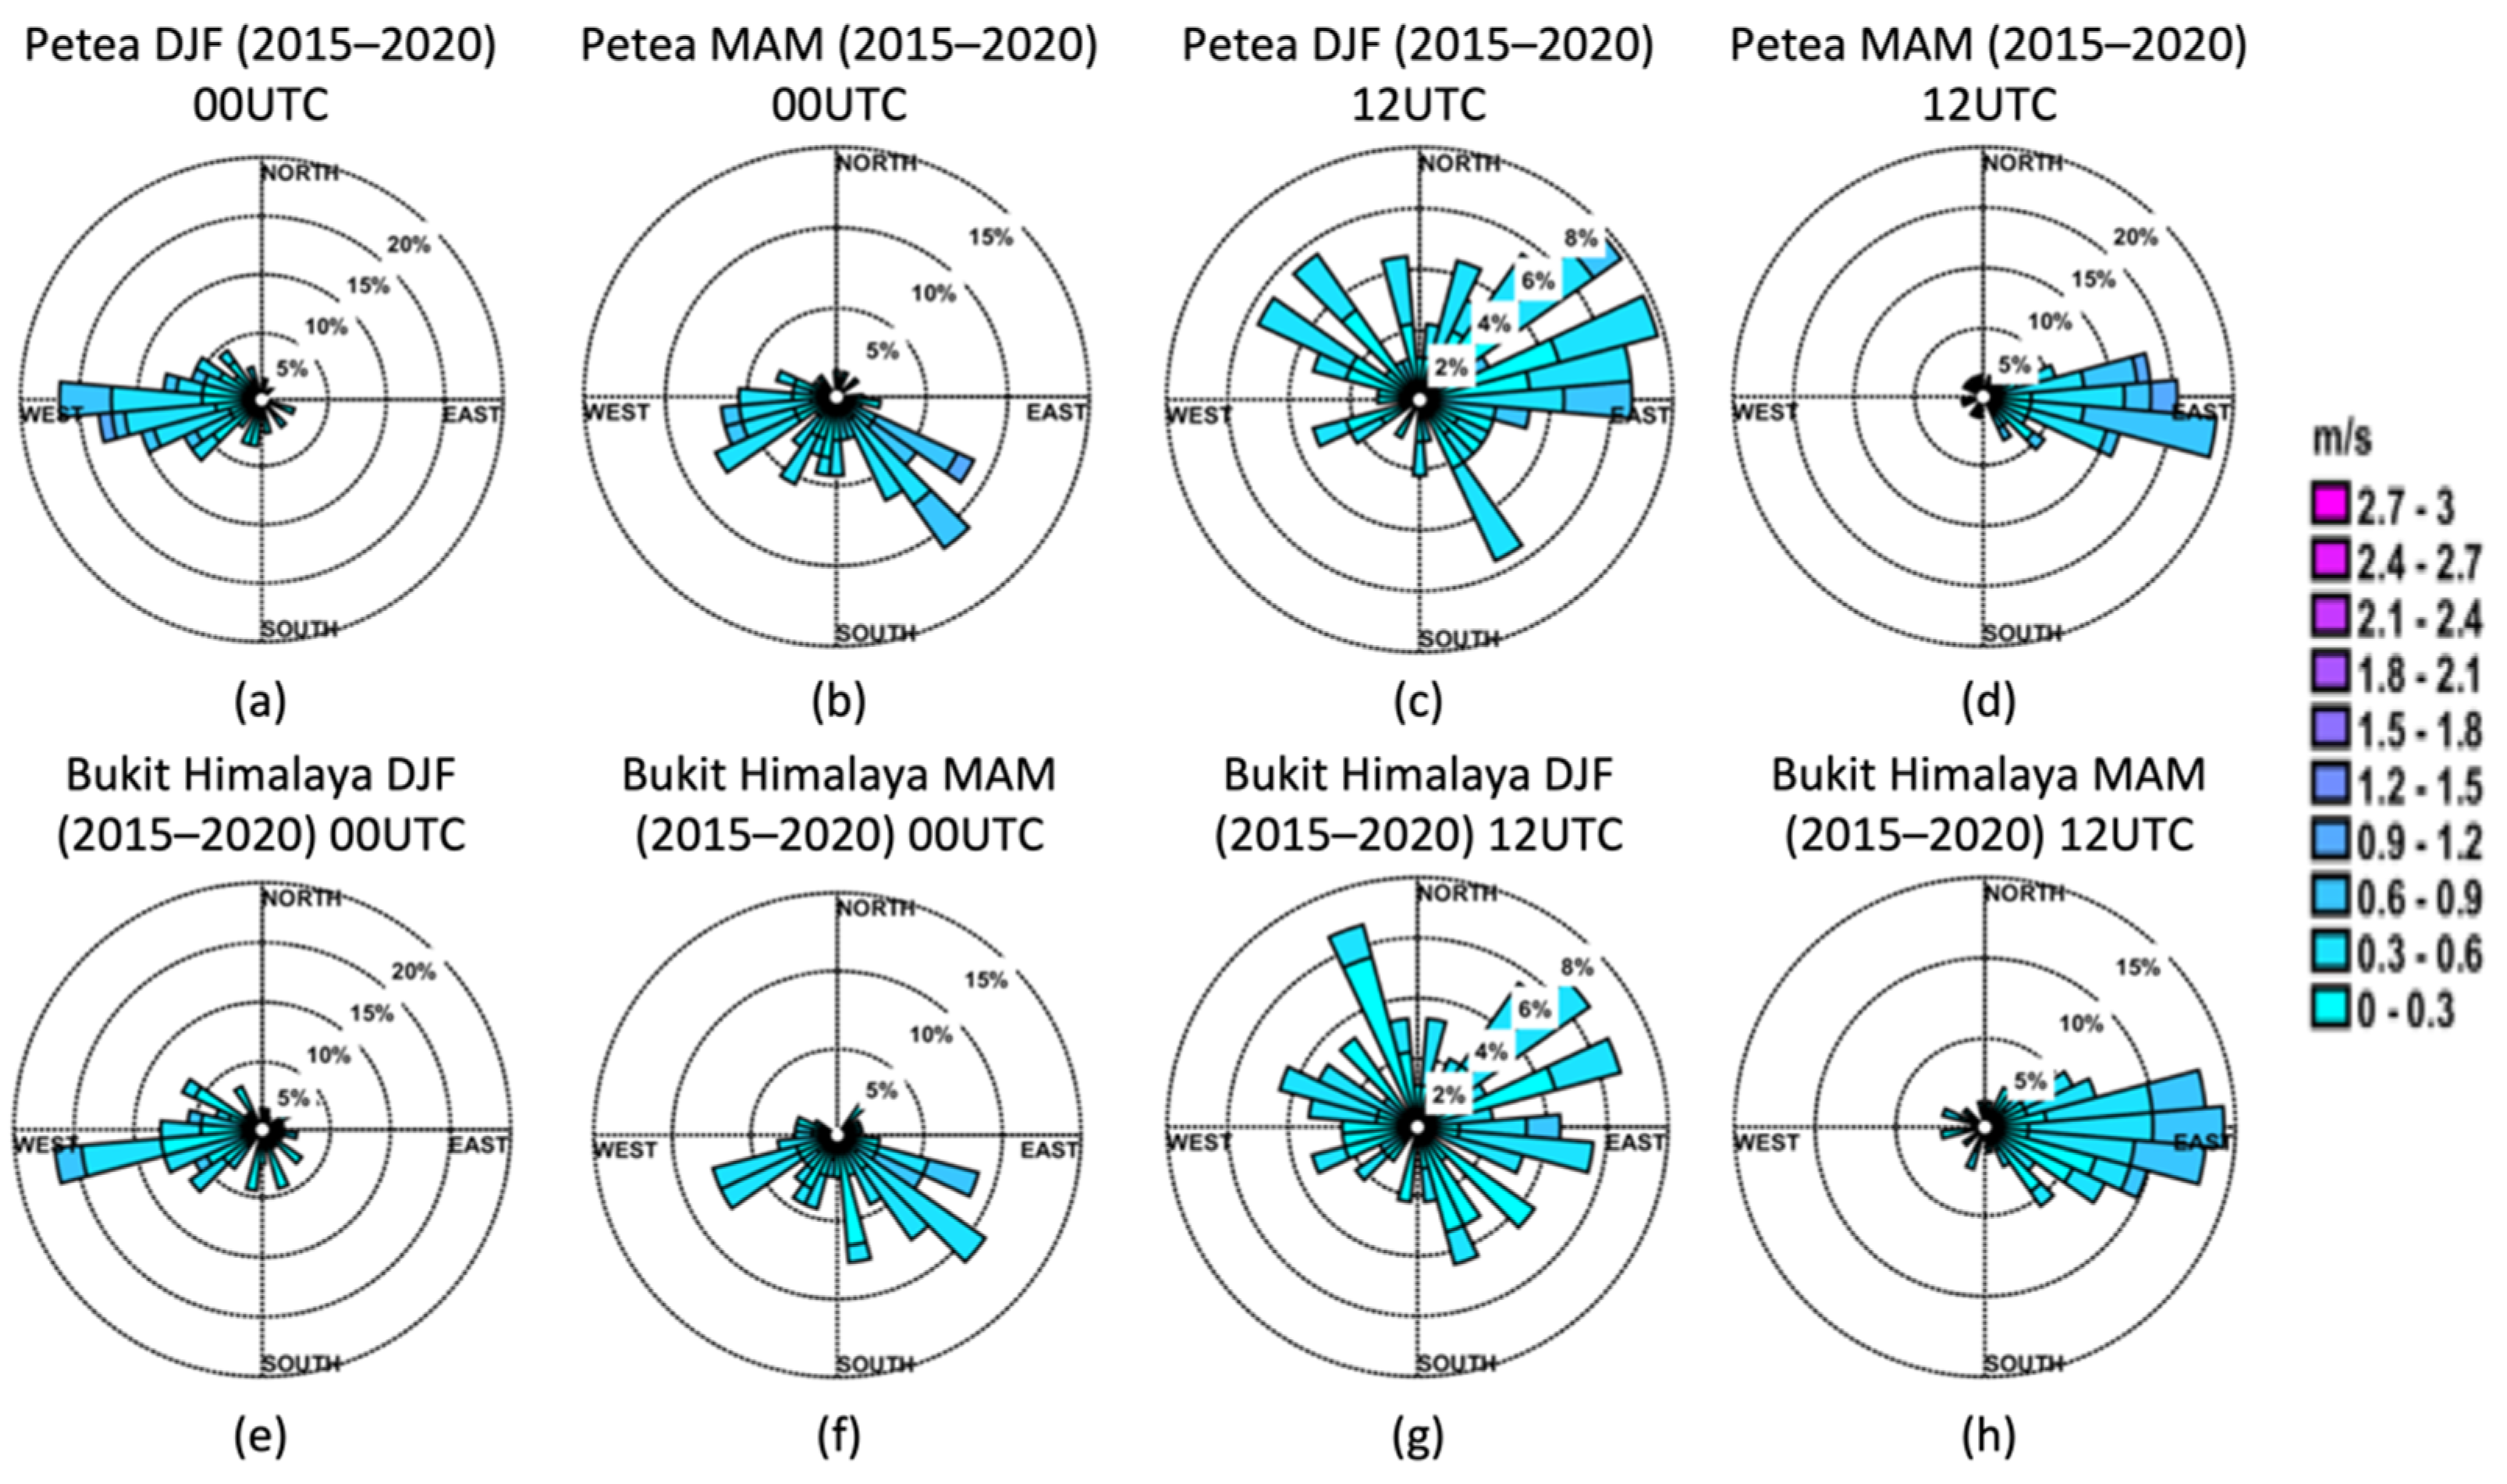
Figure 4d). Westerlies dominate historical surface wind over Larona Basin during DJF months. Meanwhile, during MAM months, the southerly and easterly winds were dominant (Figure A1). The topography of Larona Basin is also suitable for catching orographic clouds’ development, as shown in Figure 3b,c.
By taking advantage of the topographical conditions (Figure 3) and wind regime over Larona Basin, hygroscopic ground-based cloud seeding using GBG towers can be implemented for cumulus/orographic clouds over the hills of Larona Basin. 
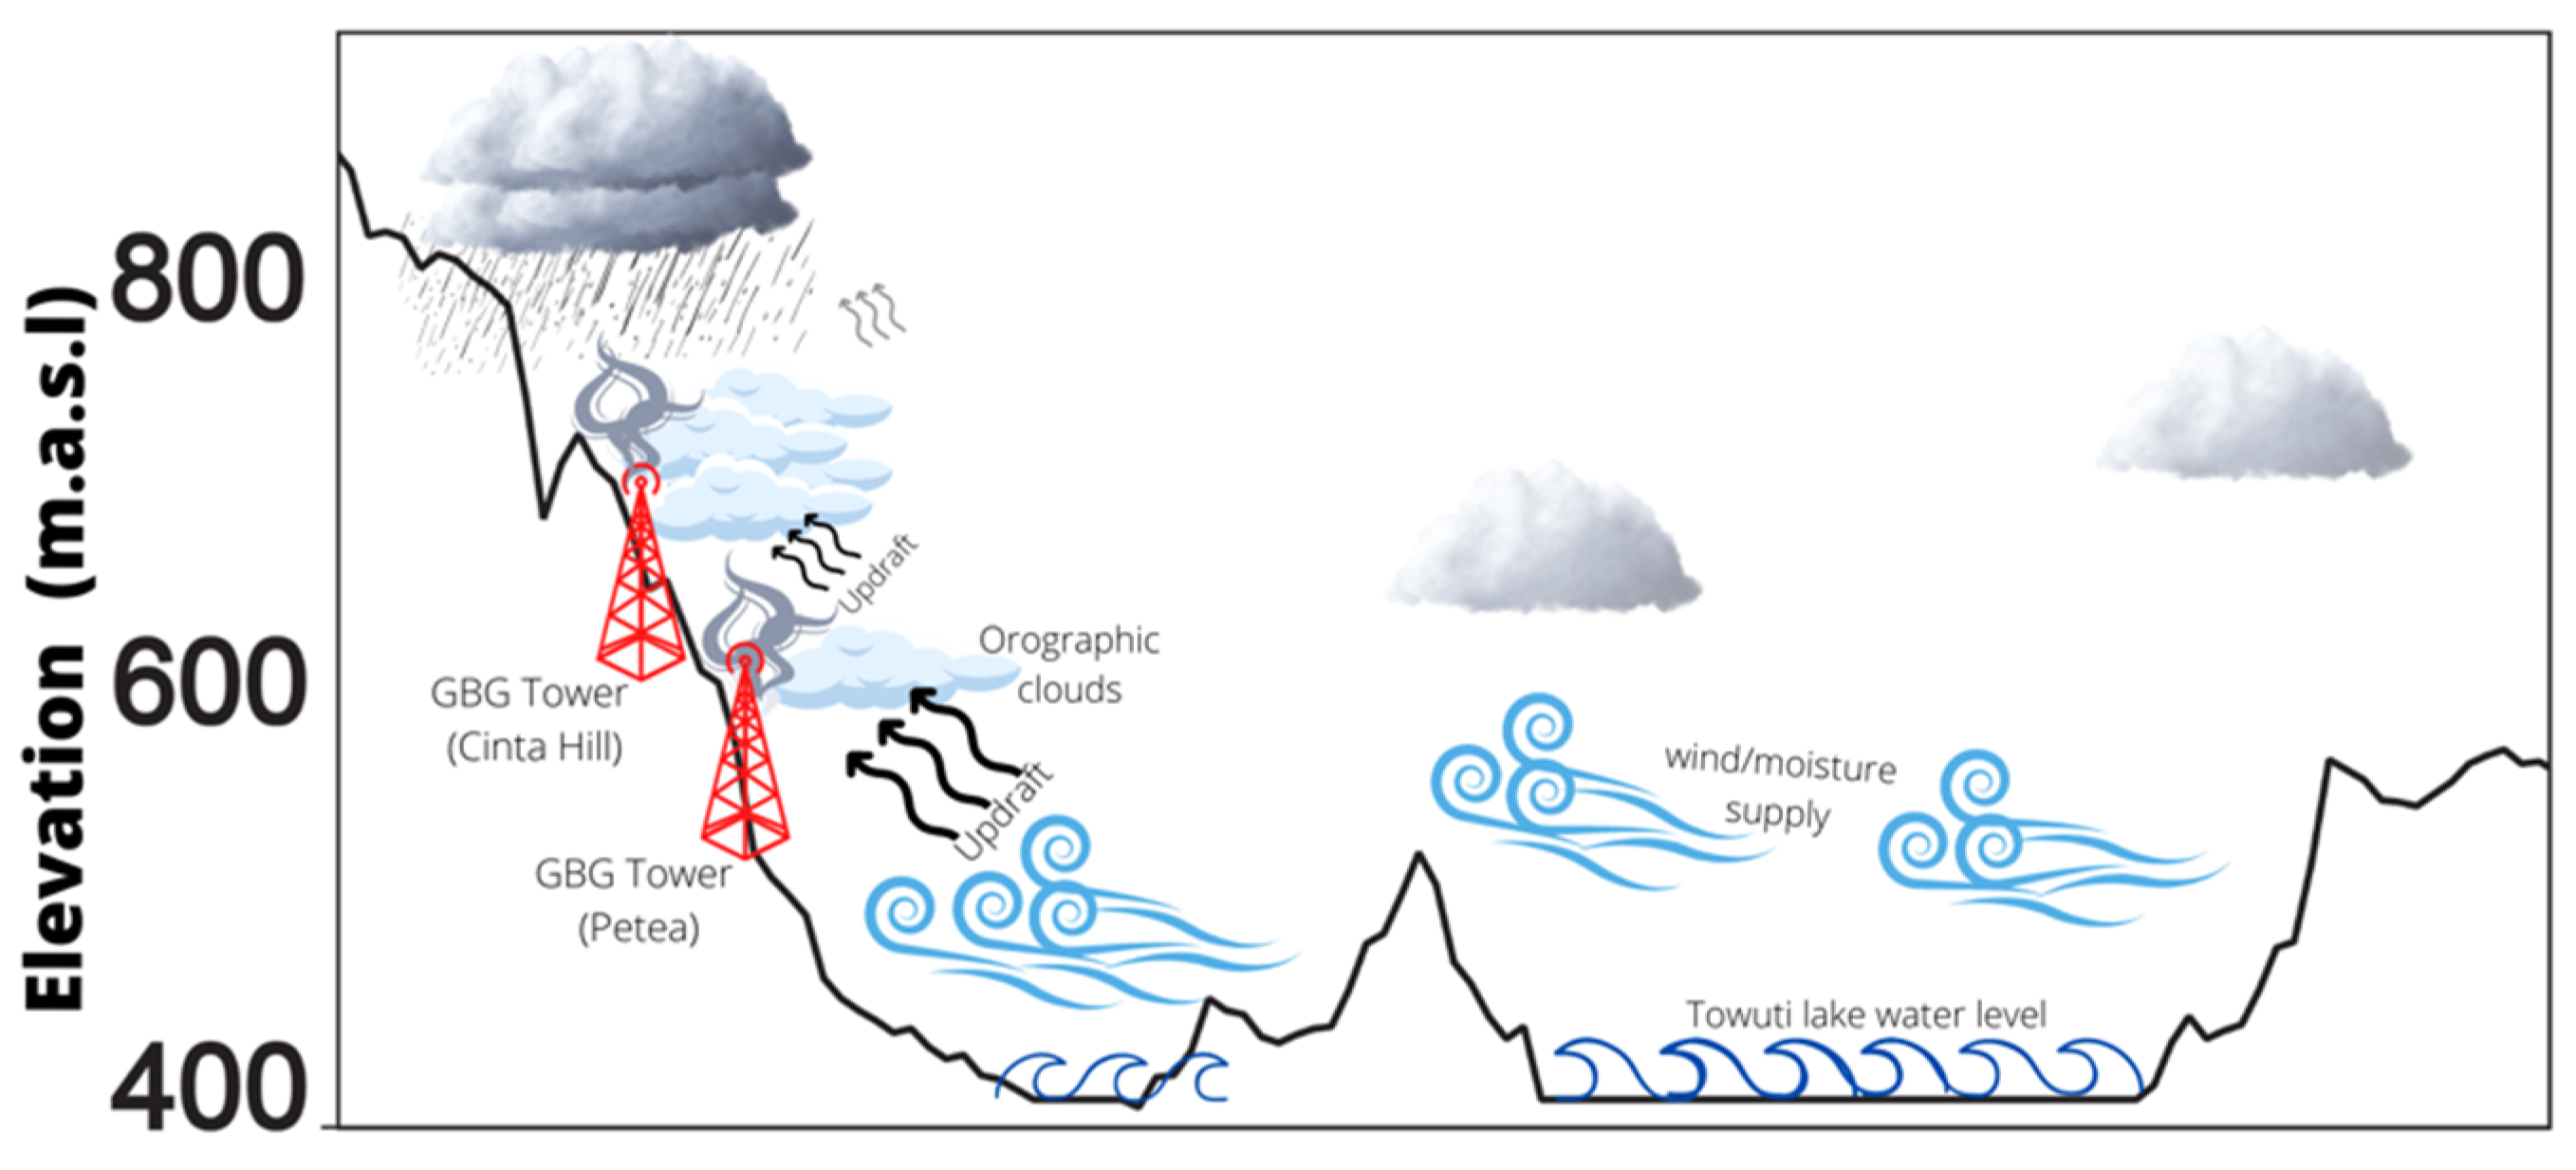
Figure 5 shows a schematic diagram of the cloud seeding operation using a GBG tower in Larona Basin.
As mentioned in the previous section, southerly and easterly wind regimes were dominant in MAM, which brought wet moisture supplies from lake bodies in the south into the mountainous region in the northwestern area of Larona Basin. This wet moisture acted as the seed for the orographic clouds at the foot of the hills and grew along the ridge of the mountains where GBG towers are located. Flares from the GBG tower released giant CCN into newly developed orographic clouds and then enhanced the cloud development process. This CCN from flares would help speed up the development of cloud droplets into rain droplets through collision and coalescence.

2.1. Standard Operating Procedure (SOP)

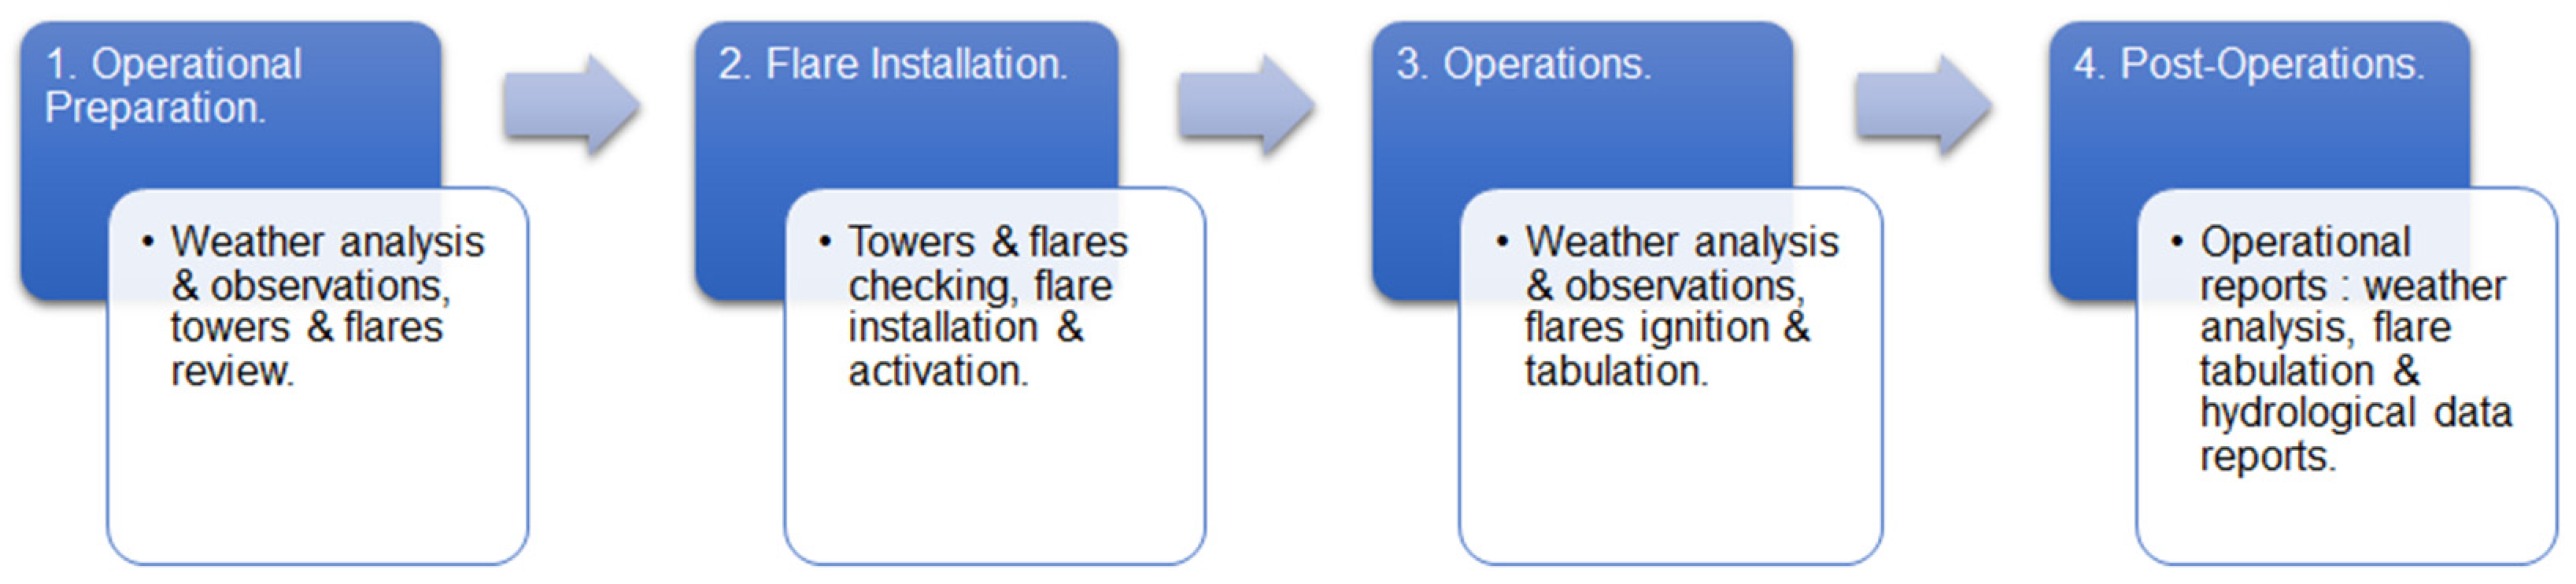
For the 2020 operations, a daily standard operating procedure (SOP) shown in Figure 6 was applied to each operating tower.
The sequence of daily SOP for each tower in the 2020 operations started with the operational preparation stage. In this stage, global and local weather conditions were observed and analyzed. First, global weather conditions were obtained and analyzed daily from the Indonesian Meteorological, Climatological, and Geophysical Agency (BMKG) and the Australian Bureau of Meteorology (BOM) websites. These data can be found in Weekly Report 01 to Weekly Report 13 in the Supplementary Material. Local weather conditions were also obtained and analyzed daily from the BMKG websites and early on-site observations on the operating towers. Next, all four towers and flares usage conditions from the previous operation were reviewed and analyzed for that day’s global and local weather conditions. These two steps designated potential towers to be activated later during operations. This stage was then finalized with a review of pre-operations health and safety environment (HSE) procedures.
In the flare installation stage, flare basket and ignition systems checking were conducted on the designated towers. Used flares were then discarded and replaced with new flares on the towers. The ignition systems were then activated so that once the instruction to ignite was sent, the flares would automatically burn during operations on the designated towers. Next, global and local weather conditions were observed and analyzed in the operations stage. Sources for global and local weather conditions were the same as in the first stage. This step allowed designated towers/flares to be ignited/burned. Depending on the weather, towers in other locations can be ignited, not only limited to designated towers. Finally, tabulation of towers activation and flares usages were then conducted. In the post-operation stage, daily global and local weather analysis and forecasts were produced and reported. In addition, daily and weekly towers activations and flare usages were also reported. Next, weekly hydrological data in the form of water level height from Lake Matano and Towuti, rainfall amount, and spatial rainfall in the Larona Basin were recorded. Finally, post-operation HSE reviews were conducted.

2.2. Operation Period and Material Used

The 2020 Larona Basin operations lasted 120 days, from 31 December 2019 to 28 April 2020. Only four out of five GBGs were used for the 2020 operations. These were the Salonsa, Himalaya Hill, Asuli Hill, and Cinta Hill towers. The Petea tower was not used due to a technical malfunction with the tower’s flare basket structure. In addition, a pattern of 2–3 GBGs operating at the same time was commonly used for daily operations. This was because of daily potential target clouds’ presence that usually occurred in 2–3 GBGs locations. In the 2020 operations, 181 NaCl-based hygroscopic flares were burned from all four operating GBGs. A detailed breakdown of total flare, total days of flare, and average daily flare usage for each tower, for 120 days of operations in Larona can be found in Table 2. The average daily flare usage was found by dividing the total flare usage by the entire days of flare usage for each tower. The resulting number was then rounded up to the first significant number. Detailed day-to-day flare usage during operation is presented in Table A1.
We can see that the average flare usage per tower was about 1–2 flares per day, with the Salonsa tower having the highest daily flare usage compared to the other towers. Additionally, Salonsa and Cinta Hill towers’ total flare usage days were much higher than the other towers. This usage day pattern can again be attributed to frequent daily potential target cloud presence in 2–3 GBG locations near the Salonsa and Cinta Hill towers.

3. Cloud Seeding Operation Results

The 2020 ground-based weather modification operation in the Larona Basin, Sorowako, South Sulawesi, Indonesia was a rain-enhancement operation conducted to increase rainfall amount in the Larona Basin and make lake water optimization for hydropower generation.

3.1. Rainfall Amount and Spatial Rainfall Results

Throughout 120 days (31 December 2019–28 April 2020) of GBG operations in Larona, daily temporal and spatial average rainfall amounts (in mm) within the basin were recorded and analyzed. The daily average rainfall amounts (in mm) were obtained from 10 rain gauge stations/locations within the Larona Basin (Figure 3a, red circle). The data were obtained by summing the daily rainfall amounts from the ten sites and dividing the result by the number of locations (i.e., 10). For missing stations/locations data, the sum of daily rainfall amounts was divided by recording locations. For example, if there were only eight recording rain gauge stations (instead of ten), the daily average rainfall amounts were obtained by dividing the sum of recording stations by eight locations. The daily average rainfall amounts from the Larona Basin were then plotted for days of operational durations as the temporal element and can be seen in Figure 7 below.
From Figure 7, it can be inferred that from late January to late April 2020, monthly average rainfall amounts in the basin were higher compared to its climatological record, with the highest daily average rainfall amount recorded on 26 April 2020. The GBG operation period had a higher rainfall amount than its long-term average of monthly rainfall when there were no GBG operations. Almost all months showed increased rainfall amounts with percentage increases as much as 79%, 17%, and 46% for January, February, and March, respectively. By contrast, in April, the rainfall amount during GBG operation was 4% lower compared to its climatological average rainfall amount.
Next, the spatial rainfall amounts’ distribution (in mm) from the basin was obtained from NASA and JAXA’s Tropical Rainfall Measuring Mission (TRMM) satellite on the designated (basin) coordinates. The measured total spatial rainfall amount has a spatial resolution of 0.1° and a temporal resolution of 1 h. The resulting data were then obtained and displayed in four spatial data periods. The first spatial data period was a sum/accumulation of spatial data from 31 December 2019 to 31 January 2020, the second was the sum from 1 to 29 February 2020, the third was the sum from 1 to 31 March 2020, and finally, the fourth was the sum from 1 to 28 April 2020. The resulting four periods of spatial data can be seen in Figure 8a–d below.
In Figure 8a–d, it can be seen that the first and second period’s total spatial rainfall amounts distribution were less than the third and fourth periods, with the third period having the highest total spatial rainfall amount distribution compared to all periods. The highest total spatial rainfall amount was recorded 300 mm south of Larona in the third period. In comparison, the lowest was recorded at 75 mm for almost all of Larona in the second period. This number is consistent with the findings in Figure 7b’s plot, where the monthly rainfall amounts in March 2020 (third period) are higher compared to the first and second period (January to February 2020).

3.2. The Larona Basin Hydrological Measurement

The hydrological measurement results from the 2020 GBG operations in Larona consist of Lake Matano and Towuti daily water level height measurements and the inflow and outflow measurements from the entire (Larona) basin throughout 120 days (31 December 2019–28 April 2020) of operations. Both lakes’ water level heights were measured directly from on-site visual observations. The basin’s inflow and outflow were calculated from a water balance equation, based on the lakes’ water level height and their hydro-electric plant’s storage volume change among the parameters of the said equation [22,25].
By definition, inflow can be found from Equation (1) below:
INFLOW = GROSS INFLOW − (SURFACE EVAPORATION + GROUNDWATER LOSSES)
Both the inflow and gross inflow are in m3/s; the surface evaporation is in kg/m2, and groundwater losses in m3. The outflow can be found and linked with the inflow from Equation (2) below:
INFLOW = OUTFLOW + {((LEVEL CHANGE) × AREA)/(TIME STEP)}
In Equation (2), the level change is in m, the area is in m2, and the time step is in seconds. Here, the level change refers to the measured water body height level, the area refers to the water body surface area, and the time step refers to the unit of time used in inflow and outflow measurements. Throughout the GBG operational period, the inflow and outflow are obtained from direct on-site measurements in the Larona basin. The resulting outflow also depends on the basin’s hydropower plant operating pattern, with the basin surface area being given or already known previously.
The daily and monthly average water level monitoring for Larona Basin Lakes during the ground-based weather modification operation period and long-term average when there were no cloud seeding operations are presented in Figure 9.
From Figure 9, the water level on both lakes (Matano and Towuti) at the early phase of the GBG operation (December–January) was at its lowest condition. A rise of the water level at Towuti Lake was observed in early March 2020. Meanwhile, in Matano Lake, the water level started to rise in mid-March 2020. In absolute numbers, Matano’s daily water level height at the end of operations, i.e., on 28 April 2020, was higher (391.79 m) by 0.21 m compared to its height at the start of operations, i.e., on 31 December 2019 (391.58 m). Therefore, it can be concluded that from late March to late April 2020, an increase in daily water level height occurred at the same time with an increase in temporal and spatial rainfall amounts as seen in Figure 7 and Figure 8. Meanwhile, in absolute numbers, Towuti’s daily water level height at the end of operations (28 April 2020) was higher (318.97 m) by 1.33 m compared to its height at the start of operations (31 December 2019) at 317.64 m. Comparing the water level at the end of the GBG operation period (late April) with the beginning of the GBG operation period (early January), even though there were increases in water level in both lakes (Towuti and Matano), in percentage the increases were only 0.42% and 0.05% for Towuti and Matano Lakes, respectively. However, there was a difference in the monthly average increase in lake water level between the GBG operating time and its long-term average (Figure 9b). The yellow line in Figure 9b shows the difference in water level conditions during GBG operations (January–April 2020) compared to those in January 2020. The black line shows water level conditions when there was no GBG operation in January–April versus January’s average. There was an increase in water level when GBG operations were higher compared to the trend of increasing lake water levels when there were no GBG operations.
From late February to late April 2020, the water level increased simultaneously in temporal and spatial rainfall amounts. Next, the resulting inflow and outflow measurements (in m3/s) from the entire (Larona) basin were plotted as a histogram and analyzed with respect to the 120 days (31 December 2019–28 April 2020) of GBG operations. The plot can be seen in Figure 10 below.
From the Figure 10 histogram, except for a few days in January, we can see that the inflow trends started to increase dramatically and became higher compared to the outflow ones from late February to late April 2020. Additionally, the basin’s inflow was higher than its outflows on most days within this period. In absolute numbers, the outflow itself was relatively stable at approximately 100–110 m3/s throughout the operations. Meanwhile, the inflow at the end of operations (491.36 m3/s) was higher by 369.91 m3/s compared to the inflow at the start of operations (121.45 m3/s). This is a very significant rise in the basin’s inflow post-operations. Note that the highest inflow number was recorded on 26 April 2020, at 543.62 m3/s. Finally, we can conclude that the increase in inflow during late February to late April 2020 occurred at the same time that there was an increase in temporal and spatial rainfall amounts, as seen in Figure 5 and Figure 6. Additionally, this inflow increase coincided with the same period increase in Matano and Towuti lakes’ daily water level heights.

4. Discussion

The GBG-based hygroscopic cloud seeding operation was conducted over The Larona Basin from December 2019 to April 2020. This operation aimed to restore and maintain the water levels at major lakes within the basin. The two major lakes that were targeted were Lake Matano and Lake Towuti. Additionally, previous research has already investigated weather characteristics over the Larona Basin [
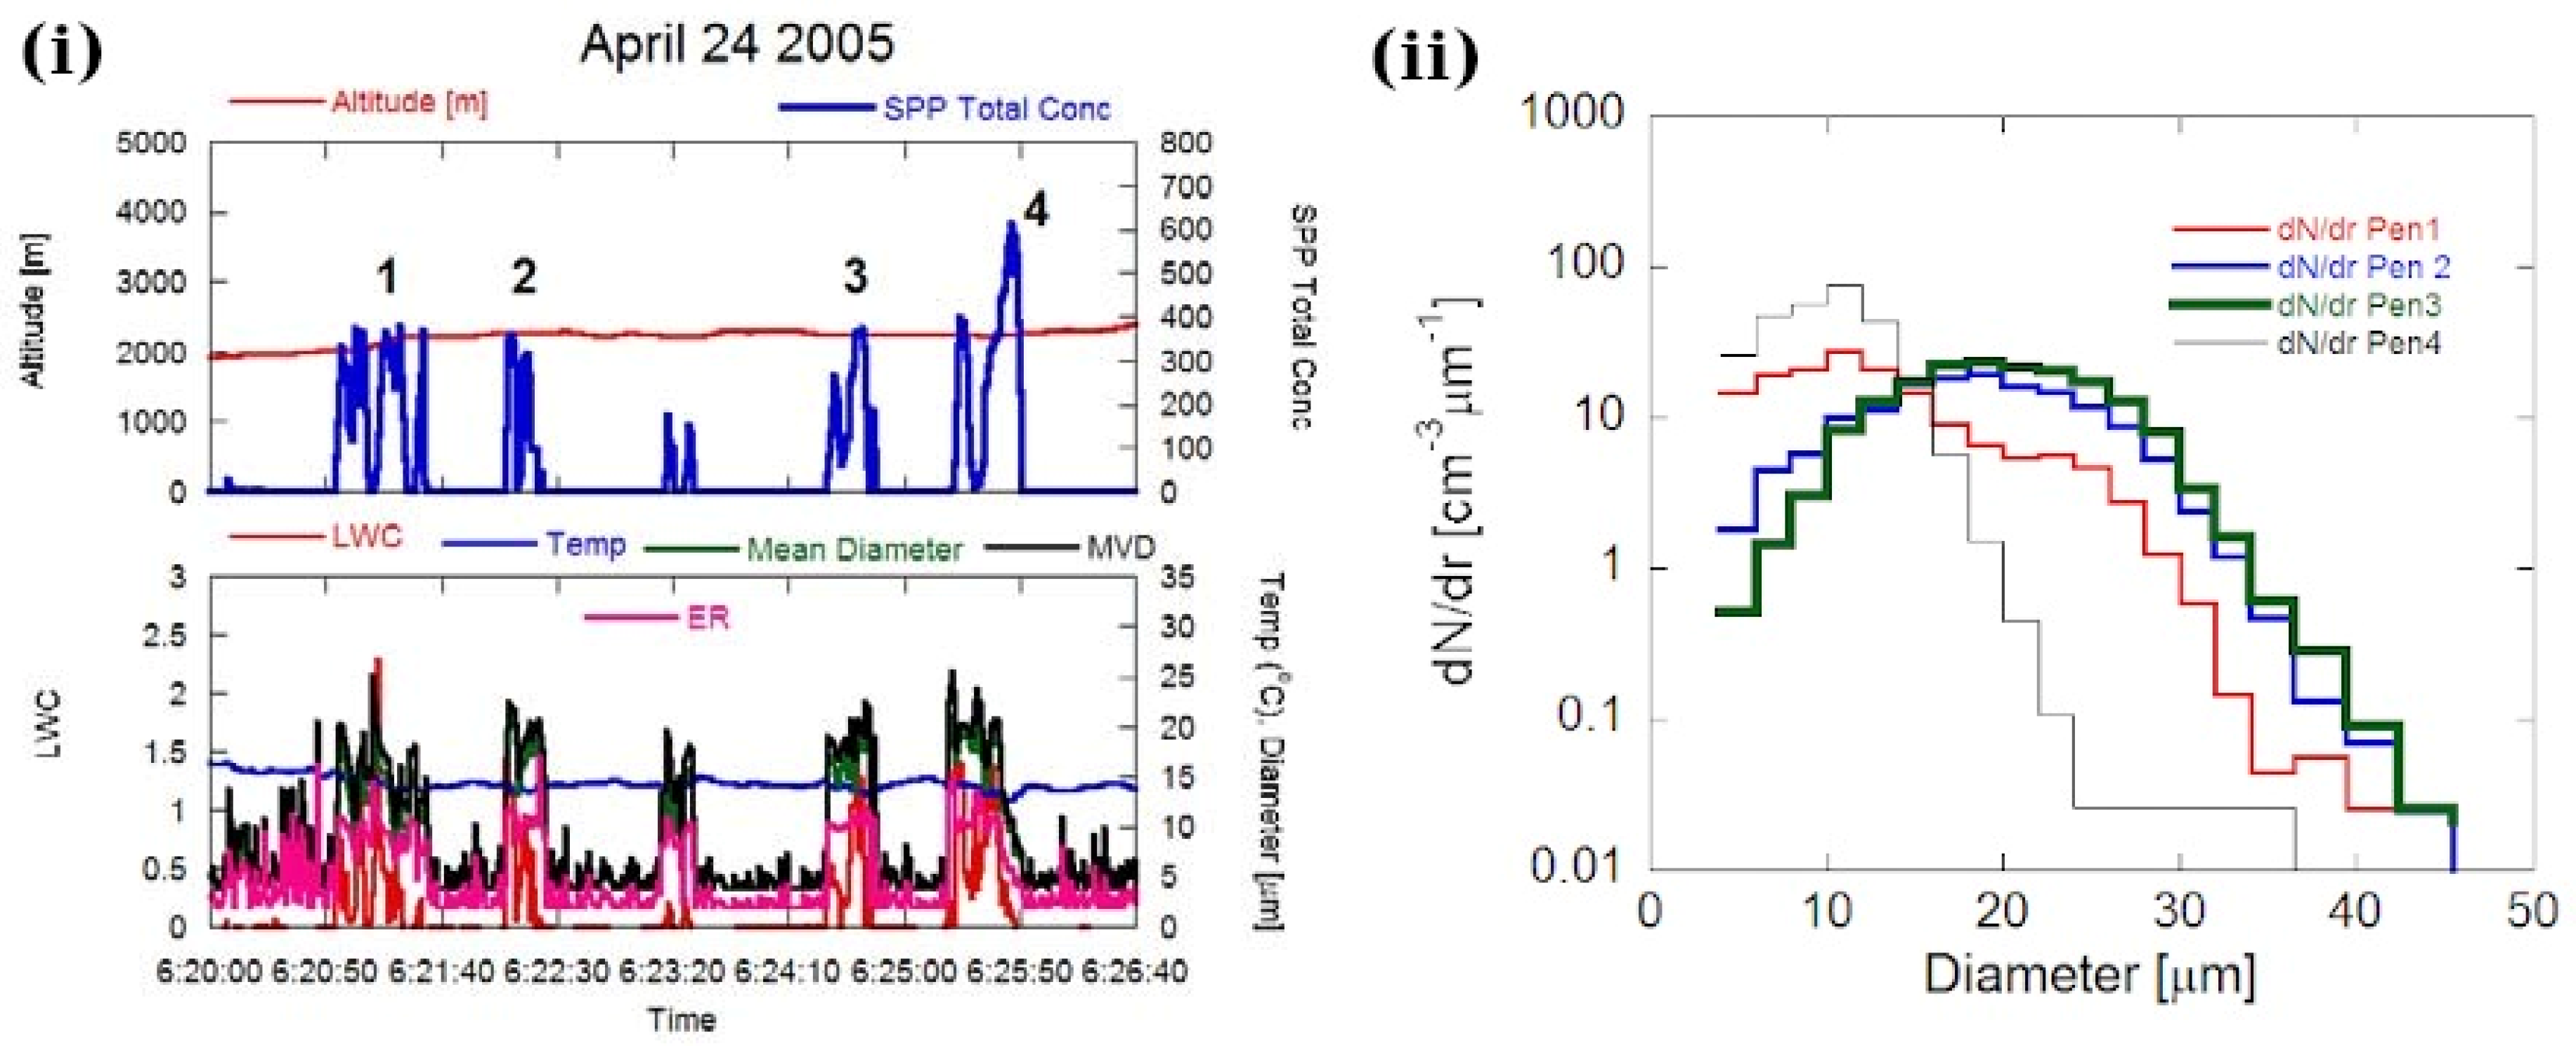
21]. The results show that even after a one-month long (April–May) microphysics process observation, it was found that Larona Basin clouds did not satisfy one of the seedability criteria for aircraft-based seeding with hygroscopic flares. The April–May 2005 measurements showed that within the basin, the cloud droplet size distribution had maritime environment characteristics. In addition, it was found that only clouds affected by smoke from VALE’s factory plume may satisfy the requirements of a narrow cloud base droplet spectra and a high concentration of droplets. The report also stated that the cloud formation process over the basin was different from month to month and in between seasons. Evidence showed that in March, the clouds needed to grow to higher altitudes before developing into precipitating clouds. The report recommended that cloud seeding techniques for clouds over the Larona Basin must be adopted and that the correct timing for cloud seeding operations must include the dry season while excluding the months of April–May. Based on this recommendation and given the basin’s topography, including its RH and Liquid Water Content (LWC) parameters, which are still wet, we have developed a ground-based hygroscopic seeding technique that uses hygroscopic flares-based GBG in the Larona Basin, Sorowako, Indonesia. The complete result of microphysics parameter measurement during the research in [21] is presented in Figure A2.
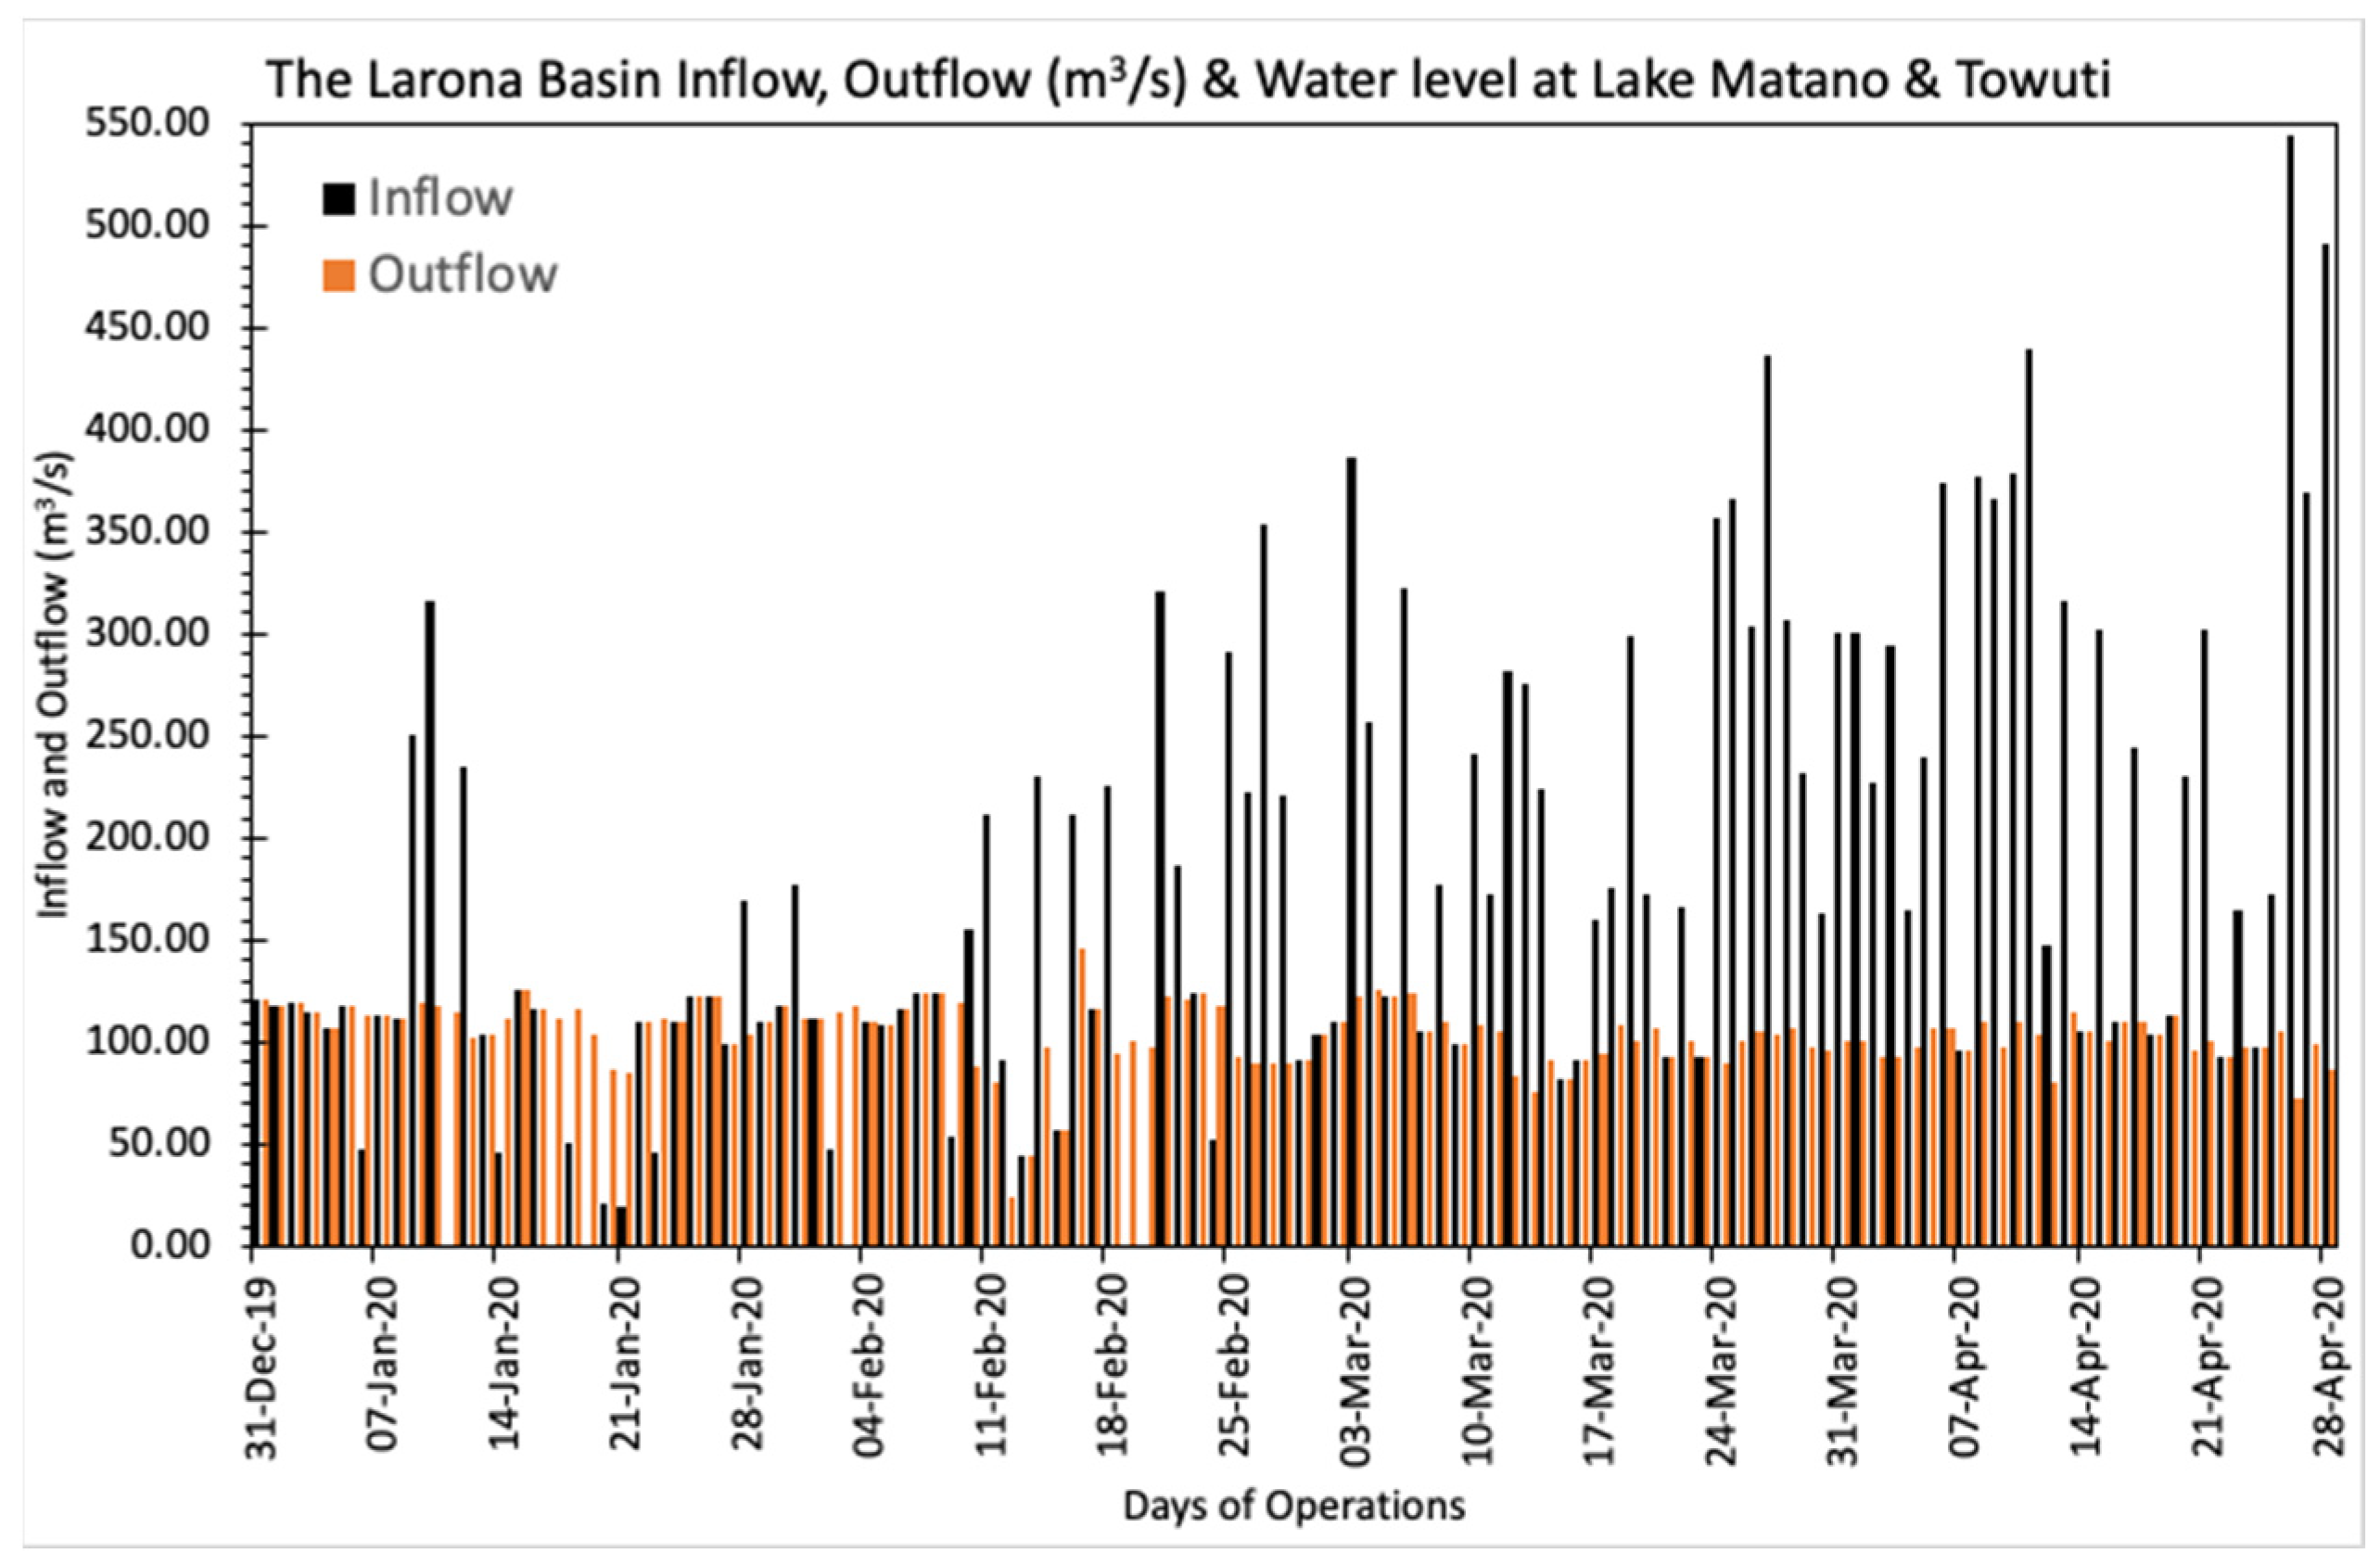
Discussing the aim to maintain lake water levels so that the hydropower plant can be normally operated, the lake water levels are mainly controlled by the rainfall amount that falls into the lake catchment area as run-off from streams/rivers or directly falls into the lake body of water. Another factor that controls the lake water level is lake outflow; this outflow is related to the hydropower plant operations, including how much water is needed to generate how much power. The Larona Basin hydropower plant operation was described in a previous study [22].
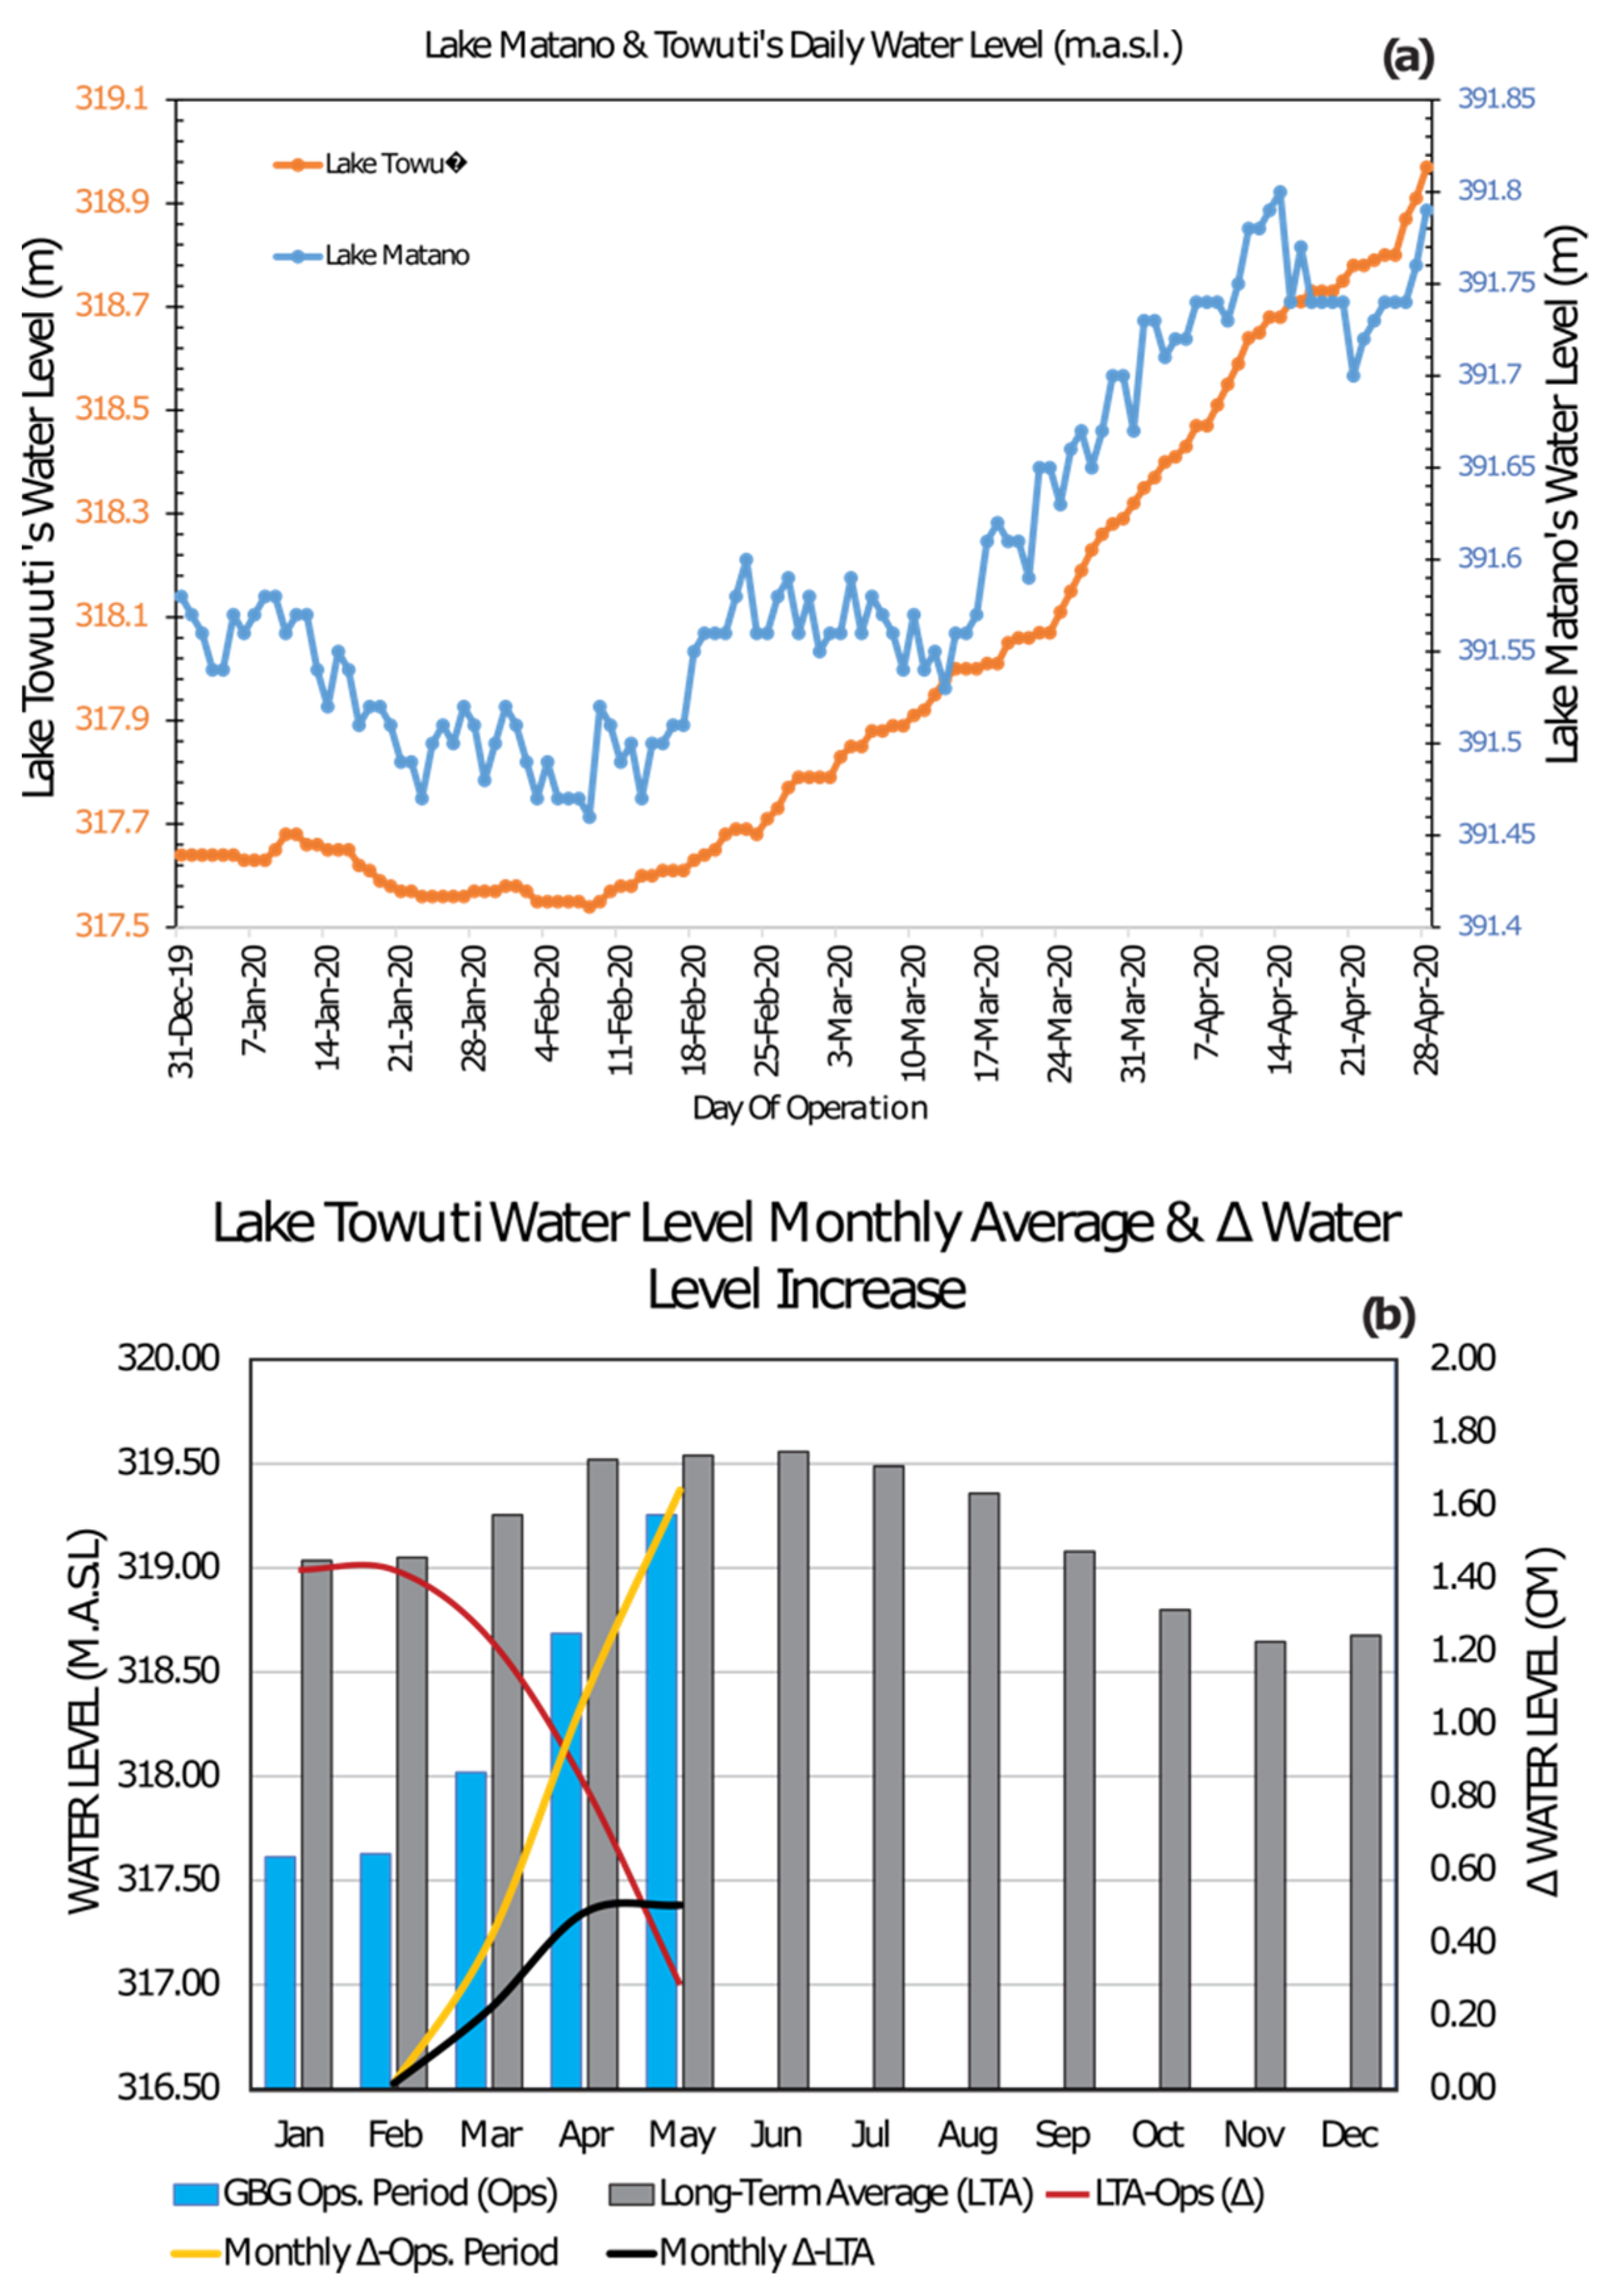
In this operation, even though there was an increase in the monthly rainfall amount in January, February, and March by as much as 79%, 17%, and 46%, respectively, compared to its climatological conditions, the increase in the water level for JFM was below 0.5%. The monthly average water level during GBG operations was compared with the long-term average conditions when the cloud seeding operation was not active to see the effect of cloud seeding operations on lake water level conditions (Figure 9b). The results showed that the trend of lake water level rise during cloud seeding operations was higher than the long-term average, as discussed in 
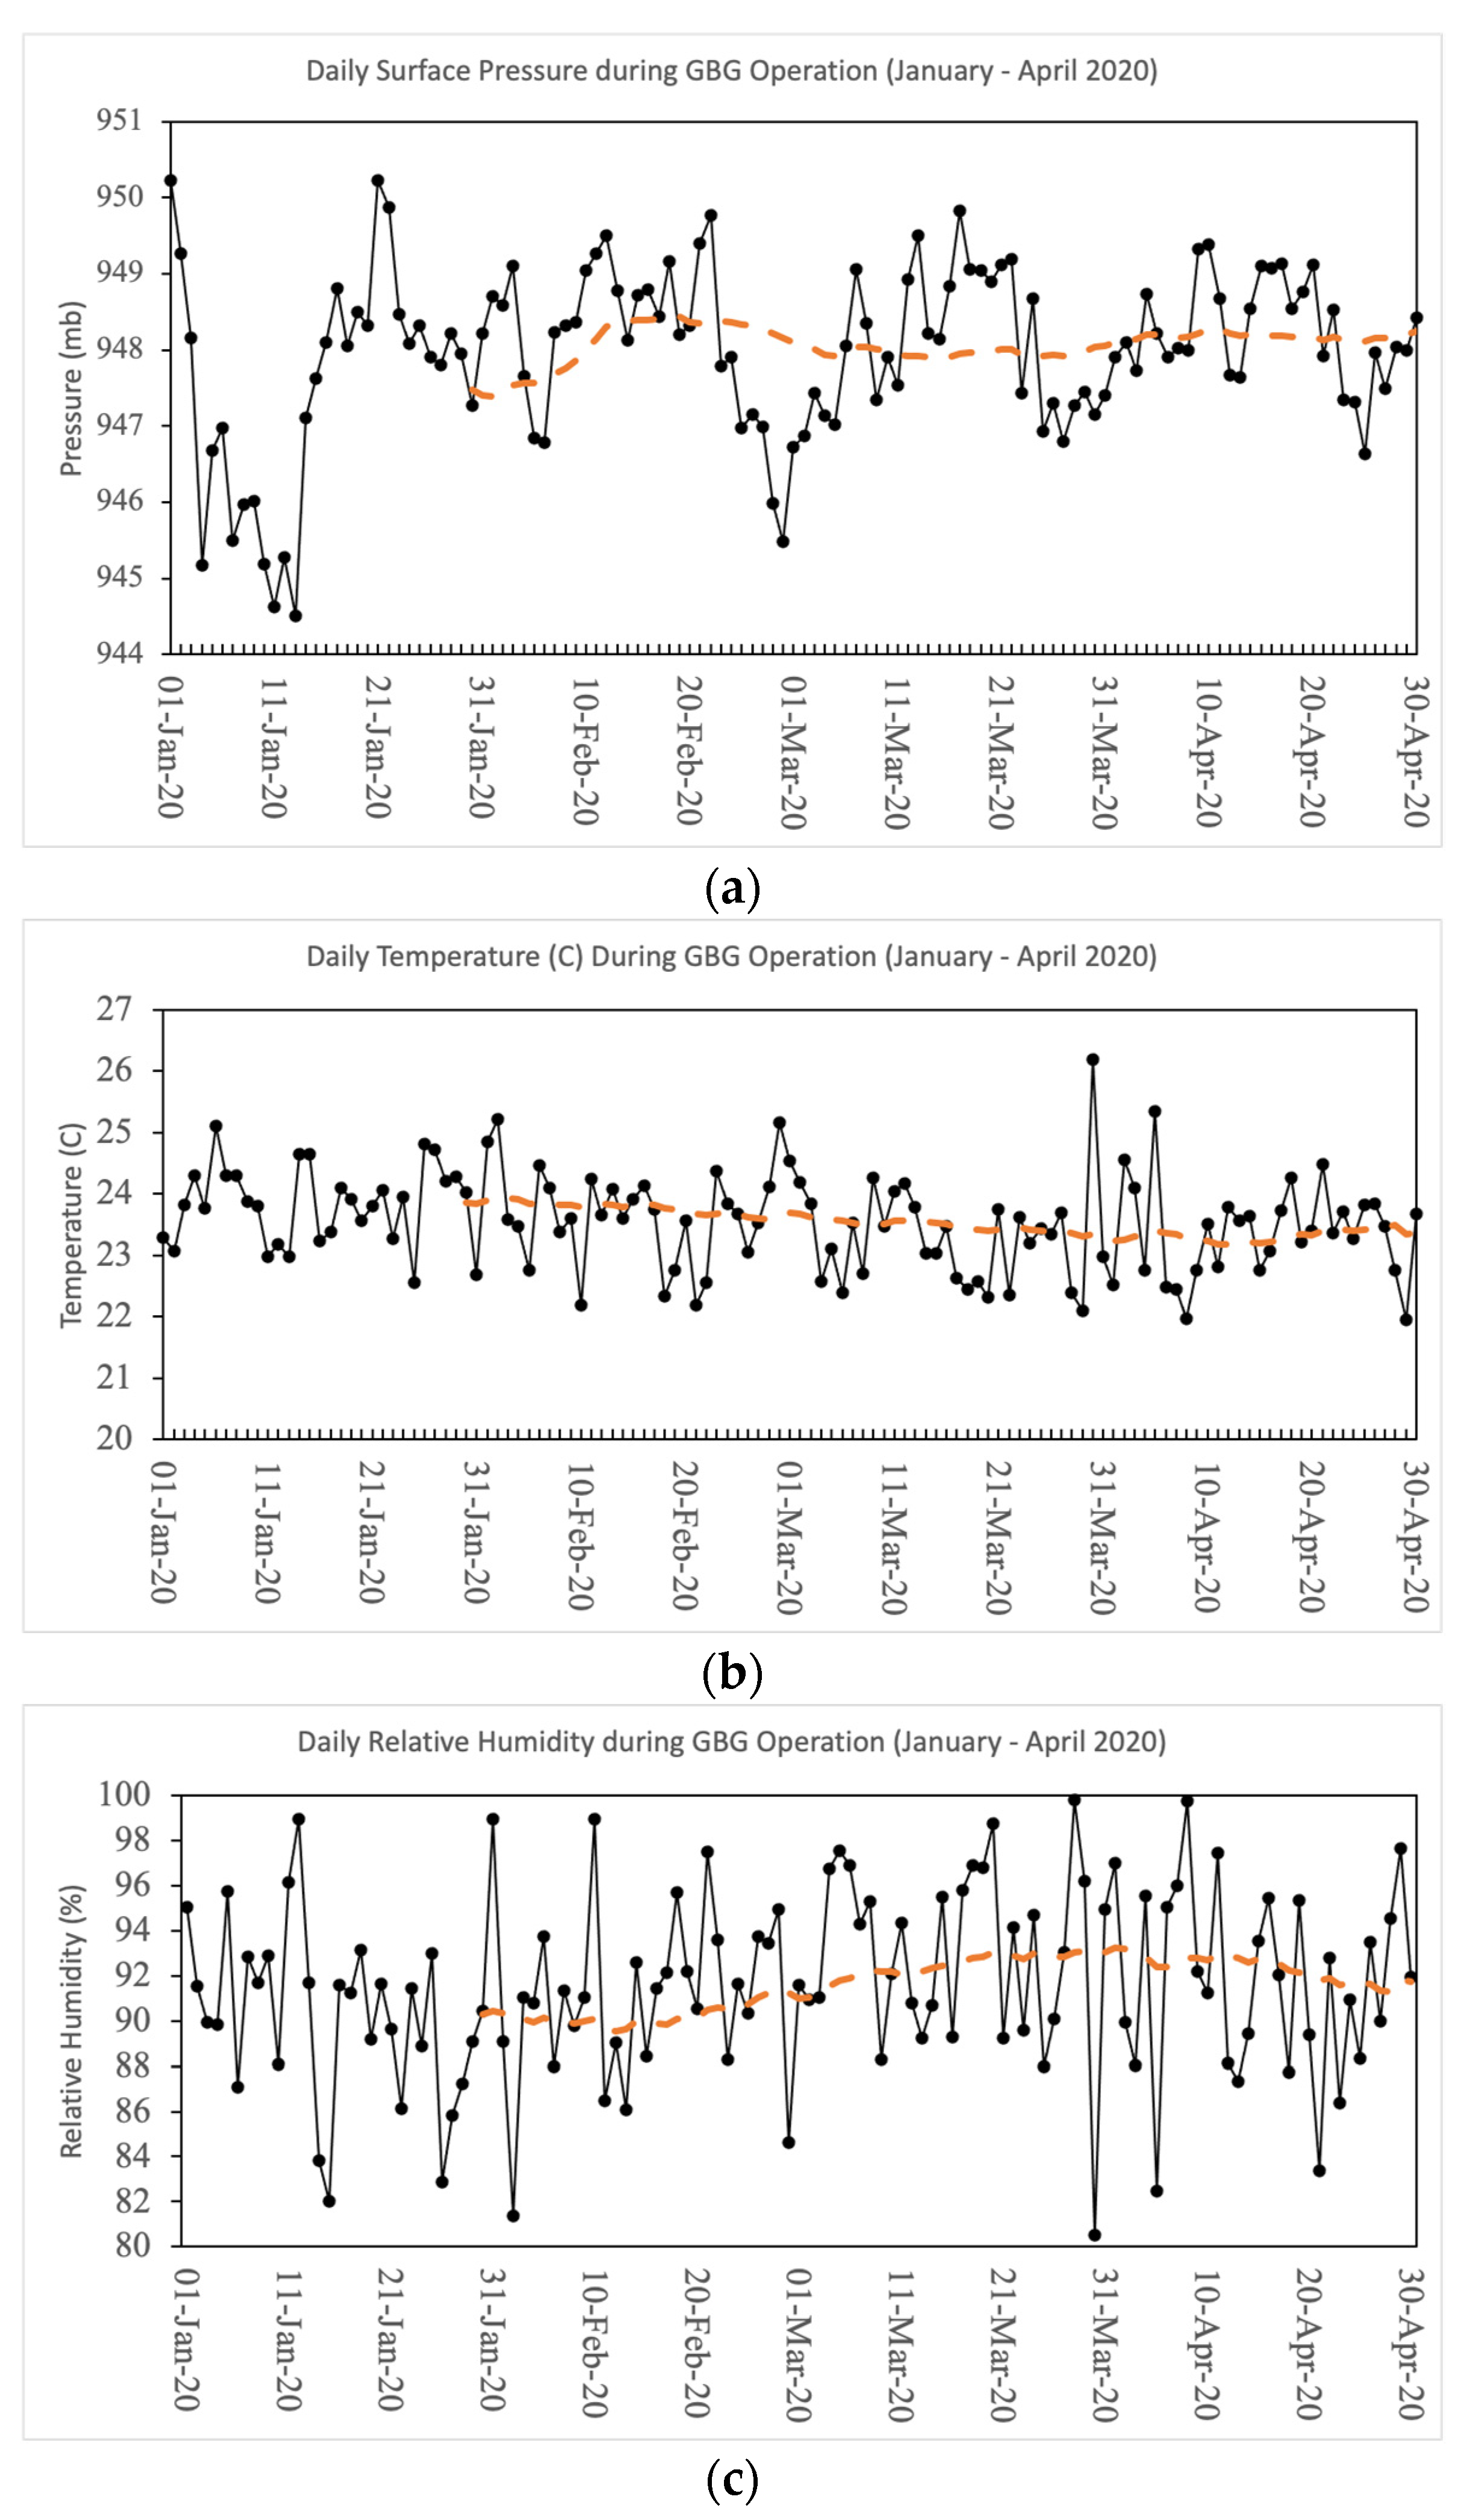
Section 3.2. Further analysis needs to be performed to explore whether hygroscopic ground-based cloud seeding operations directly impact the lake water levels in the Larona basin. Whether or not the increase in the water levels is due to its temporal variability is beyond the scope of this study. For example, the exploration and analysis of other weather factors such as pressure, temperature, and RH would also help determine whether those parameters control the rainfall amount in this area. Temporal variability of pressure, temperature, and RH during the GBG operation period are presented in Figure A3. Analyzing such matters would be essential to determine what controls the rainfall amount. The ideal operation of a cloud seeding should involve complete microphysics and meteorological parameters observation such as weather radars, airborne measurements, and satellite observations. These observations would help determine the impact of cloud seeding on rainfall and water level increases.
A significant environmental challenge during the 2020 Larona Basin GBG operations was the flare’s physical impact on the surrounding basin’s environment. As previously mentioned, the GBG uses NaCl-based hygroscopic flares to seed nearby orographic clouds [24]. Other flare materials are KClO4 and BaClO3-Ba(NO3)2 as oxidizing agents, with Mg powders to aid in flare ignition. The physical impact of these substances, especially after ignitions, was then quantitatively determined and measured by performing water quality characterizations on samples taken from several locations within the basin. The samples and measurements were taken during the GBG operational period. This period was specifically chosen to observe the flares’ physical effects on water quality during an ongoing operation. The water quality characterizations consisted of physical and chemical characterizations. The physical characterization was carried out by measuring the water’s electrical conductivity (in μS/cm). At the same time, the chemical characterizations were performed by measuring the water’s Li, Al, Cl, K, Na, and Mg contents (in ppm) and its pH. A water electrical conductivity test was performed to detect the presence of foreign pollutants within the basin, which would cause significant changes in the basin’s baseline electrical conductivity [26,27]. The chemical substance characterizations were performed to measure Li, Al, Cl, K, Na, and Mg concentrations that may influence water quality parameters (e.g., color and turbidity) when present in high amounts [28], while the pH characterization was carried out to measure the acid–base balance within the water body, i.e., to know the water’s acidity or alkalinity level. The resulting physical and chemical characterizations were then compared and analyzed with regard to drinking-water guidelines from national and international regulatory/governing bodies. The national drinking-water guidelines come from the Republic of Indonesia Ministry of Health Regulation No. 32, year 2017, and the Ministry of Health Regulation No. 492/MENKES/PER/IV/2010 [29]. Note also that these regulations do not cover the maximum limit allowable for Li, K, and Mg substances. The international drinking-water guidelines come from WHO’s fourth Edition Guidelines for Drinking Water Quality and Trace Elements in Human Nutrition and Health report, respectively published in 2022 and 1996. All of the characterization results, including the date the samples were taken, can be seen in Table A2.
Compared to The Indonesian Ministry of Health’s drinking-water regulations, Table A2 results show that all nine samples’ electrical conductivity, Al, Cl, and Na amounts were well below the maximum limit stated in the regulations, while the pH level in all locations, except for Lake Matano and Towuti, was lower than the prescribed minimum pH limit. Next, compared to the WHO’s drinking-water guidelines, all samples’ electrical conductivity, Li, Al, Cl, K, Na, and Mg amounts were well below the maximum limit allowable in the guidelines, while the pH level in all locations, except Lake Matano and Towuti, was again lower than the guideline’s minimum pH limit. We can then conclude that the GBG operation’s physical impact was very low or insignificant in terms of the basin water’s electrical conductivity, Li, Al, Cl, K, Na, and Mg amounts. However, in terms of pH amounts, there is a relatively small impact on the basin from the ongoing GBG operations.

5. Conclusions

Based on a previous feasibility study on conducting weather modification through cloud seeding operations over the Larona Basin, we have designed ground-based hygroscopic seeding that utilizes GBG instruments. This operation was carried out to maintain the water level in the surrounding lakes in the Larona Basin, which is essential for the operation of the Vale Indonesia hydropower plant. The 2020 GBG operation over the Larona Basin was conducted for 120 days from December 2019 to April 2020. By utilizing four GBG towers across the basin, we targeted warm orographic clouds that formed in the hills surrounding the basin. The results showed an increase in rainfall amount around Larona Basin and consequently an increase in the water level of surrounding lakes, i.e., in Lake Matano and Towuti. Even though there was a promising result from the ground-based hygroscopic seeding operation, some work still needs to be done, especially in terms of statistical and physical evaluation of the seeding effect in enhancing the rainfall amount over the Larona Basin and the seeding effect on the rise of lake water level. Continuous measurement of the microphysical parameters using weather radar data or airborne measurement and numerical modeling to forecast future conditions are among the works that need to be carried out to show more scientific evidence in favor of a cloud seeding operation. Other than this, ethical conflicts with associated communities regarding cloud seeding operations need to be mitigated by demonstrating the evidence of the operation’s scientific benefits and its relative safety to local communities.

Supplementary Materials

The following supporting information can be downloaded at: https://www.mdpi.com/article/10.3390/atmos13060968/s1. Weekly Report 01 to Weekly Report 13 provide global weather observation data during operation.

Author Contributions

Conceptualization, F.R., K.A. and E.A.; methodology, P.P. and E.M.; data processing, H.A.B. and R.S.; data analysis, S.D.; writing—original draft preparation, F.R. and K.A.; writing—review and editing, M.K., H.A.B., S.D., P.P., E.M., R.S. and E.A.; supervision, J.A. All authors have read and agreed to the published version of the manuscript.

Funding

This research received no external funding.

Institutional Review Board Statement

Not applicable.

Informed Consent Statement

Not applicable.

Data Availability Statement

The data used in this manuscript are downloaded from the following open websites: ERA-5: https://confluence.ecmwf.int/display/CKB/Use+Case+1%3A+ERA5-Land+hourly+data+from+1950+to+present (accessed on 1 March 2022). GSMaP Realtime: https://sharaku.eorc.jaxa.jp/GSMaP/index.htm (accessed on 1 March 2022).

Acknowledgments

The authors would like to thank the National Laboratory for Weather Modification technology of Indonesia for all of the data and resources used in this study. The authors also thank Vale Indonesia. This study was carried out in cooperation with Vale Indonesia during the 2020 GBG operation.

Conflicts of Interest

The authors declare no conflict of interest.

Appendix A

Figure A1. (a) Wind regime at Petea Tower in DFJ at 00 UTC; (b) wind regime at Petea Tower in MAM season 00 UTC; (c) same as (a) but at 12 UTC; (d) same as (b) but at 12 UTC; (e) wind regime at Himalaya Hill Tower in DJF at 00 UTC; (f) wind regime at Bukit Himalaya Hill Tower in MAM at 00 UTC; (g) same as (e) at 12 UTC; (h) same as (h) at 12 UTC.
Atmosphere 13 00968 g0a1
Figure A2. Time history of altitude (m), cloud droplet concentration (cm−3), temperature (C), liquid water content (LWC, gm−3), mean droplet diameter (MD, μm), mean volume diameter (MVD, μm), and effective radius (ER, μm) (i); and the droplet size distributions for the four penetrations marked in (i), (ii) near cloud base at 24 April 2005 (adapted from [18]).
Atmosphere 13 00968 g0a2
Figure A3. (a) Daily surface pressure during GBG operation (January–April 2020) with 30 days’ moving average (dashed orange line); (b) daily near-surface temperature during GBG operation (January–April 2020) with 30 days’ moving average (dashed orange line); (c) daily relative humidity during GBG operation (January–April 2020) with 30 days’ moving average (dashed orange line). All data are from ERA5 reanalysis data.
Atmosphere 13 00968 g0a3
Table A1. Day by day flare usage for five GBG towers during the 2020 weather modification operation in Larona Basin in the 31 December 2019–28 April 2020 period.
No.DateFlare Usage
HimalayaSalonsaAsuliPeteaCinta HillsTotal
131 December 2019 2 2
21 January 2020 2 2
32 January 2020 11
43 January 2020 1 12
54 January 2020 2 24
65 January 2020 1 12
76 January 2020 11
87 January 2020 22
95 February 2020 2 2
106 February 2020 -
117 February 2020 2 2
128 February 2020 1 1
139 February 2020 3 3
1410 February 2020 2 2
1511 February 2020 -
1612 February 2020 2 2
1713 February 2020 2 2
1814 February 2020 3 3
1915 February 2020 2 2
2016 February 2020 2 2
2117 February 2020 2 2
2218 February 2020 1 1
2319 February 2020 2 2
2420 February 2020 2 2
2521 February 2020 2 2
2622 February 2020 -
2723 February 2020 -
2824 February 202011 13
2925 February 202022 4
3026 February 202021 25
3127 February 202013 15
3228 February 2020
3329 February 202011 13
341 March 202011 13
352 March 202013 4
363 March 202011 24
374 March 2020 1 12
385 March 202011 13
396 March 2020 -
407 March 20201 1 2
418 March 2020 1 1
429 March 2020 1 1
4310 March 2020 -
4411 March 20201 1
4512 March 2020 11 2
4613 March 20201 1 2
4714 March 2020 1 1
4815 March 2020 -
4916 March 2020 1 23
5017 March 2020 -
5118 March 2020 1 1
5219 March 2020 1 1
5320 March 2020 1 12
5421 March 2020 11 13
5522 March 2020 1 1
5623 March 2020 11 13
5724 March 2020 -
5825 March 2020 21 25
5926 March 2020 -
6027 March 2020 1 23
6128 March 2020 11 13
6229 March 2020 11
6330 March 2020 11 13
6431 March 2020 1 12
651 April 2020 1 12
662 April 2020 1 12
673 April 2020 1 12
684 April 2020 1 12
695 April 2020 1 23
706 April 2020 1 12
717 April 2020 11
728 April 2020 1 1
739 April 2020 22
7410 April 2020 2 13
7511 April 2020 11
7612 April 2020 -
7713 April 2020 -
7814 April 2020 1 23
7915 April 2020 1 12
8016 April 2020 11
8117 April 2020 -
8218 April 2020 -
8319 April 2020 2 13
8420 April 2020 -
8521 April 2020 22
8622 April 2020 2 13
8723 April 2020 33
8824 April 2020 1 12
8925 April 2020 --
9026 April 2020 -
9127 April 2020 2 2
9228 April 2020 -
Table A2. The Larona basin’s water quality characterizations results, which consist of physical and chemical characterizations. The physical characterization was performed by measuring the water’s electrical conductivity (in μS/cm), while the chemical characterizations were performed by measuring the water’s Li, Al, Cl, K, Na, and Mg content (in ppm) and its pH.
No.Sample LocationsDate TakenpHElect. Conductivity (μS/cm)Li (ppm)AlClKNaMg
(dd/mm/yy)(ppm)(ppm)(ppm)(ppm)(ppm)
1.Pontada5 March 20204.3513.66−0.000260.03097<0.10.027210.4991.046
2.Sumasang24 February 20205.5213.020.000150.029040.40.137360.4311.261
3.Wawondula27 February 20204.139.340.000050.00005<0.10.230430.730.708
4.Asuli24 February 20203.6631.70.000080.04207<0.10.065370.5040.964
5.Wasuponda24 February 20205.0220.01−0.000160.05228<0.10.132250.81.641
6.Nuha27 February 20204.3820.2−0.000380.0263<0.10.029840.703<0.001
7.Malili5 March 20204.8816.16−0.000190.04606<0.1−0.031470.4980.476
8.Lake Matano18 February 20206.96182.50,000380.01321<0.10.2321.0388.856
9.Lake Towuti26 February 20206.55147.30,000200.05588<0.10.1761.0229.405

References

  1. Liu, Y.; Luo, R.; Zhu, Q.; Hua, S.; Wang, B. Cloud ability to produce precipitation over arid and semiarid regions of Central and East Asia. Int. J. Climatol. 2020, 40, 1824–1837. [Google Scholar] [CrossRef]
  2. Zhao, P.; Xiao, H.; Liu, J.; Zhou, Y. Precipitation efficiency of cloud and its influencing factors over the Tibetan plateau. Int. J. Climatol. 2022, 42, 416–434. [Google Scholar] [CrossRef]
  3. Abshaev, A.M.; Flossmann, A.; Siems, S.T.; Prabhakaran, T.; Yao, Z.; Tessendorf, S. Rain Enhancement through Cloud Seeding. In Unconventional Water Resources; Springer: Cham, Switzerland, 2022; pp. 21–49. [Google Scholar]
  4. Rosenfeld, D.; Axisa, D.; Woodley, W.L.; Lahav, R. A quest for effective hygroscopic cloud seeding. J. Appl. Meteorol. Climatol. 2010, 49, 1548–1562. [Google Scholar] [CrossRef]
  5. Drofa, A.S.; Ivanov, V.N.; Rosenfeld, D.; Shilin, A.G. Studying an effect of salt powder seeding used for precipitation enhancement from convective clouds. Atmos. Chem. Phys. 2010, 10, 8011–8023. [Google Scholar] [CrossRef]
  6. Drofa, A.S.; Eran’kov, V.G.; Ivanov, V.N.; Shilin, A.G.; Iskevich, G.F. Experimental investigations of the effect of cloud-medium modification by salt powders. Izvestiya Atmos. Ocean. Phys. 2013, 49, 298–306. [Google Scholar] [CrossRef]
  7. Jung, E.; Albrecht, B.A.; Jonsson, H.H.; Chen, Y.C.; Seinfeld, J.H.; Sorooshian, A.; Metcalf, A.R.; Song, S.; Fang, M.; Russell, L.M. Precipitation effects of giant cloud condensation nuclei artificially introduced into stratocumulus clouds. Atmos. Chem. Phys. 2015, 15, 5645–5658. [Google Scholar] [CrossRef] [Green Version]
  8. D’albe, E.F.; Lateef, A.M.A.; Rasool, S.I.; Zaidi, I.H. The cloud-seeding trials in the central Punjab, July-September 1954. Q. J. R. Meteorol. Soc. 1955, 81, 574–581. [Google Scholar] [CrossRef]
  9. Biswas, K.R.; Kapoor, R.K.; Kanuga, K.K.; Ramana Murty, B.V. Cloud seeding experiment using common salt. J. Appl. Meteorol. Climatol. 1967, 6, 914–923. [Google Scholar] [CrossRef] [Green Version]
  10. Murty, B.V.R.; KR, B. Weather modification in India. J. Meteorol. Soc. Jpn. 1968, 46, 160–165. [Google Scholar] [CrossRef] [Green Version]
  11. Pillai, A.G.; Reddy, R.S.; Vijayakumar, R.; Kapoor, R.K.; Murty, A.R.; Selvam, A.M.; Murty, R.R. Ground-based Salt Seeding in Tamil Nadu State, South India, 1973–1977. J. Weather Modif. 1981, 13, 177–181. [Google Scholar]
  12. Cotton, W.R. Modification of precipitation from warm clouds—A review. Bull. Am. Meteorol. Soc. 1982, 63, 146–160. [Google Scholar] [CrossRef] [Green Version]
  13. Bruintjes, R.T. A review of cloud seeding experiments to enhance precipitation and some new prospects. Bull. Am. Meteorol. Soc. 1999, 80, 805–820. [Google Scholar] [CrossRef] [Green Version]
  14. Silverman, B.A. A critical assessment of hygroscopic seeding of convective clouds for rainfall enhancement. Bull. Am. Meteorol. Soc. 2003, 84, 1219–1230. [Google Scholar] [CrossRef] [Green Version]
  15. Flossmann, A.I.; Manton, M.J.; Abshaev, A.; Bruintjet, R.; Murakami, M.; Prabhakaran, T.; Yao, Z. Peer Review Report on Global Precipitation Enhancement Activities. Doctoral Dissertation, WMO, Geneva, Switzerland, 2018. [Google Scholar]
  16. Mordy, W. Computations of the growth by condensation of a population of cloud droplets. Tellus 1959, 11, 16–44. [Google Scholar] [CrossRef] [Green Version]
  17. Tessendorf, S.A.; Bruintjes, R.T.; Weeks, C.; Wilson, J.W.; Knight, C.A.; Roberts, R.D.; Peter, J.R.; Collis, S.; Buseck, P.R.; Freney, E.; et al. The Queensland cloud seeding research program. Bull. Am. Meteorol. Soc. 2012, 93, 75–90. [Google Scholar] [CrossRef]
  18. Jensen, J.B.; Nugent, A.D. Condensational growth of drops formed on giant sea-salt aerosol particles. J. Atmos. Sci. 2017, 74, 679–697. [Google Scholar] [CrossRef]
  19. Chen, S.; Xue, L.; Yau, M.K. Impact of aerosols and turbulence on cloud droplet growth: An in-cloud seeding case study using a parcel–DNS (direct numerical simulation) approach. Atmos. Chem. Phys. 2020, 20, 10111–10124. [Google Scholar] [CrossRef]
  20. Chen, S.; Xue, L.; Yau, M.K. Hygroscopic Seeding Effects of Giant Aerosol Particles Simulated by the Lagrangian-Particle-Based Direct Numerical Simulation. Geophys. Res. Lett. 2021, 48, e2021GL094621. [Google Scholar] [CrossRef]
  21. Research Applications Laboratory; National Center for Atmospheric Research (NCAR). Feasibility Study for the Augmentation of Rain in Sulawesi, Final Report to INCO; Weather Modification Inc.: Fargo, ND, USA, 2005. [Google Scholar]
  22. Prasetio, A.; Widjiantoro, B.L.; Nasution, A.M. Overview of ground-based generator towers as cloud seeding facilities to optimize water resources in the Larona Basin. MATEC Web Conf.-EDP Sci. 2019, 276, 06025. [Google Scholar] [CrossRef] [Green Version]
  23. Purwadi, P.; Seto, T.H. Desain Konseptual Ground Based Generator (GBG) Otomatis dan konsep operasional berbasis wireless sensor network (WSN). JSTMC 2014, 15, 9–14. (In Bahasa) [Google Scholar] [CrossRef] [Green Version]
  24. Agency for the Assessement and Application of Technology. CoSAT 1000: Cloud Seeding Agent Tube; Internal Report; Agency for the Assessement and Application of Technology: Jakarta, Indonesia, 2020. [Google Scholar]
  25. Tao, T. Local Inflow Calculator for Reservoirs. Can. Water Resour. J. 1999, 24, 53–59. [Google Scholar] [CrossRef] [Green Version]
  26. Meride, Y.; Ayenew, B. Drinking water quality assessment and its effects on residents health in Wondo genet campus, Ethiopia. Env. Syst Res 2016, 5, 1. [Google Scholar] [CrossRef] [Green Version]
  27. WHO. Guidelines for Drinking-Water Quality: Fourth Edition Incorporating the First and Second Addenda. Available online: https://www.who.int/publications/i/item/9789240045064 (accessed on 9 May 2022).
  28. WHO. Trace Elements in Human Nutrition and Health. Available online: http://apps.who.int/iris/handle/10665/37931 (accessed on 9 May 2020).
  29. Indonesia Ministry of Health. Available online: https://www.kemkes.go.id/index.php?act=regulation (accessed on 9 May 2020).
Figure 1. (a) GBG technical design; (b) flare bucket; (c) electronic ignition schematic ignition (bottom right).
Atmosphere 13 00968 g001
Figure 2. The GBG’s hygroscopic flares particle concentration vs. diameter measurements plot. The concentrations were measured with respect to 0.3, 0.5, 1, 2.5, 5, and 10 μm particle diameters.
Atmosphere 13 00968 g002
Figure 3. (a) A map of the Larona basin within Sulawesi, Indonesia, and the locations of all five GBG towers (yellow stars) and rain-gauge location (red circles); (b) topography cross sections of the A–B line (red line in (a)); and (c) topography cross section of the A–D line (black line in (a)).
Atmosphere 13 00968 g003
Figure 4. (a) Climatological conditions of RH; (b) surface pressure; (c) monthly rainfall amount; and (d) surface temperature over Sorowako (Larona Basin). The climatological period was calculated from 2009 to 2019. Monthly rainfall amount was derived from rain-gauge measurements, whereas RH, surface pressure, and temperature were derived from ERA5 reanalysis data.
Atmosphere 13 00968 g004
Figure 5. Schematic diagram of hygroscopic ground-based cloud seeding over Larona Basin. The wind regime will bring moisture from the lake water bodies into hills/mountains in the northern and western areas. Flares in the GBG towers will add CCN into newly developed orographic clouds, and enhance the precipitation process inside the cloud, changing cloud droplets into rain droplets.
Atmosphere 13 00968 g005
Figure 6. The daily standard operating procedure (SOP) applied for each operating tower in the 2020 GBG operations in the Larona Basin, Sorowako, Sulawesi.
Atmosphere 13 00968 g006
Figure 7. (a) The daily average rainfall amounts in the Larona Basin, Sulawesi, Indonesia. (b) Monthly rainfall amount during GBG operation days (blue column) and climatological monthly rainfall amount during years without GBG operation (orange column). Non-GBG operation years were 2010–2015 and 2017–2019.
Atmosphere 13 00968 g007
Figure 8. Four periods of total spatial rainfall amount distributions (in mm) from the Larona Basin, Sorowako as obtained from NASA and JAXA’s Tropical Rainfall Measuring Mission (TRMM) satellite: (a) the 1st spatial data period was a sum of spatial data from 31 December 2019 to 31 January 2020; (b) the 2nd was the sum from 1 to 29 February 2020; (c) the 3rd was the sum from 1 to 31 March 2020; (d) and the 4th was the sum from 1 to 28 April 2020. The measured total spatial rainfall amount has a spatial resolution of 0.1° and a temporal resolution of 1 h.
Atmosphere 13 00968 g008
Figure 9. (a) Daily water level measurement (m.a.s.l.) for Lake Matano (blue line) and Lake Towuti 326 (orange line) during ground-based weather modification operations (31 December 2019–28 April 2020); (b) Lake Towuti water level monthly average during GBG operation period January–April 2020 (blue column) and Lake Towuti water level long-term average (2010–2015; 2017–2019) (grey column); the red line indicates water level differences between the long term average and the GBG operations period, the yellow line represent the difference of water level on each month compared to January during the GBG operations period, and the black line is the same as the yellow line but for long-term average condition.
Atmosphere 13 00968 g009
Figure 10. The resulting inflow (black bars) and outflow (orange bars) measurements’ (in m3/s) histogram from the entire (Larona) basin for the 120 days (31 December 2019–28 April 2020) of GBG operations.
Atmosphere 13 00968 g010
Table 1. All five towers’ names, coordinates, and heights, from the lowest to the highest, in the Larona Basin, Sorowako, Sulawesi.
No.Tower NameTower CoordinatesTower Height (m.a.s.l.)
1.Salonsa121.33° E, 2.51° S476
2.Petea121.48° E, 2.51° E500
3.Himalaya Hill121.39° E, 2.56° S635
4.Asuli Hill121.3° E, 2.60° S773
5.Cinta Hill121.49° E, 2.51° S804
Table 2. A detailed breakdown of total flare, total days of flare, and average daily flare usage for each tower, for 120 days of operations in Larona, Sorowako.
No.Tower NameTotal Flare Usage per TowerTotal Days of Flare Usage per TowerAverage Daily Flare Usage per Tower
1.Salonsa84572
2.Petea000
3.Himalaya Hill14121
4.Asuli Hill10101
5.Cinta Hill55421
Publisher’s Note: MDPI stays neutral with regard to jurisdictional claims in published maps and institutional affiliations.

