
Population Health Risks Assessment from Air Pollution Exposure in an Industrialized Residential Area in Greece

 ,
,  ,
,  , and
, and
Abstract
:1. Introduction
2. Materials and Methods
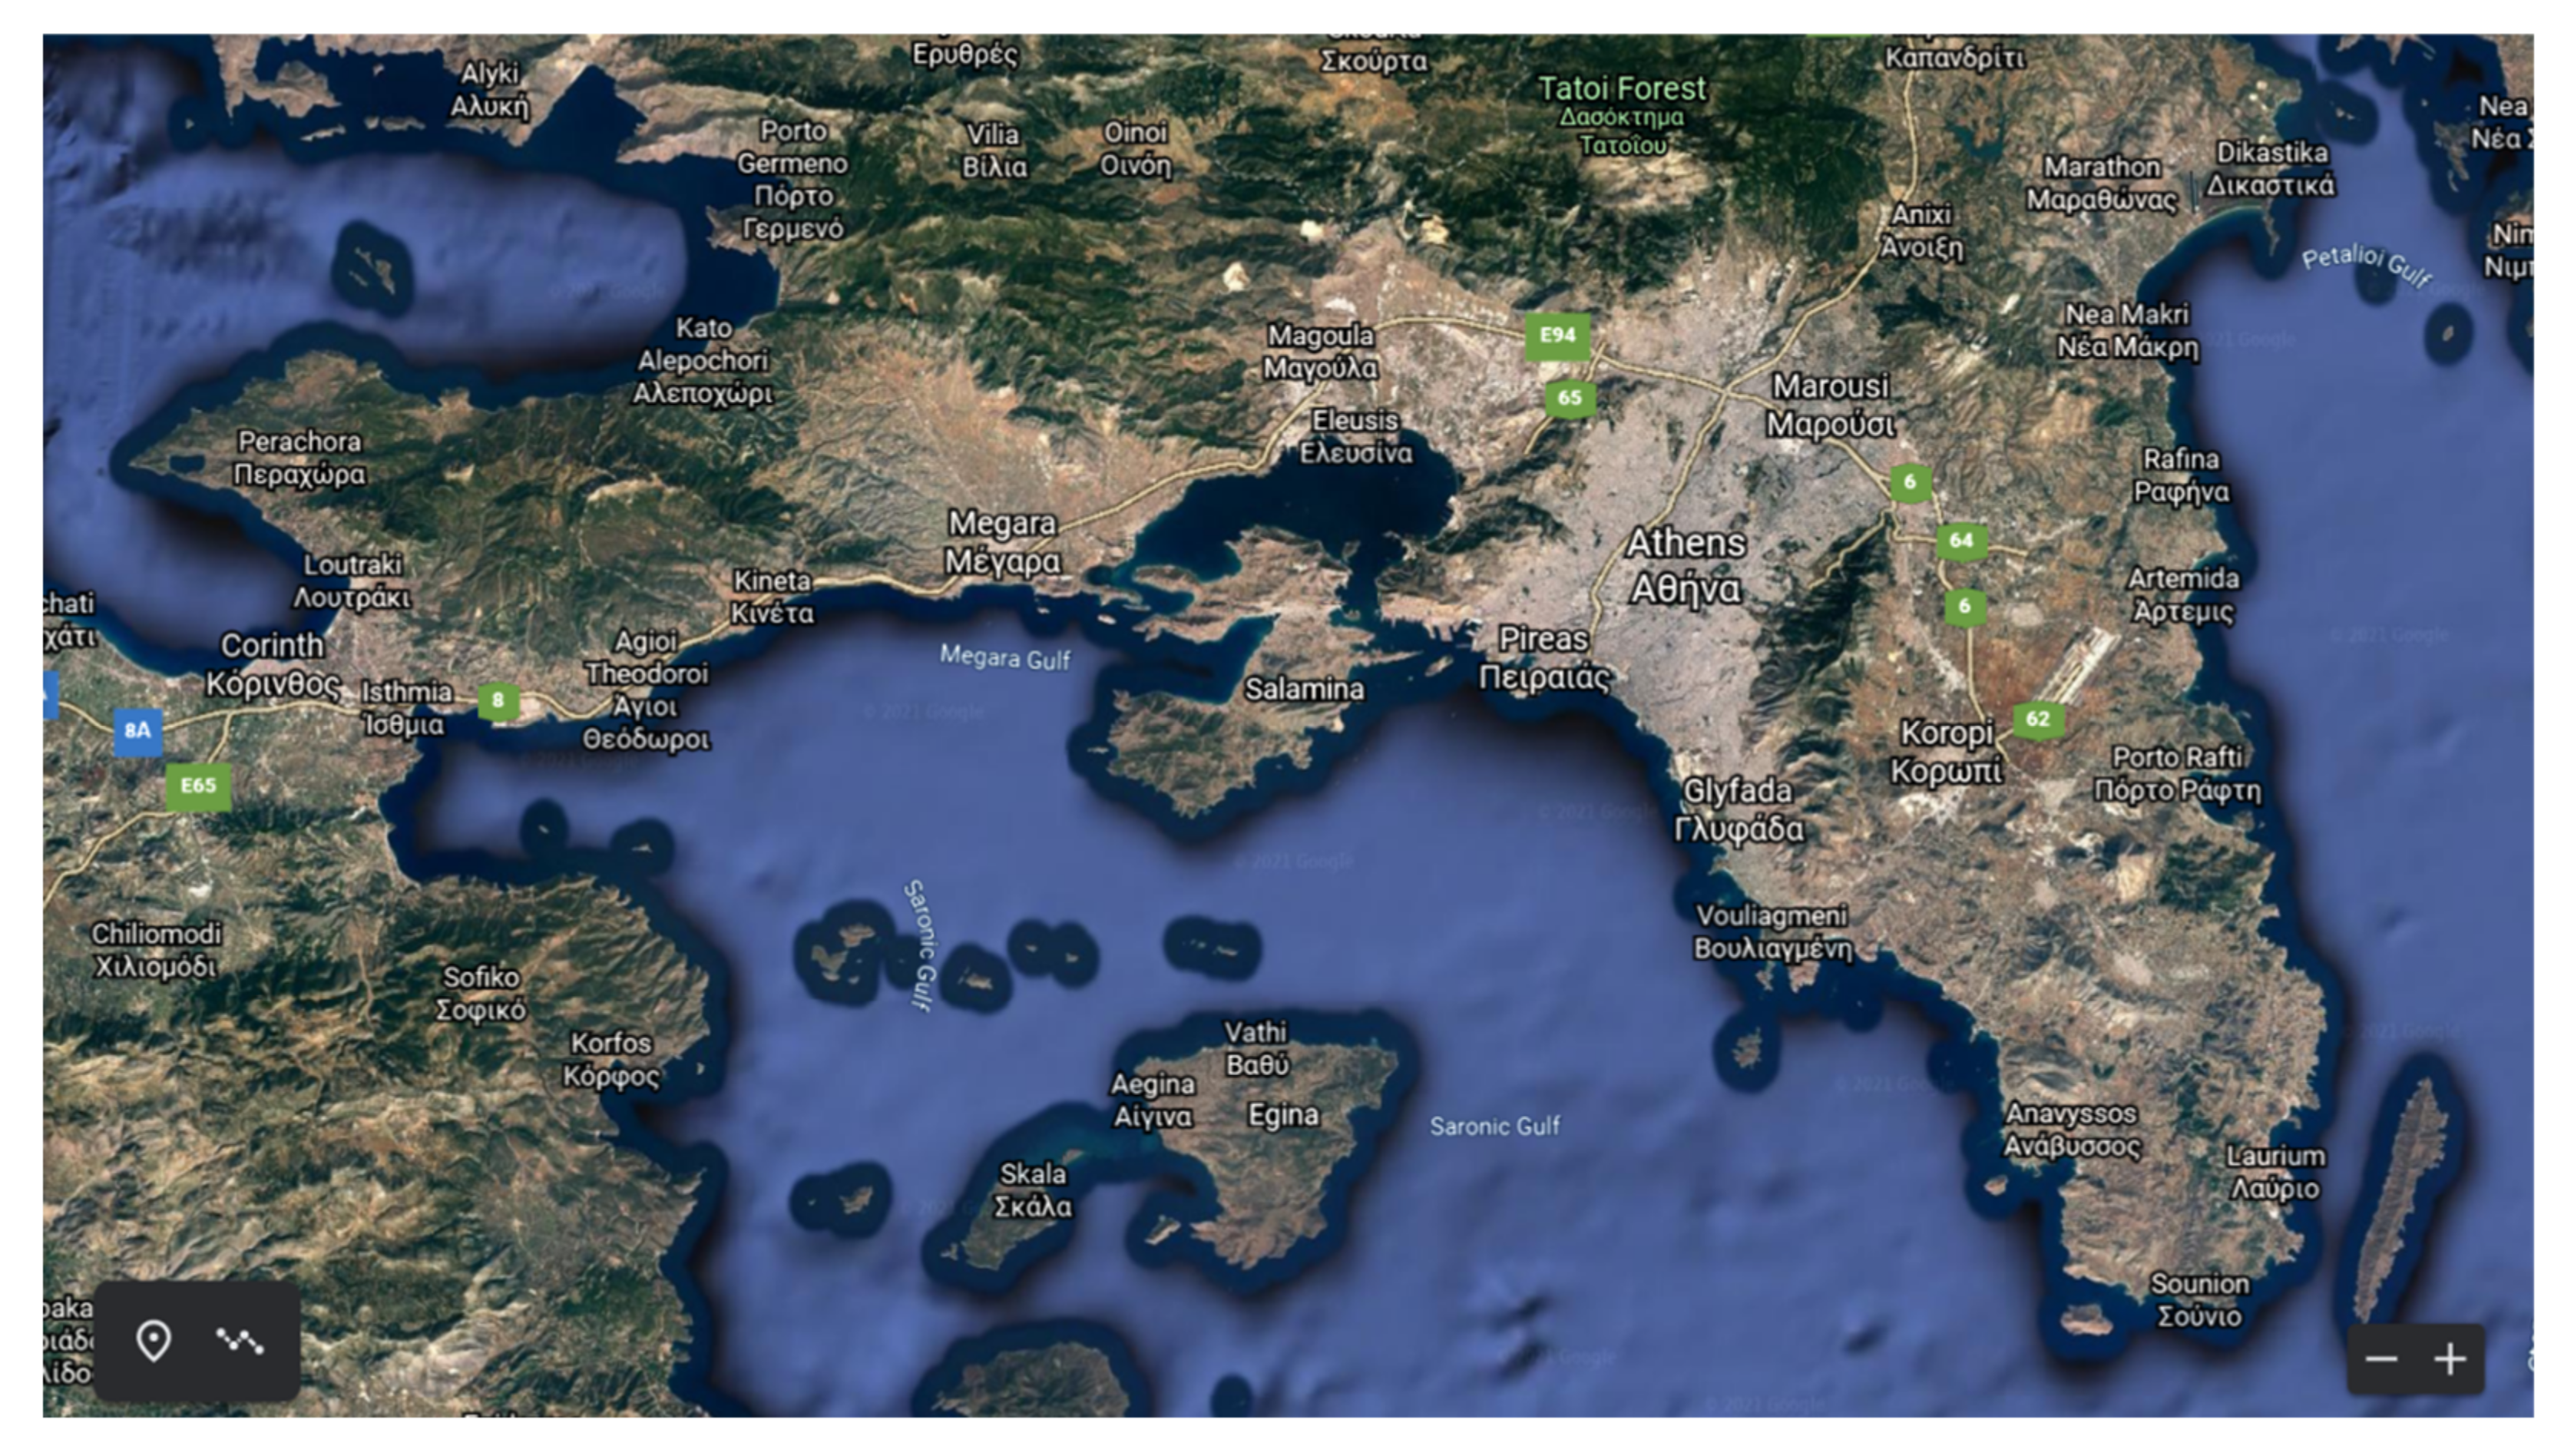
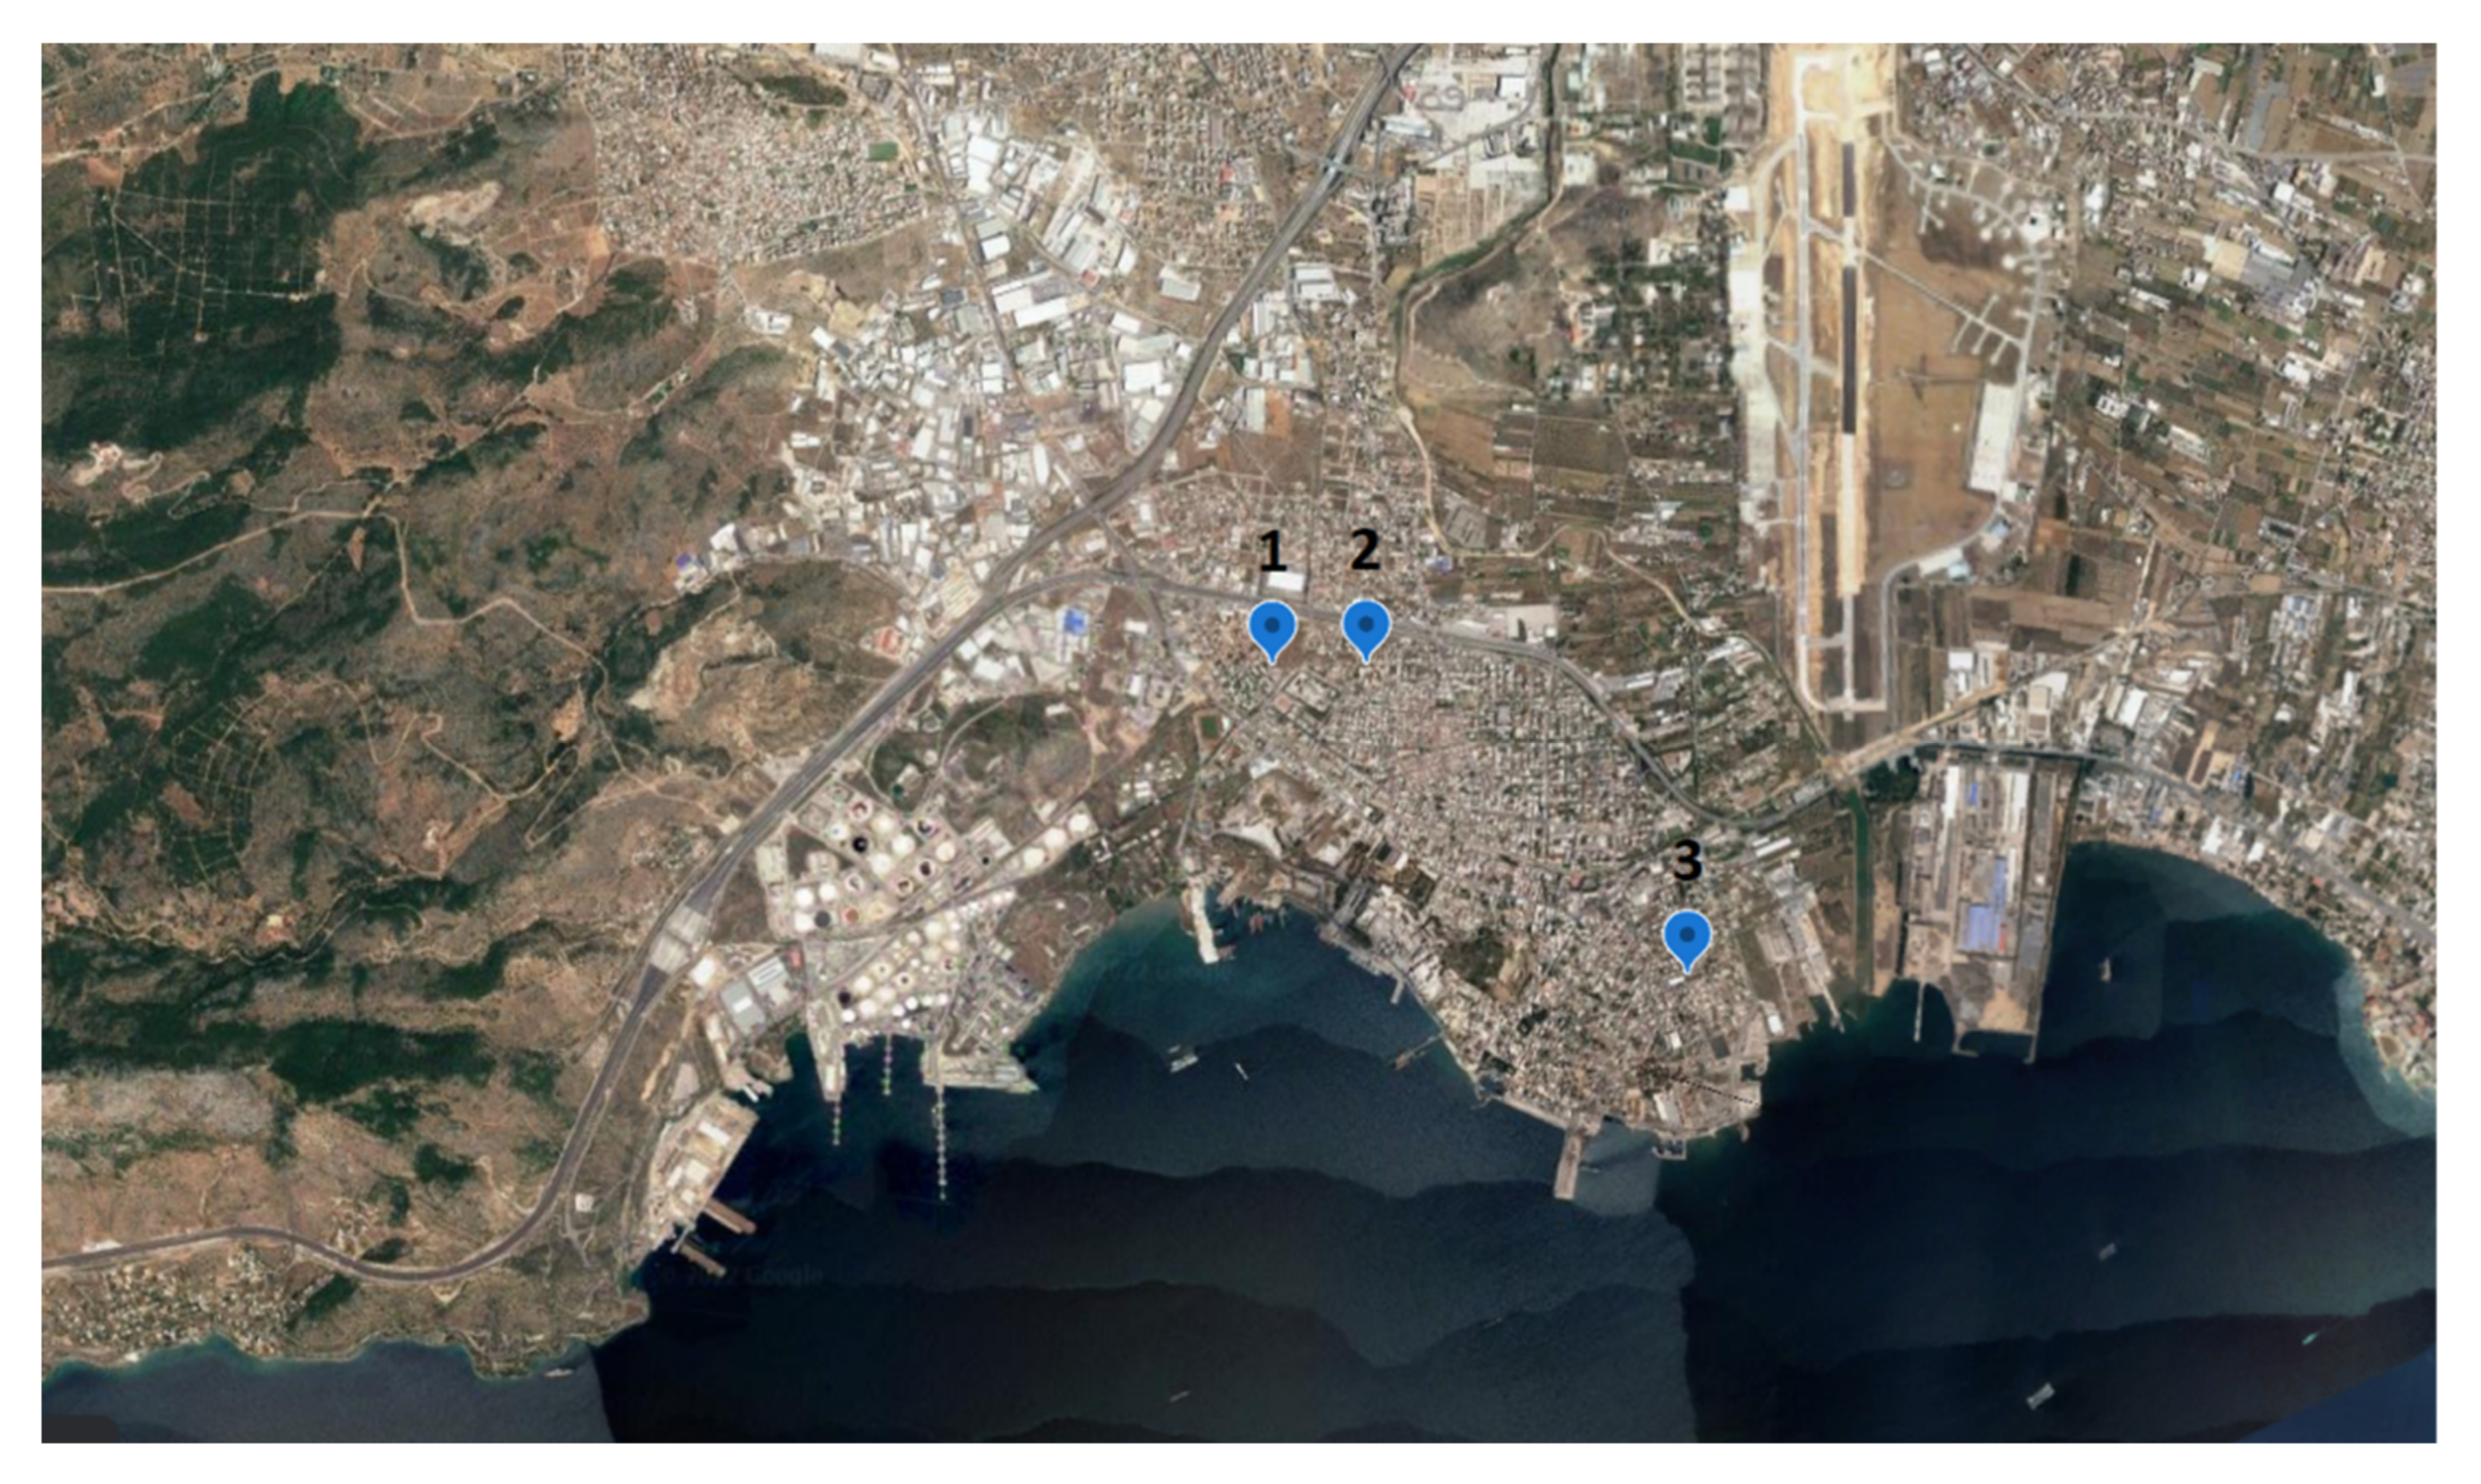
2.1. Location Description
2.2. Sampling and Chemical Analysis
2.3. Health Risk Assessment (Methodological Approach)
- For males: IR = 16.4 (m3/day) and BW = 76 (kg),
- For females: IR = 12.6 (m3/day) and BW = 63 (kg),
- For children of age 2–16 years old: IR = 10.8 (m3/day) and BW = 32.5 (kg),
- For children of age 0–2 years old: IR = 4.9 (m3/day) and BW = 10.3 (kg).
- For the calculation of the examined parameters, the average concentration of the considered pollutants given in Table 3 was used.
2.3.1. Carcinogenic Risk Assessment Methodological Approaches (Group A)
Methodology A.I
- AF0–2: 10-fold adjustment, for children between 0–2 years old
- AF2–16: 3-fold adjustment, for children between 3–16 years old
- AF16–80: no adjustment needed for children >16 years old and adults
Methodology A.II
Methodology A.III
Methodology A.IV
2.3.2. Risk Assessment for Carcinogenesis and non-Cancer Effects Approaches (Group B)
Methodology B.I
Methodology B.II
Methodology B.III
Methodology B.IV
2.3.3. Risk Assessment Approach Based on Methodologies Combination
Methodology C.I
Methodology C.II
3. Results and Discussion
3.1. Cancer Risk Assessment
3.2. Non-Cancer Effects
4. Conclusions
- The estimation of the risk for potential cancer and non-cancer effects varies depending on the applied methodology; however, the acceptable limits for cancer risk provided by OEHHA, EPA and WHO were not exceeded in any case except for one approach, as well as only one case (C.I & C.II) which were found to be in excess of the acceptable limits of cancer risk (10−6–10−4) for the total lifetime.
- Several methodologies lack critical parameters (e.g., IR, BW, AF) which are important for the estimation of the exposure dose of people, depending on their age, gender, and the daily activity of people. In six approaches in which there was the possibility to estimate the exposure specifically for women, the results were lower compared to those for men (with the exception of methods B.III & B.IV). The main reason was the existence of IR and BW parameters.
- The duration of the exposure to air pollution (i.e., hours per day, days per year and number of years) is a major factor influencing the estimated risks and was differentiated as a function of the time the people were exposed to the pollutants, regardless of people gender, age or other parameters.
- Age adjustment factor (AF) proves to be a critical parameter for cancer risk assessment as, during the early stages of life, people are more vulnerable to the effects of chemical toxins.
- Benzene comprises a critical factor as its estimated cancer risk was significant, mainly due to its high concentration and its high cancer slope factor, as well. Additionally, pollutants with low concentrations (DBahA, BaP) have been associated with high potential risks, due to their high value of parameters for the corresponding risk (CSF,P or RFD, HQ).
- In the majority of the methodologies used, the younger the age of people who were studied, the lower the estimated risk for cancer. In cases A.I, A.II, A.IV, C.I & C.II where the duration of exposure was not taken under consideration, the risk for children was equal to or higher than that of adults.
Limitations—Future Study
Supplementary Materials
Author Contributions
Funding
Institutional Review Board Statement
Informed Consent Statement
Data Availability Statement
Acknowledgments
Conflicts of Interest
Glossary
| PM | Particulate Matter |
| IARC | International Agency for Research on Cancer |
| PAHs | Polycyclic Aromatic Hydrocarbons |
| DALYs | Disability Adjusted Life Years |
| VOCs | Volatile Organic Compounds |
| SVOCs | Semivolatile Organic Compounds |
| IR | Inhalation Rate |
| BW | Body weight |
| CR | Cancer Risk |
| OEHHA | Office of Environmental Health Hazard Assessment |
| PEF | Potency Equivalency Factor |
| SF | Slope Factor |
| EF | Exposure Factor |
| AF | Adjustment Factor |
| ED | Exposure Duration |
| AT | Averaging Time |
| RPF | Relative Potency Factor |
| ASF | Age Sensitivity Factor |
| FAH | Fraction At Home |
| RfD | Reference Dose |
| RR | Relative Risk |
| CDI | Chronic Daily Intake |
| IUR | Inhalation Unit Risk |
| EC | Exposure Concentration |
Appendix A. Tables with Results of Assessment

| Lifetime Cancer Risk: | |||||||
|---|---|---|---|---|---|---|---|
| PAHs | C (ng/m3) | Children 0–2 Years | Children 2–16 Years | Women 16–80 Years | Men 16–80 Years | ||
| 14 h/Day | 24 h/Day | 14 h/Day | 24 h/Day | ||||
| BaP | 0.059 | 1.09 × 10⁻⁶ | 2.29 × 10⁻⁷ | 2.68 × 10⁻⁸ | 4.60 × 10⁻⁸ | 2.90 × 10⁻⁸ | 4.97 × 10⁻⁸ |
| BaA | 0.053 | 9.83 × 10⁻⁹ | 2.06 × 10⁻⁹ | 2.41 × 10⁻¹⁰ | 4.13 × 10⁻¹⁰ | 2.60 × 10⁻¹⁰ | 4.46 × 10⁻¹⁰ |
| BbF | 0.289 | 5.36 × 10⁻⁸ | 1.12 × 10⁻⁸ | 1.31 × 10⁻⁹ | 2.25 × 10⁻⁹ | 1.42 × 10⁻⁹ | 2.43 × 10⁻⁹ |
| BkF | 0.079 | 1.47 × 10⁻⁸ | 3.07 × 10⁻⁹ | 3.59 × 10⁻¹⁰ | 6.16 × 10⁻¹⁰ | 3.88 × 10⁻¹⁰ | 6.65 × 10⁻¹⁰ |
| CHRY | 0.108 | 2.00 × 10⁻¹⁰ | 4.20 × 10⁻¹¹ | 4.91 × 10⁻¹² | 8.42 × 10⁻¹² | 5.30 × 10⁻¹² | 9.09 × 10⁻¹² |
| DBahA | 0.02 | 1.95 × 10⁻⁶ | 4.09 × 10⁻⁷ | 4.78 × 10⁻⁸ | 8.20 × 10⁻⁸ | 5.16 × 10⁻⁸ | 8.85 × 10⁻⁸ |
| I123cdP | 0.135 | 2.50 × 10⁻⁸ | 5.25 × 10⁻⁹ | 6.14 × 10⁻¹⁰ | 1.05 × 10⁻⁹ | 6.63 × 10⁻¹⁰ | 1.14 × 10⁻⁹ |
| Σ | 3.15 × 10⁻⁶ | 6.60 × 10⁻⁷ | 7.72 × 10⁻⁸ | 1.32 × 10⁻⁷ | 8.33 × 10⁻⁸ | 1.43 × 10⁻⁷ | |
| Cases/106 | 3.15 | 0.66 | 0.08 | 0.13 | 0.08 | 0.14 | |
| Lifetime Cancer Risk | |||||||
|---|---|---|---|---|---|---|---|
| PAHs | C (ng/m3) | Children 0–2 Years | Children 2–16 Years | Women 16–80 Years | Men 16–80 Years | ||
| 14 h/Day | 24 h/Day | 14 h/Day | 24 h/Day | ||||
| BaP | 0.059 | 1.09 × 10⁻⁷ | 7.65 × 10⁻⁸ | 2.68 × 10⁻⁸ | 4.60 × 10⁻⁸ | 2.90 × 10⁻⁸ | 4.97 × 10⁻⁸ |
| BaA | 0.053 | 9.83 × 10⁻¹⁰ | 6.87 × 10⁻¹⁰ | 2.41 × 10⁻¹⁰ | 4.13 × 10⁻¹⁰ | 2.60 × 10⁻¹⁰ | 4.46 × 10⁻¹⁰ |
| BbF | 0.289 | 5.36 × 10⁻⁹ | 3.75 × 10⁻⁹ | 1.31 × 10⁻⁹ | 2.25 × 10⁻⁹ | 1.42 × 10⁻⁹ | 2.43 × 10⁻⁹ |
| BkF | 0.079 | 1.47 × 10⁻⁹ | 1.02 × 10⁻⁹ | 3.59 × 10⁻¹⁰ | 6.16 × 10⁻¹⁰ | 3.88 × 10⁻¹⁰ | 6.65 × 10⁻¹⁰ |
| CHRY | 0.108 | 2.00 × 10⁻¹¹ | 1.40 × 10⁻¹¹ | 4.91 × 10⁻¹² | 8.42 × 10⁻¹² | 5.30 × 10⁻¹² | 9.09 × 10⁻¹² |
| DBahA | 0.02 | 1.95 × 10⁻⁷ | 1.36 × 10⁻⁷ | 4.78 × 10⁻⁸ | 8.20 × 10⁻⁸ | 5.16 × 10⁻⁸ | 8.85 × 10⁻⁸ |
| I123cdP | 0.135 | 2.50 × 10⁻⁹ | 1.75 × 10⁻⁹ | 6.14 × 10⁻¹⁰ | 1.05 × 10⁻⁹ | 6.63 × 10⁻¹⁰ | 1.14 × 10⁻⁹ |
| Σ | 3.15 × 10⁻⁷ | 2.20 × 10⁻⁷ | 7.72 × 10⁻⁸ | 1.32 × 10⁻⁷ | 8.33 × 10⁻⁸ | 1.43 × 10⁻⁷ | |
| Cases/106 | 0.31 | 0.22 | 0.08 | 0.13 | 0.08 | 0.14 | |
| Lifetime Cancer Risk | ||||||
|---|---|---|---|---|---|---|
| Pollutants | C (ng/m3) | Children 0–16 Years | Women 16–80 Years | Men 16–80 Years | ||
| 14 h/Day | 24 h/Day | 14 h/Day | 24 h/Day | |||
| BaP | 0.059 | 3.76 × 10⁻⁹ | 5.28 × 10⁻⁹ | 9.05 × 10⁻⁹ | 5.70 × 10⁻⁹ | 9.77 × 10⁻⁹ |
| BaA | 0.053 | 3.38 × 10⁻¹⁰ | 4.74 × 10⁻¹⁰ | 8.13 × 10⁻¹⁰ | 5.12 × 10⁻¹⁰ | 8.77 × 10⁻¹⁰ |
| BbF | 0.289 | 1.84 × 10⁻⁹ | 2.59 × 10⁻⁹ | 4.43 × 10⁻⁹ | 2.79 × 10⁻⁹ | 4.78 × 10⁻⁹ |
| BkF | 0.079 | 5.03 × 10⁻¹¹ | 7.07 × 10⁻¹¹ | 1.21 × 10⁻¹⁰ | 7.63 × 10⁻¹¹ | 1.31 × 10⁻¹⁰ |
| CHRY | 0.108 | 6.88 × 10⁻¹² | 9.67 × 10⁻¹² | 1.66 × 10⁻¹¹ | 1.04 × 10⁻¹¹ | 1.79 × 10⁻¹¹ |
| DBahA | 0.02 | 1.27 × 10⁻⁹ | 1.79 × 10⁻⁹ | 3.07 × 10⁻⁹ | 1.93 × 10⁻⁹ | 3.31 × 10⁻⁹ |
| I123cdP | 0.135 | 8.60 × 10⁻¹⁰ | 1.21 × 10⁻⁹ | 2.07 × 10⁻⁹ | 1.30 × 10⁻⁹ | 2.23 × 10⁻⁹ |
| 1Methyl | 0.577 | 1.07 × 10⁻⁹ | 1.50 × 10⁻⁹ | 2.57 × 10⁻⁹ | 1.62 × 10⁻⁹ | 2.77 × 10⁻⁹ |
| Ni | 4.38 | 2.54 × 10⁻⁷ | 3.57 × 10⁻⁷ | 6.12 × 10⁻⁷ | 3.85 × 10⁻⁷ | 6.60 × 10⁻⁷ |
| Pb | 8.03 | 2.15 × 10⁻⁸ | 3.02 × 10⁻⁸ | 5.17 × 10⁻⁸ | 3.26 × 10⁻⁸ | 5.58 × 10⁻⁸ |
| Benzene | 1390 | 4.87 × 10⁻⁶ | 6.84 × 10⁻⁶ | 1.17 × 10⁻⁵ | 7.38 × 10⁻⁶ | 1.27 × 10⁻⁵ |
| Σ | 5.83 × 10⁻⁶ | 1.10 × 10⁻⁵ | 1.89 × 10⁻⁵ | 1.15 × 10⁻⁵ | 1.98 × 10⁻⁵ | |
| Cases/106 | 5.2 | 7.2 | 12.4 | 7.8 | 13.4 | |
| Pollutants | C (ng/m3) | Lifetime Cancer Risk | |
|---|---|---|---|
| UR (OEHHA. 2005) | UR (WHO. 2010) | ||
| BaP | 0.059 | 6.49 × 10⁻⁸ | 5.13 × 10⁻⁶ |
| BaA | 0.053 | 1.17 × 10⁻⁸ | 9.22 × 10⁻⁷ |
| BbF | 0.289 | 2.54 × 10⁻⁷ | 2.01 × 10⁻⁵ |
| BkF | 0.079 | 2.61 × 10⁻⁹ | 2.06 × 10⁻⁷ |
| CHRY | 0.108 | 1.19 × 10⁻⁸ | 9.40 × 10⁻⁷ |
| DBahA | 0.02 | 2.20 × 10⁻⁷ | 1.74 × 10⁻⁵ |
| I123cdP | 0.135 | 1.04 × 10⁻⁸ | 8.22 × 10⁻⁷ |
| BghiP | 0.222 | 2.20 × 10⁻⁹ | 1.74 × 10⁻⁷ |
| FLA | 0.136 | 1.20 × 10⁻⁸ | 9.47 × 10⁻⁷ |
| Σ | 5.90 × 10⁻⁷ | 4.67 × 10⁻⁵ | |
| Cases/106 | 0.59 | 46.66 | |
| Lifetime Cancer Risk | |||||
|---|---|---|---|---|---|
| Pollutants | C (ng/m3) | Children 0–2 Years | Children 2–16 Years | Adults 16–80 Years | Total Cancer Risk 80 Years |
| BaP | 0.059 | 2.63 × 10⁻⁹ | 1.28 × 10⁻⁸ | 3.71 × 10⁻⁸ | 5.26 × 10⁻⁸ |
| BaA | 0.053 | 2.36 × 10⁻¹⁰ | 1.15 × 10⁻⁹ | 3.34 × 10⁻⁹ | 4.73 × 10⁻⁹ |
| BbF | 0.289 | 1.29 × 10⁻⁹ | 6.29 × 10⁻⁹ | 1.82 × 10⁻⁸ | 2.58 × 10⁻⁸ |
| BkF | 0.079 | 3.52 × 10⁻¹⁰ | 1.72 × 10⁻⁹ | 4.97 × 10⁻⁹ | 7.04 × 10⁻⁹ |
| CHRY | 0.108 | 4.81 × 10⁻¹¹ | 2.35 × 10⁻¹⁰ | 6.80 × 10⁻¹⁰ | 9.63 × 10⁻¹⁰ |
| DBahA | 0.02 | 9.36 × 10⁻¹⁰ | 4.58 × 10⁻⁹ | 1.32 × 10⁻⁸ | 1.87 × 10⁻⁸ |
| I123cdP | 0.135 | 6.01 × 10⁻¹⁰ | 2.94 × 10⁻⁹ | 8.50 × 10⁻⁹ | 1.20 × 10⁻⁸ |
| Nickel | 4.38 | 4.55 × 10⁻⁸ | 2.23 × 10⁻⁷ | 6.43 × 10⁻⁷ | 9.11 × 10⁻⁷ |
| Lead | 8.03 | 3.85 × 10⁻⁹ | 1.88 × 10⁻⁸ | 5.44 × 10⁻⁸ | 7.71 × 10⁻⁸ |
| Benzene | 1390 | 1.59 × 10⁻⁶ | 7.76 × 10⁻⁶ | 2.24 × 10⁻⁵ | 3.18 × 10⁻⁵ |
| Σ | 1.64 × 10⁻⁶ | 8.03 × 10⁻⁶ | 2.32 × 10⁻⁵ | 3.29 × 10⁻⁵ | |
| Cases/106 | 1.64 | 8.0 | 23.2 | 33 | |
| Substance | C (μg/m3) | Total HQAcute | Immune System | Reproductive/ Development | Hematologic System | Respiratory System | Eyes | Nervous System |
|---|---|---|---|---|---|---|---|---|
| Benzene | 1.39 | 5.1 × 10⁻² | 1.72 × 10⁻² | 1.72 × 10⁻² | 1.72 × 10⁻² | – | – | – |
| Toluene | 3.56 | 9.62 × 10⁻⁵ | – | 2.41 × 10⁻⁵ | – | 2.41 × 10⁻⁵ | 2.41 × 10⁻⁵ | 2.41 × 10⁻⁵ |
| Xylenes 1 | 3.08 | 1.40 × 10⁻⁴ | – | – | – | 4.67 × 10⁻⁵ | 4.67 × 10⁻⁵ | 4.67 × 10⁻⁵ |
| Xylenes 2 | 2.76 | 1.25 × 10⁻⁴ | – | – | – | 4.18 × 10⁻⁵ | 4.18 × 10⁻⁵ | 4.18 × 10⁻⁵ |
| Xylenes 3 | 7.53 | 3.42 × 10⁻⁴ | – | – | – | 1.14 × 10⁻⁴ | 1.14 × 10⁻⁴ | 1.14 × 10⁻⁴ |
| Total Acute Hazard Index | 1.72 × 10⁻² | 1.72 × 10⁻² | 1.72 × 10⁻² | 2.27 × 10⁻⁴ | 2.27 × 10⁻⁴ | 2.28 × 10⁻⁴ | ||
| Pollutants | C (mg/kg) | Lifetime Cancer Risk | Non Carcinogenic Risk | ||||
|---|---|---|---|---|---|---|---|
| ADD0–16 Years | ADD16–80 Years | HQ0–16 Years | HQ16–80 Years | ||||
| Ni | 315.7 | 4.47 × 10⁻⁸ | 7.40 × 10⁻⁸ | 4.80 × 10⁻⁸ | 3.59 × 10⁻⁶ | 2.33 × 10⁻⁶ | |
| BaP | 4.46 | 4.14 × 10⁻¹¹ | NO RfD | NO RfD | |||
| BaA | 3.91 | 4.81 × 10⁻¹⁰ | |||||
| BbF | 21.59 | 2.66 × 10⁻⁹ | |||||
| BkF | 5.93 | 7.30 × 10⁻¹¹ | |||||
| CHRY | 7.95 | 9.78 × 10⁻¹² | |||||
| DBahA | 1.49 | 1.83 × 10⁻⁹ | |||||
| I123cdP | 10.20 | 1.26 × 10⁻⁹ | |||||
| Σ | 5.11 × 10⁻⁸ | ||||||
| Cases/106 | 0.05 | ||||||
| Lifetime Cancer Risk | |||||||
|---|---|---|---|---|---|---|---|
| Pollutants | C (ng/m3) | Children 0–16 Years | Women 16–80 Years | Men 16–80 Years | |||
| 14 h/Day | 24 h/Day | 14 h/Day | 24 h/Day | ||||
| PAH | BaP | 0.059 | 6.79 × 10⁻⁹ | 1.58 × 10⁻⁸ | 2.72 × 10⁻⁸ | 1.58 × 10⁻⁸ | 2.72 × 10⁻⁸ |
| BaA | 0.053 | 6.10 × 10⁻¹⁰ | 1.42 × 10⁻⁹ | 2.44 × 10⁻⁹ | 1.42 × 10⁻⁹ | 2.44 × 10⁻⁹ | |
| BbF | 0.289 | 3.33 × 10⁻⁹ | 7.76 × 10⁻⁹ | 1.33 × 10⁻⁸ | 7.76 × 10⁻⁹ | 1.33 × 10⁻⁸ | |
| BkF | 0.079 | 9.09 × 10⁻¹¹ | 2.12 × 10⁻¹⁰ | 3.64 × 10⁻¹⁰ | 2.12 × 10⁻¹⁰ | 3.64 × 10⁻¹⁰ | |
| CHRY | 0.108 | 1.24 × 10⁻¹¹ | 2.90 × 10⁻¹¹ | 4.97 × 10⁻¹¹ | 2.90 × 10⁻¹¹ | 4.97 × 10⁻¹¹ | |
| DBahA | 0.02 | 2.30 × 10⁻⁹ | 5.37 × 10⁻⁹ | 9.21 × 10⁻⁹ | 5.37 × 10⁻⁹ | 9.21 × 10⁻⁹ | |
| I123cdP | 0.135 | 1.55 × 10⁻⁹ | 3.62 × 10⁻⁹ | 6.21 × 10⁻⁹ | 3.62 × 10⁻⁹ | 6.21 × 10⁻⁹ | |
| Heavy metals | Ni | 4.38 | 2.18 × 10⁻⁷ | 5.10 × 10⁻⁷ | 8.74 × 10⁻⁷ | 5.10 × 10⁻⁷ | 8.74 × 10⁻⁷ |
| Pb | 8.03 | 1.85 × 10⁻⁸ | 4.31 × 10⁻⁸ | 7.39 × 10⁻⁸ | 4.31 × 10⁻⁸ | 7.39 × 10⁻⁸ | |
| VOC | Benzene | 1390 | 2.08 × 10⁻⁶ | 4.85 × 10⁻⁶ | 8.32 × 10⁻⁶ | 4.85 × 10⁻⁶ | 8.32 × 10⁻⁶ |
| Σ | 2.33 × 10⁻⁶ | 5.44 × 10⁻⁶ | 9.32 × 10⁻⁶ | 5.44 × 10⁻⁶ | 9.32 × 10⁻⁶ | ||
| Cases/106 | 2.3 | 5.4 | 9.3 | 5.4 | 9.3 | ||
| I (Elefsina) * | 0.07 | 0.16 | 0.28 | 0.16 | 0.28 | ||
| Hazard Quotient | ||||||
|---|---|---|---|---|---|---|
| Pollutants | C (ng/m3) | Children 0–16 Years | Women 16–80 Years | Men 16–80 Years | ||
| 14 h/Day | 24 h/Day | 14 h/Day | 24 h/Day | |||
| BaP | 0.059 | 0.0283 | 0.0165 | 0.0283 | 0.0165 | 0.0283 |
| Ni | 4.38 | 0.2100 | 0.1225 | 0.2100 | 0.1225 | 0.2100 |
| Pb | 8.03 | 0.0385 | 0.0225 | 0.0385 | 0.0225 | 0.0385 |
| Benzene | 1390 | 0.0444 | 0.0259 | 0.0444 | 0.0259 | 0.0444 |
| Toluene | 3563 | 6.83 × 10⁻⁴ | 3.99 × 10⁻⁴ | 6.83 × 10⁻⁴ | 3.99 × 10⁻⁴ | 6.83 × 10⁻⁴ |
| Trimethylben | 2300 | 3.68 × 10⁻² | 2.14 × 10⁻² | 3.68 × 10⁻² | 2.14 × 10⁻² | 3.68 × 10⁻² |
| m-Xylene | 3077 | 2.95 × 10⁻² | 1.72 × 10⁻² | 2.95 × 10⁻² | 1.72 × 10⁻² | 2.95 × 10⁻² |
| o-Xylene | 2760 | 2.65 × 10⁻² | 1.54 × 10⁻² | 2.65 × 10⁻² | 1.54 × 10⁻² | 2.65 × 10⁻² |
| p-Xylene | 7533 | 7.22 × 10⁻² | 4.21 × 10⁻² | 7.22 × 10⁻² | 4.21 × 10⁻² | 7.22 × 10⁻² |
| Cyclohexane | 7187 | 1.15 × 10⁻³ | 6.70 × 10⁻³ | 1.15 × 10⁻³ | 6.70 × 10⁻³ | 1.15 × 10⁻³ |
| Nonane | 773 | 3.71 × 10⁻² | 2.16 × 10⁻² | 3.71 × 10⁻² | 2.16 × 10⁻² | 3.71 × 10⁻² |
| Hazard Index | 0.5269 | 0.3074 | 0.5269 | 0.3074 | 0.5269 | |
| Parameters | All Cause Mortality (PM10) (β = 0.0008) | Cardiopulmonary Mortality (PM2.5) (β = 0.15515) | Lung Cancer Mortality (PM2.5) (β = 0.23218) |
|---|---|---|---|
| ER (95% CI) | 0.008 | 0.223 | 0.352 |
| AF (95% CI) | 0.008 | 0.183 | 0.260 |
| Deaths (95% CI) | 5.76 × 10⁻⁵ | 1.36 × 10⁻³ | 1.93 × 10⁻³ |
| Lifetime Cancer Risk: | |||||
|---|---|---|---|---|---|
| Pollutants | C (ng/m3) | Children 0–16 Years | Adults 16–80 Years | ||
| 14 h/Day | 24 h/Day | ||||
| PAH | BaP | 0.059 | 6.79 × 10⁻⁹ | 1.58 × 10⁻⁸ | 2.72 × 10⁻⁸ |
| BaA | 0.053 | 6.10 × 10⁻¹⁰ | 1.42 × 10⁻⁹ | 2.44 × 10⁻⁹ | |
| BbF | 0.289 | 3.33 × 10⁻⁹ | 7.76 × 10⁻⁹ | 1.33 × 10⁻⁸ | |
| BkF | 0.079 | 9.09 × 10⁻¹¹ | 2.12 × 10⁻¹⁰ | 3.64 × 10⁻¹⁰ | |
| CHRY | 0.108 | 1.24 × 10⁻¹¹ | 2.90 × 10⁻¹¹ | 4.97 × 10⁻¹¹ | |
| DBahA | 0.02 | 2.30 × 10⁻⁹ | 5.37 × 10⁻⁹ | 9.21 × 10⁻⁹ | |
| I123cdP | 0.135 | 1.55 × 10⁻⁹ | 3.62 × 10⁻⁹ | 6.21 × 10⁻⁹ | |
| Heavy metals | Ni | 4.38 | 2.18 × 10⁻⁷ | 5.10 × 10⁻⁷ | 8.74 × 10⁻⁷ |
| Pb | 8.03 | 1.85 × 10⁻⁸ | 4.31 × 10⁻⁸ | 7.39 × 10⁻⁸ | |
| VOC | Benzene | 1390 | 2.08 × 10⁻⁶ | 4.85 × 10⁻⁶ | 8.32 × 10⁻⁶ |
| Σ | 2.33 × 10⁻⁶ | 5.44 × 10⁻⁶ | 9.32 × 10⁻⁶ | ||
| Cases/106 | 2.3 | 5.4 | 9.3 | ||
| Hazard Quotient: | |||||
|---|---|---|---|---|---|
| Pollutants | C (ng/m3) | Children 0–16 Years | Adults 16–80 Years | ||
| 14h/Day | 24h/Day | ||||
| PAH | BaP | 0.059 | 0.0283 | 0.0165 | 0.0283 |
| Heavy metals | Ni | 4.38 | 0.2100 | 0.1225 | 0.2100 |
| Pb | 8.03 | 0.0385 | 0.0225 | 0.0385 | |
| VOC | Benzene | 1390 | 0.0444 | 0.0259 | 0.0444 |
| Toluene | 3563 | 6.83 × 10⁻⁴ | 3.99 × 10⁻⁴ | 6.83 × 10⁻⁴ | |
| Trimethylben | 2300 | 3.68 × 10⁻² | 2.14 × 10⁻² | 3.68 × 10⁻² | |
| m-Xylene | 3077 | 2.95 × 10⁻² | 1.72 × 10⁻² | 2.95 × 10⁻² | |
| o-Xylene | 2760 | 2.65 × 10⁻² | 1.54 × 10⁻² | 2.65 × 10⁻² | |
| p-Xylene | 7533 | 7.22 × 10⁻² | 4.21 × 10⁻² | 7.22 × 10⁻² | |
| Cyclohexane | 7187 | 1.15 × 10⁻³ | 6.70 × 10⁻³ | 1.15 × 10⁻³ | |
| Nonane | 773 | 3.71 × 10⁻² | 2.16 × 10⁻² | 3.71 × 10⁻² | |
| Hazard Index | 0.5269 | 0.3074 | 0.5269 | ||
| Lifetime Cancer Risk | |||||||
|---|---|---|---|---|---|---|---|
| C (ng/m3) | Children 0–2 Years | Children 2–16 Years | Women 16–80 Years | Men 16–80 Years | |||
| 14 h/Day | 24 h/Day | 14 h/Day | 24 h/Day | ||||
| BaP | 0.059 | 1.09 × 10⁻⁷ | 7.65 × 10⁻⁸ | 2.68 × 10⁻⁸ | 4.60 × 10⁻⁸ | 2.90 × 10⁻⁸ | 4.97 × 10⁻⁸ |
| BaA | 0.053 | 9.83 × 10⁻⁹ | 6.87 × 10⁻⁹ | 2.41 × 10⁻⁹ | 4.13 × 10⁻⁹ | 2.60 × 10⁻⁹ | 4.46 × 10⁻⁹ |
| BbF | 0.289 | 5.36 × 10⁻⁸ | 3.75 × 10⁻⁸ | 1.31 × 10⁻⁸ | 2.25 × 10⁻⁸ | 1.42 × 10⁻⁸ | 2.43 × 10⁻⁸ |
| BkF | 0.079 | 1.47 × 10⁻⁸ | 1.02 × 10⁻⁸ | 3.59 × 10⁻⁹ | 6.16 × 10⁻⁹ | 3.88 × 10⁻⁹ | 6.65 × 10⁻⁹ |
| CHRY | 0.108 | 2.00 × 10⁻⁹ | 1.40 × 10⁻⁹ | 4.91 × 10⁻¹⁰ | 8.42 × 10⁻¹⁰ | 5.30 × 10⁻¹⁰ | 9.09 × 10⁻¹⁰ |
| DBahA | 0.02 | 3.90 × 10⁻⁸ | 2.72 × 10⁻⁸ | 9.57 × 10⁻⁹ | 1.64 × 10⁻⁸ | 1.03 × 10⁻⁸ | 1.77 × 10⁻⁸ |
| I123cdP | 0.135 | 2.50 × 10⁻⁸ | 1.75 × 10⁻⁸ | 6.14 × 10⁻⁹ | 1.05 × 10⁻⁸ | 6.63 × 10⁻⁹ | 1.14 × 10⁻⁸ |
| Ni | 4.38 | 1.90 × 10⁻⁶ | 1.32 × 10⁻⁶ | 4.65 × 10⁻⁷ | 7.97 × 10⁻⁷ | 5.02 × 10⁻⁷ | 8.60 × 10⁻⁷ |
| Pb | 8.03 | 1.60 × 10⁻⁷ | 1.12 × 10⁻⁷ | 3.93 × 10⁻⁸ | 6.75 × 10⁻⁸ | 4.25 × 10⁻⁸ | 7.28 × 10⁻⁸ |
| Benzene | 1390 | 6.61 × 10⁻⁵ | 4.62 × 10⁻⁵ | 1.62 × 10⁻⁵ | 2.78 × 10⁻⁵ | 1.75 × 10⁻⁵ | 3.00 × 10⁻⁵ |
| Σ | 6.84 × 10⁻⁵ | 4.78 × 10⁻⁵ | 1.68 × 10⁻⁵ | 2.88 × 10⁻⁵ | 1.81 × 10⁻⁵ | 3.10 × 10⁻⁵ | |
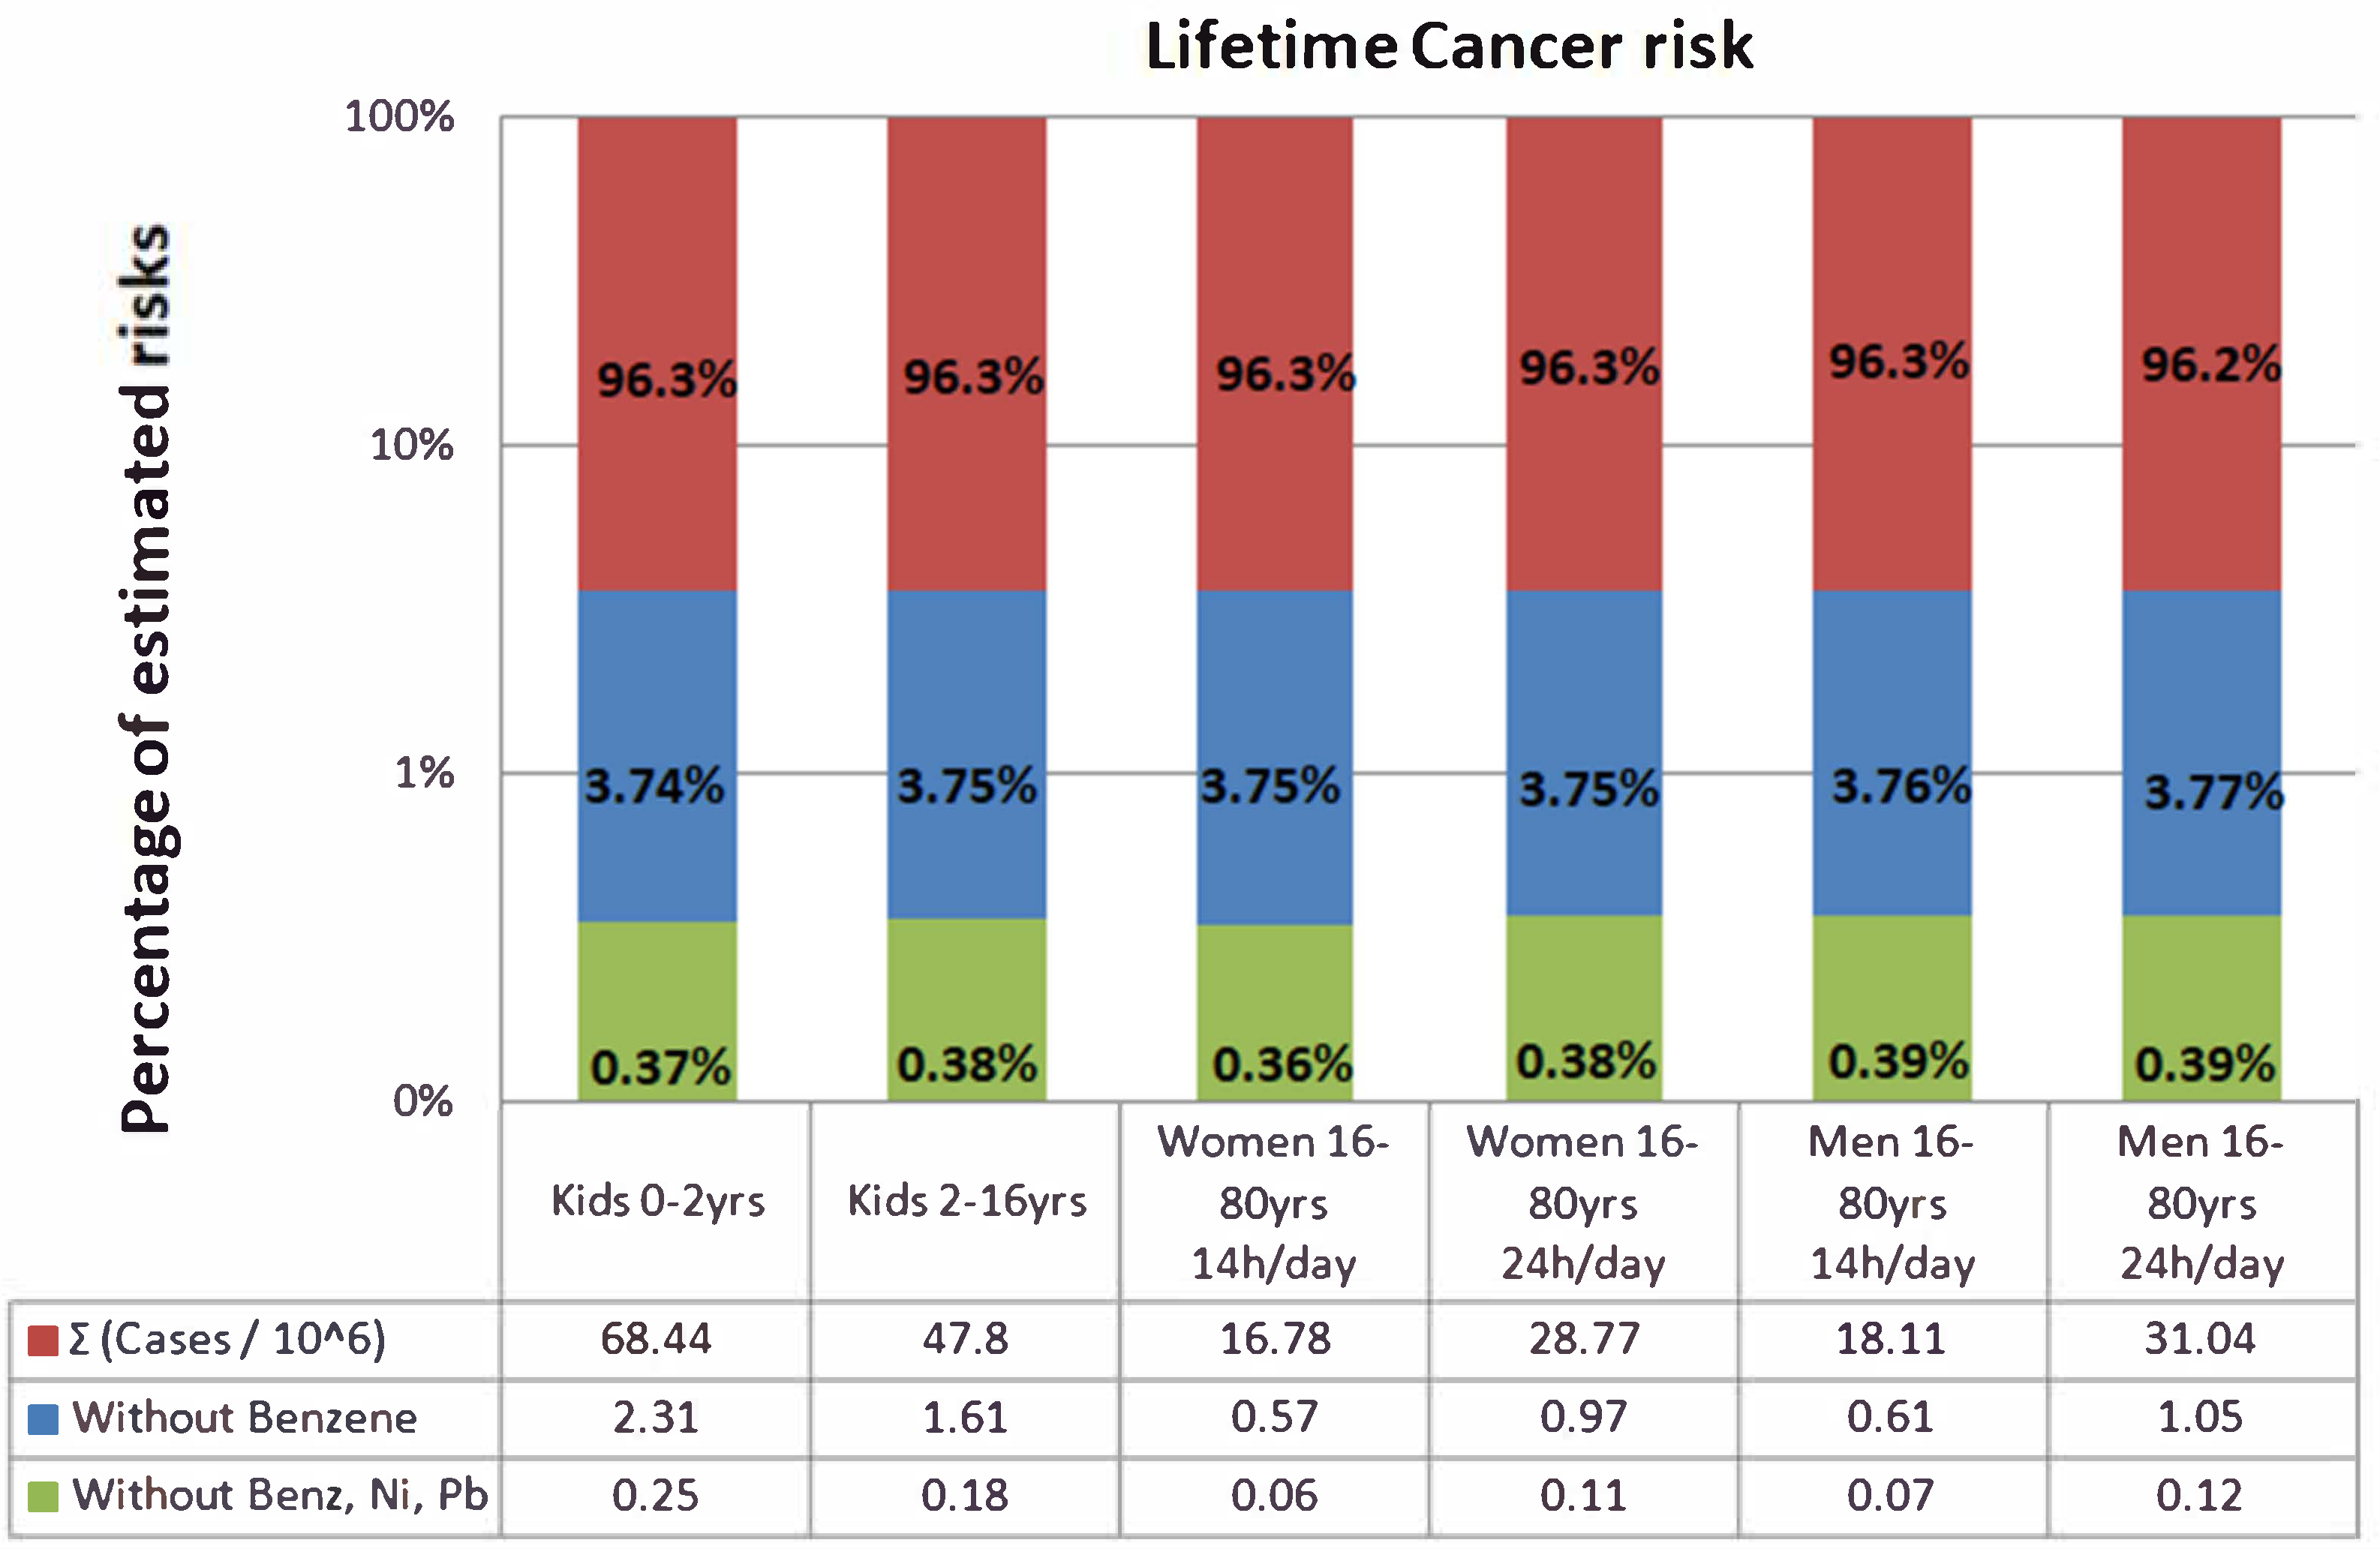
| Cases/106 | 68.44 | 47.80 | 16.78 | 28.77 | 18.11 | 31.04 | |
| Without Benzene | 2.31 | 1.61 | 0.57 | 0.97 | 0.61 | 1.05 | |
| Without Benz, Ni, Pb | 0.25 | 0.18 | 0.06 | 0.11 | 0.07 | 0.12 | |
| Lifetime Cancer Risk: | |||||||
|---|---|---|---|---|---|---|---|
| C (ng/m3) | Children 0–2 Years | Children 2–16 Years | Women 16–80 Years | Men 16–80 Years | |||
| 14 h/Day | 24 h/Day | 14 h/Day | 24 h/Day | ||||
| BaP | 0.059 | 1.09 × 10⁻⁷ | 7.65 × 10⁻⁸ | 2.68 × 10⁻⁸ | 4.60 × 10⁻⁸ | 2.90 × 10⁻⁸ | 4.97 × 10⁻⁸ |
| BaA | 0.053 | 9.83 × 10⁻⁹ | 6.87 × 10⁻⁹ | 2.41 × 10⁻⁹ | 4.13 × 10⁻⁹ | 2.60 × 10⁻⁹ | 4.46 × 10⁻⁹ |
| BbF | 0.289 | 5.36 × 10⁻⁸ | 3.75 × 10⁻⁸ | 1.31 × 10⁻⁸ | 2.25 × 10⁻⁸ | 1.42 × 10⁻⁸ | 2.43 × 10⁻⁸ |
| BkF | 0.079 | 1.47 × 10⁻⁸ | 1.02 × 10⁻⁸ | 3.59 × 10⁻⁹ | 6.16 × 10⁻⁹ | 3.88 × 10⁻⁹ | 6.65 × 10⁻⁹ |
| CHRY | 0.108 | 2.00 × 10⁻⁹ | 1.40 × 10⁻⁹ | 4.91 × 10⁻¹⁰ | 8.42 × 10⁻¹⁰ | 5.30 × 10⁻¹⁰ | 9.09 × 10⁻¹⁰ |
| DBahA | 0.02 | 3.90 × 10⁻⁸ | 2.72 × 10⁻⁸ | 9.57 × 10⁻⁹ | 1.64 × 10⁻⁸ | 1.03 × 10⁻⁸ | 1.77 × 10⁻⁸ |
| I123cdP | 0.135 | 2.50 × 10⁻⁸ | 1.75 × 10⁻⁸ | 6.14 × 10⁻⁹ | 1.05 × 10⁻⁸ | 6.63 × 10⁻⁹ | 1.14 × 10⁻⁸ |
| Ni | 4.38 | 1.90 × 10⁻⁶ | 1.32 × 10⁻⁶ | 4.65 × 10⁻⁷ | 7.97 × 10⁻⁷ | 5.02 × 10⁻⁷ | 8.60 × 10⁻⁷ |
| Pb | 8.03 | 1.60 × 10⁻⁷ | 1.12 × 10⁻⁷ | 3.93 × 10⁻⁸ | 6.75 × 10⁻⁸ | 4.25 × 10⁻⁸ | 7.28 × 10⁻⁸ |
| Benzene | 1390 | 6.61 × 10⁻⁵ | 4.62 × 10⁻⁵ | 1.62 × 10⁻⁵ | 2.78 × 10⁻⁵ | 1.75 × 10⁻⁵ | 3.00 × 10⁻⁵ |
| Σ | 6.84 × 10⁻⁵ | 4.78 × 10⁻⁵ | 1.68 × 10⁻⁵ | 2.88 × 10⁻⁵ | 1.81 × 10⁻⁵ | 3.10 × 10⁻⁵ | |
| Cases/106 | 68.44 | 47.80 | 16.78 | 28.77 | 18.11 | 31.04 | |
| Without Benzene | 2.31 | 1.61 | 0.57 | 0.97 | 0.61 | 1.05 | |
| Without Benz, Ni, Pb | 0.25 | 0.18 | 0.06 | 0.11 | 0.07 | 0.12 | |
References
- Olstrup, H.; Johansson, C.; Forsberg, B.; Åström, C.; Orru, H. Seasonal Variations in the Daily Mortality Associated with Exposure to Particles, Nitrogen Dioxide, and Ozone in Stockholm, Sweden, from 2000 to 2016. Atmosphere 2021, 12, 1481. [Google Scholar] [CrossRef]
- Emmanouil, C.; Drositi, E.; Vasilatou, V.; Diapouli, E.; Krikonis, K.; Eleftheriadis, K.; Kungolos, A. Study on particulate matter air pollution, source origin, and human health risk based of PM10 metal content in Volos City, Greece. Toxicol. Environ. Chem. 2016, 99, 691–709. [Google Scholar] [CrossRef]
- Scorer, R.S. The meteorological scene. In Air Pollution Meteorology; Woodhead Publishing: Sawston, UK, 2002; pp. 1–20. ISBN 9781898563938. [Google Scholar] [CrossRef]
- WHO (World Health Organization). WHO Ambient Air Pollution: A Global Assessment of Exposure and Burden of Disease; WHO: Geneva, Switzerland, 2016; ISBN 9789241511353. Available online: https://www.who.int/phe/publications/air-pollution-global-assessment/en/ (accessed on 14 February 2022).
- Gao, P.; Guo, H.; Wang, S.; Guo, L.; Xinge, Y.; Yaoe, C.; Jiae, L.; Fana, Q.; Hang, J. In Vitro investigations of high molecular weight polycyclic aromatic hydrocarbons in winter airborne particles using simulated lung fluids. Atmos. Environ. 2019, 201, 293–300. [Google Scholar] [CrossRef]
- WHO (World Health Organization). 7 Million Premature Deaths Annually Linked to Air Pollution; WHO Press Release: Geneva, Switzerland, 2014; Available online: https://www.who.int/mediacentre/news/releases/2014/air-pollution/en/#:~:text=25%20March%202014%20%7C%20Geneva%20%2D%20In,result%20of%20air%20pollution%20exposure (accessed on 14 February 2022).
- World Health Organization. WHO Global Air Quality Guidelines: Particulate Matter (PM2.5 and PM10), Ozone, Nitrogen Dioxide, Sulfur Dioxide and Carbon Monoxide; World Health Organization: Geneva, Switzerland, 2021; Available online: https://apps.who.int/iris/handle/10665/345329. (accessed on 1 March 2022).
- IARC. Outdoor Air Pollution. IARC Monographs on the Evaluation of Carcinogenic Risks to Humans. International Agency for Research on Cancer, France; World Health Organization: Geneva, Switzerland, 2016; Volume 109, Available online: http://monographs.iarc.fr/ENG/Monographs/vol109/mono109.pdf (accessed on 14 February 2022).
- Sun, Y.; Hu, X.; Wu, J.; Lian, H.; Chen, Y. Fractionation and health risks of atmospheric particle-bound As and heavy metals in summer and winter. Sci. Total Environ. 2014, 493, 487–494. [Google Scholar] [CrossRef] [PubMed]
- Lim, S.S.; Vos, T.; Flaxman, A.D.; Danaei, G.; Shibuya, K.; Adair-Rohani, H.; AlMazroa, M.A.; Amann, M.; Anderson, H.R.; Andrews, K.G.; et al. A comparative risk assessment of burden of disease and injury attributable to 67 risk factors and risk factor clusters in 21 regions, 1990–2010: A systematic analysis for the Global Burden of Disease Study 2010. Lancet 2012, 380, 2224–2260. [Google Scholar] [CrossRef] [Green Version]
- Hänninen, O.; Knol, A. European Perspectives on Environmental Burden of Disease Estimates for Nine Stressors in Six European Countries (2011); National Institute for Health and Welfare (THL): Helsinki, Finland, 2011; ISBN 978-952-245-413-3. [Google Scholar]
- Collins, J.F.; Brown, J.P.; Alexeeff, G.V.; Salmon, A.G. Potency equivalency factors for some polycyclic aromatic hydrocarbons and polycyclic aromatic hydrocarbon derivatives. Regul. Toxicol. Pharmacol. 1998, 28, 45–54. [Google Scholar] [CrossRef] [PubMed]
- Maertens, R.M.; Bailey, J.; White, P.A. The mutagenic hazards of settled house dust: A review. Mutat. Res. 2004, 567, 401–425. [Google Scholar] [CrossRef]
- Maertens, R.M.; Yang, X.; Zhu, J.; Gagne, R.W.; Douglas, G.R.; White, P.A. Mutagenic and carcinogenic hazards of settled house dust I: Polycyclic aromatic hydrocarbon content and excess lifetime cancer risk from preschool exposure. Environ. Sci. Technol. 2008, 42, 1747–1753. [Google Scholar] [CrossRef] [Green Version]
- Shao, T.; Pan, L.; Chen, Z.; Wang, R.; Li, W.; Qin, Q.; He, Y. Content of Heavy Metal in the Dust of Leisure Squares and Its Health Risk Assessment—A Case Study of Yanta District in Xi’an. Int. J. Environ. Res. Public Health 2018, 15, 394. [Google Scholar] [CrossRef] [Green Version]
- Stamatelopoulou, A.; Dasopoulou, M.; Bairachtari, K.; Karavoltsos, S.; Sakellari, A.; Maggos, T. Contamination and Potential Risk Assessment of Polycyclic Aromatic Hydrocarbons (PAHs) and Heavy Metals in House Settled Dust Collected from Residences of Young Children. Appl. Sci. 2021, 11, 1479. [Google Scholar] [CrossRef]
- Hong, W.J.; Jia, H.; Yang, M.; Li, Y.F. Distribution, seasonal trends, and lung cancer risk of atmospheric polycyclic aromatic hydrocarbons in North China: A three-year case study in Dalian city. Ecotoxicol. Environ. Saf. 2020, 196, 110526. [Google Scholar] [CrossRef] [PubMed]
- Gao, P.; Guo, H.; Zhang, Z.; Ou, C.; Hang, J.; Fan, Q.; He, C.; Wu, B.; Feng, Y.; Xing, B. Bioaccessibility and exposure assessment of trace metals from urban airborne particulate matter (PM10 and PM2.5) in simulated digestive fluid. Environ. Pollut. 2018, 242, 1669–1677. [Google Scholar] [CrossRef] [PubMed]
- Ostro, B.; Prüss-üstün, A.; Campbell-lendrum, D.; Corvalán, C.; Woodward, A. Outdoor Air Pollution: Assessing the Environmental Burden of Disease at National and Local Levels; Environmental Burden of Disease Series, No. 5; World Health Organization Protection Human Environmental: Geneva, Switzerland, 2004; Available online: https://www.who.int/quantifying_ehimpacts/publications/ebd5/en/ (accessed on 14 February 2022).
- Burnett, R.T.; Pope, A., III; Ezzati, M.; Olives, C.; Lim, S.S.; Mehta, S.; Shin, H.H.; Singh, G.; Hubbell, B.; Brauer, M.; et al. An Integrated Risk Function for Estimating the Global Burden of Disease Attributable to Ambient Fine Particulate Matter Exposure. Environ. Health Perspect. 2014, 122, 4. [Google Scholar] [CrossRef] [PubMed]
- Manousakas, M.; Diapouli, E.; Papaefthymiou, H.; Kantarelou, V.; Zarkadas, C.; Kalogridis, A.-C.; Karydas, A.G.; Eleftheriadis, K. XRF characterization and source apportionment of PM10 samples collected in a coastal city. X-ray Spectrom. 2018, 47, 190–200. [Google Scholar] [CrossRef]
- ICRP. International Commission on Radiological Protection. In Basic Anatomical and Physiological Data for Use in Radiological Protection: Reference Values; Valentin, J., Ed.; ICRP: Stockholm, Sweden, 2002; Volume 32, ISBN 008 0442668. Available online: http://www.icrp.org/publication.asp?id=icrp%20publication%2089 (accessed on 14 February 2022).
- U.S. Environmental Protection Agency. Exposure Factors Handbook; National Center for Environmental Assessment: Washington, DC, USA, 2011.
- OEHHA. Office of Environmental Health Hazard Assessment, Air Toxics Hot Spots Program. In Guidance Manual for Preparation of Health Risk Assessment; California Environmental Protection Agency U.S.: Sacramento, CA, USA, 2015; 231. Available online: http://oehha.ca.gov/air/hot_spots/2015/2015GuidanceManual.pdf (accessed on 14 February 2022).
- Farris, F.F.; Ray, S.D. Cancer Potency Factor. In Encyclopedia of Toxicology, 3rd ed.; Elsevier: Amsterdam, The Netherlands, 2014; Volume 1, pp. 642–644. [Google Scholar] [CrossRef]
- Chalvatzaki, E.; Chatoutsidou, S.E.; Lehtomäki, H.; Almeida, S.M.; Eleftheriadis, K.; Hänninen, O.; Lazaridis, M. Characterization of human health risks from particulate air pollution in selected European cities. Atmosphere 2019, 10, 1–16. [Google Scholar] [CrossRef] [Green Version]
- Megido, L.; Suárez-Peña, B.; Negral, L.; Castrillón, L.; Fernández-Nava, Y. Suburban air quality: Human health hazard assessment of potentially toxic elements in PM10. Chemosphere 2017, 177, 284–291. [Google Scholar] [CrossRef]
- Huang, M.; Wang, W.; Chan, C.Y.; Cheung, K.C.; Man, Y.B.; Wang, X.; Wong, M.H. Contamination and risk assessment (based on bioaccessibility via ingestion and inhalation) of metal(loid)s in outdoor and indoor particles from urban centers of Guangzhou, China. Sci. Total Environ. 2014, 479–480, 117–124. [Google Scholar] [CrossRef]
- U.S. EPA; Cogliano, J.; Flowers, L.; Valcovic, L.; Barton, H.; Tracey Woodruff, T.; Choksi, N. Supplemental Guidance for Assessing Cancer Susceptibility from Early-Life Exposure to Carcinogens; EPA/630/R-03/003; U.S. Environmental Protection Agency: Washington, DC, USA, 2003; p. 20460. Available online: www.epa.gov/ncea/raf/cancer2003.htm (accessed on 14 February 2022).
- U.S. EPA; Barton, H.; Cogliano, J.; Firestone, M.P.; Flowers, L.; Valcovic, L.; Setzer, R.W.; Woodruff, T. Supplemental Guidance for Assessing Susceptibility from Early-Life Exposure to Carcinogens; EPA/630/R-03/003F; U.S. Environmental Protection Agency: Washington, DC, USA, 2005; p. 20460.
- Jackson, M.M. Roadside concentration of gaseous and particulate matter pollutants and risk assessment in dar-Es-Salaam, Tanzania. Environ. Monit. Assess. 2005, 104, 385–407. [Google Scholar] [CrossRef]
- U.S. EPA. Guidelines for Carcinogen Risk Assessment; EPA/630/R-00/004; Risk Assessment Forum U.S. Environmental Protection Agency: Washington, DC, USA, 1986. Available online: https://cfpub.epa.gov/ncea/risk/recordisplay.cfm?deid=54933 (accessed on 14 February 2022).
- U.S. EPA. Regional Screening Level (RSL) Summary Table. 2019. Available online: https://www.epa.gov/risk/regional-screening-levels-rsls-generic-tables (accessed on 14 February 2022).
- OEHHA Appendices. Office of Environmental Health Hazard Assessment, Air Toxics Hot Spots Program; Guidance Manual for Preparation of Health Risk Assessment, Appendix A-I, 245. 2015. Available online: https://oehha.ca.gov/air/crnr/notice-adoption-air-toxics-hot-spots-program-guidance-manual-preparation-health-risk-0 (accessed on 14 February 2022).
- U.S. EPA. Development of a Relative Potency Factor (RPF) Approach for Polycyclic Aromatic Hydrocarbon (PAH) Mixtures; External Review Draft; Integrated Risk Information System; U.S. EPA: Washington, DC, USA, 2010.
- OEHHA. Benzo[a]pyrene as a Toxic Air Contaminant. In Part B. Health Effects of Benzo[a]pyrene; California Environmental Protection Agency, Office of Environmental Health Hazard Assessment, Air Toxicology and Epidemiology Section: Berkeley, CA, USA, 1993. [Google Scholar]
- OEHHA. Air Toxics Hot Spots Program Risk Assessment Guidelines; California Environmental Protection Agency, Office of Environmental Health Hazard Assessment, Air Toxicology and Epidemiology Section: Oakland, CA, USA, 2005.
- World Health Organization. Air Quality Guidelines Copenhagen, Regional Office for Europe Second edition. Air Qual. Guidel. 2000, 22, 1–8. [Google Scholar] [CrossRef]
- World Health Organization. WHO Guidelines for Indoor Air Quality: Selected Pollutants; Regional Office for Europe: København, Denmark, 2010; Available online: https://apps.who.int/iris/handle/10665/260127 (accessed on 14 February 2022).
- U.S. EPA. Risk Assessment Guidance for Superfund: Volume I—Human Health Evaluation Manual (Part E, Supplemental Guidance for Dermal Risk Assessment) (Final); EPA/540/R/99/005; Office of Superfund Remediation and Technology Innovation, U.S. Environmental Protection Agency: Washington, DC, USA, 2004. Available online: https://www.epa.gov/sites/production/files/2015-09/documents/part_e_final_revision_10-03-07.pdf (accessed on 14 February 2022).
- U.S. EPA. Risk Assessment Guidance for Superfund Volume I: Human Health Evaluation Manual (Part F, Supplemental Guidance for Inhalation Risk Assessment); Office of Superfund Remediation and Technology Innovation Environmental Protection Agency: Washington, DC, USA, 2009; Volume I, pp. 1–68. Available online: https://www.epa.gov/sites/production/files/2015-09/documents/partf_200901_final.pdf (accessed on 14 February 2022).
- U.S. EPA. Risk Assessment Guidance for Superfund: Volume I—Human Health Evaluation Manual (Part A) (Interim Final); EPA/540/1e89/002; Office of Emergency and Remedial Response, U.S. Environmental Protection Agency: Washington, DC, USA, 1989.
- OEHHA Appendices. Office of Environmental Health Hazard Assessment Appendix A: Hot Spots Unit Risk and Cancer Potency Values. 2019. Available online: https://oehha.ca.gov/air/crnr/technical-support-document-cancer-potency-factors-2009 (accessed on 14 February 2022).
- U.S. EPA. Supplemental Guidance for Developing Soil Screening Levels for Superfund Sites; Office of Emergency and Remedial Response, U.S. Environmental Protection Agency: Washington, DC, USA, 2002; Volume 106, p. 20460.
- Ferreira-Baptista, L.; De Miguel, E. Geochemistry and risk assessment of street dust in Luanda, Angola: A tropical urban environment. Atmos. Environ. 2005, 39, 4501–4512. [Google Scholar] [CrossRef] [Green Version]
- U.S. EPA. Regional Screening Level (RSL) Summary Table; 2017. Available online: https://www.epa.gov/risk/regional-screening-levels-rsls-generic-tables (accessed on 1 March 2022).
- Cárdaba, A.M.; Moreno, M.M.; Medina, A.A.; Capitán, M.A.; Vaquer, F.C.; Gómez, A.A. Health impact assessment of air pollution in Valladolid, Spain. BMJ Open 2014, 4, 1–12. [Google Scholar] [CrossRef] [PubMed] [Green Version]
- Xu, T.; Hou, J.; Cheng, J.; Zhang, R.; Yin, W.; Huang, C.; Zhu, X.; Chen, W.; Yuan, J. Estimated individual inhaled dose of fine particles and indicators of lung function: A pilot study among Chinese young adults. Environ. Pollut. 2018, 235, 505–513. [Google Scholar] [CrossRef] [PubMed]


| Sampling Point Code | Sampling Point Features | Region | Coordinates | |
|---|---|---|---|---|
| X | Y | |||
| E1 | Primary School Mandra | Elefsina (Mandra) | 38°3′7″ B | 23°31′35″ A |
| E2 | Primary School I Elefsina | Elefsina | 38°3′10″ B | 23°31′51″ A |
| E3 | Primary School II Elefsina | Elefsina | 38°2′26″ B | 23°32′4″ A |
| Sampling Site | PM2.5 | PAH | VOCs | Heavy Metals |
|---|---|---|---|---|
| E1 | 93 | 42 | 131 | 43 |
| E2 | 44 | 22 | 115 | 22 |
| E3 | 43 | 27 | 84 | 25 |
| Total | 180 | 91 | 330 | 90 |
| Chemical Substance | Concentration (ng/m3) | |
|---|---|---|
| PAHs | Benzo(a)pyrene | 0.059 |
| Benz(a)anthracene | 0.053 | |
| Benzo(b)fluoranthene | 0.289 | |
| Benzo(k)fluoranthene | 0.079 | |
| Chrysene | 0.108 | |
| Dibenzo(a,h)anthracene | 0.023 | |
| Indeno(1,2,3-c,d)pyrene | 0.135 | |
| 1-methylnaphthalene | 0.577 | |
| Heavy metals | Nickel | 4.380 |
| Lead | 8.031 | |
| VOC | Benzene | 1390 |
| PAH | Relative Potency Factor |
|---|---|
| benzo[a]pyrene | 1.000 |
| benz[a]anthracene | 0.200 |
| benzo[b]fluoranthrene | 0.800 |
| benzo[k]fluoranthrene | 0.030 |
| chrysene | 0.100 |
| dibenz[a,h]anthracene | 10.00 |
| Indeno[1,2,3-c,d]pyrene | 0.070 |
| benzo[g,h,i]perylene | 0.009 |
| fluoranthene | 0.080 |
| Lifetime Cancer Risk Cases/106 | |||||||
|---|---|---|---|---|---|---|---|
| Methodology | Children 0–2 Years | Children 2–16 Years | Women 16–80 Years | Men 16–80 Years | Σ0–80 yrs (24 h/day) | ||
| 14 h/Day | 24 h/Day | 14 h/Day | 24 h/Day | ||||
| A.I | 3.15 | 0.66 | 0.08 | 0.13 | 0.08 | 0.14 | 3.95 1 |
| A.II | 0.31 | 0.22 | 0.08 | 0.13 | 0.08 | 0.14 | 0.68 1 |
| A.III | 5.2 | 7.2 | 12.4 | 7.8 | 13.4 | 18.6 1 | |
| A.IV | 0.59 (UR OEHHA, 2005) | 0.59 46.66 3 | |||||
| 46.66 (UR WHO, 2010) | |||||||
| B.I | 1.64 | 8.0 | 23.2 | 33.84 2 | |||
| B.II | 0.05 | 0.05 3 | |||||
| B.III | 2.3 | 5.4 | 9.3 | 5.4 | 9.3 | 11.7 1 | |
| B.IV | 2.3 | – | 5.4 | 9.3 | 11.7 2 | ||
| C.I | 68.44 | 47.80 | 16.78 | 28.77 | 18.11 | 31.04 | 147.3 1 |
| C.II | 68.44 | 47.80 | 16.78 | 28.77 | 18.11 | 31.04 | 147.3 1 |
| Hazard Quotient | |||||||
|---|---|---|---|---|---|---|---|
| Methodology | Children 0–2 Years | Children 2–16 Years | Women 16–80 Years | Men 16–80 Years | Hazard Index (24 h/day) | ||
| 14 h/Day | 24 h/Day | 14 h/Day | 24 h/Day | ||||
| B.I | HQ for each Target organ System(s) & Acute HI (OEHHA, 2015) | ||||||
| B.II | 3.59 × 10⁻⁶ | 2.33 × 10⁻⁶ | 5.92 × 10⁻⁶ * | ||||
| B.III | 0.5269 | 0.3074 | 0.5269 | 0.3074 | 0.5269 | 1.05 ** | |
| B.IV | 0.5269 | – | 0.3074 | 0.5269 | 1.05 ** | ||
| Substance | C (μg/m3) | Total HQAcute | Immune System | Reproductive/Development | Hematologic System | Respiratory System | Eyes | Nervous System |
|---|---|---|---|---|---|---|---|---|
| Benzene | 1.39 | 5.1 × 10⁻² | 1.72 × 10⁻² | 1.72 × 10⁻² | 1.72 × 10⁻² | – | – | – |
| Toluene | 3.56 | 9.62 × 10⁻⁵ | – | 2.41 × 10⁻⁵ | – | 2.41 × 10⁻⁵ | 2.41 × 10⁻⁵ | 2.41 × 10⁻⁵ |
| Xylenes 1 | 3.08 | 1.40 × 10⁻⁴ | – | – | – | 4.67 × 10⁻⁵ | 4.67 × 10⁻⁵ | 4.67 × 10⁻⁵ |
| Xylenes 2 | 2.76 | 1.25 × 10⁻⁴ | – | – | – | 4.18 × 10⁻⁵ | 4.18 × 10⁻⁵ | 4.18 × 10⁻⁵ |
| Xylenes 3 | 7.53 | 3.42 × 10⁻⁴ | – | – | – | 1.14 × 10⁻⁴ | 1.14 × 10⁻⁴ | 1.14 × 10⁻⁴ |
| Total Acute Hazard Index | 1.72 × 10⁻² | 1.72 × 10⁻² | 1.72 × 10⁻² | 2.27 × 10⁻⁴ | 2.27 × 10⁻⁴ | 2.28 × 10⁻⁴ | ||
| Methodology | Gender | Ages | AF | IR & BW | Exposure (h/Day) | Exposure (Day/Years) | Exposure (Years) |
|---|---|---|---|---|---|---|---|
| A.I | ✓ | ✓ | ✓ | ✓ | ✓ | X | X |
| A.II | ✓ | ✓ | X | ✓ | ✓ | X | X |
| B.I | X | ✓ | X | ✓ | ✓ | ✓ | ✓ |
| B.II | X | X | X | ✓ | ✓ | ✓ | ✓ |
| A.III | ✓ | ✓ | X | ✓ | ✓ | ✓ | ✓ |
| B.III | ✓ | ✓ | X | ✓ | ✓ | ✓ | ✓ |
| B.IV | X | ✓ | X | ✓ | X | ✓ | ✓ |
| A.IV | X | X | X | X | X | X | X |
| C.I | ✓ | ✓ | X | ✓ | ✓ | X | X |
| C.II | ✓ | ✓ | X | ✓ | ✓ | X | X |
Publisher’s Note: MDPI stays neutral with regard to jurisdictional claims in published maps and institutional affiliations. |
© 2022 by the authors. Licensee MDPI, Basel, Switzerland. This article is an open access article distributed under the terms and conditions of the Creative Commons Attribution (CC BY) license (https://creativecommons.org/licenses/by/4.0/).
Share and Cite
Pachoulis, M.; Maggos, T.; Panagopoulos, P.; Dasopoulou, M.; Balla, D.; Stamatelopoulou, A.; Manousakas, M.I.; Eleftheriadis, K.; Saraga, D. Population Health Risks Assessment from Air Pollution Exposure in an Industrialized Residential Area in Greece. Atmosphere 2022, 13, 615. https://doi.org/10.3390/atmos13040615
Pachoulis M, Maggos T, Panagopoulos P, Dasopoulou M, Balla D, Stamatelopoulou A, Manousakas MI, Eleftheriadis K, Saraga D. Population Health Risks Assessment from Air Pollution Exposure in an Industrialized Residential Area in Greece. Atmosphere. 2022; 13(4):615. https://doi.org/10.3390/atmos13040615
Chicago/Turabian StylePachoulis, Michail, Thomas Maggos, Panagiotis Panagopoulos, Maria Dasopoulou, Dimitra Balla, Asimina Stamatelopoulou, Manousos Ioannis Manousakas, Konstantinos Eleftheriadis, and Dikaia Saraga. 2022. "Population Health Risks Assessment from Air Pollution Exposure in an Industrialized Residential Area in Greece" Atmosphere 13, no. 4: 615. https://doi.org/10.3390/atmos13040615