Article

The Contents of Potentially Toxic Elements and Emission Characteristics of PM2.5 in Soil Fugitive Dust around Six Cities of the Yunnan-Guizhou Plateau in China

1
Faculty of Environmental Science and Engineering, Kunming University of Science and Technology, Kunming 650500, China
2
National-Regional Engineering Center for Recovery of Waste Gases from Metallurgical and Chemical Industries, Kunming University of Science and Technology, Kunming 650500, China
3
Faculty of Civil Engineering and Mechanics, Kunming University of Science and Technology, Kunming 650500, China
4
Yunnan Ecological Environmental Monitoring Center, Kunming 650034, China
5
Lincang Meteorological Service, Lincang 677000, China
*
Author to whom correspondence should be addressed.
Atmosphere 2022, 13(5), 678; https://doi.org/10.3390/atmos13050678
Submission received: 29 March 2022 / Revised: 20 April 2022 / Accepted: 21 April 2022 / Published: 23 April 2022
(This article belongs to the Special Issue Health Effects of Urban Atmospheric Aerosols)

Abstract

:
The contents of potentially toxic elements (V, Cr, Mn, Co, Ni, Cu, Zn, As, Cd, and Pb) and emission characteristics of PM2.5 in soil fugitive dust (SFD) in six Yunnan cities (Baoshan, Kunming, Wenshan, Honghe, Yuxi, and Zhaotong) were investigated in this research. The results showed that the contents of Zn and Pb in PM2.5 of SFD were the highest around Honghe and Yuxi, respectively, while the contents of Mn were the highest in PM2.5 of SFD around the other four cities. The enrichment factor and correlation indicated that the potentially toxic elements’ pollution degrees of PM2.5 of SFD around Kunming, Yuxi, and Honghe were higher than those around the other three cities and that potentially toxic elements were generally affected by metal smelting activities, and in Zhaotong, were affected by coal burning activities, while in Wenshan and Baoshan were less affected by human activities. The total emission of PM2.5 of SFD in the six cities was 7705.49 t in 2018. The total emission factor of PM2.5 of SFD reached the highest level from January to May and the lowest level from July to October. The health risk assessment showed that the potentially toxic elements in PM2.5 of SFD for children in the six cities and for adults in Baoshan, Kunming, Honghe, and Zhaotong had non-carcinogenic risk (non-carcinogenic risk thresholds were greater than 1), and As contributes most to non-carcinogenic risk. The carcinogenic risk value of Cr in PM2.5 of SFD in Kunming and Zhaotong was between 1 × 10⁻⁶ and 1 × 10⁻⁴, which had a certain carcinogenic risk. More attention should be paid to alleviate health risks posed by particle-bound potentially toxic elements through SFD.

1. Introduction

The contribution of soil fugitive dust (SFD) to atmospheric particulate matter can reach more than 40% [1,2,3], which is an important source of atmospheric particulate pollutants [4,5,6,7]. SFD refers to particulate matter that is directly derived from bare ground (such as farmland, bare mountains, and unhardened or nongreen open spaces) that becomes part of the ambient air through wind erosion [8,9]. The activity level of SFD is difficult to obtain due to the wide distribution area and random emission of SFD sources [10]. The influence of SFD on ambient air has not been considered in many regions, which limits the improvement potential of urban ambient air quality and is not conducive to the emission control of regional atmospheric particulate matter.
SFD emission estimation is important for understanding atmospheric particulate matter pollution in urban areas. The wind erosion equation (WEQ) was proposed by the U.S. Department of Agriculture in the 1960s [11], and the WEQ is still widely used because of its simple algorithm and high maneuverability [9,12,13,14,15]. In 2014, the equation was also recommended by the Ministry of Ecology and Environment of the People’s Republic of China (MEPC) as the calculation method of SFD emissions and was included in “The Technical Guide for Compilation of Particulate Matter Emission Inventory from Fugitive Dust Sources (Trial Version)” (hereafter referred to as the “Guide”) (http://www.mee.gov.cn, accessed on 21 February 2020). Remote sensing interpretation in areas with large cloud cover to obtain SFD activity levels often increases the uncertainty of land use and other data. However, the required data accuracy for SFD emission calculations can be guaranteed by published land use supervision classification data and normalized difference vegetation index (NDVI) data [8].
Yunnan-Guizhou Plateau is the main distribution area with rocky desertification and high background value area of geochemistry elements in China; As, Cd, Pb, and other potentially toxic elements generally have typical parent rock inheritance and are in a secondary enrichment state [16,17,18,19]. At the same time, Yunnan is known as the “Kingdom of Nonferrous Metals”, and its frequent non-ferrous metal smelting activities tend to release potentially harmful elements such as Zn, Pb, and Cd into surrounding environment and are enriched in soil. SFD, as one of the media of the soil environment into the atmosphere environment migration, is a harmful element that may be a potential source of human health hazards. The contents of potentially toxic elements in the dust migration process are usually higher than the background concentration of the soil [20,21]. The risk of potentially toxic elements’ toxicity also increased due to repeated “dusting and settling” of SFD in the atmospheric environment [22], and SFD is gradually becoming the sink and source of potentially toxic elements pollutants in urban ecosystems [23,24]. PM2.5 is more likely to be rich in potentially toxic elements and to cause vascular, respiratory, and nervous system diseases in the human body due to its large specific surface area [25,26,27], and the health risks that are posed by potentially toxic elements in PM2.5 of fugitive dust are highest in places such as Yangzhou [28] and Huzhou [29]. The spatial distribution of SFD emissions in China shows a pattern of “strong in the north and weak in the south, strong in the west and weak in the east”, with the highest emission intensity occurring in western Nei Mongolia Province and Xinjiang Province [30]. Various regions have diverse chemical features of PM2.5 in SFD [31], as well as different sources of its potentially toxic elements [32]. However, only a few research have investigated on the emissions of PM2.5 in SFD in the Yunnan-Guizhou Plateau area, and data on the contents of potentially toxic elements in PM2.5 of SFD is also scarce.
The contents and health risks characteristics of potentially toxic elements in PM2.5 can offer more valuable information than the analysis of other elements to the policymaker [33]. Therefore, this study aims to examine the emissions and the potentially toxic elements’ (V, Cr, Mn, Co, Ni, Cu, Zn, As, Cd, and Pb) content characteristics in PM2.5 of SFD around six cities (Baoshan, Kunming, Wenshan, Honghe, Yuxi, and Zhaotong) in the Yunnan-Guizhou Plateau region of China and assess the associated health risks for the potentially toxic elements, which can provide a scientific basis for improving environmental air quality and protecting human health.

2. Materials and Methods

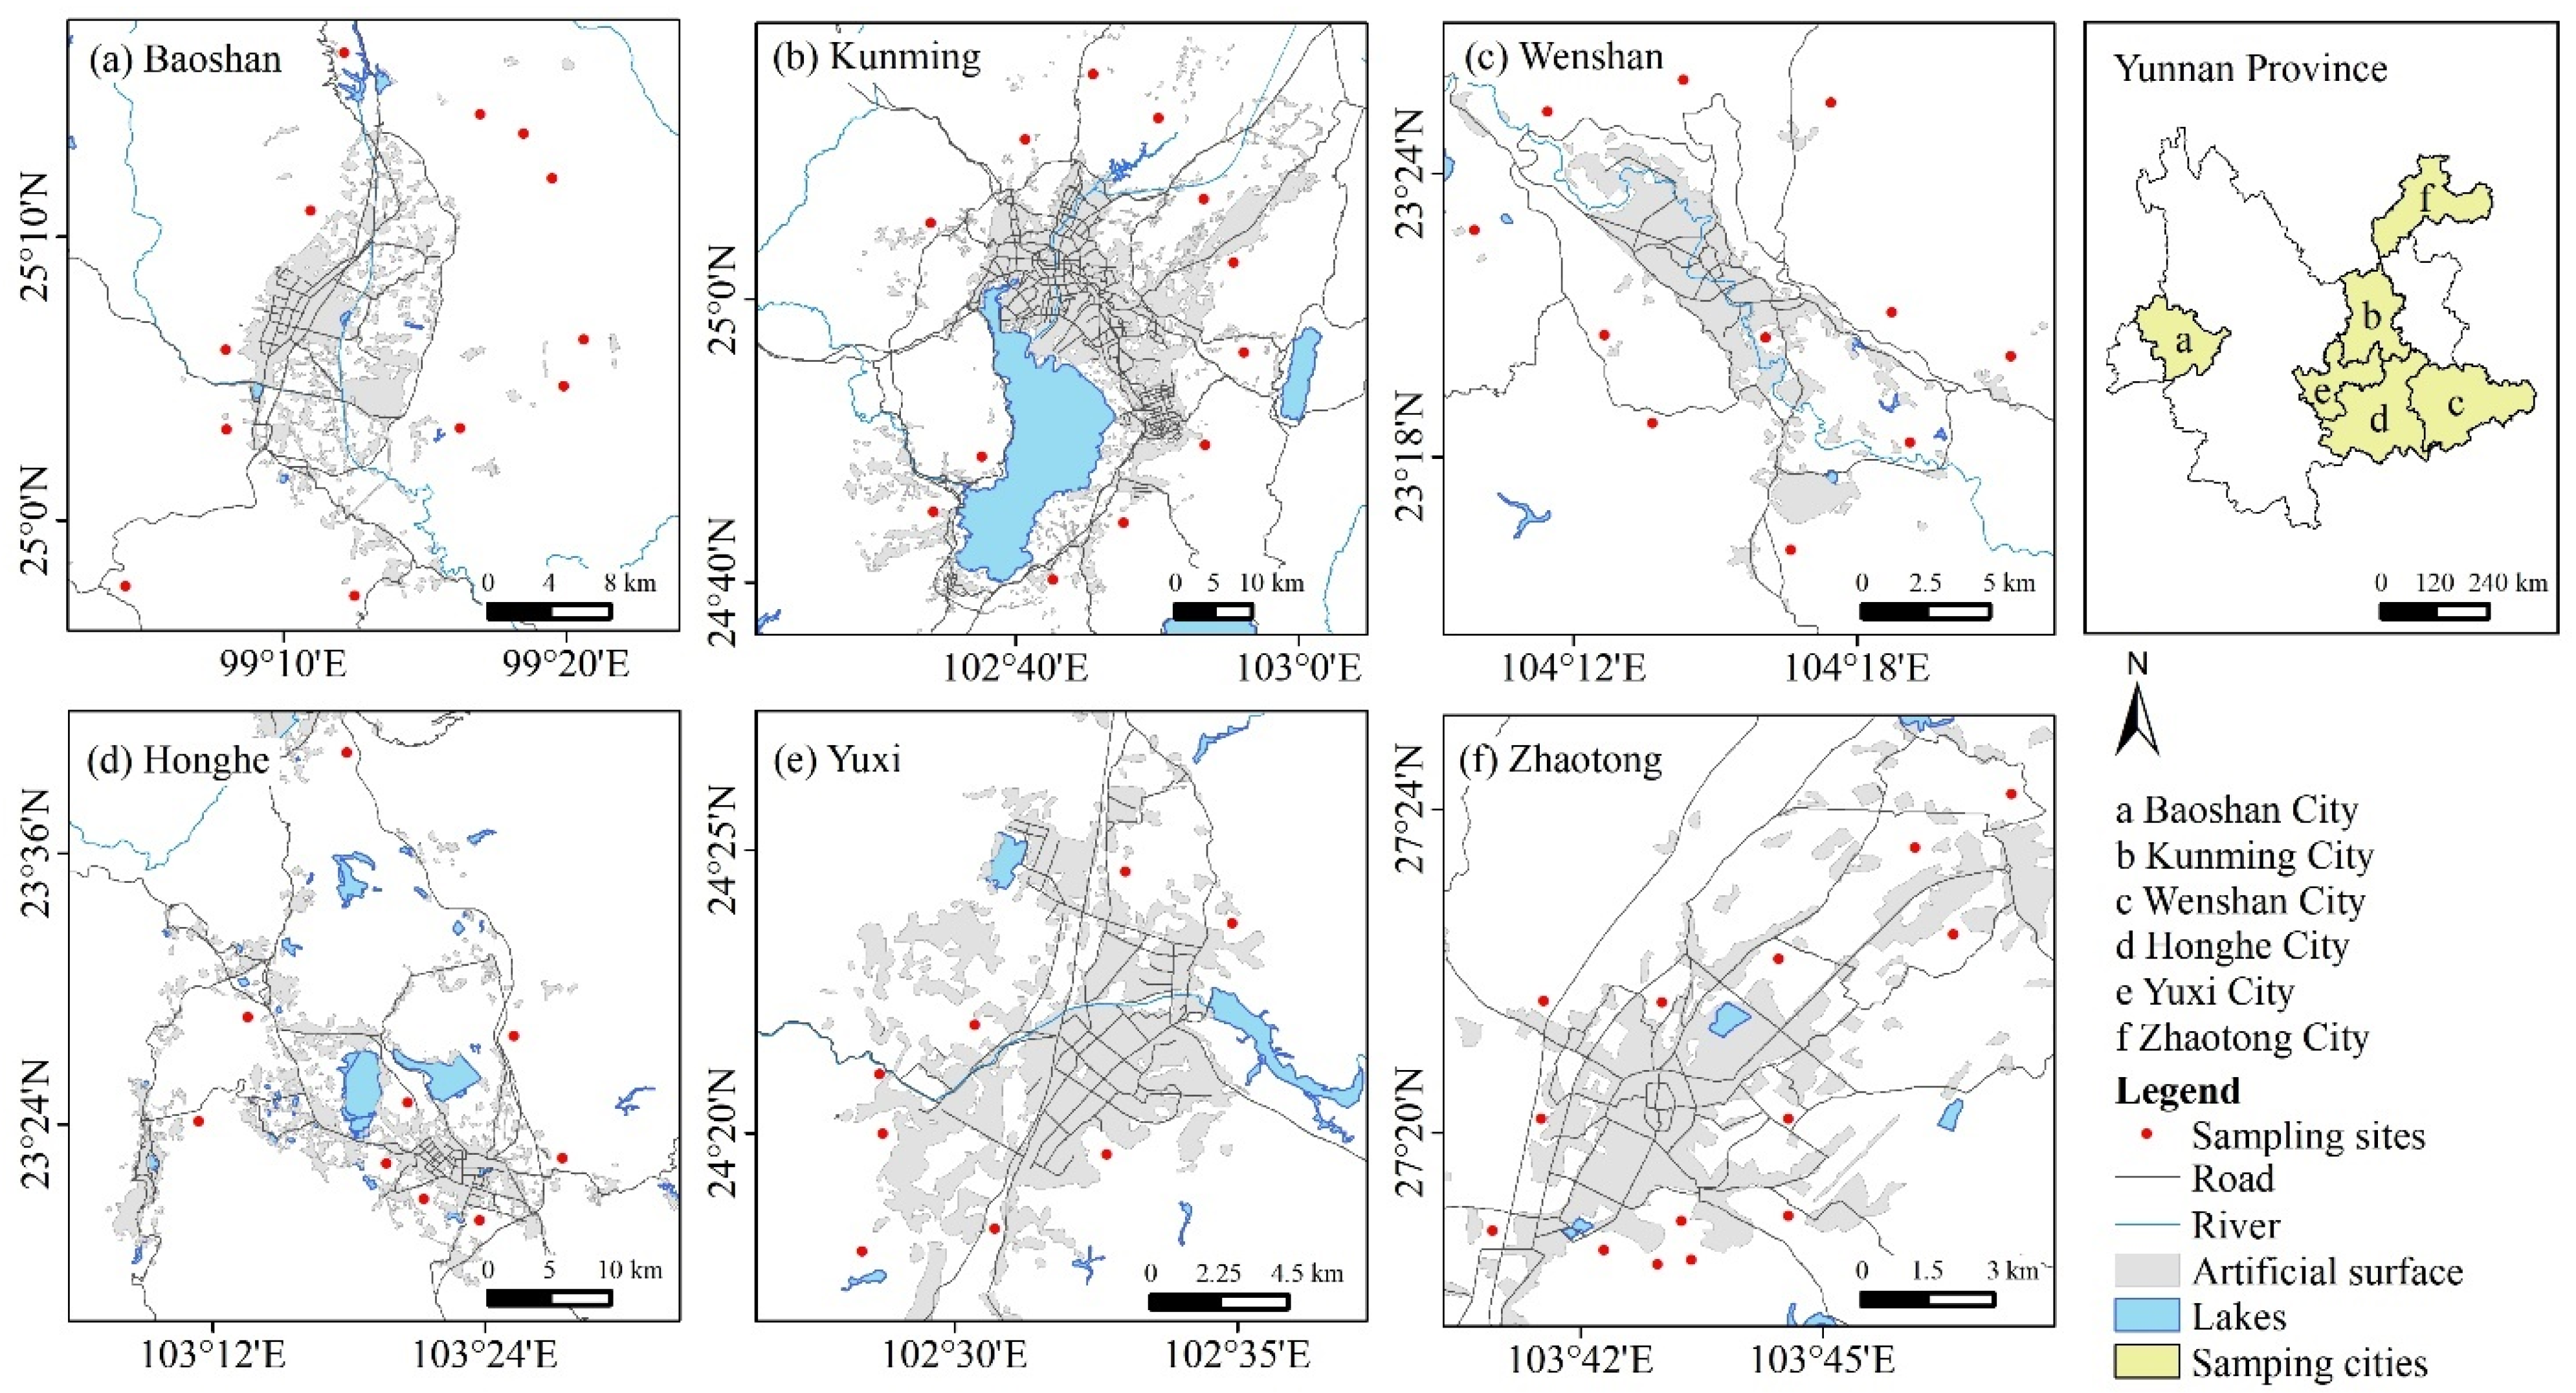
2.1. Description of the Study Area

Baoshan City (98°25′–100°02′ E, 24°08′–25°51′ N), Kunming City (102°10′–103°40′ E, 24°23′–26°22′ N), Wenshan City (103°35′–106°12′ E, 22°40′–24°48′ N), Honghe City (101°47′–104°16′ E, 22°26′–24°45′ N), Yuxi City (101°16′–103°09′ E, 23°19′–24°53′ N), and Zhaotong City (102°52′–105°19′ E, 26°55′–28°36′ N) are located in the Yunnan-Guizhou Plateau in southwest China and the administrative area of Yunnan Province. Yunnan has a low-latitude plateau mountain monsoon climate, with small temperature differences among the four seasons and distinct dry and wet seasons [34]. Most areas of Yunnan are affected by the southwest dry heating current in the dry season (November to April), with sunny and warm weather and little precipitation [35]. During the rainy season (May to October), in which there is abundant precipitation in Yunnan, the southwest monsoon airflow from the Indian Ocean and the southeast monsoon airflow from the North Pacific prevail [35]. Kunming is the capital of Yunnan Province and the main industrial base of Yunnan. It has formed a comprehensive industrial system based on machinery manufacturing, metallurgy, and tobacco processing. Honghe and Yuxi are the major heavy industrial cities in Yunnan and have rich mineral resources. Honghe is dominated by nonferrous metal smelting, the energy and chemical industries, and building material production, while Yuxi is dominated by mining and dressing, steel manufacturing and processing, and phosphorous chemical production. Zhaotong ranks first in terms of lignite reserves in Yunnan Province, and the coal mining and washing industry is developed. Wenshan is dominated by the notoginseng, tobacco, and metal smelting and processing industries. Baoshan is dominated by the steel and refined tea industries. In 2018, the GDPs of Baoshan, Kunming, Wenshan, Honghe, Yuxi, and Zhaotong were 73.81 billion yuan, 520.69 billion yuan, 85.91 billion yuan, 159.38 billion yuan, 149.30 billion yuan, and 88.98 billion yuan, respectively [36].

2.2. Sample Collection and Processing

At each sampling site of the SFD, mixed samples of soil dust were collected based on the plum blossom spots. Then, approximately 1000 g of the sample was obtained via the quarter method with a wooden shovel and loaded into sealed bags. Table 1 lists the sampling information, and Figure 1 shows the geographic locations of the sampling sites. All dust samples were taken back to the laboratory to remove branches, leaves, and other debris and then sieved through a 150-mesh stainless steel sieve after being naturally dried in the shade. The sieved amount was not less than 100 g. The sieved dust samples were collected on a Teflon membrane (MK360, Munktell, Sweden) with a diameter of 47 mm through a particle resuspension system (NK-ZXF, Nankai University) to obtain PM2.5. The sampling time for each dust sample was approximately 1 min, and the total sampling flow was 20 L/min−1. Blank Teflon membranes were placed in an oven at 60 °C for 2 h before sampling to remove impurities on the Teflon membranes. The Teflon membranes were balanced for 24 h in a temperature (25 ± 1 °C) and relative humidity (30 ± 5%) controlled environment before and after sampling and were finally weighed.

2.3. Chemical Analysis

The levels of potentially toxic elements (V, Cr, Mn, Co, Ni, Cu, Zn, As, Cd, and Pb) in PM2.5 were quantified by inductively coupled plasma-optical emission spectrometry (ICP-MS, Agilent 7500a, Agilent, CA, USA). The chemical analysis procedure was described in detail in our previous study [37]. Blank (including filter), Blank spike recovery (including filter), and duplicate sample analyses were performed for approximately 10% of all the samples. The relative deviation of the target elements in the duplicate sample analysis was less than 10%, and the target elements detection value in the blank sample analysis was lower than the detection limit of the double method. GBW07407 (National Research Center of Certified Reference Materials, China) was used to ensure accuracy and precision in this study, and the elements recovery percentage was between 90% and 110%.

2.4. Enrichment Factor (EF)

Al was selected as the reference element [38,39]. The EF was calculated as follows:
EF i = ( C i / C n ) sample / ( B i / B n ) background
where (Ci/Al)sample and (Ci/Al)background are the mass ratios of Ci and Al in the atmosphere and soil, respectively. The value of potentially toxic elements in soil refers to the background value for surface soil in Yunnan Province [40]. An EF value of less than 10 indicates that the soil is derived from the crust, whereas a value of greater than 10 indicates dominant anthropogenic emissions [41].

2.5. Computational Model of Soil Fugitive Dust Emssion

Song et al. [10], Li et al. [15], and Li et al. [42] introduced the principles of the computational model (WEQ) of SFD in the “Guide” in detail. The computational model of SFD is expressed as follows:
W si = E si × A s
E si = a × D i × C × ( 1 ŋ ) × 10 4
D i = k i × I we × f × L × VFC
C = 3.86 × u 3 / PE 2
PE = 3.16 × i = 1 12 [ P i / ( 1.8 × T i + 22 ) ] 10 / 9
VC = ( NDVI NDVI soil ) / ( NDVI veg NDVI soil )
VCF = ( 1 VC )
k j = VCF j × u j 3 / j = 1 12 ( VCF j × u j 3 )
In Equations (2)–(8), W is the emission amount of SFD, t/a; EF is the emission factor of the SFD, t/(m2·a); A is the area of the studied region, m2; a is the ratio coefficient of the total suspended particulate to the total wind erosion loss, of which the value is 0.025 [43]; Di is the dusting factor of the SFD, t/(hm2·a); ƞ is the removal efficiency of the pollution control technology on the SFD, which was not considered in this study; ki is the particle size coefficient (dimensionless), where the ki values of PM2.5 are 0.05; Iwe is the soil erodibility index, t/(hm2·a), and Table S1 presents the Iwe values of various soil texture types; f is the soil roughness factor, which has a dimensionless uniform value of 0.50; L is the unshielded width, which has values of 0.70, 0.85, and 1 for fields of width less than 300 m, 300–600 m, and greater than 600 m, respectively, and based on the topography of the study area, which consists primarily of plateau mountains, a value of 0.70 was used for the calculation; C is the climate factor (dimensionless); u is the annual average wind speed, m/s; PE is the Thorn Thwaite precipitation–evaporation index (dimensionless); Pi is the monthly precipitation (mm), which is calculated as 12.7 when Pi < 12.7 mm; Ti is the monthly average temperature, °C, which is calculated as −1.7 °C when Ti ≤ −1.7 °C; VCF is the proportion of the area that is covered by bare soil per unit area; VC is the vegetation coverage, which is calculated using the pixel dichotomy model [44] in Equation (7); and NDVIsoil and NDVIveg are the non-vegetation-covered land and the vegetated land, respectively, where the upper and lower thresholds of the NDVI with a 5% confidence level are used to represent NDVIsoil and NDVIveg, respectively. The monthly distribution coefficient (kj) of the PM2.5 emission factor of SFD was calculated using Equation (9), which was proposed by Li et al. [9].

2.6. Health Risk Assessment

This study is based on the health risk assessment model of the U.S. Environmental Protection Agency (EPA) to assess the health risks (non-carcinogenic and carcinogenic) of ten potentially toxic elements in PM2.5 of SFD [45], among which Mn, Cu, Zn, Pb, and V are non-carcinogenic elements and Cr, Co, Ni, As, and Cd are carcinogenic elements. The research objects are children and adults. The formulas for calculating the average daily exposure of humans to SFD through ingestion, inhalation, and dermal absorption are as follows [39,46]:
D ing = C × IngR × EF × ED BW × AT × 10 6
D inh = C × InhR × EF × ED PEF × BW × AT
D dermal = C × SA × SL × ABS × EF × ED BW × AT × 10 6
where Ding (mg/kg), Dinh (mg/kg), and Ddermal (mg/kg) represent the chemical daily intake through ingestion, the exposure content through inhalation, and the dermal absorbed dose, respectively. C (mg/kg) is the upper of 95% confidence interval for potentially toxic elements’ content, and other parameters are shown in Table S2 [46,47,48]. Since the EPA only provides the carcinogenic risk parameters of the respiratory route, this study only considers the carcinogenic risk of the respiratory route. The calculation formula of the lifetime average daily exposure (LADD) is as follows:
LADD = C × EF PEF × AT × ( InhR child × ED child BW child + InhR adult × ED adult BW adult )
The non-carcinogenic risk quotient (HQ) and carcinogenic risk (CR) of potentially toxic elements were calculated as follows:
HI = i m j n HQ ij = i m j n D ij RFD ij
CR = i m CR i = i m LADD i × SF i
where HI is the hazard index, namely, the sum of HQ, HI is > 1, suggesting the risk of cancer exists, and HI is less than or equal to 1, indicating the risk can be accepted or ignored. HQij is the non-carcinogenic risk value of potentially toxic elements i in the j expose pathway; RFDij is the reference dose of potentially toxic elements i exposed in the j pathway, mg/(kg∙d). Ri is the carcinogenic risk value of the potentially toxic elements i. CR is the sum of CRi; when CR is < 1 × 10⁻⁶, the risk can be ignored, and the risk can be accepted when CR is between 1 × 10⁻⁶ and 1 × 10⁻⁴. While CR is > 1 × 10⁻⁴, the risk of cancer exists seriously. SF is the carcinogenic slope factor, mg/(kg∙d). The specific parameters values are shown in Table S3 [48,49].

2.7. Data Source for Calculating Soil Fugitive Dust Emission

This study used the land use data at a spatial resolution of 1 km of the Resource and Environmental Science Data Center of the Chinese Academy of Sciences (https://www.resdc.cn/Default.aspx, accessed on 10 October 2021) for 2018 (Figure S1). The dry land, sparse forestland, other forestland, low-coverage grassland, medium-coverage grassland, bare soil, and bare rock in the land use data were used as the sources of SFD emissions around the six cities. The Harmonized World Soil Database V1.1 of the Food and Agriculture Organization of the United Nations (https://www.fao.org/home/en/, accessed on 14 October 2021) was combined with the recommended values of Iwe for each soil type (Table S1) to obtain the Iwe values of the spatial distributions in six cities (Figure S2). The meteorological data (wind speed, rainfall, and temperature) for the six cities were obtained from the National Climatic Data Center (NCDC), which is affiliated with the National Oceanic and Atmospheric Administration (https://www.ncdc.noaa.gov/, accessed on 30 August 2021). The NDVI data at spatial resolution of 1 km were obtained from the Resource and Environmental Science Data Center of the Chinese Academy of Sciences (https://www.resdc.cn/Default.aspx, accessed on 13 October 2021). The atmospheric environment PM2.5 concentration data were obtained from the China Environmental Monitoring Center (https://air.cnemc.cn:18007/, accessed on 4 August 2021).

3. Results and Discussion

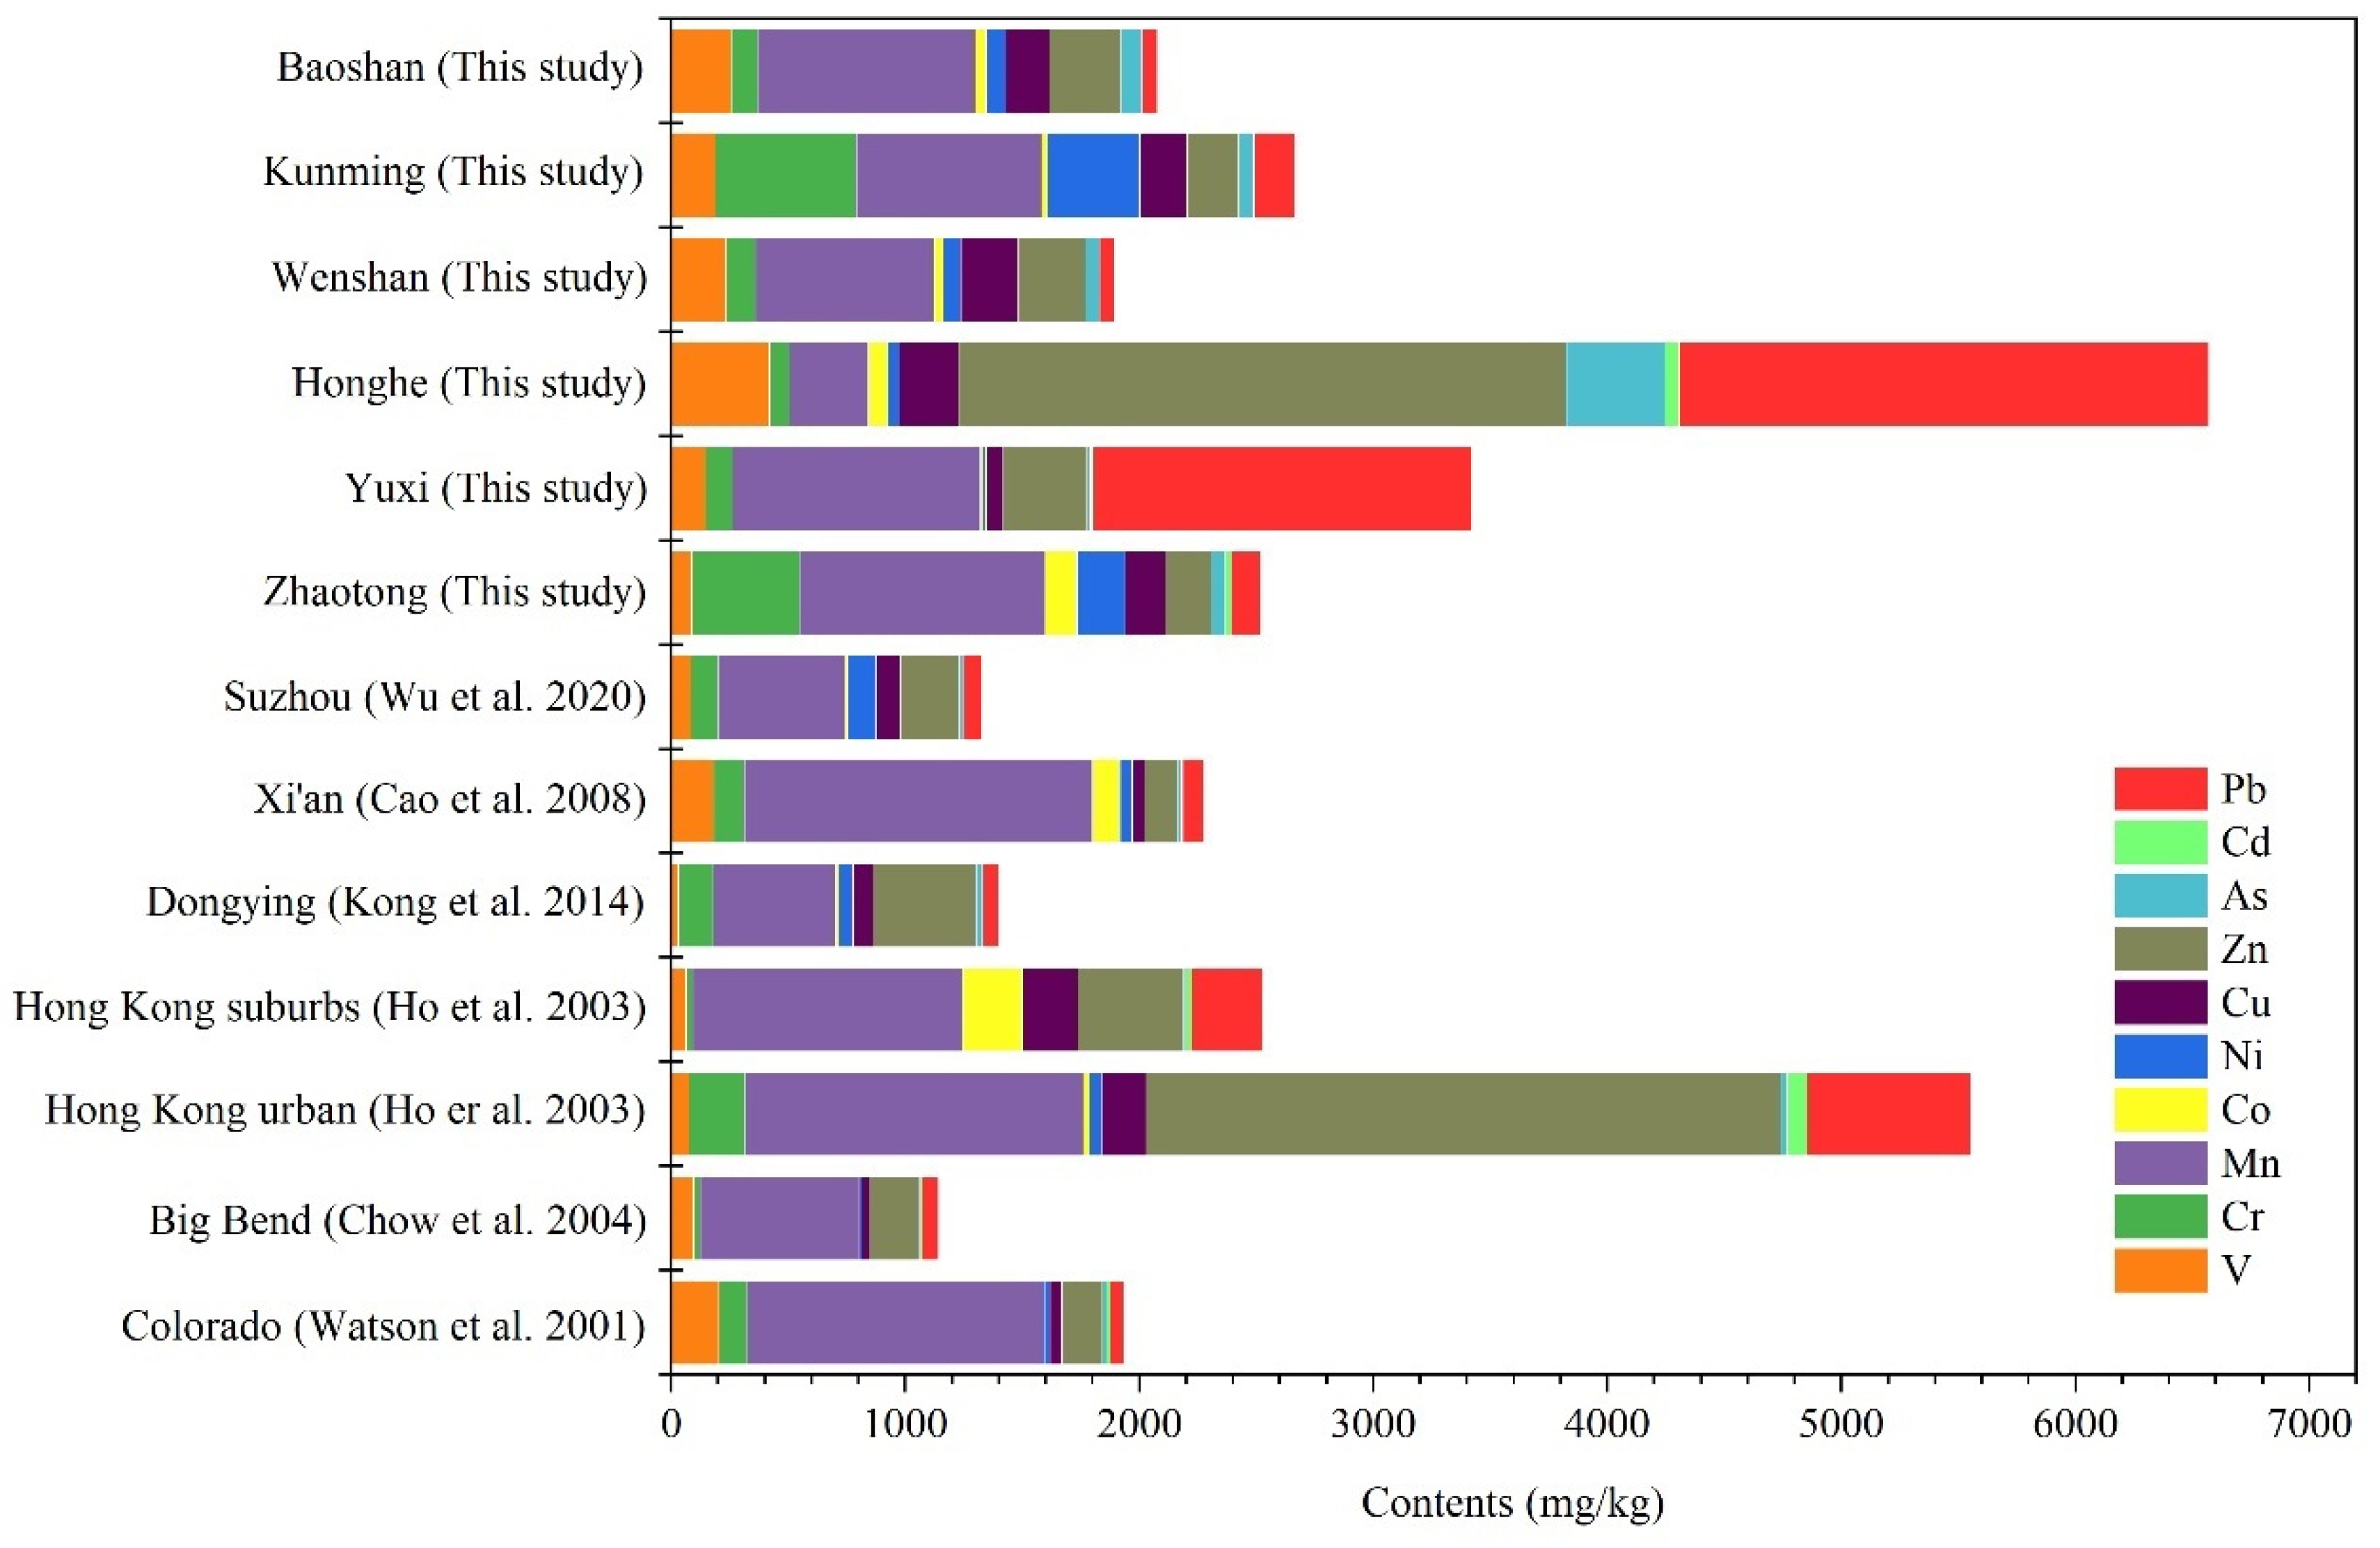
3.1. Potentially Toxic Elements Content Characteristics

The content levels of ten potentially toxic elements in PM2.5 of SFD around six cities are presented in Table 2. The sums of the contents of these ten potentially toxic elements in PM2.5 of SFD around Baoshan, Kunming, Wenshan, Honghe, Yuxi, and Zhaotong were 2074.70 mg/kg, 2660.38 mg/kg, 1890.15 mg/kg, 6570.43 mg/kg, 3418.38 mg/kg, and 2711.63 mg/kg, respectively. Among these potentially toxic elements, the contents of Zn and Pb were the highest in Honghe and Yuxi, respectively, and that of Mn was the highest in the other four cities. Only Mn and Ni in Honghe, V in Zhaotong and V, Co, Ni, and As in Yuxi did not exceed the local soil background values, which indicates that most of the potentially toxic elements in PM2.5 of SFD around the six cities were affected by human activities.
As shown in Figure 2, the contents of V, Cu, Zn, As, Cd, and Pb in the PM2.5 of SFD around Honghe were higher than those around other five cities in this study, and also higher than those in other study areas (except for Hong Kong urban) [39,50,51,52,53,54]. The Honghe area is rich in lead, zinc, and other nonferrous metal mines, and nonferrous smelting activities are frequent. Most potentially toxic elements, such as Zn and Pb, are released during mining, traffic, and smelting, and these potentially toxic elements may accumulate in the soil through atmospheric deposition and other mechanisms [55,56]. The contents of Pb in PM2.5 of SFD around Yuxi were lower than only those around Honghe, but it accounted for 47.33% of the total contents of the ten potentially toxic elements, which is much higher than around other cities. The iron and steel industry around Yuxi city is developed, and iron and steel smelting dust contains a large amount of potentially toxic elements such as Zn, Cd, and Pb [57]; potentially toxic elements in PM2.5 of SFD around Yuxi may have been affected by iron and steel smelting activities. The contents of Cr and Ni in PM2.5 of SFD around Kunming were relatively high, accounting for 22.64% and 14.86%, respectively, of the total contents of the ten potentially toxic elements, which were significantly higher than those in other cities, demonstrating that the Cr and Ni may have been affected by local human activities. The levels of Cr, Co, Ni, and Cd in PM2.5 of SFD around Zhaotong were also high in this research. This may have been related to local coal burning activities, which produce potentially toxic elements including Cr, Ni, and Cd [58]. Wenshan and Baoshan had relatively low levels of the ten potentially toxic elements in PM2.5 in SFD compared with the other four cities in this study, which may have been less affected by human activities. Most of the soil samples in this study were collected from bare farmland, and the potentially toxic elements in PM2.5 of SFD may have been affected by agricultural activities. In addition, Mn/V >> 1 indicates that the particulate matter originates mainly from coal burning activities [36,59], and the Mn/V (12.30) in Zhaotong was also higher than that of the northern Chinese city of Xi’an (8.22) [50], implying the potentially toxic elements in PM2.5 of SFD around Zhaotong may have been influenced by coal combustion activities.

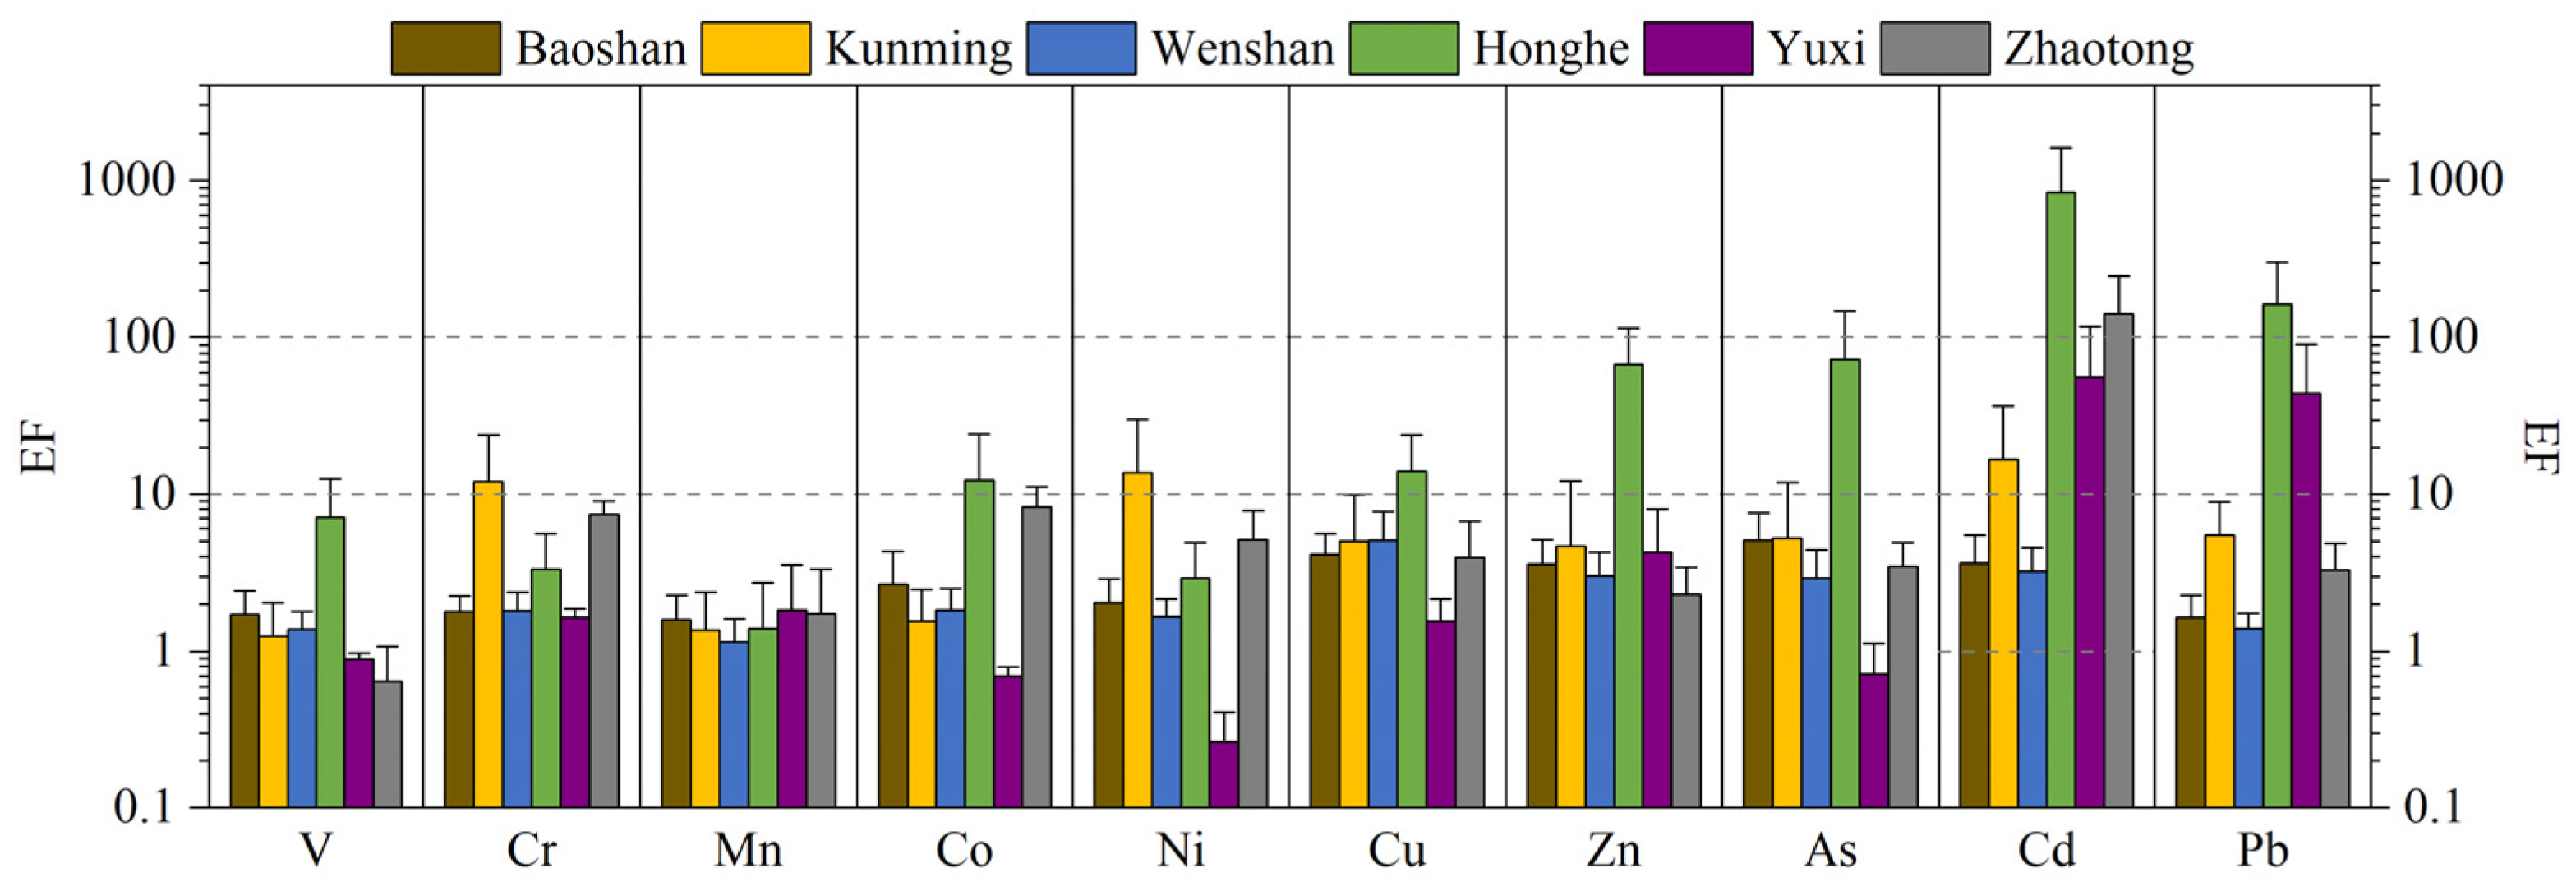
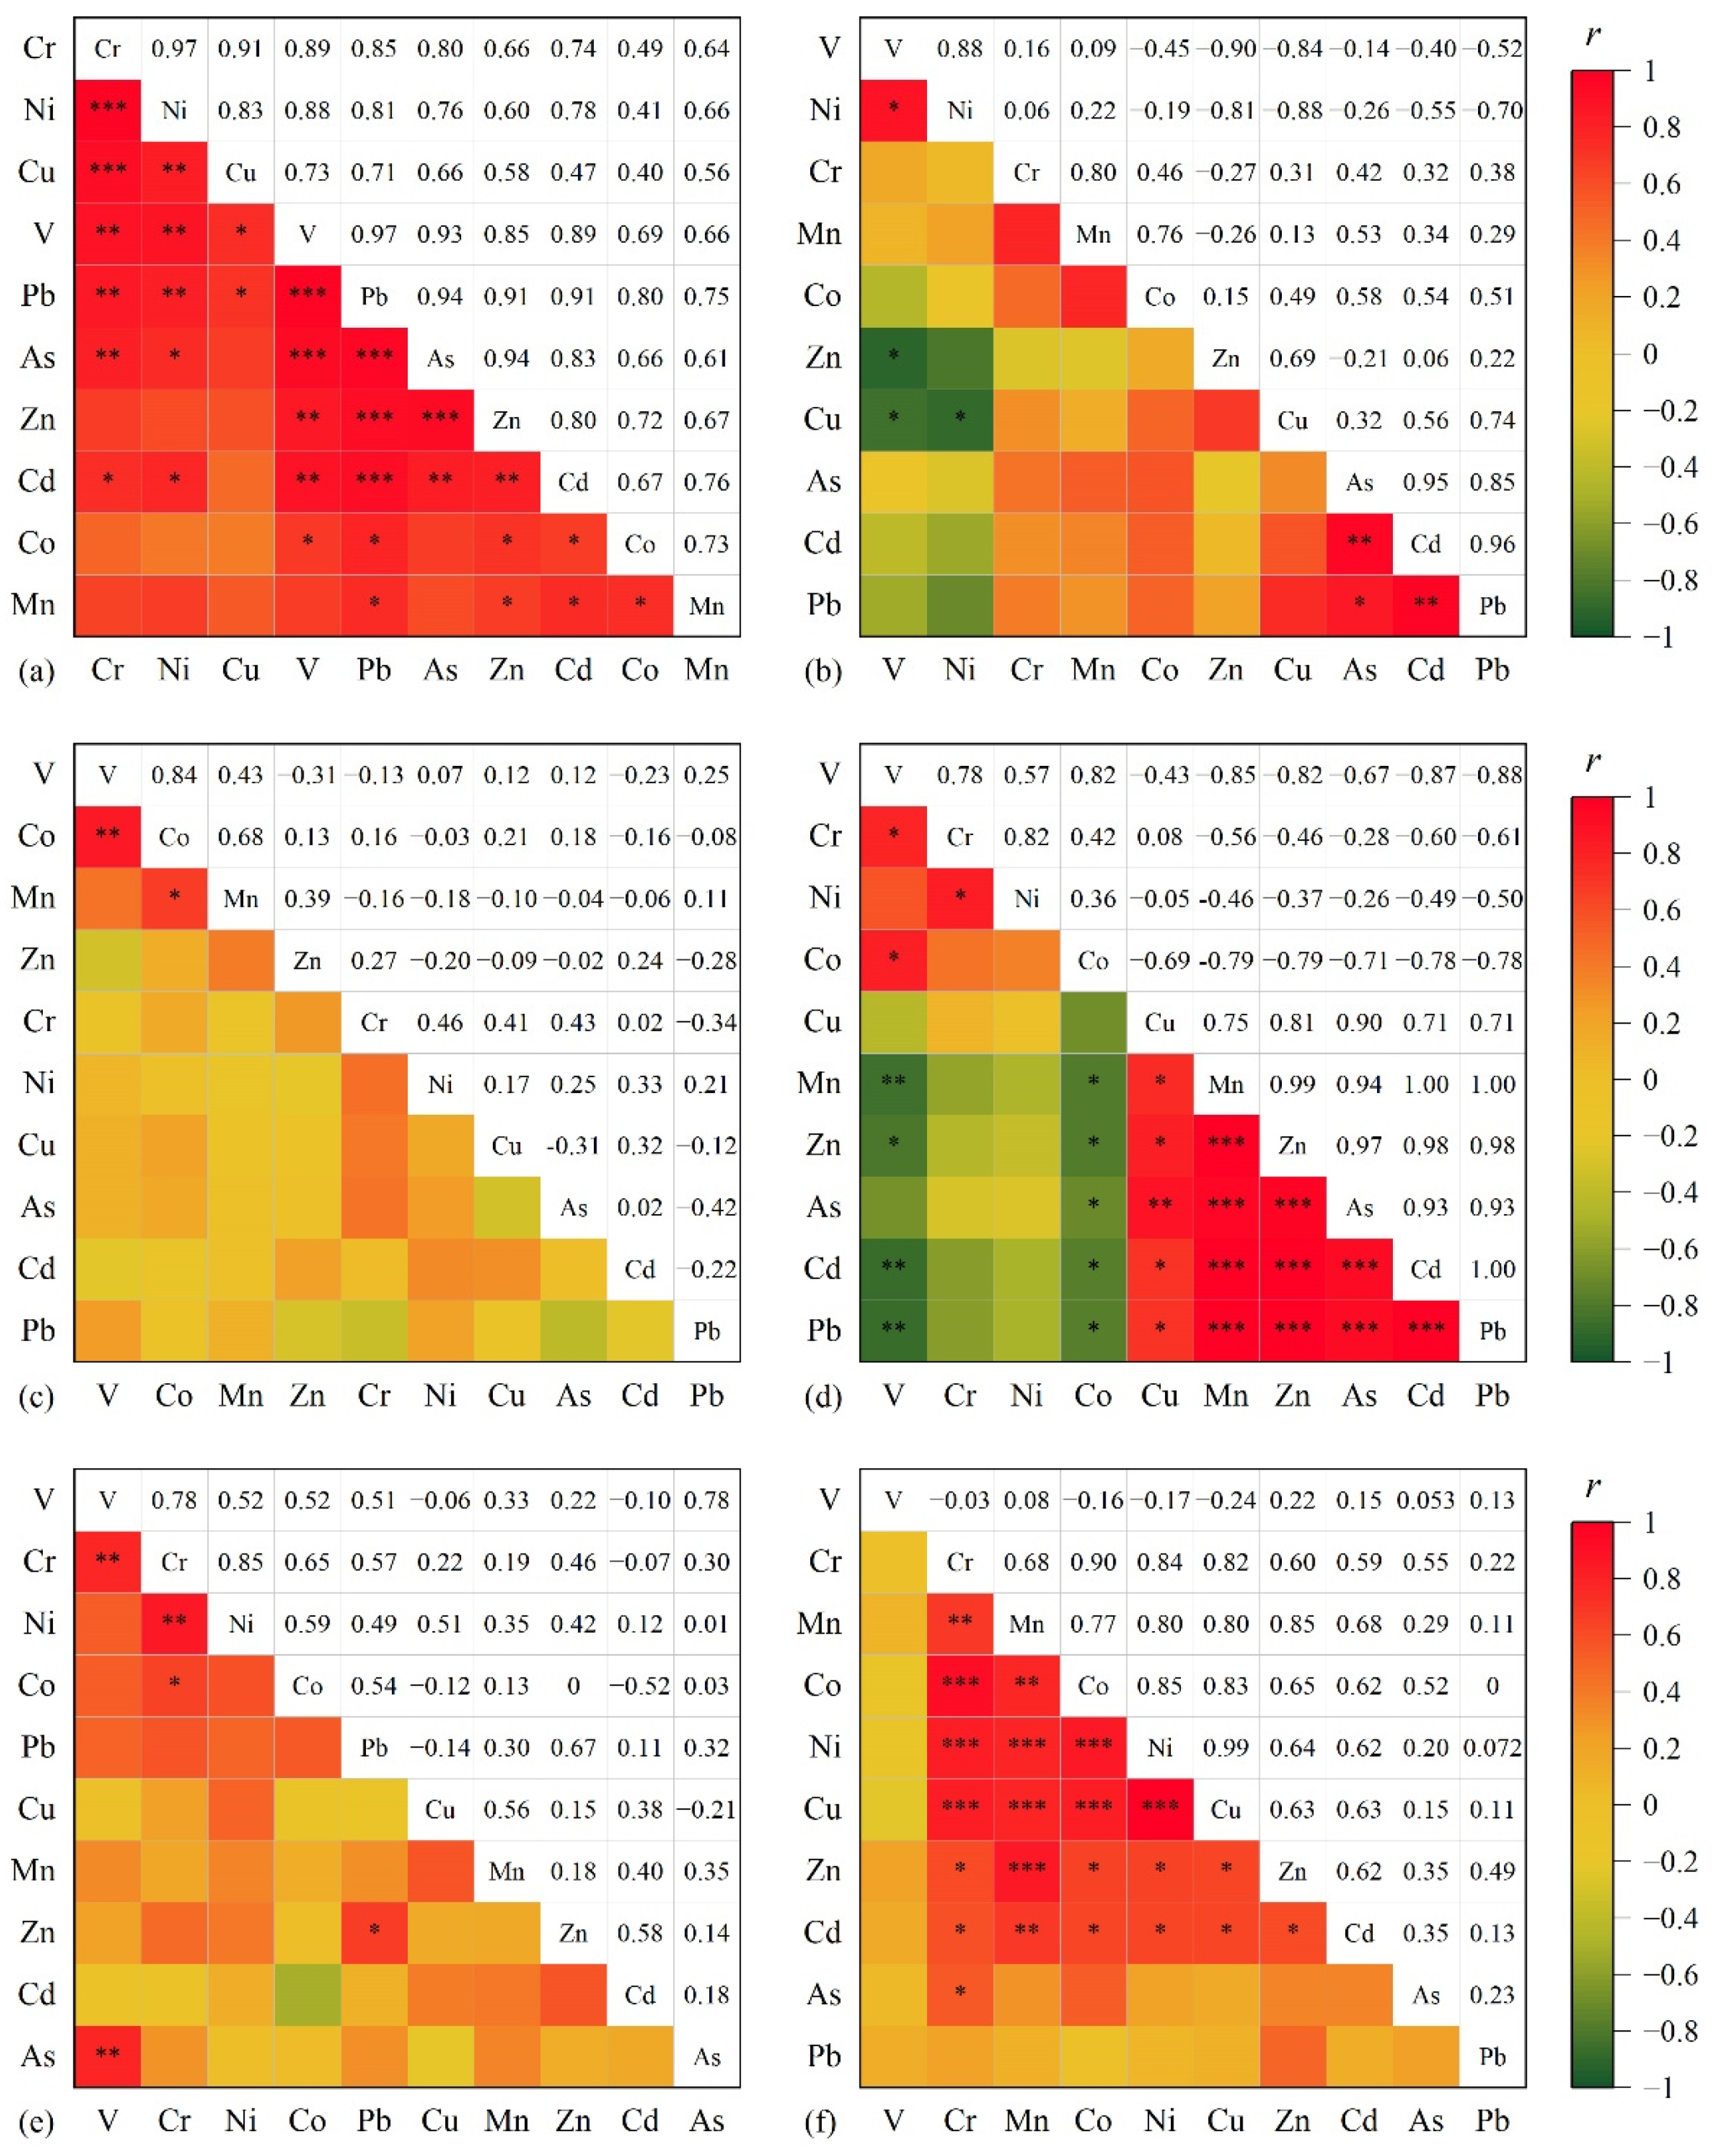
3.2. Enrichment Factor and Correlation Analysis

Correlations between potentially toxic elements can reflect whether they are homologous, and a correlation analysis between potentially toxic elements was conducted using SPSS software (version 24.0, SPSS Inc., Chicago, IL, USA). Figure 3 and Figure 4 show the EF values for 10 potentially toxic elements and the Pearson’s correlation coefficient (r) values from a correlation analysis between each pair of the 10 potentially toxic elements.
The EF values of the ten potentially toxic elements in PM2.5 of SFD around Baoshan and Wenshan were less than 10. The correlation coefficients among the ten potentially toxic elements in PM2.5 in SFD around Baoshan were all higher than 0.40, which indicated that the potentially toxic elements in PM2.5 in SFD around Baoshan were affected mainly by a single natural source. In PM2.5 of SFD around Wenshan, potentially toxic elements V-Cr, V-As, Cr-Co, Cr-Ni, and Zn-Pb were significantly correlated (r > 0.60, p < 0.05). The degree of rocky desertification in Wenshan is among the most severe in Yunnan, with a rocky desertification land area of 646,967.70 hm2 [60]. The weathering of the rock is also the major source of V in ambient air particles [61], and Cr, Co, Ni, and As often have typical parent rock inheritance in Yunnan [16,17]. Zn and Pb are characteristic elements of vehicle pollution sources [41,62]; V, Cr, Co, and other metals may also be produced by pavement wear [63]. Therefore, the potentially toxic elements in PM2.5 of SFD around Wenshan originated mainly from natural sources, but they may have also been slightly affected by traffic sources.
In the PM2.5 of SFD around Kunming, the EF values of V, Mn, Co, Cu, Zn, As, and Pb were less than 10; these potentially toxic elements are derived mainly from natural sources. Among ten potentially toxic elements, only Co-V and Co-Mn showed a significant correlation (r > 0.60, p < 0.05), and V, Co, and Mn in dust are also considered to be derived from crustal materials [61,64,65]. The EF values of Cr, Ni, and Cd were between 10 and 100. Cr and Cd are usually used to protect other metals from corrosion and rust damage, so Cr and Cd are often related to nonferrous metal smelting, steel manufacturing, and other production processes [66,67]. Ni is a marker for fuel combustion, but it is also an iron-philic element and is widely used in steel manufacturing [4]. According to Han et al. [37], Cr in the atmospheric PM2.5 in Kunming is mainly from vehicle emissions. Miao et al. [68] showed that potentially toxic elements in Kunming soil are affected by industrial sources and traffic sources, and Chen et al. [69] identified agricultural fertilizers as the main cause of excessive Cd contents in Kunming soil. In summary, the potentially toxic elements in PM2.5 of SFD around Kunming may have been affected by various artificial sources, such as nonferrous metal smelting, steel manufacturing and processing, and agricultural fertilizers.
The EF values of V, Cr, Mn, and Ni were less than 10 in PM2.5 of SFD around Honghe, thereby indicating that these elements originated from natural sources, which is consistent with the research results of Wang et al. [70]. The EF values of Co, Cu, and Zn were between 10 and 100; the EF values of As, Cd, and Pb were greater than 100; and the EF values of Co, Cu, Zn, As, Cd, and Pb were higher than those of the other five cities in this study. Cu-V, Cu-Ni, and V-Zn were significantly negatively correlated, and V-Ni were significantly positively correlated, thereby indicating that the sources of Cu and Zn differed from those of V and Ni. Cu, Zn, and Pb are related mainly to the emission of antioxidants, lubricating oil use, brake pad wear, and tire friction of motor vehicles [71,72]. According to Wang et al. [70] and Guo et al. [73], Cu, Zn, and Pb in the soil of the Honghe smelting area are affected by local smelting industrial activities in addition to traffic sources. Significant correlations (r > 0.80, p < 0.05) among As, Cd, and Pb in the PM2.5 of SFD around Honghe were identified in this study. As, Cd, and Pb are the typical potentially toxic elements in the lead–zinc smelting area [74,75,76]. Therefore, the potentially toxic elements in the PM2.5 of SFD around Honghe were affected mainly by metal smelting activities and traffic activities.
The EF values of V, Cr, Mn, Co, Ni, Cu, Zn, and As in the PM2.5 of SFD around Yuxi were less than 10, and the EF values of Cd and Pb were between 10 and 100. Cd and Pb are widely present in activities such as nonferrous metal smelting, steel smelting, and coal combustion [77,78]. Yuan et al. [79] found that Cu, Zn, Cd, and Pb pollution occurred near a steel smelting area. There were significant positive correlations (r > 0.70, p < 0.05) among Cu, Zn, As, Cd, and Pb in the PM2.5 of SFD around Yuxi, and As has been identified as a characteristic component of coal combustion [80,81], indicating that the potentially toxic elements in PM2.5 of SFD around Yuxi were affected mainly by iron and steel smelting and coal burning activities.
The EF values of V, Cr, Mn, Cu, As, Ni, Co, Zn, and Pb in PM2.5 of SFD around Zhaotong were less than 10, and the EF value of Cd was greater than 100. There were significant positive correlations (r > 0.60, p < 0.05) among Cr, Mn, Co, Ni, Cu, Zn, and Cd. Cd mainly originates from coal combustion [77], while the lignite chemical industry and mining is one of Zhaotong’s seven pillar industries, and the coal consumption of residents also accounted for a certain proportion (914.80 thousand tons of standard coal, accounting for 15.59% of the total energy consumption of coal) [36]. At the same time, the potentially toxic elements such as Cr, Co, Ni, and Cd are also produced in coal burning activities [58]. Therefore, the potentially toxic elements in the PM2.5 of SFD around Zhaotong were affected by coal burning activities.
The above roughly judged the source of potentially toxic elements in PM2.5 of SFD in six cities, and more data are required to provide support for the detailed source of potentially toxic elements.

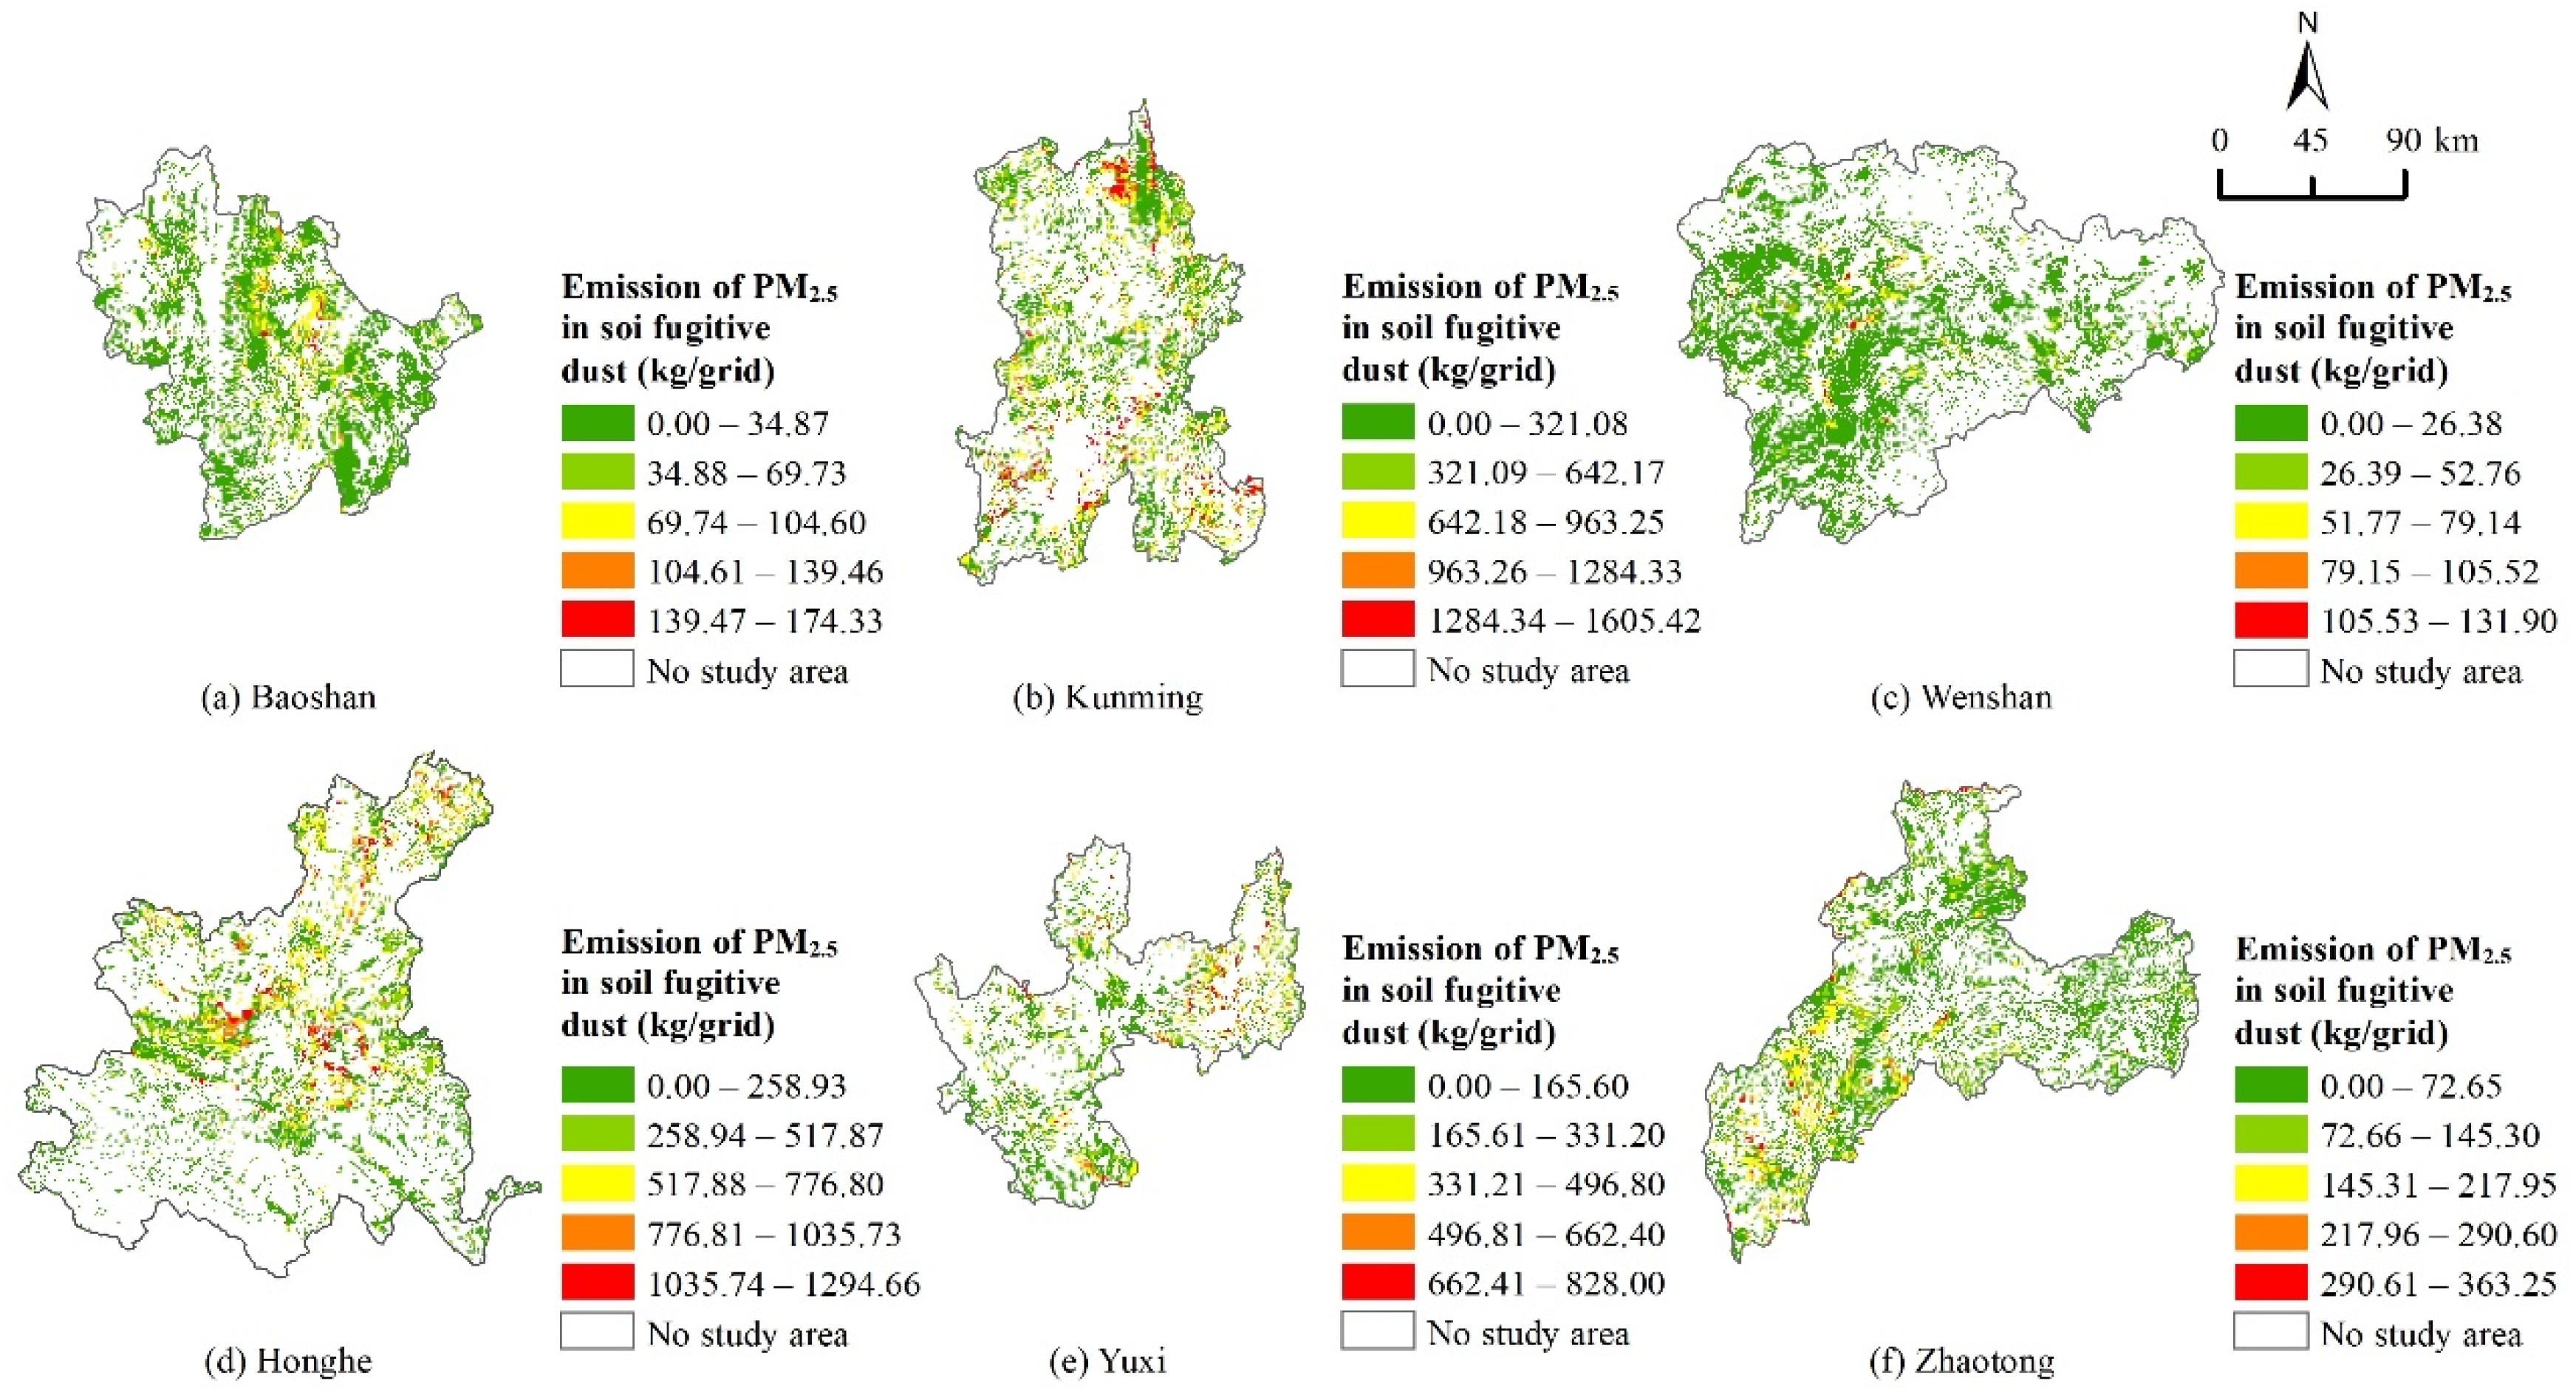
3.3. Emission of PM2.5 in Soil Fugitive Dust

3.3.1. Key Parameter Values

Seven types of soil texture are present in the six cities (Table S4), and the main soil texture types are loam, clay, sandy clay loam, and silty loam. A nonparametric test (the Kruskal–Wallis test, 95% confidence level) showed that there were significant differences in Iwe among the six cities (p < 0.05). As shown in Table 3, the Iwe value of Honghe was the largest. Its sandy clay loam, loam, and clay accounted for 48.98%, 25.59%, and 18.02%, respectively, and the silt loam accounted for less than 10%. Wenshan had the lowest value of Iwe, and its main soil texture type was clay, which accounted for 81.28%.
The annual wind speed, temperature, and precipitation of the six cities in 2018 are shown in Figure S3, which were tested using a nonparametric test (the Freedman test, with a confidence of 95%) and compared in pairs. The results showed that there were significant differences in wind speed, temperature, and precipitation among the six cities (p < 0.05). The values of C followed the order Kunming > Honghe > Yuxi > Zhaotong > Baoshan > Wenshan, which showed that the climatic factors in central and southern Yunnan were relatively high, and this order was also similar to the annual average wind speed of the six cities (Table S5), implying the wind speed may have been one of the reasons for the significant differences in C among the six cities. At the same time, the wind speeds in the six cities were generally the highest in spring and winter, while the wind speeds in summer and autumn were relatively low.
The six cities also showed significant differences in VCF (p < 0.05) in the nonparametric test (the Kruskal–Wallis test, 95% confidence level). The cities were ordered in terms of VCF value as Kunming > Yuxi > Honghe > Wenshan > Zhaotong > Baoshan, which indicated that there were more bare land areas in central and southern Yunnan. The monthly VCF values of the six cities are presented in Table S6, and the nonparametric test (the Kruskal–Wallis test, 95% confidence level) showed that the monthly VCF values of the six cities differed significantly (p < 0.05). The lowest values of VCF in the six cities generally appeared from June to October, while the highest values appeared from November to March (except for Baoshan). This may have been due to the gradual maturity of crops such as upland rice, corn, and sugarcane in Yunnan in autumn. Subsequent harvesting activities led to a continuous increase in the bare area of farmland. The highest value of VCF in Baoshan occurred in June, which may have been due to June being the local harvest month for crops such as wheat.

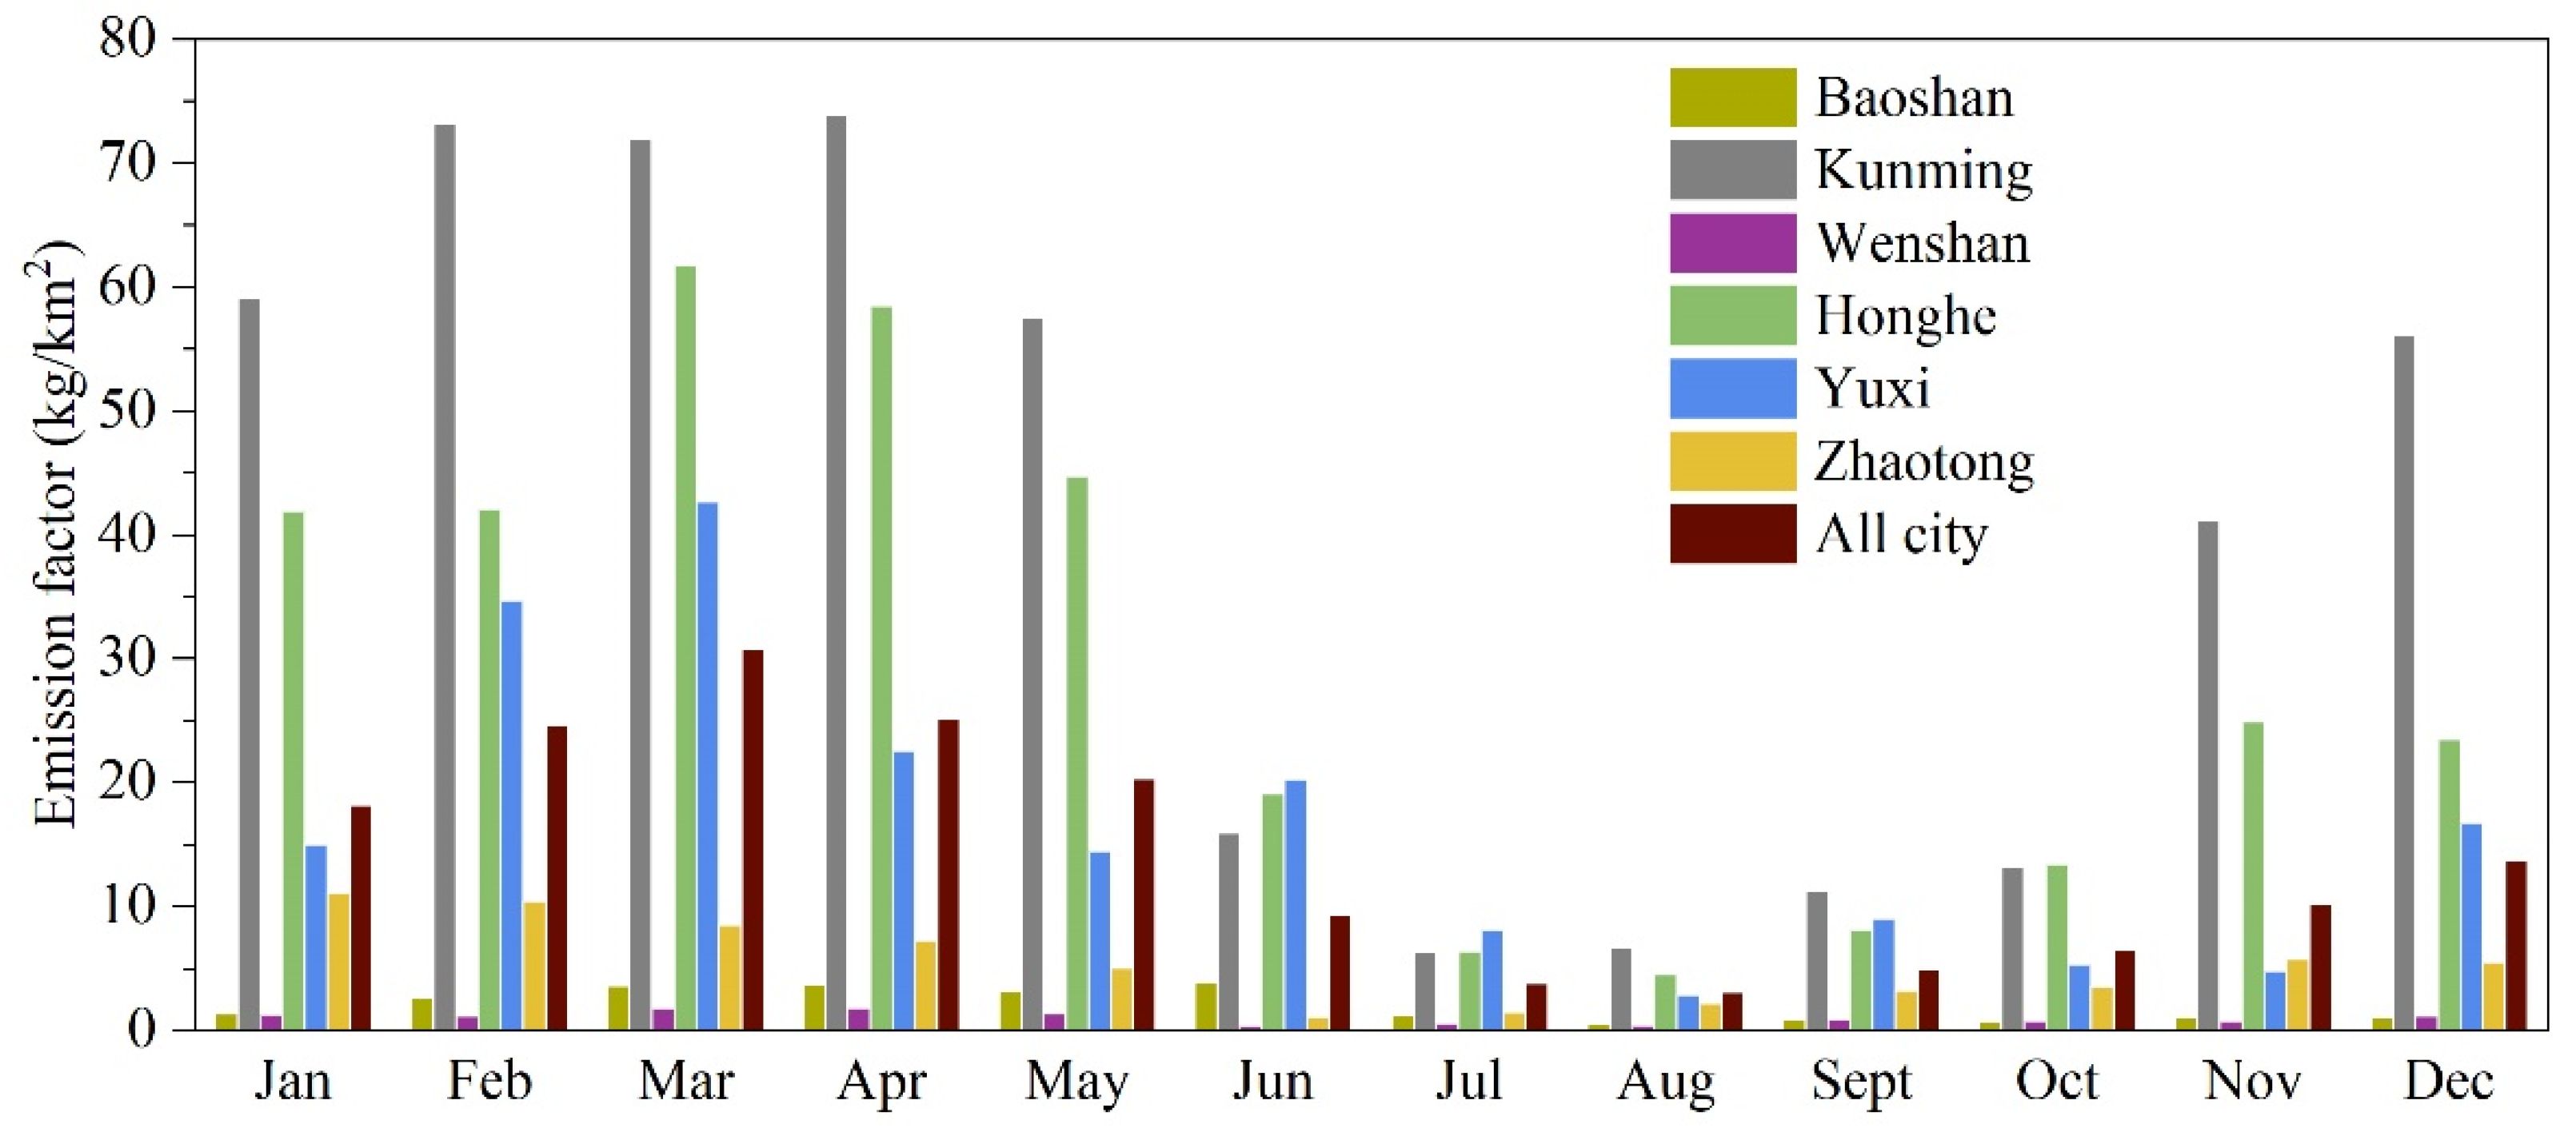
3.3.2. Soil Fugitive Dust Emission Characteristics

The spatial distributions of the emissions of PM2.5 in SFD are shown in Figure 5. The areas of SFD sources in Baoshan, Kunming, Wenshan, Honghe, Yuxi, and Zhaotong accounted for 39.63%, 31.92%, 33.10%, 24.23%, 24.21%, and 36.92% of their administrative areas, respectively. Although the SFD source area was shown as Wenshan > Zhaotong > Honghe > Baoshan > Kunming > Yuxi, the order in terms of emission factor and emission of soil dust PM2.5 was Kunming > Honghe > Yuxi > Zhaotong > Baoshan > Wenshan. This order is consistent with the order in terms of the size of C. A nonparametric test (Kruskal–Wallis test, 95% confidence level) showed that there were significant differences in the emission factor and emission of PM2.5 of SFD among the six cities (p < 0.05). At the same time, comparing the land use data, it can be found that high emissions occur in the surrounding areas of the main urban area, which may be due to the frequent anthropogenic activities around the city to promote the release of SFD. In addition, some areas far away from the main urban area also had high emissions, and our survey found that these areas generally have higher Iwe and a geological background of rocky desertification, so their surface may be barer and have higher wind erosion potential. The monthly PM2.5 of SFD emission factor of the six cities is shown in Figure 6. The SFD emission factor in each city was generally greater in spring and winter than in autumn and summer. The total PM2.5 emission factor of the studied cities was high from January to May and ranged from 18.19 to 30.83 kg/km2, which accounted for 10.65–18.05% of the total annual emissions. The next highest emission factor months were November and December, which accounted for 5.99% and 8.02%, and the remaining months accounted for approximately 1.80–5.43%.
Table S7 presents the concentration atmospheric PM2.5 for each month in the six cities. The concentrations of atmospheric PM2.5 in the six cities from January to April were generally higher than those in other months, and the annual distribution characteristics of the monthly average concentrations of atmospheric PM2.5 in the six cities were similar to the monthly emission factor of PM2.5 of SFD. The emission factor can better reflect the impact of SFD on air quality than the total emissions [10]. The values of the correlation coefficient between the monthly emission factor of PM2.5 of SFD and the monthly average concentration of atmospheric environmental particulate matter in the six cities are presented in Table 4. The monthly emission factor of PM2.5 of SFD around the six cities and the monthly average concentrations of PM2.5 in the atmospheric environment all showed good correlations, which demonstrated the reliability of the SFD emission in this study. At the same time, in 2018, the average daily PM2.5 concentrations in the six cities exceeded the MEPC level one guideline (35 µg·m−3, China, MEPC 2012), accounting for 9.59–23.83% of annual days. These values were lower than those in northern China and some coastal cities [82]. This showed that in Yunnan-Guizhou Plateau areas with relatively high vegetation, the impact of open sources such as SFD on the atmospheric PM2.5 concentration may be more significant than is usually believed.
The emissions of ten potentially toxic elements were obtained based on the contents of potentially toxic elements in PM2.5 of SFD around six cities and the PM2.5 emissions of SFD, as presented in Table 5. The concentration of potentially toxic elements in dust varies with different seasons [83]. Although this research only collected SFD samples in specific months, without considering the actual dusting mechanism, the monthly distribution characteristics for potentially toxic elements emissions in PM2.5 of SFD should be similar to the PM2.5 emissions of SFD. The total emissions of potentially toxic elements in PM2.5 of SFD in Kunming, Honghe, and Yuxi was higher than that in Baoshan, Wenshan, and Zhaotong, while Kunming, Honghe, and Yuxi are economically developed areas in Yunnan province, and frequent human activities may be more likely to cause soil disturbance and potentially toxic elements enrichment in SFD. The emissions of V, Co, Cu, Zn, As, Cd, and Pb in PM2.5 of SFD around Honghe were much greater than those around other cities in this study; Cr and Ni around Kunming and Pb around Yuxi also showed higher emissions, similar to the sequence of potentially toxic elements contents in PM2.5 of SFD. At the same time, most of the above-mentioned potentially toxic elements were in an enriched state. Therefore, the relevant emissions of potentially toxic elements in SFD in spring and winter should receive more attention.

3.3.3. Uncertainty Analysis

In this study, the uncertainty of the emission of PM2.5 in SFD originated mainly from the SFD calculation formula (WEQ) itself and the selection of the parameters [9]. Meteorological data, soil texture type data, and NDVI data were all sourced from official data, and the statistical errors were small. Parameters such as the particle size coefficient, unshielded width, and surface roughness were selected from the recommended values in the Chinese “Guide”, and no field sample measurements were carried out. In addition, limited by the number of meteorological stations, the calculation of C was performed at the city scale, which ignores the influence of climate differences within cities [10]. The actual dusting mechanism was not considered in the calculation of potentially toxic elements emissions. The amount of SFD samples in this study is not abundant, and the representativeness may be lacking. All the above factors may have caused uncertainty in the calculation results for the emission of SFD and its potentially toxic elements.

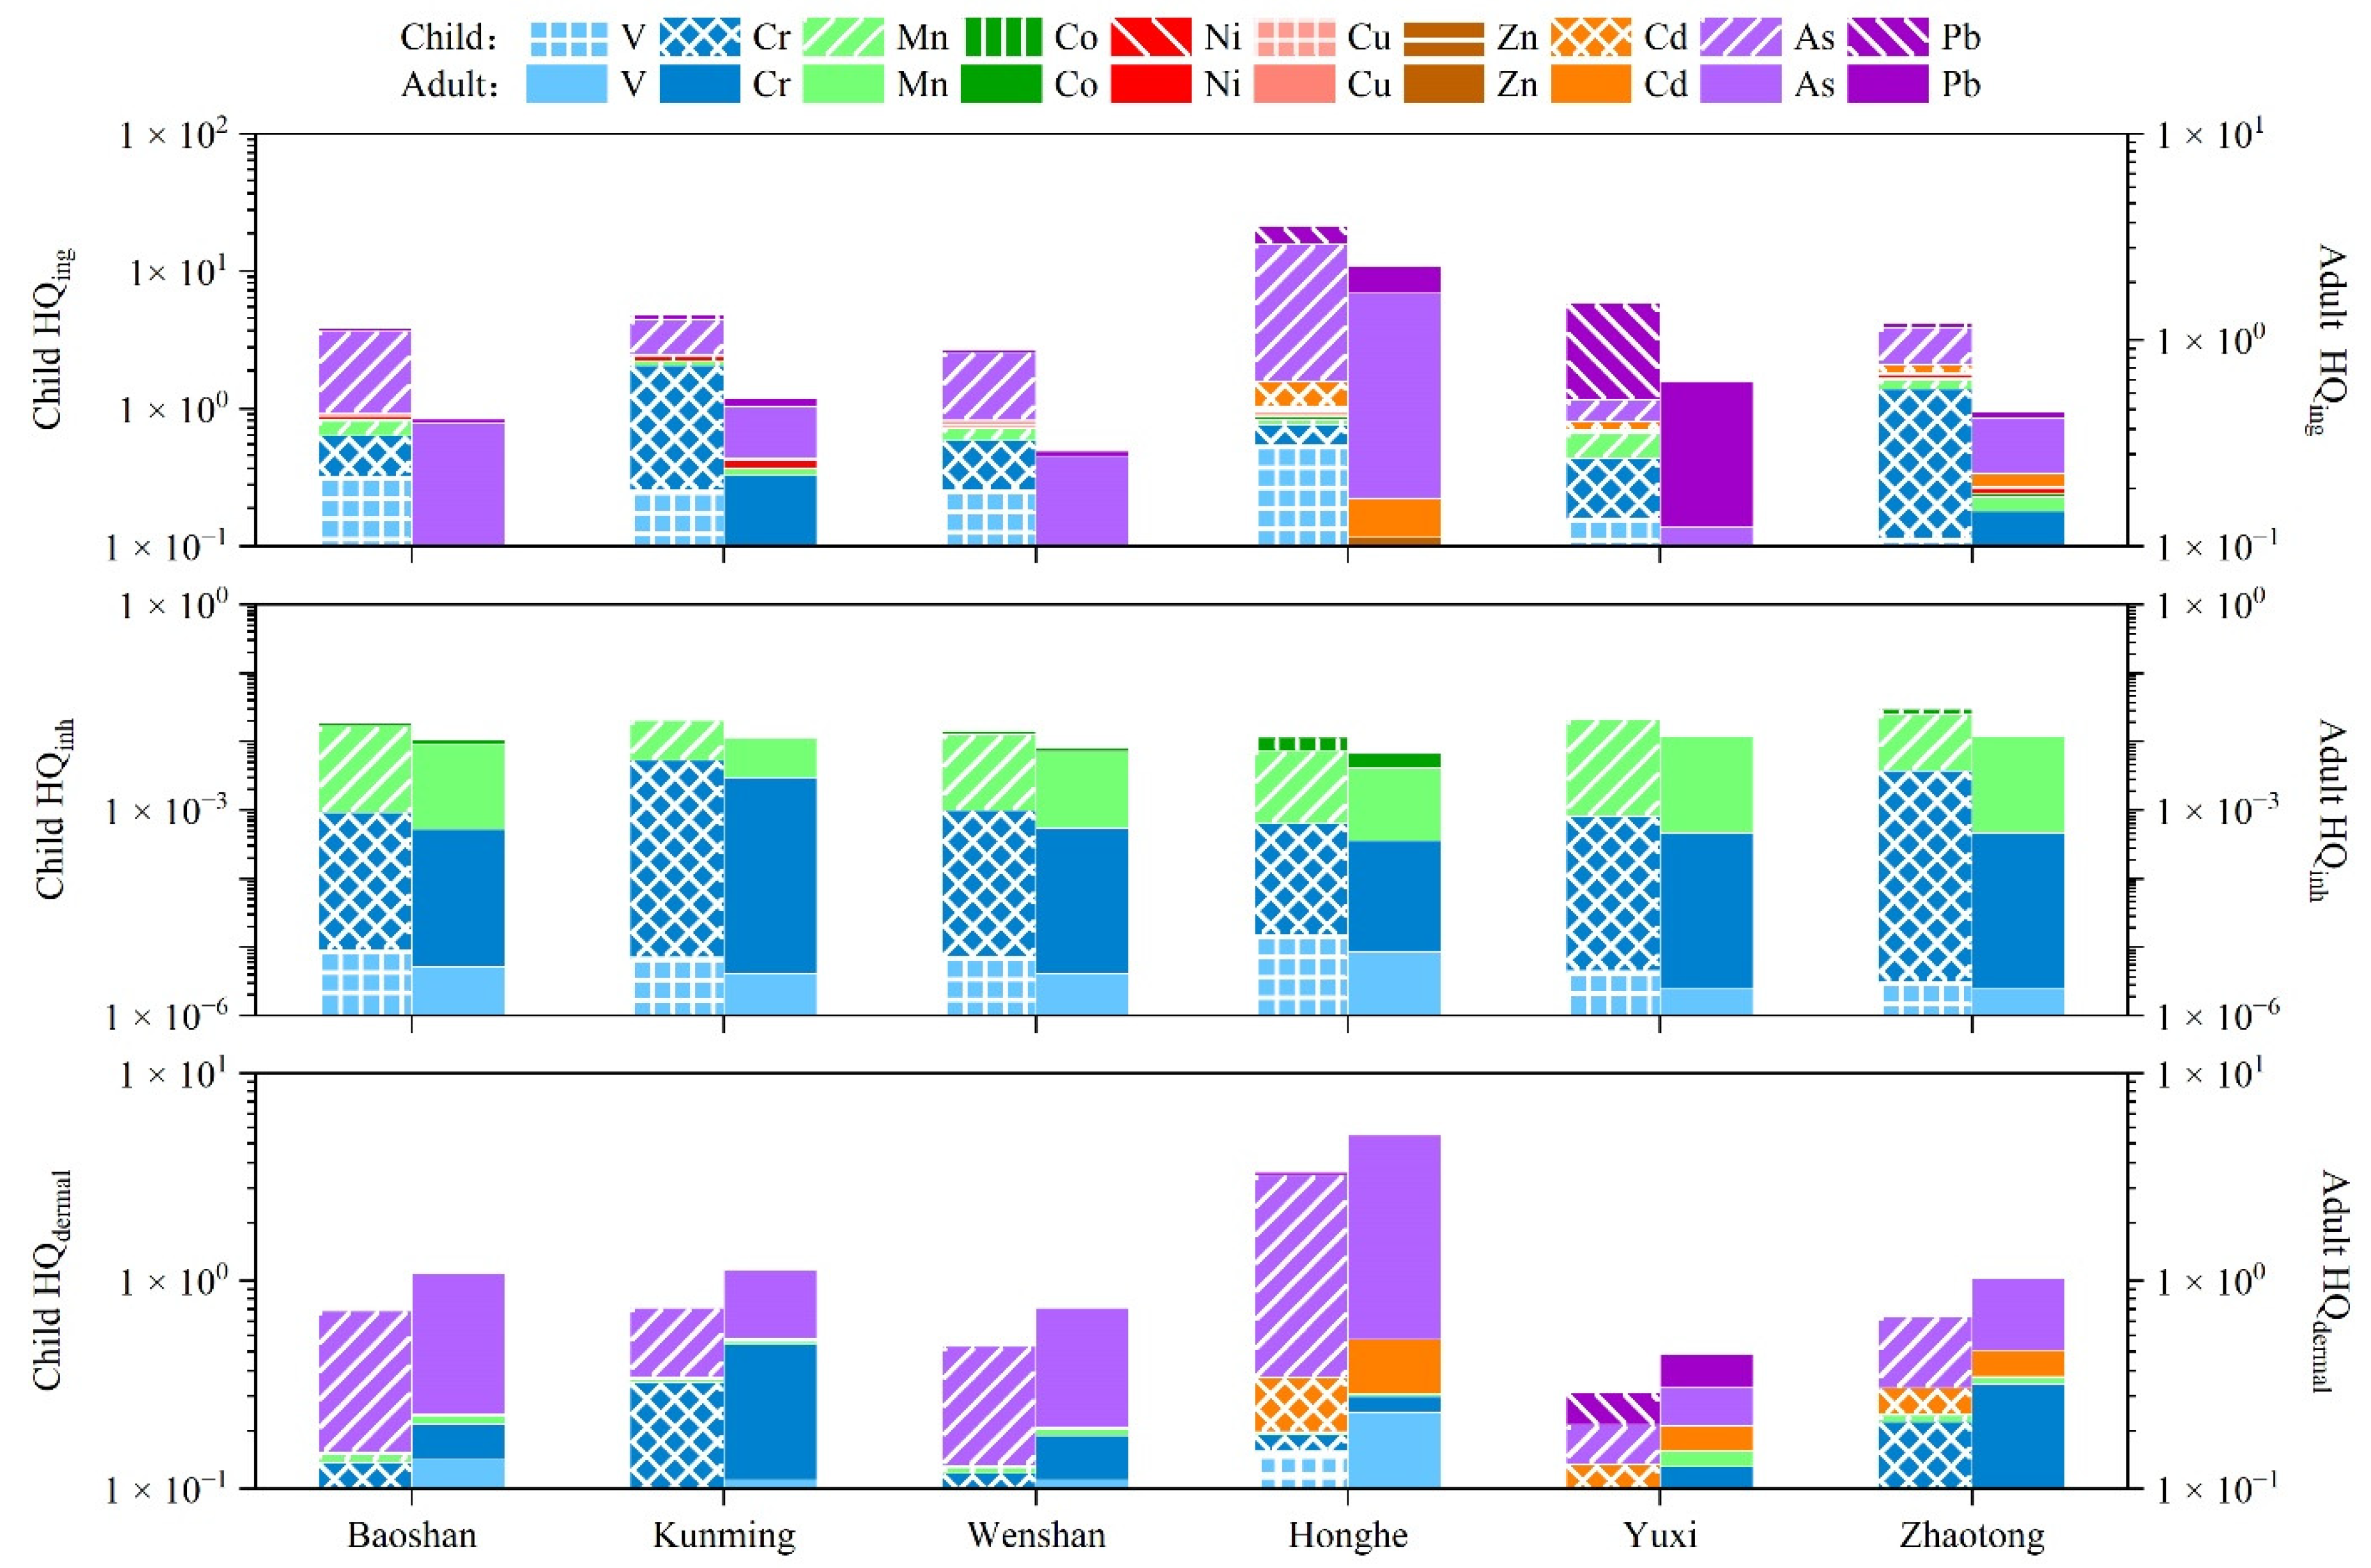
3.4. Health Risk Assessment

3.4.1. Non-Carcinogenic Health Risk Assessment

Non-carcinogenic health risk is shown in Figure 7. The non-carcinogenic routes of potentially toxic elements in PM2.5 of SFD for adults and children are as follows: ingestion > dermal contact > inhalation, which indicates that ingestion is the main exposure route of non-carcinogenic risk. A similar result was reported in a study carried out in Suzhou [39]. For potentially toxic elements in SFD, the non-carcinogenic risk of children through ingestion and inhalation routes in six cities was higher than that of adults, but the skin exposure route was the opposite.
The HIs for children were more than one in PM2.5 of SFD of all the six cities. Baoshan, Kunming, Wenshan, Yuxi, Honghe, and Zhaotong children were: 4.59 × 100, 5.61 × 100, 3.19 × 100, 2.47 × 101, 6.20 × 100, and 4.91 × 100, all of which were non-carcinogenic risk. As had a non-carcinogenic risk for children all the six cities, and the HI of As the highest in Honghe, with a value of 1.70 × 101. Kunming and Zhaotong had the non-carcinogenic risk of Cr for children, and Yuxi and Honghe had the non-carcinogenic risk of Pb. These potentially toxic elements mentioned above also had carcinogenic risks in the ingestion route, and As in Honghe also has non-carcinogenic risks in the dermal contact route. For adults, the HIs of 10 potentially toxic elements in Baoshan, Kunming, Wenshan, Honghe, Yuxi, and Zhaotong were: 1.44 × 100, 1.49 × 100, 9.71 × 10⁻¹, 7.16 × 100, 9.72 × 10⁻¹, and 1.34 × 100, respectively. Only Wenshan and Yuxi had no non-carcinogenic risk for adults. Among the 10 potentially toxic elements with non-carcinogenic risk for adults, for As in Baoshan and Honghe, its ingestion route also has a carcinogenic risk. The HIs of potentially toxic elements for children in Baoshan, Kunming, Wenshan, Honghe, Yuxi and, Zhaotong were 3.18, 3.77, 3.28, 3.45, 6.38, and 3.66 times that for adults. Combined with the above analysis, it can be found that children were more susceptible to potentially toxic elements in PM2.5 of SFD. At the same time, As had the highest non-carcinogenic risk through ingestion and dermal exposure.
The value of HQ in ten potentially toxic elements for six cities was different in various exposure pathways, but in general, adults and children showed higher non-carcinogenic risks of As, Cr, Pb, and V in the ingestion and dermal pathways. Mn, Cr, and Co were the major non-carcinogenic risk contributors to inhalation routes in adults and children, which are similar to those in Suzhou [39].

3.4.2. Carcinogenic Health Risk Assessment

The results of carcinogenic risk of potentially toxic elements are presented in Table 6. The CR of Cr in Kunming and Zhaotong exceeded the carcinogenic risk threshold (1 × 10⁻⁶), and there was a certain risk of cancer. The CR of potentially toxic elements in the remaining four cities was lower than 1 × 10⁻⁶, i.e., they were free of carcinogen. Among the five potentially toxic elements, Cr played a major carcinogenic role in PM2.5 of SFD in Baoshan, Kunming, Wenshan, Yuxi, and Zhaotong, accounting for 69.82–94.02%. However, As played a major carcinogenic role in Honghe, accounting for 61.99%, which may be related to local smelting activities. Therefore, Cr and As in PM2.5 of SFD posed a higher carcinogenic risk through inhalation, which should receive more attention.

4. Conclusions

Among the PM2.5 of SFD around Baoshan, Kunming, Wenshan, Honghe, Yuxi, and Zhaotong, only Mn and Ni in Honghe, V in Zhaotong, and V, Co, Ni, and As in Yuxi did not exceed the soil background values in Yunnan Province. Based on the correlation analysis and enrichment factor analysis, it is concluded that the PM2.5 of SFD around Kunming, Yuxi, and Honghe, which have relatively developed economies and industries, had higher levels of potentially toxic elements pollution than the other three cities and that the potentially toxic elements were generally affected by metal smelting activities. The potentially toxic elements in PM2.5 of SFD in Zhaotong were affected by coal-burning activities, while the potentially toxic elements in PM2.5 of SFD in Wenshan and Baoshan were less affected by human activity. The PM2.5 emissions of SFD around Baoshan, Kunming, Wenshan, Honghe, Yuxi, and Zhaotong were 183.51 t, 3335.00 t, 124.68 t, 2783.24 t, 726.42 t, and 552.63 t in 2018, respectively. Monthly distribution characteristics revealed that the total emission factor of PM2.5 of SFD reached the highest level from January to May and the lowest level from July to October. In terms of the health risks for potentially toxic elements in PM2.5 of SFD, there were non-carcinogenic risks (HI > 1) for children in all six cities and adults in Baoshan, Kunming, Honghe, and Zhaotong. Ingestion was the main way to cause non-carcinogenic risks. Potentially toxic elements with non-carcinogenic risk for children were As in six cities, Cr in Kunming and Zhaotong, and Pb in Yuxi and Honghe. At the same time, potentially toxic elements with non-carcinogenic risks for adults were As in Baoshan and Honghe. For carcinogenic risk in PM2.5 of SFD, the carcinogenic risk value of Cr in Kunming and Zhaotong was higher than 1 × 10⁻⁶, indicating a certain carcinogenic risk, and the remaining four cities had no carcinogenic risk. Therefore, the health risks for people from the potentially toxic elements in PM2.5 of SFD must be considered. We hope these findings have implications for the development of emission control policies regarding the potentially toxic elements in the atmospheric environment.

Supplementary Materials

The following supporting information can be downloaded at: https://www.mdpi.com/article/10.3390/atmos13050678/s1, Figure S1: Land use type in six cities in 2018; Figure S2: Spatial distribution of soil texture types; Figure S3: Daily temperature, wind speed, and rainfall data in 2018; Table S1: Soil erodibility index; Table S2: Expose parameters of potentially toxic elements; Table S3: Reference doses and slope factors of potentially toxic elements; Table S4: Proportion of soil texture in six cities; Table S5: Annual mean values of various meteorological parameters; Table S6: VCF for each month in 2018; Table S7: Atmospheric PM2.5 concentration for each month in 2018.

Author Contributions

Conceptualization, J.S. and X.H.; investigation, S.L., Y.B., J.W., P.Z. and F.X.; resources, J.S.; data curation, X.P.; writing—original draft preparation, X.P.; writing—review and editing, J.S., X.P. and Y.Z.; supervision, P.N. All authors have read and agreed to the published version of the manuscript.

Funding

This research was funded by the National Natural Science Foundation of China (No. 21966016), the National Key R&D Program of China (No. 2019YFC0214405), and the Science and Technology Special Project of Demonstration Zone for National Sustainable Development in Yunnan (No. 202104AC100001-A14).

Institutional Review Board Statement

Not applicable.

Informed Consent Statement

Not applicable.

Data Availability Statement

The data used in this paper can be provided by Jianwu Shi (Shijianwu@kust.edu.cn).

Conflicts of Interest

The authors declare that there are no competing financial interests that could inappropriately influence the contents of this manuscript.

References

  1. Contini, D.; Genga, A.; Cesari, D.; Siciliano, M.; Donateo, A.; Bove, M.; Guascito, M. Characterisation and source apportionment of PM10 in an urban background site in Lecce. Atmos. Res. 2010, 95, 40–54. [Google Scholar] [CrossRef]
  2. Owoade, K.O.; Hopke, P.K.; Olise, F.S.; Adewole, O.O.; Ogundele, L.T.; Fawole, O.G. Source apportionment analyses for fine (PM2.5) and coarse (PM2.5–10) mode particulate matter (PM) measured in an urban area in southwestern Nigeria. Atmos. Pollut. Res. 2016, 7, 843–857. [Google Scholar] [CrossRef]
  3. Arhami, M.; Hosseini, V.; Shahne, M.Z.; Bigdeli, M.; Lai, A.; Schauer, J.J. Seasonal trends, chemical speciation and source apportionment of fine PM in Tehran. Atmos. Environ. 2017, 153, 70–82. [Google Scholar] [CrossRef]
  4. Wang, Q.; Bi, X.H.; Wu, J.H.; Zhang, Y.; Feng, Y.C. Heavy metals in urban ambient PM10 and soil background in eight cities around China. Environ. Monit. Assess. 2013, 185, 1473–1482. [Google Scholar] [CrossRef] [PubMed]
  5. Wang, X.; Wen, H.; Shi, J.S.; Bi, J.R.; Huang, Z.W.; Zhang, B.D.; Zhou, T.; Fu, K.Q.; Chen, Q.L.; Xin, J.Y. Optical and microphysical properties of natural mineral dust and anthropogenic soil dust near dust source regions over northwestern China. Atmos. Chem. Phys. 2017, 18, 2119–2138. [Google Scholar] [CrossRef] [Green Version]
  6. Jiang, N.; Dong, Z.; Xu, Y.Q.; Yu, F.; Yin, S.S.; Zhang, R.Q.; Tang, X.Y. Characterization of PM10 and PM2.5 Source Profiles of Fugitive Dust in Zhengzhou, China. Aerosol Air Qual. Res. 2018, 18, 314–329. [Google Scholar] [CrossRef] [Green Version]
  7. Alves, D.D.; Riegel, R.P.; Klauck, C.R.; Ceratti, A.M.; Hansen, J.; Cansi, L.M.; Pozza, S.A.; Quevedo, D.M.; Osório, D.M.M. Source apportionment of metallic elements in urban atmospheric particulate matter and assessment of its water-soluble fraction toxicity. Environ. Sci. Pollut. Res. 2020, 27, 12202–12214. [Google Scholar] [CrossRef]
  8. Song, H.Q.; Zhang, K.S.; Piao, S.L.; Wan, S.Q. Spatial and temporal variations of spring dust emissions in northern China over the last 30 years. Atmos. Environ. 2016, 126, 117–127. [Google Scholar] [CrossRef]
  9. Li, T.K.; Bi, X.H.; Dai, Q.L.; Wu, J.H.; Zhang, Y.F.; Feng, Y.C. Optimized approach for developing soil fugitive dust emission inventory in ”2 + 26” Chinese cities. Environ. Pollut. 2021, 285, 117521. [Google Scholar] [CrossRef]
  10. Song, L.L.; Li, T.K.; Bi, X.H.; Wang, X.H.; Zhang, W.H.; Zhang, Y.F.; Wu, J.H.; Feng, Y.C. Construction and dynamic method of soil fugitive dust emission inventory with high spatial resolution in Beijing-Tianjin-Hebei Region. Res. Environ. Sci. 2021, 34, 1771–1781. (In Chinese) [Google Scholar]
  11. Woodruff, N.P.; Siddoway, F.H. A Wind Erosion Equation. Soil Sci. Soc. Am. J. 1965, 29, 602–608. [Google Scholar] [CrossRef]
  12. Panebianco, J.E.; Buschiazzo, D.E. Erosion predictions with the Wind Erosion Equation (WEQ) using different climatic factors. Land Degrad Dev. 2008, 19, 36–44. [Google Scholar] [CrossRef]
  13. Bao, A.M.; Yang, G.G.H.; Liu, H.H.L.; Liu, Y. Evaluation of wind erosion in Xinjiang based on grid method. Soil Sci. 2012, 177, 69–77. [Google Scholar]
  14. Mandakh, N.; Tsogtbaatar, J.; Dash, D.; Khudulmur, S. Spatial assessment of soil wind erosion using WEQ approach in Mongolia. J. Geogr. Sci. 2016, 26, 473–483. [Google Scholar] [CrossRef] [Green Version]
  15. Li, T.K.; Bi, X.H.; Dai, Q.L.; Liu, B.S.; Han, Y.; You, H.Y.; Wang, L.; Zhang, J.Y.; Cheng, Y.; Zhang, Y.C.; et al. Improving spatial resolution of soil fugitive dust emission inventory using RS-GIS technology: An application case in Tianjin, China. Atmos. Environ. 2018, 191, 46–54. [Google Scholar] [CrossRef]
  16. Cheng, X. Geochemical Behavior and Risk Analysis for Heavy Elements in Soil Profiles with Different Parent Material, Yunnan Province, China. Master’s Thesis, China University of Geosciences, Beijing, China, 2016. (In Chinese). [Google Scholar]
  17. Peng, M. Heavy Metals in Soil-Crop System from Typical High Geological Background Areas, Southwest China: Transfer Characteristics and Controlling Factors. Master’s Thesis, China University of Geosciences, Beijing, China, 2020. (In Chinese). [Google Scholar]
  18. Zhang, L.; McKinley, J.; Cooper, M.; Peng, M.; Wang, Q.L.; Song, Y.T.; Cheng, H.X. A regional soil and river sediment geochemical study in Baoshan area, Yunnan province, southwest China. J. Geochem. Explor. 2020, 217, 106557. [Google Scholar] [CrossRef]
  19. Wang, Q.L.; Song, Y.T.; Wang, C.W.; Xu, R.T.; Peng, M.; Zhou, Y.L.; Han, W. Source identification and spatial distribution of soil heavy metals in Western Yunnan. China Environ. Sci. 2021, 41, 3693–3703. (In Chinese) [Google Scholar]
  20. Wei, B.G.; Yang, L.S. A review of heavy metal contaminations in urban soils, urban road dusts and agricultural soils from China. Microchem. J. 2010, 94, 99–107. [Google Scholar] [CrossRef]
  21. Cesari, D.; Contini, D.; Genga, A.; Siciliano, M.; Elefante, C.; Baglivi, F.; Daniele, L. Analysis of raw soils and their re-suspended PM10 fractions: Characterisation of source profiles and enrichment factors. Appl. Geochem. 2012, 27, 1238–1246. [Google Scholar] [CrossRef]
  22. Ho, K.F.; Wu, K.C.; Niu, X.Y.; Wu, Y.F.; Zhu, C.S.; Wu, F.; Cao, J.J.; Shen, Z.X.; Hsiao, T.C.; Chuang, K.J.; et al. Contributions of local pollution emissions to particle bioreactivity in downwind cities in China during Asian dust periods. Environ. Pollut. 2019, 245, 675–683. [Google Scholar] [CrossRef]
  23. Pan, Y.P.; Tian, S.L.; Li, X.G.; Sun, Y.; Li, Y.; Wentworth, G.R.; Wang, Y.S. Trace elements in particulate matter from metropolitan regions of Northern China: Sources, concentrations and size distributions. Sci. Total Environ. 2015, 537, 9–22. [Google Scholar] [CrossRef] [PubMed]
  24. Han, Q.; Wang, M.S.; Cao, J.L.; Gui, C.L.; Liu, Y.P.; He, X.D.; He, Y.C.; Liu, Y. Health risk assessment and bioaccessibilities of heavy metals for children in soil and dust from urban parks and schools of Jiaozuo, China. Ecotox. Environ. Safe 2020, 191, 110157. [Google Scholar] [CrossRef] [PubMed]
  25. Smith, J.L.; Lee, K. Soil as a Source of Dust and Implications for Human Health. Adv. Agron. 2003, 80, 1–32. [Google Scholar]
  26. Kuo, C.Y.; Wong, R.H.; Lin, J.Y.; Lai, J.C.; Lee, H. Accumulation of chromium and nickel metals in lung tumors from lung cancer patients in Taiwan. J. Toxicol. Environ. Heal. A 2006, 69, 1337–1344. [Google Scholar] [CrossRef] [PubMed]
  27. Bai, K.J.; Ho, S.C.; Tsai, C.Y.; Chen, J.K.; Lee, C.N.; Lee, K.Y.; Chang, C.C.; Chen, T.T.; Feng, P.H.; Chen, K.Y.; et al. Exposure to PM2.5 is associated with malignant pleural effusion in lung cancer patients. Ecotox. Environ. Safe 2021, 208, 111618. [Google Scholar] [CrossRef]
  28. Peng, X.; Shi, G.; Liu, G.R.; Xu, J.; Tian, Y.Z.; Zhang, Y.F.; Feng, Y.C.; Russell, A.G. Source apportionment and heavy metal health risk (HMHR) quantification from sources in a southern city in China, using an ME2-HMHR model. Environ. Pollut. 2017, 221, 335–342. [Google Scholar] [CrossRef]
  29. Dong, S.H.; Xie, Y.; Huangpu, Y.Q.; Shi, X.R.; Yi, R.; Shi, G.L.; Feng, Y.C. Source apportionment and heath risk quantification of heavy metals in PM2.5 in Yangzhou, China. Environ. Sci. 2019, 40, 540–547. (In Chinese) [Google Scholar]
  30. Wu, Y.M.; Wang, Y.F.; Zhou, Y.J.; Jiao, L.J.; Tian, H.Z. An inventory of atmospheric wind erosion dust emissions of China, 1995~2015. China Environ. Sci. 2019, 39, 908–914. (In Chinese) [Google Scholar]
  31. Chow, J.C.; Watson, J.G.; Houck, J.E.; Pritchett, L.C.; Rogers, C.F.; Frazier, C.A.; Egami, R.T.; Ball, B.M. A laboratory resuspension chamber to measure fugitive dust size distributions and chemical compositions. Atmos. Environ. 1994, 28, 3463–3481. [Google Scholar] [CrossRef]
  32. Wang, H.B.; Qiao, B.Q.; Zhang, L.M.; Yang, F.M.; Jiang, X. Characteristics and sources of trace elements in PM2.5 in two megacities in Sichuan Basin of southwest China. Environ. Pollut. 2018, 242, 1557–1586. [Google Scholar] [CrossRef]
  33. Wang, X.F.; He, S.L.; Chen, S.C.; Zhang, Y.L.; Wang, A.L.; Luo, J.B.; Ye, X.L.; Wu, L.Z.; Xu, P.W.; Cai, G.F.; et al. Spatiotemporal Characteristics and Health Risk Assessment of Heavy Metals in PM2.5 in Zhejiang Province. Int. J. Environ. Res. Public Health 2018, 15, 583. [Google Scholar] [CrossRef] [PubMed] [Green Version]
  34. Yang, K.; Teng, M.F.; Luo, Y.; Zhou, X.L.; Zhang, M.; Sun, W.Z.; Li, Q.L. Human activities and the natural environment have induced changes in the PM2.5 concentrations in Yunnan Province, China, over the past 19 years. Environ. Pollut. 2020, 265, 114878. [Google Scholar] [CrossRef] [PubMed]
  35. Guo, W.; Zhang, Z.Y.; Zheng, N.J.; Luo, L.; Xiao, H.Y.; Xiao, H.W. Chemical characterization and source analysis of water-soluble inorganic ions in PM2.5 from a plateau city of Kunming at different seasons. Atmos. Res. 2020, 234, 104687. [Google Scholar] [CrossRef]
  36. CSP. Statistical Bureau of Yunnan Province. In Yunnan Statistical Yearbook; China Statistics Press: Beijing, China, 2019. [Google Scholar]
  37. Han, X.Y.; Li, S.; Li, Z.Z.; Pang, X.C.; Bao, Y.Z.; Shi, J.W.; Ning, P. Concentrations, source characteristics, and health risk assessment of toxic heavy metals in PM2.5 in a plateau city (Kunming) in Southwest China. Int. J. Environ. Res. Public Health 2021, 18, 11004. [Google Scholar] [CrossRef]
  38. Reimann, C.; Caritat, P.D. Intrinsic flaws of element enrichment factor (EFs) in environmental geochemistry. Environ. Sci. Technol. 2000, 34, 5084–5091. [Google Scholar] [CrossRef]
  39. Wu, F.Q.; Kong, S.F.; Yan, Q.; Wang, W.; Liu, H.B.; Wu, J.; Zheng, H.; Zheng, S.R.; Cheng, Y.; Niu, Z.Z.; et al. Sub-type source profiles of fine particles for fugitive dust and accumulative health risks of heavy metals: A case study in a fast-developing city of China. Environ. Sci. Pollut. Res. 2020, 27, 16554–16573. [Google Scholar] [CrossRef]
  40. China Environmental Monitoring Station. Background Values of Soil Elements in China; China Environmental Science Press: Beijing, China, 1990. [Google Scholar]
  41. Zhou, S.Z.; Yuan, Q.; Li, W.J.; Lu, Y.L.; Zhang, Y.M.; Wang, W.X. Trace metals in atmospheric fine particles in one industrial urban city: Spatial variations, sources, and health implications. J. Environ. Sci. 2014, 26, 205–213. [Google Scholar] [CrossRef]
  42. Li, B.B.; Huan, Y.H.; Bi, X.H.; Liu, L.Y.; Qin, J.P. Localization of soil wind erosion dust emission factor in Beijing. Environ. Sci. 2020, 41, 2609–2616. (In Chinese) [Google Scholar]
  43. Cowherd, C.; Axetell, K.; Guenther, C.M.; Jutze, G.A. Development of Emission Factors for Fugitive Dust Sources. Triangle Park, North Carolina: U. S. Environmental Protection Agency, 1974. Available online: https://nepis.epa.gov/Adobe/PDF/2000MC6B.PDF (accessed on 28 March 2022).
  44. Jia, K.; Yao, Y.J.; Wei, X.Q.; Gao, S.; Jiang, B.; Zhao, X. A review on fractional vegetation cover estimation using remote sensing. Adv. Earth. Sci. 2013, 28, 774–782. (In Chinese) [Google Scholar]
  45. EPA. Risk Assessment Guidance for Superfund Volume I: Human Health Evaluation Manual; EPA: Washington, DC, USA, 1989. [Google Scholar]
  46. Musa, A.A.; Hamza, S.M.; Kidak, R. Street dust heavy metal pollution implication on human health in Nicosia, North Cyprus. Environ. Sci. Pollut. Res. 2019, 26, 28993–29002. [Google Scholar] [CrossRef]
  47. Zheng, N.; Liu, J.S.; Wang, Q.C.; Liang, Z.Z. Heavy metals exposure of children from stairway and sidewalk dust in the smelting district, northeast of China. Atmos. Environ. 2010, 44, 3239–3245. [Google Scholar] [CrossRef]
  48. Ferreira-Baptista, L.; Miguel, E.D. Geochemistry and risk assessment of street dust in Luanda, Angola: A tropical urban environment. Atmos. Environ. 2005, 39, 4501–4512. [Google Scholar] [CrossRef] [Green Version]
  49. Liu, Y.X.; Li, S.S.; Sun, C.Y.; Qi, M.X.; Yu, X.; Zhao, W.J.; Li, X.X. Pollution level and health risk assessment of PM2.5-bound metals in baoding city before and after the heating period. Int. J. Environ. Res. Public Health 2018, 15, 2286. [Google Scholar] [CrossRef] [PubMed] [Green Version]
  50. Cao, J.J.; Chow, J.J.; Watson, J.G.; Wu, F.; Han, Y.M.; Jin, Z.D.; Shen, Z.X.; An, Z.S. Size-differentiated source profiles for fugitive dust in the Chinese Loess Plateau. Atmos. Environ. 2008, 42, 2261–2275. [Google Scholar] [CrossRef]
  51. Kong, S.F.; Ji, Y.Q.; Lu, B.; Zhao, X.Y.; Han, B.; Bai, Z.P. Similarities and differences in PM2.5, PM10 and TSP chemical profiles of fugitive dust sources in a coastal oilfield city in China. Aerosol Air Qual. Res. 2014, 14, 2017–2028. [Google Scholar] [CrossRef] [Green Version]
  52. Ho, K.F.; Lee, S.C.; Chow, J.C.; Watson, J.G. Characterization of PM10 and PM2.5 source profiles for fugitive dust in Hong Kong. Atmos. Environ. 2003, 37, 1023–1032. [Google Scholar] [CrossRef]
  53. Chow, J.C.; Watson, J.G.; Kuhns, H.; Etyemezian, V.; Lowenthal, D.H.; Crow, D.; Kohl, S.D.; Engelbrecht, J.P.; Green, M.C. Source profiles for industrial, mobile, and area sources in the Big Bend Regional aerosol visibility and observational study. Chemosphere 2004, 54, 185–208. [Google Scholar] [CrossRef]
  54. Watson, J.G.; Chow, J.C.; Houck, J.E. PM2.5 chemical source profiles for vehicle exhaust, vegetative burning, geological material, and coal burning in Northwestern Colorado during 1995. Chemosphere 2001, 43, 1141–1151. [Google Scholar] [CrossRef]
  55. Barcan, V. Nature and origin of multicomponent aerial emissions of the copper-nickel smelter complex. Environ. Int. 2003, 28, 451–456. [Google Scholar] [CrossRef]
  56. Zhang, J.L.; Qu, M.K.; Chen, J.; Yang, L.F.; Zhao, Y.C.; Huang, B. Meta-analysis of the effects of metal mining on soil heavy metal concentrations in Southwest China. Environ. Sci. 2021, 42, 4414–4421. (In Chinese) [Google Scholar]
  57. Long, Z.J.; Zhu, H.; Bing, H.J.; Tian, X.; Wang, Z.G.; Wang, X.F.; Wu, Y.H. Contamination, sources and health risk of heavy metals in soil and dust from different functional areas in an industrial city of Panzhihua City, Southwest China. J. Hazard. Mater. 2021, 420, 126638. [Google Scholar] [CrossRef] [PubMed]
  58. Wang, B.Q.; Li, Y.N.; Tang, Z.Z.; Cai, N.N.; Zhang, N.; Liu, J.F. The heavy metals in indoor and outdoor PM2.5 from coal-fired and non-coal-fired area. Urban Clim. 2021, 40, 101000. [Google Scholar] [CrossRef]
  59. Mitra, A.P.; Morawska, L.; Sharma, C.; Zhang, J. Chapter two: Methodologies for characterisation of combustion sources and for quantification of their emissions. Chemosphere 2002, 49, 903–922. [Google Scholar] [CrossRef]
  60. Su, Y.L. Discussion on ecological contral model of rocky desertification in Wenshan prefecture. For. Inventory. Plan. 2019, 44, 82–85. (In Chinese) [Google Scholar]
  61. Cheng, X.; Huang, Y.; Long, Z.J.; Ni, S.J.; Shi, Z.M.; Zhang, C.J. Characteristics, sources and health risk assessment of trace metals in PM10 in Panzhihua, China. Bull. Environ. Contam. Toxicol. 2017, 98, 76–83. [Google Scholar] [CrossRef]
  62. Harrison, R.M.; Jones, A.M.; Gietl, J.; Yin, J.X; Green, D.C. Estimation of the contribution of brake dust, tyre wear and eesuspension to non-exhaust traffic particles derived from atmospheric measurements. Environ. Sci. Tech. 2012, 46, 6523–6529. [Google Scholar] [CrossRef]
  63. Fiala, M.; Hwang, H. Influence of highway pavement on metals in road dust: A case study in Houston, Texas. Water Air Soil Pollut. 2021, 232, 185. [Google Scholar] [CrossRef]
  64. Han, Y.M.; Du, P.X.; Cao, J.J.; Posmentier, E.S. Multivariate analysis of heavy metal contamination in urban dusts of Xi’an, Central China. Sci. Total Environ. 2006, 355, 176–186. [Google Scholar]
  65. Sánchez de la Campa, A.M.; de la Rosa, J.D.; González-Castanedo, Y.; Fernández-Camacho, R.; Alastuey, A.; Querol, X.; Pio, C. high concentrations of heavy metals in PM from ceramic factories of Southern Spain. Atmos. Res. 2010, 96, 633–644. [Google Scholar] [CrossRef]
  66. Taiwo, A.M.; Harrison, R.M.; Shi, Z.B. A review of receptor modelling of industrially emitted particulate matter. Atmos. Environ. 2014, 97, 109–120. [Google Scholar] [CrossRef] [Green Version]
  67. Liu, J.W.; Chen, Y.J.; Chao, S.H.; Cao, H.B.; Zhang, A.C; Yang, Y. Emission control priority of PM2.5-bound heavy metals in different seasons: A comprehensive analysis from health risk perspective. Sci. Total Environ. 2018, 644, 20–30. [Google Scholar] [CrossRef] [PubMed]
  68. Miao, R.Q.; Yan, Y.F.; Bai, Y.; Deng, A. Assessment of heavy metal contamination of soil in Kunming City, China. Earth Environ 2015, 43, 536–539. (In Chinese) [Google Scholar]
  69. Chen, J.J.; Zhang, N.M.; Qing, L.; Chen, H.Y. Heavy metal pollution and pesticide residues in soils of Kunming area. J. Ecol. Rural Environ. 2004, 20, 37–40. (In Chinese) [Google Scholar]
  70. Wang, Y.T.; Guo, G.H.; Zhang, D.G.; Lei, M. An integrated method for source apportionment of heavy metal(loid)s in agricultural soils and model uncertainty analysis. Environ. Pollut. 2021, 276, 116666. [Google Scholar] [CrossRef]
  71. Apeagyei, E.; Bank, M.S.; Spengler, J.D. Distribution of heavy metals in road dust along an urban-rural gradient in Massachusetts. Atmos. Environ. 2011, 45, 2310–2323. [Google Scholar] [CrossRef]
  72. Lin, Y.C.; Li, Y.C.; Amesho, K.T.T.; Shangdiar, S.; Chou, F.F.; Cheng, P.C. Chemical characterization of PM2.5 emissions and atmospheric metallic element concentrations in PM2.5 emitted from mobile source gasoline-fueled vehicles. Sci. Total Environ. 2020, 739, 139942. [Google Scholar] [CrossRef]
  73. Guo, G.H.; Zhang, D.G.; Wang, Y.T. Source apportionment and source-specific health risk assessment of heavy metals in size-fractionated road dust from a typical mining and smelting area, Gejiu, China. Environ. Sci. Pollut. Res. 2021, 28, 9313–9326. [Google Scholar] [CrossRef]
  74. Sánchez-Rodas, D.; Sánchez de la Campa, A.M.; de la Rosa, J.D.; Oliveira, V.; Gómez-Ariza, J.L.; Querol, X.; Alastuey, A. Arsenic speciation of atmospheric particulate matter (PM10) in an industrialised urban site in southwestern Spain. Chemosphere 2007, 66, 1485–1493. [Google Scholar] [CrossRef]
  75. Xu, H.M.; Cao, J.J.; Ho, K.F.; Ding, H.; Han, Y.M.; Wang, G.H.; Chow, J.C.; Watson, J.G.; Khol, S.D.; Qiang, J.; et al. Lead concentrations in fine particulate matter after the phasing out of leaded gasoline in Xi’an, China. Atmos. Environ. 2012, 46, 217–224. [Google Scholar] [CrossRef]
  76. Zhang, K.; Chai, F.H.; Zheng, Z.L.; Yang, Q.; Zhong, X.C.; Fomba, K.W.; Zhou, G.Z. Size distribution and source of heavy metals in particulate matter on the lead and zinc smelting affected area. J. Environ. Sci. 2018, 71, 188–196. [Google Scholar] [CrossRef]
  77. Shao, X.; Cheng, H.G.; Li, Q.; Lin, C.Y. Anthropogenic atmospheric emissions of cadmium in China. Atmos. Environ. 2013, 79, 155–160. [Google Scholar] [CrossRef]
  78. Zhou, X.T.; Strezov, V.; Jiang, Y.J.; Yang, X.X.; Kan, T.; Evans, T. Contamination identification, source apportionment and health risk assessment of trace elements at different fractions of atmospheric particles at iron and steel making areas in China. PLoS ONE 2020, 15, e0230983. [Google Scholar] [CrossRef] [PubMed]
  79. Yuan, G.L.; Sun, T.H.; Han, P.; Li, J. Environmental geochemical mapping and multivariate geostatistical analysis of heavy metals in topsoils of a closed steel smelter: Capital Iron & Steel Factory, Beijing, China. J. Geochem. Explor. 2013, 130, 15–21. [Google Scholar]
  80. Duan, J.C.; Tan, J.H. Atmospheric heavy metals and arsenic in China: Situation, sources and control policies. Atmos. Environ. 2013, 74, 93–101. [Google Scholar] [CrossRef]
  81. Xie, J.J.; Yuan, C.G.; Xie, J.; Niu, X.D.; Zhang, X.R.; Zhang, K.G.; Xu, P.Y.; Ma, X.Y.; Lv, X.B. Comparison of arsenic fractions and health risks in PM2.5 before and after coal-gas replacement. Environ. Pollut. 2020, 259, 113881. [Google Scholar] [CrossRef] [PubMed]
  82. Shao, P.; Xin, J.Y.; Zhang, X.L.; Gong, C.S.; Ma, Y.J.; Wang, Y.S.; Wang, S.G.; Hu, B.; Ren, X.B.; Wang, B.Y. Aerosol optical properties and their impacts on the co–occurrence of surface ozone and particulate matter in Kunming City, on the Yunnan–Guizhou Plateau of China. Atmos. Res. 2022, 266, 105963. [Google Scholar] [CrossRef]
  83. Farsani, M.H.; Shirmardi, M.; Alavi, N.; Maleki, H.; Sorooshian, A.; Babaei, A.; Asgharnia, H.; Marzouni, B.M.; Goudarzi, G. Evaluation of the relationship between PM10 concentrations and heavy metals during normal and dusty days in Ahvaz, Iran. Aeolian Res. 2018, 33, 12–22. [Google Scholar] [CrossRef]
Figure 1. Locations and spatial distributions of the sampling sites for soil dust around the urban areas in six cities.
Atmosphere 13 00678 g001
Figure 2. Comparison of the contents of potentially toxic elements in PM2.5 of soil fugitive dust in different cities.
Atmosphere 13 00678 g002
Figure 3. Enrichment factor of ten potentially toxic elements in PM2.5 of soil fugitive dust.
Atmosphere 13 00678 g003
Figure 4. Pearson’s correlation coefficients of potentially toxic elements in PM2.5 of soil fugitive dust. (a) Baoshan; (b) Honghe; (c) Kunming; (d) Yuxi; (e) Wenshan; (f) Zhaotong. * Showed significant correlation at the 0.05 level; ** Showed significant correlation at the 0.01 level; *** Showed significant correlation at the 0.001 level.
Atmosphere 13 00678 g004
Figure 5. Spatial distributions of the emissions of PM2.5 in soil fugitive dust in 2018 on a 1 km grid cell.
Atmosphere 13 00678 g005
Figure 6. Monthly emission factor of PM2.5 of soil fugitive dust.
Atmosphere 13 00678 g006
Figure 7. Non-carcinogenic risk of potentially toxic elements in PM2.5 of soil fugitive dust.
Atmosphere 13 00678 g007
Table 1. Information on and descriptions of samples of soil fugitive dust around the urban areas in six cities.
CitySample Collection DateAmountSampling Site Type Description
BaoshanNovember 201612Wasteland, farmland, and orchard
KunmingMay 201412Wasteland, farmland, and orchard
WenshanOctober 201611Wasteland and farmland
HongheNovember 20179Bare land, wasteland, and farmland
YuxiMay 20158Wasteland and farmland
ZhaotongMay 201912Wasteland and farmland
Table 2. Potentially toxic elements’ contents in PM2.5 of soil fugitive dust (mean value ± standard deviation, mg/kg).
Potentially Toxic ElementsBaoshanKunmingWenshanHongheYuxiZhaotong
V255.02 ± 114.53188.44 ± 132.76232.62 ± 61.58420.17 ± 150.45148.42 ± 25.7885.42 ± 62.23
Cr113.93 ± 38.11602.30 ± 347.36128.65 ± 31.9284.03 ± 12.11113.71 ± 15.26461.97 ± 206.58
Mn931.92 ± 373.48790.44 ± 586.79762.45 ± 223.64336.13 ± 180.061057.54 ± 603.141050.38 ± 1011.89
Co43.43 ± 20.4325.26 ± 15.2135.84 ± 15.9884.03 ± 48.0912.98 ± 2.85135.16 ± 62.40
Ni85.30 ± 45.57395.27 ± 323.9276.51 ± 15.8250.82 ± 18.4612.63 ± 6.32206.10 ± 144.96
Cu186.23 ± 78.96201.79 ± 168.91244.83 ± 89.24252.10 ± 32.3473.34 ± 10.51173.84 ± 146.66
Zn304.54 ± 120.25220.31 ± 180.02288.08 ± 69.312596.64 ± 1223.51357.79 ± 188.40190.51 ± 93.35
As90.18 ± 47.4761.96 ± 41.2459.01 ± 30.01420.17 ± 213.6112.94 ± 3.5962.89 ± 33.41
Cd0.75 ± 0.362.08 ± 1.410.75 ± 0.2161.62 ± 20.9011.11 ± 7.5228.89 ± 22.73
Pb63.41 ± 23.69172.54 ± 60.0061.42 ± 11.812264.71 ± 709.711617.92 ± 1073.59121.31 ± 70.36
Table 3. Main calculation parameters and emissions of PM2.5 in soil fugitive dust.
CityVCFCIwe (t/hm2·a)As (km2)ESi (t/km2)WSi (t)
Baoshan0.20 ± 0.210.0044640.21 ± 340.2876750.0239 ± 0.0297183.51
Kunming0.42 ± 0.280.0403681.55 ± 329.7768540.4866 ± 0.43033335.00
Wenshan0.28 ± 0.210.0033294.80 ± 269.8010,4110.0120 ± 0.0163124.68
Honghe0.33 ± 0.270.0325744.22 ± 293.5179790.3488 ± 0.32302783.24
Yuxi0.31 ± 0.260.0208664.40 ± 326.0937000.1963 ± 0.1990726.42
Zhaotong0.24 ± 0.200.0091674.98 ± 341.8184990.0650 ± 0.0694552.63
All city0.29 ± 0.250.0144593.71 ± 356.0745,1180.1708 ± 0.28877705.49
Table 4. Pearson correlation coefficient (r) between the monthly emission factor of PM2.5 in soil fugitive dust and the monthly PM2.5 concentration of the atmospheric environment in six cities in 2018.
CityBaoshanKunmingWenshanHongheYuxiZhaotongAll City
r0.667 *0.787 **0.774 **0.825 **0.794 **0.913 **0.524 **
* Showed significant correlation at the 0.05 level. ** Showed significant correlation at the 0.01 level.
Table 5. Potentially toxic elements emissions in PM2.5 of soil fugitive dust in 2018 (kg).
CityVCrMnCoNiCuZnAsCdPbSum
Baoshan46.8020.91171.017.9715.6534.1755.8816.550.1411.64380.72
Kunming628.442008.672636.1284.231318.22672.98734.73206.646.94575.428872.39
Wenshan29.0016.0495.064.479.5430.5335.927.360.097.66235.67
Honghe1169.43233.89935.54233.89141.45701.667227.071169.43171.526303.2218,287.10
Yuxi107.8282.60768.229.439.1853.27259.909.408.071175.32483.19
Zhaotong47.21255.30580.4774.7113.996.07105.2834.7615.9767.041390.70
Table 6. Carcinogenic risk of potentially toxic elements in PM2.5 of soil fugitive dust.
CityCrCoNiAsCdCR
Baoshan3.08 × 10−72.97 × 10−85.18 × 10−99.81 × 10−83.31 × 10−104.42 × 10⁻⁷
Kunming1.77 × 10−61.75 × 10−82.59 × 10−86.83 × 10−89.61 × 10−101.88 × 10⁻⁶
Wenshan3.23 × 10−72.34 × 10−83.75 × 10−96.13 × 10−82.88 × 10−104.12 × 10⁻⁷
Honghe2.08 × 10−76.76 × 10−83.02 × 10−94.99 × 10−72.70 × 10−88.05 × 10⁻⁷
Yuxi2.72 × 10−77.72 × 10−97.72 × 10−101.23 × 10−85.62 × 10−92.99 × 10⁻⁷
Zhaotong1.25 × 10−68.60 × 10−81.25 × 10−86.36 × 10−81.36 × 10−81.43 × 10⁻⁶
Publisher’s Note: MDPI stays neutral with regard to jurisdictional claims in published maps and institutional affiliations.

