Article

Quantify the Spatial Association between the Distribution of Catering Business and Urban Spaces in London Using Catering POI Data and Image Segmentation

1
School of Design, Shanghai Jiao Tong University, Shanghai 200240, China
2
School of Architecture, Clemson University, Clemson, SC 29631, USA
3
Bartlett School of Architecture, University College London, 22 Gordon St, London WC1E 6BT, UK
4
Faculty of Forestry, University of British Columbia, Endowment Lands, Vancouver, BC V6T 1Z4, Canada
5
College of Landscape Architecture and Forestry, Qingdao Agriculture University, Qingdao 266109, China
*
Authors to whom correspondence should be addressed.
Atmosphere 2022, 13(12), 2128; https://doi.org/10.3390/atmos13122128
Submission received: 4 December 2022 / Revised: 14 December 2022 / Accepted: 15 December 2022 / Published: 19 December 2022

Abstract

:
The impacts of global climate change on food systems will be broad, complex, and profoundly affected by urban context. Food-related urbanism has been investigated for decades to explore how food access influences placemaking and urban forms. With global climate change, foodscapes within urban spaces are an important consideration in urban design and planning for food security and community health. The distribution of catering businesses (restaurants and cafés), one critical method of access to food, is highly associated with urban spaces because of their high impact on diet patterns, human physical activities, travel behaviors, and the use of public spaces. This research explores the spatial associations that exist between the distribution of catering businesses and the design and planning of urban spaces in London. This quantitative research includes three parts: (1) uses Open Street Map data and the GIS spatial analysis method to study the distribution of catering businesses; (2) uses the imagery segmentation method in machine learning to categorize urban spaces into open, landscape, and conflict spaces; and (3) establishes the association between the distribution of catering businesses and the categories of urban spaces through Spearman’s correlation and a linear regression model. The results indicate that the spatial distributions of catering businesses are highly correlated with urban spaces. Conflict and landscape spaces have a significant positive influence on the distribution of catering businesses, while open space has a significant negative influence. Based on the context of global climate change, this research contributes a quantitative urban design and planning approach to promote access to food increase food options and advocate active lifestyles.

1. Introduction

1.1. Food-Related Urbanism

Food-related urbanism has been investigated for decades to explore how food distribution influences placemaking and urban forms. The food system accounts for one-third of global anthropogenic greenhouse gas (GHG) emissions, with 9800–16,900 megatons of carbon dioxide equivalent (MtCO2e) being released. [1] Food plays a critical role in urbanism, as evidenced by the interconnected and worsening global issues of inequality and climate change [2]. A cross-disciplinary effort in urban design, planning, geography, sociology, and others has been seeking substantial urban forms to promote access to food, an active lifestyle, and healthy diets. The term foodscapes in urban design refers to the spatial form in which the production, transportation, consumption, and recycling of food are conducted as the main functions. It influences the classification of the urban space and the socioeconomics of the city [3]. Foodscapes are where food places, public life, and urban spaces converge, including restaurants, cafes, markets, shops, community gardens, etc. [2]. Foodscapes have an impact on social activities and human behaviors in big cities. Hanser’s idea [4] shows that “good food” in the city is to embrace health, environment, economy, cultural diversity, creativity, community building, local identity, and visions of vibrant, shared public spaces.
The restaurant and food industry (catering businesses) are vital components of the neighborhood environment for food access. The gastronomic experience of a restaurant or cafe is more than satisfying the need to eat; it also conveys a sense of place and place identity [5]. Frank et al. [6] identified grocery stores, restaurants, cafés, and general shops as having the highest weight in the Walk Score algorithm. Among all food places, Ewing and Handy [7] indicated that outdoor dining places are highly associated with walkability in the neighborhood, individual food choice, and food intake through the concept of food access.
London’s restaurants, cafés, markets, and street food are the signature and identity of its vibrant, diverse communities [8]. The food culture of London is determined by its ethnic diversity. In addition to traditional British cuisine, London has a worldwide restaurant scene that caters to multicultural communities. As a world-renowned tourist destination, London attracts many visitors from all over the world every year. However, the catering business has significantly dropped due to the economic shock and decreased tourism during the COVID-19 pandemic. Food insecurity has been prevalent during the COVID-19 pandemic due to the increase in unemployment and the closure of food production facilities [9]. The closing of restaurants and takeaways has worsened the food situation. The study of catering-related urban spaces informs related disciplines to rebuild community identities and increase food access through the design of food places.

1.2. Spatial Distribution—Point Pattern Analysis

Previous research has used spatial distribution and pattern analysis to identify and measure urban public areas. Points of interest (POI) are the locations where people gather and conduct daily activities [10]. Understanding the POI arrangements of various urban zones (e.g., administrative districts, neighborhoods, commercial areas, planning areas, metro station areas, and so on) is helpful for urban planners, investors, advertisers, and residents. Urban planners may assess regions’ functionality, vitality, and advancements by analyzing their POI arrangements [11]. The walking buffer concept is a spatial buffering technique used to analyze the spatial layout of urban spaces by breaking them down into small units [6]. A 1 km network buffer has been used to collect built environment data and calculate the walkability index [12]. The 400, 800, and 1600 m buffer sizes are also frequently used to study walkability in the context of the 5, 10, or 20 min city or neighborhood unit [6,13]. The distribution of catering POI and buffer zones can represent the food situation and be visualized on a map through a geographic information system (GIS).

1.3. Classification and Quantification of Urban Space

Urban space refers to the built environment of spaces in the urban context. Researchers use various landscape metrics to analyze and classify urban space through landscape patterns. Swanwick et al. [14] classified the external urban environment into green space and grey space. Green space includes parks, gardens, natural and semi-natural green spaces, allotments, community and city farms, green corridors, and amenity greens. Grey space contains functional grey spaces and civic spaces. Open space is the term for fields and forests that are purposefully kept undeveloped while the land around them is turned into houses and roads [15]. Based on the function of land use, open spaces are classified into two major categories: providing recreation and other services to society and conserving natural values [16]. This study combined urban green and grey space with civic functions into urban open space. Urban green space is characterized as a plot of land covered with vegetation in an urban environment. It varies in size, plant species, amenities, and services [17], including parks, forests, green roofs, streams, and community gardens. Urban blue space refers to all significant static or moving surface water bodies in metropolitan environments. Due to their historical geopolitical significance, substantial blue spaces naturally exist as essential components of the landscape of many towns [18].
Recently, Shen et al. categorized urban spaces into three types: open, landscape, and conflict, based on the urban potential patch from landscape ecology [19]. A patch is a spatial unit that differs in appearance and character from its surroundings and has a certain internal homogeneity. The open patch refers to urban public space as an area where people participate in social interaction and daily life activities [17]. This type carries citizens’ commuting and essential leisure functions, including corner squares, crossroads, extra roadways, extended spaces, etc. The landscape patch relates to urban green space. Parks, gardens, natural and semi-natural green areas, green corridors, amenity greens, community gardens, and city farms are examples of greenery in cities [6]. This patch includes open-access grass, space along border trees, small and isolated parks, etc. The conflict patch regards the grey space between the developed and the to-be-developed land in the urban space, or the excessive gray zone between the public and private spaces, which has a robust and usable value, including roof, indoor to outdoor, in the corner, understructure, etc.

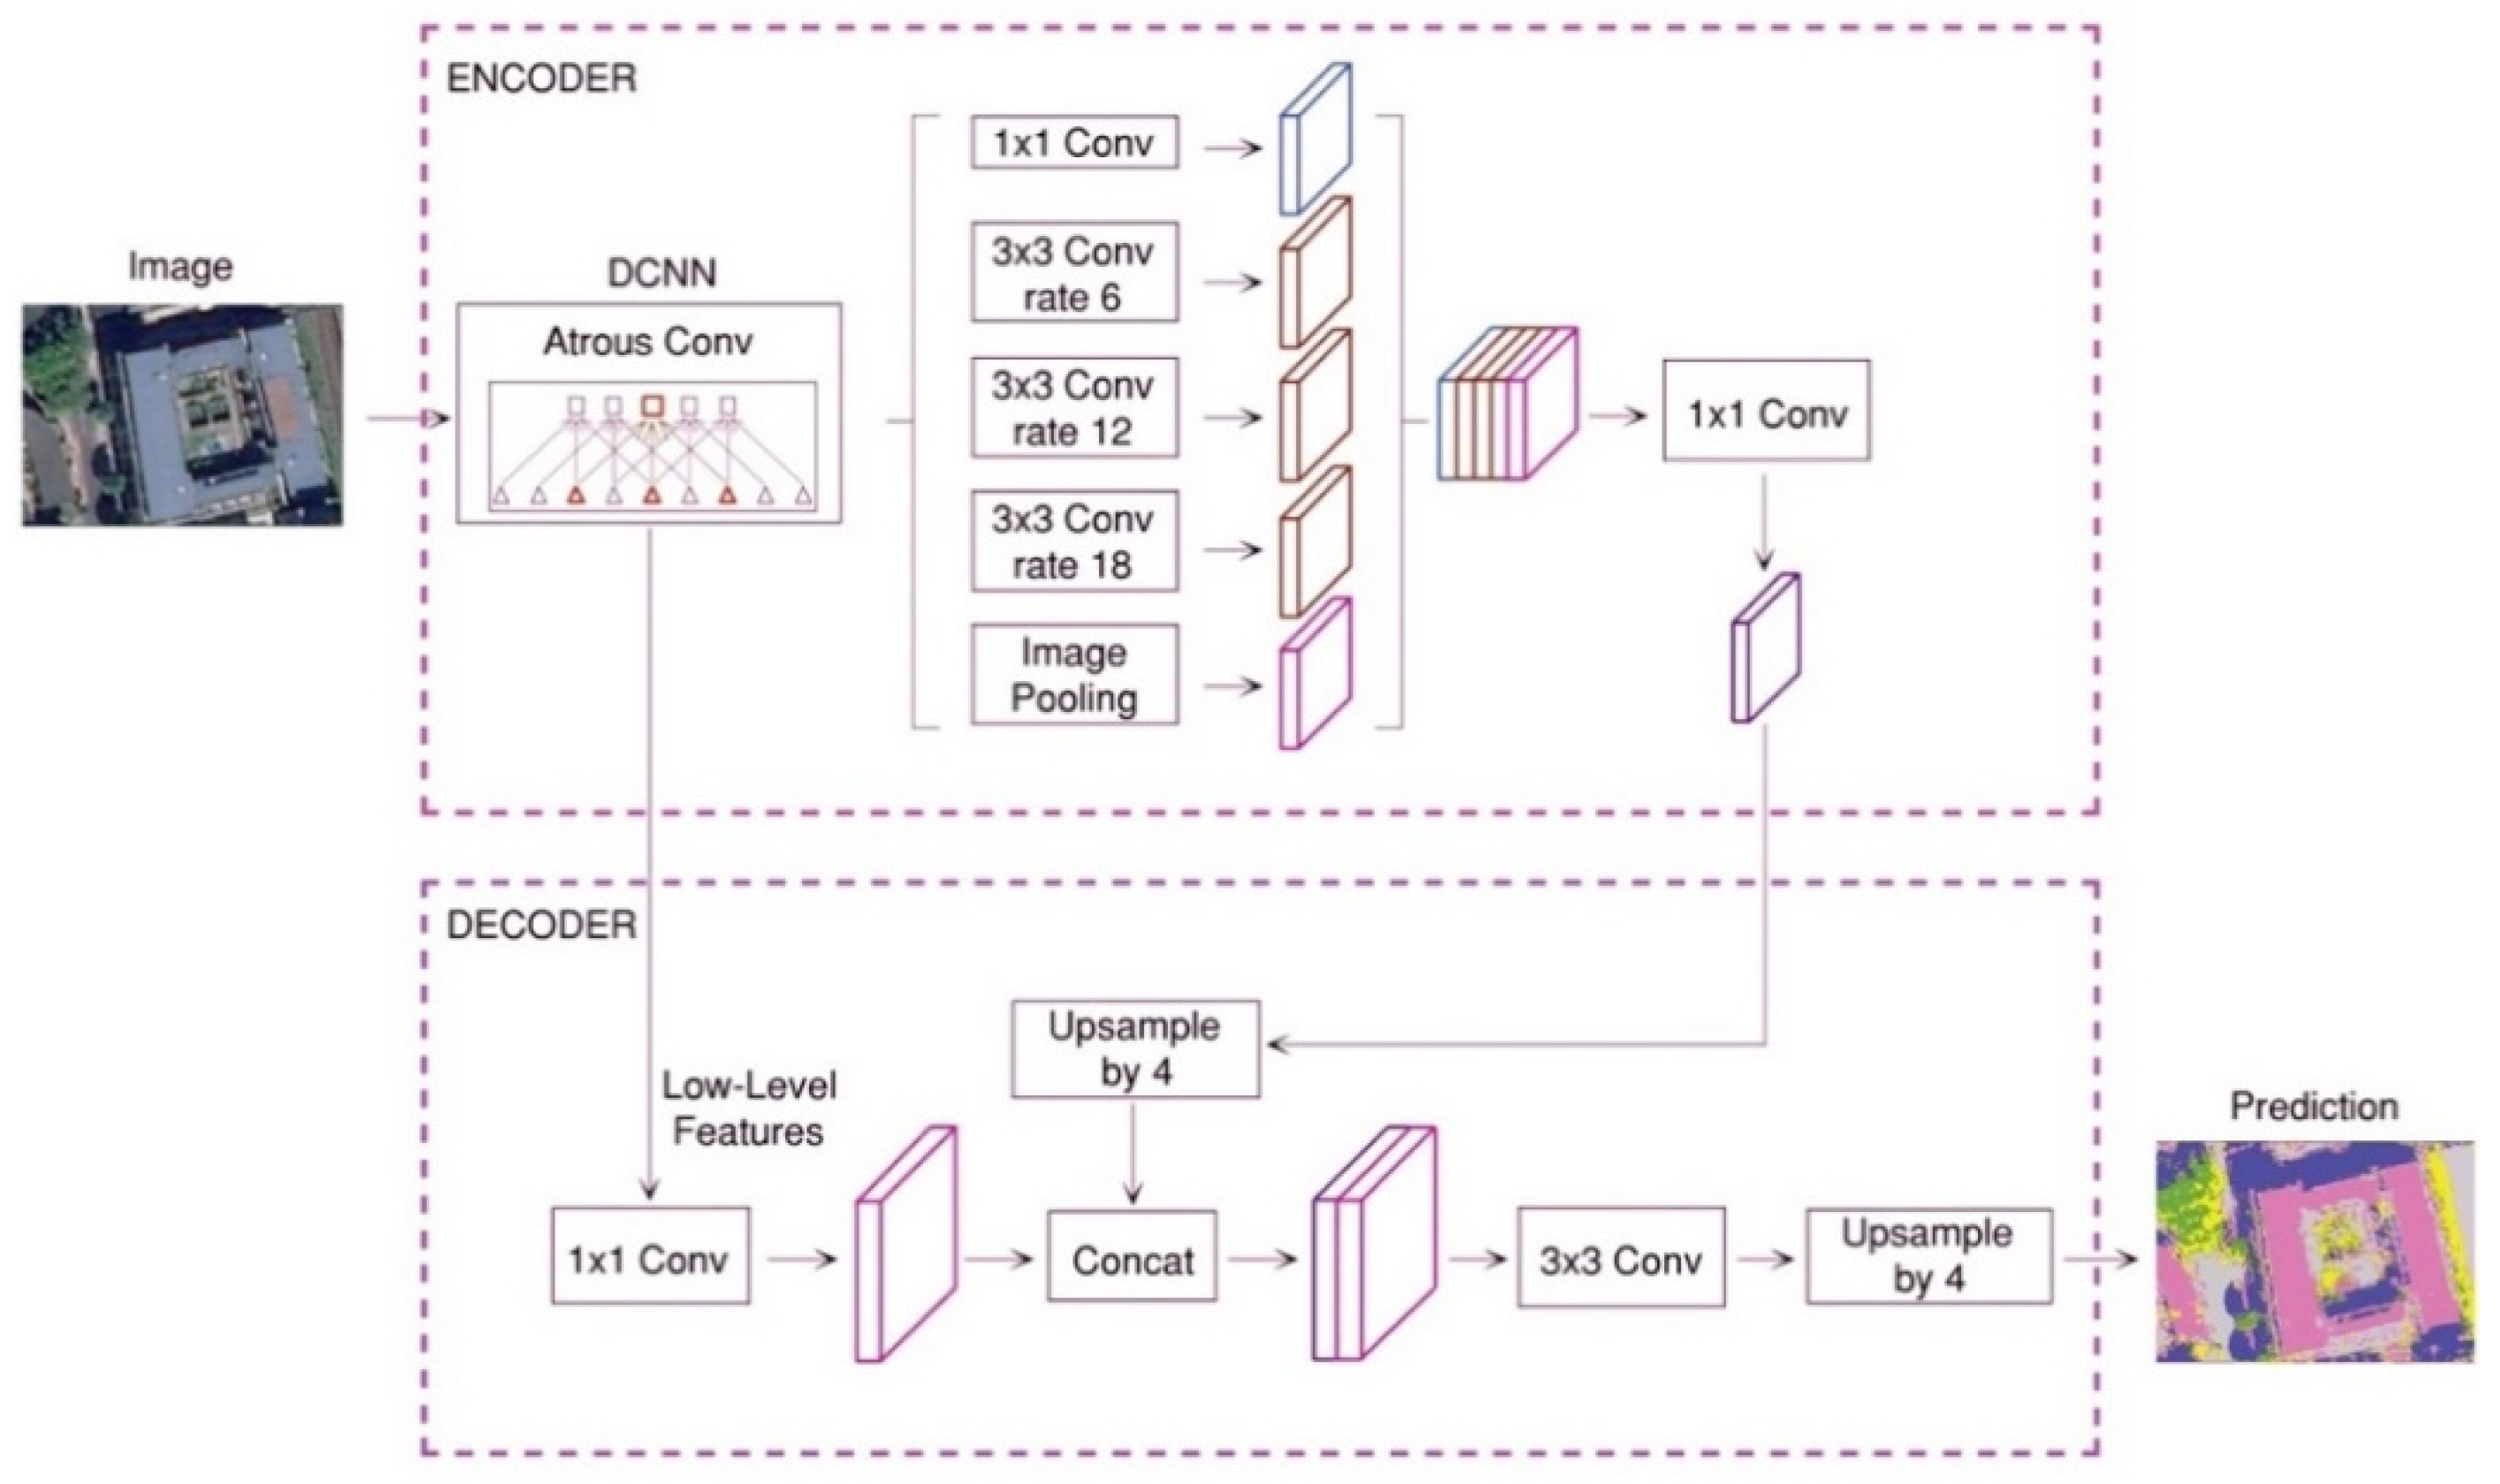
1.4. The Application of Machine Learning Methods in Urban Analytics

In recent years, with the development of machine learning [20], point cloud [21], and UAV technology [22], research into the analysis and visualization of urban analytics in computer vision [23] techniques has begun to emerge. Imagery and videos have proven valuable in conjunction with other data sources, such as social media [24]. Unmanned aerial vehicles (UAVs) mapping people’s behavior in parks through drone imagery demonstrated that drone images could offer quantitative and qualitative data for behavior maps [25]. Deep neural network methods can potentially be used to understand human behaviors [26]. From the study of 250 papers about Google Street View applications in urban research [27], the segmentation in GSV is widely used in spatial data infrastructure, health and well-being, urban perception, transportation and mobility, greenery, walkability, urban morphology, real estate, socio-economics, etc. According to this research, we can conclude that the machine learning method is being used extensively and is being iteratively updated for many areas of urban research. Unfortunately, under the theme of foodscapes and the city, only a few scholars have applied the relevant techniques for integration and in-depth analysis, especially at the level of urban space.

1.5. The Derived Relationship between Catering and Urban Space

The relationship between catering and urban space is derived from the place-making model, which was proposed by many urban design theorists such as Canter, Lynch, Jacobs, and others and is widely used in urban design [28,29,30]. Place-making refers to designing a place beyond the space itself, considering the activities and events. A place should be a convergence of activity, physical attributes, and conceptions. Montgomery [31] introduced this model to the United Kingdom in 1995. This model ties the availability of catering places, such as restaurants, cafes, theaters, pubs, and other cultural and meeting places, to the availability of spaces, such as blocks, street-front stores, plazas, gardens, and other urban spaces to enable such activities [31]. Bianchini [32] points out that the streets, squares, and paved spaces are encouraged to be used by pubs, cafes, and restaurants to promote activities. These activities also provide natural surveillance to increase the safety of these places. Compared with large open urban spaces, Jacobs [33] emphasizes the fine-grained small blocks of buildings that would encourage small businesses such as catering. Montgomery [31] underscored the importance of an appropriate level of ground coverage for urbanity, where too low a density cannot create vitality, whereas too high a density would standardize buildings and constrain layouts. Montgomery [31] contends that high and medium densities should favor restaurants, cafes, and shops, as well as the neighborhoods in which they are located. However, what is the appropriate level of ground coverage for urbanity and how high should the density be to promote the catering business?
Based on the place-making model and its interpretations and the classification of urban space, the “open patch” (urban public space), where people participate in social interaction and daily life activities, would be positively related to the distribution of catering. The “conflict patch” (understructured gray space) would be negatively related to the distribution of catering due to its low density and large open spaces, which are the opposite of fine-grained principles in the place-making model. The “landscape patch” would be slightly positively related to the distribution of catering because parks, gardens, and natural green space could serve as cultural and meeting places such as outdoor dining. However, the low density of the landscape patch means that it is less positive than the open patch.

1.6. Research, Objective, Question, and Significance

The purpose of this study is to investigate the relationship between the distribution of catering businesses (restaurants and cafés) and the types of urban spaces. This research answers two questions:
  • How do the three types of urban space (open, landscape, and conflict) relate to catering distribution?
  • What is the proportion of each type of urban space associated with catering distribution?
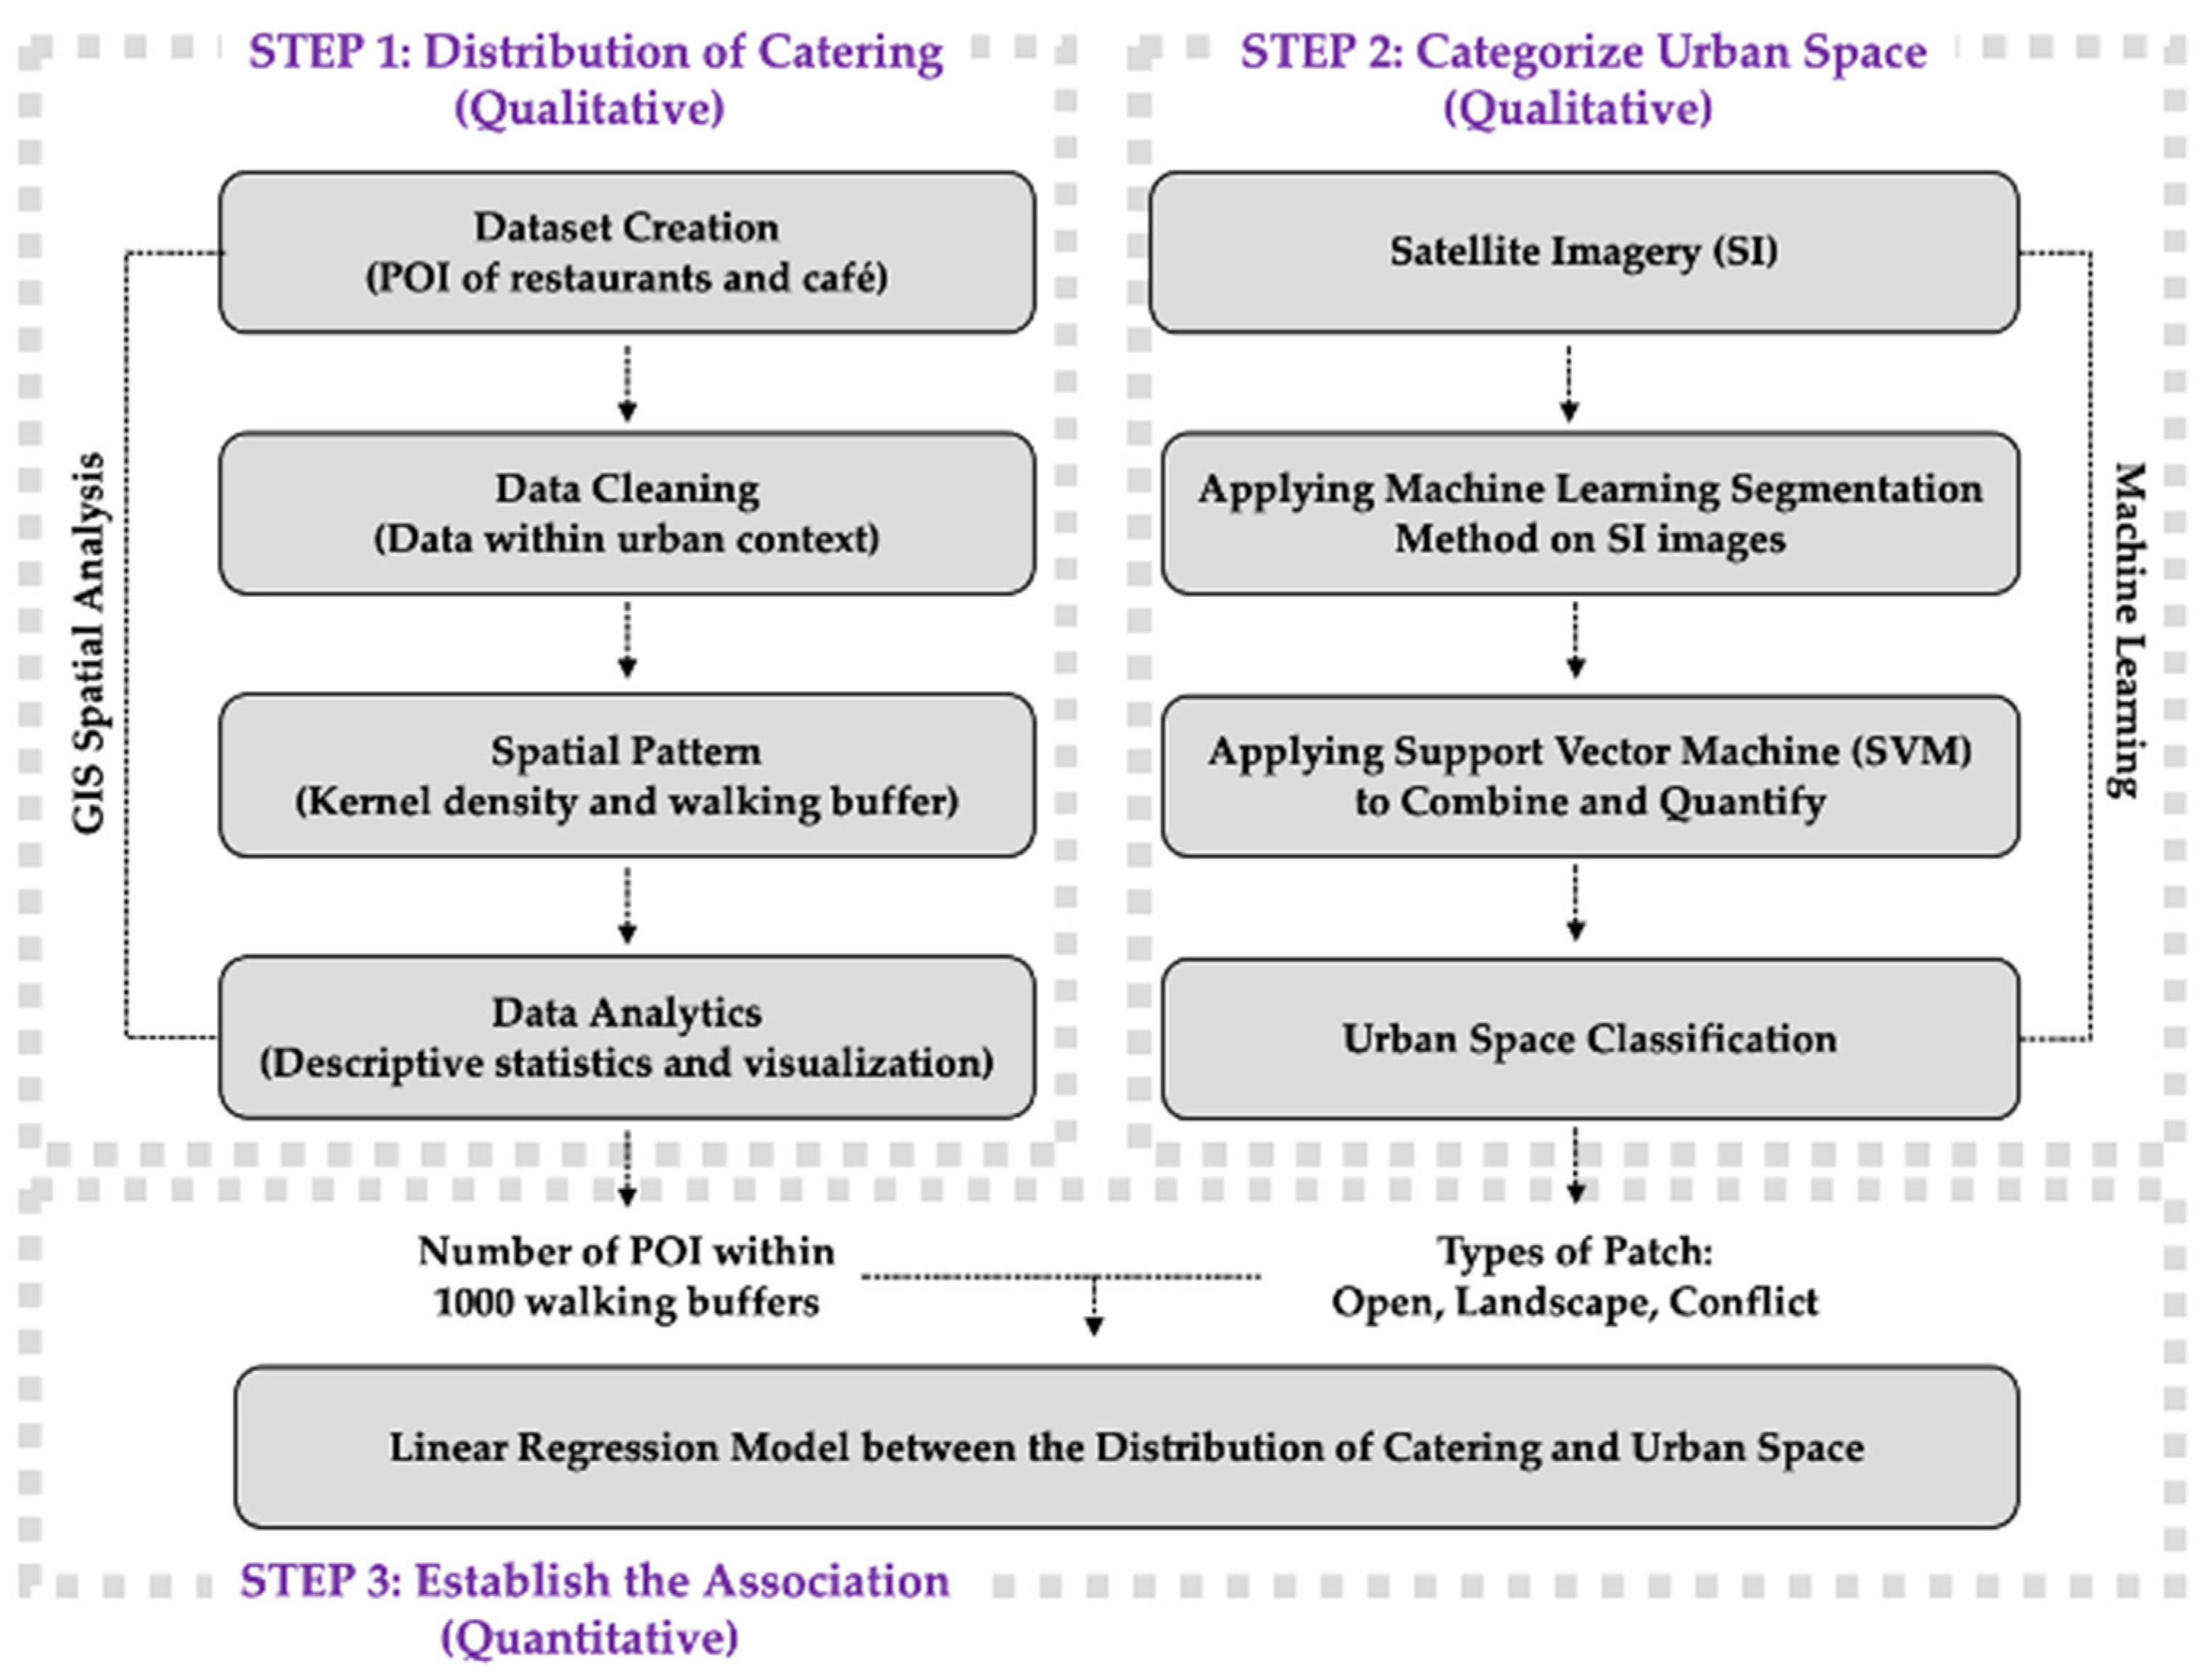
This study uses data statistics and mathematical modeling to explore and quantify the association between types of urban space and catering distribution. The proportion of the types of urban space that can be used to decide the “appropriate level” of ground cover to develop food-led cities and communities. This research reveals a quantitative urban foodscape planning approach to conducting spatial analysis using data at the city scale.
Urban potential patches provide the spatial basis for the planning and design of food corridors. Food and urban space influence the city’s planning and development. The results of this research can help urban planners, researchers, and policymakers rethink urban space and the built environment from a food-oriented perspective. The results and findings provide suggestions and implications for designing foodscapes in urban spaces. Designing urban forms for restaurants and cafés not only provides geographic access to food but also encourages public life and builds a place’s identity [34,35]. The appropriate design of urban forms for catering places would increase food choices, improve general health, and reduce vehicle emissions by promoting walking activities [36,37,38].

2. Research Methods

2.1. Study Area

This study investigates Inner London as the research area and collects catering POI data and urban analytics based on these 12 boroughs. The basic spatial unit in London in the borough is the local government district. Inner London (delineated in the London Government Act 1963) includes the boroughs: of Camden, Hackney, Hammersmith and Fulham, Haringey, Islington, Kensington and Chelsea, Lambeth, Lewisham, Newham, Southwark, Tower Hamlets, and Wandsworth.

2.2. Research Process

This mixed-method quantitative research includes three parts: (1) uses Open Street Map data and the GIS spatial analysis method to study the distribution of catering businesses; (2) uses the imagery segmentation method in machine learning to categorize urban spaces into open, landscape, and conflict spaces; and (3) establishes the association between the distribution of catering businesses and the categories of urban spaces through Spearman’s correlation and a linear regression model.
As shown in Figure 1, the research flow of this study will be divided into three sections: qualitative spatial analysis, qualitative machine learning, and quantitative statistical analysis. The first step is to examine the spatial distribution of catering businesses. This research explores Inner London as a research area and generates a base map according to the boroughs. The catering POI data, including restaurant and café locations, are collected from the OSM and explicitly displayed on the map, including the names, locations, and types of catering in Inner London boroughs. Then, ArcGIS-based kernel density analysis is used to calculate the density of catering POIs in the surrounding neighborhood. Then, a “food hub buffer” (a 1000 m buffer, representing a 10 min walking radius) is created as the unit of analysis. Then, the density calculation method will be used to find the high-density food hub according to the POI distribution. The second step uses the satellite image segmentation method to redefine urban space and establish a principle of urban space classification. The segmentation result and restaurant points can be combined for analytics by creating a 50 × 50 m fishnet based on the food hub buffers. The third section will investigate the correlation and the linear regression model to explore the relationship between catering POIs and urban space according to the data statistics and mathematical modeling.

3. Result and Discussion

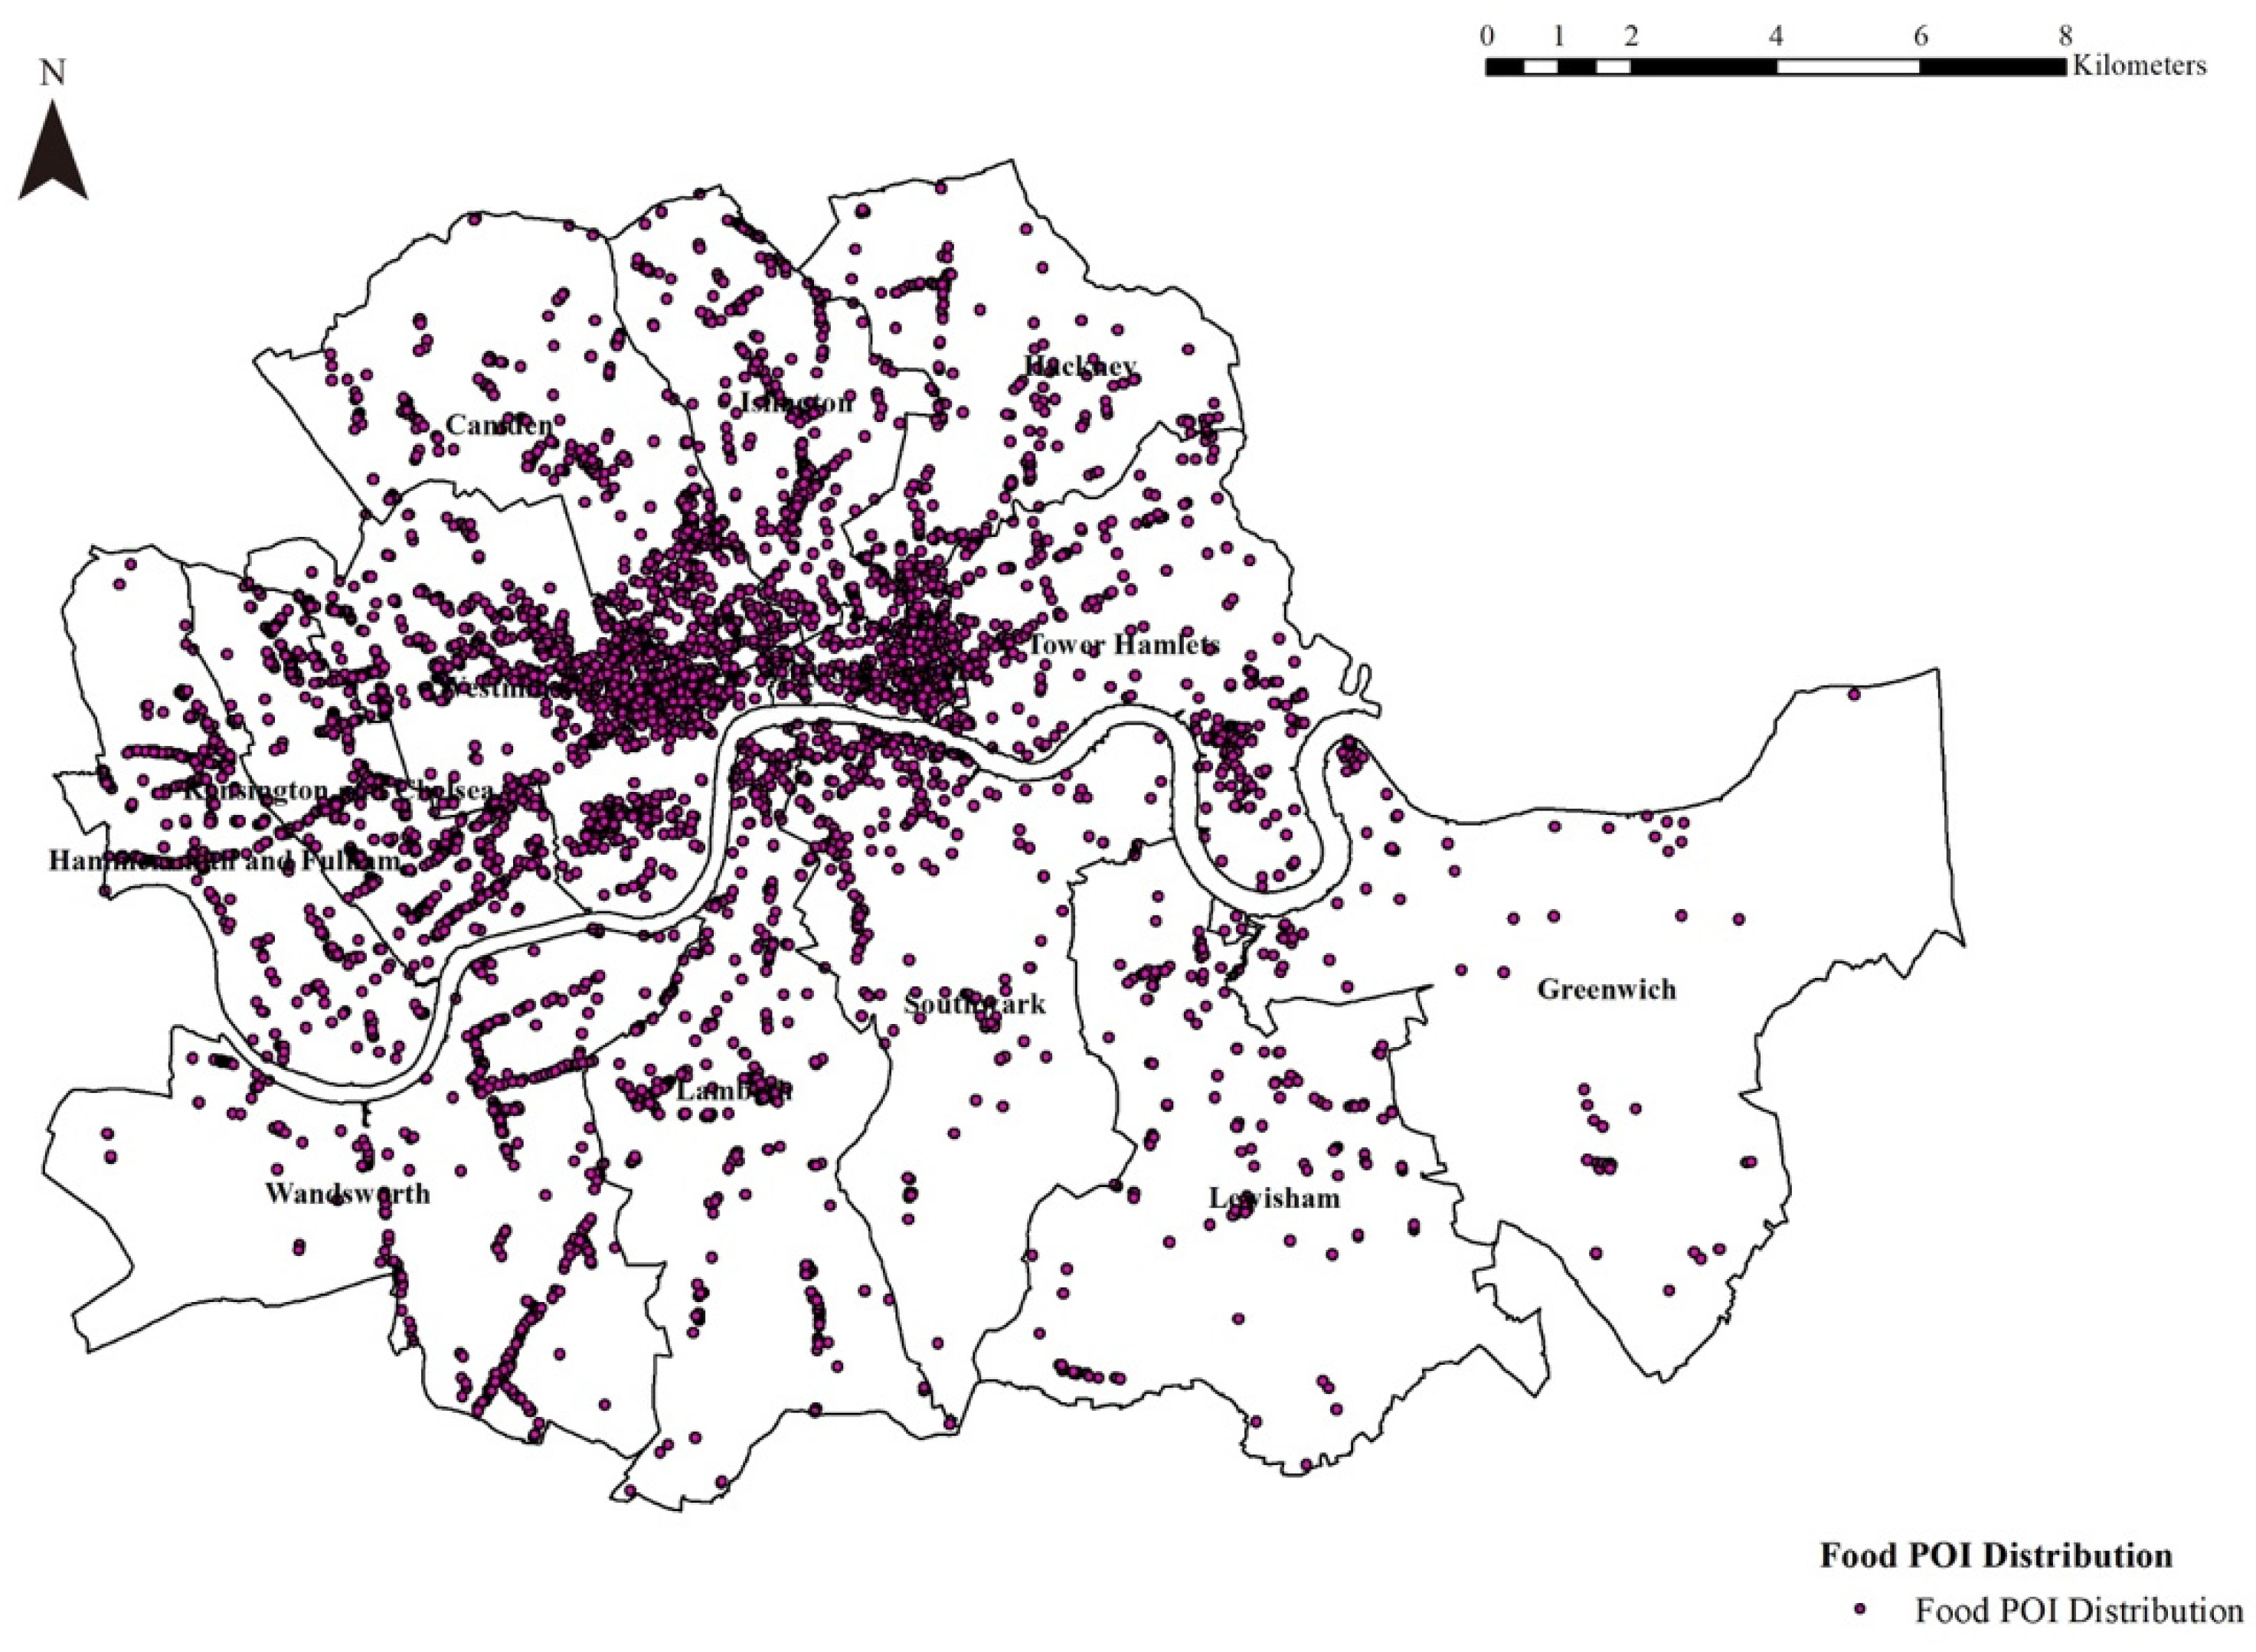
3.1. Spatial Distribution of the Catering Business

3.1.1. Dataset Creation and Cleaning–Distribution of Catering POI

The data set of catering POIs is derived from the Open Street Map (OSM) platform and manually cleaned up in ArcGIS. OSM has been widely used as a data source for big data projects, providing multi-vector data, including POIs, street networks, land use, etc. [27,39]. The POI in OSM includes name, geographical coordinates, and type information, which can be located and reclassified in ArcGIS. This study obtained the latest POI data for London released by OSM in 2022.
Figure 2 presents the distribution of the POIs in the Inner London area based on ArcGIS. The frequency and descriptive analyses are tested in IBM SPSS Statistics in Table 1. There are 5424 points of interest collected from 12 boroughs in London. The frequency analysis shows that the borough of Westminster holds the most significant number of catering POIs. Conversely, the borough of Greenwich has the lowest number.

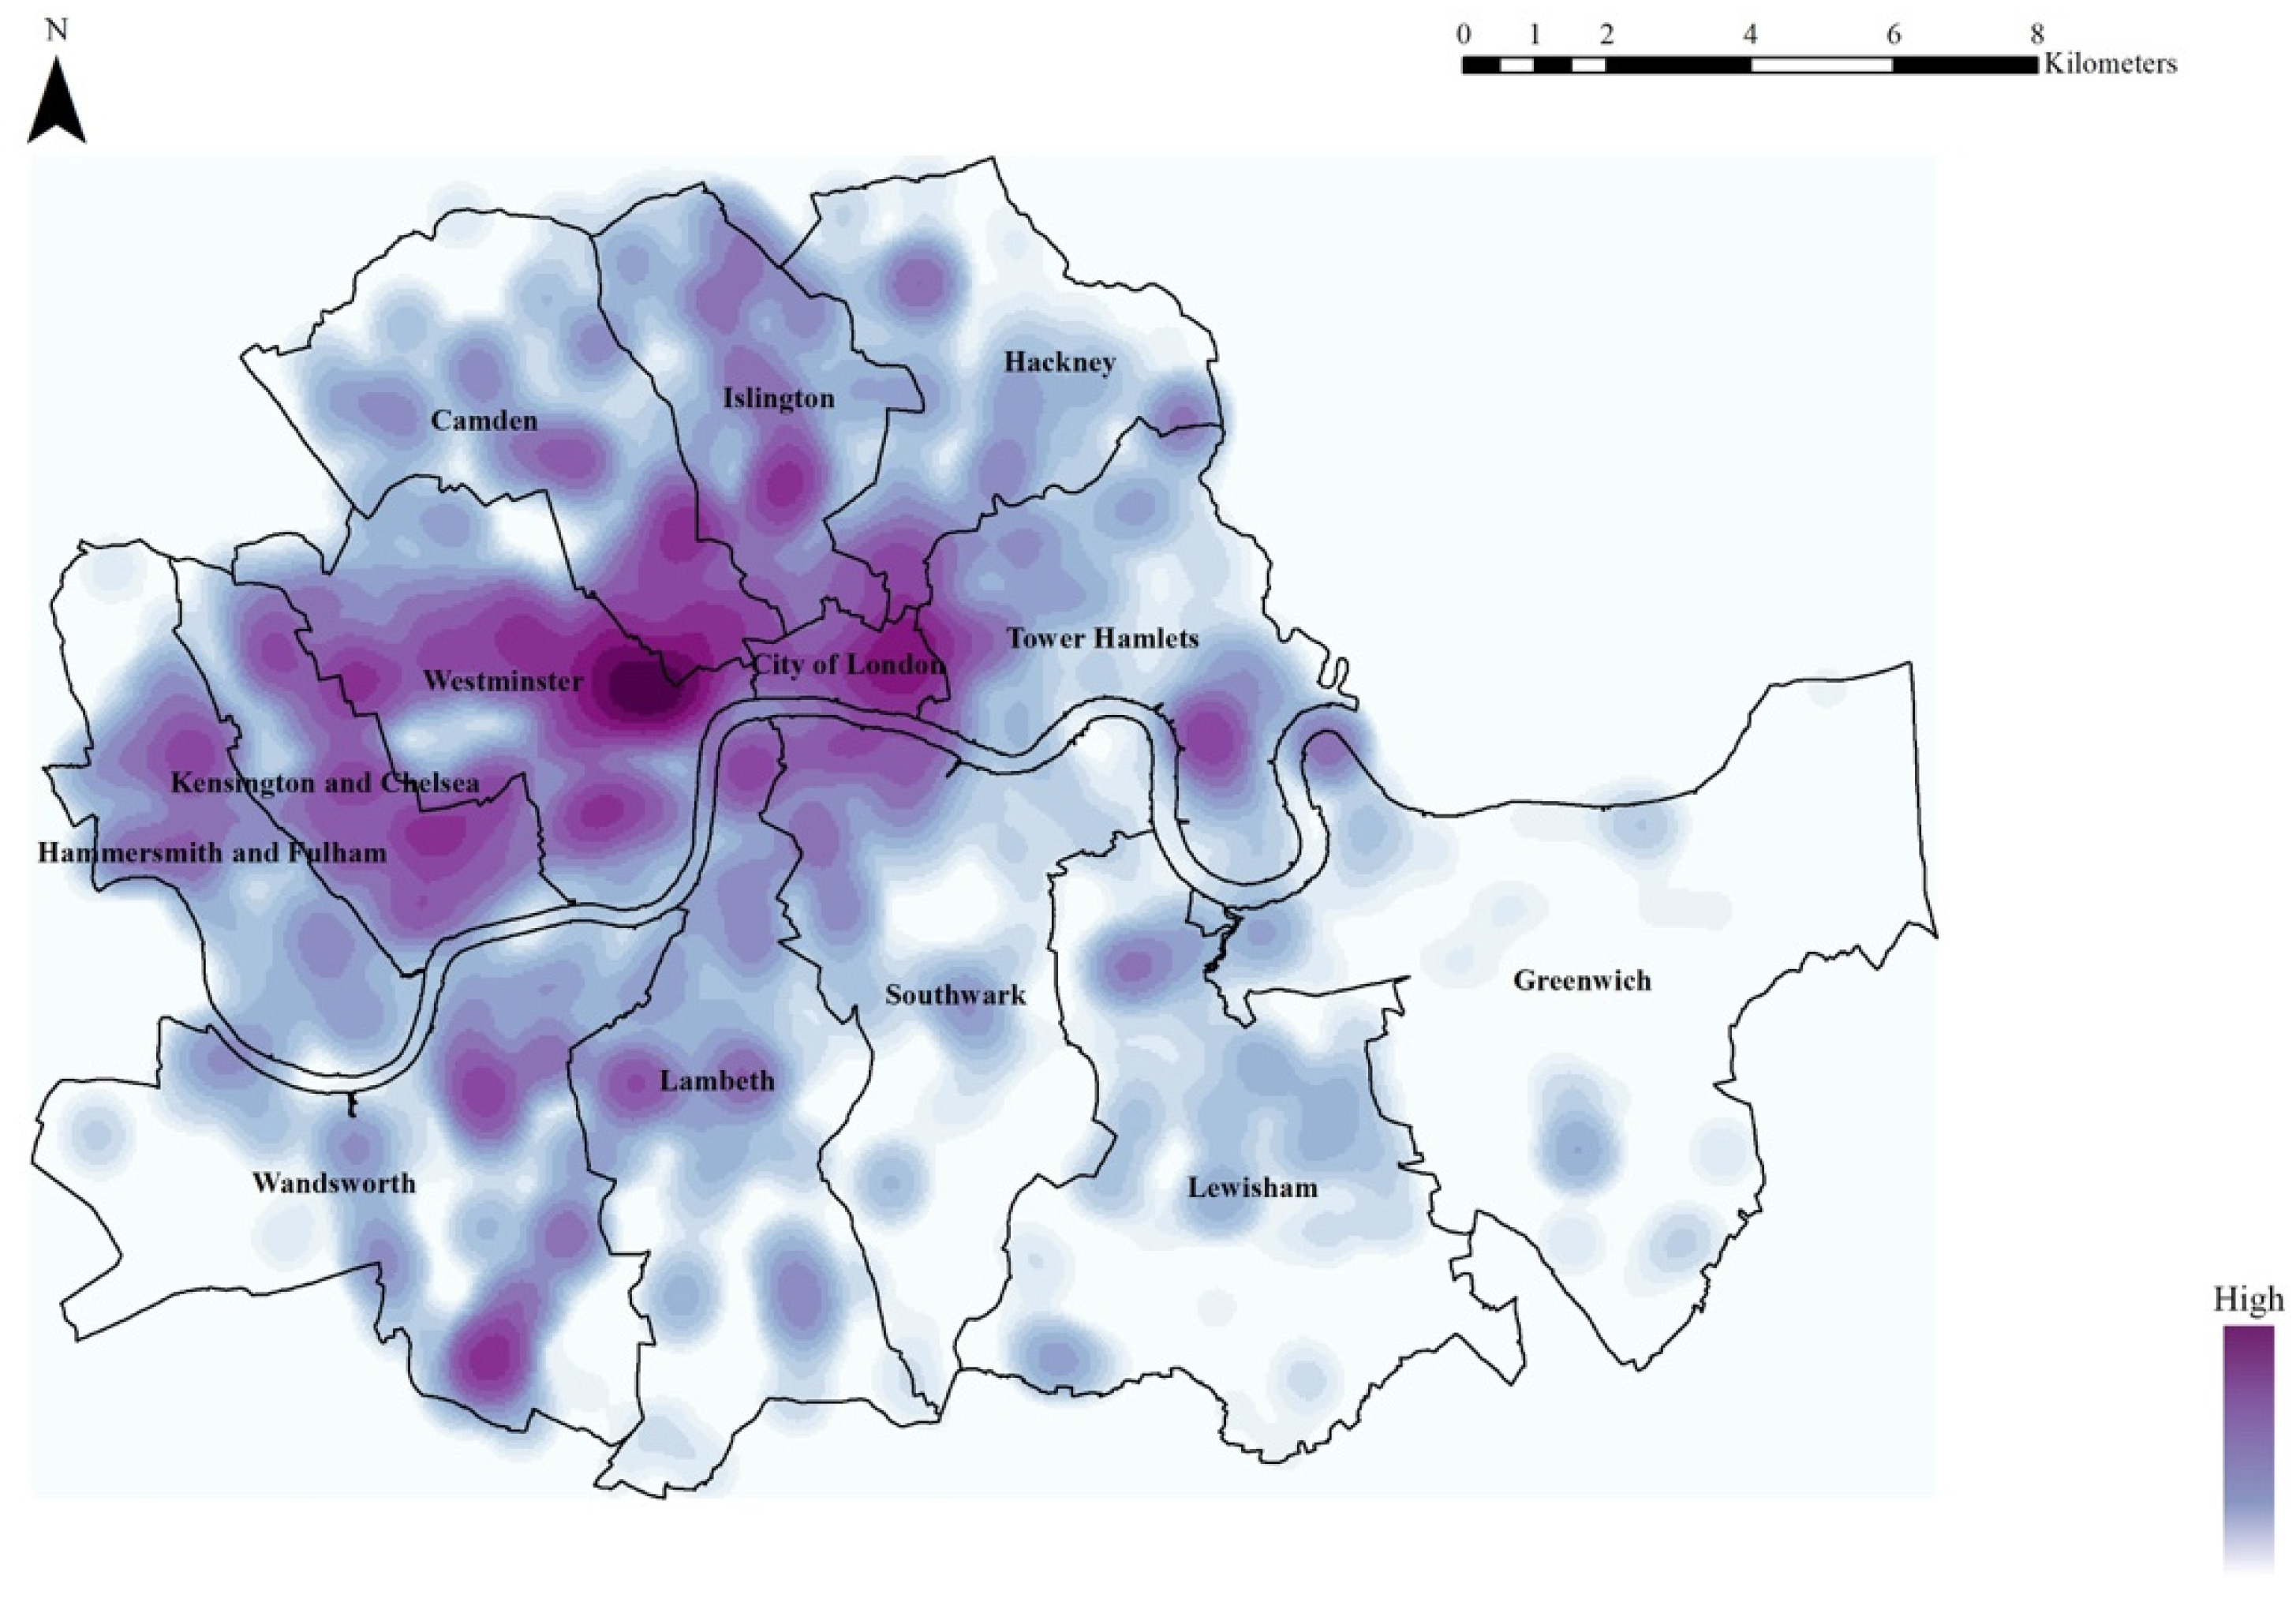
3.1.2. Spatial Pattern: Kernel Density Estimation

This research indicated the use of kernel density to find the high-density food hub. In ArcGIS, Kernel Density calculates the density of POIs around each raster unit. Kernel density estimation (KDE) is a non-parametric estimate of probability density that generates continuous density curves based on spatial sample points [40]. ArcGIS-based kernel density analysis is used to calculate the density of an element in its surrounding neighborhood. A smooth surface is overlaid on top of each point in the calculation for point elements. The surface value is highest at the location of the point, decreases as the distance from the point increases, and is zero at a distance from the point equal to the search radius. The predicted density at a new (x, y) location is determined by the following formula:
D e n s i t y = 1 ( r a d i u s ) 2   i 1 n [ 3 π · p o p i ( 1 ( d i s t i r a d i u s 2 ) ) 2 ]
i = 1 n
where:
  • i = 1 n are the input points. Only include points in the sum if they are within the radius distance of the (x, y) location.
  • p o p i is the population field value of point i, which is an optional parameter.
  • d i s t i is the distance between point i and the (x, y) location.
The kernel density (geometrical interval) result (Figure 3) indicates the density of catering POIs in its borough. The distribution of catering POIs is unequal among the boroughs. Westminster has the highest density and Greenwich has the lowest density of catering POIs. This study defines 74 high-density food hubs among 12 boroughs.

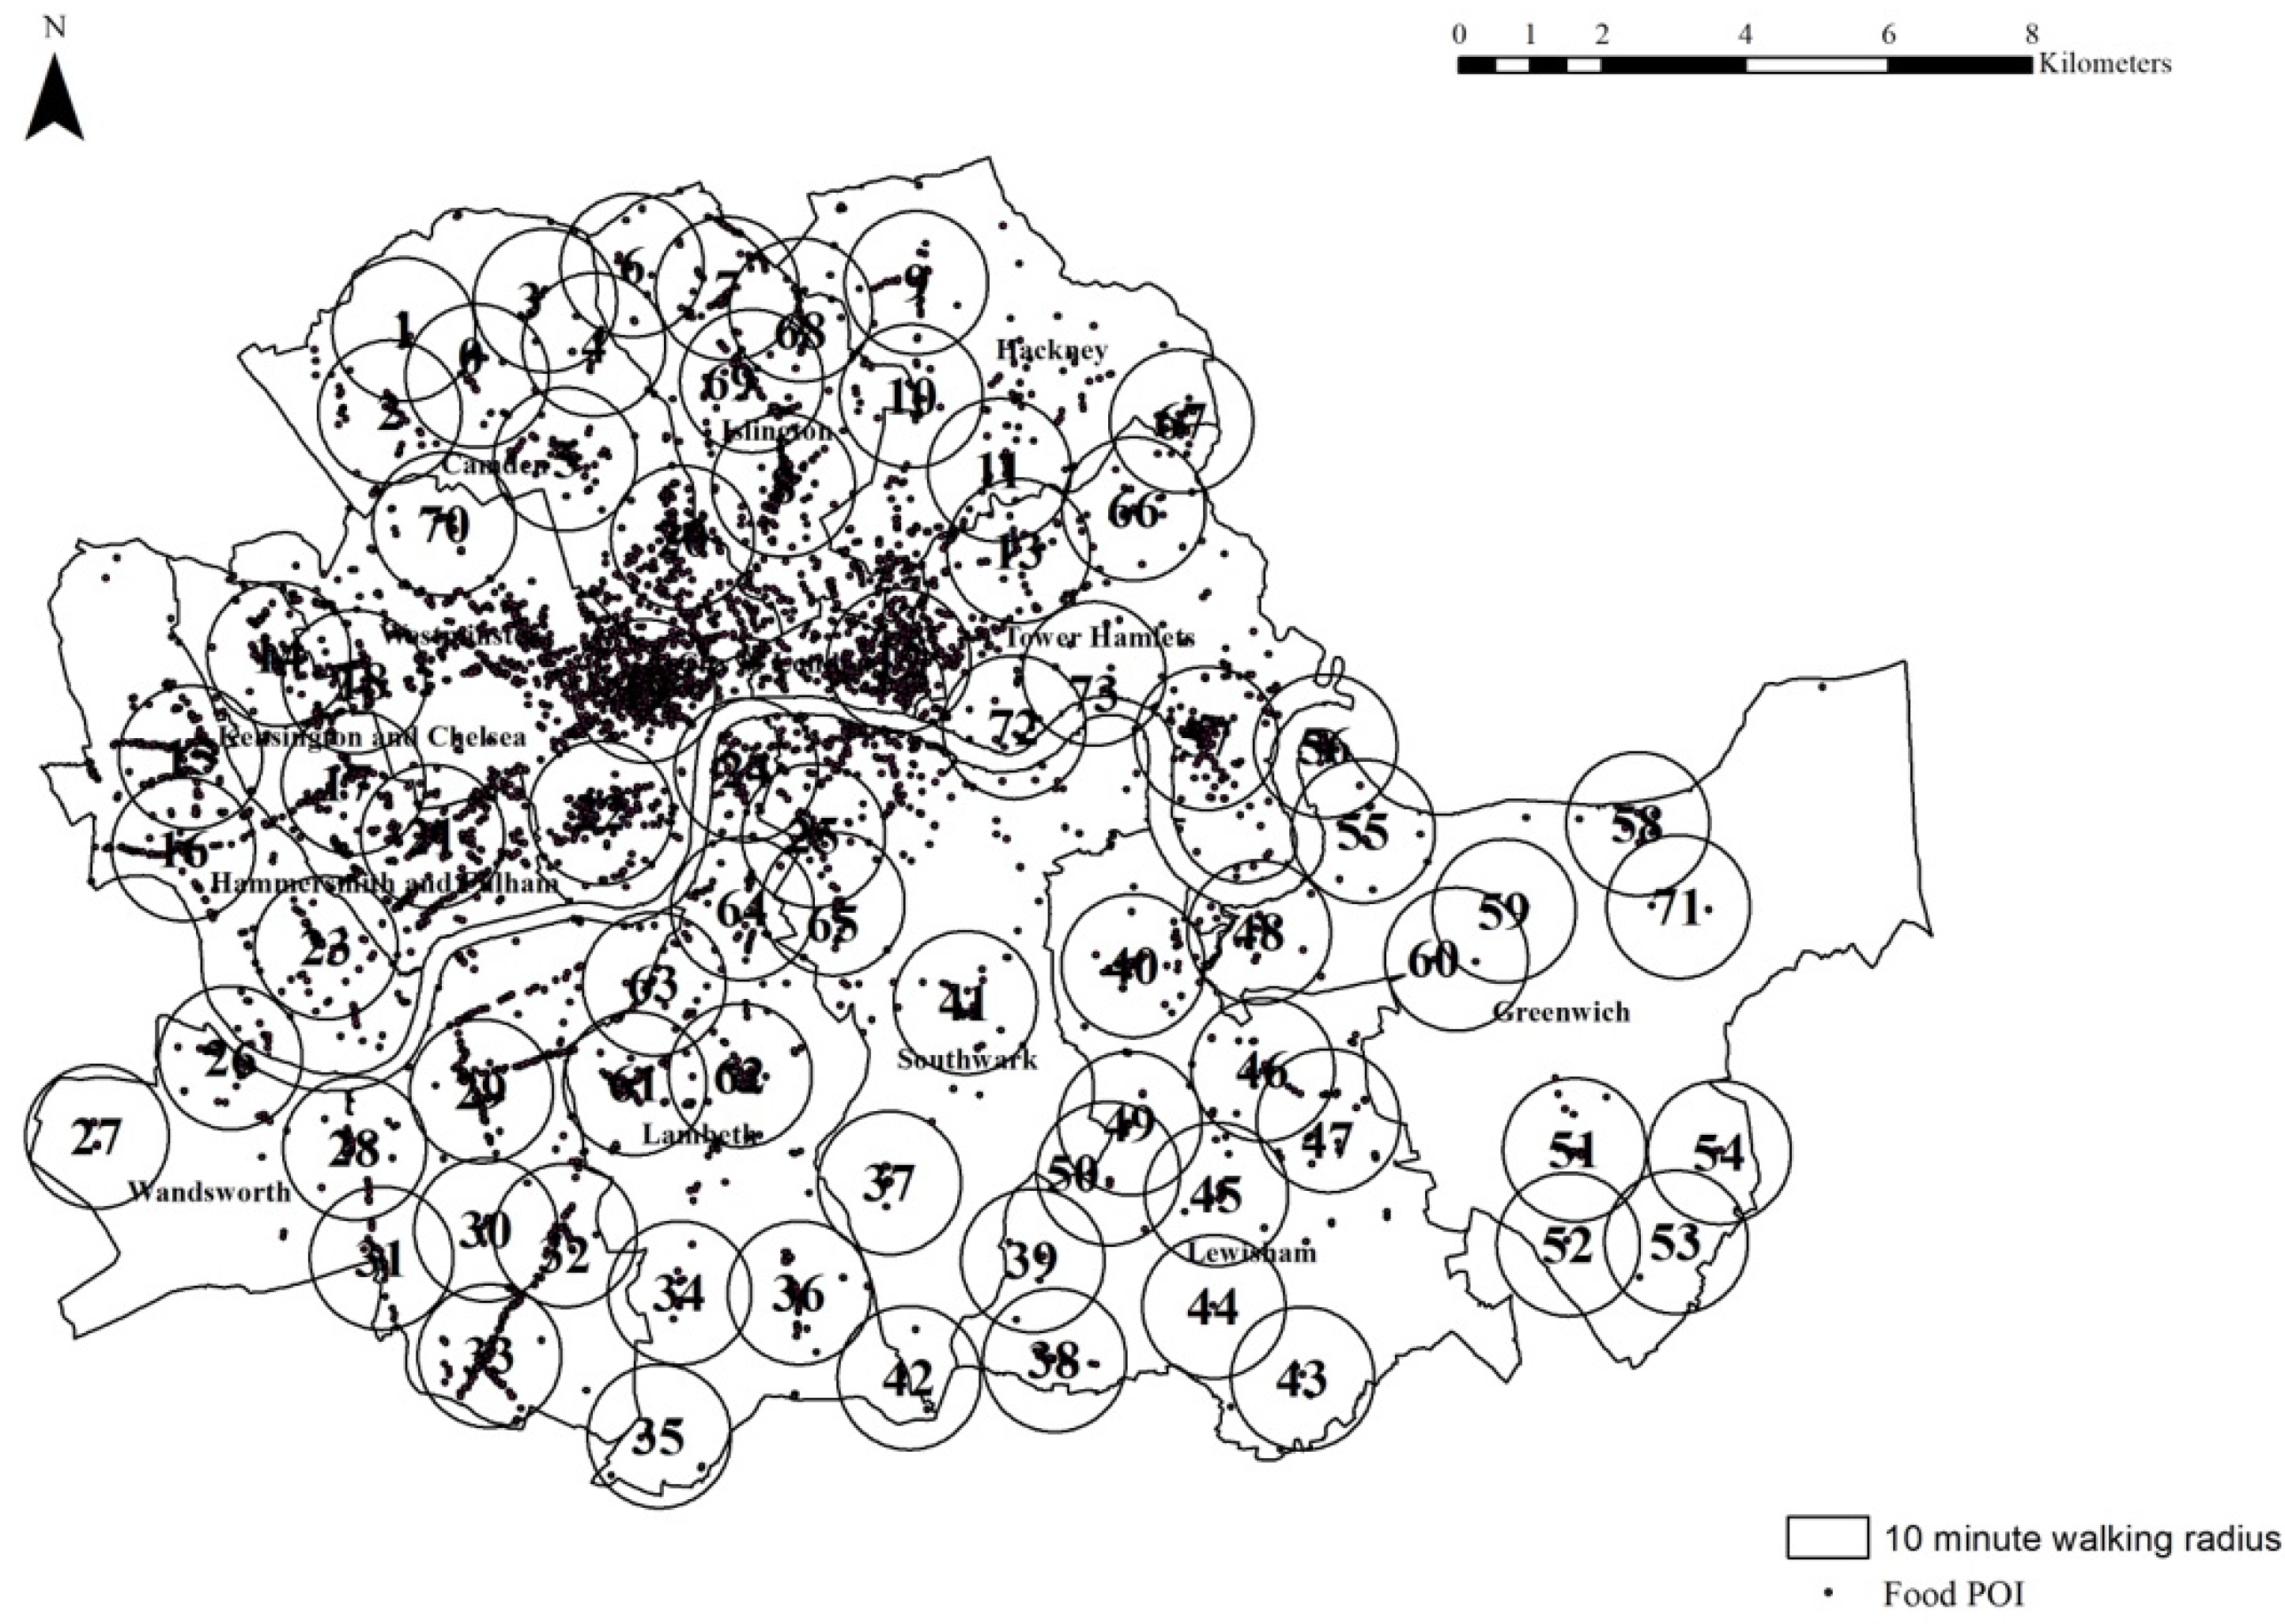
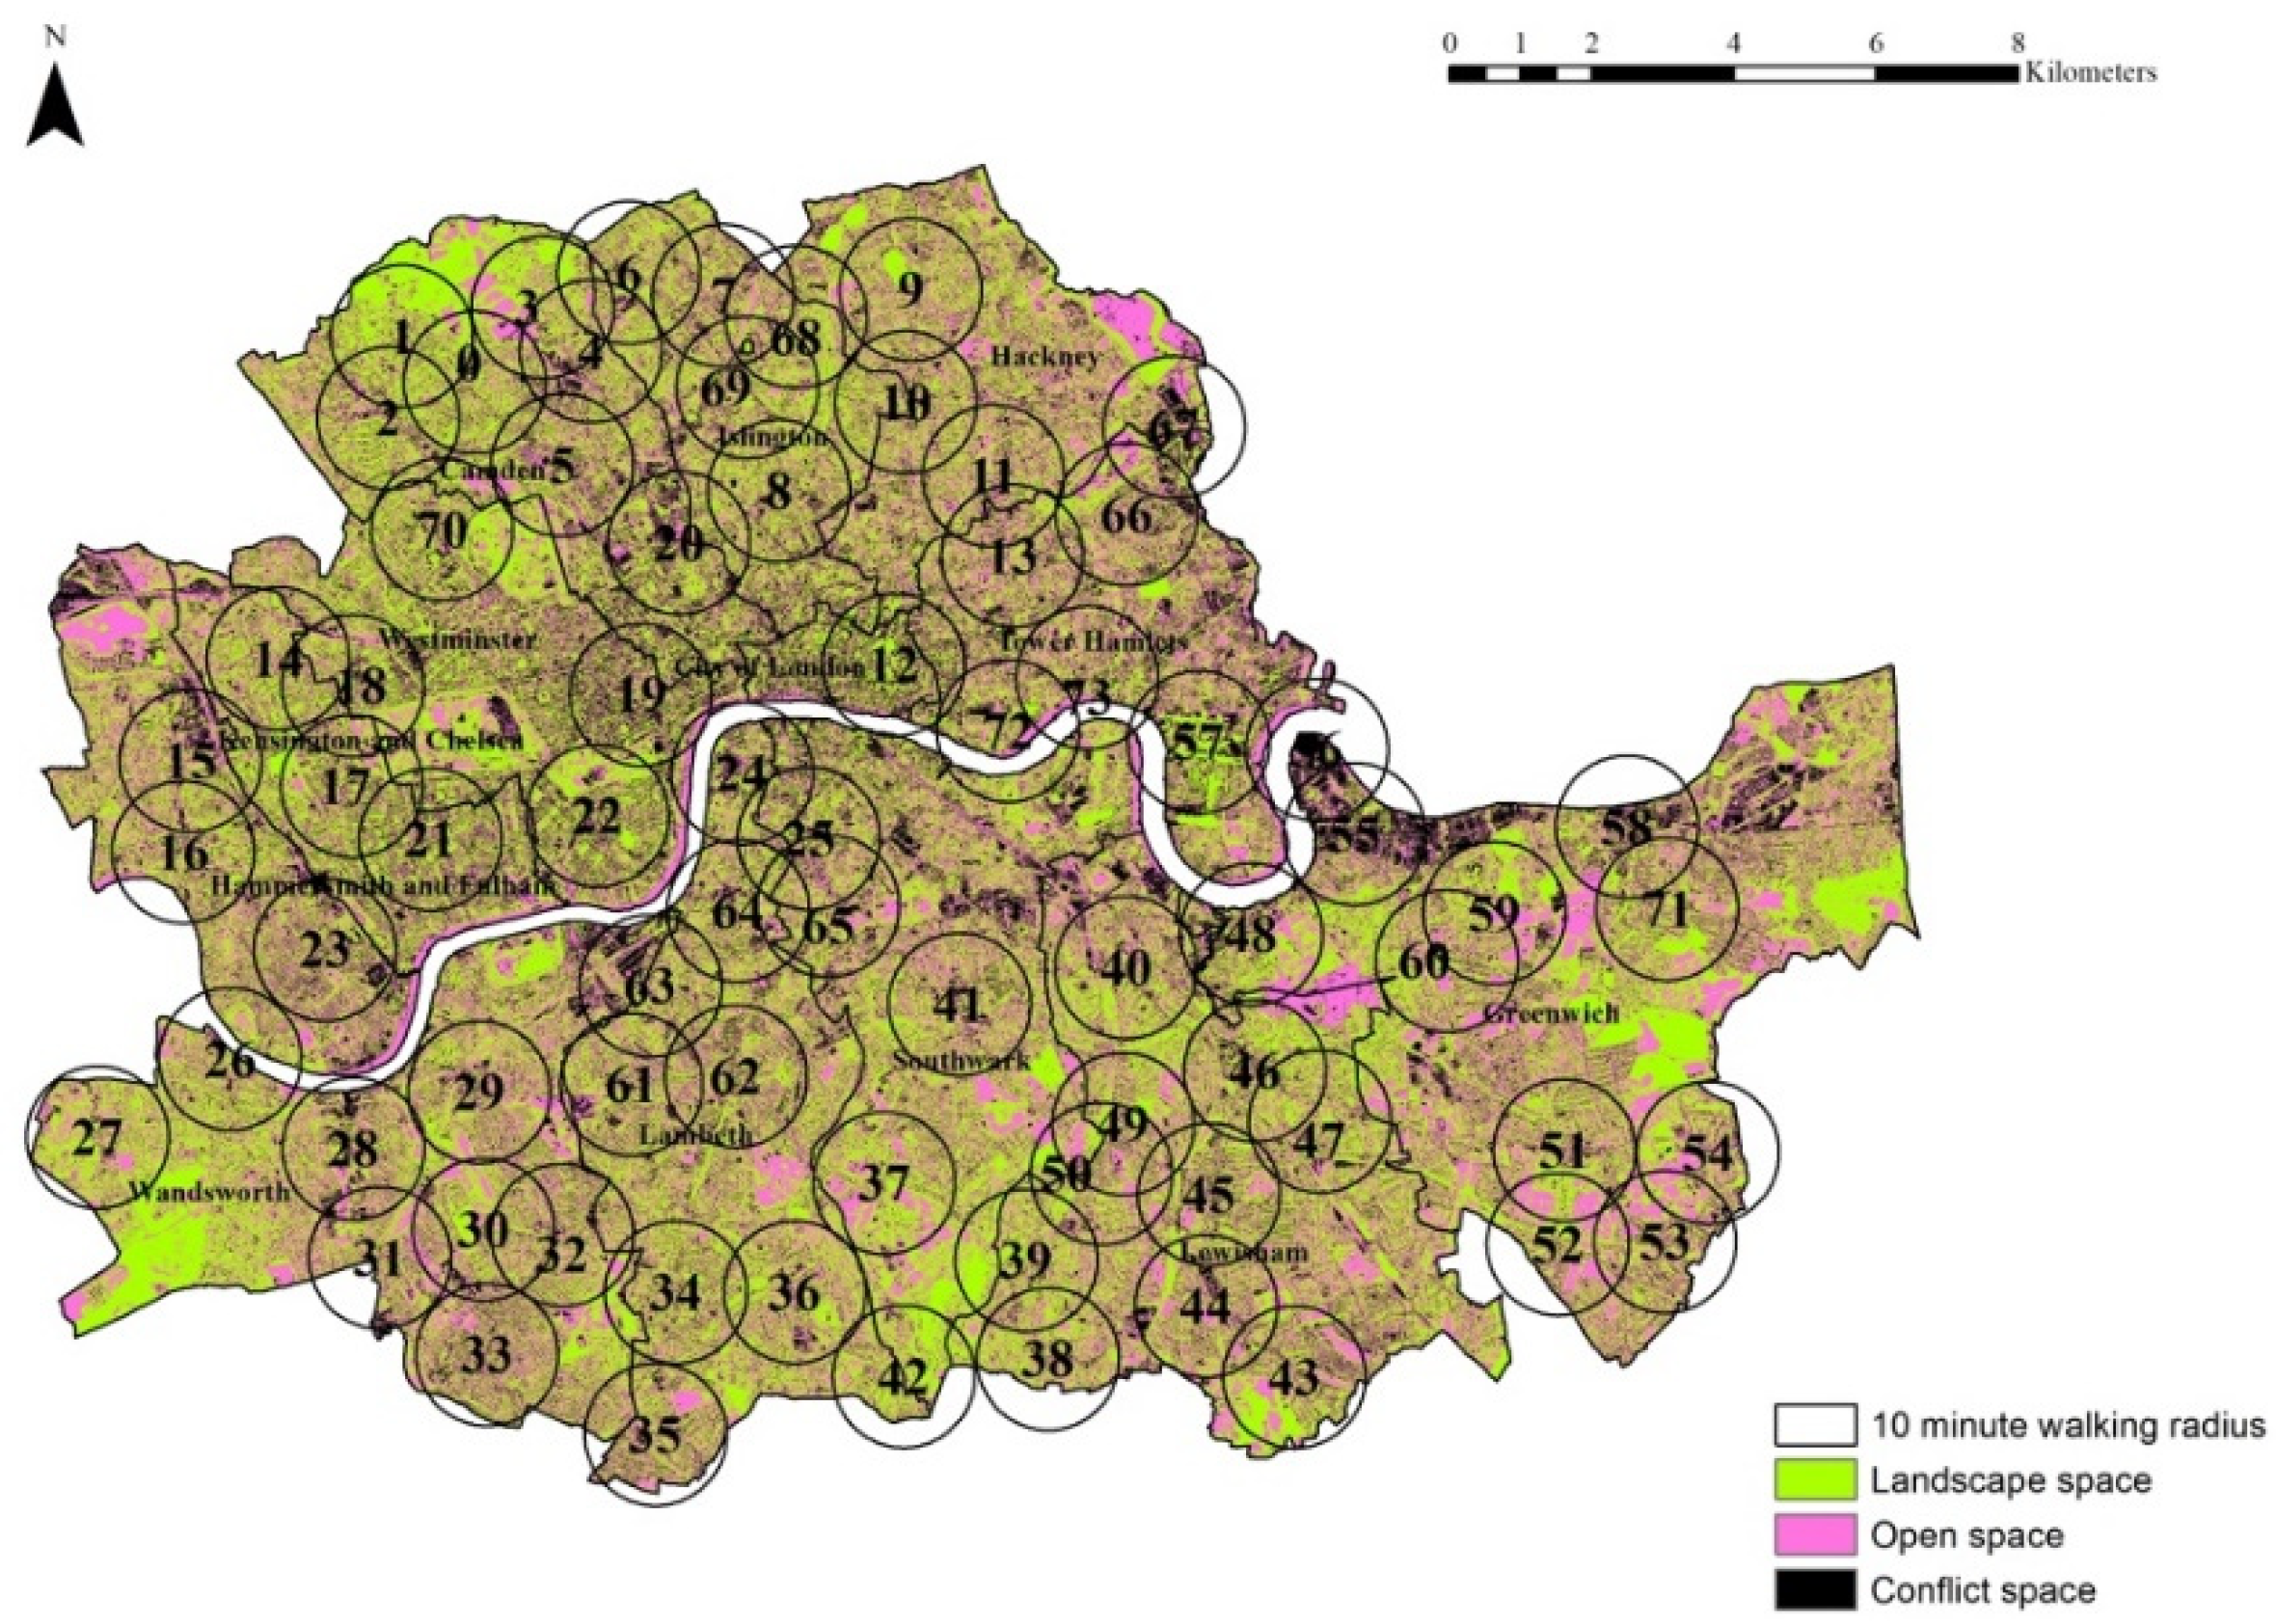
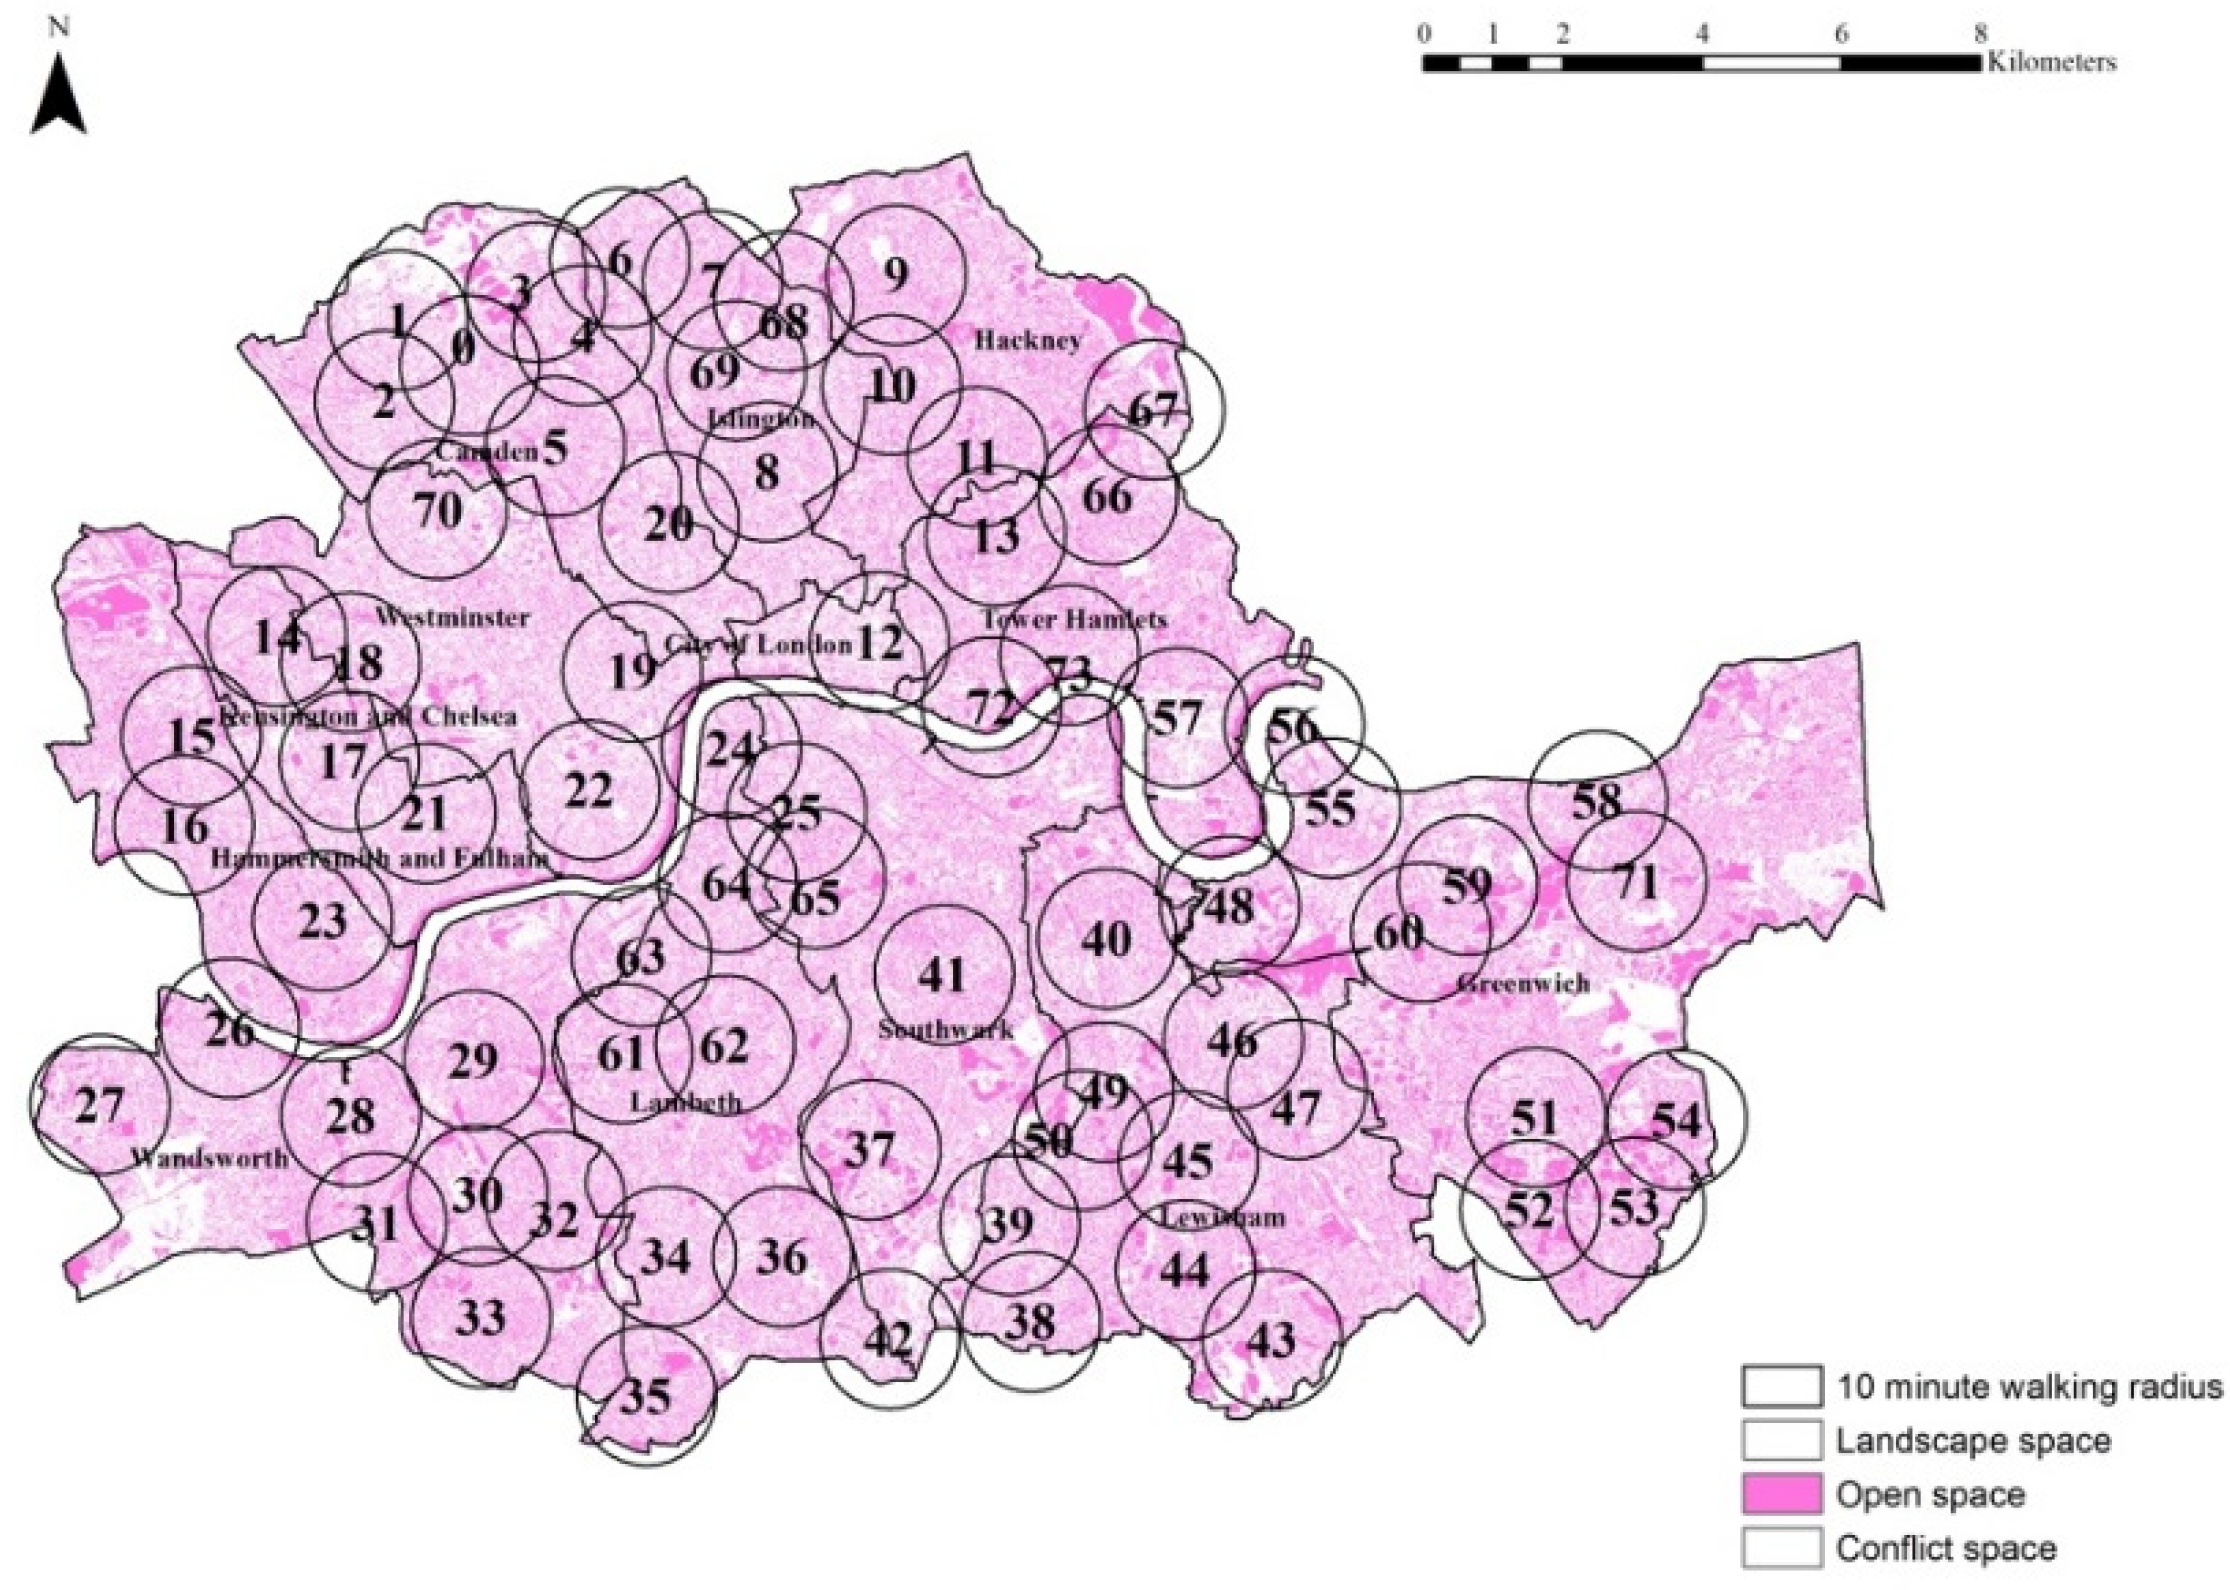
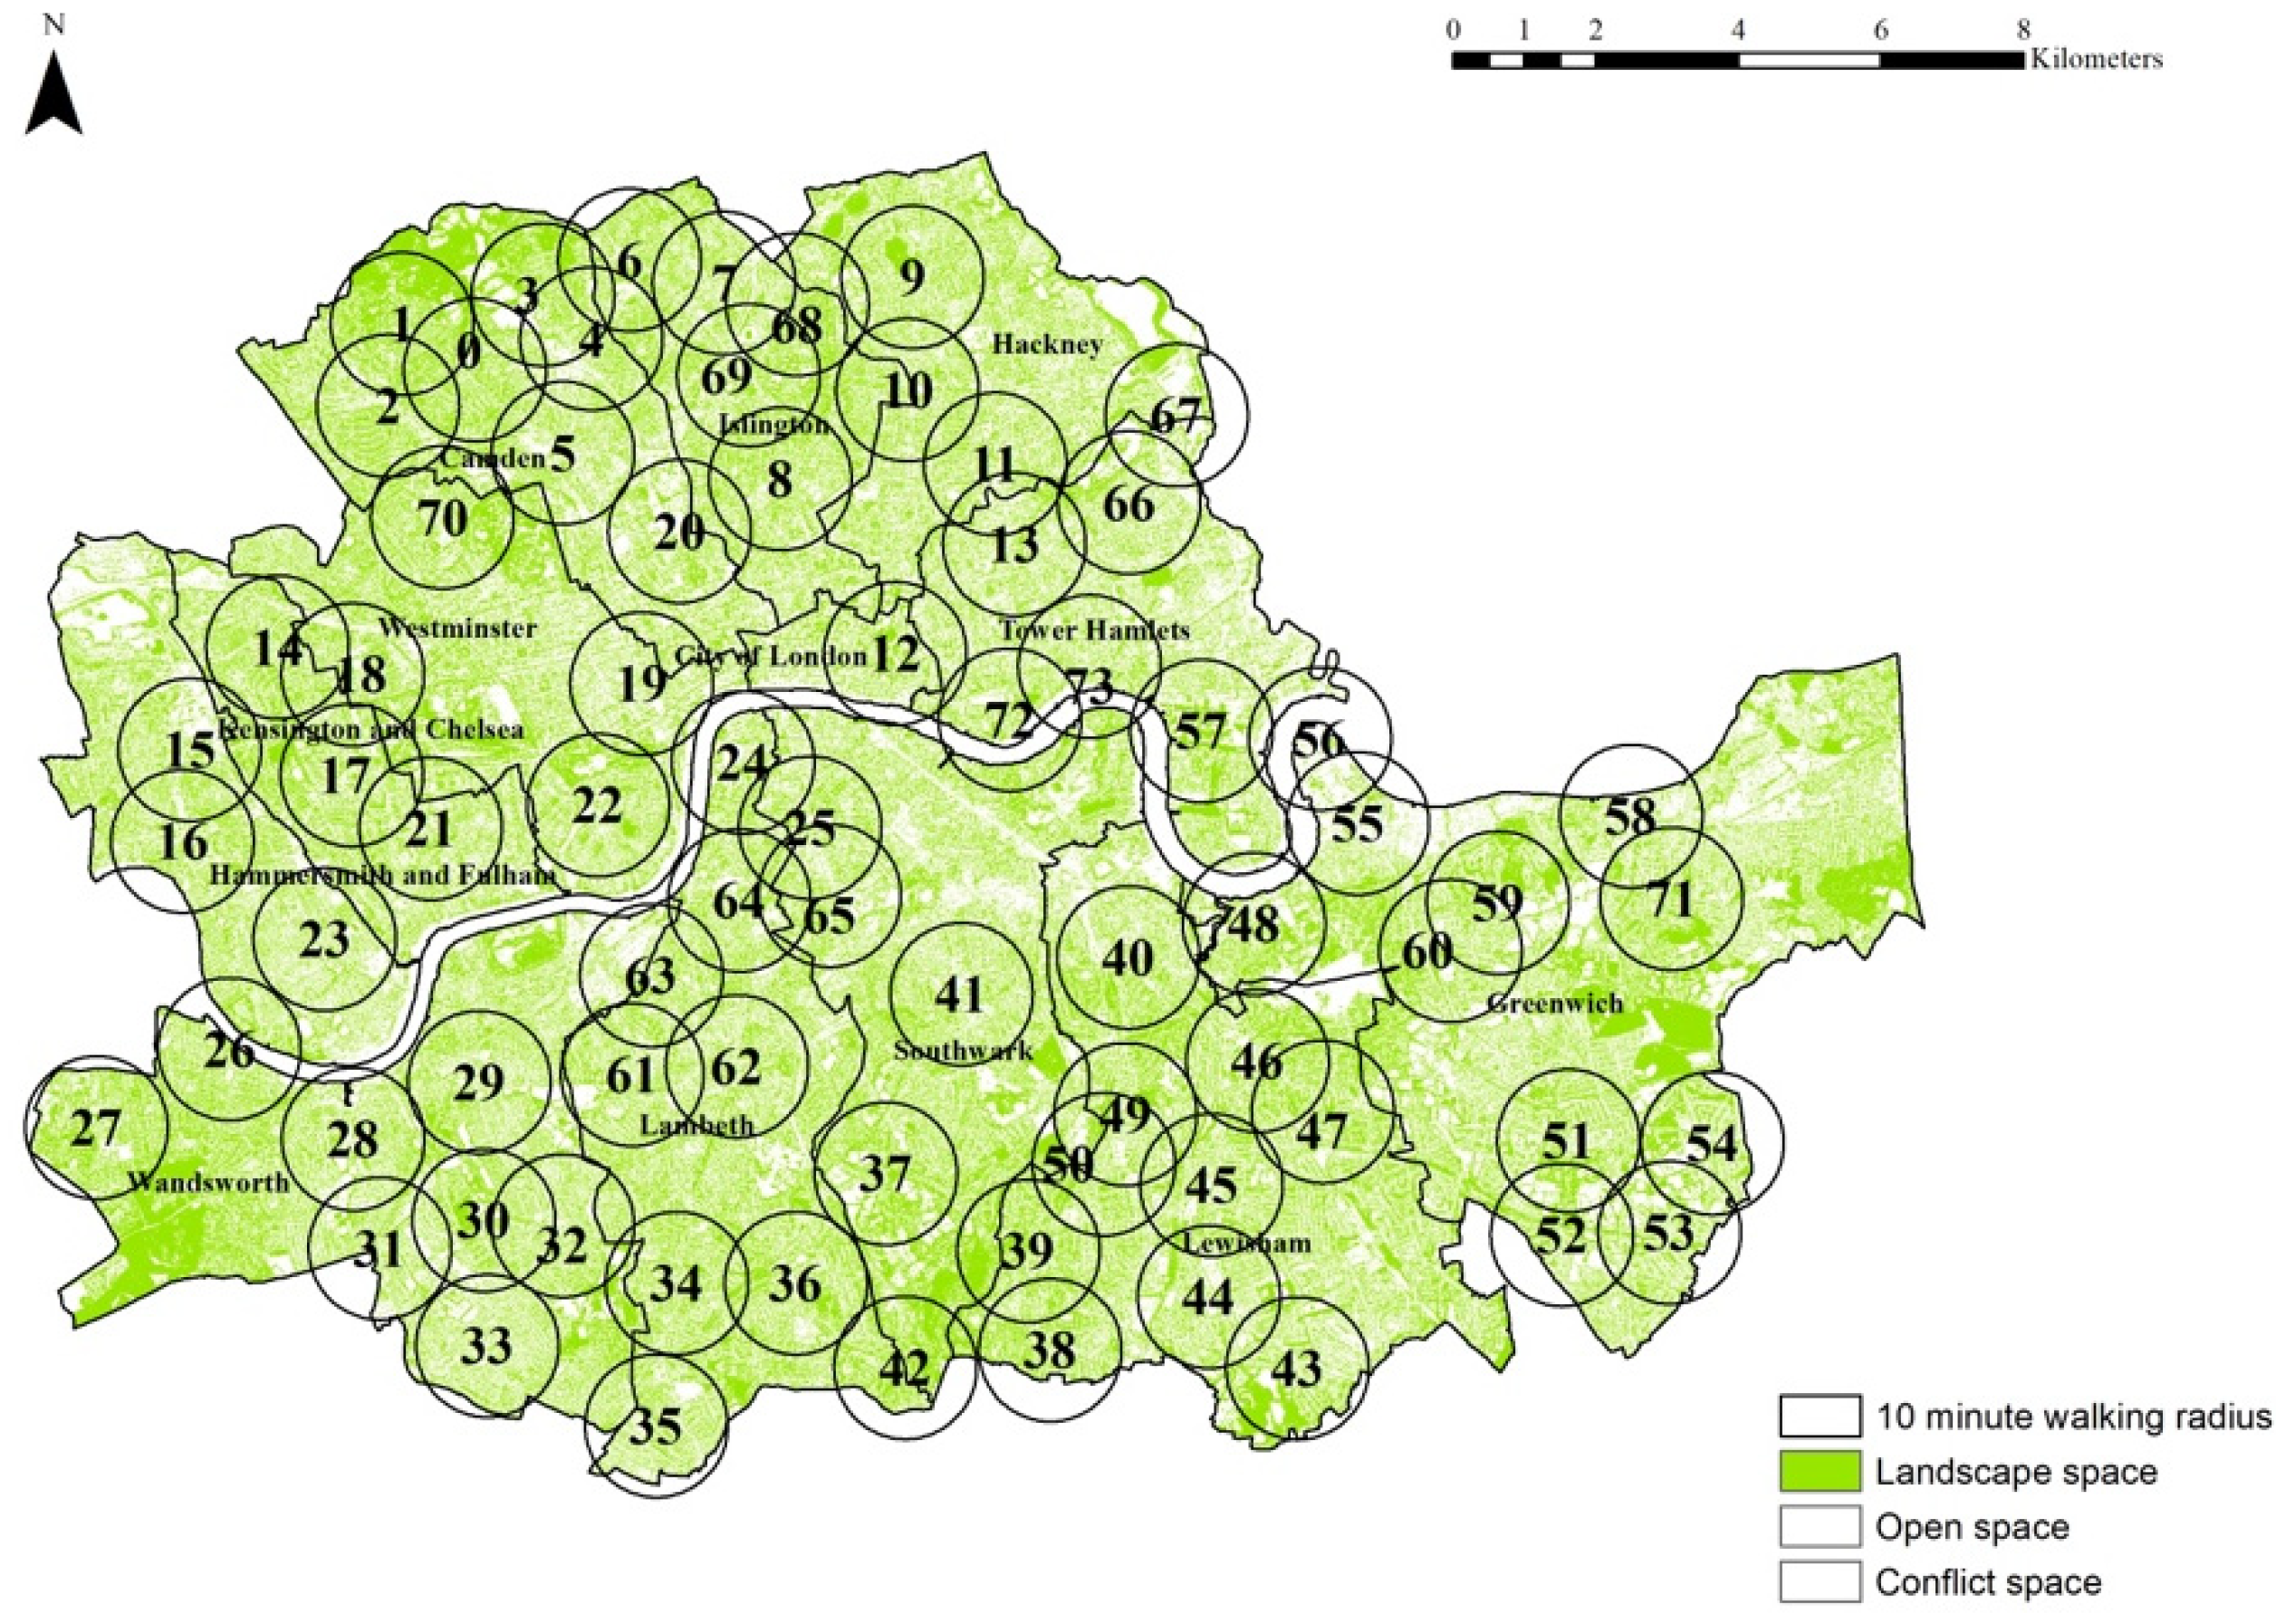
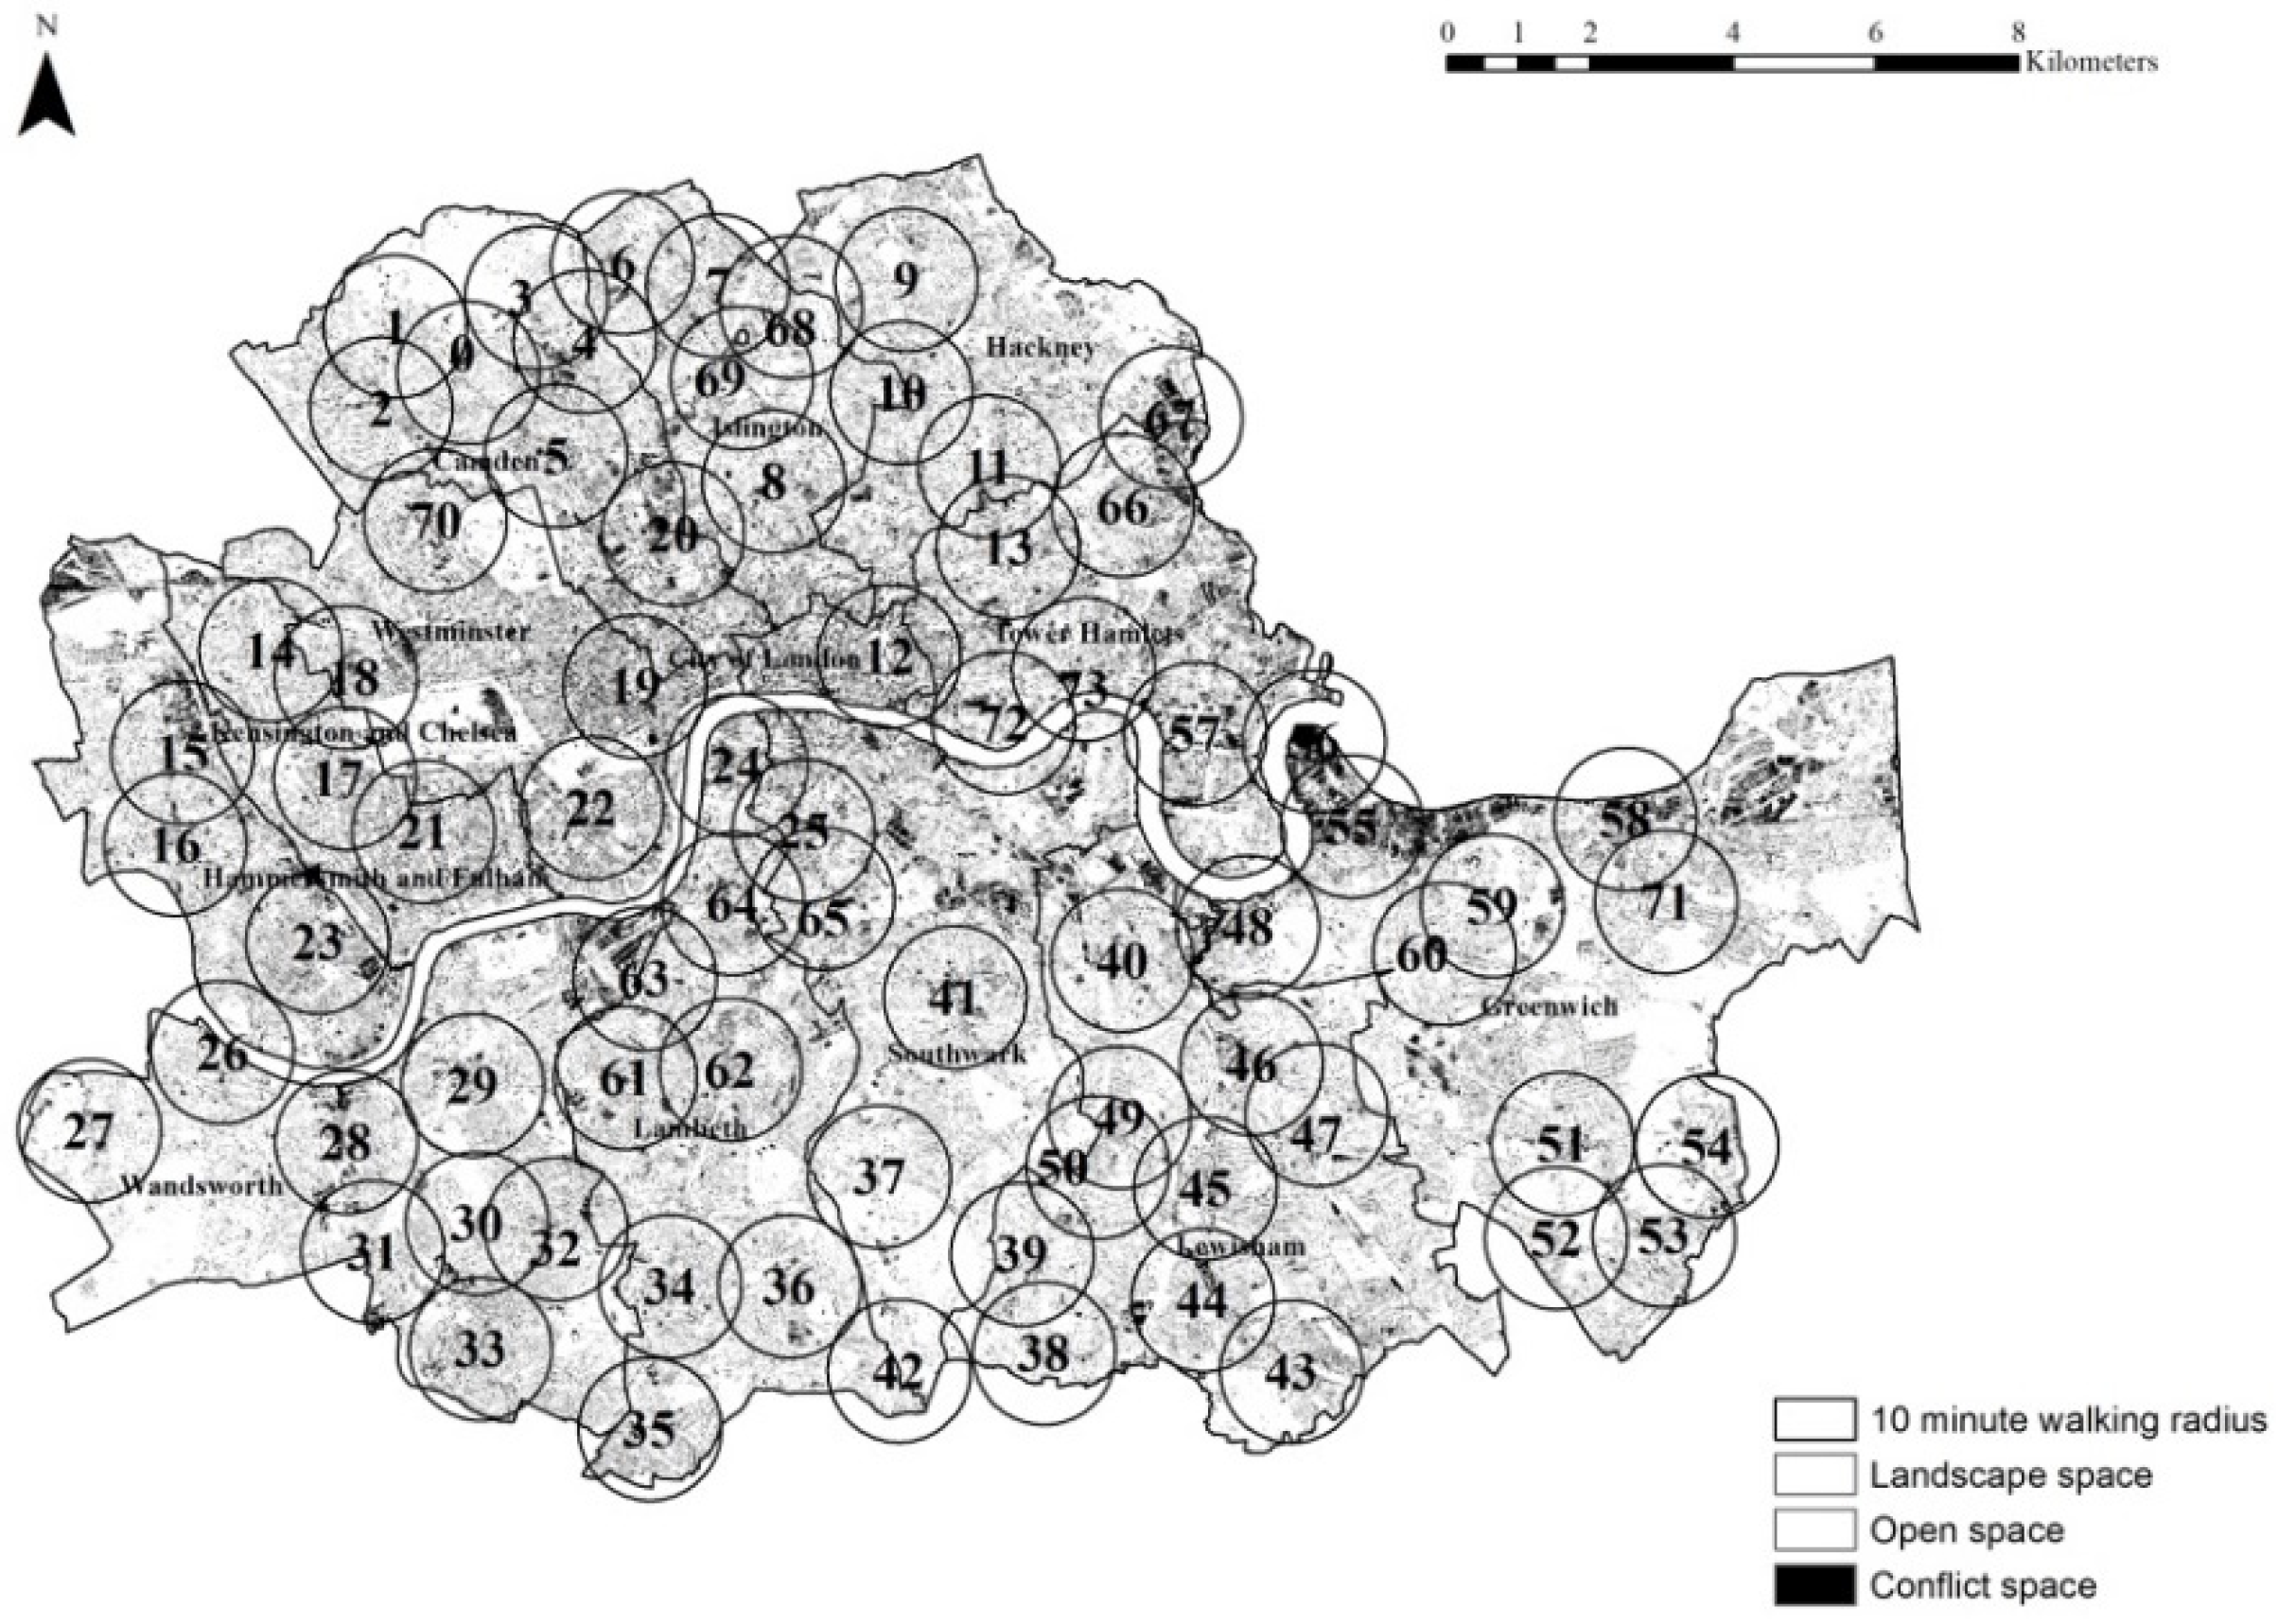
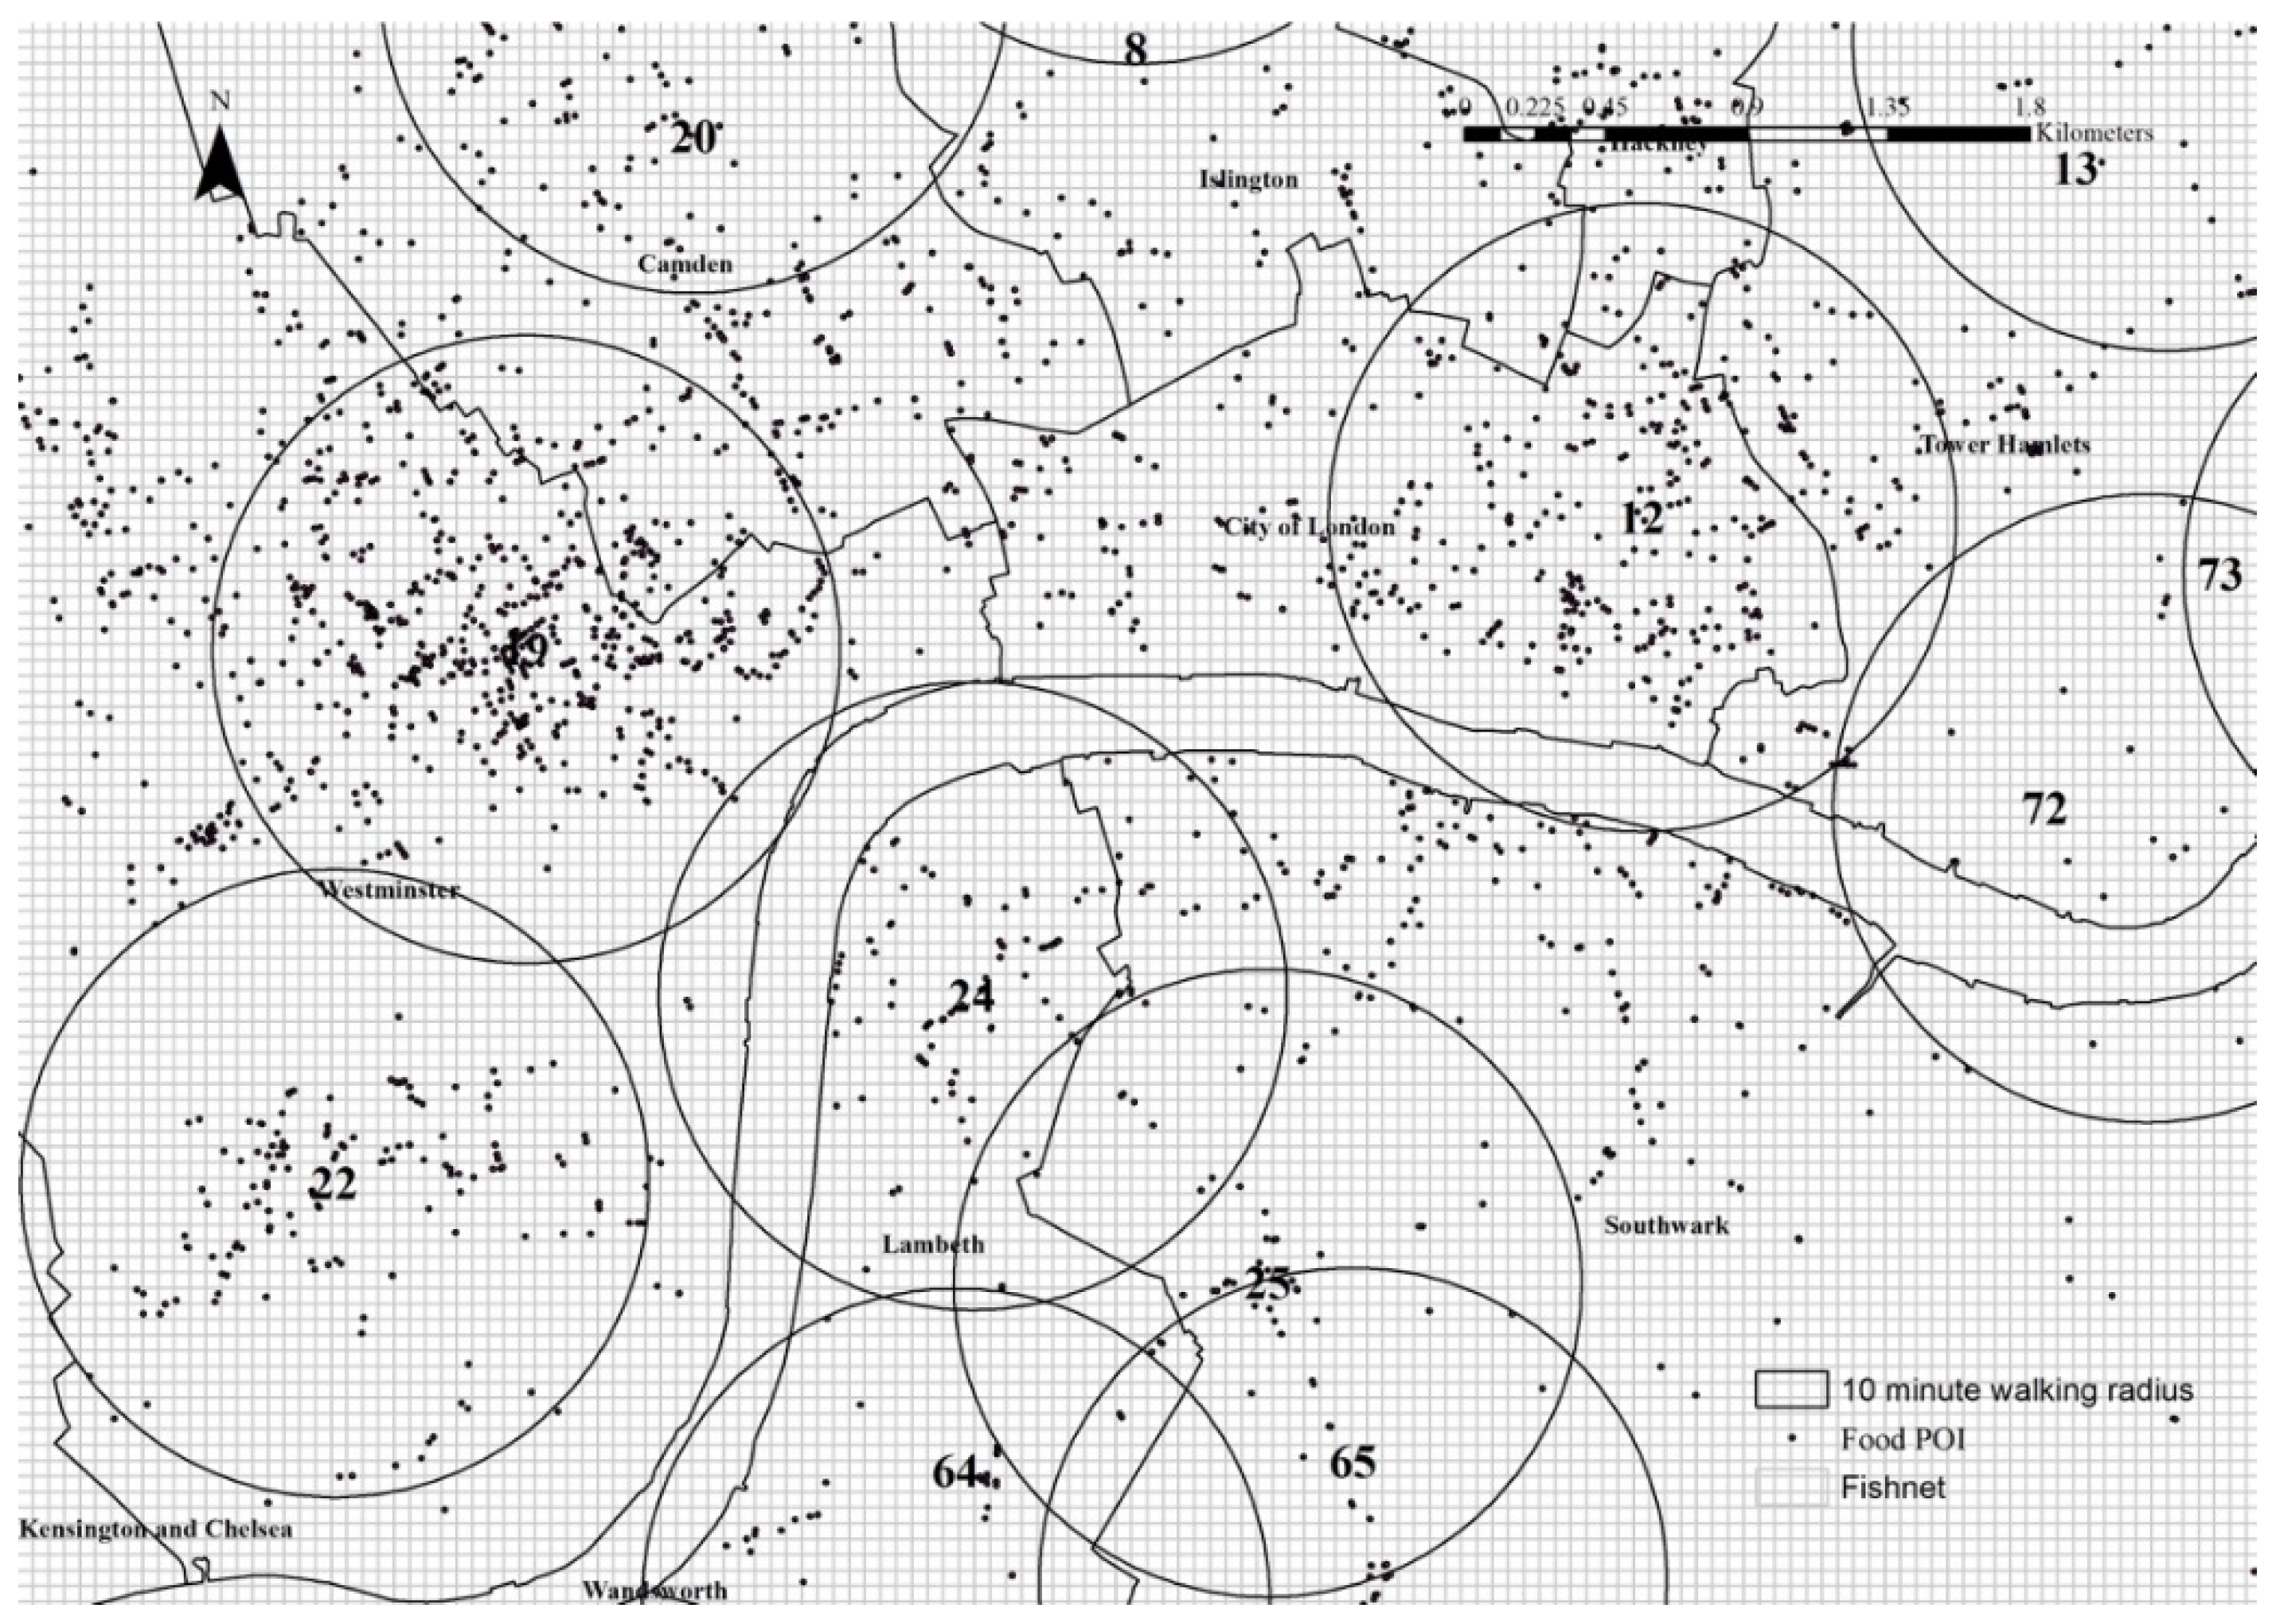
3.1.3. High-Density Food Hub Buffer

This study defines 74 high-density food hubs and creates a 1000 m buffer for each center (Figure 4). A 1 km network buffer is constantly used as a unit to conduct spatial analysis in a neighborhood [10]. This study defines a 1000 m square as the unit of analysis to study the relationship between the number of catering POIs and the number of urban space patches. These buffers are used as basic units in the subsequent study to calculate the number of catering POIs in the range based on the number of spatial patches. According to the density result from the kernel analysis, a “10 min walking” radius buffer is created from the 74 high-density points. As Figure 4 shows, the buffers cover most of the distribution area of the catering POIs.

3.2. Categorization and Quantification of Urban Space

This research uses image segmentation to analyze urban space based on computer vision learning at the satellite level. Image segmentation is a crucial application in computer vision, and an increasing number of scholars and planners use it to perform urban analytics [27]. Most existing research investigates street view imagery such as Google Street View and traditional urban data like roads, land use, and buildings. These methods are incapable of calculating urban space in relation to catering POIs. This research uses the number and proportion of urban patches within a unit of analysis to categorize and quantify urban spaces.
The study acquires high-resolution satellite images of Inner London from Google Maps. Urban space is categorized first through satellite image analysis. Different types of spaces in an image can be automatically identified by training neural networks. After the categorization of the urban space, data resampling is applied to quantify the urban space into urban potential patches within each buffer unit. Then, the images are placed as inputs to the learning model for training, and the accuracy of the results is continuously improved through supervised learning.

3.2.1. Categorize Urban Space Using Image Semantic Segmentation

Image semantic segmentation is an integral part of machine vision technology regarding image understanding [23]. Semantic segmentation based on supervised learning can divide an image into several specific regions with unique properties and propose targets of interest, which is the process of linking each pixel in an image to a class label. These labels may include buildings, trees, roads, etc. Semantic segmentation enables the fast recognition, segmentation, and processing of image data.
This study uses ArcGIS-based image classification tools to train the image samples and perform image segmentation (Figure 5). Based on the remote sensing satellite imagery, the study investigates a supervised machine learning method according to the ‘Principles of potential patch categories’ to segment the image into three colors (purple refers to the open space, green refers to the landscape space, blue refers to the conflict space). The process of supervised learning begins with the creation of a training model and then the labeling of the samples. The more accurate the sample selection and the larger the number of samples during training, the more realistic the segmentation results will be.
The final model outputs the result of segmenting the land use into colors (Figure 6). In Figure 6, the result contains 217,520,466 open spaces, 243,574,543 landscape spaces, and 82,278,405 conflict spaces. Figure 7, Figure 8 and Figure 9 show the results of the space separately. According to the segmentation results, landscape spaces have the highest proportion, followed by open spaces, and conflict spaces have the lowest proportion. Based on the intersection tool in ArcGIS and statistic analytics in Python, the dataset can be prepared to be joined as units for the correlation and regression analysis.
The potential urban development patch (PUDP) was defined to investigate the relationship between food culture in urban ecology [19]. Based on the PUDP guideline and previous research, this research categorizes urban spaces into three types: Open P-Patch, Landscape P-Patch, and Conflict P-Patch, as indicated in Table 2.

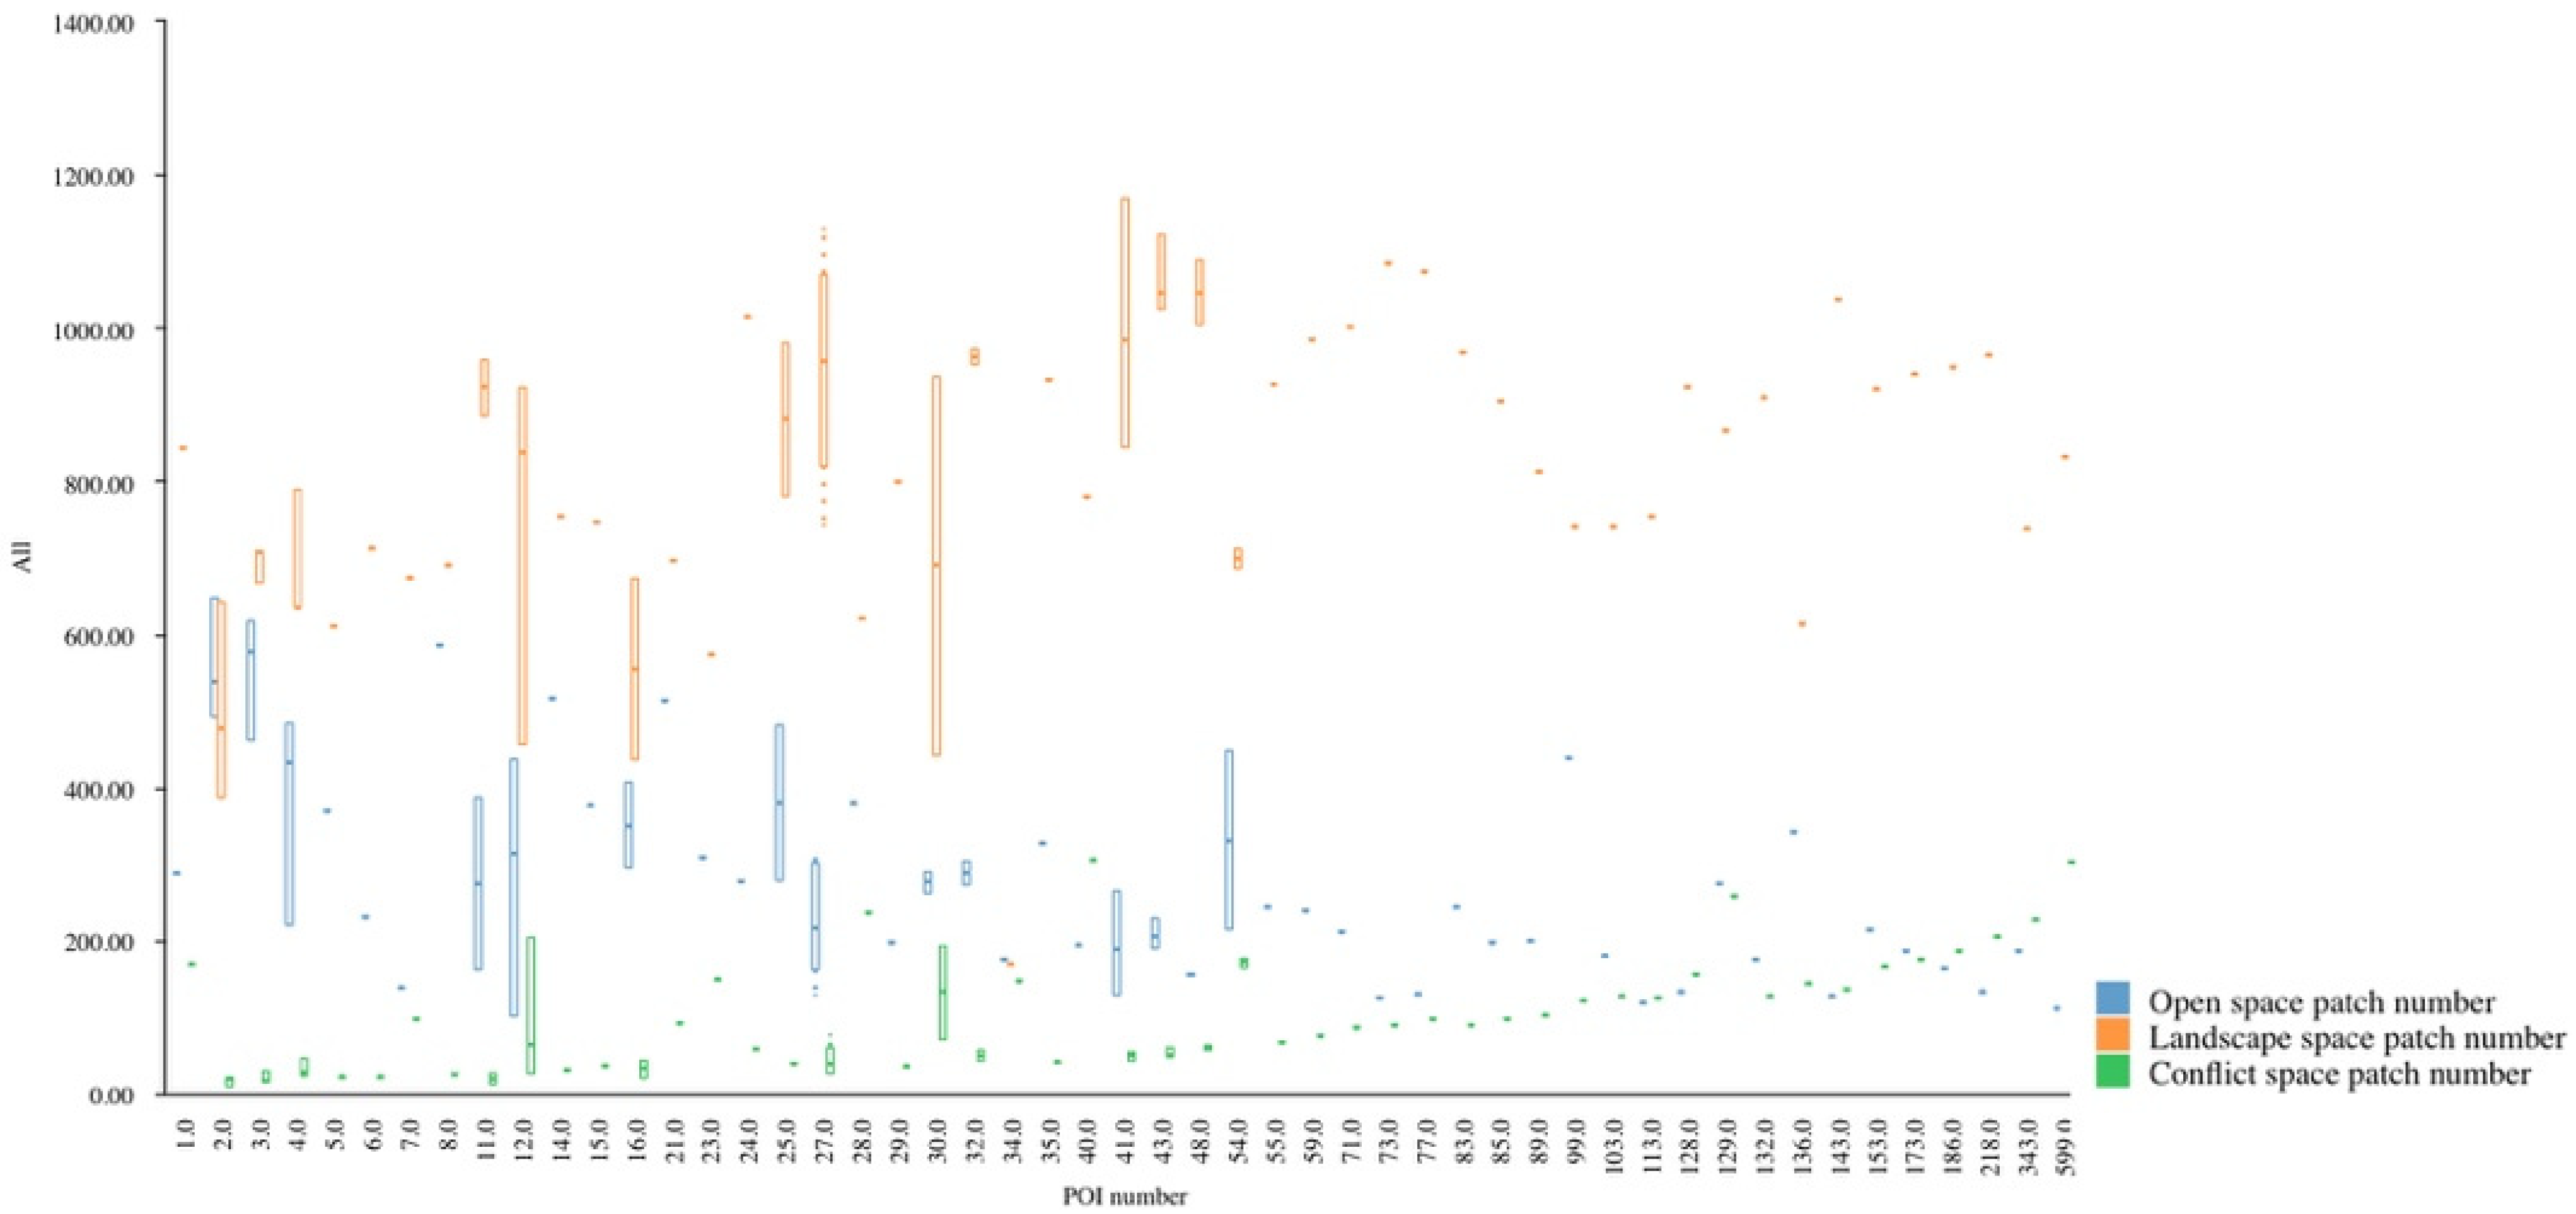
3.2.2. Quantify Urban Space by Data Resampling

Data resampling aims to create a method to calculate the urban potential patches. The study creates a fishnet with 122,423 units (50 m × 50 m each). Figure 10 shows the partial fishnet with the catering POIs and food hub buffers. The segmentation method will be applied based on the units. There are an estimated 1300 cells in a complete buffer (excluding incomplete sections cut by edges). However, it cannot be ignored that some buffers cover areas outside the satellite map, such as the Thames and the area beyond the borough’s boundary. The number of units used in these buffers for calculation will be less than 1300, as Table 3 shows. For these errors, the study used the approximate estimation principle to calculate the number of units in each food hub. The image segmentation uses this fishnet to slice the satellite image before machine learning. Furthermore, it is also the basic unit for the following data statistics.

3.3. Association Relationship between Catering Business to Urban Spaces

The last part of the study intends to explore the correlation between catering POIs and urban space and discover which spaces have the potential to influence food distribution by using data statistics and mathematical modeling, including Spearman’s correlation and linear regression model.
Table 3 indicates descriptive statistics of POIs of catering businesses and urban potential patches within 73 food hubs. The regression model is tested in the analytical software R Studio to set the POI number as an independent variable and the three types of P-Patches as dependent variables to explore the relationship and correlations between them.

3.3.1. Outlier Detection

Box line plots are used to visualize the data distribution characteristics, including showing the overall distribution of the data and exploring and showing outlier data (Figure 11). No outlier data were found to be present based on the results of the analysis.

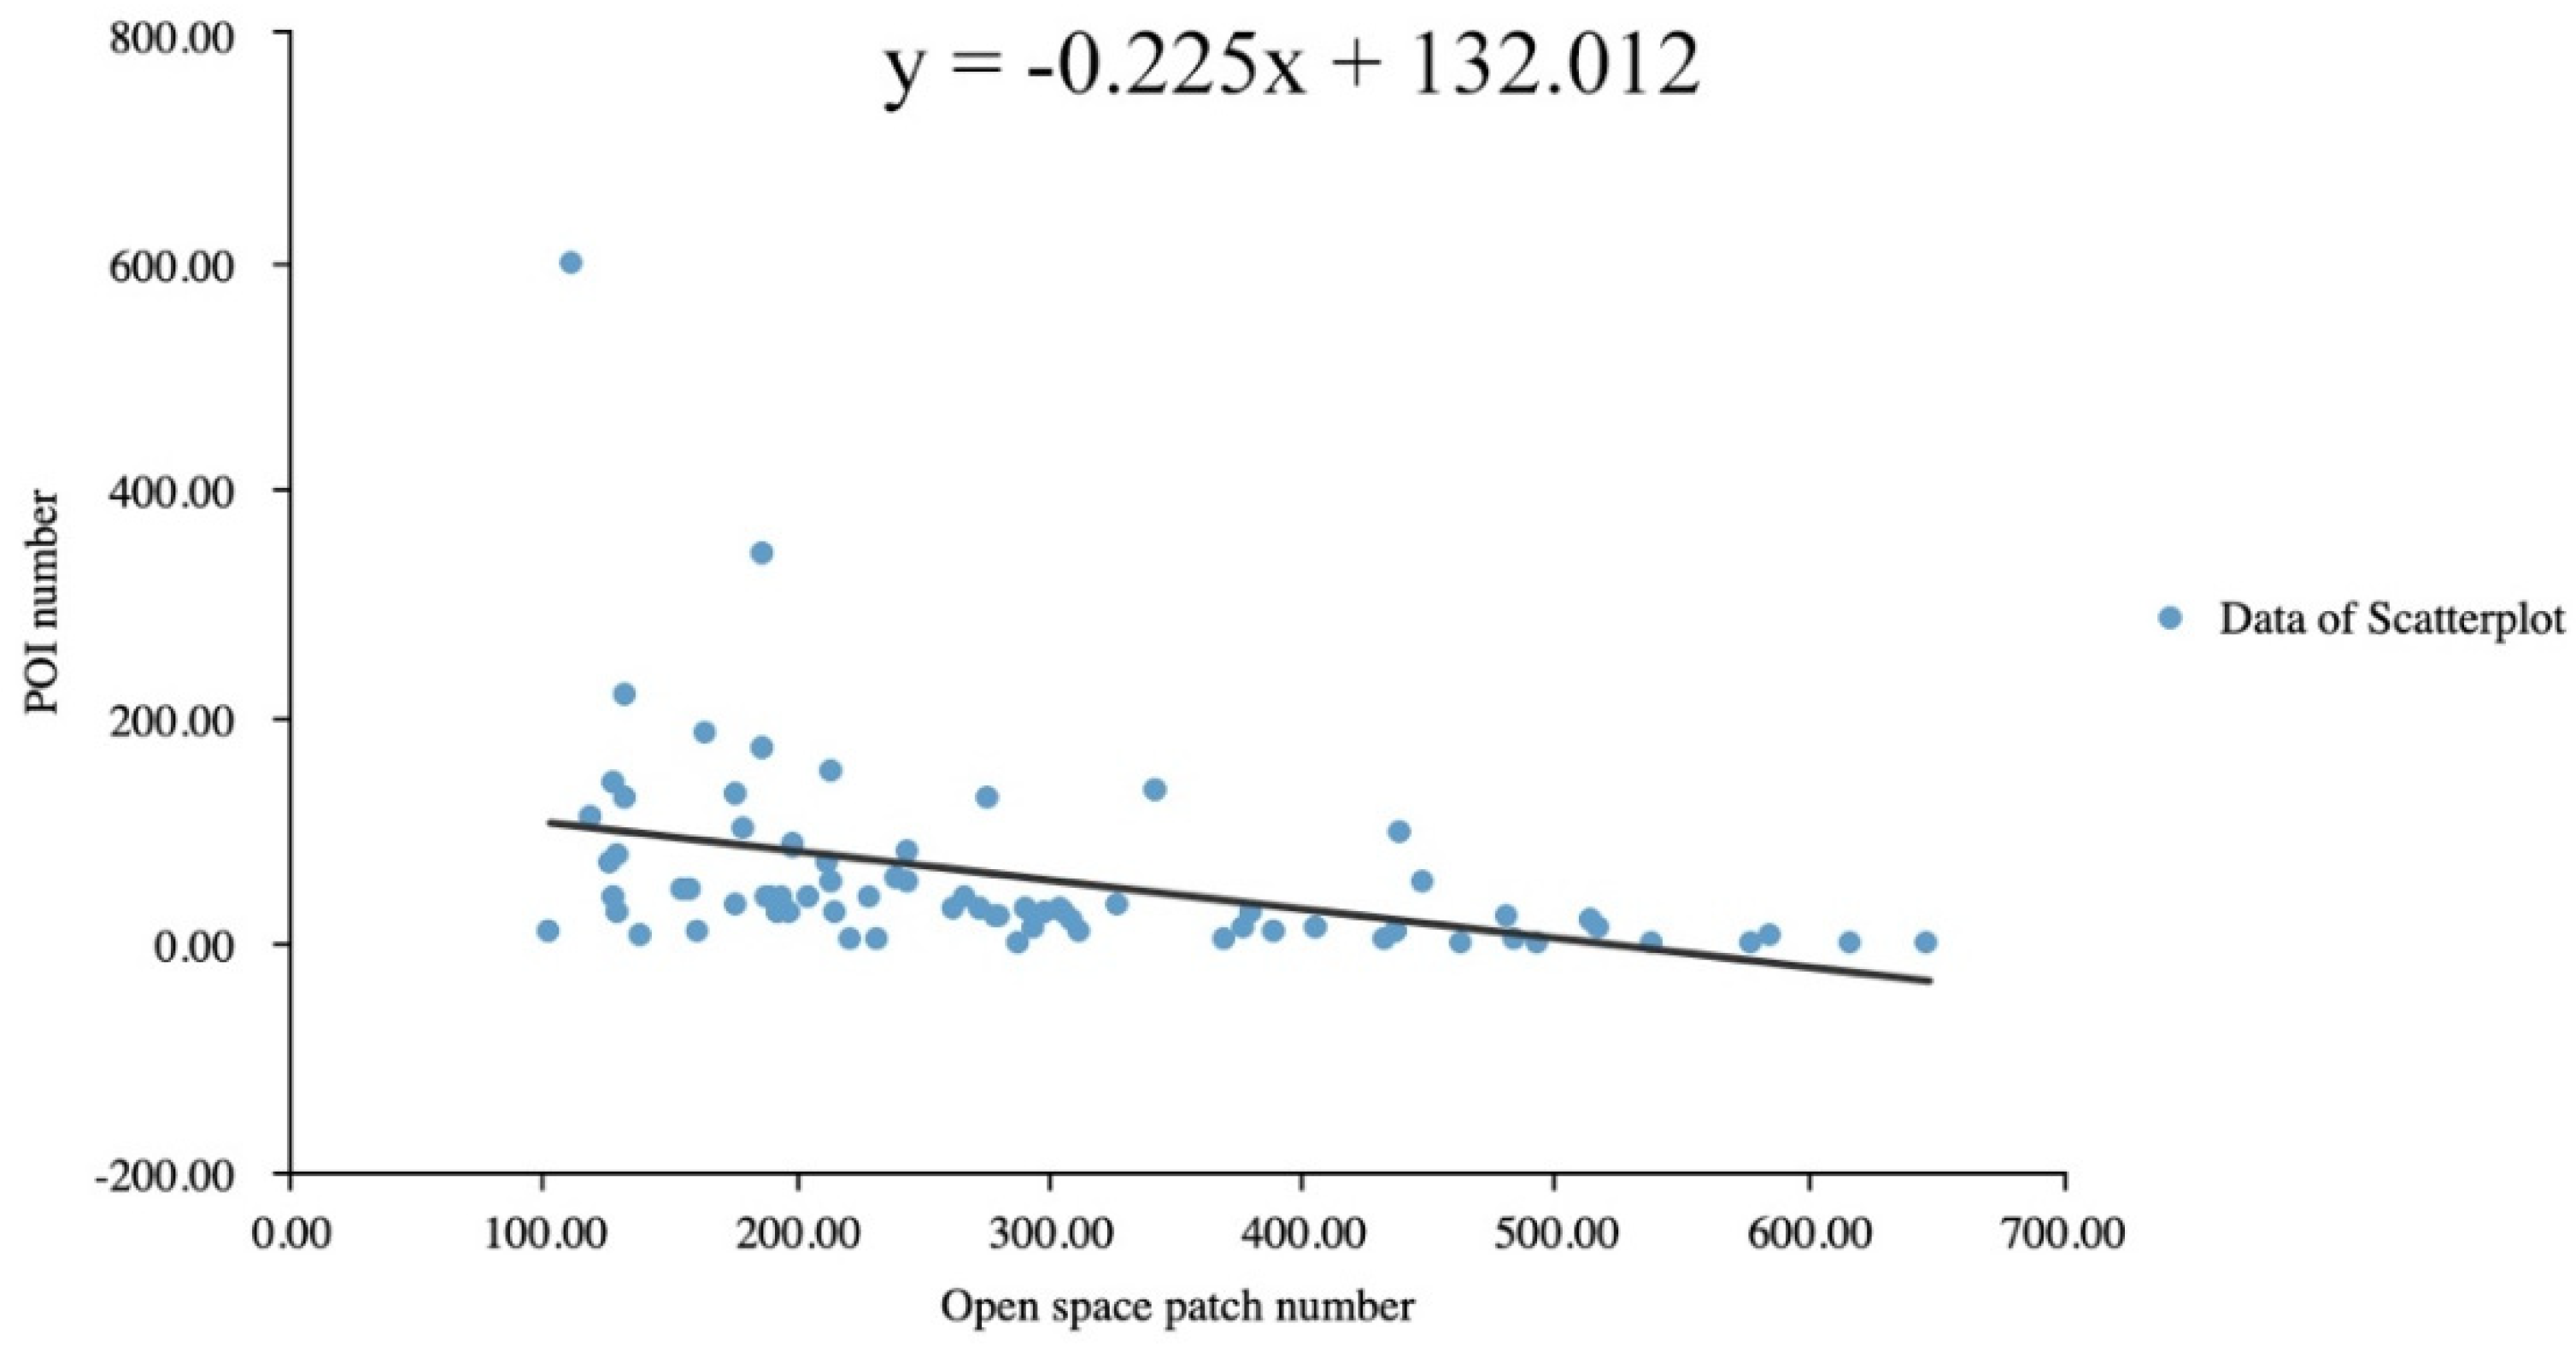
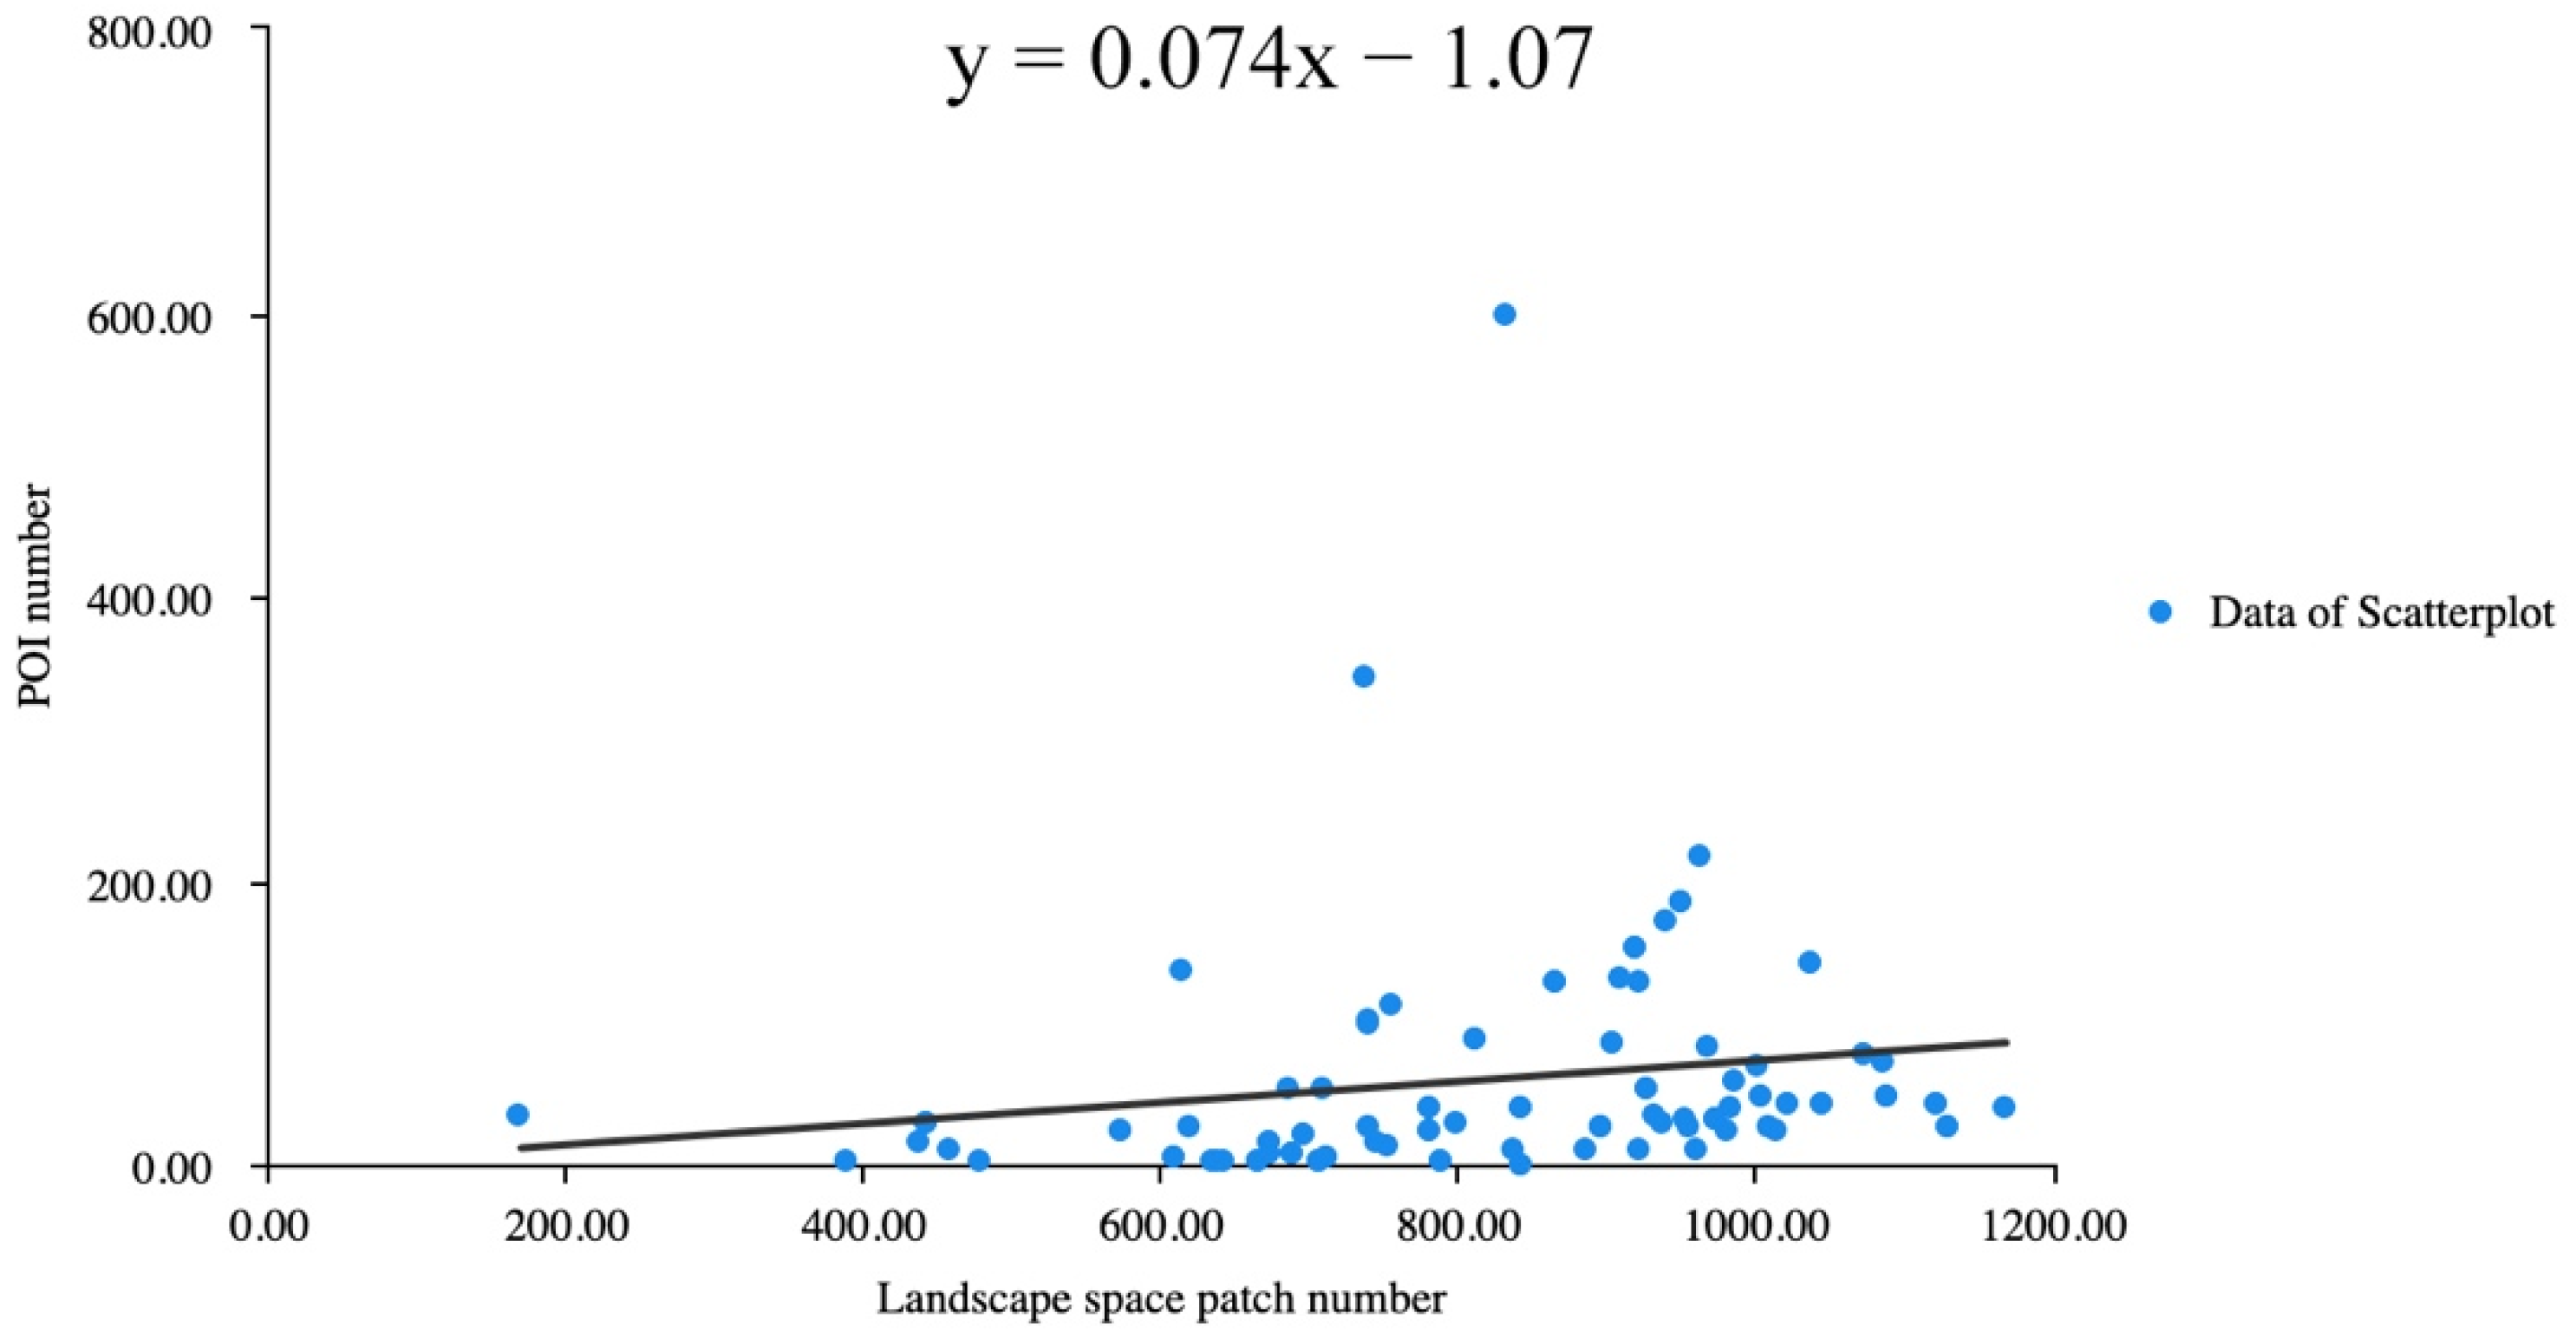
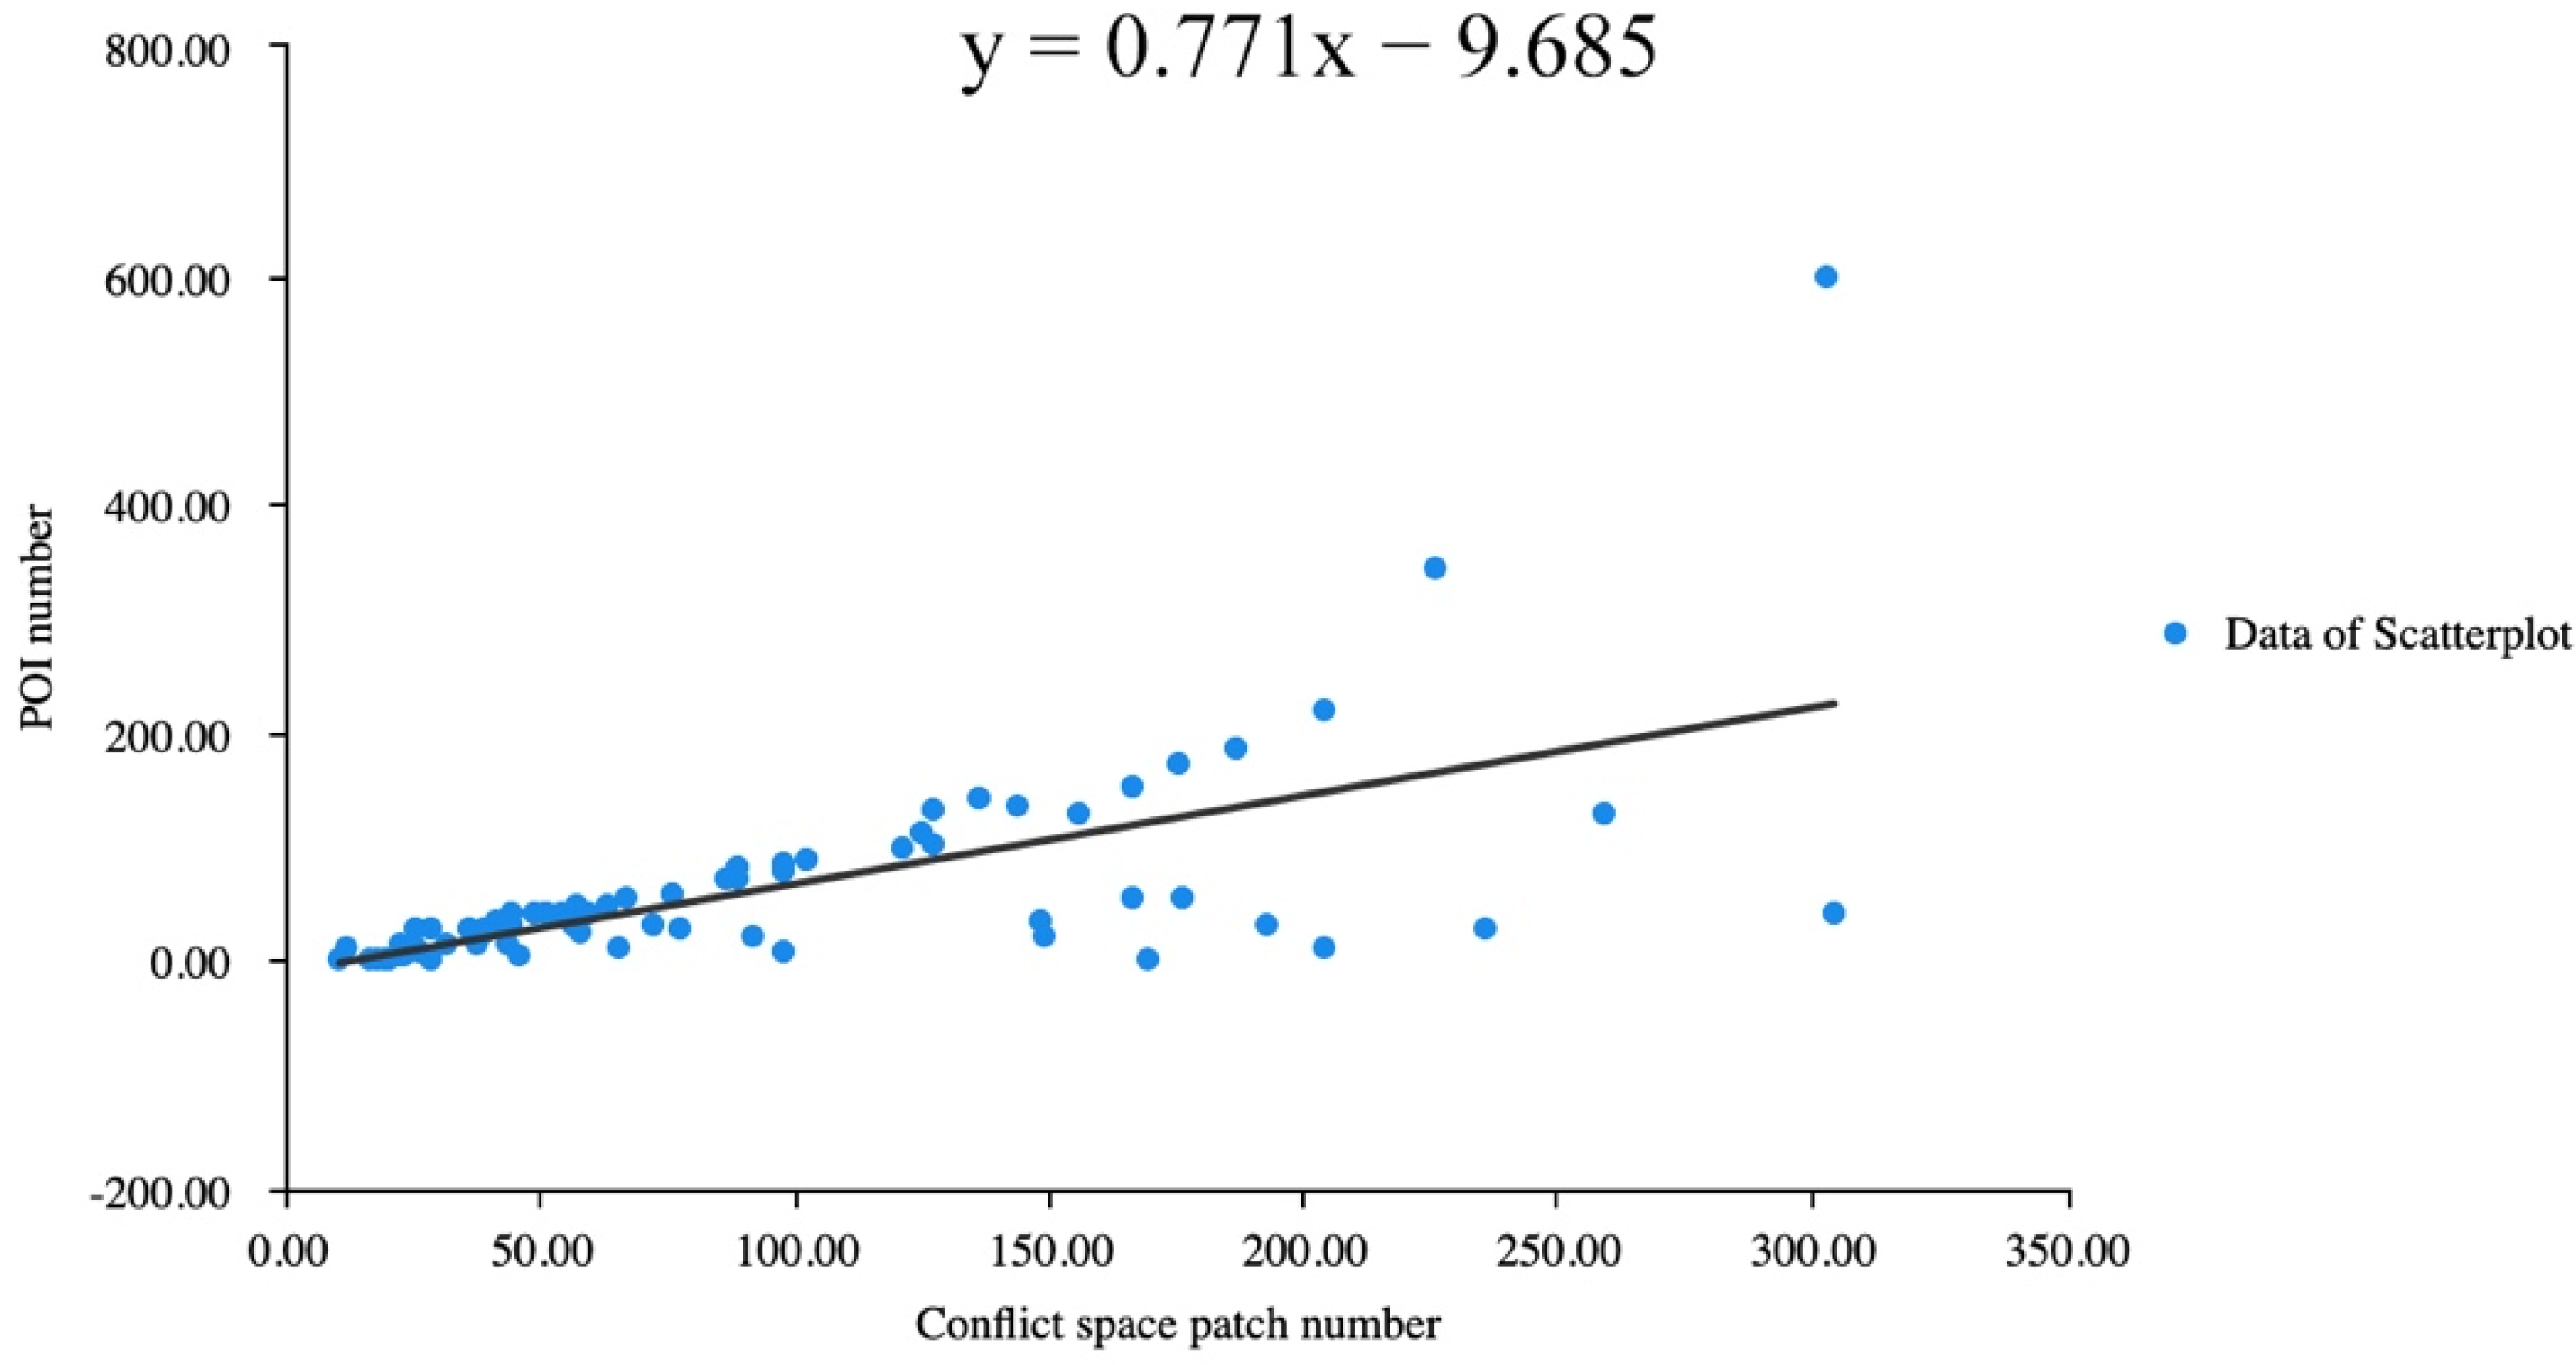
3.3.2. Correlation Analysis

From Table 4, the correlation analysis was used to investigate the correlation between the POI number and the open space patch number, landscape space patch number, and conflict space patch number, respectively, and the Pearson correlation coefficient was used to indicate the strength of the correlation.
More specifically, the correlation coefficient between the POI number and the open space patch number was −0.403 and showed significance at the 0.01 level, thus indicating that there was a significant negative correlation between the POI number and the open space patch number. The correlation coefficient between the POI number and the landscape space patch number is 0.166, which is close to 0, and the p-value is 0.158 > 0.05, thus indicating that there is no correlation between the POI number and the landscape space patch number. The correlation coefficient between the POI number and the conflict space patch number was 0.641 and showed significance at the 0.01 level, thus indicating that there is a significant positive correlation between the POI number and the conflict space patch number.

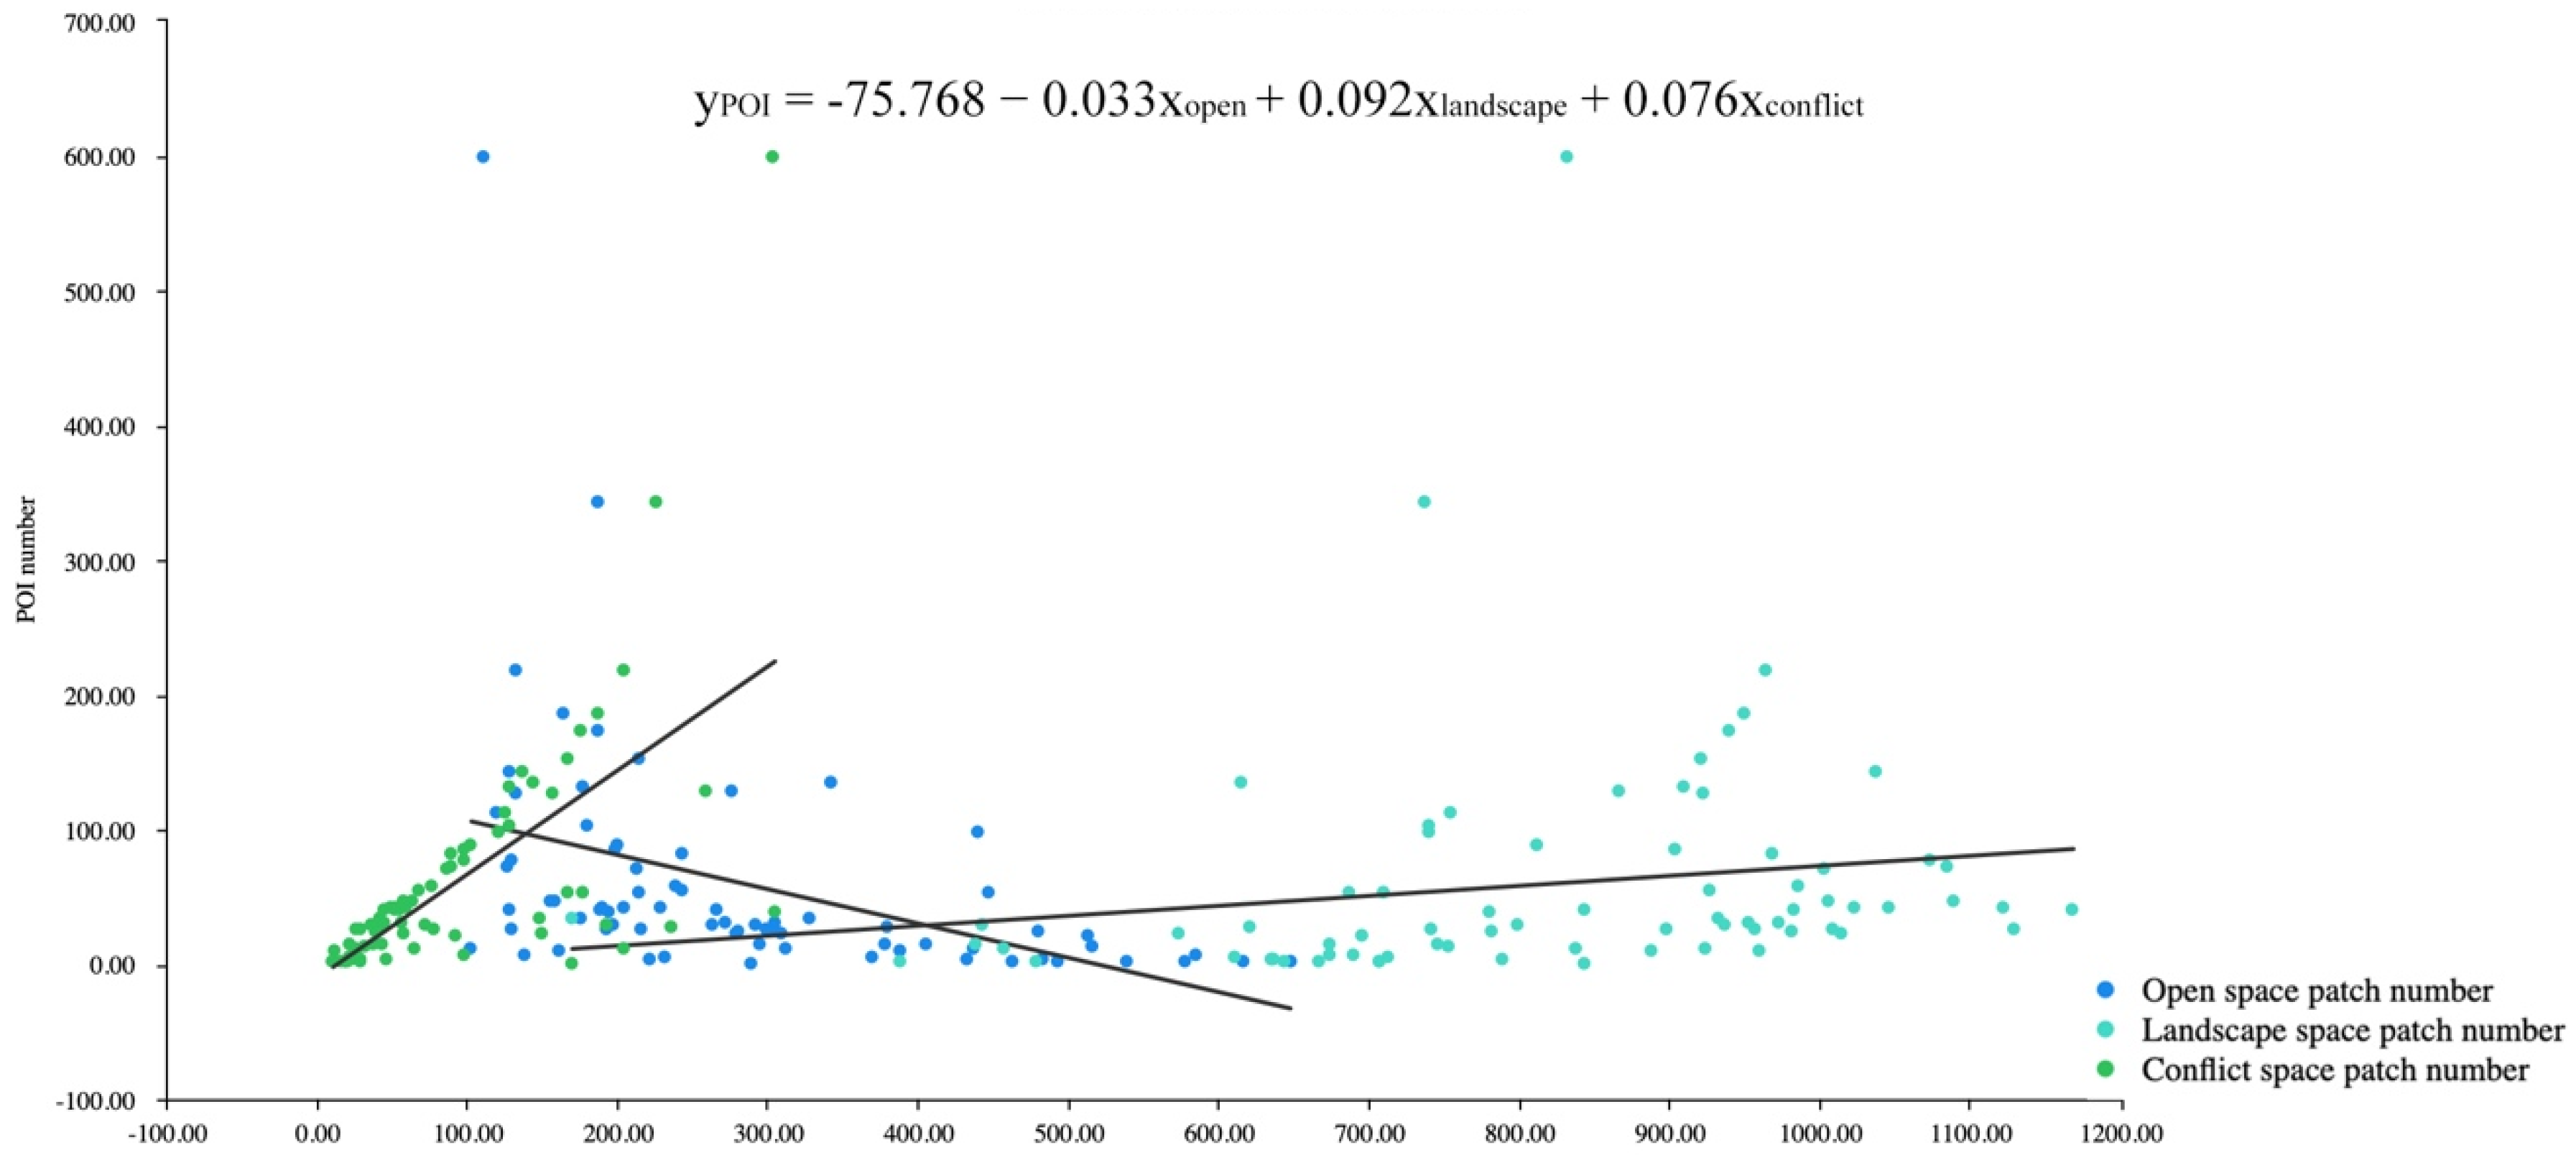
3.3.3. Regression Model

From Table 5, the open space patch number, landscape space patch number, and conflict space patch number are used as independent variables. In contrast, the POI number is used as the dependent variable for the linear regression analysis from the above table, and it can be seen that the model equation is: POI number = −75.768 – 0.033 × Open space patch number + 0.092 × Landscape space patch number + 0.769 × Conflict space patch number, and the model R-squared value is 0.464, implying that the open space patch number, landscape space patch number, and conflict space patch number can explain 46.4% of the variation in the POI number. When the F-test was performed on the model, it was found that the model passed the F-test (F = 20.236, p = 0.000 < 0.05), which means that at least one of the open space patch number, landscape space patch number, conflict space patch number would have an effect on the POIs. In addition, the multiple covariances of the model were tested and it was found that all the VIF values in the model were less than 5, implying that there was no covariance problem, and the D-W values were around the number 2, thus indicating that there was no autocorrelation in the model, there was no correlation between the sample data, and the model was good. The final analysis shows that:
  • The regression coefficient value for the open space patch number is −0.033 (t =−0.469, p = 0.640 > 0.05), meaning that the open space patch number does not have an effect on the POI number.
  • The regression coefficient value for the landscape space patch number was 0.092 (t = 2.035, p = 0.046 < 0.05), implying that the landscape space patch number has a significant positive effect on the POI number.
  • The regression coefficient value for the conflict space patch number was 0.769 (t = 6.282, p = 0.000 < 0.01), implying that the conflict space patch number would have a significant positive influence on the POI number.
To sum up the analysis, it can be seen that the landscape space patch number and the conflict space patch number will have a significant positive influence on the POI number. However, the open space patch number does not affect the POI number.
The mathematical formula for catering POIs and urban space can be summarized as follows:
S Food   POI = 75.768 0.033 a open + 0.092 a landscape + 0.769 a conflict
As Figure 12, Figure 13, Figure 14 and Figure 15 show, the linear fit formula for scattered data is the POI number = 132.012 − 0.255 × Open space patch number, with an R-squared value of 0.163. The POI number = −1.070 + 0.074 × the number of patches in the landscape space with an R-squared value of 0.028. The POI number = −9.685 + 0.771 × the number of patches in the conflict space with an R-squared value of 0.410.
From the formula, we can find that the open space has a limited impact on the catering POI distribution. Based on the regression coefficients, the ratio of landscape to factor conflict can be calculated as follows:
γ = 0.769 0.092 = 8.36
The results show that each additional unit of landscape space is accompanied by an increase of 8.36 units of conflict space. Such an approach to spatial planning contributes to the city’s restaurant sector’s development and food-led neighborhood planning. Considering urban space distribution from the perspective of the urban food system shows a strong connection to restaurant distribution and influences on human-caused greenhouse gas emissions.

4. Conclusions

As a representation of urban culture, food strongly relates to urban public space and human behaviors. It is an irreplicable and significant factor in the urban built environment. The relationship between food facilities and urban areas is a valuable question to both urban planners and researchers. At the same time, the quantitative combination of the restaurant industry and space offers new ways of thinking about the relationship and behavioral patterns of people and space in the context of global climate change and urban processes. Catering distribution plays a significant part in urban sustainability development, especially in urban land use planning. The density of catering POIs is connected to the urban types in this study.
Through the visualization and evaluation of catering POIs, a high-density food center map is generated by ArcGIS. Next, based on the theory of urban public space and landscape ecology, this research defines, classifies, and analyzes the potential urban patch (open p-patch, landscape p-patch, and conflict p-patch) and maps the patches quantitatively in Inner London. The principles of classification include four factors: pavement, green coverage, land area, and waterbody. Afterward, the research zooms into a specific area to illustrate the classification processing. Next, a colorful patch map is created based on the image recognition method.
A 1000 m influence range can be used to create buffer zones for each high-density food center after calculating the numbers of catering POIs and the three types of P-Patches. This established a logistic regression model of the catering POI and P-Patch numbers to present the relationship and relevance between space and food. As a result of the regression model, urban conflict spaces and landscape spaces significantly impact the distribution of restaurants relative to open spaces. Landscape and conflict spaces positively affect increases in the number of restaurants. According to the regression coefficients, the effect of conflict space is more significant. For urban and landscape planners, appropriately increasing the planning area of conflict space and landscape space is beneficial to the planning of food cities and communities. The study further calculated and summarized the regression formulae and scale coefficients to explore the scaling laws for the two types of spaces. The landscape space represented by blue-green space and the conflict space represented by buildings and structures meet 1:8.36, facilitating spatial planning by planners and urban researchers in food-led communities. At the technical level, this research progressively uses ArcGIS, Python data crawling, image recognition, SPSS Statistics, and R Studio linear regression.
There are several limitations to this study. Due to the extensive study area and the limited clarity of the satellite images, there are some inaccuracies in the segmentation of satellite images by supervised machine learning, which may lead to spatial definition errors to some extent. In addition, there will be some errors in the cell calculations due to edges being cut. Further, for the definition of urban space, the study only divided it into three categories and did not classify open space in more detail, nor did it differentiate between categories such as green space and blue space for the classification of landscape space. Pre-existing classification criteria may lead to limitations in the results of the study.
This study was carried out at the Inner London scale, and further research is expected to be carried out in more depth at the regional or neighborhood scales. The image segmentation and machine learning methods can contribute to larger scales than neighborhood scales, as well as other urbanism-related research directions. This research explores the proportions of the various types of space that can be used to better develop food-led cities and communities. Urban potential patches provide the spatial basis for the planning and design of food corridors. Food and urban space influence the city’s planning and development. The results of this research can help urban planners, researchers, and policymakers rethink the urban space and foodscapes within neighborhoods to increase food choices, improve general health, and reduce vehicle emissions by promoting walking activities.

Author Contributions

Conceptualization, Y.Z., X.L., Q.J. and M.C.; methodology, Y.Z., L.L. and M.C.; software, M.C. and Q.J.; validation, X.L., Y.Z. and M.C.; formal analysis, Y.Z. and M.C.; investigation, Y.Z., Q.J., X.L. and M.C.; resources, Y.Z., X.L., Q.J. and M.C.; data curation, Y.Z. and M.C.; writing—original draft preparation, Y.Z., Q.J., X.L. and M.C.; writing—review and editing, Y.Z. and M.C.; visualization, M.C.; supervision, Y.Z., L.L. and M.C.; project administration, Y.Z. and L.L. All authors have read and agreed to the published version of the manuscript.

Funding

This research received no external funding.

Institutional Review Board Statement

Not applicable.

Informed Consent Statement

Informed consent was obtained from all subjects involved in the study.

Data Availability Statement

Not applicable.

Conflicts of Interest

The authors declare no conflict of interest.

References

  1. Pielke, R.A.; Adegoke, J.O.; Chase, T.N.; Marshall, C.H.; Matsui, T.; Niyogi, D. A New Paradigm for Assessing the Role of Agriculture in the Climate System and in Climate Change. Agric. For. Meteorol. 2007, 142, 234–254. [Google Scholar] [CrossRef]
  2. Parham, S. Exploring Food and Urbanism. J. Urban. Int. Res. Placemaking Urban Sustain. 2020, 13, 1–12. [Google Scholar] [CrossRef]
  3. Moragues-Faus, A.; Morgan, K. Reframing the Foodscape: The Emergent World of Urban Food Policy. Environ. Plan. Econ. Space 2015, 47, 1558–1573. [Google Scholar] [CrossRef]
  4. Hanser, A. Good Food in the City: How Cultural Ideas About Food Shape Street Vending Regulation. Int. J. Urban Reg. Res. 2021, 45, 519–534. [Google Scholar] [CrossRef]
  5. Hashemnezhad, H.; Heidari, A.A.; Mohammad Hoseini, P. Sense of Place” and “place Attachment. Int. J. Archit. Urban Dev. 2013, 3, 5–12. [Google Scholar]
  6. Frank, L.D.; Appleyard, B.S.; Ulmer, J.M.; Chapman, J.E.; Fox, E.H. Comparing Walkability Methods: Creation of Street Smart Walk Score and Efficacy of a Code-Based 3D Walkability Index. J. Transp. Health 2021, 21, 101005. [Google Scholar] [CrossRef]
  7. Ewing, R.; Handy, S. Measuring the Unmeasurable: Urban Design Qualities Related to Walkability. J. Urban Des. 2009, 14, 65–84. [Google Scholar] [CrossRef]
  8. Greater London Authority. The London Food Strategy: Healthy and Sustainable Food for London; Greater London Authority: London, UK, 2018; p. 64. [Google Scholar]
  9. Goudie, S.; McIntyre, Z. A Crisis within a Crisis: The Impact of COVID-19 on Household Food Security; The Food Foundation: London, UK, 2021. [Google Scholar]
  10. Liu, K.; Yin, L.; Lu, F.; Mou, N. Visualizing and Exploring POI Configurations of Urban Regions on POI-Type Semantic Space. Cities 2020, 99, 102610. [Google Scholar] [CrossRef]
  11. Gao, S.; Janowicz, K.; Couclelis, H. Extracting Urban Functional Regions from Points of Interest and Human Activities on Location-Based Social Networks: GAO et al. Trans. GIS 2017, 21, 446–467. [Google Scholar] [CrossRef]
  12. Frank, L.D.; Fox, E.H.; Ulmer, J.M.; Chapman, J.E.; Kershaw, S.E.; Sallis, J.F.; Conway, T.L.; Cerin, E.; Cain, K.L.; Adams, M.A.; et al. International Comparison of Observation-Specific Spatial Buffers: Maximizing the Ability to Estimate Physical Activity. Int. J. Health Geogr. 2017, 16, 4. [Google Scholar] [CrossRef] [Green Version]
  13. Logan, T.M.; Hobbs, M.H.; Conrow, L.C.; Reid, N.L.; Young, R.A.; Anderson, M.J. The X-Minute City: Measuring the 10, 15, 20-Minute City and an Evaluation of Its Use for Sustainable Urban Design. Cities 2022, 131, 103924. [Google Scholar] [CrossRef]
  14. Swanwick, C.; Dunnett, N.; Woolley, H. Nature, Role and Value of Green Space in Towns and Cities: An Overview. Built Environ. 2003, 29, 94–106. [Google Scholar] [CrossRef]
  15. Ahern, J. Planning for an Extensive Open Space System: Linking Landscape Structure and Function. Landsc. Urban Plan. 1991, 21, 131–145. [Google Scholar] [CrossRef]
  16. Maruani, T.; Amit-Cohen, I. Open Space Planning Models: A Review of Approaches and Methods. Landsc. Urban Plan. 2007, 81, 1–13. [Google Scholar] [CrossRef]
  17. Wolch, J.R.; Byrne, J.; Newell, J.P. Urban Green Space, Public Health, and Environmental Justice: The Challenge of Making Cities ‘Just Green Enough’. Landsc. Urban Plan. 2014, 125, 234–244. [Google Scholar] [CrossRef] [Green Version]
  18. Gunawardena, K.R.; Wells, M.J.; Kershaw, T. Utilising Green and Bluespace to Mitigate Urban Heat Island Intensity. Sci. Total Environ. 2017, 584–585, 1040–1055. [Google Scholar] [CrossRef]
  19. Shen, X.; Chen, M.; Ge, M.; Padua, M.G. Examining the Conceptual Model of Potential Urban Development Patch (PUDP), VOCs, and Food Culture in Urban Ecology: A Case in Chengdu, China. Atmosphere 2022, 13, 1369. [Google Scholar] [CrossRef]
  20. Wang, J. Unsupervised Machine Learning in Urban Studies: A Systematic Review of Applications. Cites 2022, 129, 103925. [Google Scholar] [CrossRef]
  21. Urech, P.R.W.; Dissegna, M.A.; Girot, C.; Grêt-Regamey, A. Point Cloud Modeling as a Bridge between Landscape Design and Planning. Landsc. Urban Plan. 2020, 203, 103903. [Google Scholar] [CrossRef]
  22. Park, K.; Ewing, R. The Usability of Unmanned Aerial Vehicles (UAVs) for Measuring Park-Based Physical Activity. Landsc. Urban Plan. 2017, 167, 157–164. [Google Scholar] [CrossRef]
  23. Ibrahim, M.R.; Haworth, J.; Cheng, T. Understanding Cities with Machine Eyes: A Review of Deep Computer Vision in Urban Analytics. Cities 2020, 96, 102481. [Google Scholar] [CrossRef]
  24. Cao, R.; Zhu, J.; Tu, W.; Li, Q.; Cao, J.; Liu, B.; Zhang, Q.; Qiu, G. Integrating Aerial and Street View Images for Urban Land Use Classification. Remote Sens. 2018, 10, 1553. [Google Scholar] [CrossRef] [Green Version]
  25. Park, K.; Christensen, K.; Lee, D. Unmanned Aerial Vehicles (UAVs) in Behavior Mapping: A Case Study of Neighborhood Parks. Urban For. Urban Green. 2020, 52, 126693. [Google Scholar] [CrossRef]
  26. Han, S.; Ren, F.; Wu, C.; Chen, Y.; Du, Q.; Ye, X. Using the TensorFlow Deep Neural Network to Classify Mainland China Visitor Behaviours in Hong Kong from Check-in Data. ISPRS Int. J. Geo-Inf. 2018, 7, 158. [Google Scholar] [CrossRef] [Green Version]
  27. Biljecki, F.; Ito, K. Street View Imagery in Urban Analytics and GIS: A Review. Landsc. Urban Plan. 2021, 215, 104217. [Google Scholar] [CrossRef]
  28. Jacobs, J. The Death and Life of Great American Cities; Jonathan Cape: London, UK, 1962. [Google Scholar]
  29. Canter, D. The Psychology of Place; Architectural Press: London, UK, 1977; ISBN 978-0-85139-532-6. [Google Scholar]
  30. Lynch, K. Good City Form; Reprint edition; The MIT Press: Cambridge, MA, USA, 1984; ISBN 978-0-262-62046-8. [Google Scholar]
  31. Montgomery, J. Making a City: Urbanity, Vitality and Urban Design. J. Urban Des. 1998, 3, 93–116. [Google Scholar] [CrossRef]
  32. Bianchini, F. The Crisis of Urban Public Social Life in Britain: Origins of the Problem and Possible Responses. Plan. Pract. Res. 1990, 5, 4–8. [Google Scholar] [CrossRef]
  33. Jacobs, A.B. Great Streets; MIT Press: Cambridge, MA, USA, 1995; ISBN 978-0-262-60023-1. [Google Scholar]
  34. Wang, L.; Ge, M.; Chen, N.; Ding, J.; Shen, X. An Evaluation Model of Riparian Landscape: A Case in Rural Qingxi Area, Shanghai. Land 2022, 11, 1512. [Google Scholar] [CrossRef]
  35. Cui, X.; Ge, M.; Shen, X. Application of Comprehensive Evaluation in New-Product-Development Evaluation: The Case of Landscape-Architectural Outdoor Wooden Furnishing. Forests 2022, 13, 1552. [Google Scholar] [CrossRef]
  36. Shen, X. Identifying the Role of Technology within the Discipline of 21st Century Landscape Architecture. Des. J. 2022. [Google Scholar] [CrossRef]
  37. Shen, X.; Handel, S.N.; Kirkwood, N.G.; Huang, Y.; Padua, M.G. Locating the Responsive Plants for Landscape Recovery: A Toolkit for Designers and Planners. Ecol. Restor. 2022, 40, 33–35. [Google Scholar] [CrossRef]
  38. Shen, X.; Ge, M.; Wang, Q.; Padua, M.; Chen, D. Restoring, Remaking and Greening Freshwater Ecosystems: A Review of Projects in China. Ecol. Restor. 2022, 40, 172–178. [Google Scholar] [CrossRef]
  39. Juhász, L.; Hochmair, H.H. Cross-Linkage between Mapillary Street Level Photos and OSM Edits. In Proceedings of the Geospatial Data in a Changing World; Sarjakoski, T., Santos, M.Y., Sarjakoski, L.T., Eds.; Springer International Publishing: Cham, Switzerland, 2016; pp. 141–156. [Google Scholar] [CrossRef]
  40. Brunsdon, C. Estimating Probability Surfaces for Geographical Point Data: An Adaptive Kernel Algorithm. Comput. Geosci. 1995, 21, 877–894. [Google Scholar] [CrossRef]
Figure 1. Research Process.
Atmosphere 13 02128 g001
Figure 2. Catering POI distribution by borough.
Atmosphere 13 02128 g002
Figure 3. The Kernel Density (geometrical interval).
Atmosphere 13 02128 g003
Figure 4. The 1000 m buffers of 74 high-density food hubs.
Atmosphere 13 02128 g004
Figure 5. The machine learning flow of image segmentation.
Atmosphere 13 02128 g005
Figure 6. Result of image segmentation.
Atmosphere 13 02128 g006
Figure 7. Open space distribution map based on image segmentation.
Atmosphere 13 02128 g007
Figure 8. Landscape space distribution map based on image segmentation.
Atmosphere 13 02128 g008
Figure 9. Conflict space distribution map based on image segmentation.
Atmosphere 13 02128 g009
Figure 10. Data resampling (fishnet partial zoom-in).
Atmosphere 13 02128 g010
Figure 11. The boxplot of ‘All space patch number & POI number’.
Atmosphere 13 02128 g011
Figure 12. The scatter result of the ‘Open space patch number and POI number’.
Atmosphere 13 02128 g012
Figure 13. The scatter result of the ‘Landscape space patch number and POI number’.
Atmosphere 13 02128 g013
Figure 14. The scatter result of the ‘Conflict space patch number and POI number’.
Atmosphere 13 02128 g014
Figure 15. The scatter result of ‘All space patch number and POI number’.
Atmosphere 13 02128 g015
Table 1. Catering POI frequency by boroughs.
FrequencyPercentValid PercentCumulative Percent
BoroughCamden56210.4%10.4%10.4%
City of London3316.1%6.1%16.5%
Greenwich991.8%1.8%18.3%
Hackney2514.6%4.6%22.9%
Hammersmith and Fulham3266.0%6.0%28.9%
Islington4358.0%8.0%36.9%
Kensington and Chelsea5119.4%9.4%46.4%
Lambeth3766.9%6.9%53.3%
Lewisham1592.9%2.9%56.2%
Southwark2975.5%5.5%61.7%
Tower Hamlets3566.6%6.6%68.3%
Wandsworth4578.4%8.4%76.7%
Westminster126423.3%23.3%100.0%
Total5424100.0%100.0%
Table 2. Categorization of P-Patch.
Open P-PatchCitizens’ commuting and essential leisure functions space, including plazas, corner squares, extra roadways, extended pavement spaces, etc.
Landscape P-PatchGreen and blue infrastructure, including green space, public grass, roof garden, border tree space, pocket park, isolated greening space, etc.
Conflict P-PatchBuildings and to-be-developed space or the excessive gray space between buildings and outdoors, including parking space, under-structure area, useless corner area, etc.
Table 3. Descriptive statistics high-density centers of POI number and P-Patch.
Center IDPOI NumberOpen Space Patch Number Landscape Space Patch Number Conflict Space Patch Number All
032272972561300
112312923651300
241691187441300
3242281014581300
4272151008771300
5712121002861300
6301121116721300
785981004981200
81281329221561210
9432041045511300
1032304952441300
11432281023491300
12343878372261150
13542141010761300
1413614210141441300
151291759661591300
16891498111021062
171532149201661300
181731869391751300
19599419313031275
201861649491871300
212181329642041300
2214312710371361300
23541471087661300
2411367806125998
25731261085891300
2641128843541025
274432636461114
28281791020361235
299913910401211300
30212131055321300
3129197799361032
3241266983511300
331327610091271212
3411388887251300
35623171222965
36351271132411300
378425849261300
381629443843775
394483789281300
40431191122591300
4127305956391300
42422163523879
433462706281196
441588693191300
4515317946371300
4625280981391300
4727278997251300
4823199773491021
4916405873221300
5012437838251300
5114416853311300
52253838820946
535369610221001
54249247819989
5512102457204763
563475269148492
571031797391271045
58713867398909
593616666181300
603477807161300
6183243968891300
6259239985761300
634017410001041278
6455243926671236
65481551088571300
6625480781391300
6730262442193897
68481581005631226
69771291073981300
70271291129421300
712647643101300
722719374128962
7311161959121132
Table 4. Correlations analysis of high-density centers of POI numbers and P-Patches.
Correlations
POIOpenLandscapeConflict
POIPearson Correlation1−0.403 **0.1660.641 **
Sig. (2-tailed) <0.0010.158<0.001
N74747474
OpenPearson Correlation−0.403 **1−0.412 **−0.416 **
Sig. (2-tailed)<0.001 <0.001<0.001
N74747474
LandscapePearson Correlation0.166−0.412 **1−0.097
Sig. (2-tailed)0.158<0.001 0.411
N74747474
ConflictPearson Correlation0.641 **−0.416 **−0.0971
Sig. (2-tailed)<0.001<0.0010.411
N74747474
** Correlation is significant at the 0.01 level (2-tailed).
Table 5. Regression coefficient table.
Coefficients
ModelUnstandardized CoefficientsStandardized CoefficientstSig.Collinearity Statistics
BStd. ErrorBetaToleranceVIF
(Constant)−75.76856.417 −1.3430.184
Open−0.0330.07−0.052−0.4690.640.621.613
Landscape0.0920.0450.2062.0350.0460.7431.346
Conflict0.7690.1220.6396.282<0.0010.741.352
Dependent Variable: POI
Publisher’s Note: MDPI stays neutral with regard to jurisdictional claims in published maps and institutional affiliations.

