

Evaluating Agronomic Onset Definitions in Senegal through Crop Simulation Modeling
by
 , , ,
, , ,
Eunjin Han
1,*,
Adama Faye
2,
Mbaye Diop
2,
Bohar Singh
3,
Komla Kyky Ganyo
4 and
Walter Baethgen
3 1
Adaptive Cropping Systems Laboratory, USDA-Agricultural Research Service, Beltsville, MD 20705, USA
2
Institut Sénégalais de Recherches Agricoles (ISRA), Route des Hydrocarbures, Bel Air, BP 1386, Dakar CP 18524, Senegal
3
International Research Institute for Climate and Society, Columbia University, 61 Route 9W Monell Building, Palisades, NY 10964, USA
4
Institut Togolais de Recherche Agronomique/Direction des Laboratoires (ITRA/DL), Lomé BP 1163, Togo
*
Author to whom correspondence should be addressed.
Atmosphere 2022, 13(12), 2122; https://doi.org/10.3390/atmos13122122
Submission received: 26 September 2022
/
Revised: 14 December 2022
/
Accepted: 15 December 2022
/
Published: 17 December 2022
(This article belongs to the Special Issue Toward Better Understanding and Prediction of Monsoon Onset and Withdrawal for Agricultural Sectors)
Abstract
:Rainfed agriculture in Senegal is heavily affected by weather-related risks, particularly timing of start/end of the rainy season. For climate services in agriculture, the National Meteorological Agency (ANACIM) of Senegal has defined an onset of rainy season based on the rainfall. In the field, however, farmers do not necessarily follow the ANACIM’s onset definition. To close the gap between the parallel efforts by a climate information producer (i.e., ANACIM) and its actual users in agriculture (e.g., farmers), it is desirable to understand how the currently available onset definitions are linked to the yield of specific crops. In this study, we evaluated multiple onset definitions, including rainfall-based and soil-moisture-based ones, in terms of their utility in sorghum production using the DSSAT–Sorghum model. The results show that rainfall-based definitions are highly variable year to year, and their delayed onset estimation could cause missed opportunities for higher yields with earlier planting. Overall, soil-moisture-based onset dates determined by a crop simulation model produced yield distributions closer to the ones by semi-optimal planting dates than the other definitions, except in a relatively wet southern location. The simulated yields, particularly based on the ANACIM’s onset definition, showed statistically significant differences from the semi-optimal yields for a range of percentiles (25th, 50th, 75th, and 90th) and the means of the yield distributions in three locations. The results emphasize that having a good definition and skillful forecasts of onset is critical to improving the management of risks of crop production in Senegal.
1. Introduction
The economy in West Africa heavily relies on rainfed agriculture and is thus highly vulnerable to the negative impact of climate change and variability [1]. Particularly, in Senegal, agriculture contributes to over 17% of the gross domestic product (GDP), and more than 70% of its population are employed in agriculture [2,3]. Weather-related risk, including the delayed onset or early cessation of the rainy season, erratic rainfall distribution, and dry spells, is the most predominant factor threatening agricultural production in Senegal [4]. The West African countries have limited adaptive capacities to the climate and/or weather-related risks due to the low level of fertilizer use, irrigation systems, mechanized cultivation, and other off-farm inputs [5,6]. Therefore, shifting planting dates is one of the most suitable approaches that smallholder farmers are relatively able to act upon to mitigate the risks of year-to-year climate variability. Delayed planting might lead to reduced yield by shortening the critical crop growth period, while planting too early has a risk of early crop failure and thus replanting when a long dry spell follows sowing [7,8]. Therefore, the onset dates of the rainy season for optimal planting were identified as essential information affecting farmers’ crop management decisions and for usable weather and climate information services in Senegal [3,9,10,11].
The onset of the West African monsoon has been analyzed and defined by many studies, as summarized in Fitzpatrick et al. [12] and Bombardi et al. [13]. The previous studies broadly defined onset at two scales: (1) regional and (2) local. The regional onset is mainly explained by the latitudinal shift of the intertropical convergence zone (ITCZ), but the timing of the onset of the local rainy season has a weak correlation with the ITCZ shifts [12]. The local onsets were defined solely based on daily rainfall observations and can be divided into meteorological and agronomic definitions [14]. The meteorological definitions are mainly based on the first rains, while the agronomic definitions take into account subsequent dry spells to guarantee enough soil moisture for successful germination and early crop development [14,15]. The meteorological approaches used only cumulative rainfall [16,17,18] or both cumulative and climatological mean daily rainfall [19,20]. The agronomic definitions have multiple variants with different thresholds for the duration of the first wet spell, rainfall amount during the wet spell, duration of the following dry spell, and the subsequent search period for the dry spell [8,15,21,22,23]. Some approaches explicitly used the water-holding capacity of different soil types to determine the rainfall requirement [24,25,26].
After comparing nine different onset definitions of the West African monsoon at both regional and local scales, Fitzpatrick et al. [12] concluded that there exist little correlation and harmony between local onsets and regional onsets and thus an improved understanding and prediction of the shifts of the ITCZ might not ensure a better prediction of local onsets, which are more relevant to farmers’ decisions. On the contrary, in an earlier study, Sultan et al. [6] showed the possibility of improving local millet production by linking the information on regional climate dynamics with crop modeling.
The development of skillful forecasts of monsoon onset should be oriented to meet the needs of end-users (e.g., farmers, extension workers or government policy/decision makers in the case of the agriculture sector) to become “usable” information. Although many studies have proposed different onset definitions for the West African monsoon, there has been little work evaluating the utility of the proposed definitions in terms of agricultural production and/or usefulness in helping agricultural climate risk management. To our knowledge, only Marteau et al. [14] and Sultan et al. [6] applied a crop simulation model, SARRAH, to assess the impact of different onset definitions on millet yield in Niger in the context of the West African monsoon.
In Senegal, the National Meteorological Agency (ANACIM) has been working on developing and delivering locally relevant weather and climate information for smallholder farmers in collaboration with the CGIAR Research Program on Climate Change, Agriculture and Food Security (CCAFS) since 2012 [10]. To provide usable monsoon onset forecasts, ANACIM has developed an agronomic definition of the onset as the first wet day of one or three consecutive days receiving at least 15 to 20 mm of rain without any 20-day dry spell during the following 30 days [27]. In the field, farmers may use their index finger to examine if the soil is wet enough to sow [28]. Extension workers use a rainfall-based criterion (e.g., rainfall > 20 mm) as the onset of the rainy season [Personal communication with ISRA]. In the meantime, the Institut Sénégalais de Recherches Agricoles (ISRA, Senegalese Institute of Agricultural Research) has been trying to develop crop-specific planting criteria [Personal communication with ISRA].
To close the gap between the parallel efforts by ANACIM (i.e., climate information producer) and ISRA (i.e., a climate information user), it is desirable to understand how the current ANACIM’s onset definition is linked to the obtained yield of specific crops in Senegal. In this study, we aimed to evaluate multiple local agronomic onset dates defined by ANACIM, Bombardi et al. [20], and soil-moisture-based planting determined by the Decision Support System for Agrotechnology Transfer (DSSAT)–Crop Environment Resource Synthesis (CERES)–Sorghum model, in terms of their utility for sorghum production. The evaluation was conducted by comparing full distributions of model simulated yields at four locations covering diverse climatic conditions in Senegal. Crop simulation models are effective tools that allow impractical, costly, and lengthy experiments in hypothetical environments to evaluate multiple management options. In evaluating the effect of planting dates on crop yields, hundreds of seasonal experiments/simulations at several locations with multiple planting dates in more than 30 years are possible only using crop simulation modeling. Considering its geographical popularity and importance in the food security of Senegal, sorghum was selected in the present study. The ultimate goal of this analysis is to contribute to defining an agriculture-relevant onset definition that could help to determine optimal planting dates and thus to improving ANACIM’s onset forecasting service to make it more usable. We envision this study stimulates co-production of usable weather and climate information between ANACIM and ISRA for the agricultural sector.
2. Materials and Methods
2.1. Sites and Meteorological Data
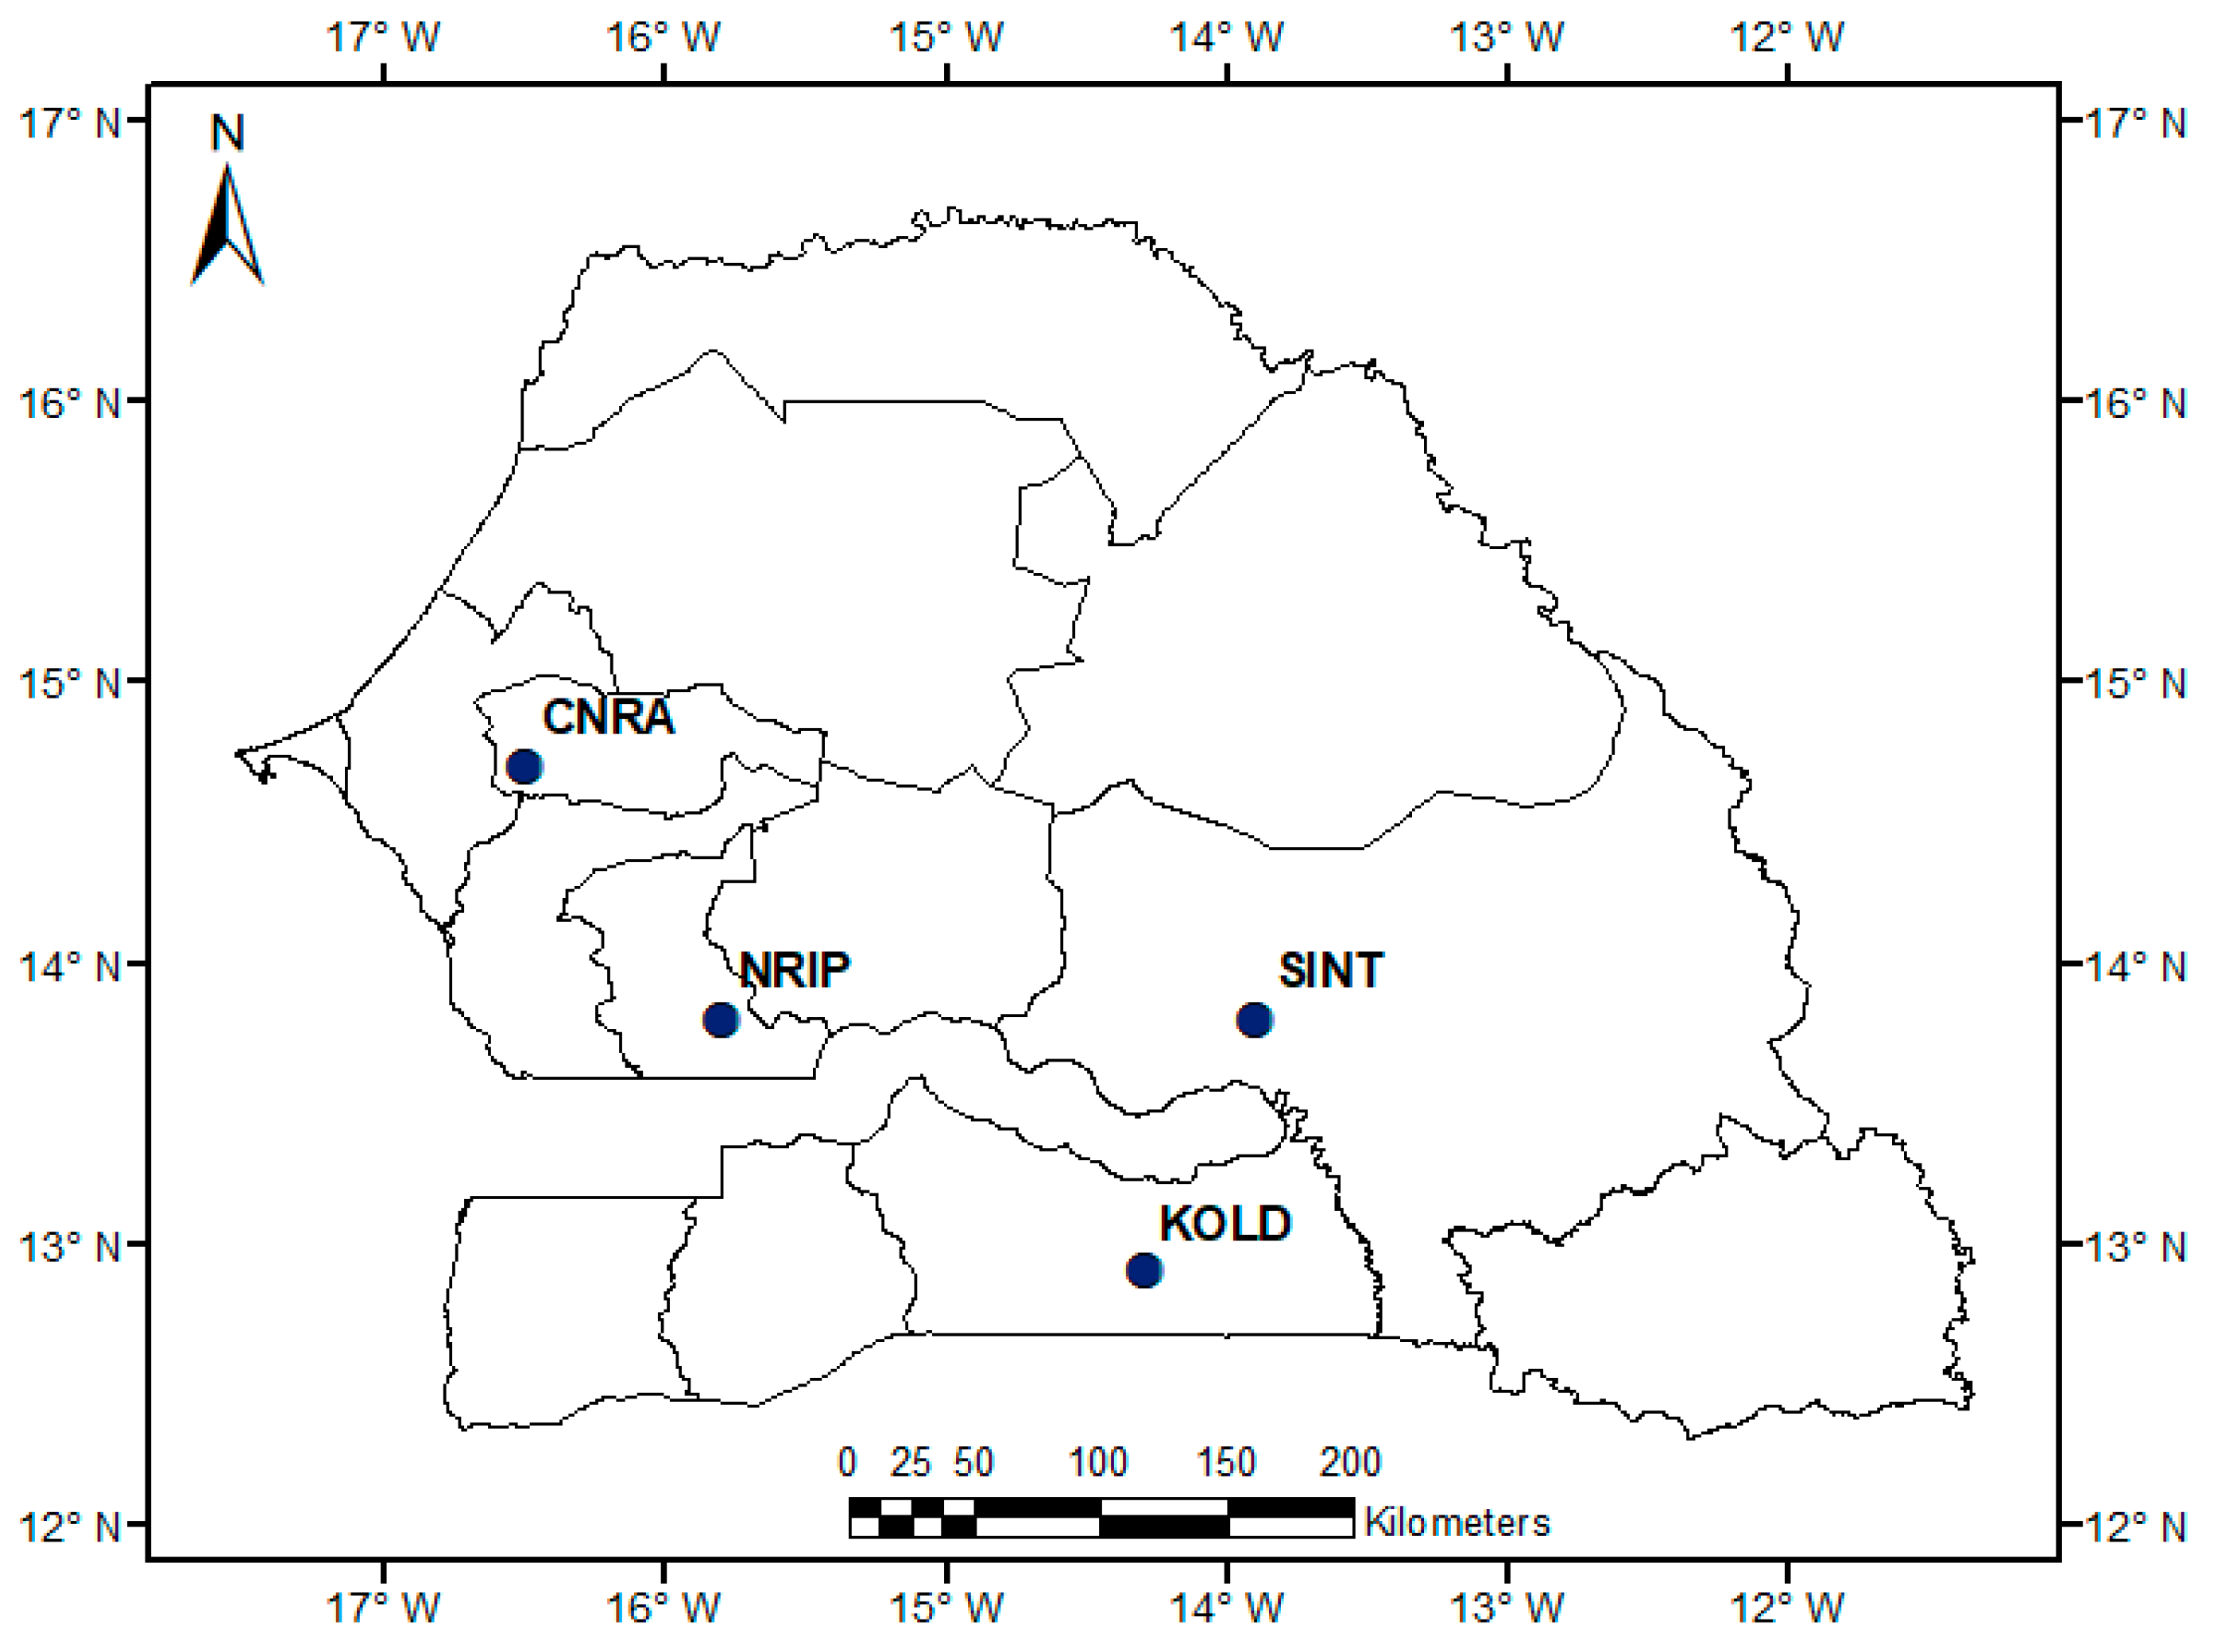
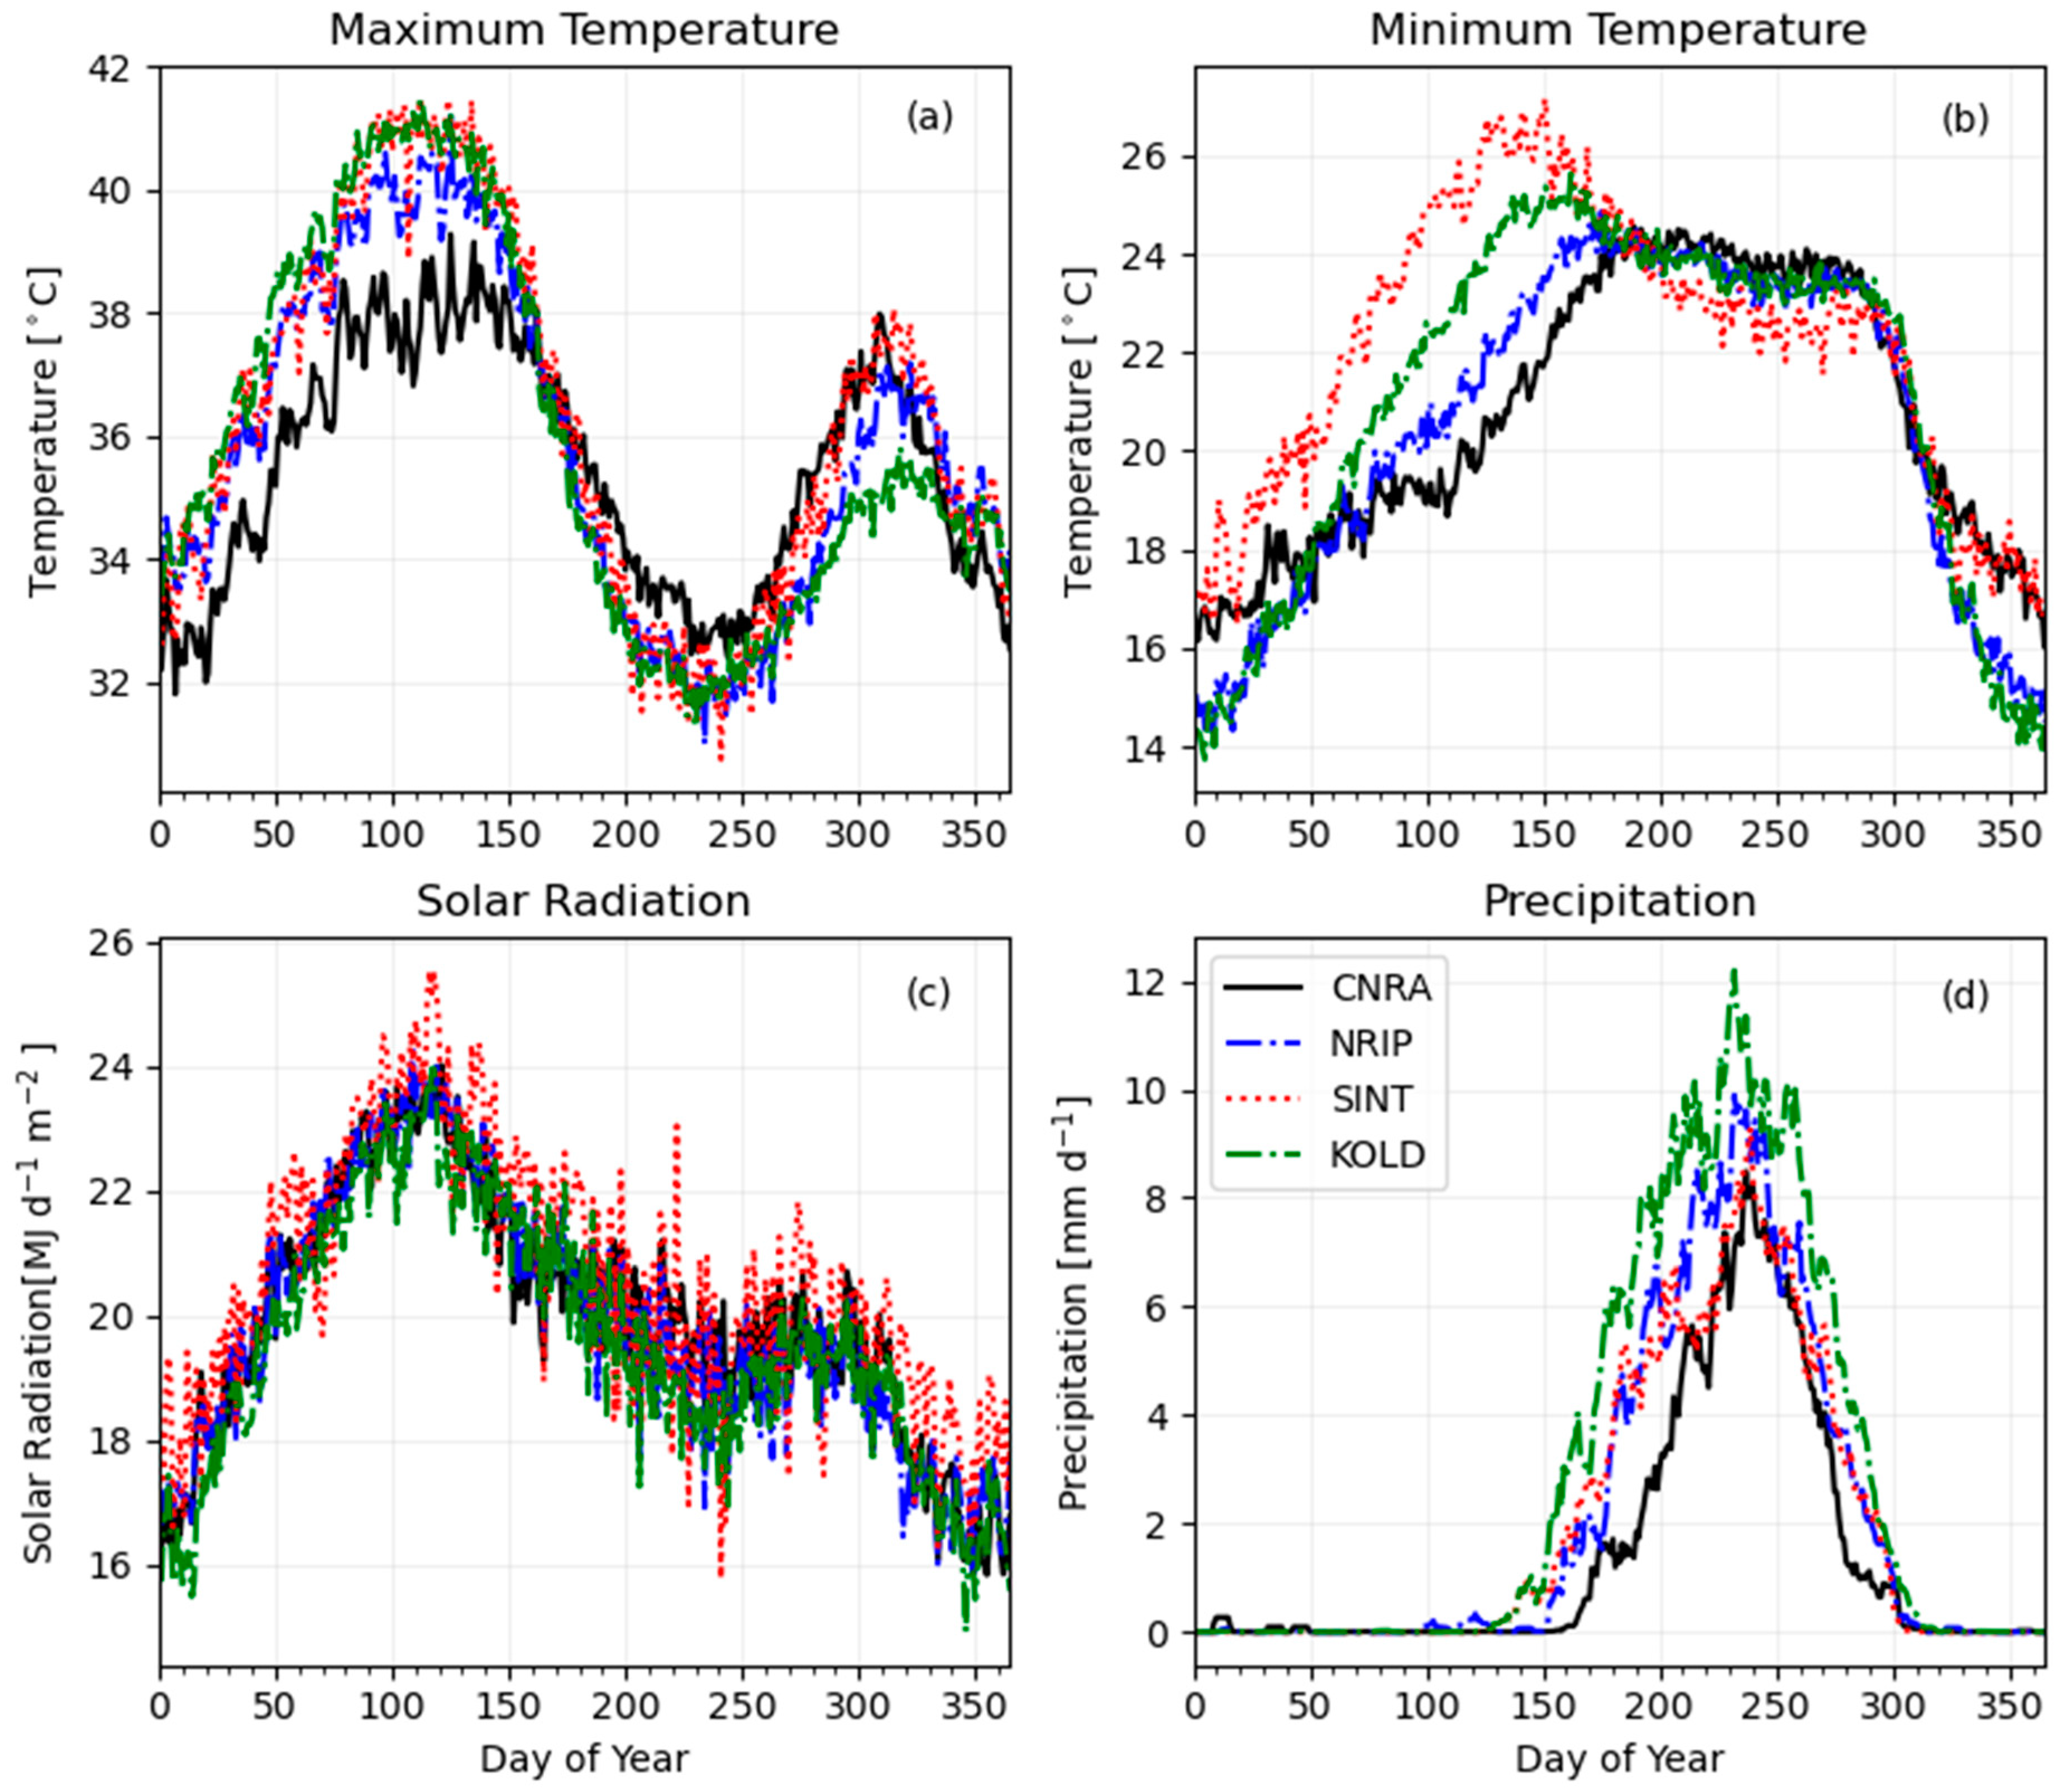
In this study, we selected ISRA’s four agricultural research experimental fields in Senegal: Bambey (14.71° N, 16.48° W), Nioro du Rip (13.76° N, 15.78° W), Sinthiou Malème (13.82° N, 13.9° W), and Kolda (12.88° N, 14.25° W), as shown in Figure 1. Long-term weather data (i.e., daily maximum and minimum temperature, solar radiation, and precipitation) from 1981 to 2015 were obtained from the ANACIM in order to define meteorological onsets and run the DSSAT–CERES–Sorghum model. Senegal is located in the Sudano-Sahelian climatic zone and has a unimodal rainfall distribution [29]. The mean annual rainfall gradually increases from the north (550 mm in Bambey) to the south (768 mm in Nioro du Rip, 755 mm in Sinthiou Malème and 996 mm in Kolda). At a large scale, the rainy season is governed by the West African monsoon and the movement of the ITCZ [30]. The length of the rainy season ranges from 3 months in the north to 5 months in the south (Figure 2d). Seasonal cycles of temperature and solar radiation show relatively lower values during the rainy season (Figure 2).
2.2. Rainfall-Based Onset Definitions
2.2.1. ANACIM’s Onset Definition
ANACIM’s onset definition is based on previous studies for the Western Sahel region, including Sivarkumar [22,31] and Marteau et al. [15]. Currently they define the agronomic onset as the first wet day of one or three consecutive days receiving at least 15 or 20 mm of rain without any 20-day dry spell during the following 30 days, starting from 1 May [27]. The threshold rainfall amount, 15 or 20 mm, is differentiated between the northern and the southern regions, respectively, separated by a straight line connecting Mbour-Diourbel-Matam. The 20 mm of rainfall threshold represents the minimum water requirement for crop survival, mainly based on the International Crops Research Institute for the Semi-Arid Tropics (ICRISAT)’s study on millet in Niger [15]. The post-onset dry spell is set to filter out false onsets that could damage germination and crop growth during the early stages. Compared to the 7-day dry spell in other studies [7,15,22,32], the ANACIM’s definition has a more relaxed criterion (i.e., 20 days).
2.2.2. Bombardi’s Onset Definition for Sub-Seasonal Onset Prediction
Another rainfall-based onset definition was adopted from Bombardi et al. [20] (BM hereafter), which defined the onset of a rainy season to capture a seasonal change in the precipitation regime by improving on Bombardi and Carvalho [33] and Liebmann and Marengo [34]. The onset date at a weather station is detected based on accumulated rainfall anomalies
where S(n) is the accumulated precipitation deviation from day t0 to day n. The daily deviation is calculated by subtracting the annual climatological precipitation rate (, mm day−1) from the rainfall at day i (). Precipitation anomalies averaged with 5-day running mean () are used to determine the onset. The first day when the first derivative of the smoothed curve is greater than 2.5 (dSm/dt > 2.5) is considered the onset of the year. Note that the threshold 2.5 was used to avoid a false onset due to the first insignificant rainfall, while Bombardi et al. [20] used the first day after the inflection point (dSm/dt > 0). The BM method was particularly applied by Singh et al. [35] to assess the predictability of monsoon onset over Senegal using sub-seasonal hindcast databases. The advantage of the BM method against the ANACIM’s onset definition is that it can be used for real-time forecasts because it does not require prior knowledge of weather for the coming 30 days to detect a false onset (i.e., 20-day dry spell after the onset).
2.3. Ex Ante Crop Simulation Experiments
2.3.1. Crop Modeling Setup and Validation
In Senegal, sorghum is one of the most important subsistence cereal crops after pearl millet and maize [36,37]. As a drought-tolerant crop, sorghum is grown in most regions of Senegal regardless of agroecological zones [38]. In the present study, we used the DSSAT–CERES–Sorghum model to (1) determine planting dates based on soil water content, (2) determine semi-optimal planting dates, and (3) evaluate various onset definitions in terms of the simulated sorghum yield. In setting up the model management inputs, we assumed planting dates as one day after the onset dates as determined either by rainfall or soil water content. Note that we assumed the agronomic onset dates corresponded to farmers’ planting dates. In other words, farmers tend to plant as early as possible when a rainy season starts, in order to secure enough crop growing period. However, actual planting on the fields is constrained by non-meteorological factors, including available labor, seeds and logistics.
The DSSAT–CERES–Sorghum model has been applied in several studies in Senegal (e.g., [38,39,40]). The DSSAT–Cropping System Model consists of primary modules for weather, management, soil, plant, and soil–plant–atmosphere, to simulate interactions between plants and environments [41,42]. Particularly, soil water content at each layer is updated daily by computing one-dimensional daily inflows (i.e., rainfall or irrigation through infiltration), outflows (i.e., soil evaporation, plant transpiration, root water uptake, and drainage), and upward unsaturated flow [41].
In this study, we followed all the field experiment setups in Ganyo et al. [43], except for inter-annually varying the planting dates. Recommended fertilizer practice (T2) is to apply 150 kg ha−1 of NPK (15-15-15) at emergence, 50 kg ha−1 of urea (46%) at tillering, and 50 kg ha−1 of urea at stem extension, as recommended by the Senegalese agricultural research institute (ISRA). This recommended practice was applied for the calibration and validation of the model performance. For multi-year simulations (1981–2015), fixed amounts of N fertilizer (22, 23 and 23 N kg ha−1) were applied at 6, 36 and 51 days after planting to follow the recommendation by ISRA (i.e., approximate emergence, tillering and stem extension growth stages). Major soil properties were also extracted from Ganyo et al. [43] (Table S1). All sites have very sandy soils with 80–95% of sand. Soil N level at the top 30 cm soil varied from 167 N kg ha−1 (‘N16-I’ experiment) to 235 N kg ha−1 (‘N16-R’ experiment).
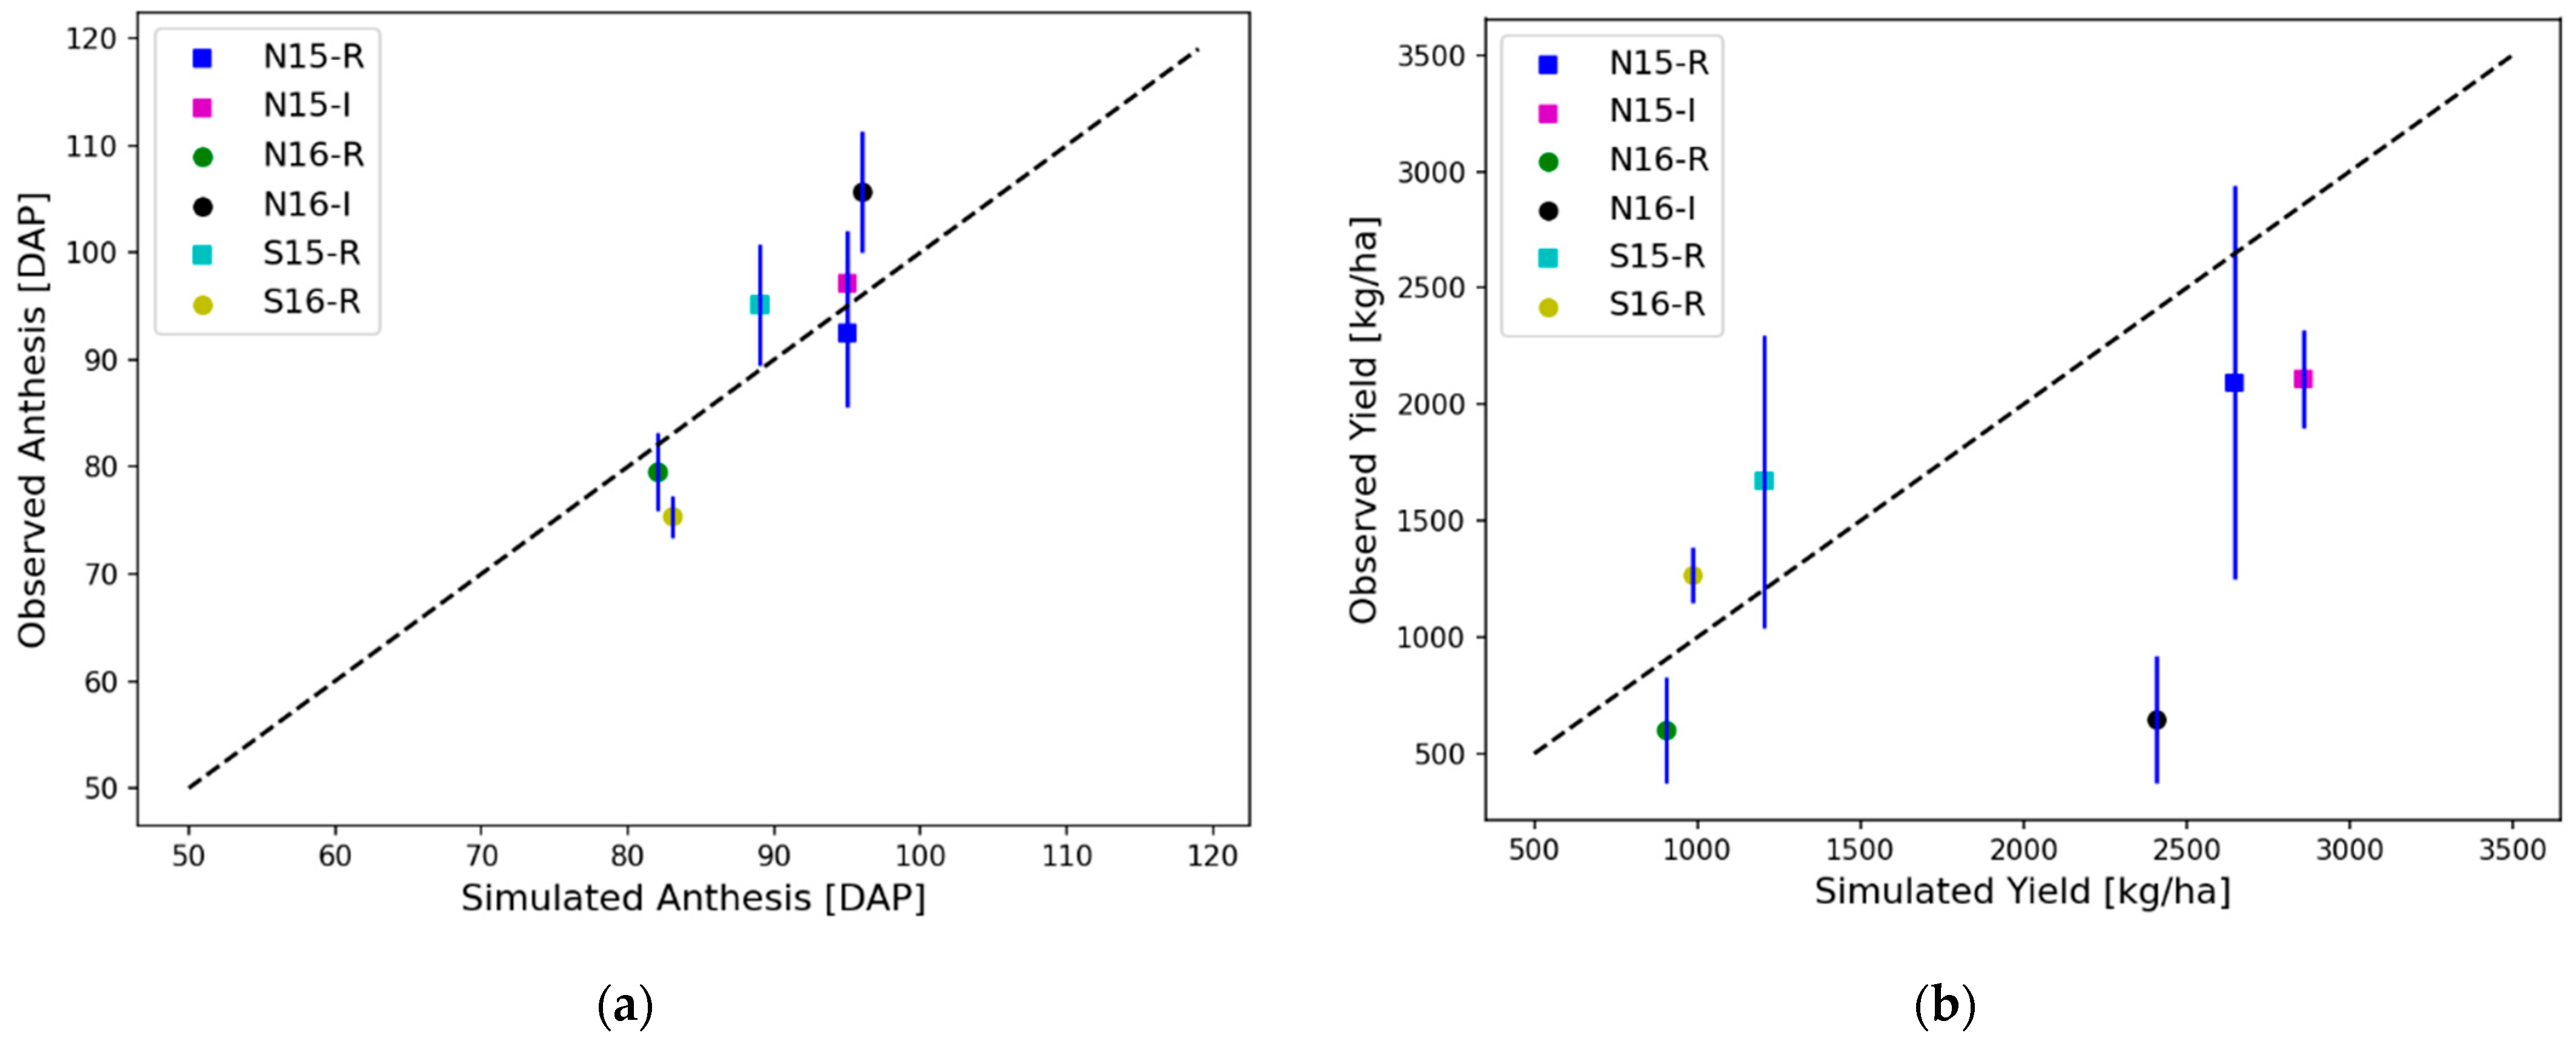
We used the genetic coefficients of Fadda, one of the most popular hybrids, as calibrated by Ganyo et al. [40,43,44] (Table S2). The calibration was based on the 2 years of field experimental data to see the effect of fertilization strategies on representative sorghum cultivars in Senegal. We further validated the calibrated sorghum model, focusing on the experiments with recommended fertilizer management. First, the performance of the calibrated model was evaluated by computing mean absolute error (MAE), root-mean-square error (RMSE), and normalized RMSE (nRMSE) (Equations (A1) and (A2)). The MAE, RMSE, and nRMSE for anthesis were 5, 6 days, and 6.6%, respectively. For the yield, the MAE, RMSE, and nRMSE were 685, 852 kg ha−1, and 60.9%, respectively. Due to small sample datasets (e.g., n ≤ 11), in this study, we considered an nRMSE ≤ 15% as “good” agreement; 15–30% as “moderate” agreement; and ≥ 30% as “poor” agreement [45,46,47]. Anthesis prediction of the model was in “good” agreement, being well-aligned along the 1:1 line in Figure 3. The yield prediction skill was poor (Figure 3b). However, the case of “Nioro du Rip 2016 Irrigated (N16-I)” had an unreasonably low yield in Figure 3b, lower than the national average sorghum grain yield in Senegal (i.e., 888 kg ha−1) despite supplemented irrigation (at least 30 mm per week) with a sufficient fertilizer amount [43]. Ganyo et al. [43] attributed the meager yield to the site’s low yield potential and fertilizer application timing. When the N16-I case was excluded, the nRMSE was improved to the “moderate” agreement, 30%. Note that high standard deviations (e.g., more than 1000 kg ha-1 in the case of S15-R and N15-R) in Figure 3b indicate considerable uncertainty in the yield measurements, even in well-controlled field experiments by ISRA, and thus difficulties in fitting the model-predicted yields to the observed.
Secondly, the model performance was validated by looking at the inter-annual variation of crop phenology. Simulated anthesis dates for the previous 35 years (1981–2015) were within the range of observed anthesis dates in Ganyo et al. [43] (74–113 days in Figure S1b). Most of the simulated maturity dates of Fadda in Figure S1c were also within the range of the medium maturing variety found in literature: 100–125 days in Ganyo et al. [43] and 100–135 days in Akinseye et al. [48]. Maturity dates were not recorded in the field experiments, but they estimated maturity dates as 25–30 days after flowering [44]. Figure S1d also shows that the durations between the simulated anthesis and maturity were around 25 days across the 35 years, with some exceptions. Note that photoperiod-sensitive local sorghum varieties in West Africa flower at approximately fixed dates for timely maturity, independent of widely varying planting dates, before the rainy season ends [49]. The DSSAT–Sorghum model accommodated the photoperiod sensitivity by adjusting the P2O and P2R coefficients in Table S2 [50,51].
2.3.2. Soil-Moisture-Based Onsets
The DSSAT’s automatic planting option allows finding planting dates within a user-specified time interval (i.e., reasonable planting window), when soil water content averaged over a specific depth (e.g., 30 cm) reaches a user-specified threshold. This study adopted the automatic planting option, rather than fixed planting dates, to determine the soil-moisture-based planting dates against the rainfall-based onset dates by assuming that it better represents farmers’ planting practices. We tested two planting windows: (i) DOY 151 (31 May) to DOY 231 (19 August) (AutoP(151) hereafter), and (ii) DOY 166 (15 June) to DOY 231 (19 August) (AutoP(166) hereafter). The two different planting windows were selected due to the substantial difference between the current ANACIM definition, which starts to count from 1 May, and the literature. For instance, Diop [52] argued that the growing season starts between 24 June and 11 July in the south and southeast and between 2 and 21 August in the north and northeast of Senegal. The soil water threshold for automatic planting was set as 30% of the field capacity over 30 cm soil depth. The DSSAT model simulation started on DOY 150 (30 May). Considering the unimodal rainfall distribution (Figure 2d) and long dry season before the rainy season starts, the initial soil is very dry, but whenever rainfall fills the soil water content up to 30% within the designated planting window, the DSSAT automatically plants sorghum seeds.
2.3.3. Determining Semi-Optimal Planting Dates
Planting as soon as soil moisture meets the automatic planting criteria does not guarantee the highest potential yields farmers can achieve in a given season. Optimal planting dates could be later if there was a subsequent long dry spell after planting. The DSSAT’s automatic planting option depends on the planting window’s first date. To find semi-optimal planting dates, we shifted the planting window day by day, starting from DOY 151 (i.e., planting window from DOY 151–231, DOY 152–231, DOY 153–231, and onwards) and then selected the planting date that produced the highest yield during the target season. For example, in the case of CNRA-1989 in Figure S2a, the planting windows from DOY 151–231 to DOY 165–231 determined planting dates as DOY 165 (the first marker on the 1989 curve in Figure S2a), indicating there was only one rainfall event during DOY 151–165 to fill the 30% of soil marginally, but it drained out quickly. The next significant rainfall arrived on DOY 172 (the second marker on the 1989 curve in Figure S2a). The earliest planting on DOY 165 resulted in a 709 kg ha−1 yield. However, planting on DOY 172 allowed a higher yield (964 kg ha−1), which is not necessarily the maximum/potential yield; thus, we call DOY 172 the semi-optimal planting date in 1989. As the planting window shifted to the later days, simulated yields gradually decreased as the growing season became shorter. Figure S2 illustrates how the semi-optimal planting windows were determined for different years and locations. The semi-optimal planting dates and corresponding simulated yields served as a reference in evaluating the utility of the different onset definitions described above.
2.4. Evaluation of Onset Definitions
The value of various onset definitions was assessed by comparing the ‘distribution’ of 35 years of simulated yields against the ‘distribution’ of reference yields with semi-optimal planting dates, not comparing all the individual years. Each empirical distribution of the simulated yields with different onset/planting dates was compared with the reference distribution. Therefore, we used representative statistical methods for the hypothesis testing of two groups of samples. For equal mean hypothesis tests, we adopted a non-parametric statistical method, Mann–Whitney–Wilcoxon (MWW) test [53] (i.e., H0: μ1 = μ2), rather than Student’s t-test, because not all yield distributions were normally distributed. Since we compared the full distributions of 35 simulated yields, testing only the mean was insufficient to evaluate the value of the different planting dates. In addition, if the yield distribution is not symmetrical, then comparing the means or variances of the two groups may not be helpful. Therefore, we adopted a permutation test to compare percentiles (10th, 25th, 50th, 75th, and 90th) of two distributions. We used the percentileTest function in the rcompanion package in R [54].
3. Results and Discussion
3.1. Bambey (CNRA)
In general, soil-moisture-based planting dates were consistent with the progression of meteorological onset in Senegal. In other words, onsets of the rainy season progress from the southeast to the northwest of the country [35], from KOLD and SINT to NRIP to CNRA (Table S3). Notably, the driest station, CNRA, showed highly variable year-to-year planting dates from the earliest DOY 160 (June 9) to the latest DOY 220 (August 8) (Figure 4a and Figure 5a, and Table S3), indicating higher vulnerability of the location to climate variability.
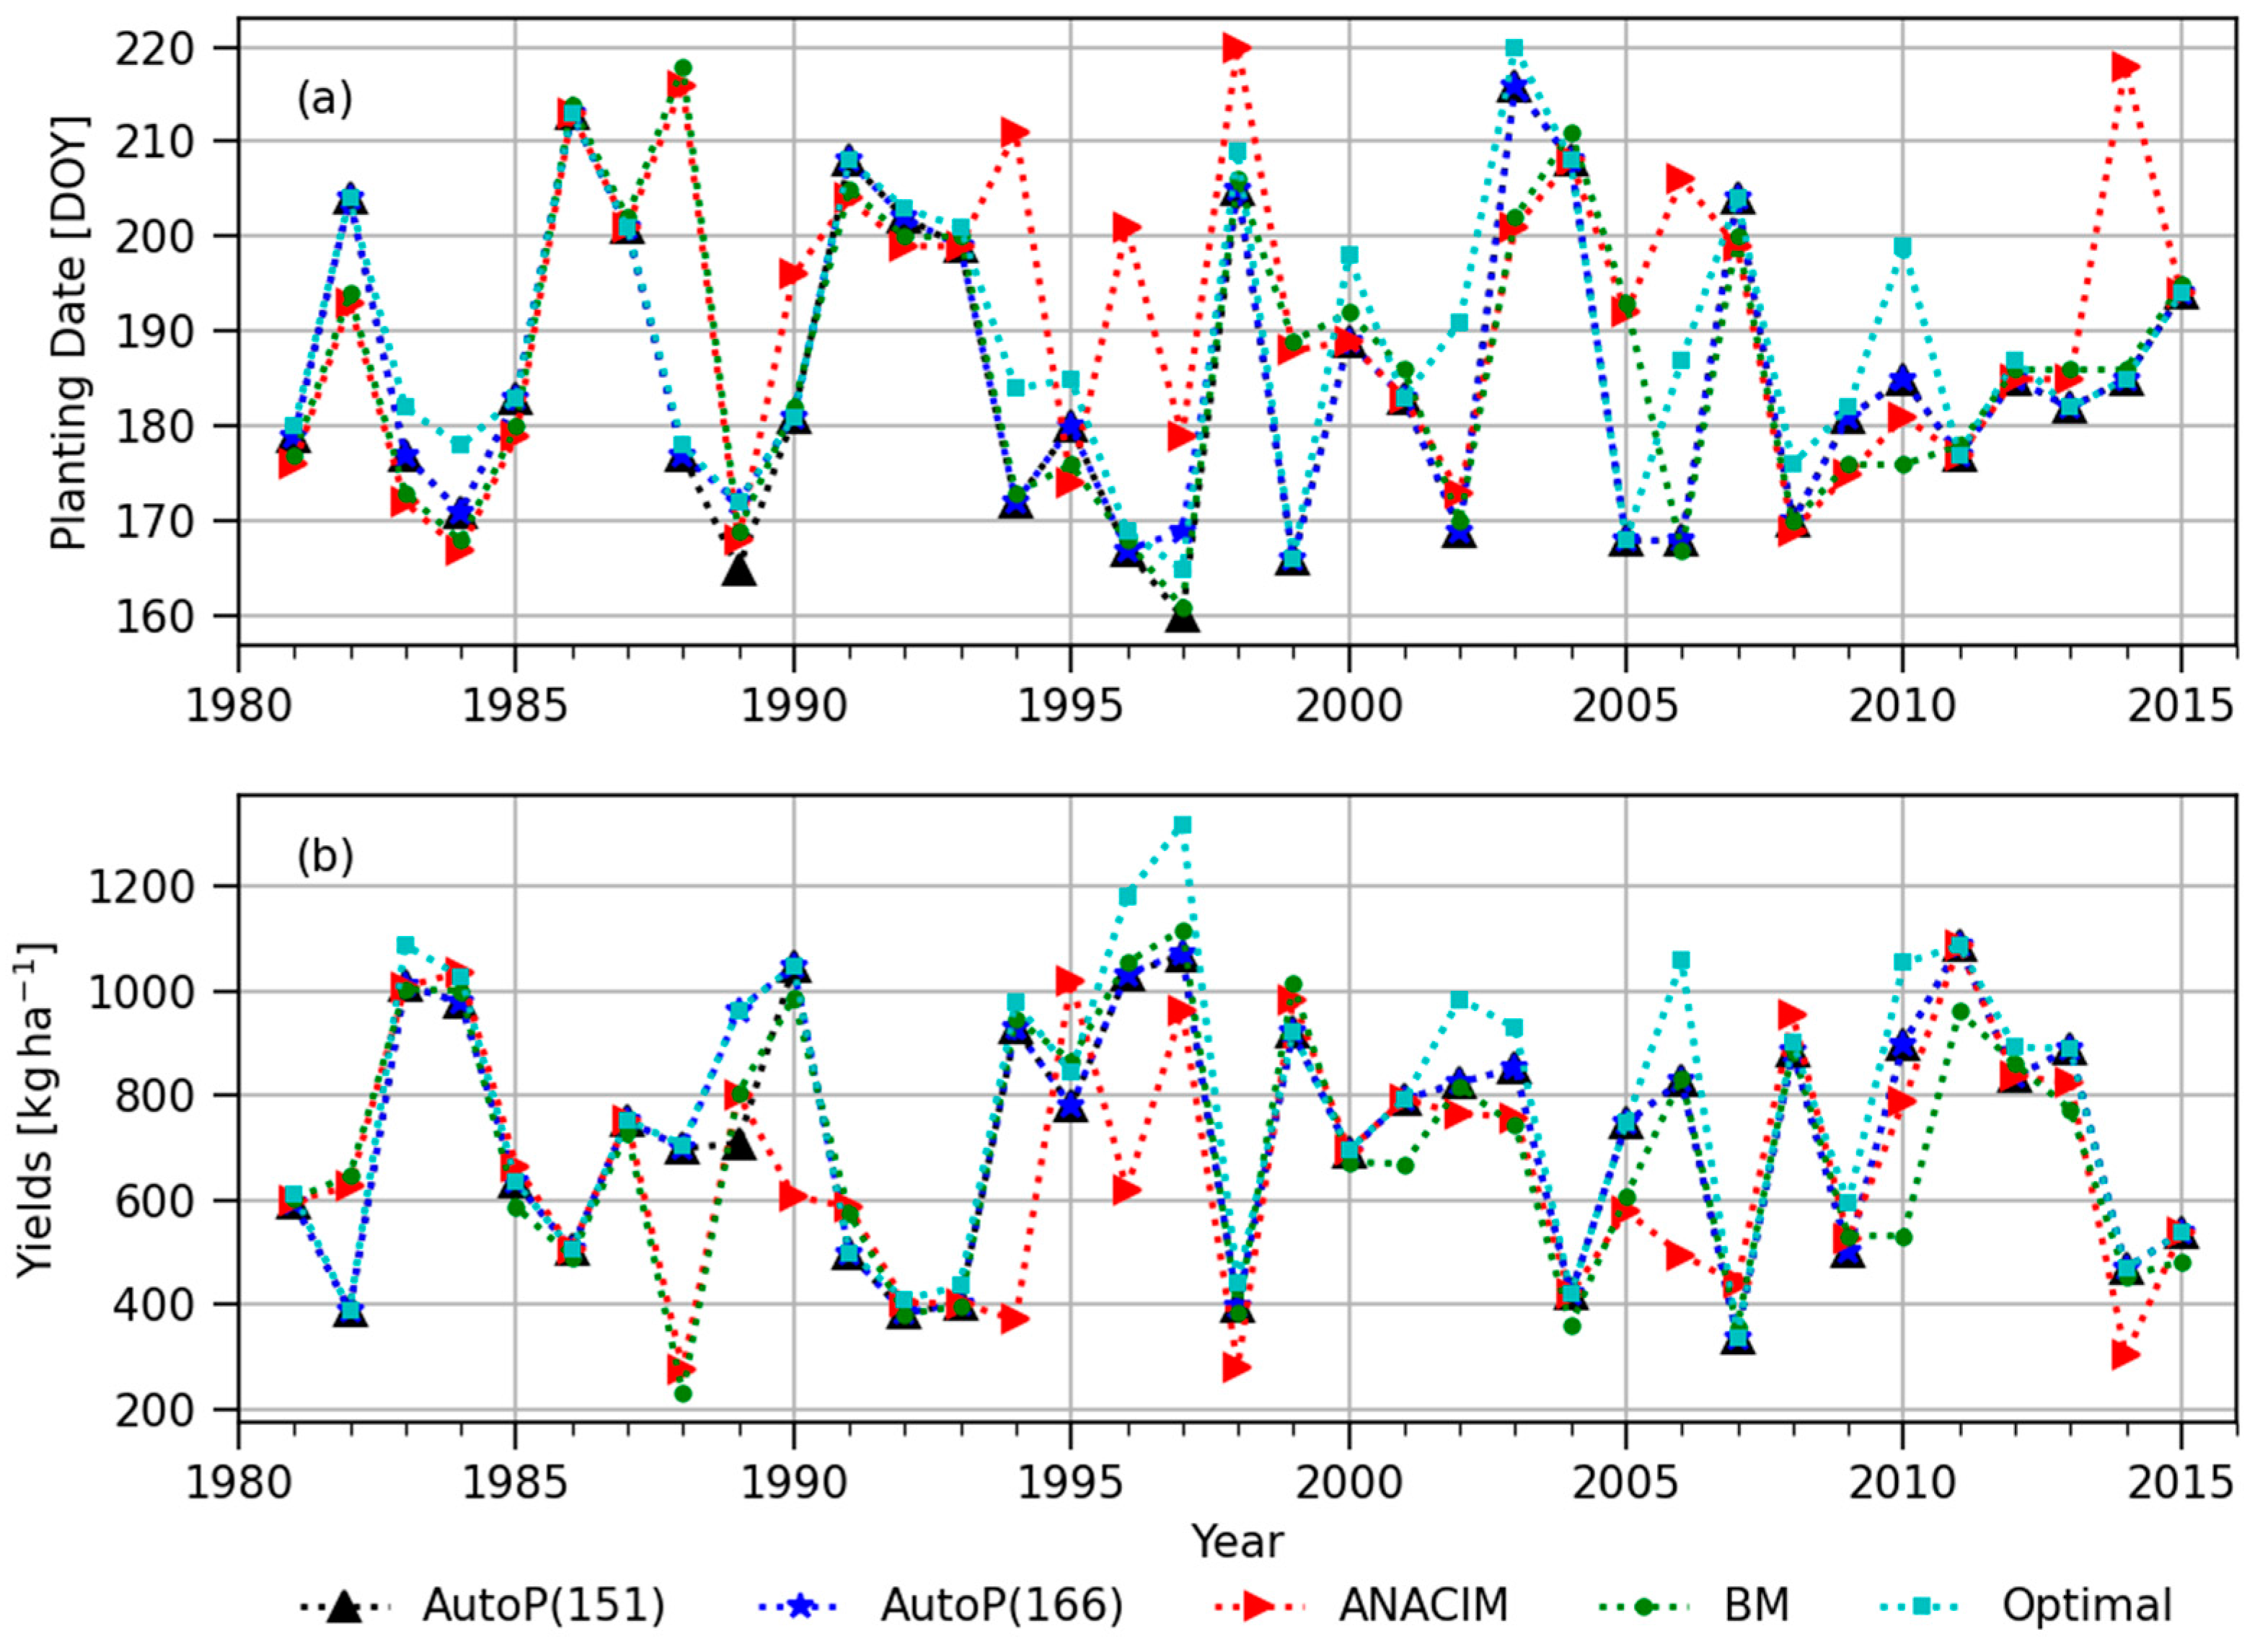
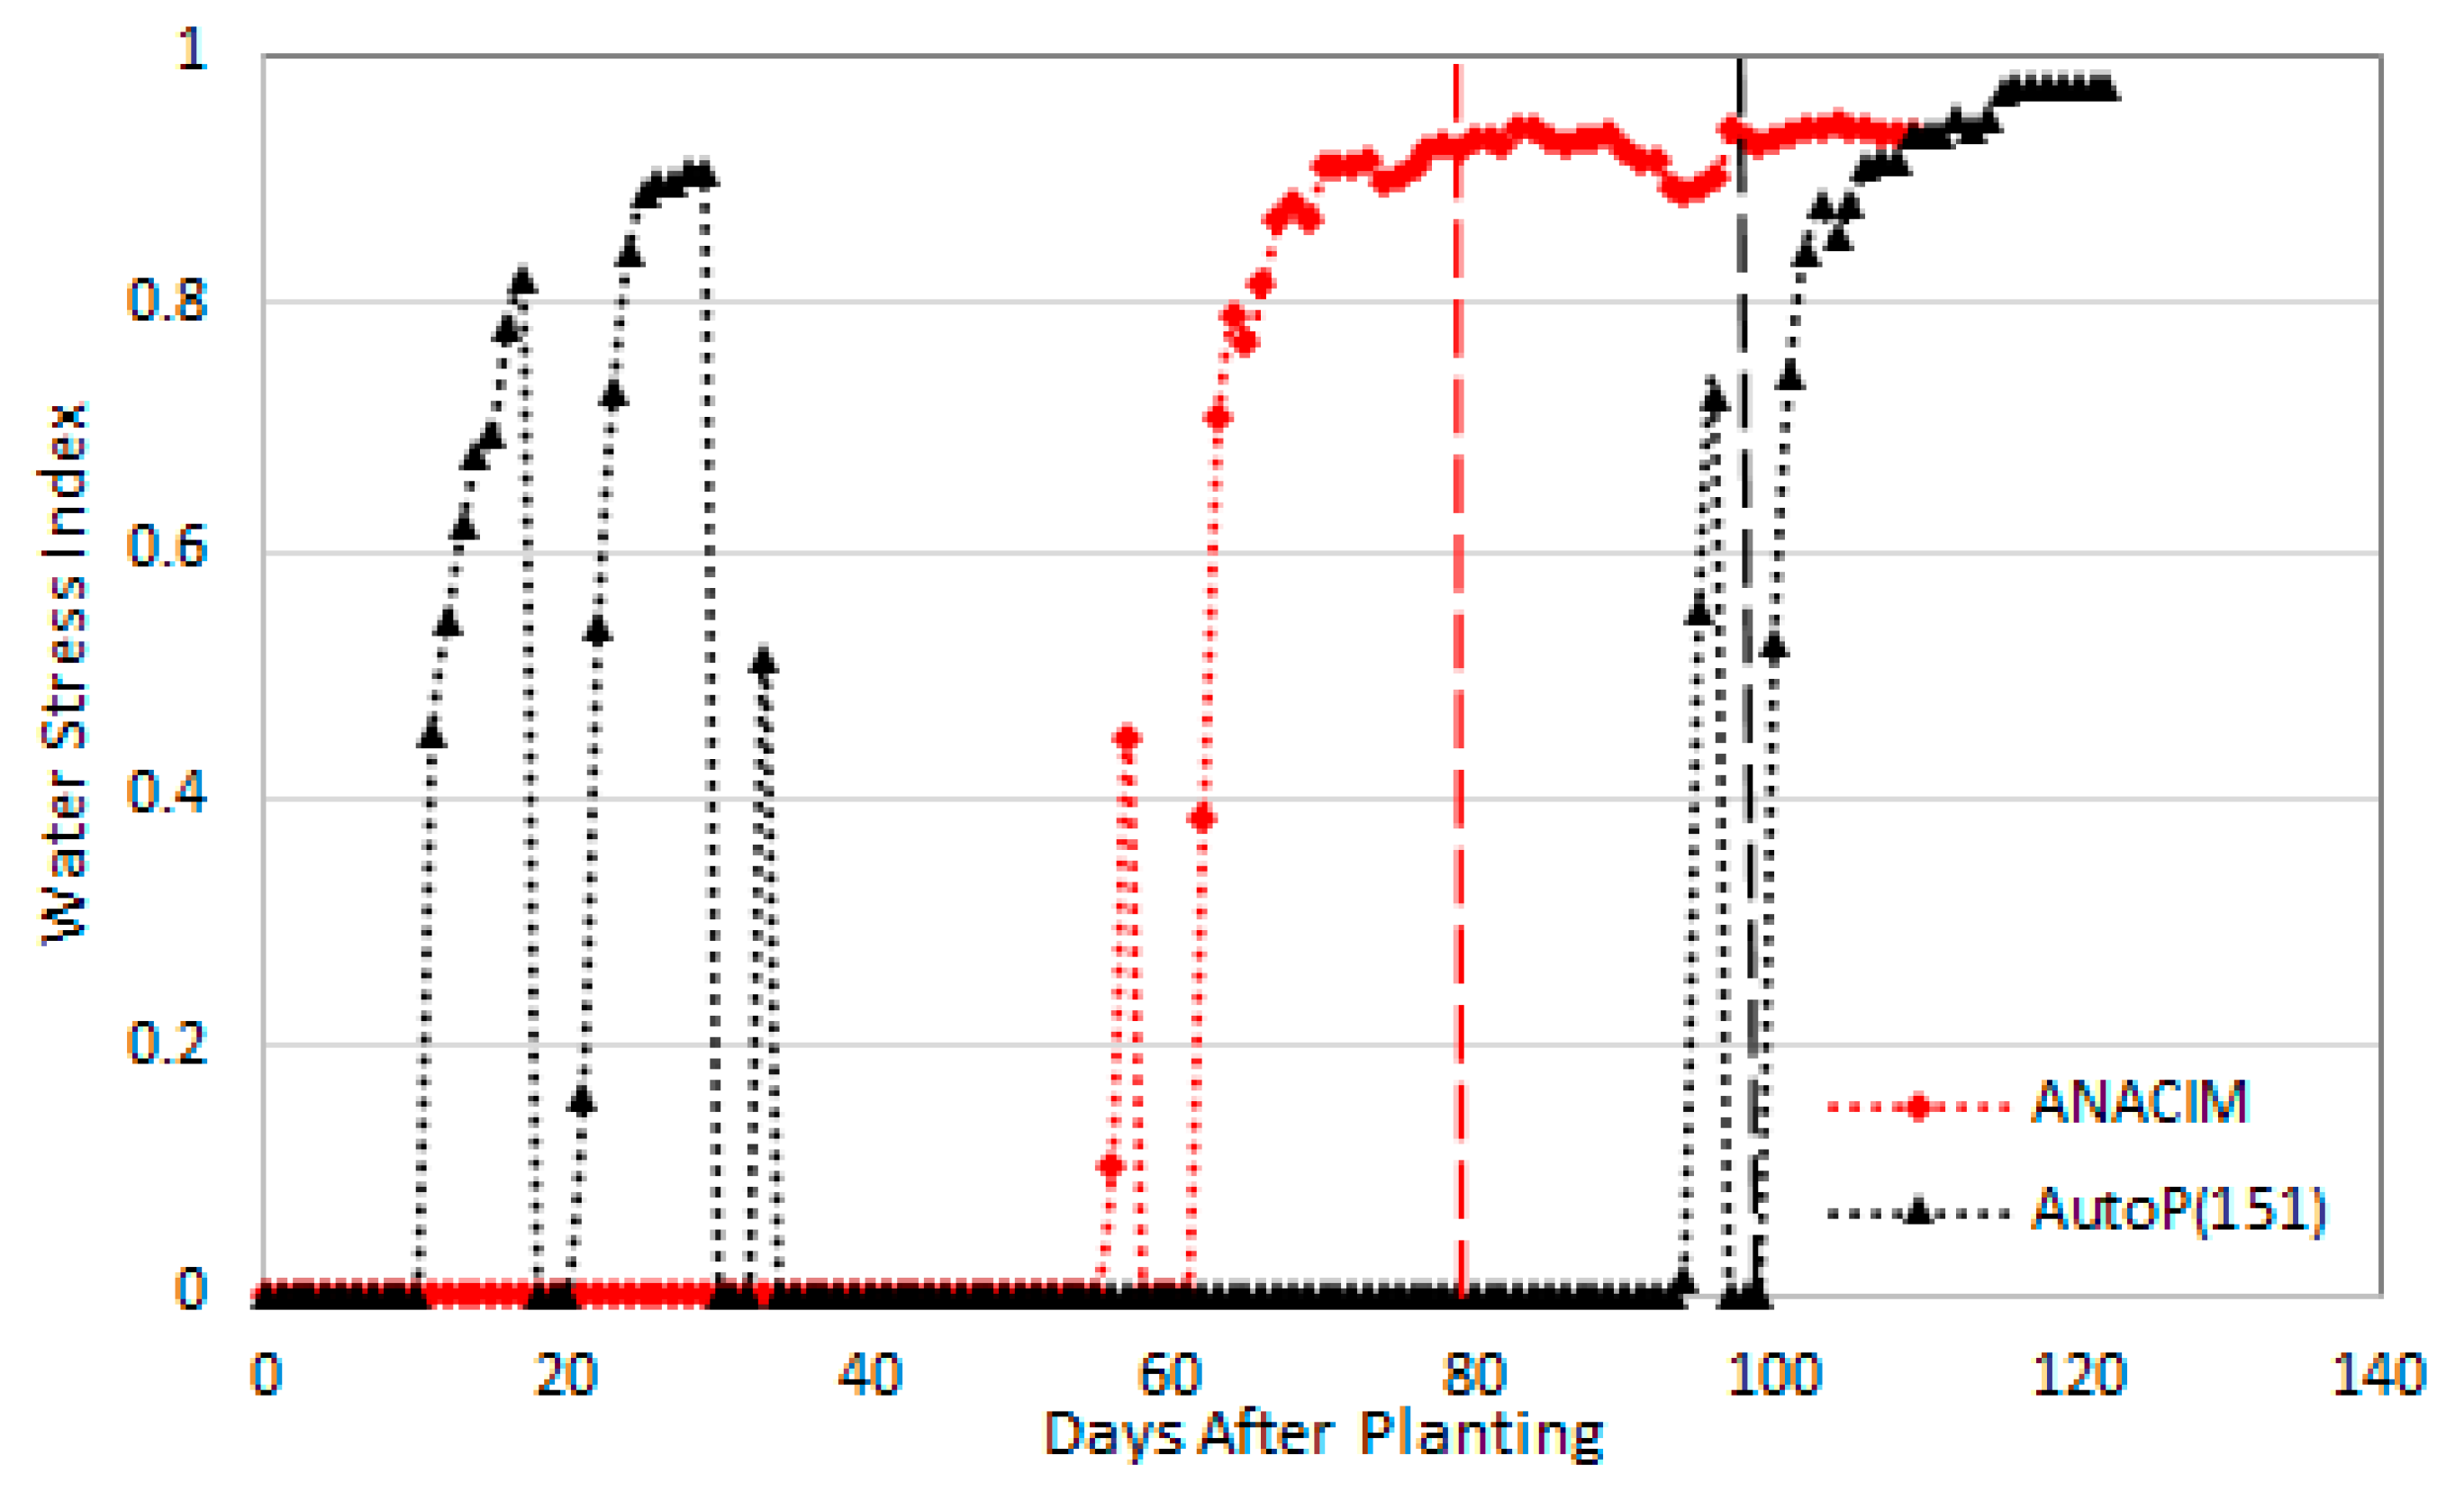
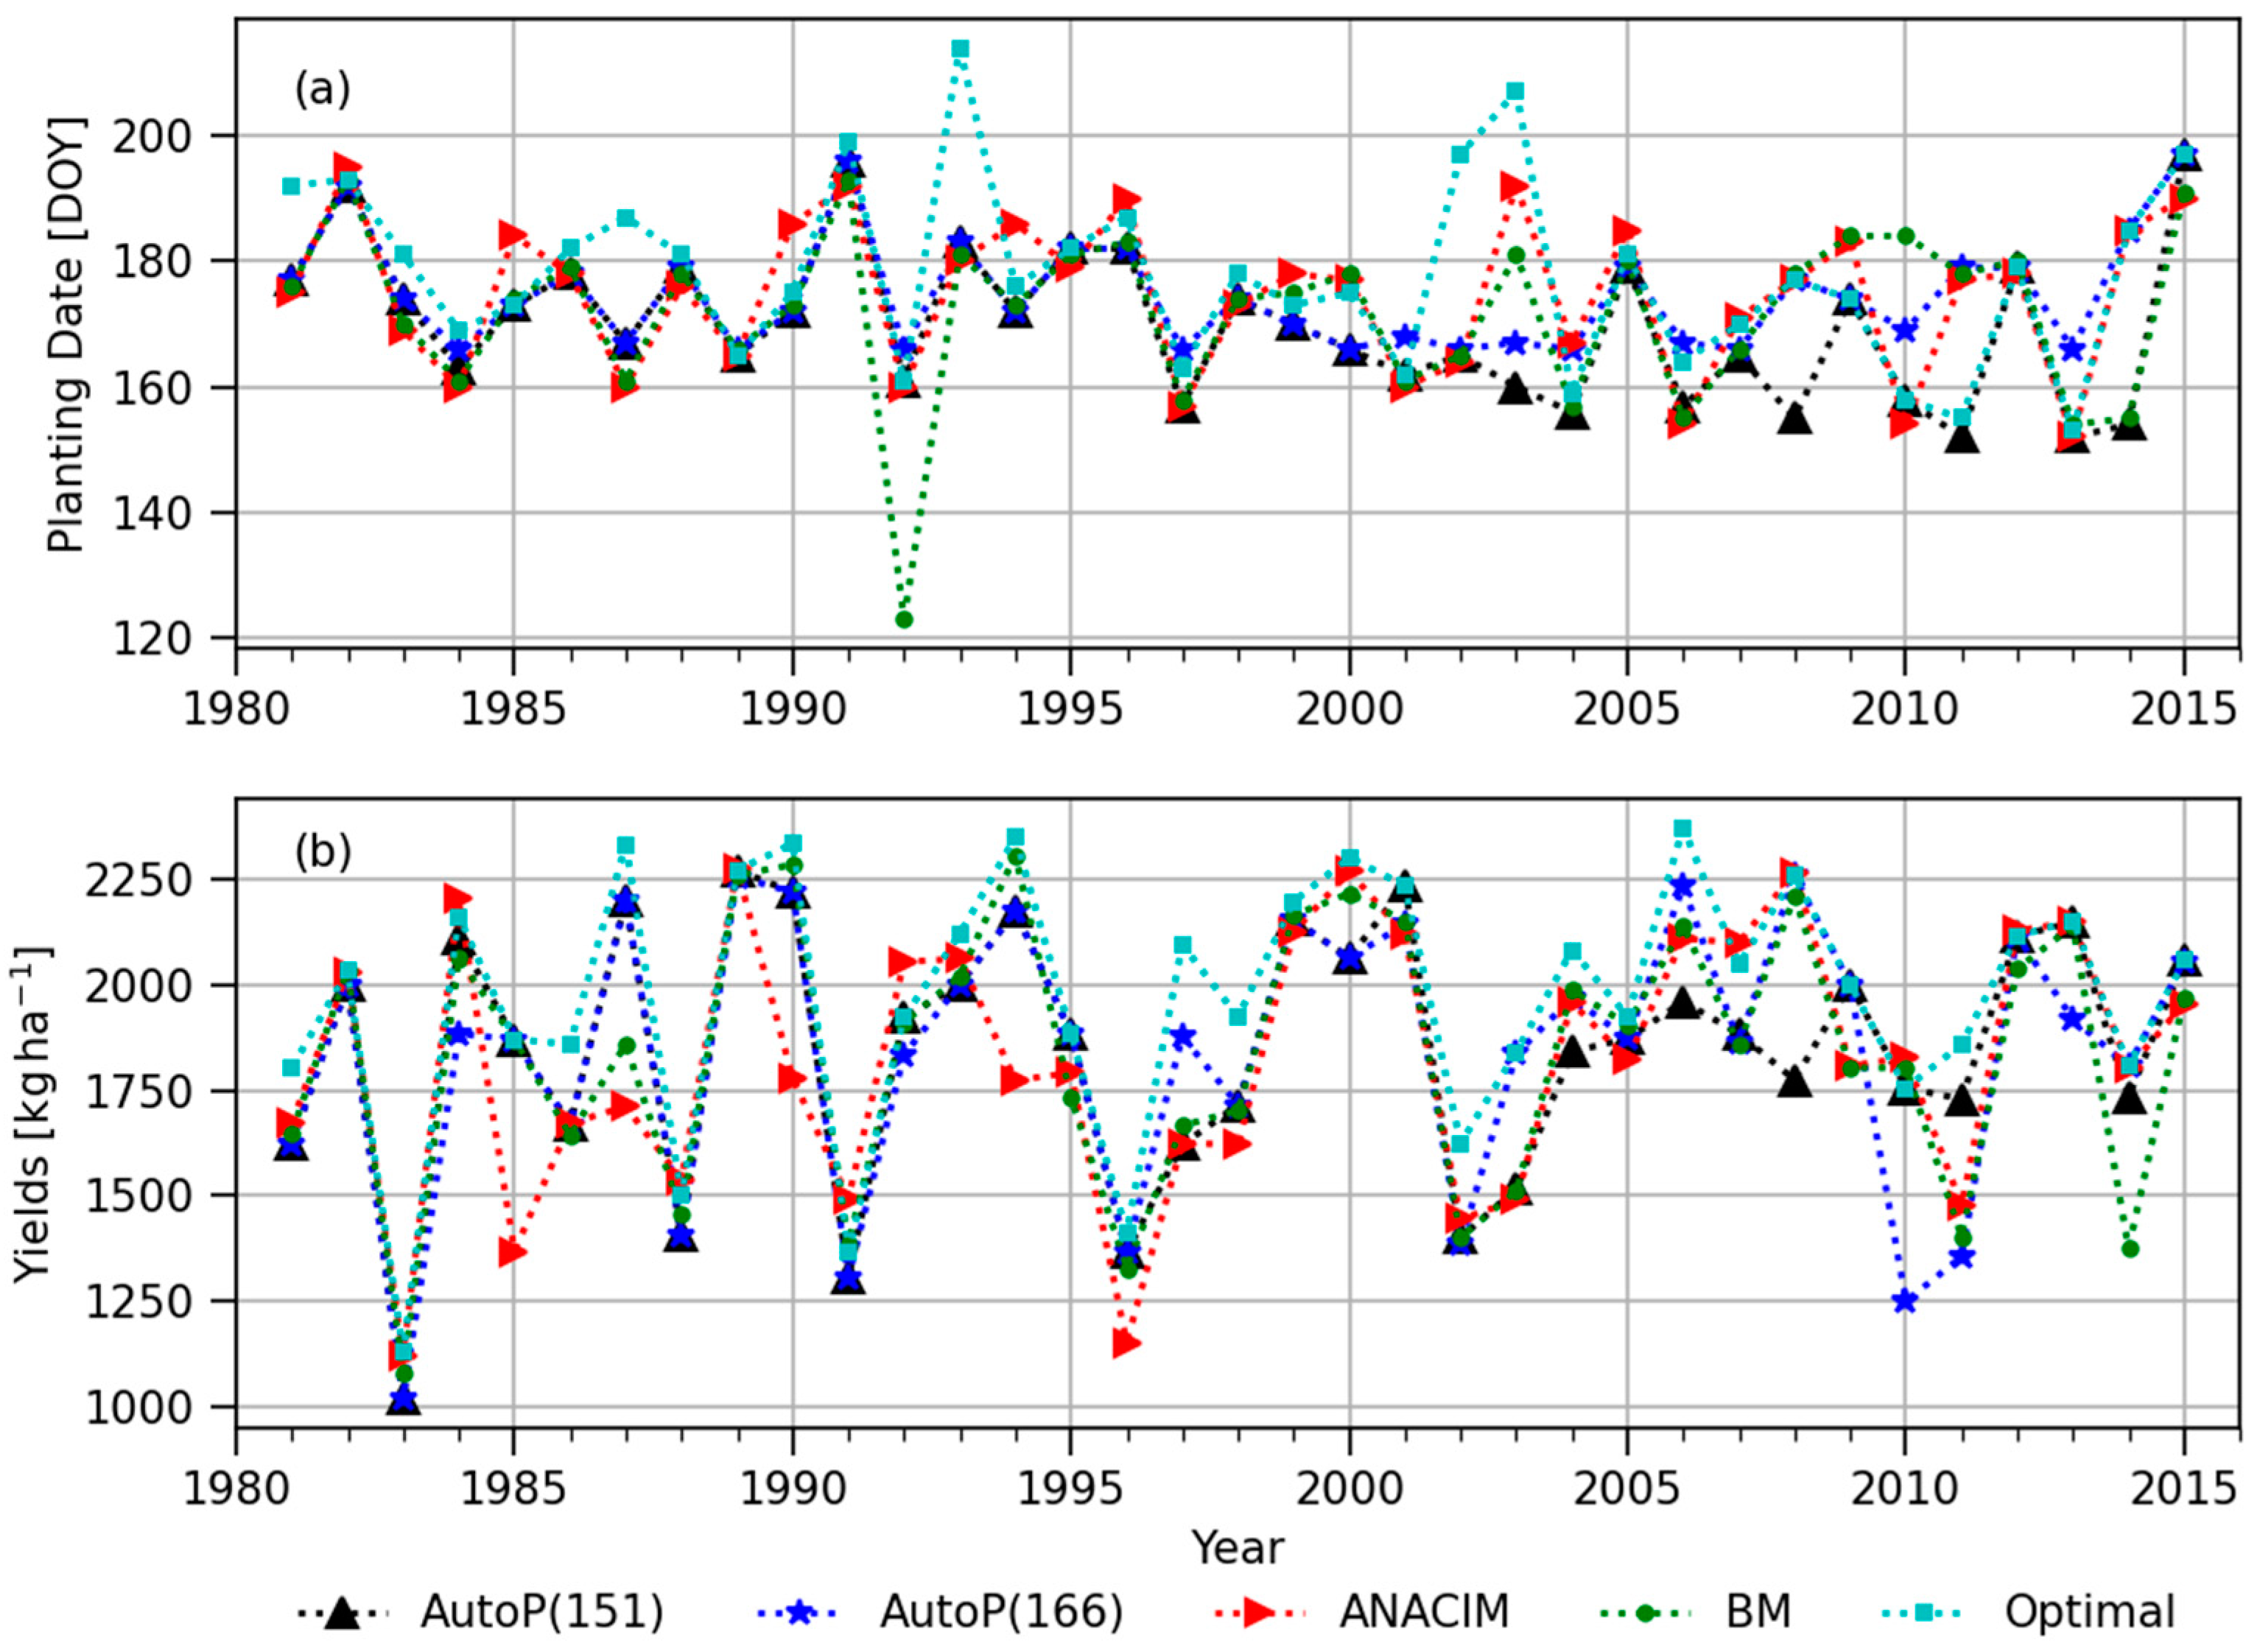
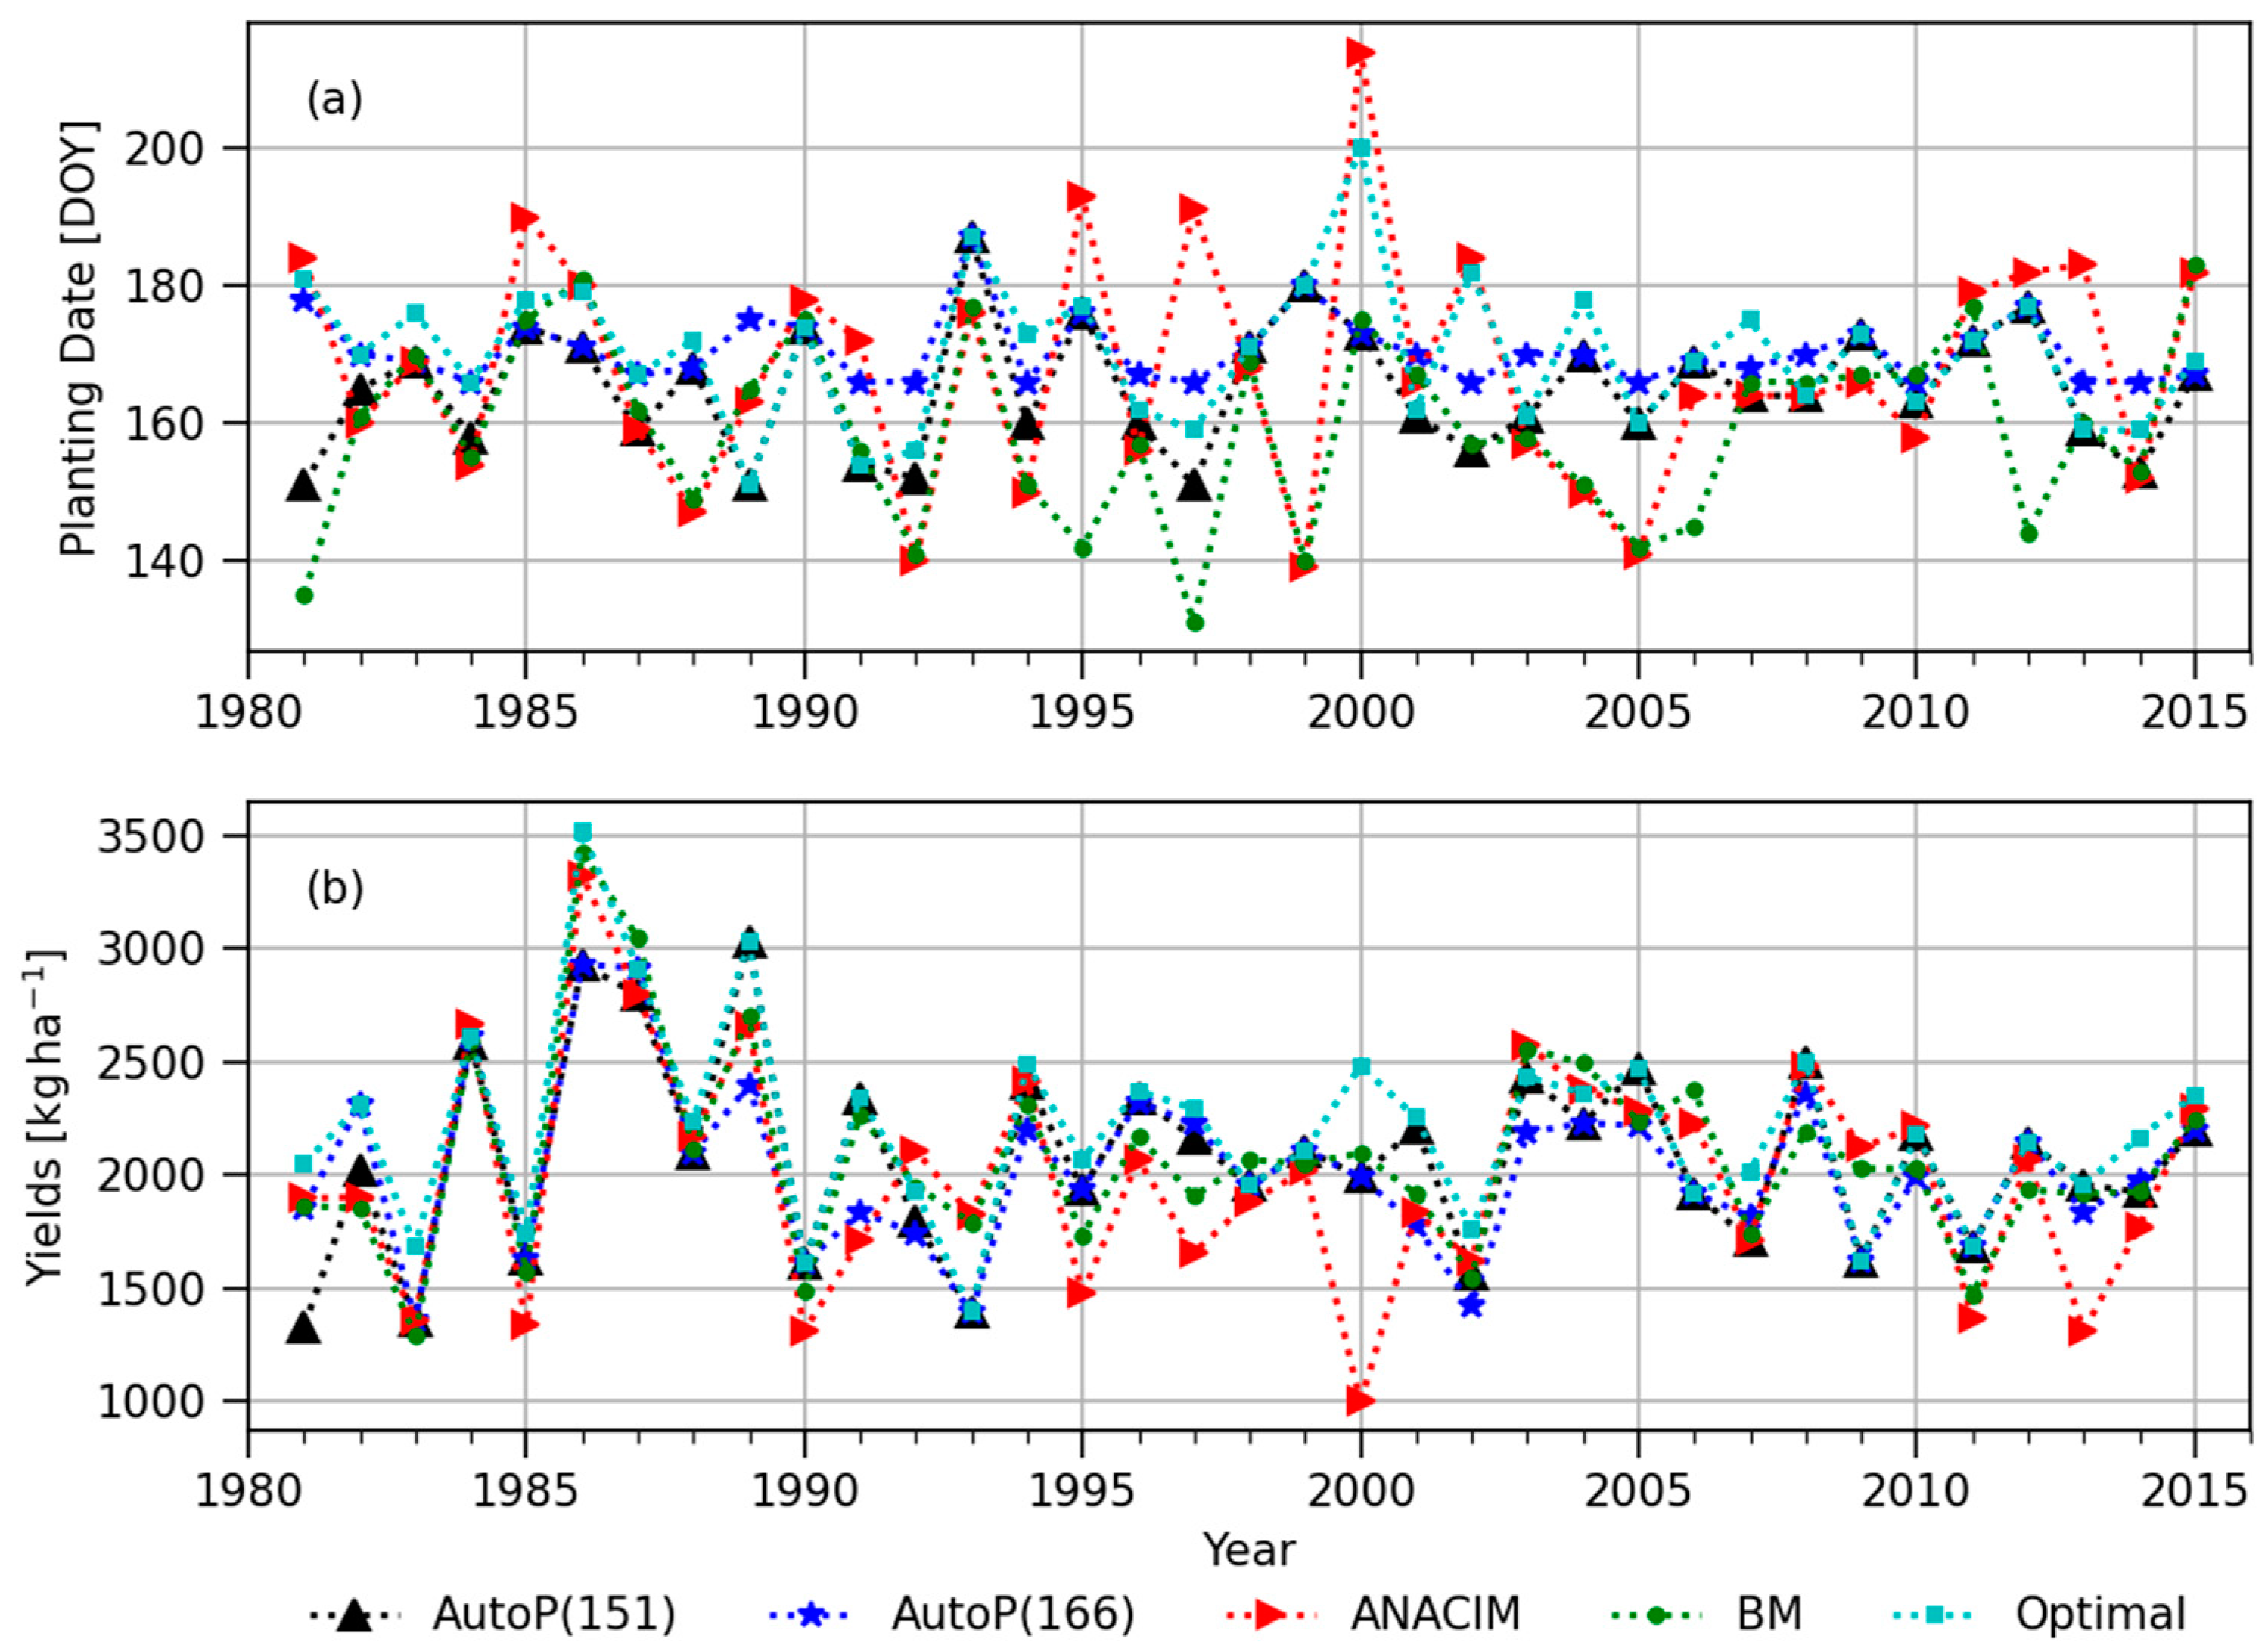
Time series of the estimated planting dates (i.e., one day after the determined onset) are shown in Figure 4a. In general, the soil-moisture-based planting dates (i.e., AutoP(151) and AutoP(166) were closer to the semi-optimal planting dates than the rainfall-based definitions (i.e., ANACIM and BM). Particularly, the ANACIM definition generated planting dates that were too late in several years (1988, 1994, 1996, 1998, 1999, 2006, and 2014), resulting in significantly lower yields. The considerably late planting dates by ANACIM brought severe water stress even before anthesis and during the grain filling period, and thus resulted in much lower final yields than the ones of the semi-optimal or AutoP(151)/AutoP(166). The simulated water stress indices in 1988 are illustrated in Figure 6 as an example.
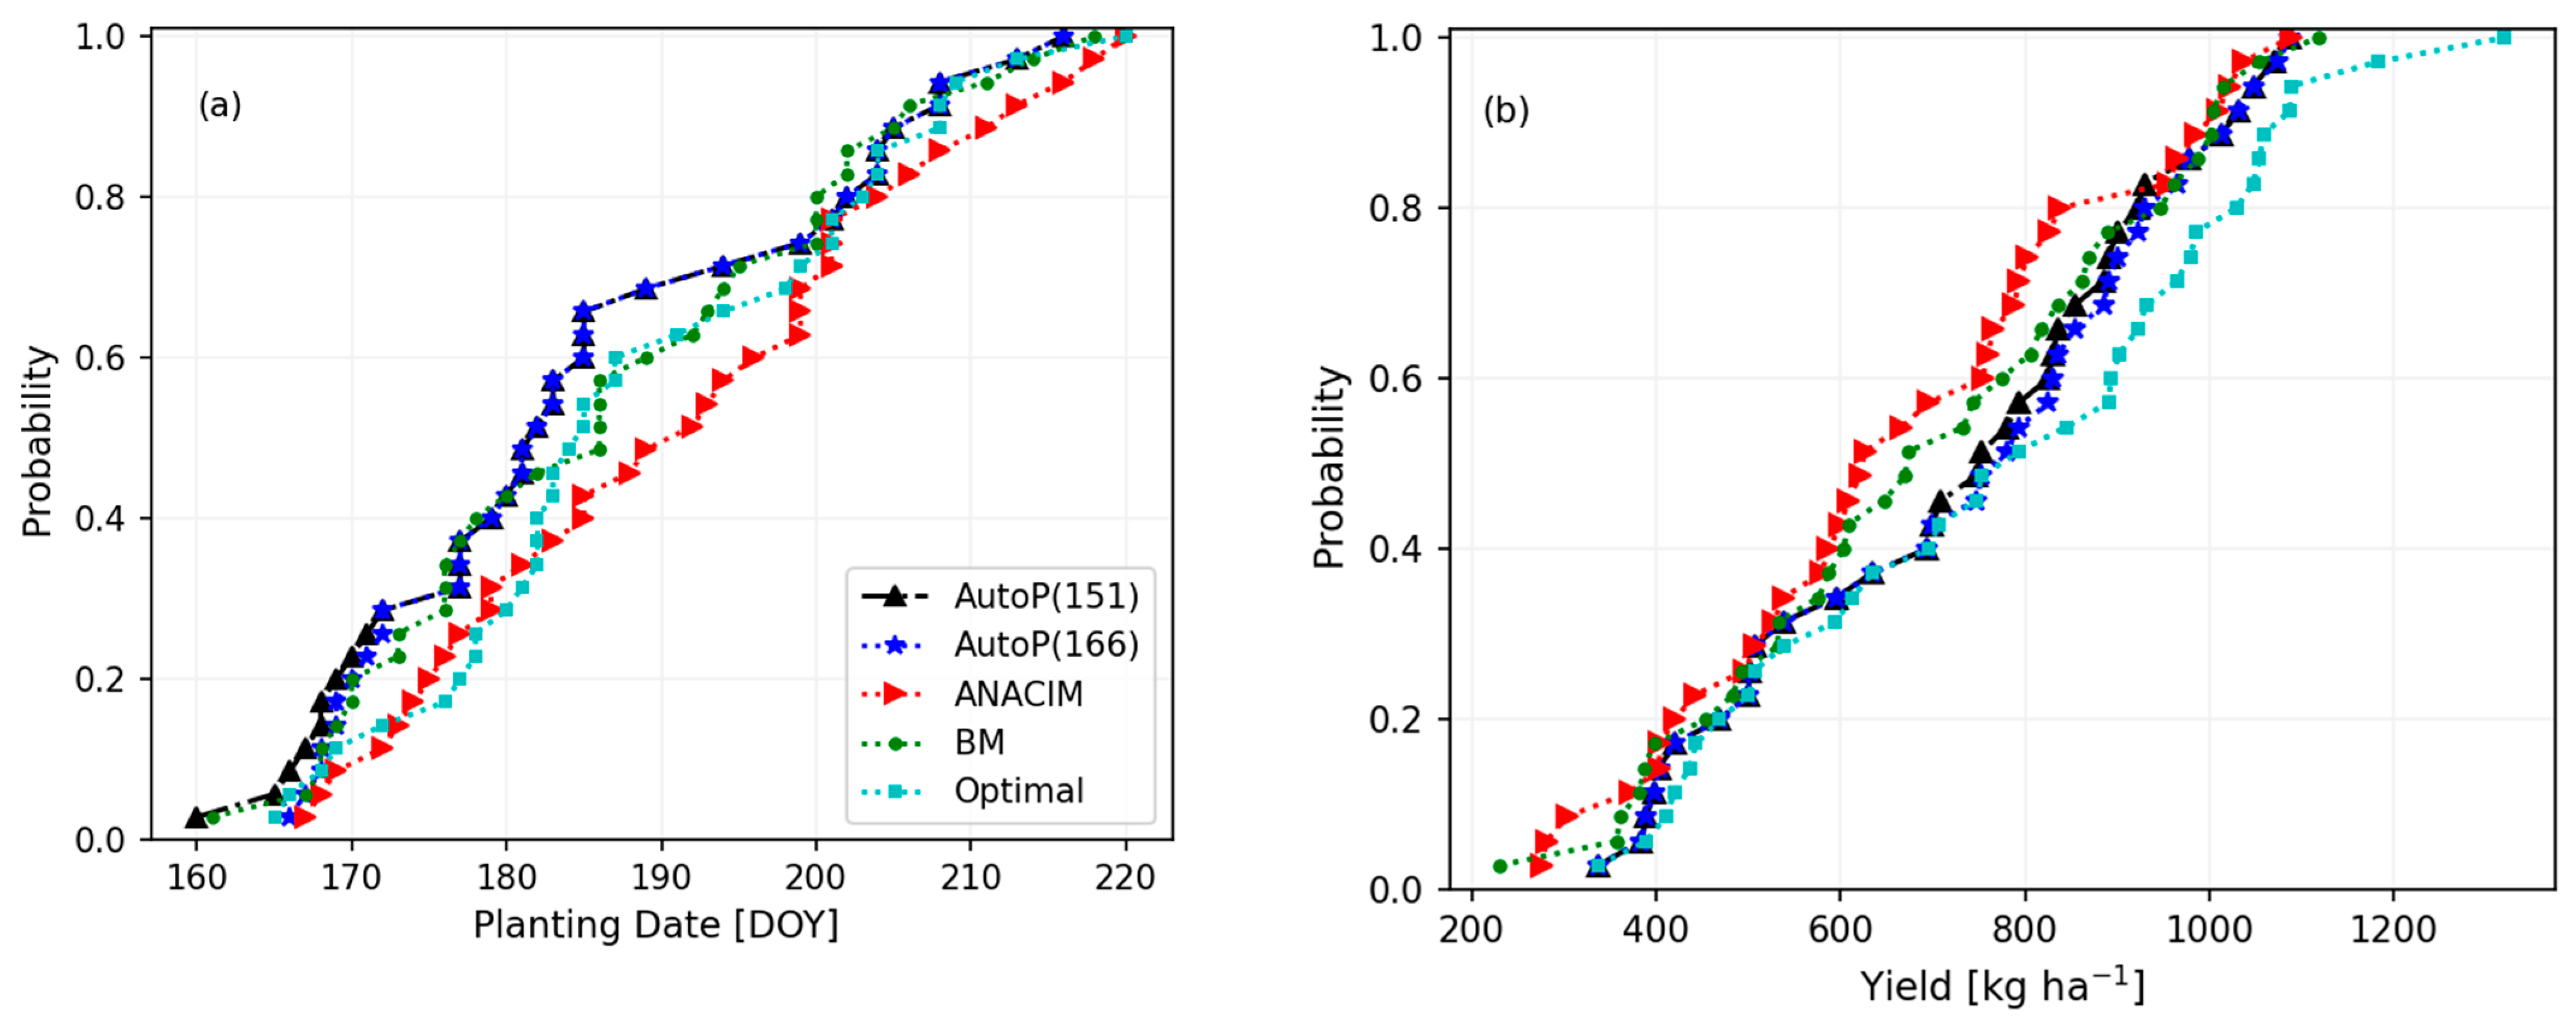
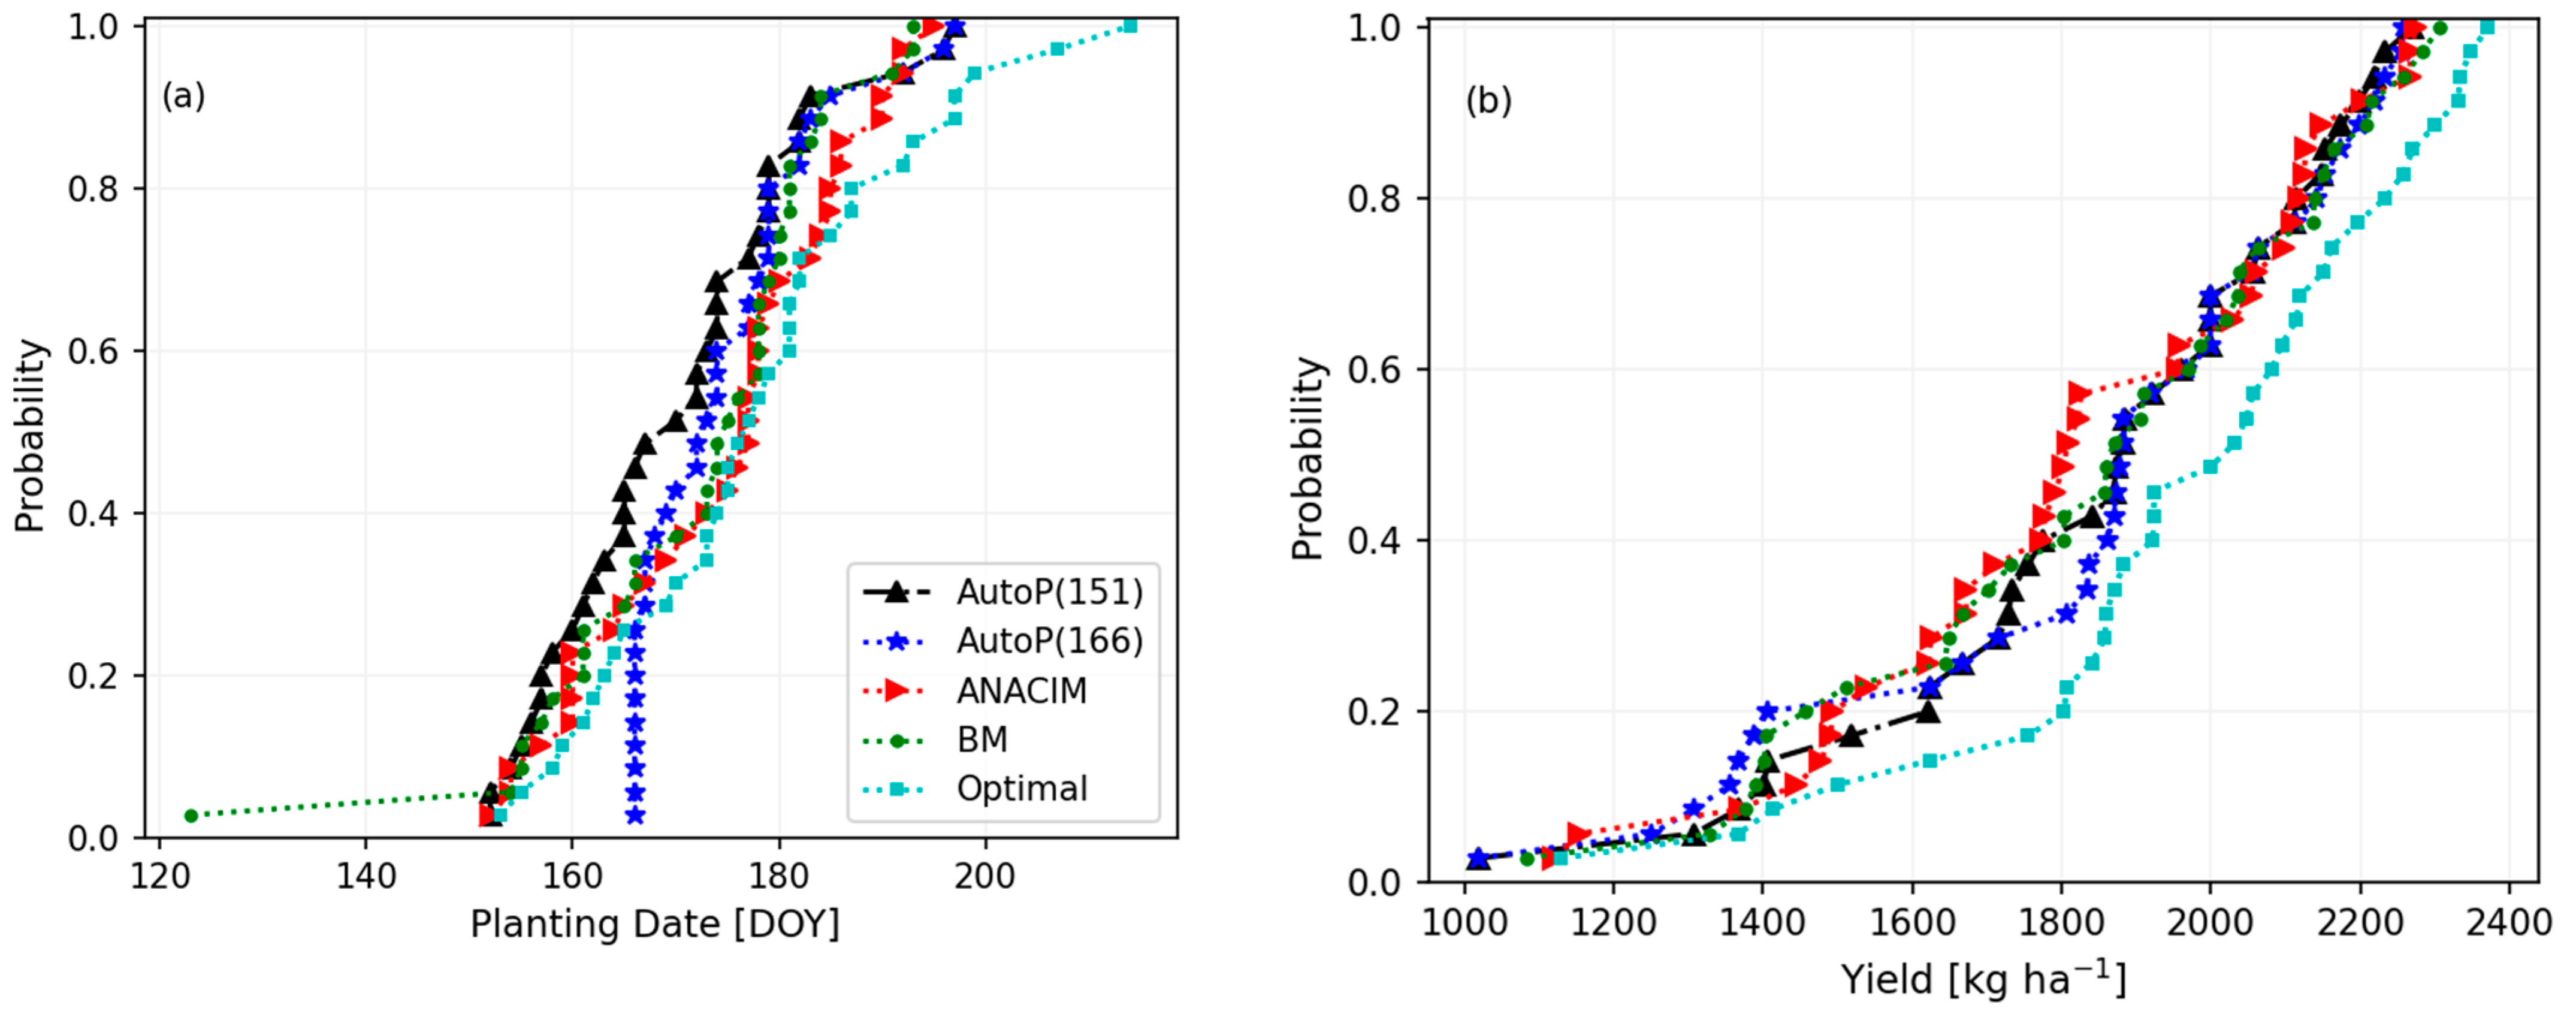
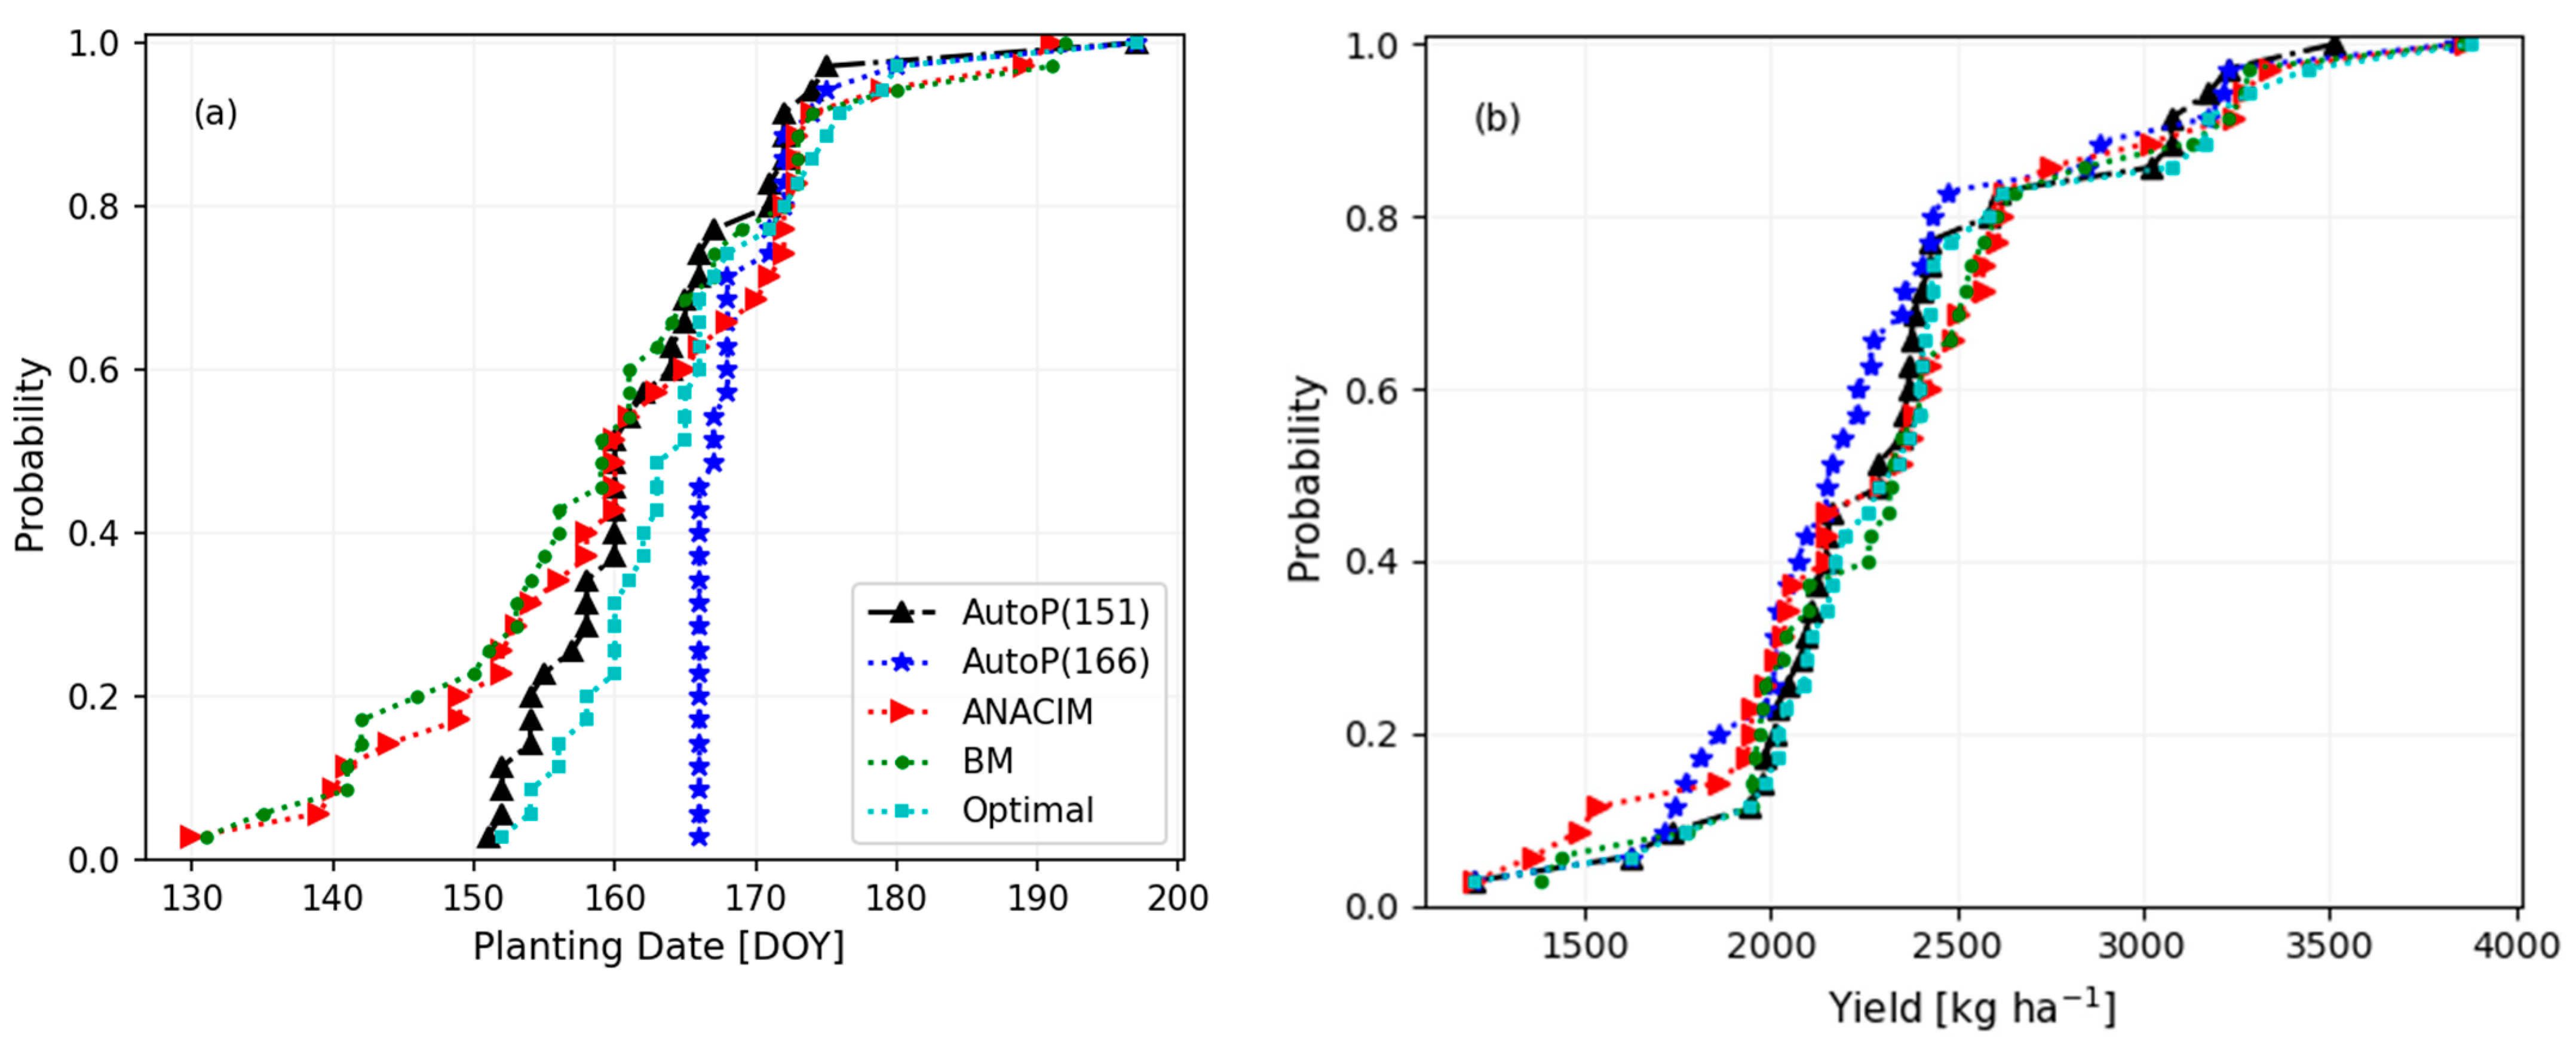
The cumulative distributions of the estimated planting dates and yields in Figure 5 also show overall later planting dates (i.e., shifted to the right from the semi-optimal curve) and lower yields (i.e., shifted to the left from the semi-optimal curve) of the ANACIM definition compared to the ones of the semi-optimal. Statistical analysis shows significant differences in the mean, 75th, and 90th percentiles between the ANACIM and the semi-optimal at a 10% level of significance (Table 1). The ANACIM onset definition seems too strict and tends to miss earlier planting opportunities for higher yields in CNRA representing the driest climatic condition of northern Senegal.
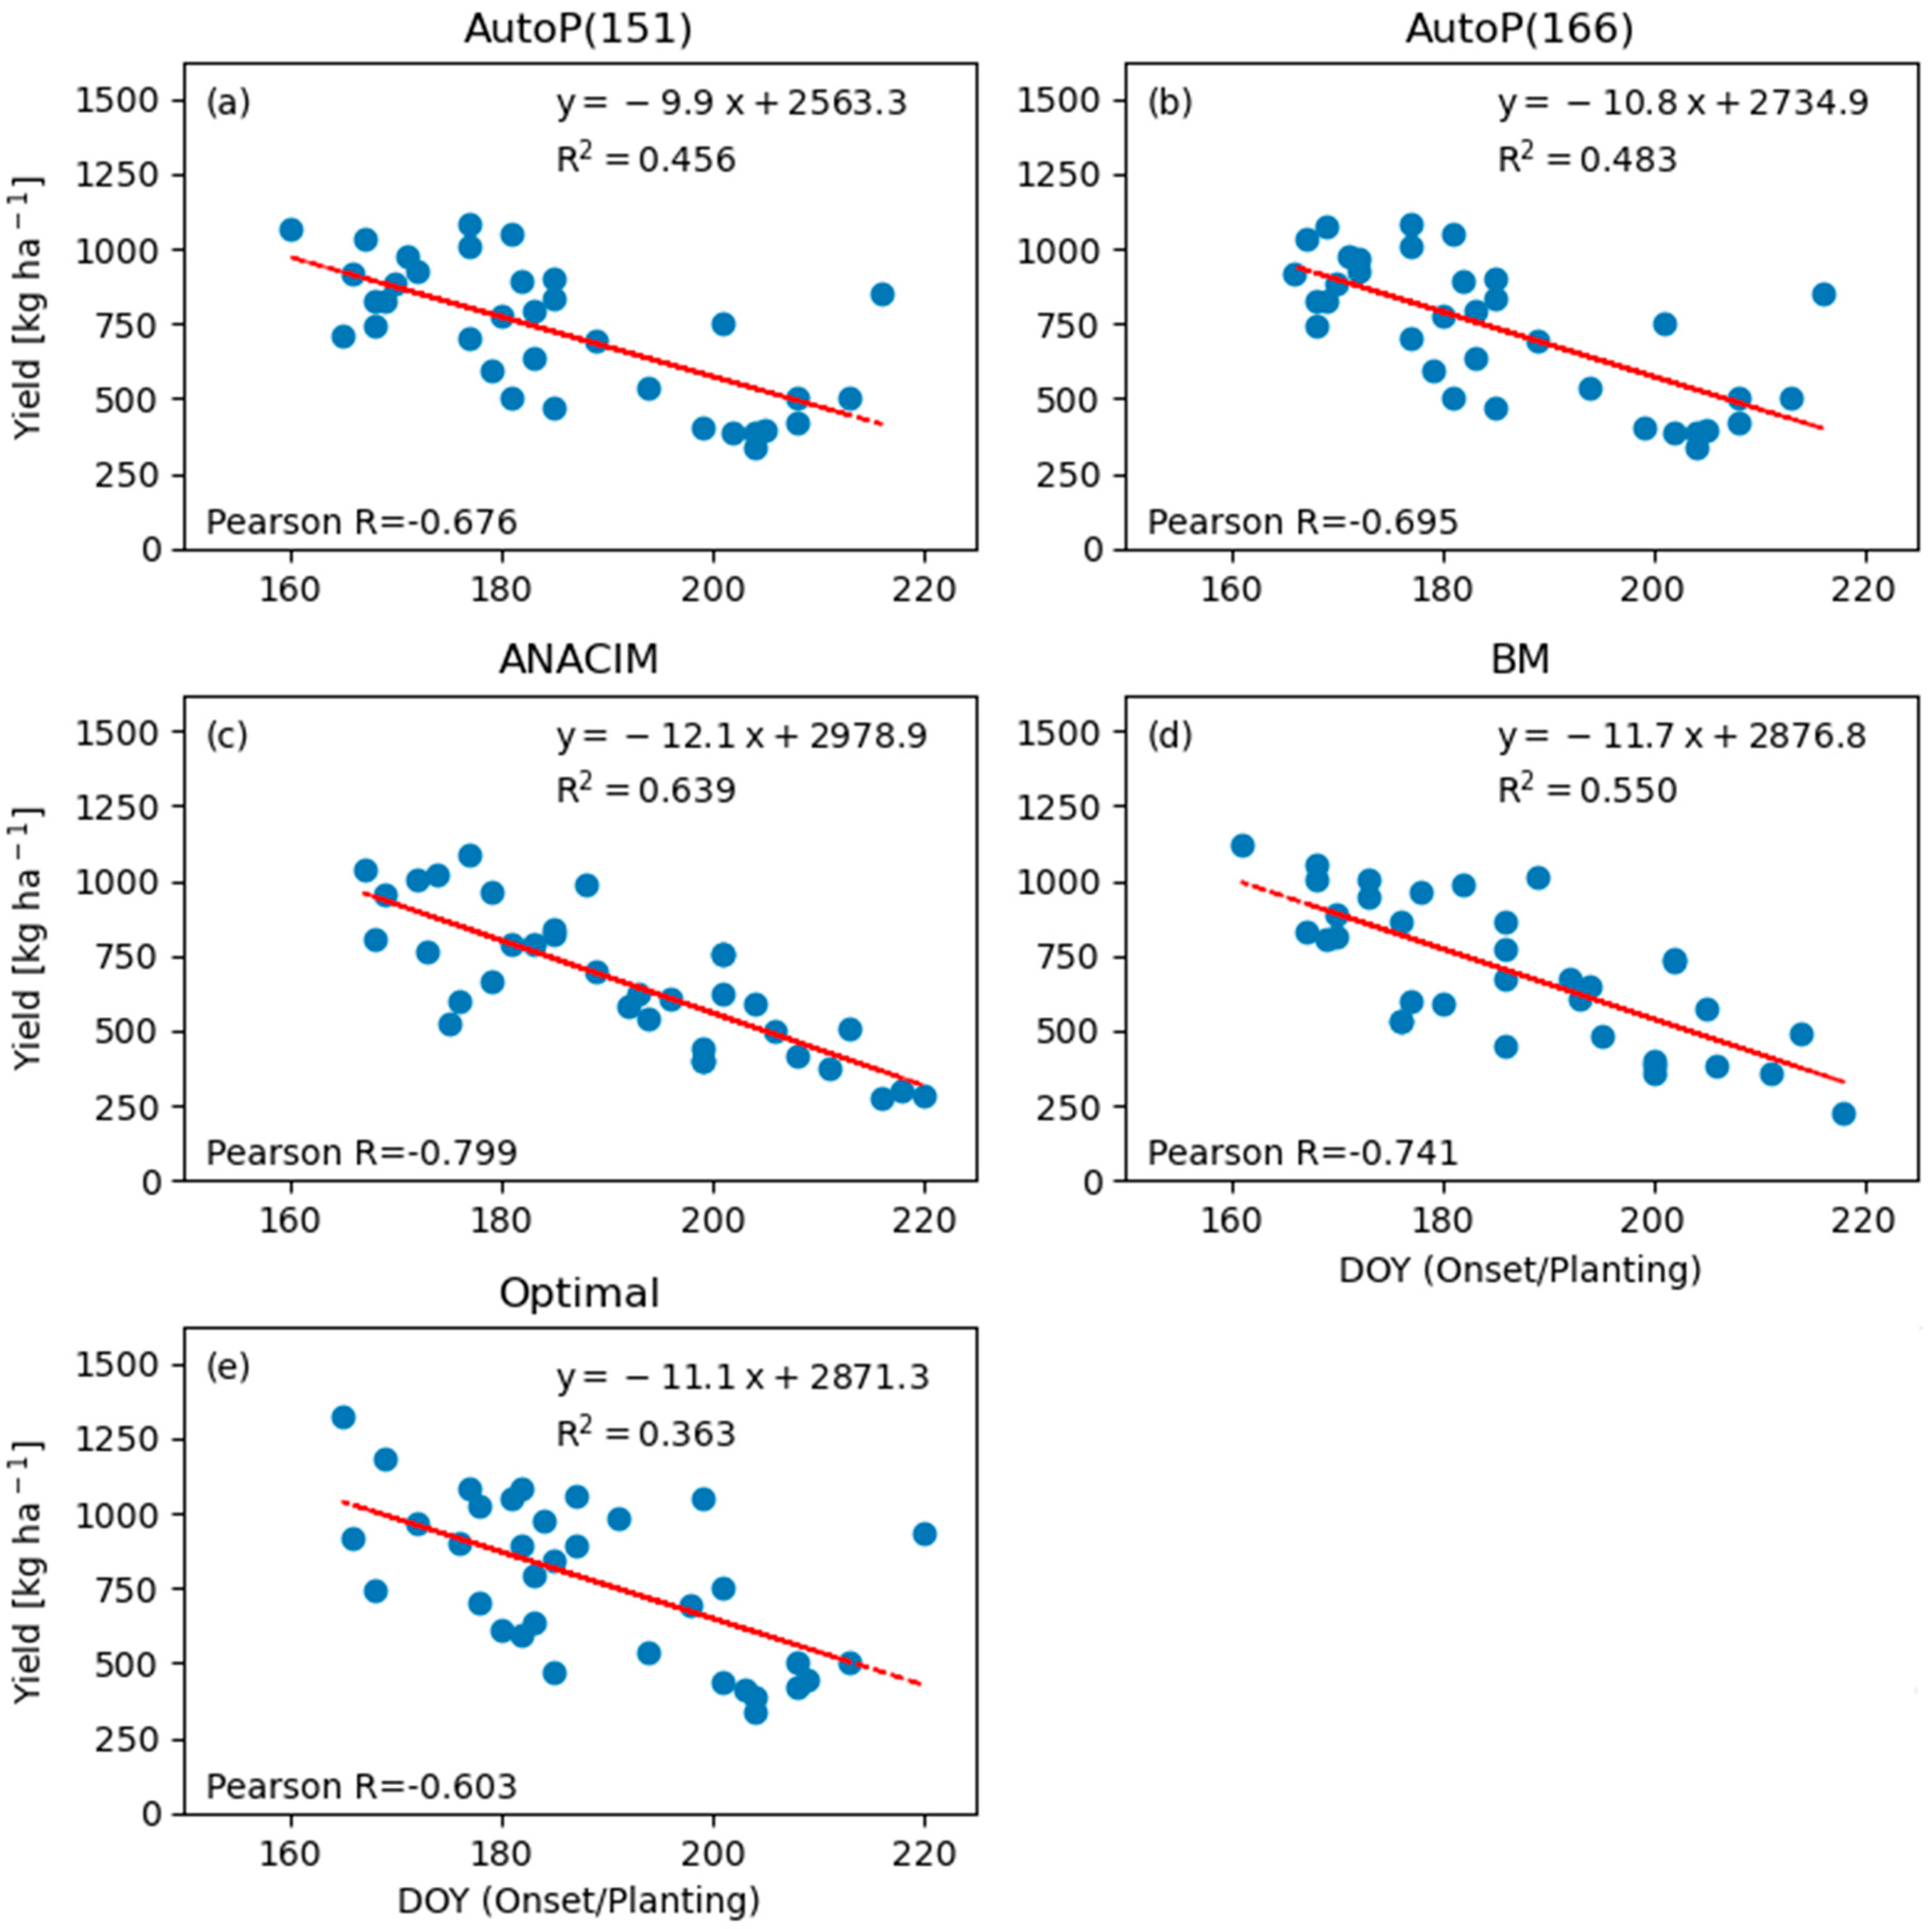
Due to the short rainy season in CNRA, in general there were negative correlations between planting dates and yields, but the negative correlation was strongest with the ANACIM method (Pearson R = −0.8) followed by the BM method (Pearson R = −0.74), as shown in Figure 7. Relatively weaker correlations with the optimal planting or soil-moisture-based onset definition in Figure 7 prove that the negative impact of late planting on yield could be avoided by adjusting planting dates accordingly. In addition, the strong correlations between onset dates and crop yields (i.e., Pearson R > 0.6) regardless of onset definitions emphasize the importance of having skillful agronomic onset forecasts for agricultural decision support, while most of the current seasonal forecasting system is focused on predicting seasonal rainfall amounts. As mentioned above, the crop growing season largely varies inter-annually (i.e., starting dates from June to August) in CNRA and thus total rainfall amount forecasts at a fixed period (e.g., June to September) might not provide a meaningful signal for the expected yield of the coming season to decision makers. On the contrary, skillful onset forecasts would be much more useful and actionable information for farmers to maximize/minimize their gains/risks, and for national government or humanitarian agencies to counteract in advance.
3.2. Nioro du Rip (NRIP)
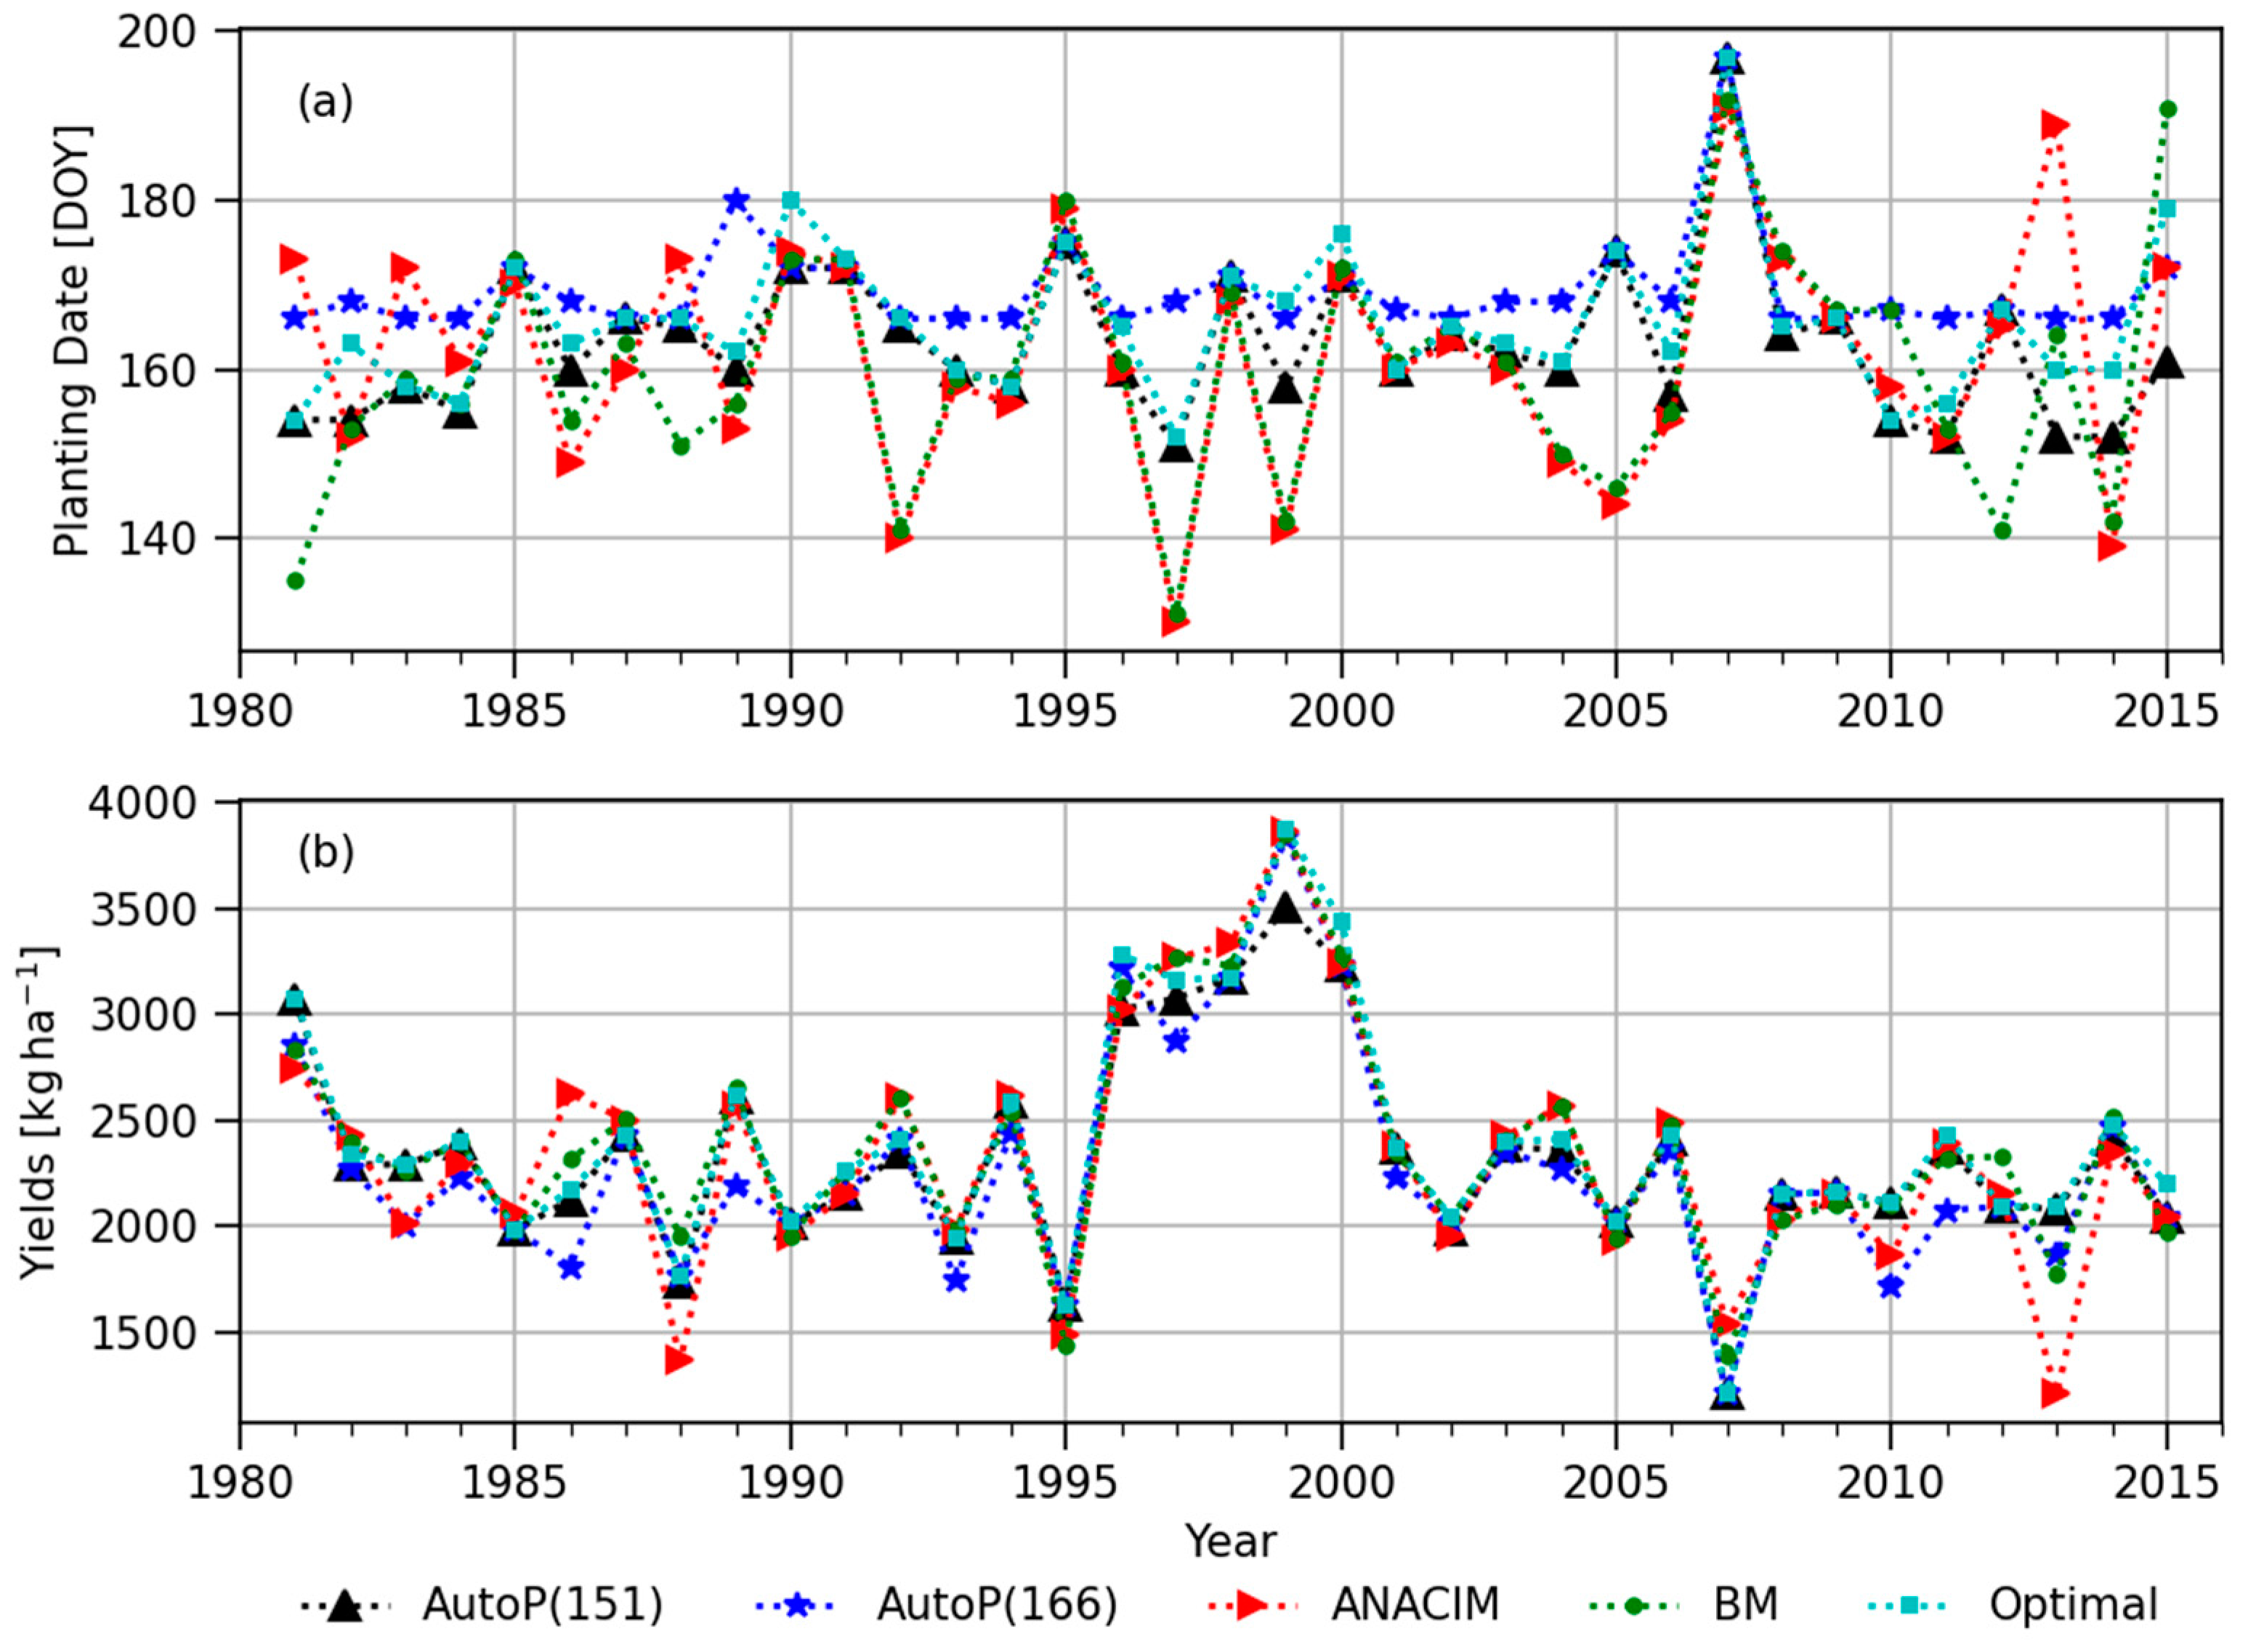
Compared to CNRA, NRIP had an approximately 10-day-earlier mean onset starting from DOY 152 (Table S3). The BM method defined an exceptionally early onset (DOY 123) in 1992 (Figure 8a and Figure 9a), which can be attributed to a significant rainfall event (24 mm) in early May (DOY 121), as shown in Figure S3. However, the next considerable rainfall event arrived one month later on DOY 159; thus, planting on DOY 121 would have resulted in a crop failure. This result shows the weakness of the BM method being too sensitive to a single rainfall event and not considering following dry spells. The BM method needs to be further elaborated to filter out unreasonable onset dates.
A few significantly late planting dates were found in the semi-optimal planting dates in Figure 8a (i.e., 1993, 2002, and 2003). To better understand the reason, we looked at the case of 2003. In 2003, the minimum soil moisture requirement for planting was met from DOY 160, but due to the following long dry spells, the maximum yield was obtained when planted on DOY 212 (Figure S4). When comparing two different planting dates (DOY 195 vs. DOY 212) in 2003, the later planting on DOY 212 allowed a higher yield with a higher harvest index (0.145 and 0.213 with DOY 195 and 212 planting, respectively). Severe water stress around the anthesis was the primary factor for the lower harvest index/yield with the DOY 195 plating (Figure S5). The case of 2003 shows the critical role of prolonged dry spells during the growing season, especially in a relatively dry year. Therefore, it emphasizes that the skillful forecasting of dry spells during the crop growing season could add value to agricultural decision making. It may be difficult for farmers to wait, but delayed planting (after the dry spell) could be better for higher yields. For instance, a 20% higher yield could be achieved when planting on DOY 212 (1708 kg ha−1) compared to planting on DOY 195 (1427 kg ha−1), as shown in Figure S4.
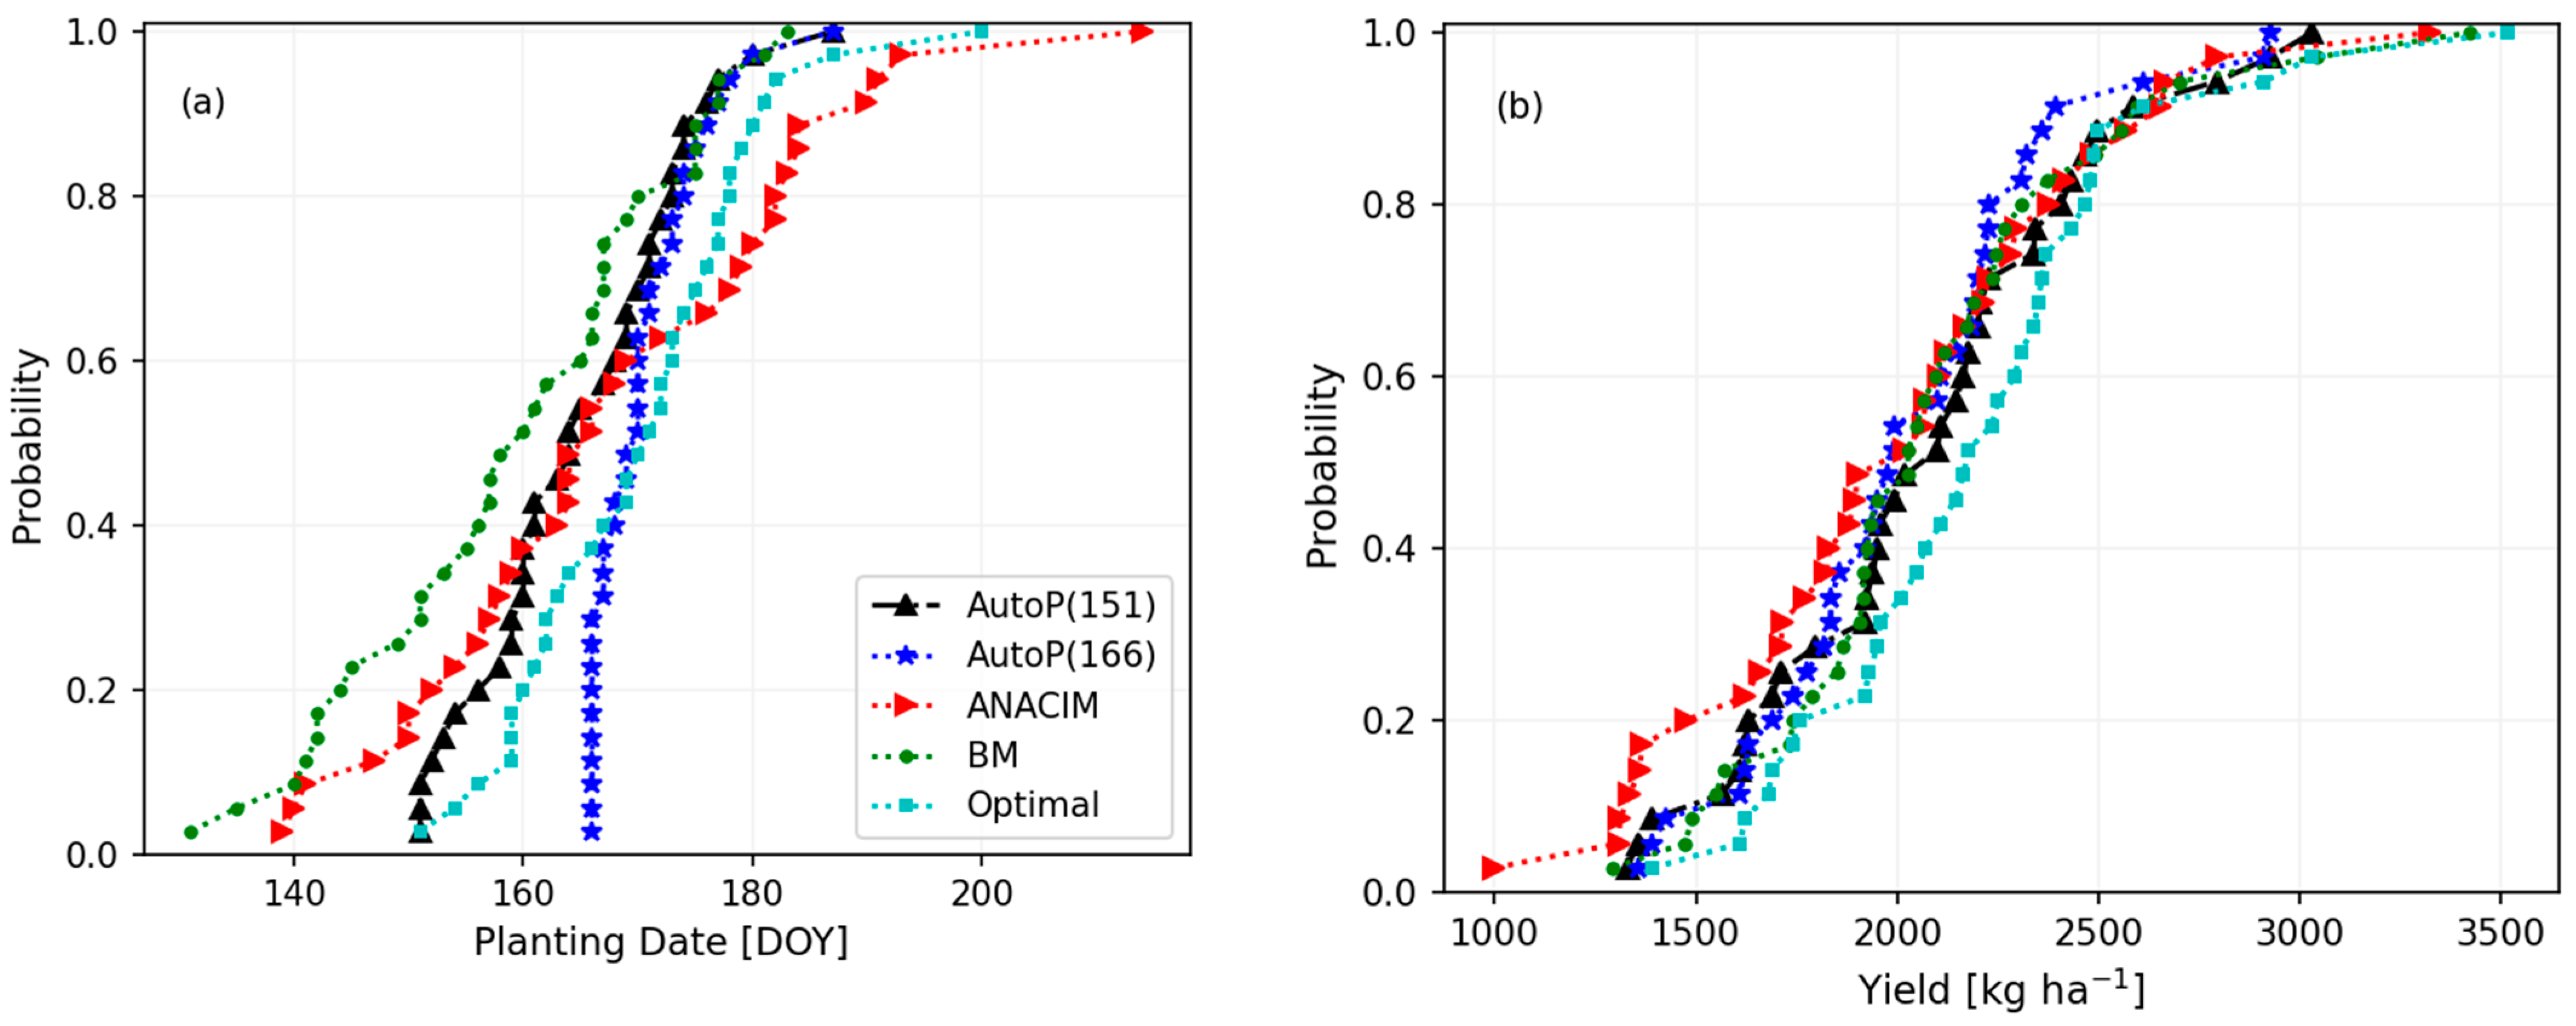
The statistical analysis showed that all four onset definitions had statistically different yields in the mean and 90th percentile from the semi-optimal (Table 1 and Figure 9b) at a 5 or 10% significance level. Particularly in the case of the ANACIM definition, statistically significant differences from the semi-optimal were found across the full distribution of the simulated yields (i.e., mean, 25th, 50th, and 90th percentiles) at a 5 or 10% level (Table 1). This result indicates that farmers could reduce overall risks ranging from the 25th to 90th percentiles of yield distribution by switching from the ANACIM to a better onset definition. There is little room to improve yield in bad years (e.g., lower 10% of the yield distribution) regardless of onset definitions, but improved onset definitions and forecasting capability could increase yields at a range greater than the 25th percentile in NRIP.
3.3. Sinthiou Malème (SINT)
Similar to the results of the CNRA, the ANACIM definition resulted in highly inter-annually varying onset dates (Figure 10a and Figure 11a). Very late planting dates by the ANACIM in 1985, 1995, 1997, 2000, and 2013 contributed to substantially lower yields than the other methods (Figure 10b). Therefore, statistically significant differences between the ANACIM and the semi-optimal results were found in the mean, 10th, and 25th percentiles at a 10% significance level (Table 1). The current ANACIM definition has a potential risk of missing optimal planting dates and thus of inducing a significant yield drop.
Both the ANACIM and BM definitions generated very early planting dates, even in May in several years, but these unusually early planting dates did not cause low yields, unlike the negative effects of the late planting. The AutoP(166) starts to count planting windows from DOY 166, not allowing earlier planting before DOY 166. This threshold date (DOY 166) hampers the potential yield as indicated in the significant difference between the mean and 75th percentile of simulated yields between the AutoP(166) and the semi-optimal (Table 1 and Figure 11b). Therefore, in SINT, farmers seem to be able to move planting dates forward (earlier than DOY 166) with lower risks, rather than sticking to the traditional planting window (i.e., June 24 to July 11 in Diop [52]) or delaying the planting dates.
3.4. Kolda (KOLD)
In KOLD, in general, there was no significant difference in the yields between the semi-optimal and all the other onset definitions (Figure 12 and Figure 13b, and Table 1). Due to the relatively favorable climatic (rainfall) conditions (Figure 2d), how to define the onset of the rainy season seems not to be very critical in KOLD as long as the crop growing season is secured before the demise of a rainy season. The ANACIM and BM definitions caused much earlier planting dates than the semi-optimal (Figure 12a and Table S3). However, negative effects of the earlier planting on yield were not found because the rainy season in KOLD starts relatively early without prolonged dry spells. Counting the onset from mid-June (i.e., AutoP(166)) seems to be a naïve approach considering the slightly lower yields with the AutoP(166), as shown in Figure 12 (e.g., 1986, 1989, 1993, 1997, 2010, and 2011). However, the yield difference is not statistically significant in Table 1. The results demonstrated that the optimal planting dates in KOLD are more flexible than in the other three sites. This in turn suggests that farmers in KOLD also have more flexibility to plant their crops within a wider range of dates as compared to the other three regions.
3.5. Limitations and Future Work
In the present study, we used a well-validated DSSAT–CERES–Sorghum model. Despite the innumerable benefits of using the crop simulation model, its limitations should be kept in mind. For the ex ante crop simulation experiments, we applied fixed amounts of fertilizers on fixed days after planting, following ISRA’s recommended fertilizer practices. However, in reality, the fertilizer amounts used could vary year to year depending on the crop growth status and farmers’ accessibility to fertilizer. For instance, farmers would not invest in fertilizer if a drought resulted in poor crop growth. They may also use small quantities of fertilizers, due to a lack of funding or access to credit. For future studies, the “automatic N application” option of the DSSAT and a detailed economic analysis could be applied to investigate the economically optimal N application rate.
Another limitation of the current modeling study could be the imperfect mechanisms of the crop model, particularly a simple soil water balance algorithm of the DSSAT. As Ritchie [55] argued, the empirical equations used to calculate soil water balance components in the DSSAT can be improved with more detailed input and experimental data to make the root zone soil water dynamics more realistic. If in situ soil moisture measurements had been available during crop growth, then the model performance in simulating soil water dynamics and its impact on crop yield could have been further evaluated.
Detailed soil properties including soil water-holding capacity are one of the most critical inputs to crop modeling, particularly in determining soil-moisture-based onset dates. We used soil analysis data from the literature for only four target locations in this study. To expand the findings of this study to the entire country, the development of a reliable national soil database should precede. Recently, a global high-resolution gridded soil database has become increasingly available [56,57]. The global soil database must be validated against national field survey data, if available.
4. Conclusions
In accordance with the increasing improvement of climate services in Senegal, we evaluated the values of diverse onset definitions, from meteorological (rainfall-based) to agronomic (soil-moisture-based) approaches, in terms of sorghum yield production. The meteorological onset definitions provide a high inter-annual variability of onset/planting dates due to their intrinsic weaknesses (i.e., being sensitive to certain threshold amounts/durations of rainfall/dry spells). The problems of highly variable onsets by the meteorological definitions were found to be detrimental when the onsets were delayed. Especially in drier regions, delayed planting caused severe water stress before and during a critical growth stage, anthesis, and thus significant yield decrease. Soil-moisture-based onset definitions were more robust and closer to the semi-optimal planting dates than the meteorological ones, mainly in drier regions (CNRA, NRIP and SINT), but not in the relatively wetter southern region (KOLD). We found more benefits of planting early than procrastinating through the ex ante crop modeling experiments. In the field, the possibility of a false onset (i.e., prolonged dry spell after onset) impedes farmers’ active response to the onset. This study emphasizes the importance of skillful and reliable forecasts of agronomic onset in the agricultural sector.
Supplementary Materials
The following supporting information can be downloaded at: https://www.mdpi.com/article/10.3390/atmos13122122/s1, Table S1: Soil profile input for DSSAT–CSM–CERES–Sorghum model for target locations; Table S2: Calibrated genetic coefficient of CSM–CERES–Sorghum model for Fadda sorghum cultivar; Table S3: Summary statistics of estimated planting dates for each onset definition; Figure S1: Inter-annual variation of simulated soil-moisture-based planting dates, anthesis dates, maturity dates, and duration from anthesis to maturity of Fadda sorghum cultivars at 4 target locations; Figure S2: Simulated sorghum yield with automatic planting dates determined by shifting planting windows day by day; Figure S3: Rainfall in NRIP in 1992; Figure S4: Simulated sorghum yield with automatic planting dates determined by shifting planting windows day by day at NRIP for selected years; Figure S5: Simulated water stress indices in NRIP with semi-optimal planting onset dates for two cases: planting on DOY 195 vs. DOY 212 in 2003.
Author Contributions
Conceptualization, E.H. and W.B.; methodology, E.H. and W.B.; formal analysis, E.H. and B.S.; investigation, E.H.; resources, A.F., K.K.G. and M.D; data curation, E.H., A.F. and K.K.G.; writing—original draft preparation, E.H.; writing—review and editing, E.H., W.B., B.S., A.F., K.K.G. and M.D. All authors have read and agreed to the published version of the manuscript.
Funding
This work is undertaken as part of the Adapting Agriculture to Climate Change Today, for Tomorrow (ACToday), the first of Columbia University’s World Projects, Columbia University in the City of New York.
Institutional Review Board Statement
Not applicable.
Informed Consent Statement
Not applicable.
Data Availability Statement
Not applicable.
Acknowledgments
The authors thank ANACIM for providing weather data.
Conflicts of Interest
The authors declare no conflict of interest.
Appendix A
Performance of the calibrated DSSAT–CERES model was evaluated with the observed sorghum yields using mean absolute error (MAE), root-mean-square error (RMSE), and normalized RMSE (nRMSE).
where Si is the simulated value, Mi is the measured value, n is the number of values, and is the average of the measured values. The RMSE summarizes the average difference between observed and predicted values [58]. The nRMSE shows the relative size of the average difference without units and this statistic is unbounded [58]. For small sample datasets (e.g., n ≤ 11) that were used in this study, we consider nRMSE ≤ 15% as “good” agreement; 15–30% as “moderate” agreement; and ≥ 30% as “poor” agreement [45,46,47].
References
- Roudier, P.; Sultan, B.; Quirion, P.; Berg, A. The impact of future climate change on West African crop yields: What does the recent literature say? Glob. Environ. Chang. 2011, 21, 1073–1083. [Google Scholar] [CrossRef] [Green Version]
- Food and Agriculture Organization (FAO). Senegal: Country Fact Sheet on Food and Agriculture Trends; FAO: Rome, Italy, 2015. [Google Scholar]
- Ouedraogo, I.; Diouf, N.S.; Ablouka, G.; Zougmoré, R.B.; Whitbread, A. Utility and Triggers in Uptake of Agricultural Weather and Climate Information Services in Senegal, West Africa. Atmosphere 2021, 12, 1515. [Google Scholar] [CrossRef]
- D’Alessandro, S.; Fall, A.A.; Grey, G.; Simpkin, S.; Wane, A. Senegal. Agricultural Sector Risk Assessment; World Bank Group: Washington, DC, USA, 2015. [Google Scholar]
- Ingram, K.; Roncoli, M.; Kirshen, P. Opportunities and constraints for farmers of West Africa to use seasonal precipitation forecasts with Burkina Faso as a case study. Agric. Syst. 2002, 74, 331–349. [Google Scholar] [CrossRef]
- Sultan, B.; Baron, C.; Dingkuhn, M.; Sarr, B.; Janicot, S. Agricultural impacts of large-scale variability of the West African monsoon. Agric. For. Meteorol. 2005, 128, 93–110. [Google Scholar] [CrossRef]
- Dodd, D.E.S.; Jolliffe, I.T. Early detection of the start of the wet season in semiarid tropical climates of western Africa. Int. J. Climatol. 2001, 21, 1251–1262. [Google Scholar] [CrossRef]
- Jolliffe, I.T.; Sarria-dodd, D.E. Early detection of the start of the wet season in tropical climates. Int. J. Climatol. 1994, 14, 71–76. [Google Scholar] [CrossRef]
- Roudier, P.; Muller, B.; d’Aquino, P.; Roncoli, C.; Soumaré, M.A.; Batté, L.; Sultan, B. The role of climate forecasts in smallholder agriculture: Lessons from participatory research in two communities in Senegal. Clim. Risk Manag. 2014, 2, 42–55. [Google Scholar] [CrossRef]
- Chiputwa, B.; Wainaina, P.; Nakelse, T.; Makui, P.; Zougmoré, R.B.; Ndiaye, O.; Minang, P.A. Transforming climate science into usable services: The effectiveness of co-production in promoting uptake of climate information by smallholder farmers in Senegal. Clim. Serv. 2020, 20, 100203. [Google Scholar] [CrossRef]
- Ouedraogo, I.; Diouf, N.S.; Ouédraogo, M.; Ndiaye, O.; Zougmoré, R.B. Closing the gap between climate information producers and users: Assessment of needs and uptake in Senegal. Climate 2018, 6, 13. [Google Scholar] [CrossRef] [Green Version]
- Fitzpatrick, R.G.; Bain, C.L.; Knippertz, P.; Marsham, J.H.; Parker, D.J. The West African monsoon onset: A concise comparison of definitions. J. Clim. 2015, 28, 8673–8694. [Google Scholar] [CrossRef]
- Bombardi, R.J.; Moron, V.; Goodnight, J.S. Detection, variability, and predictability of monsoon onset and withdrawal dates: A review. Int. J. Climatol. 2020, 40, 641–667. [Google Scholar] [CrossRef]
- Marteau, R.; Sultan, B.; Moron, V.; Alhassane, A.; Baron, C.; Traoré, S.B. The onset of the rainy season and farmers’ sowing strategy for pearl millet cultivation in Southwest Niger. Agric. For. Meteorol. 2011, 151, 1356–1369. [Google Scholar] [CrossRef] [Green Version]
- Marteau, R.; Moron, V.; Philippon, N. Spatial coherence of monsoon onset over western and central Sahel (1950–2000). J. Clim. 2009, 22, 1313–1324. [Google Scholar] [CrossRef] [Green Version]
- Ilesanmi, O.O. An empirical formulation of the onset, advance, and retreat of rainfall in Nigeria. J. Trop. Geogr. 1972, 34, 17–24. [Google Scholar]
- Ndomba, P.M. Development of rainfall curves for crops planting dates: A case study of Pangani River Basin in Tanzania. Nile Basin Water Sci. Eng. J. 2010, 3, 13–27. [Google Scholar]
- Bussmann, A.; Elagib, N.A.; Fayyad, M.; Ribbe, L. Sowing date determinants for Sahelian rainfed agriculture in the context of agricultural policies and water management. Land Use Policy 2016, 52, 316–328. [Google Scholar] [CrossRef]
- Dunning, C.M.; Black, E.C.; Allan, R.P. The onset and cessation of seasonal rainfall over Africa. J. Geophys. Res. Atmos. 2016, 121, 11405–11424. [Google Scholar] [CrossRef] [Green Version]
- Bombardi, R.J.; Pegion, K.V.; Kinter, J.L.; Cash, B.A.; Adams, J.M. Sub-seasonal predictability of the onset and demise of the rainy season over monsoonal regions. Front. Earth Sci. 2017, 5, 14. [Google Scholar] [CrossRef] [Green Version]
- Stern, R.; Dennett, M.; Garbutt, D. The start of the rains in West Africa. J. Climatol. 1981, 1, 59–68. [Google Scholar] [CrossRef]
- Sivakumar, M. Predicting rainy season potential from the onset of rains in Southern Sahelian and Sudanian climatic zones of West Africa. Agric. For. Meteorol. 1988, 42, 295–305. [Google Scholar] [CrossRef] [Green Version]
- Omotosho, J.B.; Balogun, A.; Ogunjobi, K. Predicting monthly and seasonal rainfall, onset and cessation of the rainy season in West Africa using only surface data. Int. J. Climatol. A J. R. Meteorol. Soc. 2000, 20, 865–880. [Google Scholar] [CrossRef]
- Raes, D.; Sithole, A.; Makarau, A.; Milford, J. Evaluation of first planting dates recommended by criteria currently used in Zimbabwe. Agric. For. Meteorol. 2004, 125, 177–185. [Google Scholar] [CrossRef]
- Kipkorir, E.C.; Raes, D.; Bargerei, R.J.; Mugalavai, E.M. Evaluation of two risk assessment methods for sowing maize in Kenya. Agric. For. Meteorol. 2007, 144, 193–199. [Google Scholar] [CrossRef]
- Mugalavai, E.M.; Kipkorir, E.C.; Raes, D.; Rao, M.S. Analysis of rainfall onset, cessation and length of growing season for western Kenya. Agric. For. Meteorol. 2008, 148, 1123–1135. [Google Scholar] [CrossRef]
- Siebert, A.; Ryser, P.; Ndiaye, D.; Diop, L.; Mbengue, A.; Sal, A.; Konte, O.; Ndiaye, O.; Trzaska, S.; Robertson, A. A Multi-Model Approach to Forecasting Seasonal Rainfall Characteristics in Senegal. In Proceedings of the AGU Fall Meeting Abstracts, New Orleans, LA, USA, 13–17 December 2021; pp. 55–0813. [Google Scholar]
- Salack, S.; Muller, B.; Gaye, A.T.; Hourdin, F.; Cisse, N. Analyses multi-échelles des pauses pluviométriques au Niger et au Sénégal. Science et changements planétaires / Sécheresse 2012, 23, 3–13. [Google Scholar]
- Sivakumar, M. ‘Agroclimatic aspects of rainfed agriculture in the Sudano-Sahelian zone’, in Soil, Crop and Water Management Systems for Rainfed Agriculture in the Sudano-Sahelian zone. Proceedings of an International Workshop ICRISAT Sahelian Center, Niamey, Niger, 7–11 January 1987. [Google Scholar]
- Sane, Y.; Panthou, G.; Bodian, A.; Vischel, T.; Lebel, T.; Dacosta, H.; Quantin, G.; Wilcox, C.; Ndiaye, O.; Diongue-Niang, A.J.N.H.; et al. Intensity–duration–frequency (IDF) rainfall curves in Senegal. Nat. Hazards Earth Syst. Sci. 2018, 18, 1849–1866. [Google Scholar] [CrossRef] [Green Version]
- Sivakumar, M. Empirical analysis of dry spells for agricultural applications in West Africa. J. Clim. 1992, 5, 532–539. [Google Scholar] [CrossRef]
- Omotosho, J.B. Onset of thunderstorms and precipitation over northern Nigeria. Int. J. Climatol. 1990, 10, 849–860. [Google Scholar] [CrossRef]
- Bombardi, R.J.; Carvalho, L. IPCC global coupled model simulations of the South America monsoon system. Clim. Dyn. 2009, 33, 893–916. [Google Scholar] [CrossRef] [Green Version]
- Liebmann, B.; Marengo, J. Interannual variability of the rainy season and rainfall in the Brazilian Amazon Basin. J. Clim. 2001, 14, 4308–4318. [Google Scholar] [CrossRef]
- Singh, B.; Robertson, A.W.; Trzaska, S.; Ndiaye, O.; Konté, O. Boreal summer subseasonal predictability of rainfall and monsoon onset over Senegal. In Proceedings of the AGU Fall Meeting Abstracts, Virtually, 1–17 December 2020; p. A188-0005. [Google Scholar]
- Agence Nationale de la Statistique et de la Démographie. Bulletin Mensuel des Statistiques Economiques de 2018; Division des Statistiques Economiques Ministère de l’Economie, des Finances et du Plan: Dakar, Senegal, 2018.
- Ndiaye, M.; Adam, M.; Ganyo, K.K.; Guissé, A.; Cissé, N.; Muller, B. Genotype-environment interaction: Trade-offs between the agronomic performance and stability of dual-purpose sorghum (Sorghum bicolor L. Moench) genotypes in Senegal. Agronomy 2019, 9, 867. [Google Scholar] [CrossRef] [Green Version]
- Araya, A.; Jha, P.; Zambreski, Z.; Faye, A.; Ciampitti, I.; Min, D.; Gowda, P.; Singh, U.; Prasad, P. Evaluating crop management options for sorghum, pearl millet and peanut to minimize risk under the projected midcentury climate scenario for different locations in Senegal. Clim. Risk Manag. 2022, 36, 100436. [Google Scholar] [CrossRef]
- Jha, P.K.; Araya, A.; Stewart, Z.P.; Faye, A.; Traore, H.; Middendorf, B.; Prasad, P. Projecting potential impact of COVID-19 on major cereal crops in Senegal and Burkina Faso using crop simulation models. Agric. Syst. 2021, 190, 103107. [Google Scholar] [CrossRef] [PubMed]
- Ganyo, K.K.; Muller, B.; Guissé, A.; Adam, M. Fertilization strategies based on climate information to enhance food security through improved dryland cereals production. In Handbook of Climate Change Resilience; Springer: Berlin/Heidelberg, Germany, 2018; pp. 1–18. [Google Scholar]
- Hoogenboom, G.; Jones, J.; Porter, C.; Wilkens, P.; Boote, K.; Hunt, L.; Tsuji, G. Decision Support System for Agrotechnology Transfer Version 4.5. Volume 1: Overview; University of Hawaii: Honolulu, HI, USA, 2010. [Google Scholar]
- White, J.; Alagarswamy, G.; Ottman, M.J.; Porter, C.; Singh, U.; Hoogenboom, G. An overview of CERES–sorghum as implemented in the cropping system model version 4.5. Agron. J. 2015, 107, 1987–2002. [Google Scholar] [CrossRef] [Green Version]
- Ganyo, K.K.; Muller, B.; Ndiaye, M.; Gaglo, E.K.; Guissé, A.; Adam, M. Defining fertilization strategies for sorghum (Sorghum bicolor (L.) Moench) production under Sudano-Sahelian conditions: Options for late basal fertilizer application. Agronomy 2019, 9, 697. [Google Scholar] [CrossRef] [Green Version]
- Ganyo, K.K. Etude et Modélisation des Réponses de Variétés de Sorgho (Sorghum bicolor L. Moench) à des Stratégies Contrastées D’apports D’intrants. Ph.D. Thesis, Universite Chekh Anta Diop De Dakar, Dakar, Senegal, 2018. [Google Scholar]
- Liu, S.; Yang, J.; Zhang, X.; Drury, C.; Reynolds, W.; Hoogenboom, G. Modelling crop yield, soil water content and soil temperature for a soybean–maize rotation under conventional and conservation tillage systems in Northeast China. Agric. Water Manag. 2013, 123, 32–44. [Google Scholar] [CrossRef]
- Yang, J.; Yang, J.-Y.; Liu, S.; Hoogenboom, G. An evaluation of the statistical methods for testing the performance of crop models with observed data. Agric. Syst. 2014, 127, 81–89. [Google Scholar] [CrossRef]
- Li, Z.T.; Yang, J.; Drury, C.; Hoogenboom, G. Evaluation of the DSSAT-CSM for simulating yield and soil organic C and N of a long-term maize and wheat rotation experiment in the Loess Plateau of Northwestern China. Agric. Syst. 2015, 135, 90–104. [Google Scholar] [CrossRef]
- Akinseye, F.M.; Ajeigbe, H.A.; Traore, P.C.; Agele, S.O.; Zemadim, B.; Whitbread, A. Improving sorghum productivity under changing climatic conditions: A modelling approach. Field Crops Res. 2020, 246, 107685. [Google Scholar] [CrossRef]
- Dingkuhn, M.; Singh, B.; Clerget, B.; Chantereau, J.; Sultan, B. Past, present and future criteria to breed crops for water-limited environments in West Africa. Agric. Water Manag. 2006, 80, 241–261. [Google Scholar] [CrossRef] [Green Version]
- Adam, M.; Dzotsi, K.; Hoogenboom, G.; Traoré, P.; Porter, C.; Rattunde, H.; Nebie, B.; Leiser, W.L.; Weltzien, E.; Jones, J.W. Modelling varietal differences in response to phosphorus in West African sorghum. Eur. J. Agron. 2018, 100, 35–43. [Google Scholar] [CrossRef]
- Sanon, M.; Hoogenboom, G.; Traoré, S.; Sarr, B.; Garcia, A.G.y.; Somé, L.; Roncoli, C. Photoperiod sensitivity of local millet and sorghum varieties in West Africa. NJAS: Wagening. J. Life Sci. 2014, 68, 29–39. [Google Scholar] [CrossRef] [Green Version]
- Diop, M. A propos de la durée de la saison des pluies au Sénégal. Sci. Et Chang. Planétaires/Sécheresse 1996, 7, 7–15. [Google Scholar]
- Mann, H.B.; Whitney, D.R. On a test of whether one of two random variables is stochastically larger than the other. Ann. Math. Stat. 1947, 18, 50–60. [Google Scholar] [CrossRef]
- Mangiafico, S.S. Summary and Analysis of Extension Program Evaluation in R, Version 1.19.10. 2016. Available online: http://rcompanion.org/handbook/ (accessed on 26 August 2022).
- Ritchie, J.T. Soil water balance and plant water stress. In Understanding Options for Agricultural Production; Springer: Berlin/Heidelberg, Germany, 1998; pp. 41–54. [Google Scholar]
- Han, E.; Ines, A.V.; Koo, J. Development of a 10-km resolution global soil profile dataset for crop modeling applications. Environ. Model. Softw. 2019, 119, 70–83. [Google Scholar] [CrossRef]
- Hengl, T.; Mendes de Jesus, J.; Heuvelink, G.B.; Ruiperez Gonzalez, M.; Kilibarda, M.; Blagotić, A.; Shangguan, W.; Wright, M.N.; Geng, X.; Bauer-Marschallinger, B. SoilGrids250m: Global gridded soil information based on machine learning. PLoS ONE 2017, 12, e0169748. [Google Scholar] [CrossRef] [Green Version]
- Willmott, C.J. Some comments on the evaluation of model performance. Bull. Am. Meteorol. Soc. 1982, 63, 1309–1313. [Google Scholar] [CrossRef]
Figure 1.
Locations of the four target experimental research stations managed by ISRA. CNRA, NRIP, SINT and KOLD represent Bambey, Nioro du Rip, Sinthiou Malème and Kolda, respectively.
Figure 1.
Locations of the four target experimental research stations managed by ISRA. CNRA, NRIP, SINT and KOLD represent Bambey, Nioro du Rip, Sinthiou Malème and Kolda, respectively.

Figure 2.
Mean seasonal cycle of weather variables at four target weather stations from 1981 to 2015: (a) daily Tmax, (b) daily Tmin, (c) daily Solar radiation, and (d) 7-day precipitation moving average. Refer to Figure 1 for the full names of the legend.
Figure 2.
Mean seasonal cycle of weather variables at four target weather stations from 1981 to 2015: (a) daily Tmax, (b) daily Tmin, (c) daily Solar radiation, and (d) 7-day precipitation moving average. Refer to Figure 1 for the full names of the legend.

Figure 3.
Simulated and observed anthesis (a) and yield (b) of Fadda sorghum cultivar. Error bars indicate ± standard deviation of the observed yields.
Figure 3.
Simulated and observed anthesis (a) and yield (b) of Fadda sorghum cultivar. Error bars indicate ± standard deviation of the observed yields.

Figure 4.
Planting dates based on different onset definitions (a), and corresponding simulated sorghum yields (b) in CNRA.
Figure 4.
Planting dates based on different onset definitions (a), and corresponding simulated sorghum yields (b) in CNRA.

Figure 5.
Cumulative distribution of estimated onset/planting dates (a), and corresponding simulated sorghum yields (b) for 1981–2015 in CNRA.
Figure 5.
Cumulative distribution of estimated onset/planting dates (a), and corresponding simulated sorghum yields (b) for 1981–2015 in CNRA.

Figure 6.
Simulated water stress indices in 1988 with ANACIM and AutoP(151) onset definitions in CNRA. Note that the water stress index is computed as 1 minus water deficiency, where water deficiency is the ratio of supply to potential demand. The higher water stress index indicates less water supply for root water uptake hindering crop growth. Vertical dashed lines indicate anthesis dates.

Figure 7.
Relationships between estimated onset dates (day of year) and simulated sorghum yields in CNRA for different onset definitions: AutoP(151) (a), AutoP(166) (b), ANACIM (c), BM (d), and Optimal (e).
Figure 7.
Relationships between estimated onset dates (day of year) and simulated sorghum yields in CNRA for different onset definitions: AutoP(151) (a), AutoP(166) (b), ANACIM (c), BM (d), and Optimal (e).

Figure 8.
Planting dates based on different onset definitions (a), and corresponding simulated sorghum yields (b) in NRIP.
Figure 8.
Planting dates based on different onset definitions (a), and corresponding simulated sorghum yields (b) in NRIP.

Figure 9.
Cumulative distribution of (a) estimated onset/planting dates and (b) corresponding simulated sorghum yields (1981–2015) in NRIP.
Figure 9.
Cumulative distribution of (a) estimated onset/planting dates and (b) corresponding simulated sorghum yields (1981–2015) in NRIP.

Figure 10.
Planting dates based on different onset definitions (a), and corresponding simulated sorghum yields (b) in SINT.
Figure 10.
Planting dates based on different onset definitions (a), and corresponding simulated sorghum yields (b) in SINT.

Figure 11.
Cumulative distribution of (a) estimated onset/planting dates and (b) corresponding simulated sorghum yields (1981–2015) in SINT.
Figure 11.
Cumulative distribution of (a) estimated onset/planting dates and (b) corresponding simulated sorghum yields (1981–2015) in SINT.

Figure 12.
Planting dates based on different onset definitions (a), and corresponding simulated sorghum yields (b) in KOLD.
Figure 12.
Planting dates based on different onset definitions (a), and corresponding simulated sorghum yields (b) in KOLD.

Figure 13.
Cumulative distribution of (a) estimated onset/planting dates and (b) corresponding simulated sorghum yields (1981–2015) in KOLD.
Figure 13.
Cumulative distribution of (a) estimated onset/planting dates and (b) corresponding simulated sorghum yields (1981–2015) in KOLD.


Table 1.
Summary statistics of simulated yields for each onset definition.
| Onset Definition | Mean | Stdev | Min | Max | Percentiles | |||||
|---|---|---|---|---|---|---|---|---|---|---|
| 10th | 25th | 50th | 75th | 90th | ||||||
| CNRA | ANACIM | 667 | 233 | 276 | 1088 | 384 | 502 | 626 | 815 | 999 |
| BM | 697 | 239 | 230 | 1118 | 384 | 512 | 673 | 879 | 1003 | |
| AutoP(151) | 724 | 229 | 337 | 1087 | 400 | 504 | 753 | 895 | 1024 | |
| AutoP(166) | 731 | 232 | 337 | 1087 | 400 | 504 | 780 | 911 | 1024 | |
| Optimal | 776 | 265 | 337 | 1320 | 426 | 522 | 793 | 982 | 1075 | |
| NRIP | ANACIM | 1822 | 312 | 1120 | 2274 | 1458 | 1623 | 1808 | 2104 | 2180 |
| BM | 1838 | 320 | 1084 | 2306 | 1394 | 1646 | 1870 | 2100 | 2212 | |
| AutoP(151) | 1846 | 302 | 1019 | 2270 | 1403 | 1692 | 1883 | 2087 | 2189 | |
| AutoP(166) | 1845 | 325 | 1019 | 2257 | 1360 | 1692 | 1883 | 2089 | 2210 | |
| Optimal | 1971 | 298 | 1130 | 2371 | 1550 | 1849 | 2032 | 2179 | 2319 | |
| SINT | ANACIM | 1995 | 501 | 998 | 3323 | 1345 | 1685 | 2018 | 2290 | 2621 |
| BM | 2082 | 437 | 1291 | 3424 | 1558 | 1857 | 2027 | 2256 | 2579 | |
| AutoP(151) | 2073 | 424 | 1329 | 3032 | 1583 | 1754 | 2100 | 2341 | 2550 | |
| AutoP(166) | 2023 | 373 | 1355 | 2929 | 1614 | 1796 | 1992 | 2222 | 2379 | |
| Optimal | 2197 | 428 | 1391 | 3519 | 1684 | 1941 | 2176 | 2400 | 2567 | |
| KOLD | ANACIM | 2331 | 567 | 1205 | 3861 | 1664 | 1997 | 2353 | 2590 | 3152 |
| BM | 2377 | 521 | 1385 | 3856 | 1948 | 2007 | 2328 | 2556 | 3190 | |
| AutoP(151) | 2336 | 479 | 1206 | 3513 | 1959 | 2062 | 2291 | 2428 | 3076 | |
| AutoP(166) | 2265 | 521 | 1206 | 3838 | 1753 | 2009 | 2161 | 2417 | 3057 | |
| Optimal | 2384 | 529 | 1206 | 3879 | 1960 | 2091 | 2342 | 2458 | 3171 | |
Yields in bold and underline/bold and italic indicate the null hypothesis (i.e., equal mean or equal percentile between the simulated yields and semi-optimal yields) is rejected at 5%/10% level of significance.
Publisher’s Note: MDPI stays neutral with regard to jurisdictional claims in published maps and institutional affiliations. |
© 2022 by the authors. Licensee MDPI, Basel, Switzerland. This article is an open access article distributed under the terms and conditions of the Creative Commons Attribution (CC BY) license (https://creativecommons.org/licenses/by/4.0/).
Share and Cite
MDPI and ACS Style
Han, E.; Faye, A.; Diop, M.; Singh, B.; Ganyo, K.K.; Baethgen, W. Evaluating Agronomic Onset Definitions in Senegal through Crop Simulation Modeling. Atmosphere 2022, 13, 2122. https://doi.org/10.3390/atmos13122122
AMA Style
Han E, Faye A, Diop M, Singh B, Ganyo KK, Baethgen W. Evaluating Agronomic Onset Definitions in Senegal through Crop Simulation Modeling. Atmosphere. 2022; 13(12):2122. https://doi.org/10.3390/atmos13122122
Chicago/Turabian StyleHan, Eunjin, Adama Faye, Mbaye Diop, Bohar Singh, Komla Kyky Ganyo, and Walter Baethgen. 2022. "Evaluating Agronomic Onset Definitions in Senegal through Crop Simulation Modeling" Atmosphere 13, no. 12: 2122. https://doi.org/10.3390/atmos13122122
Note that from the first issue of 2016, this journal uses article numbers instead of page numbers. See further details here.